Embed Size (px)
Citation preview
Public ndash I1-A2
SOUTH AUSTRALIAN CUSTOMER SATISFACTION MEASUREMENT SURVEY 2019
DETAILED REPORT
Source Customer Service Commission Customer Satisfaction Measurement Survey 2019 Report developed in conjunction with the NSW Customer Service CommissionerPublic I1-A2
TABLE ON CONTENTS
2
Chapter Page no Reading Guide
i Executive Summary 3 Overview of the study methodology 2018 results for key performance measures and key findings from the overall data
Priority read15 minutes
ii Key Findings 7
iii Detailed Findings 29 Select by interest area
1 Overall Measures And Topline Analysis 30 Results for the CSI and outcome measures comparing performance year on
year and by jurisdiction 10 minutes
2 Performance Against Customer Satisfaction Attributes 40
Results for specific service attributes across employees process values and goals comparing performance by jurisdiction and results for overall drivers of satisfaction
20 minutes
3 Satisfaction By Contact Method And Digital Insights 52
Results for contact methods used and preferred impact on overall satisfaction and expectations attributes of online service and drivers of digital adoption
20 minutes
4 Public Sector Overall 63 Results for the SA Public Service brand comparing performance over time and by jurisdictions associations with word descriptors 5 minutes
5 Feedback 68 Results for feedback to SA Government Services and complaint handling 10 minutes
iv Appendices
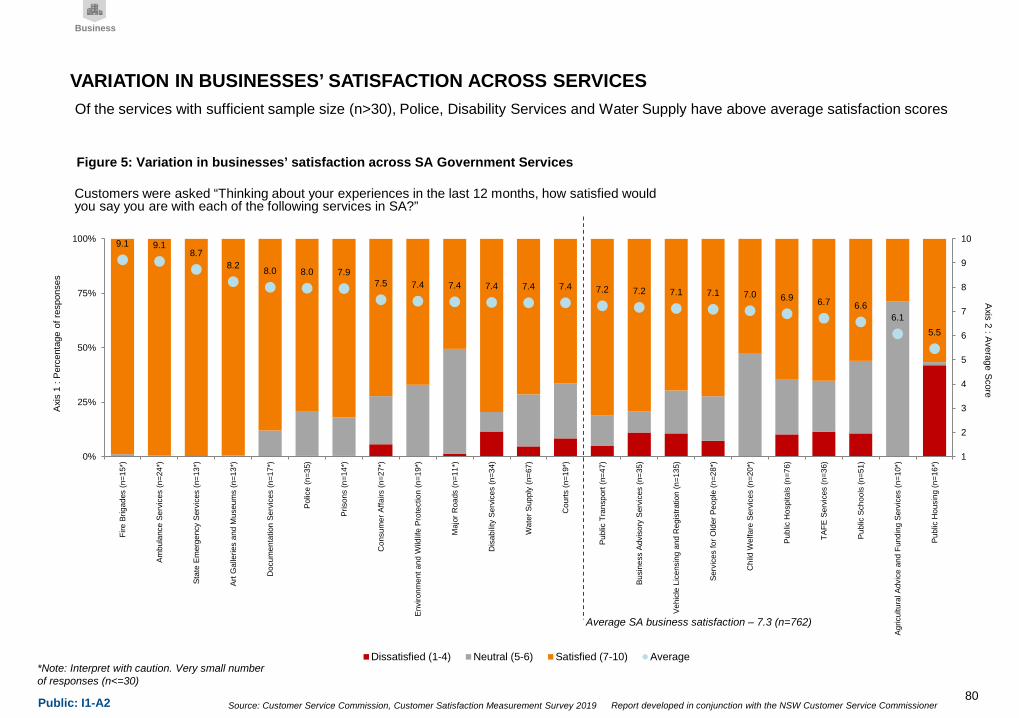
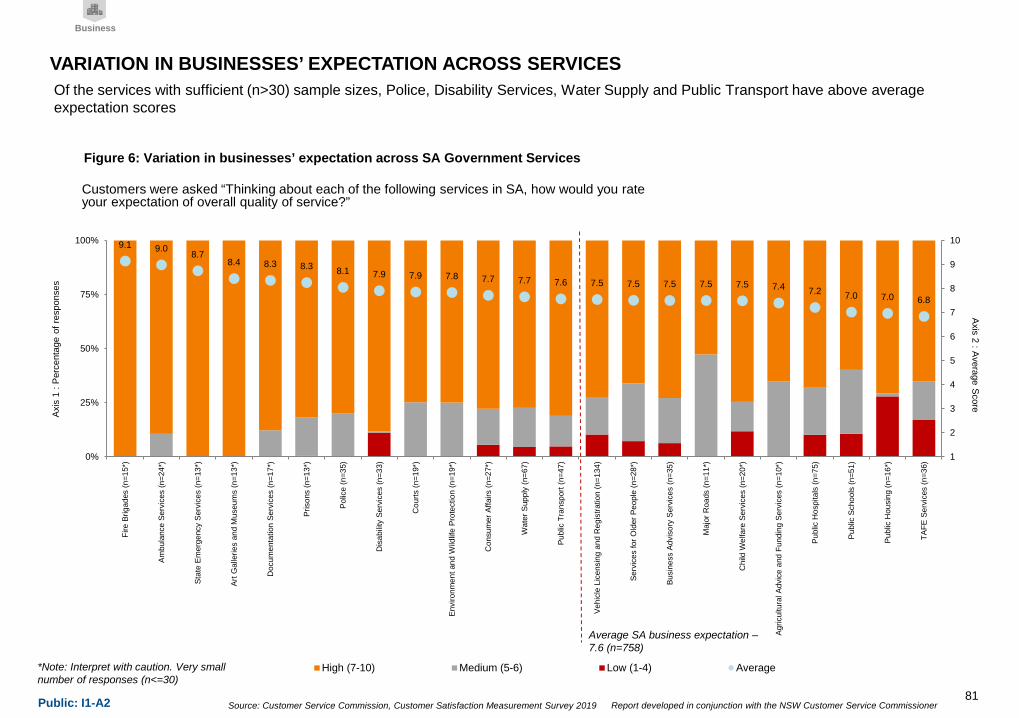
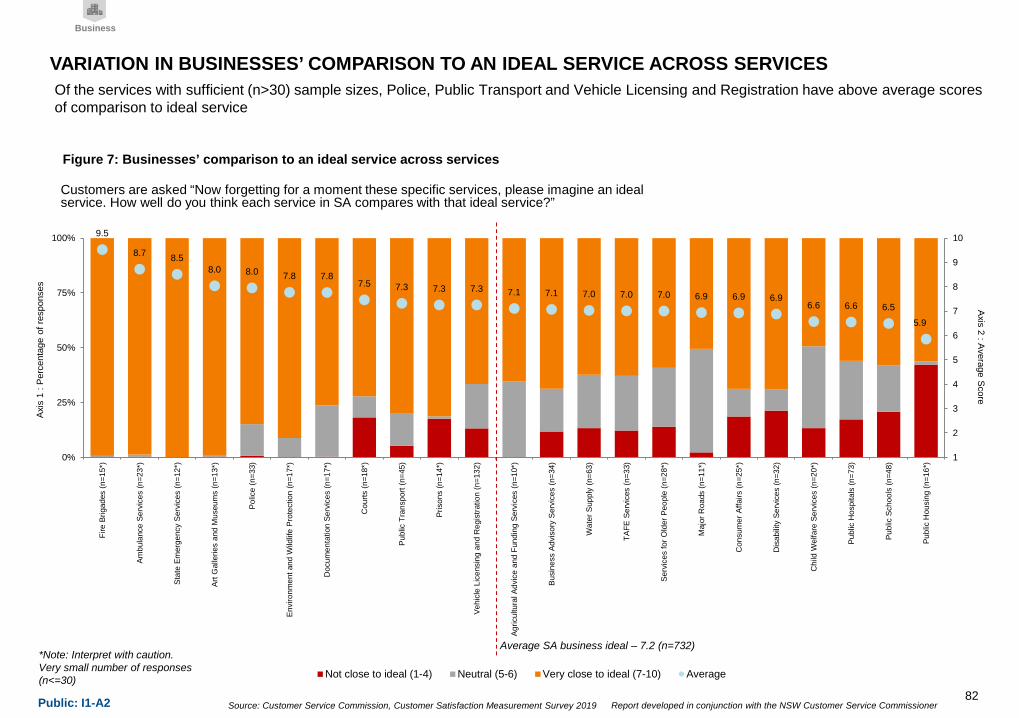
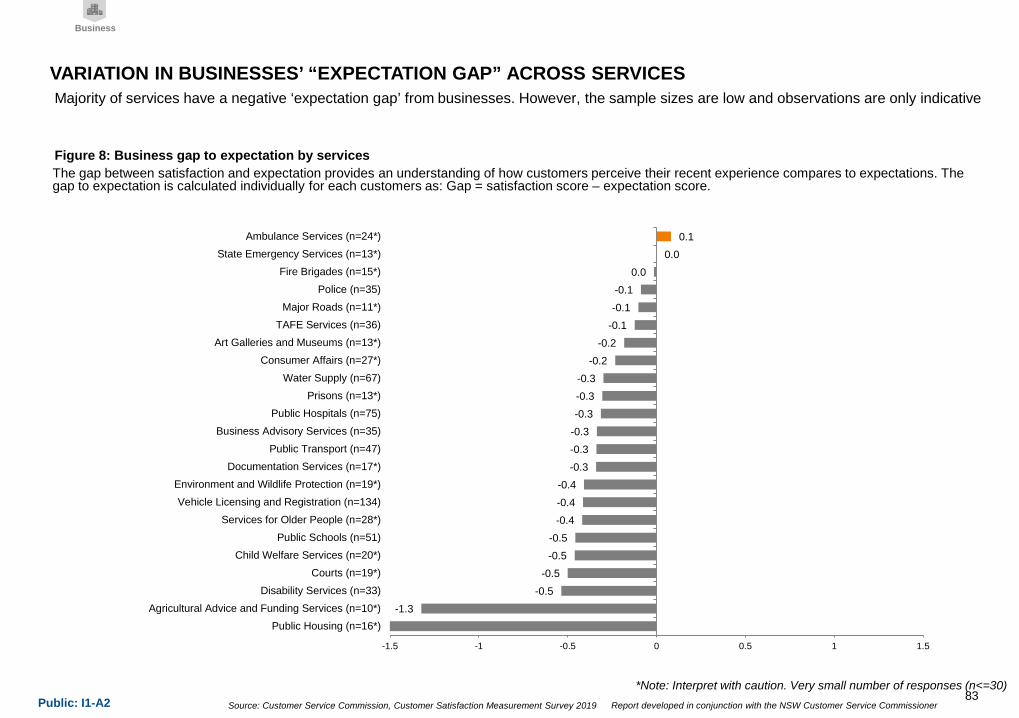
1 Analysis By Service 76 Results for outcome measures attributes and channel usage by service 25 minutes
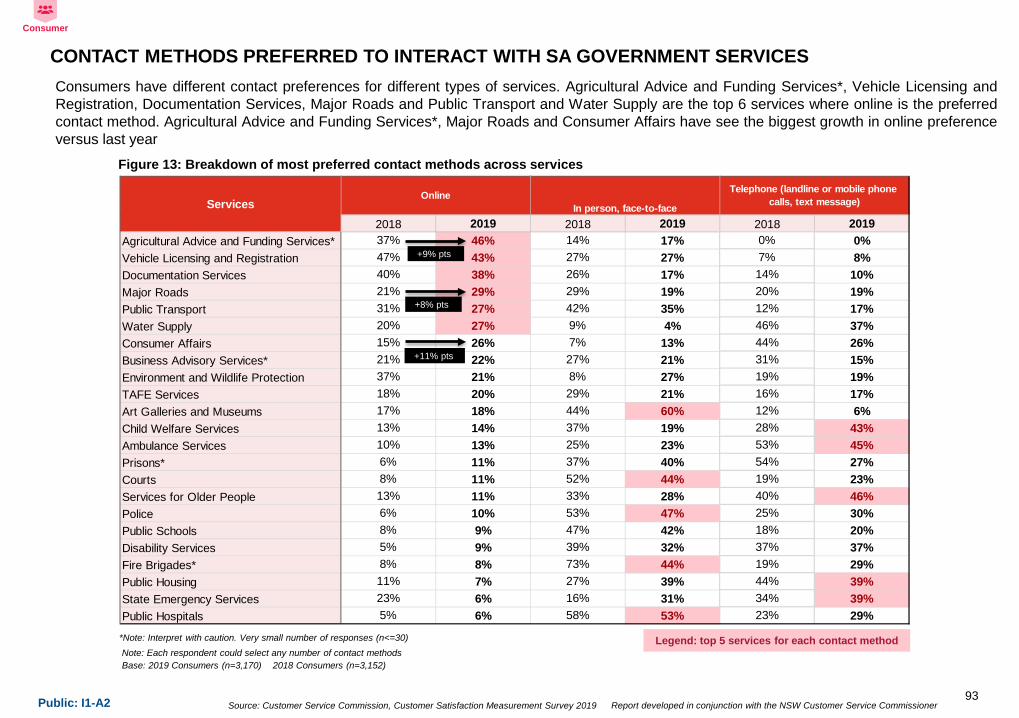
2 Contact Method Preference By Service 93 Results for contact methods used and preferred impact on overall
satisfaction with online experience by service 15 minutes
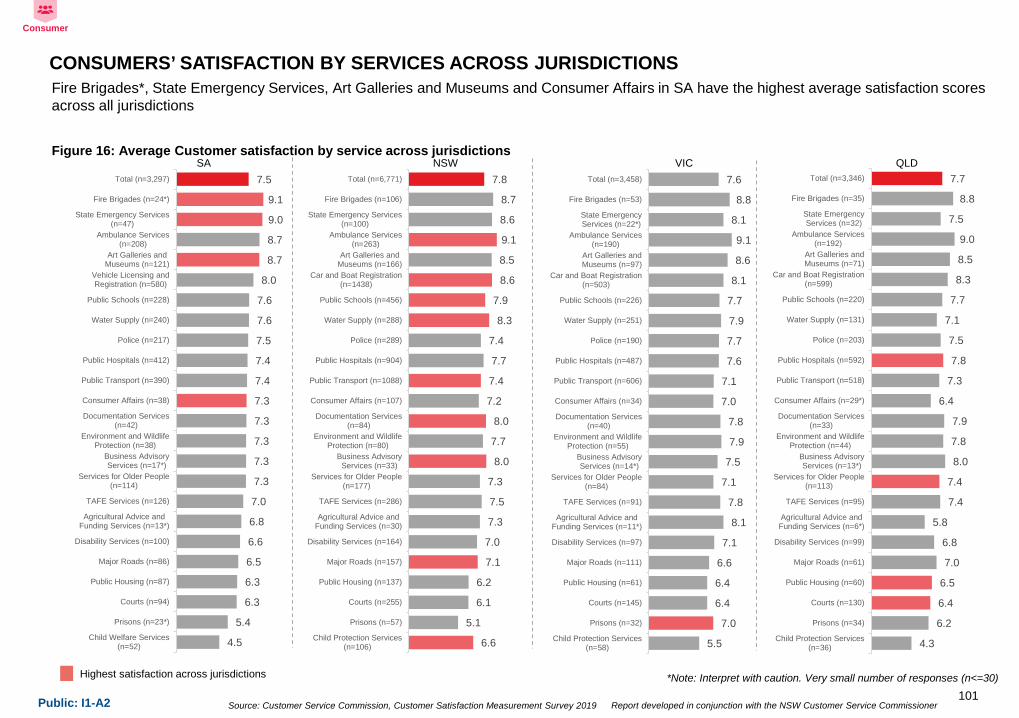
3 Jurisdictional Comparison 101 Results for overall customer satisfaction with services by jurisdiction 10 minutes
4 Demographics 104 Results for outcome measures by demographics 15 minutes
5 Cluster Dashboards 114 Results for individual clusters and services 20 minutes
6 Overview and Methodology 171 Research programme background objectives scope and explanation of the Customer Satisfaction index (CSI) 5 minutes
7 Further Technical Information 178 Details of approach to data collection and management 5 minutes
TABLE OF CONTENTS
Public ndash I1-A2
SOUTH AUSTRALIAN CUSTOMER SATISFACTION MEASUREMENT SURVEY 2019
i EXECUTIVE SUMMARY
Source Customer Service Commission Customer Satisfaction Measurement Survey 2019 Report developed in conjunction with the NSW Customer Service CommissionerPublic I1-A2
Metro74
Regional13
Rural14
QLD
VIC
NSW
SA
Online survey
Other jurisdictions - Consumers
Queensland Victoria New South Wales
United Kingdom
New Zealand
Other jurisdictions - Businesses
Queensland Victoria New South Wales
United Kingdom
New Zealand
SA ndash Consumers
SA- Businesses
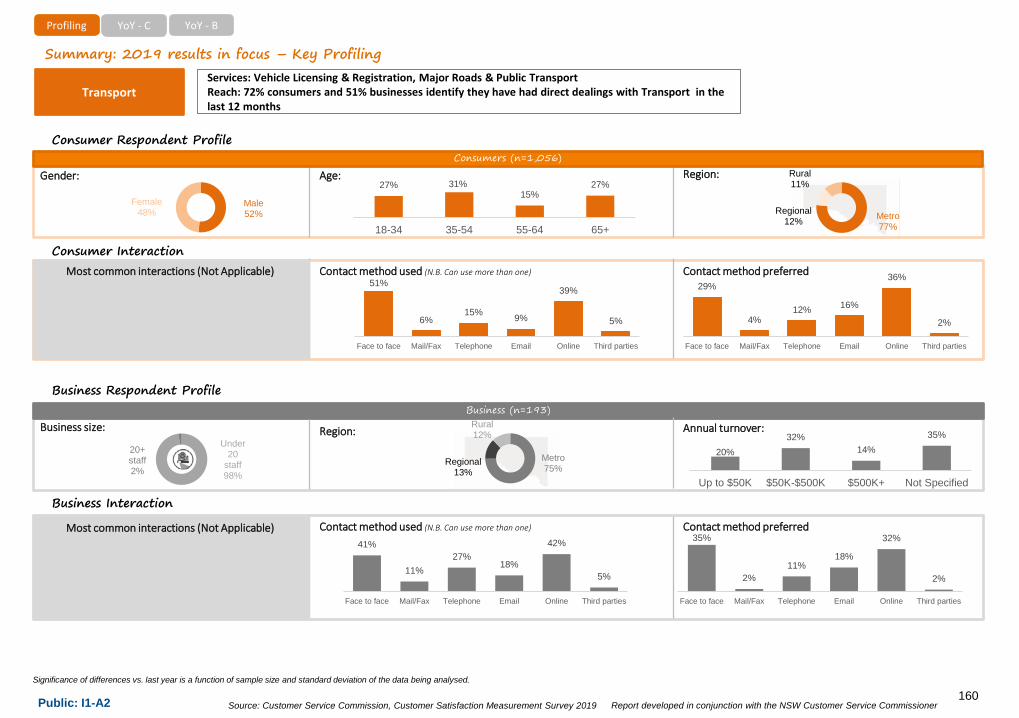
Age Gender Region
Business size Region
1998
502
49 male51
female18-3429
35-5432
55-6416
65+23
98 under 20
staff2
20+ staff
75 Metropolitan
11 Regional
14 Rural
2019 2073 4110 2019 2116
555 537 1261 1003 586
WE SURVEYED ~14300 CONSUMERS AND 4400 BUSINESSES ACROSS 6 JURISDICTIONS VIA THE ANNUAL CUSTOMER SATISFACTION MEASUREMENT SURVEY IN 2019
UK
Respondent Demographics
Note Results are subject to rounding and may not sum to 100
Consumer Business
NZ
4
Source Customer Service Commission Customer Satisfaction Measurement Survey 2019 Report developed in conjunction with the NSW Customer Service CommissionerPublic I1-A2
75 78
03
Satisfaction ExpectationGap
Expectation
Consumer satisfaction has remained stable versus last year Consumer expectations have increased slightly however not a statistically significant change
(00)
The SA consumer CSI is at 788 for 2019 and has been statistically stable since 2016
Consumersrsquo perceptions of the SA Public Services lsquobrandrsquo have remained stable in 2019 ranking second after airlines However satisfaction with the SA Public Service lsquobrandrsquo remains lower than customersrsquo satisfaction with SA Government services overall
Lowest
Highest
Avg
sat
isfac
tion
(con
sum
ers)
Airlines 71
SA Public Service 66
Telcorsquos 61
Local Council60
Banks59
Energy54
Fed Govt53
76(2017)
Nine drivers of consumer satisfaction are identified in 2019 Whereas lsquoCommunication and Empathyrsquo was a single driver last year this year lsquoFairness and Empathyrsquo is a unique driver of moderate importance separate to lsquoCommunicationrsquo which is of high importance
Efficiency and effectiveness of employees
Communication
Honesty and integrity of employees
Employee autonomy
Simplicity and efficiency of processes
Transparency
Privacy
Access to information and online services
High
High
High
Moderate
Moderate
Low
Low
Low
Drivers and relative importance
Performance of SA Government Services against baseline measures Customer Satisfaction Index (CSI) results
Drivers of satisfaction
75(2018)
+02
Perceptions of the SA Public Sector lsquobrandrsquo
SA Government Services
(avg satisfaction)
(+01)
75(2019)
Fairness and Empathy
Moderate
EXECUTIVE SUMMARY CONSUMER SATISFACTION WITH SA GOVERNMENT SERVICES HAS BEEN MAINTAINED IN 2019
Legend Statistically significant increase in avg from 2018 (at 99 level of Confidence)No significant change in avg from 2018 (at 99 level of Confidence)Statistically significant decrease in avg from 2018 (at 99 level of Confidence)
-01
Consumer CSI
Consumer
776
785784
788
77
78
79
2016 2017 2018 2019
74(2016)
00
Employee attributes Goals ProcessesKey
Groupings of drivers of satisfaction are based on analyses of NSW Government services however it is assumed that drivers of satisfaction are relatively consistent across jurisdictions and generally across service industries broadly
5
Source Customer Service Commission Customer Satisfaction Measurement Survey 2019 Report developed in conjunction with the NSW Customer Service CommissionerPublic I1-A2
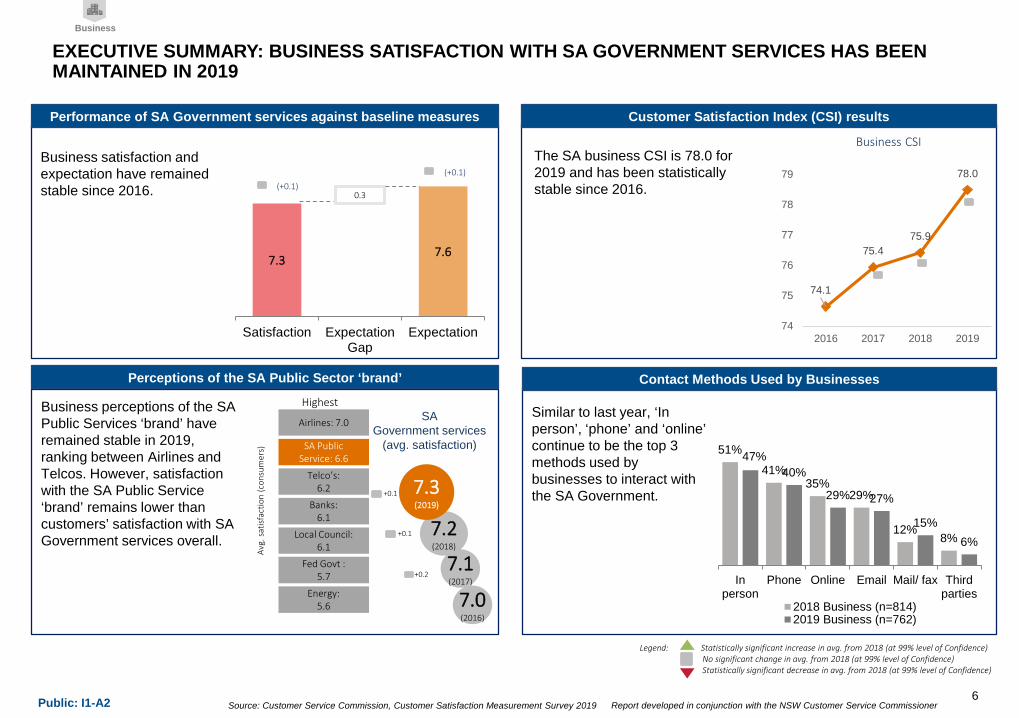
Business satisfaction and expectation have remained stable since 2016
The SA business CSI is 780 for 2019 and has been statistically stable since 2016
Business perceptions of the SA Public Services lsquobrandrsquo have remained stable in 2019 ranking between Airlines andTelcos However satisfaction with the SA Public Service lsquobrandrsquo remains lower than customersrsquo satisfaction with SA Government services overall
Lowest
Highest
Avg
sat
isfac
tion
(con
sum
ers)
Airlines 70
SA Public Service 66
Telcorsquos62
Banks61
Local Council61
Fed Govt 57
Energy56
71(2017)
+02
Performance of SA Government services against baseline measures Customer Satisfaction Index (CSI) results
72(2018)
Perceptions of the SA Public Sector lsquobrandrsquo
SA Government services
(avg satisfaction)
73(2019)
EXECUTIVE SUMMARY BUSINESS SATISFACTION WITH SA GOVERNMENT SERVICES HAS BEEN MAINTAINED IN 2019
7376
03
Satisfaction ExpectationGap
Expectation
(+01)(+01)
+01
Business CSI
Business
741
754759
780
74
75
76
77
78
79
2016 2017 2018 2019
Contact Methods Used by Businesses
51
4135
29
128
4740
29 27
156
Inperson
Phone Online Email Mail fax Thirdparties
2018 Business (n=814)2019 Business (n=762)
Similar to last year lsquoIn personrsquo lsquophonersquo and lsquoonlinersquo continue to be the top 3 methods used by businesses to interact with the SA Government
70(2016)
+01
Legend Statistically significant increase in avg from 2018 (at 99 level of Confidence)No significant change in avg from 2018 (at 99 level of Confidence)Statistically significant decrease in avg from 2018 (at 99 level of Confidence)
6
Public ndash I1-A2
SOUTH AUSTRALIAN CUSTOMER SATISFACTION MEASUREMENT SURVEY 2019
ii KEY FINDINGS IN 2019
Source Customer Service Commission Customer Satisfaction Measurement Survey 2019 Report developed in conjunction with the NSW Customer Service CommissionerPublic I1-A2
SUMMARY OF KEY FINDINGS IN 2019
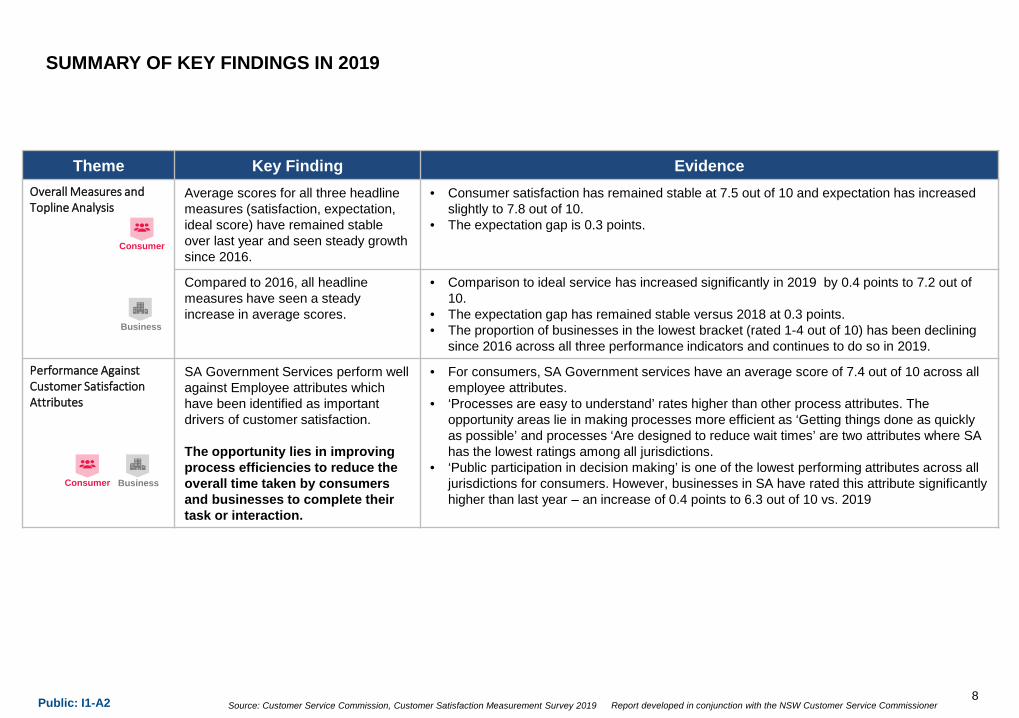
Theme Key Finding EvidenceOverall Measures and Topline Analysis
Average scores for all three headline measures (satisfaction expectation ideal score) have remained stableover last year and seen steady growth since 2016
bull Consumer satisfaction has remained stable at 75 out of 10 and expectation has increased slightly to 78 out of 10
bull The expectation gap is 03 points
Compared to 2016 all headline measures have seen a steady increase in average scores
bull Comparison to ideal service has increased significantly in 2019 by 04 points to 72 out of 10
bull The expectation gap has remained stable versus 2018 at 03 pointsbull The proportion of businesses in the lowest bracket (rated 1-4 out of 10) has been declining
since 2016 across all three performance indicators and continues to do so in 2019
Performance Against Customer Satisfaction Attributes
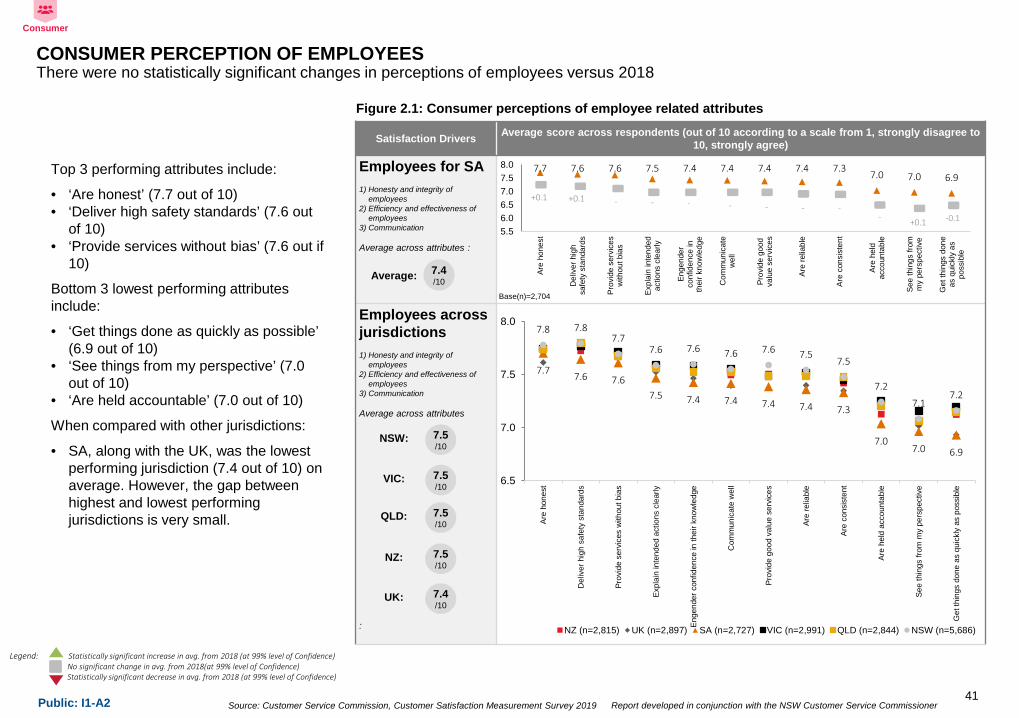
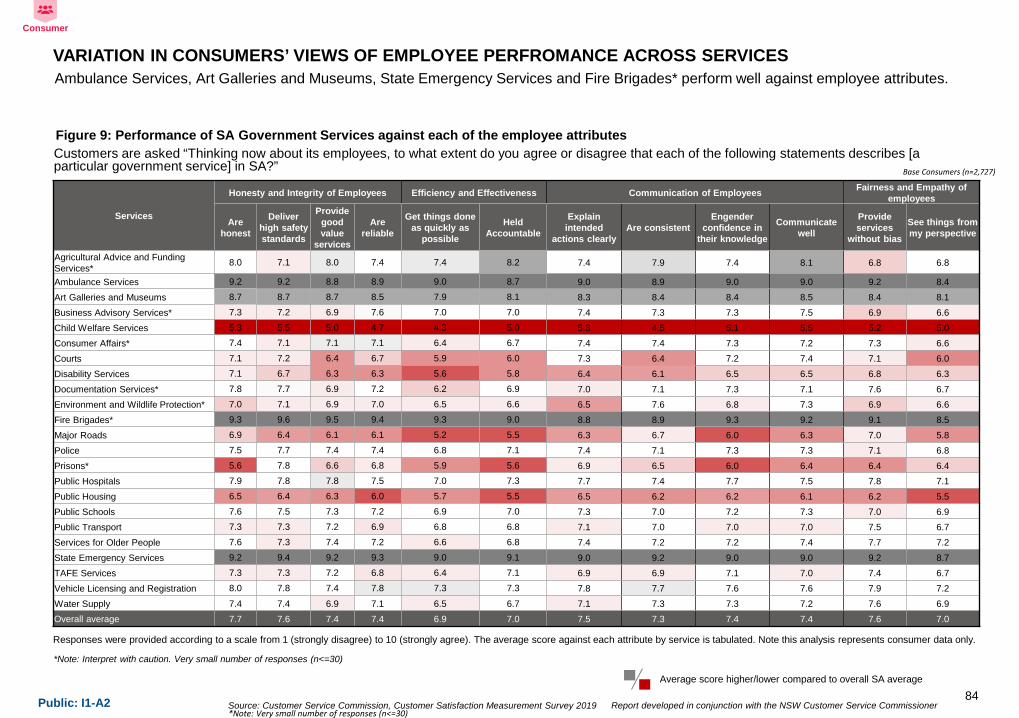
SA Government Services perform well against Employee attributes which have been identified as important drivers of customer satisfaction
The opportunity lies in improving process efficiencies to reduce the overall time taken by consumers and businesses to complete their task or interaction
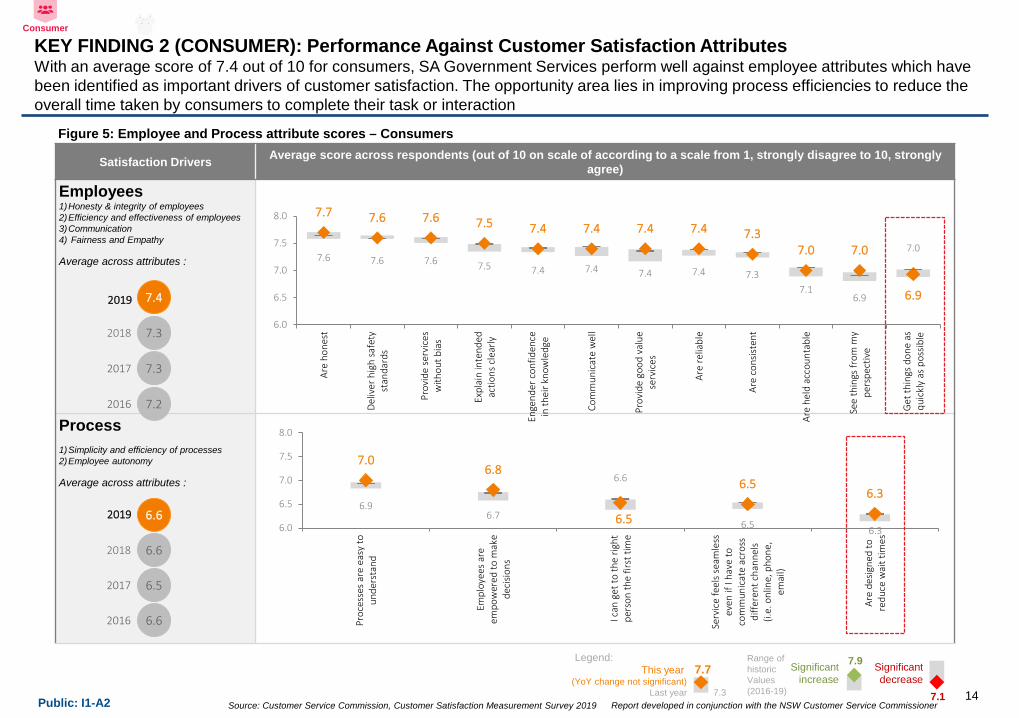
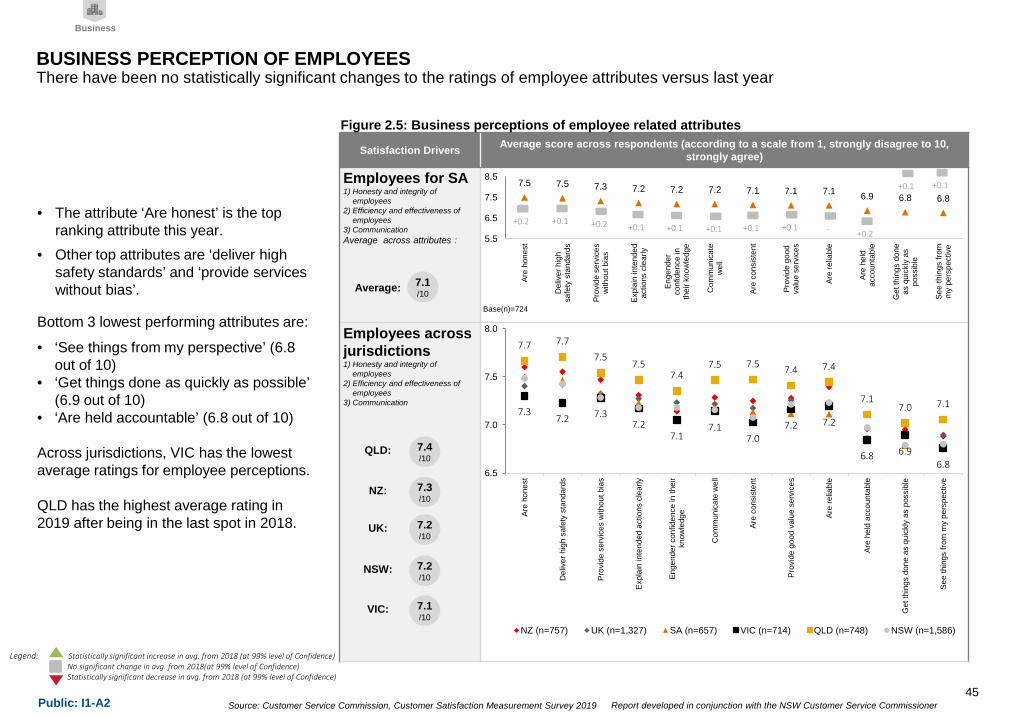
bull For consumers SA Government services have an average score of 74 out of 10 across all employee attributes
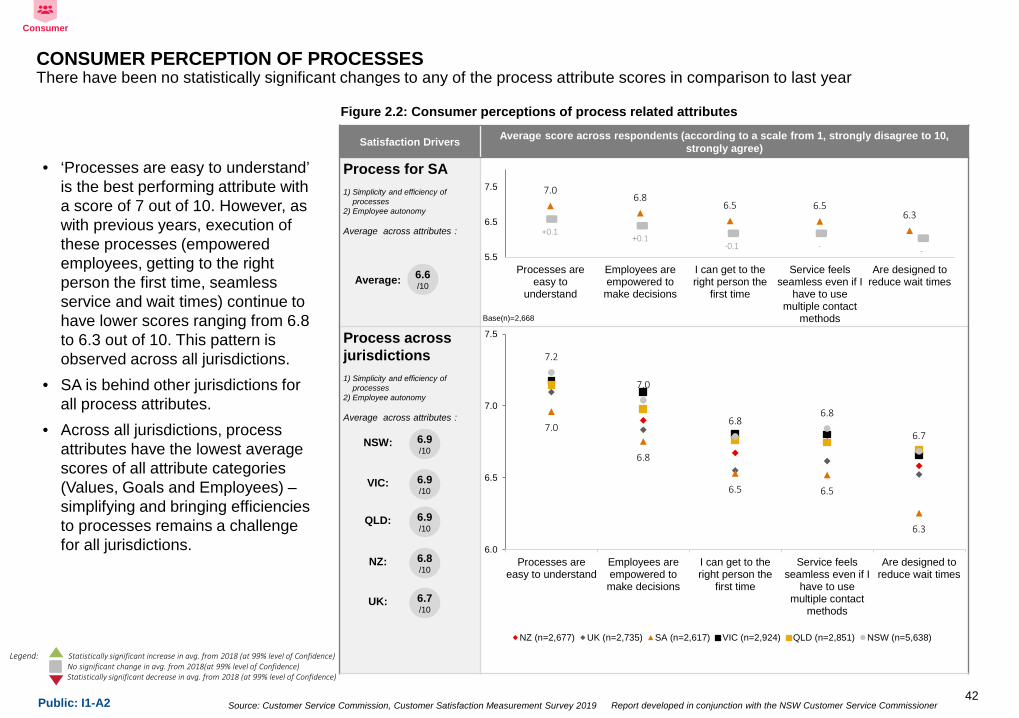
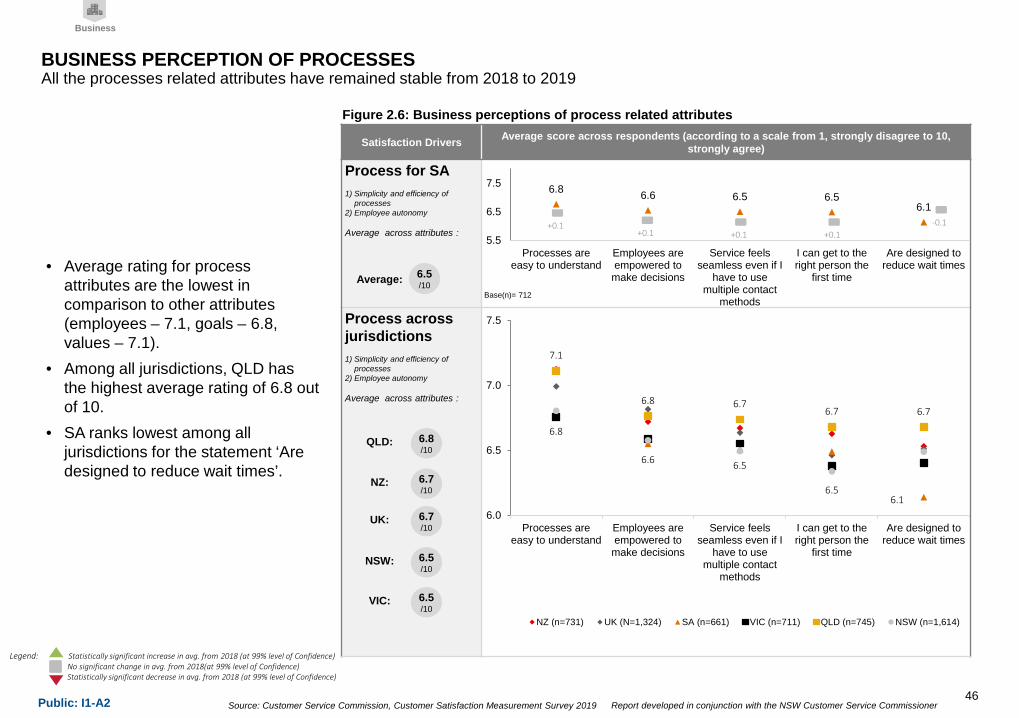
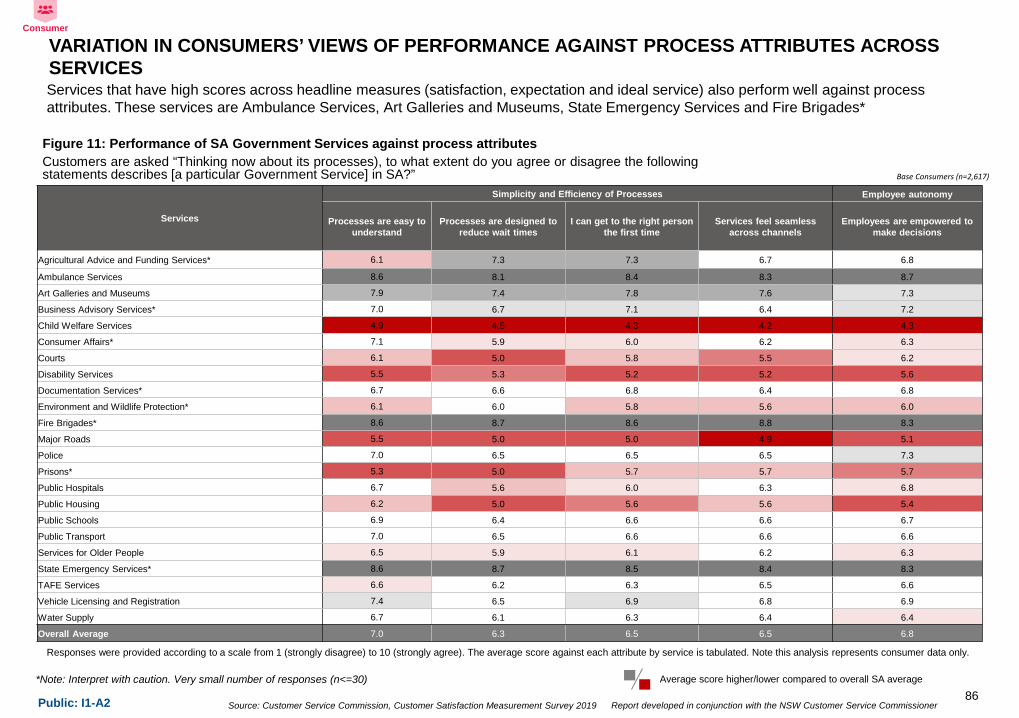
bull lsquoProcesses are easy to understandrsquo rates higher than other process attributes The opportunity areas lie in making processes more efficient as lsquoGetting things done as quickly as possiblersquo and processes lsquoAre designed to reduce wait timesrsquo are two attributes where SA has the lowest ratings among all jurisdictions
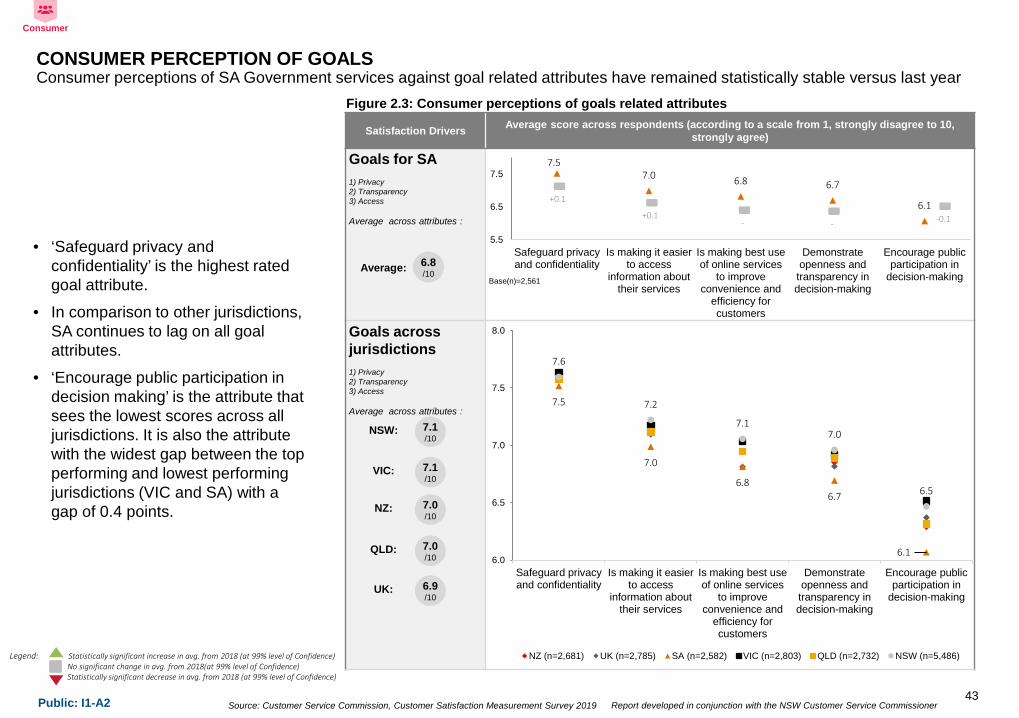
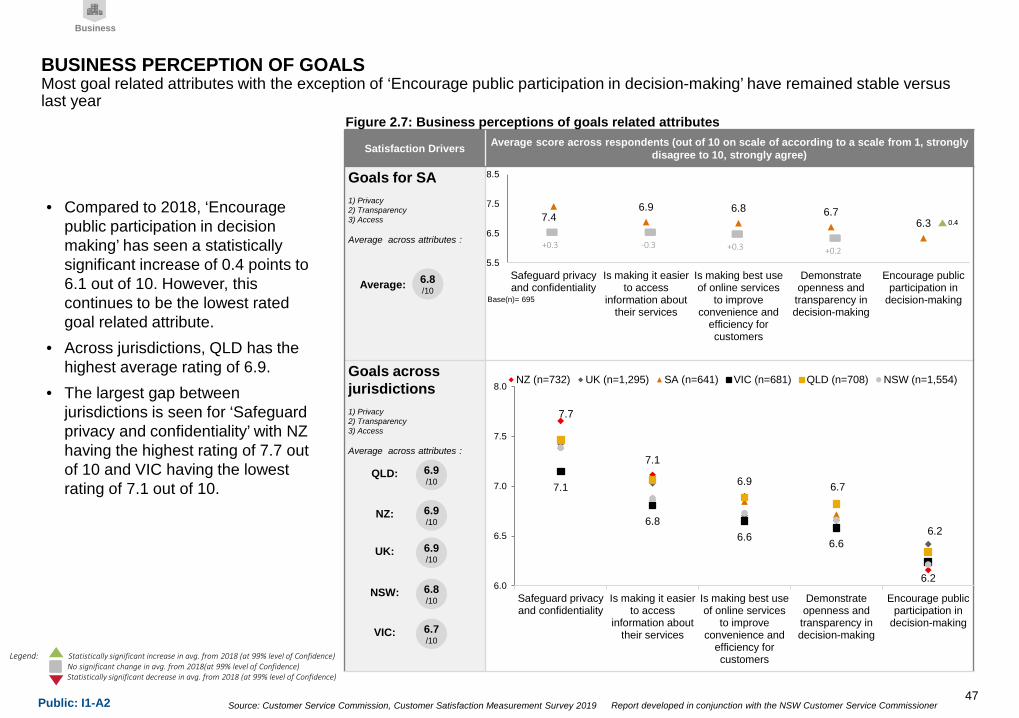
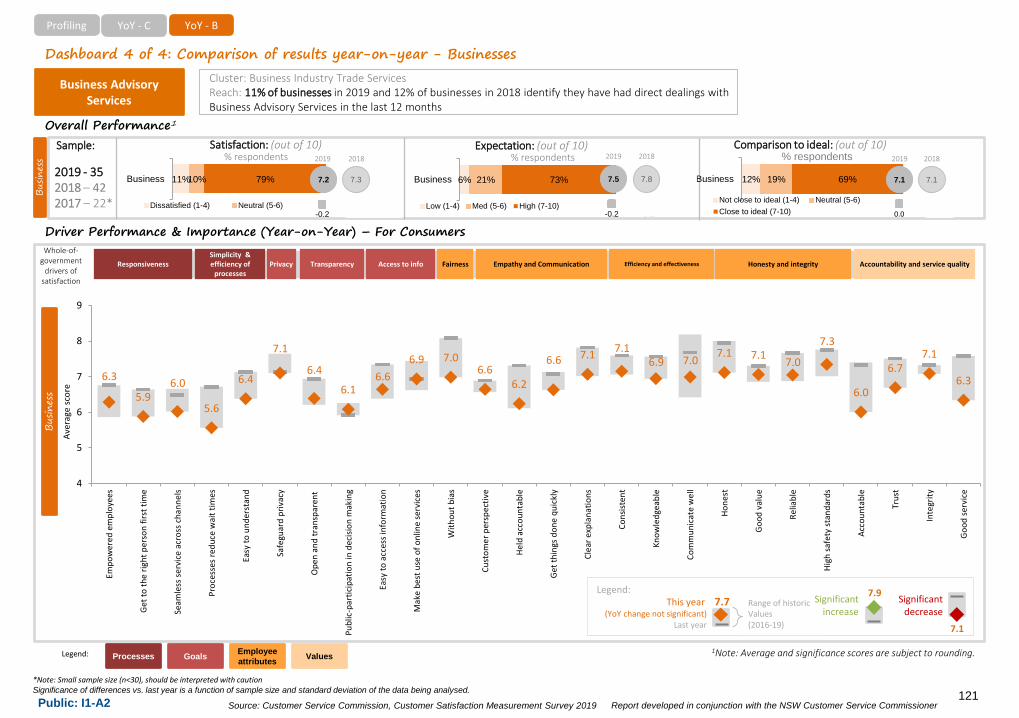
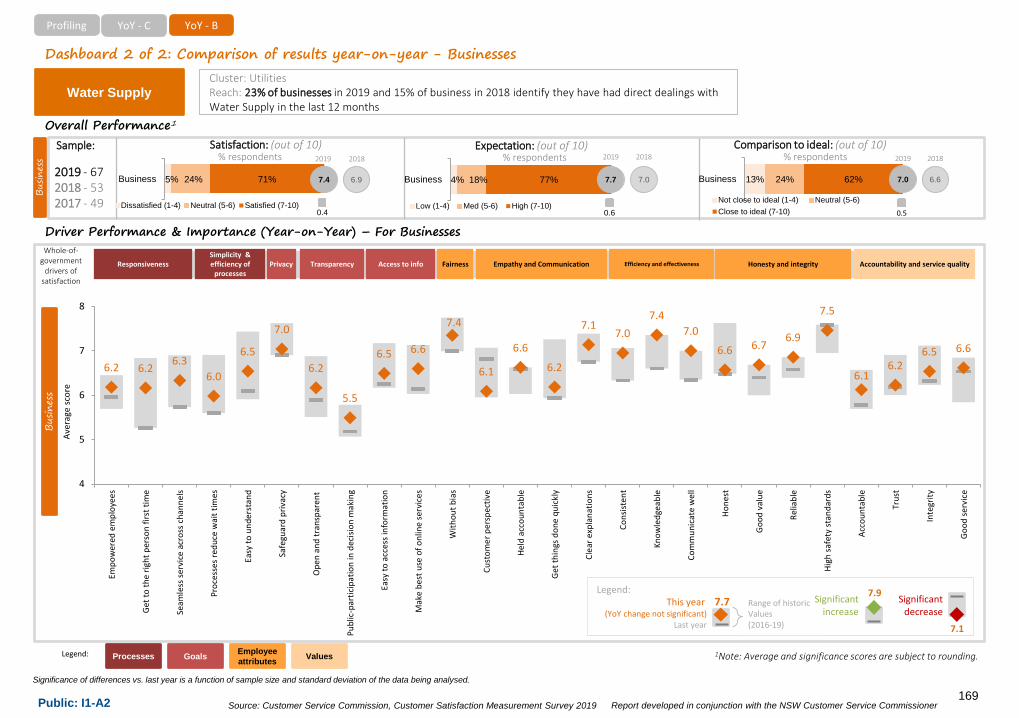
bull lsquoPublic participation in decision makingrsquo is one of the lowest performing attributes across all jurisdictions for consumers However businesses in SA have rated this attribute significantly higher than last year ndash an increase of 04 points to 63 out of 10 vs 2019
Consumer
Business
BusinessConsumer
8
Source Customer Service Commission Customer Satisfaction Measurement Survey 2019 Report developed in conjunction with the NSW Customer Service CommissionerPublic I1-A2
SUMMARY OF KEY FINDINGS IN 2019
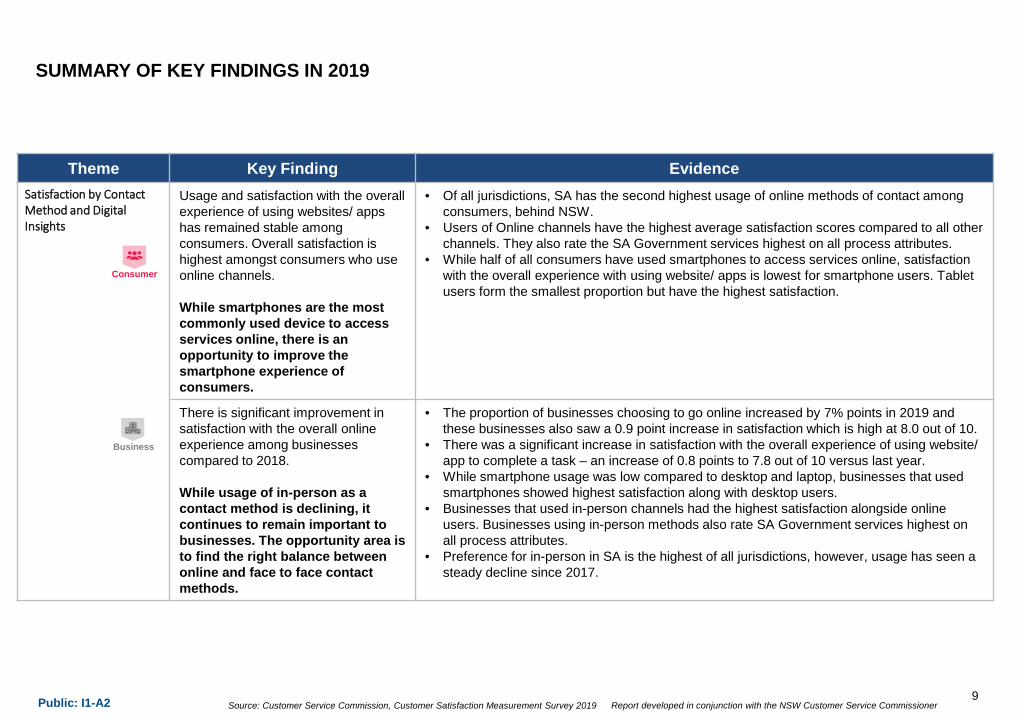
Theme Key Finding EvidenceSatisfaction by Contact Method and DigitalInsights
Usage and satisfaction with the overall experience of using websites appshas remained stable among consumers Overall satisfaction is highest amongst consumers who use online channels
While smartphones are the most commonly used device to access services online there is an opportunity to improve the smartphone experience of consumers
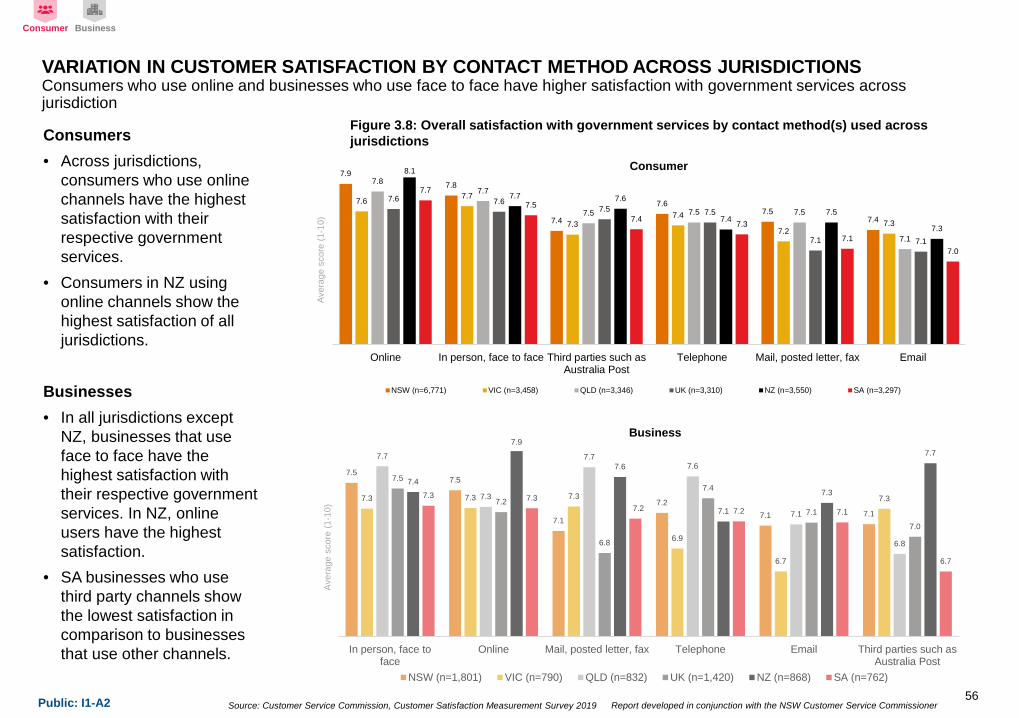
bull Of all jurisdictions SA has the second highest usage of online methods of contact among consumers behind NSW
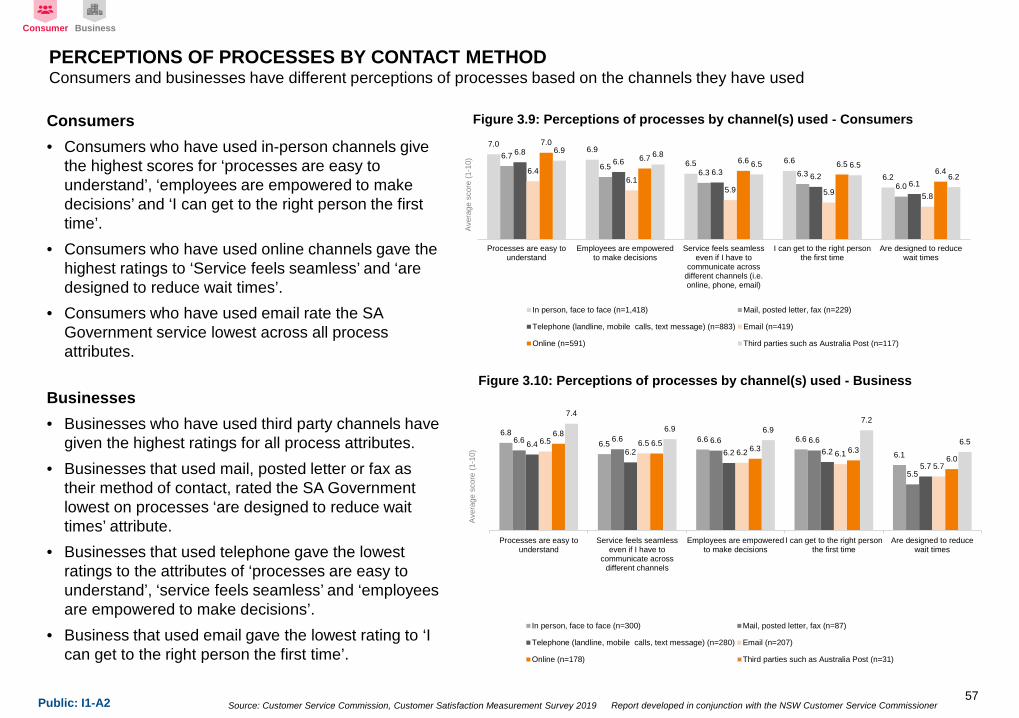
bull Users of Online channels have the highest average satisfaction scores compared to all other channels They also rate the SA Government services highest on all process attributes
bull While half of all consumers have used smartphones to access services online satisfaction with the overall experience with using website apps is lowest for smartphone users Tablet users form the smallest proportion but have the highest satisfaction
There is significant improvement in satisfaction with the overall online experience among businesses compared to 2018
While usage of in-person as a contact method is declining it continues to remain important to businesses The opportunity area is to find the right balance between online and face to face contact methods
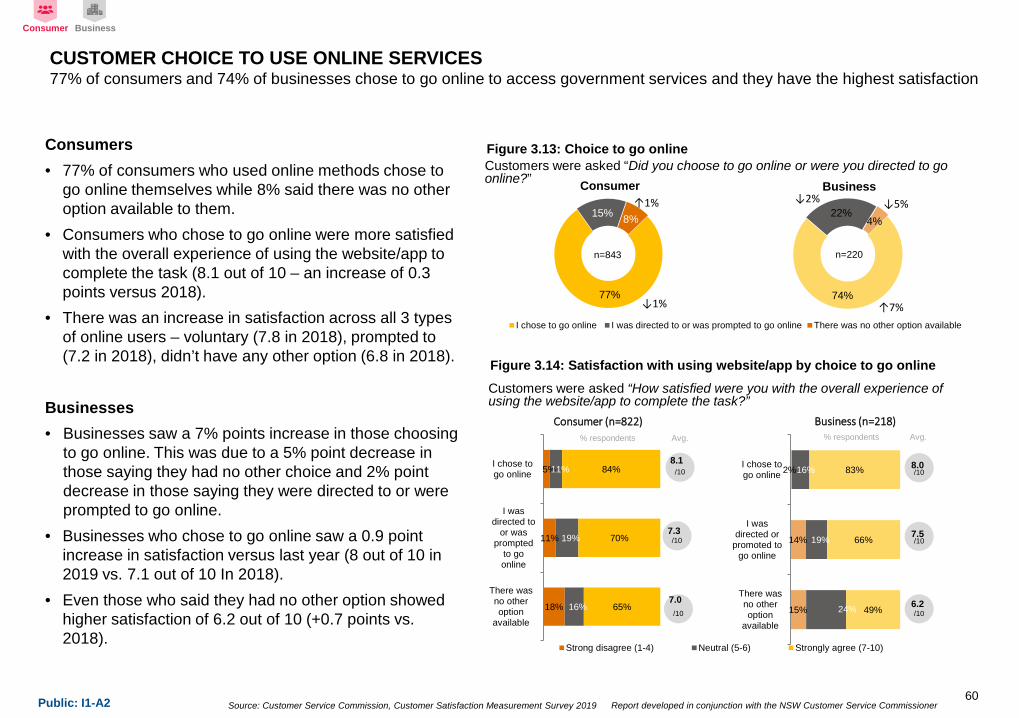
bull The proportion of businesses choosing to go online increased by 7 points in 2019 and these businesses also saw a 09 point increase in satisfaction which is high at 80 out of 10
bull There was a significant increase in satisfaction with the overall experience of using website app to complete a task ndash an increase of 08 points to 78 out of 10 versus last year
bull While smartphone usage was low compared to desktop and laptop businesses that used smartphones showed highest satisfaction along with desktop users
bull Businesses that used in-person channels had the highest satisfaction alongside online users Businesses using in-person methods also rate SA Government services highest on all process attributes
bull Preference for in-person in SA is the highest of all jurisdictions however usage has seen a steady decline since 2017
Consumer
Business
9
Source Customer Service Commission Customer Satisfaction Measurement Survey 2019 Report developed in conjunction with the NSW Customer Service CommissionerPublic I1-A2
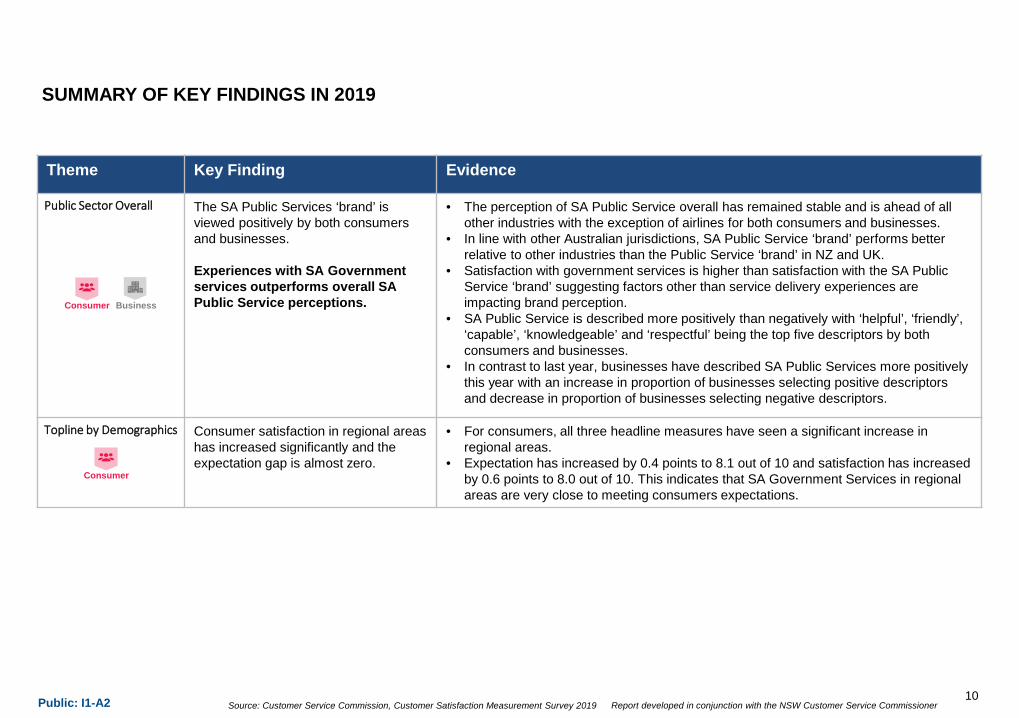
Theme Key Finding Evidence
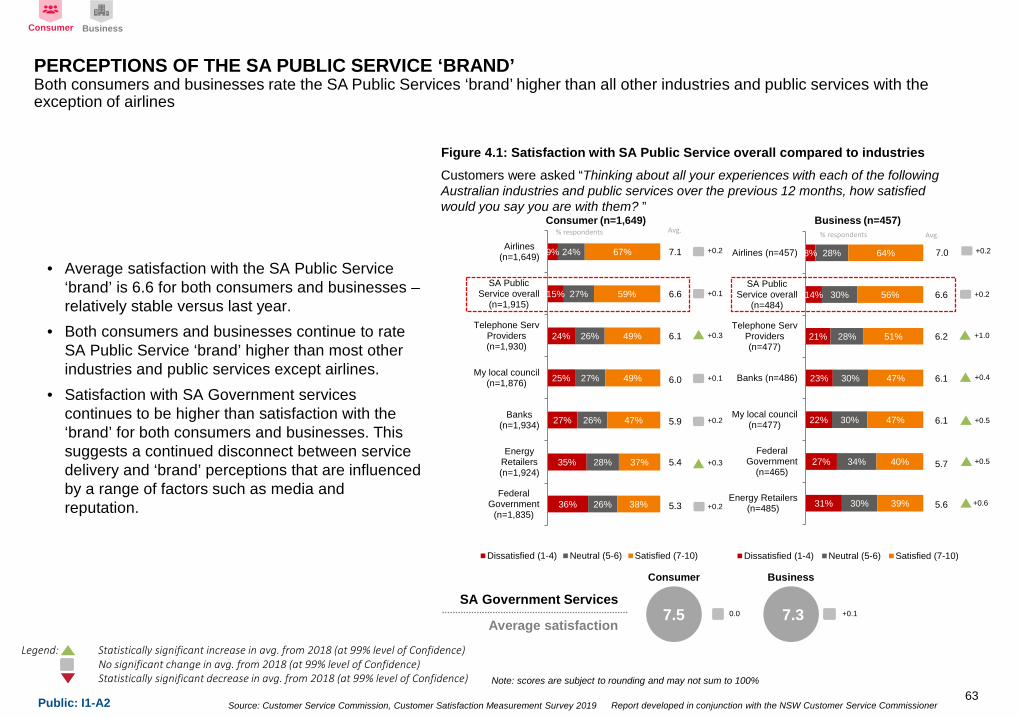
Public Sector Overall The SA Public Services lsquobrandrsquo is viewed positively by both consumers and businesses
Experiences with SA Government services outperforms overall SA Public Service perceptions
bull The perception of SA Public Service overall has remained stable and is ahead of all other industries with the exception of airlines for both consumers and businesses
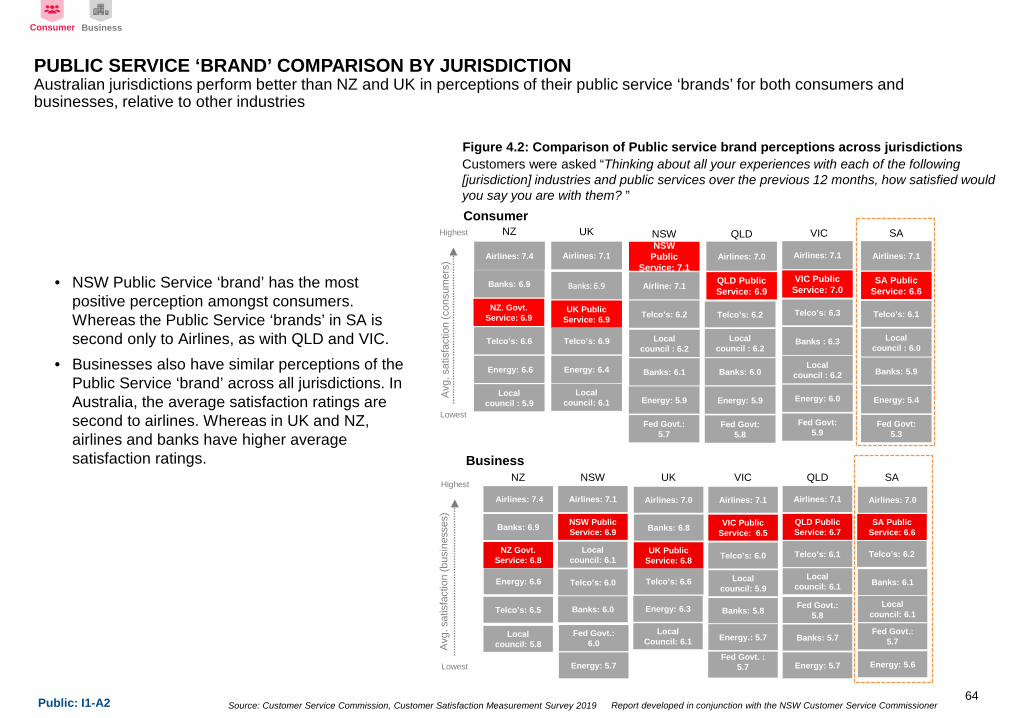
bull In line with other Australian jurisdictions SA Public Service lsquobrandrsquo performs better relative to other industries than the Public Service lsquobrandrsquo in NZ and UK
bull Satisfaction with government services is higher than satisfaction with the SA Public Service lsquobrandrsquo suggesting factors other than service delivery experiences are impacting brand perception
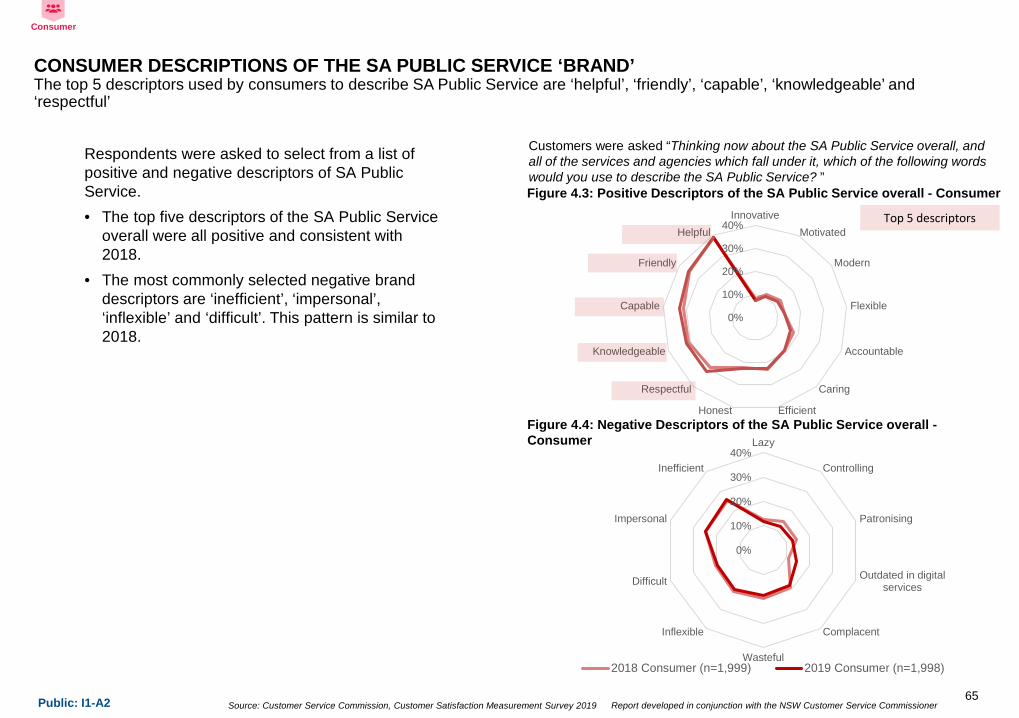
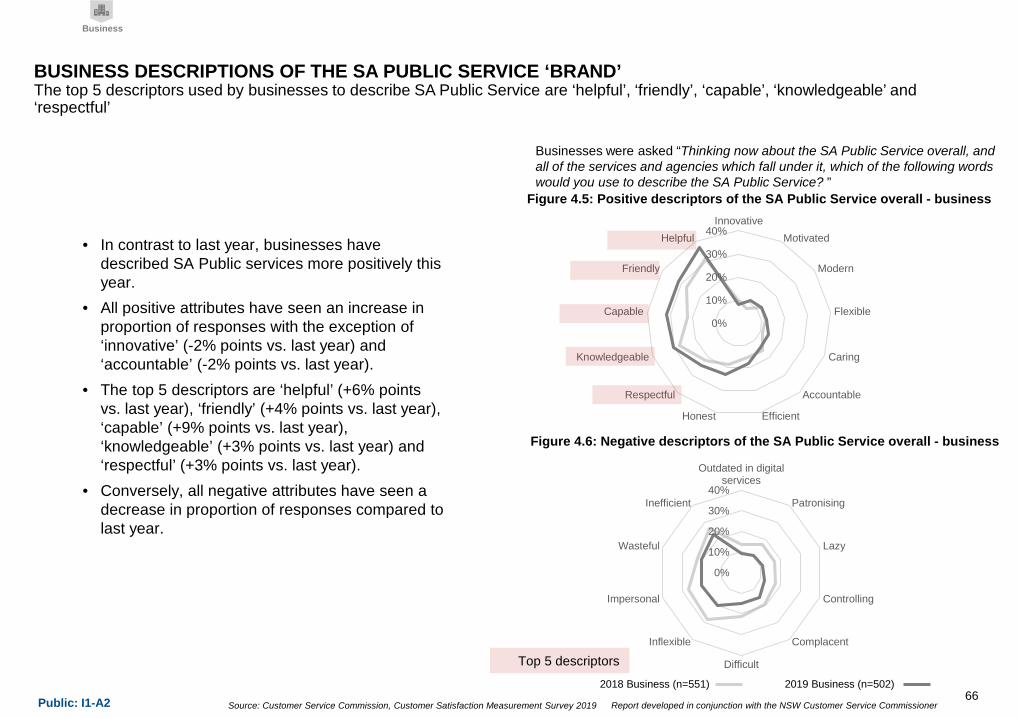
bull SA Public Service is described more positively than negatively with lsquohelpfulrsquo lsquofriendlyrsquo lsquocapablersquo lsquoknowledgeablersquo and lsquorespectfulrsquo being the top five descriptors by both consumers and businesses
bull In contrast to last year businesses have described SA Public Services more positively this year with an increase in proportion of businesses selecting positive descriptors and decrease in proportion of businesses selecting negative descriptors
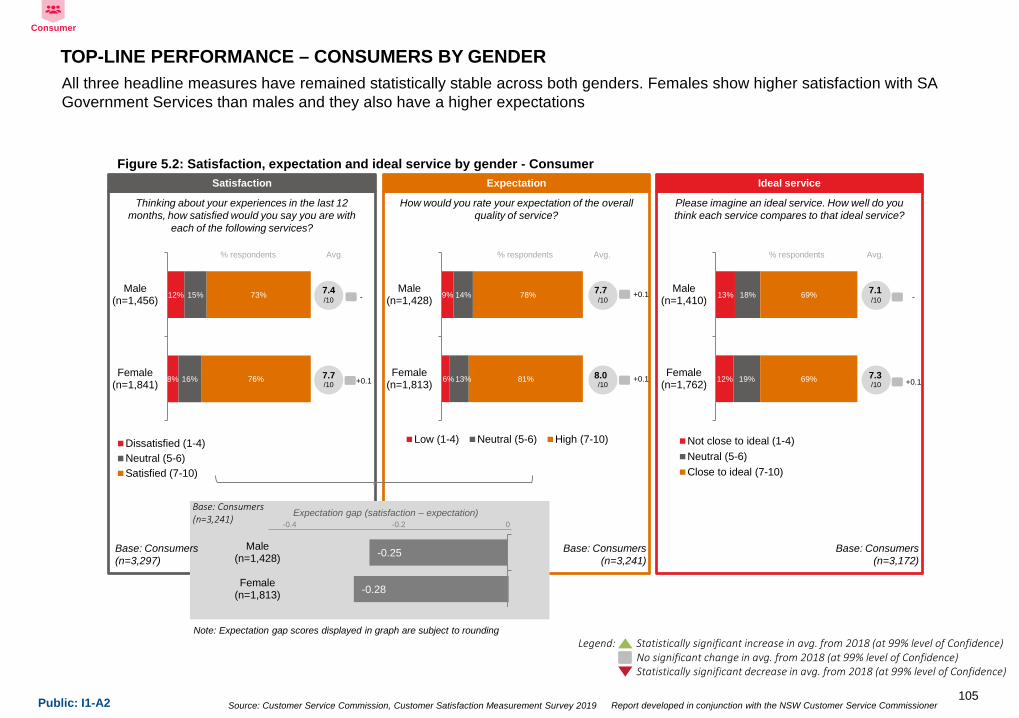
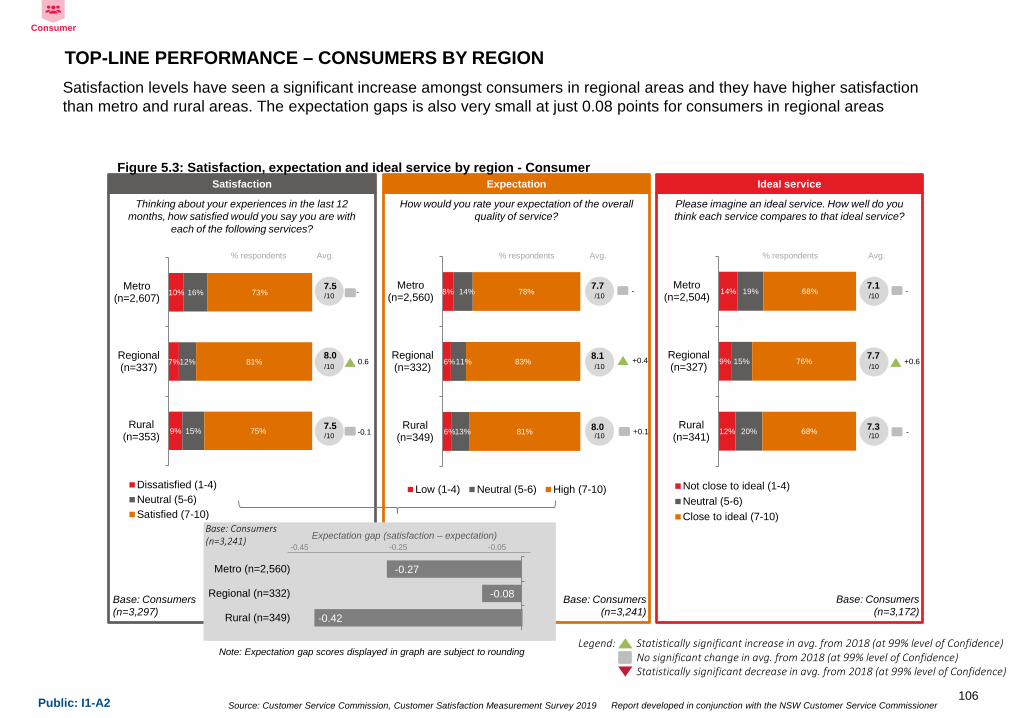
Topline by Demographics Consumer satisfaction in regional areas has increased significantly and the expectation gap is almost zero
bull For consumers all three headline measures have seen a significant increase in regional areas
bull Expectation has increased by 04 points to 81 out of 10 and satisfaction has increased by 06 points to 80 out of 10 This indicates that SA Government Services in regional areas are very close to meeting consumers expectations
Consumer Business
SUMMARY OF KEY FINDINGS IN 2019
10
Consumer
Source Customer Service Commission Customer Satisfaction Measurement Survey 2019 Report developed in conjunction with the NSW Customer Service CommissionerPublic I1-A2
Theme Key Finding Evidence
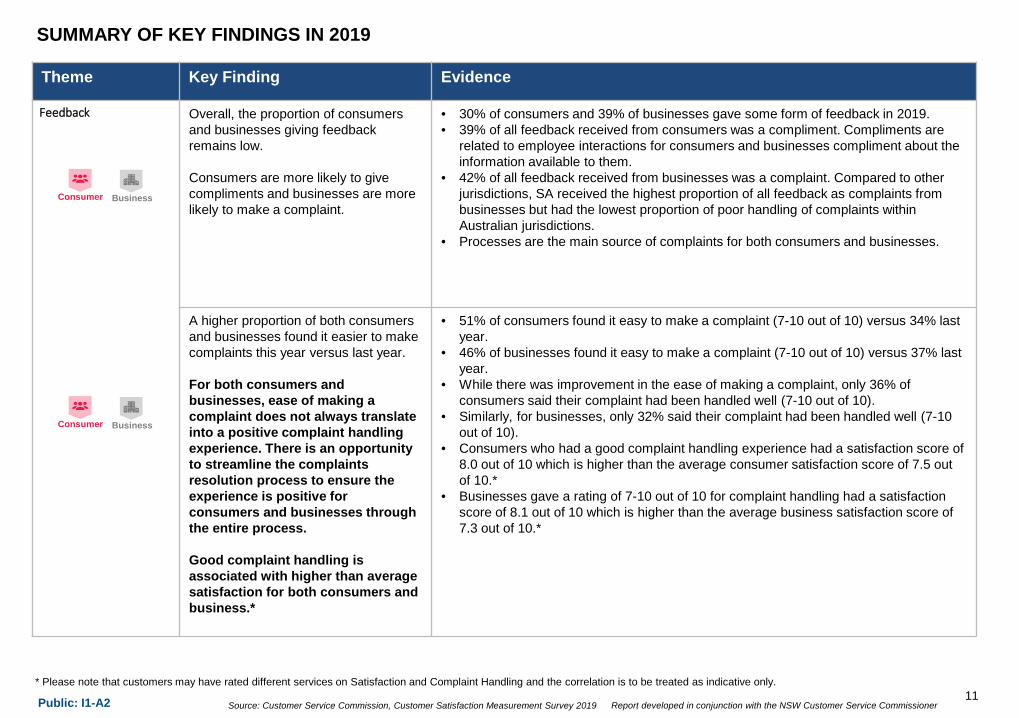
Feedback Overall the proportion of consumers and businesses giving feedback remains low
Consumers are more likely to give compliments and businesses are more likely to make a complaint
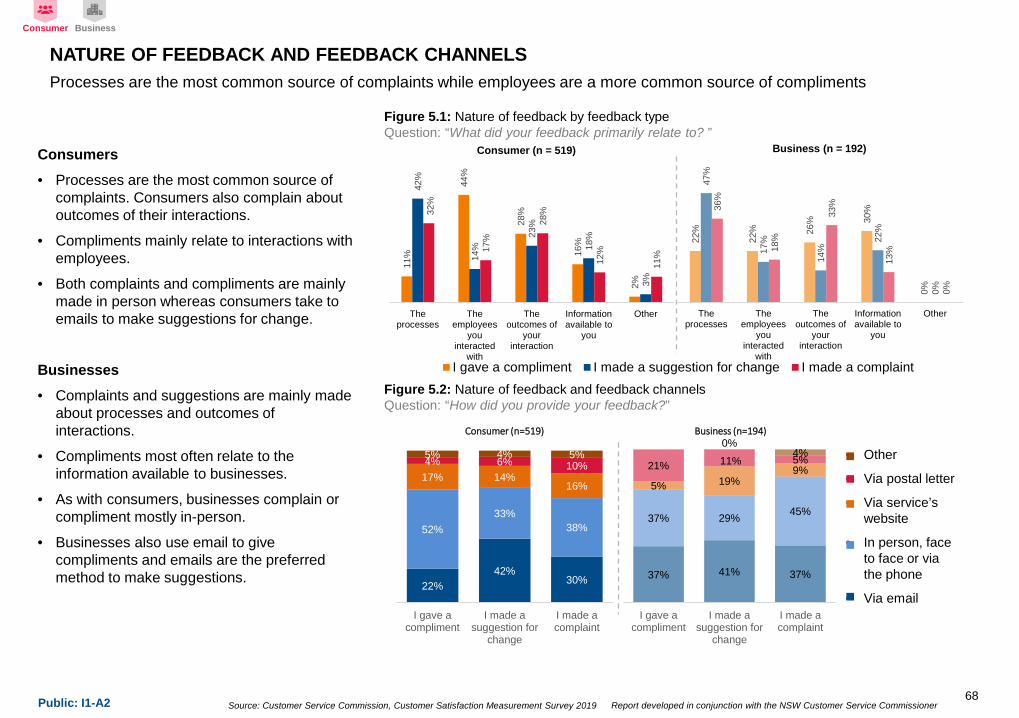
bull 30 of consumers and 39 of businesses gave some form of feedback in 2019bull 39 of all feedback received from consumers was a compliment Compliments are
related to employee interactions for consumers and businesses compliment about the information available to them
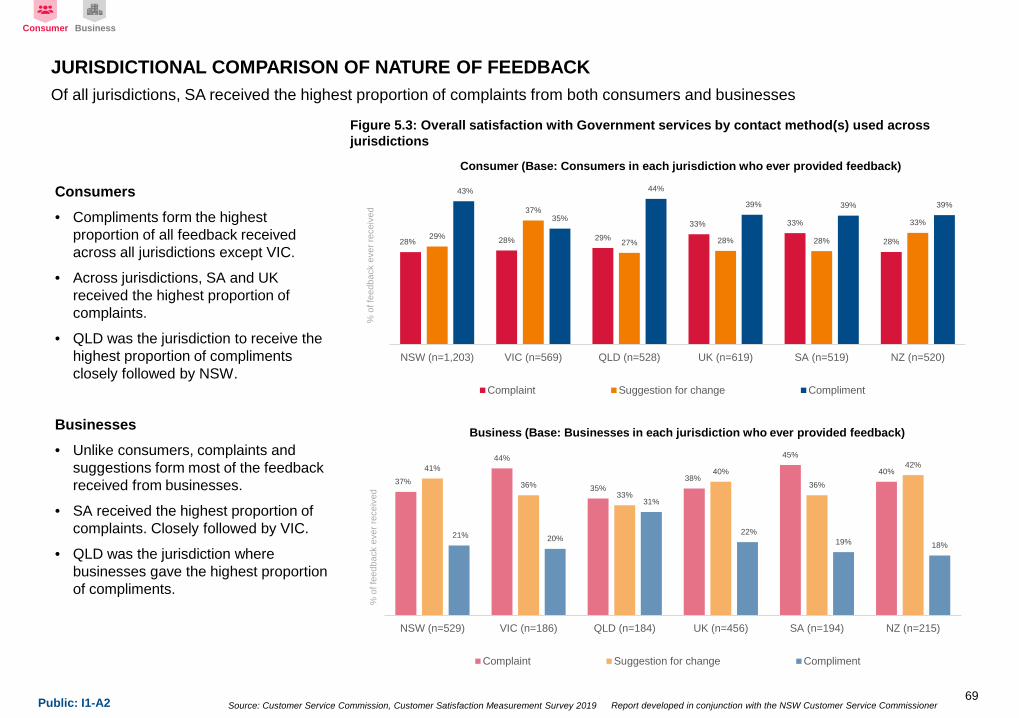
bull 42 of all feedback received from businesses was a complaint Compared to other jurisdictions SA received the highest proportion of all feedback as complaints from businesses but had the lowest proportion of poor handling of complaints within Australian jurisdictions
bull Processes are the main source of complaints for both consumers and businesses
A higher proportion of both consumers and businesses found it easier to make complaints this year versus last year
For both consumers and businesses ease of making a complaint does not always translate into a positive complaint handling experience There is an opportunity to streamline the complaints resolution process to ensure the experience is positive for consumers and businesses through the entire process
Good complaint handling is associated with higher than average satisfaction for both consumers and business
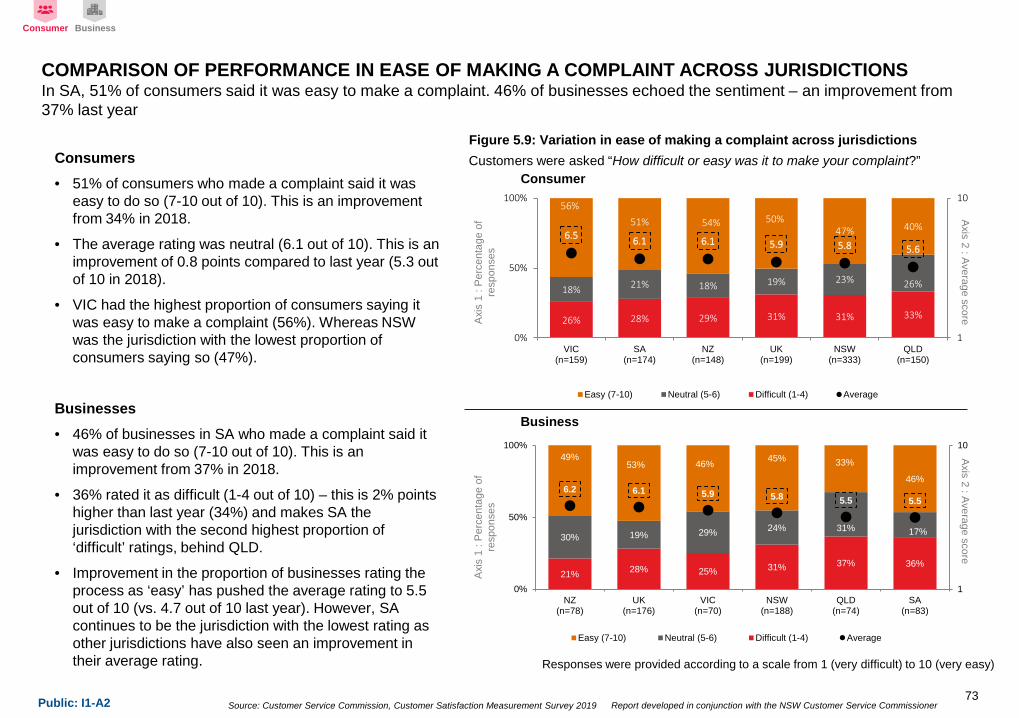
bull 51 of consumers found it easy to make a complaint (7-10 out of 10) versus 34 last year
bull 46 of businesses found it easy to make a complaint (7-10 out of 10) versus 37 last year
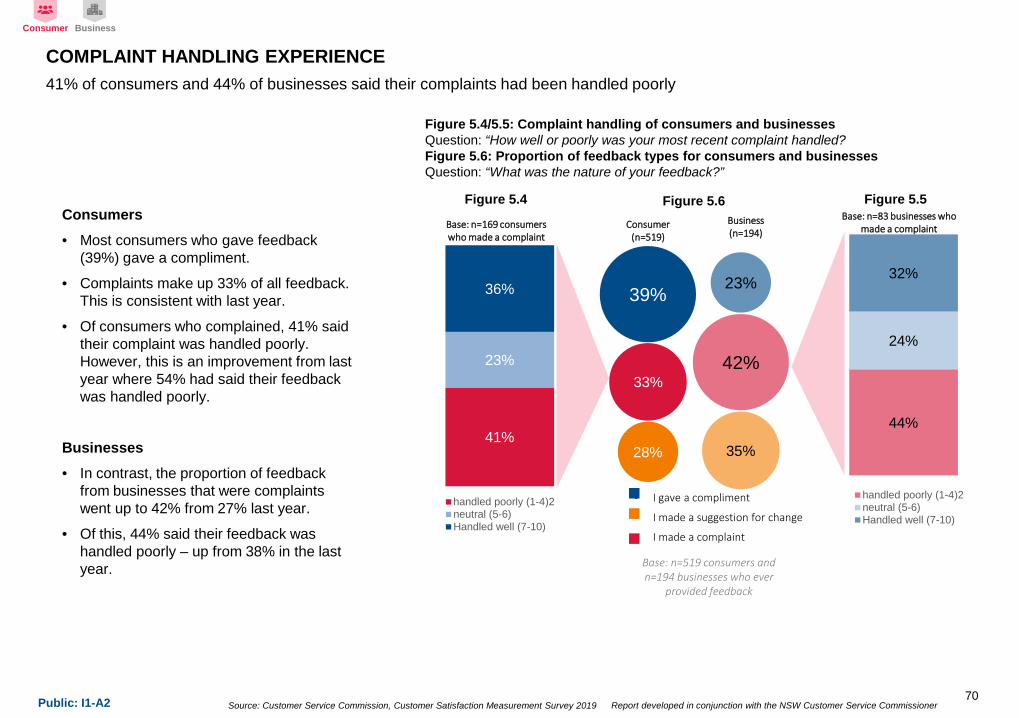
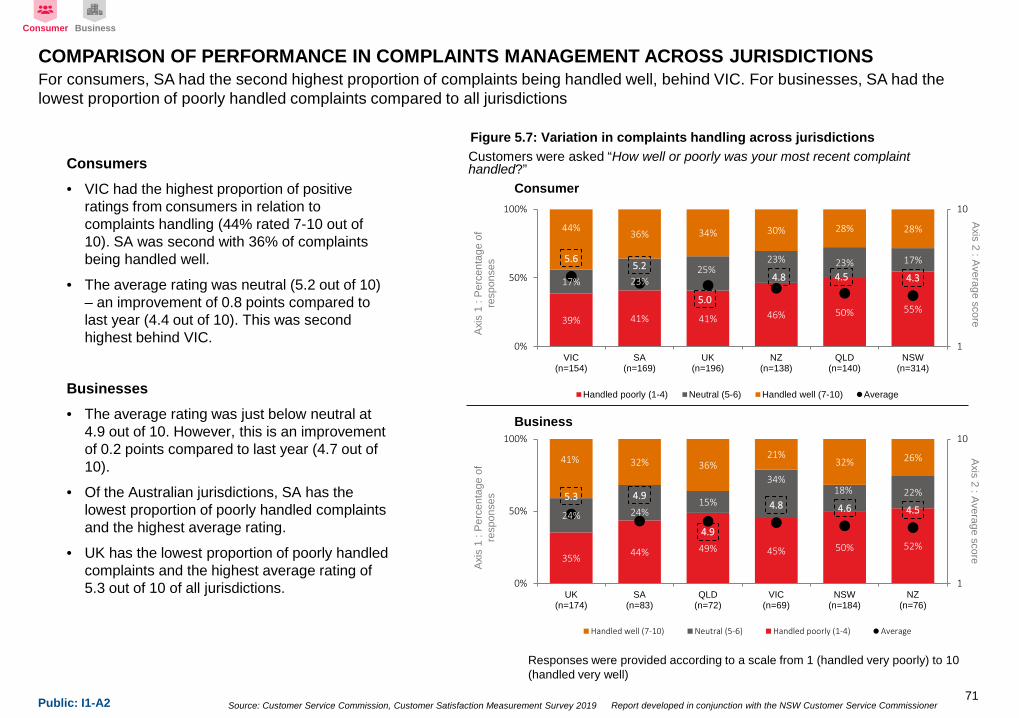
bull While there was improvement in the ease of making a complaint only 36 of consumers said their complaint had been handled well (7-10 out of 10)
bull Similarly for businesses only 32 said their complaint had been handled well (7-10 out of 10)
bull Consumers who had a good complaint handling experience had a satisfaction score of 80 out of 10 which is higher than the average consumer satisfaction score of 75 out of 10
bull Businesses gave a rating of 7-10 out of 10 for complaint handling had a satisfaction score of 81 out of 10 which is higher than the average business satisfaction score of 73 out of 10
Consumer Business
SUMMARY OF KEY FINDINGS IN 2019
11
Consumer Business
Please note that customers may have rated different services on Satisfaction and Complaint Handling and the correlation is to be treated as indicative only
Source Customer Service Commission Customer Satisfaction Measurement Survey 2019 Report developed in conjunction with the NSW Customer Service CommissionerPublic I1-A2
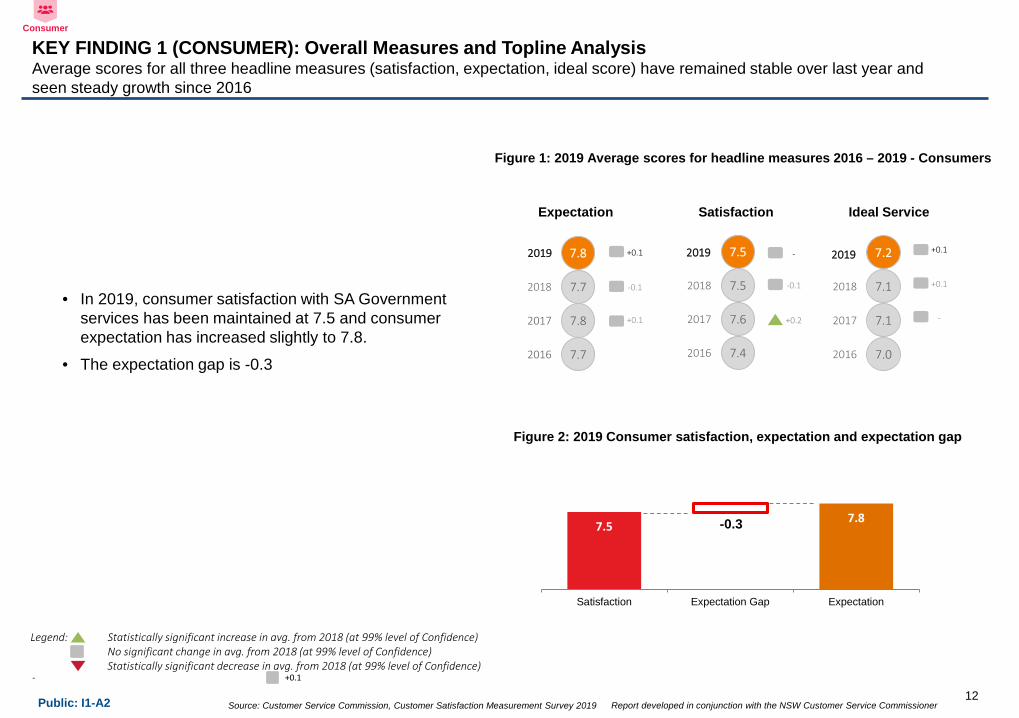
KEY FINDING 1 (CONSUMER) Overall Measures and Topline AnalysisAverage scores for all three headline measures (satisfaction expectation ideal score) have remained stable over last year and seen steady growth since 2016
7578
Satisfaction Expectation Gap Expectation
Figure 2 2019 Consumer satisfaction expectation and expectation gap
bull In 2019 consumer satisfaction with SA Government services has been maintained at 75 and consumer expectation has increased slightly to 78
bull The expectation gap is -03
+01-
Consumer
-03
Legend Statistically significant increase in avg from 2018 (at 99 level of Confidence)No significant change in avg from 2018 (at 99 level of Confidence)Statistically significant decrease in avg from 2018 (at 99 level of Confidence)
12
77
78
77
78
2016
2017
2018
2019
74
76
75
75
2016
2017
2018
2019
70
71
71
72
2016
2017
2018
2019
-01 -01 +01
+01 -+02
+01 - +01
Expectation Satisfaction Ideal Service
Figure 1 2019 Average scores for headline measures 2016 ndash 2019 - Consumers
Source Customer Service Commission Customer Satisfaction Measurement Survey 2019 Report developed in conjunction with the NSW Customer Service CommissionerPublic I1-A2
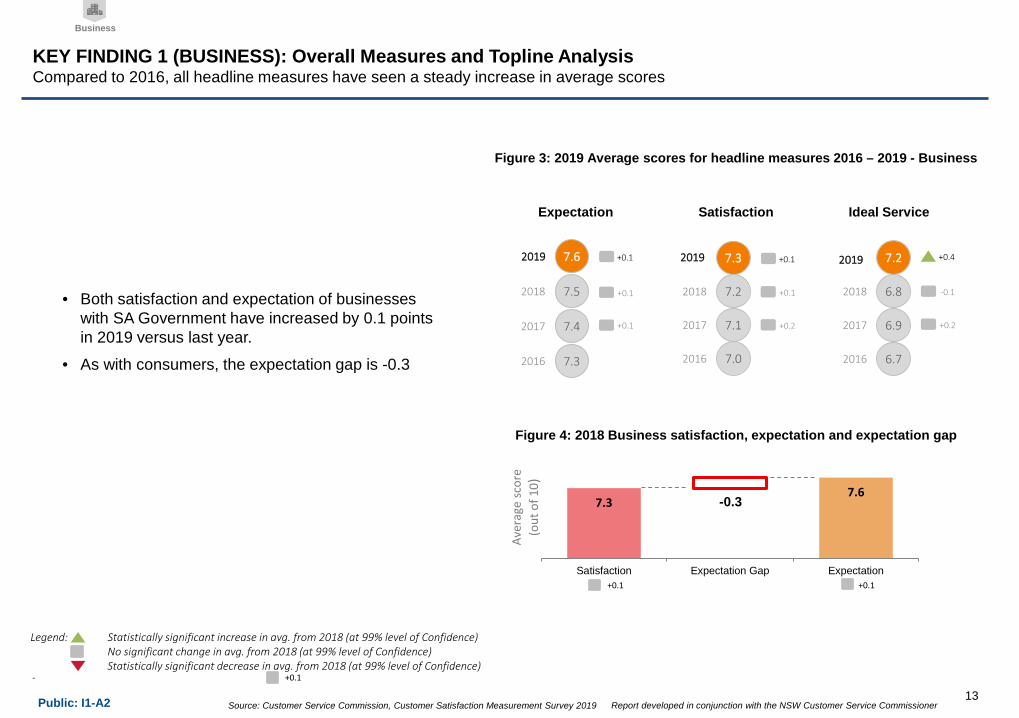
KEY FINDING 1 (BUSINESS) Overall Measures and Topline AnalysisCompared to 2016 all headline measures have seen a steady increase in average scores
bull Both satisfaction and expectation of businesses with SA Government have increased by 01 points in 2019 versus last year
bull As with consumers the expectation gap is -03
+01-
Business
Legend Statistically significant increase in avg from 2018 (at 99 level of Confidence)No significant change in avg from 2018 (at 99 level of Confidence)Statistically significant decrease in avg from 2018 (at 99 level of Confidence)
13
Expectation Satisfaction Ideal Service
Figure 3 2019 Average scores for headline measures 2016 ndash 2019 - Business
73
74
75
76
2016
2017
2018
2019
+01
+01
+01
70
71
72
73
2016
2017
2018
2019
+02
+01
+01
67
69
68
72
2016
2017
2018
2019
+02
-01
+04
+01 +01
7376
Satisfaction Expectation Gap Expectation
Figure 4 2018 Business satisfaction expectation and expectation gap
Aver
age
scor
e (o
ut o
f 10 )
-03
Source Customer Service Commission Customer Satisfaction Measurement Survey 2019 Report developed in conjunction with the NSW Customer Service CommissionerPublic I1-A2
Satisfaction Drivers Average score across respondents (out of 10 on scale of according to a scale from 1 strongly disagree to 10 strongly agree)
Employees1)Honesty amp integrity of employees2)Efficiency and effectiveness of employees3)Communication4) Fairness and Empathy
Average across attributes
Process1)Simplicity and efficiency of processes2)Employee autonomy
Average across attributes
73
This year (YoY change not significant)
Range of historicValues(2016-19)
Legend77
79
71
Significant increase
Significant decrease
Last year
72
73
73
74
2016
2017
2018
2019
76 76 76 75 74 74 74 74 7371
69
77 76 76 75 74 74 74 74 7370 70 70
69
60
65
70
75
80
Are
hone
st
Deliv
er h
igh
safe
tyst
anda
rds
Prov
ide
serv
ices
with
out b
ias
Expl
ain
inte
nded
actio
ns c
lear
ly
Enge
nder
con
fiden
cein
thei
r kno
wle
dge
Com
mun
icat
e w
ell
Prov
ide
good
val
uese
rvic
es
Are
relia
ble
Are
cons
iste
nt
Are
held
acc
ount
able
See
thin
gs fr
om m
ype
rspe
ctiv
e
Get
thin
gs d
one
asqu
ickl
y as
pos
sibl
e
66
65
66
66
2016
2017
2018
201969
6765 63
7068
6563
66
6560
65
70
75
80
Proc
esse
s ar
e ea
sy to
unde
rsta
nd
Empl
oyee
s ar
eem
pow
ered
to m
ake
deci
sions
I can
get
to th
e rig
htpe
rson
the
first
tim
e
Serv
ice
feel
s se
amle
ssev
en if
I ha
ve to
com
mun
icat
e ac
ross
diffe
rent
cha
nnel
s(i
e o
nlin
e p
hone
em
ail)
Are
desi
gned
tore
duce
wai
t tim
es
Consumer
KEY FINDING 2 (CONSUMER) Performance Against Customer Satisfaction AttributesWith an average score of 74 out of 10 for consumers SA Government Services perform well against employee attributes which havebeen identified as important drivers of customer satisfaction The opportunity area lies in improving process efficiencies to reduce the overall time taken by consumers to complete their task or interaction
Figure 5 Employee and Process attribute scores ndash Consumers
14
Source Customer Service Commission Customer Satisfaction Measurement Survey 2019 Report developed in conjunction with the NSW Customer Service CommissionerPublic I1-A2
Satisfaction Drivers Average score across respondents (out of 10 on scale of according to a scale from 1 strongly disagree to 10 strongly agree)
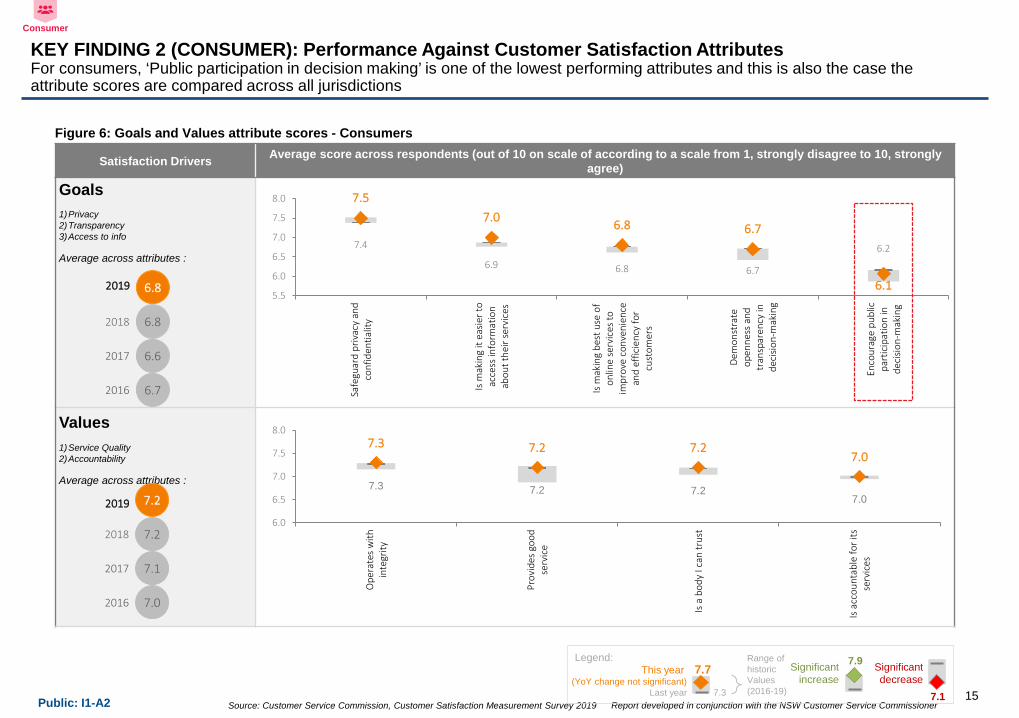
Goals 1)Privacy2)Transparency3)Access to info
Average across attributes
Values1)Service Quality2)Accountability
Average across attributes
67
66
68
68
2016
2017
2018
2019
74
69 68 67
7570 68 67
62
6155
60
65
70
75
80
Safe
guar
d pr
ivac
y an
dco
nfid
entia
lity
Is m
akin
g it
easi
er to
acce
ss in
form
atio
nab
out t
heir
serv
ices
Is m
akin
g be
st u
se o
fon
line
serv
ices
toim
prov
e co
nven
ienc
ean
d ef
ficie
ncy
for
cust
omer
s
Dem
onst
rate
open
ness
and
tran
spar
ency
inde
cisio
n-m
akin
g
Enco
urag
e pu
blic
part
icip
atio
n in
deci
sion-
mak
ing
70
71
72
72
2016
2017
2018
201973 72 72
70
73 72 7270
60
65
70
75
80
Ope
rate
s w
ithin
tegr
ity
Prov
ides
goo
dse
rvic
e
Is a
bod
y I c
an tr
ust
Is a
ccou
ntab
le fo
r its
serv
ices
73
This year (YoY change not significant)
Range of historicValues(2016-19)
Legend77
79
71
Significant increase
Significant decrease
Last year
Consumer
KEY FINDING 2 (CONSUMER) Performance Against Customer Satisfaction AttributesFor consumers lsquoPublic participation in decision makingrsquo is one of the lowest performing attributes and this is also the case the attribute scores are compared across all jurisdictions
Figure 6 Goals and Values attribute scores - Consumers
15
Source Customer Service Commission Customer Satisfaction Measurement Survey 2019 Report developed in conjunction with the NSW Customer Service CommissionerPublic I1-A2
Satisfaction Drivers Average score across respondents (out of 10 on scale of according to a scale from 1 strongly disagree to 10 strongly agree)
Employees1)Honesty amp integrity of employees2)Efficiency and effectiveness of employees3)Communication4) Fairness and Empathy
Average across attributes
Process1)Simplicity and efficiency of processes2)Responsiveness
Average across attributes
7374
71 71 71 71 7070 71
6767 67
75 7573 72 72 72 71 71 71
69 68 68
60
65
70
75
Are
hone
st
Deliv
er h
igh
safe
tyst
anda
rds
Prov
ide
serv
ices
with
out b
ias
Expl
ain
inte
nded
actio
ns c
lear
ly
Enge
nder
con
fiden
cein
thei
r kno
wle
dge
Com
mun
icat
e w
ell
Are
cons
iste
nt
Prov
ide
good
val
uese
rvic
es
Are
relia
ble
Are
held
acc
ount
able
Get
thin
gs d
one
asqu
ickl
y as
pos
sibl
e
See
thin
gs fr
om m
ype
rspe
ctiv
e
68
71
70
71
2016
2017
2018
2019
61
64
65
65
2016
2017
2018
2019 67 64 64 62
6865 65
6167
66
55
60
65
70
75
80
Proc
esse
s ar
e ea
sy to
unde
rsta
nd
Empl
oyee
s ar
eem
pow
ered
to m
ake
deci
sions
Serv
ice
feel
s se
amle
ssev
en if
I ha
ve to
com
mun
icat
e ac
ross
diffe
rent
cha
nnel
s (i
eon
line
pho
ne e
mai
l)
I can
get
to th
e rig
htpe
rson
the
first
tim
e
Are
desi
gned
tore
duce
wai
t tim
es
73
This year (YoY change not significant)
Range of historicValues(2016-19)
Legend77
79
71
Significant increase
Significant decrease
Last year
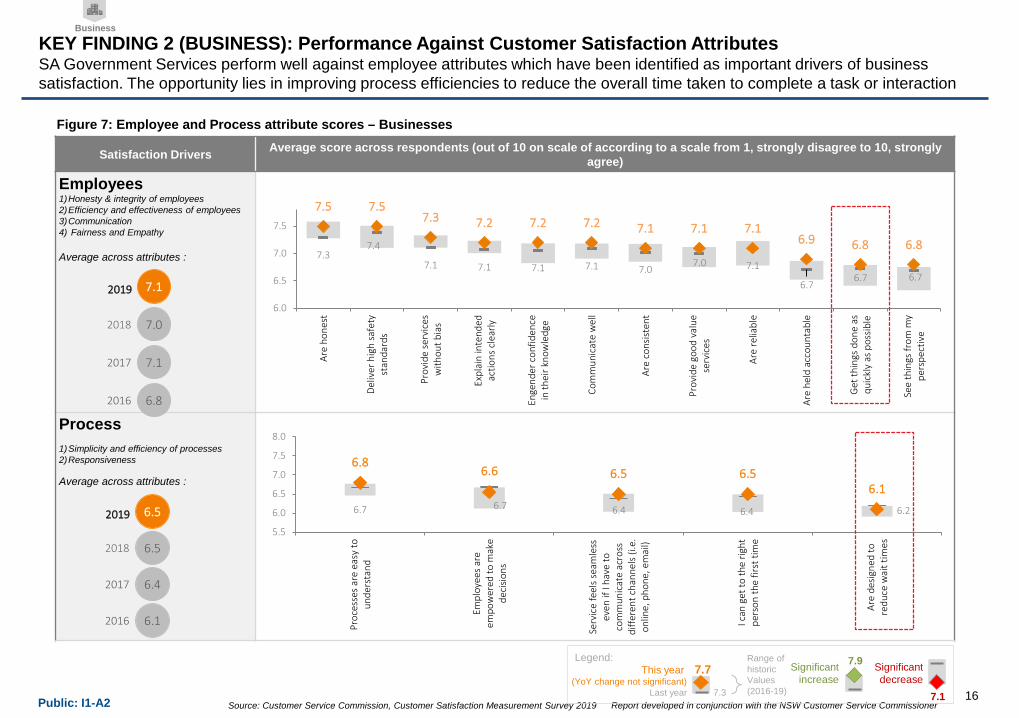
Business
Figure 7 Employee and Process attribute scores ndash Businesses
16
KEY FINDING 2 (BUSINESS) Performance Against Customer Satisfaction AttributesSA Government Services perform well against employee attributes which have been identified as important drivers of business satisfaction The opportunity lies in improving process efficiencies to reduce the overall time taken to complete a task or interaction
Source Customer Service Commission Customer Satisfaction Measurement Survey 2019 Report developed in conjunction with the NSW Customer Service CommissionerPublic I1-A2
Satisfaction Drivers Average score across respondents (out of 10 on scale of according to a scale from 1 strongly disagree to 10 strongly agree)
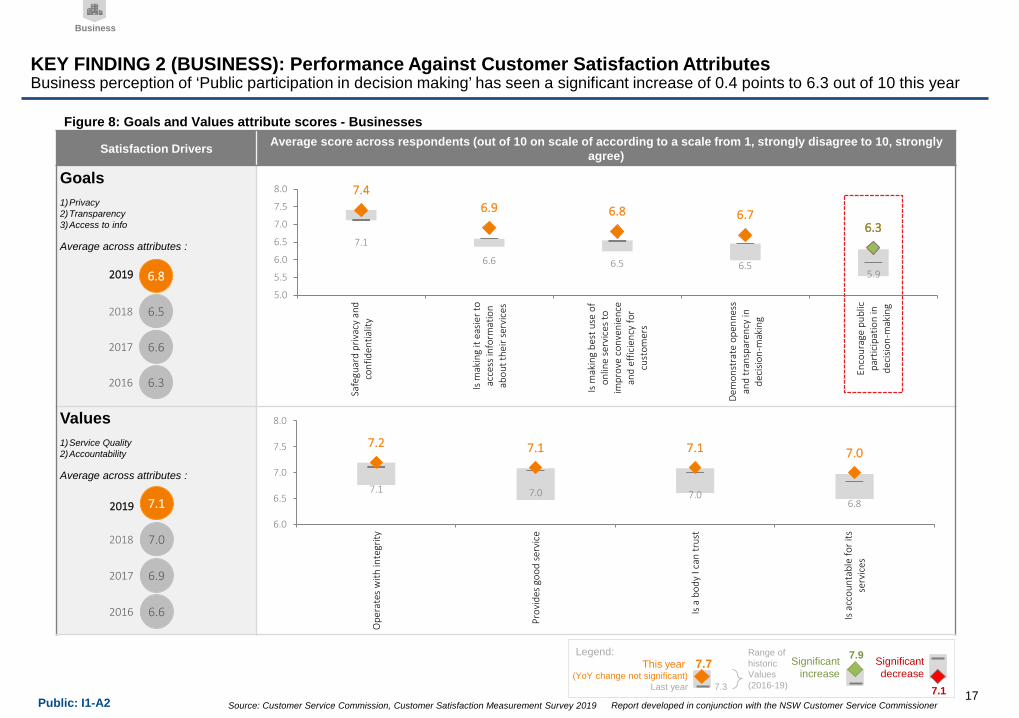
Goals 1)Privacy2)Transparency3)Access to info
Average across attributes
Values 1)Service Quality2)Accountability
Average across attributes
63
66
65
68
2016
2017
2018
2019
71
66 65 6559
7469 68 67
6363
50
55
60
65
70
75
80
Safe
guar
d pr
ivac
y an
dco
nfid
entia
lity
Is m
akin
g it
easi
er to
acce
ss in
form
atio
nab
out t
heir
serv
ices
Is m
akin
g be
st u
se o
fon
line
serv
ices
toim
prov
e co
nven
ienc
ean
d ef
ficie
ncy
for
cust
omer
s
Dem
onst
rate
ope
nnes
san
d tr
ansp
aren
cy in
deci
sion-
mak
ing
Enco
urag
e pu
blic
part
icip
atio
n in
deci
sion-
mak
ing
66
69
70
71
2016
2017
2018
201971 70 70
68
72 71 71 70
60
65
70
75
80
Ope
rate
s w
ith in
tegr
ity
Prov
ides
goo
d se
rvic
e
Is a
bod
y I c
an tr
ust
Is a
ccou
ntab
le fo
r its
serv
ices
73
This year (YoY change not significant)
Range of historicValues(2016-19)
Legend77
79
71
Significant increase
Significant decrease
Last year
Business
KEY FINDING 2 (BUSINESS) Performance Against Customer Satisfaction AttributesBusiness perception of lsquoPublic participation in decision makingrsquo has seen a significant increase of 04 points to 63 out of 10 this year
Figure 8 Goals and Values attribute scores - Businesses
17
Source Customer Service Commission Customer Satisfaction Measurement Survey 2019 Report developed in conjunction with the NSW Customer Service CommissionerPublic I1-A2
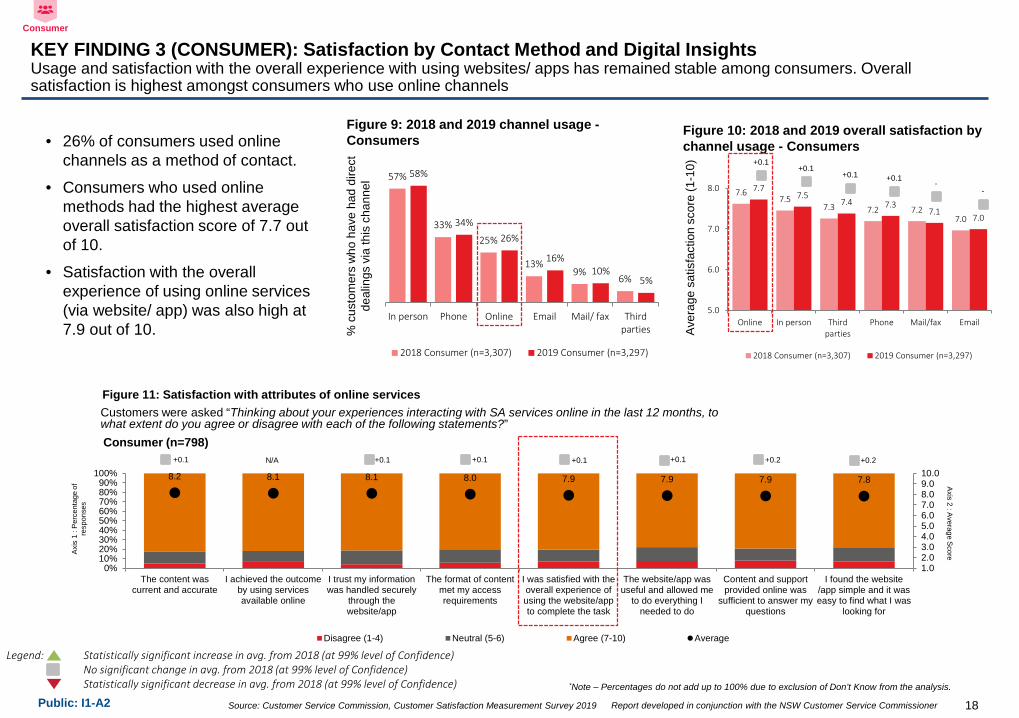
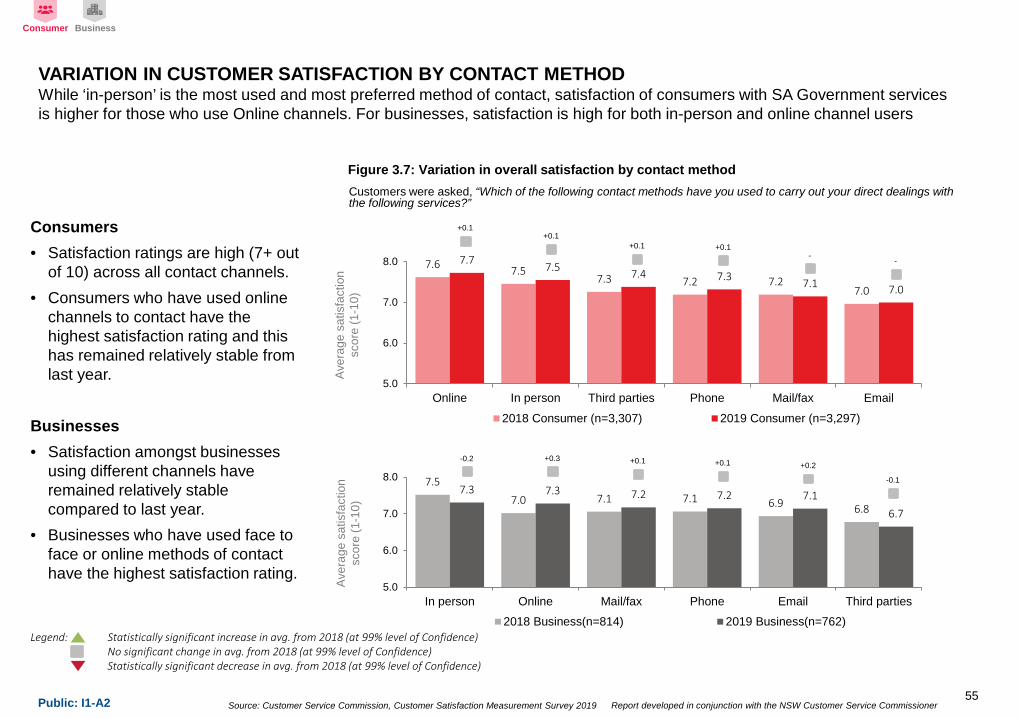
KEY FINDING 3 (CONSUMER) Satisfaction by Contact Method and Digital InsightsUsage and satisfaction with the overall experience with using websites apps has remained stable among consumers Overall satisfaction is highest amongst consumers who use online channels
Note ndash Percentages do not add up to 100 due to exclusion of Donrsquot Know from the analysis
bull 26 of consumers used online channels as a method of contact
bull Consumers who used online methods had the highest average overall satisfaction score of 77 out of 10
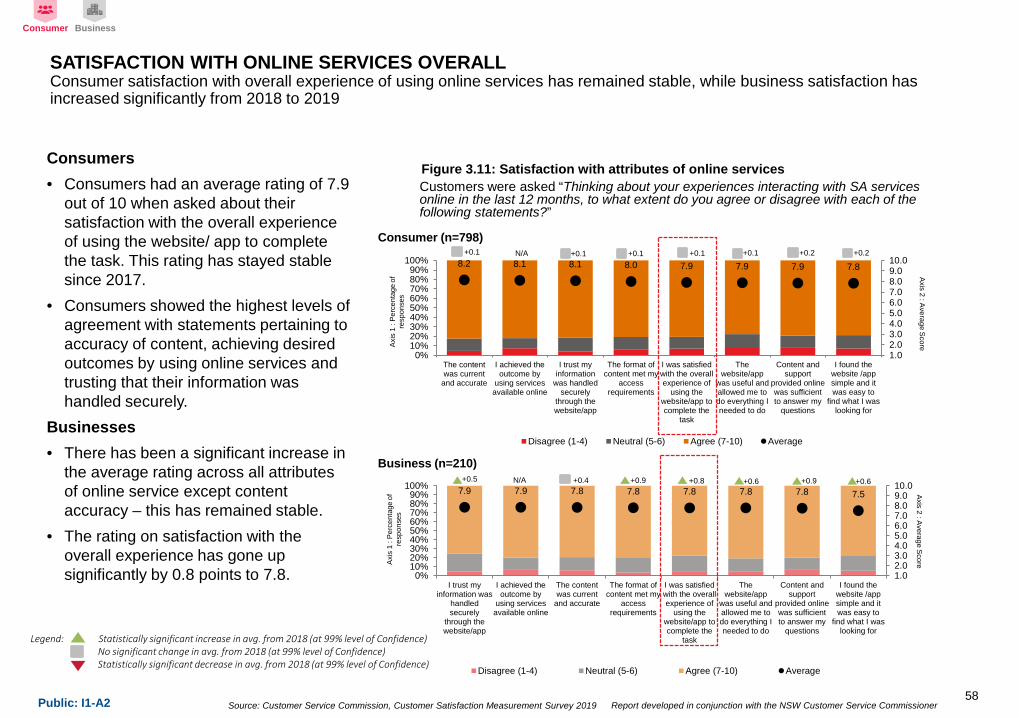
bull Satisfaction with the overall experience of using online services (via website app) was also high at 79 out of 10
57
3325
139
6
58
3426
1610
5
In person Phone Online Email Mail fax Thirdparties
2018 Consumer (n=3307) 2019 Consumer (n=3297)
cus
tom
ers
who
hav
e ha
d di
rect
de
alin
gs v
ia th
is c
hann
el
Figure 9 2018 and 2019 channel usage -Consumers
Consumer
Figure 10 2018 and 2019 overall satisfaction by channel usage - Consumers
7675
73 72 7270
7775
74 7371
70
50
60
70
80
Online In person Thirdparties
Phone Mailfax Email
2018 Consumer (n=3307) 2019 Consumer (n=3297)
Aver
age
satis
fact
ion
scor
e (1
-10) +01
+01+01 +01
--
Legend Statistically significant increase in avg from 2018 (at 99 level of Confidence)No significant change in avg from 2018 (at 99 level of Confidence)Statistically significant decrease in avg from 2018 (at 99 level of Confidence)
Customers were asked ldquoThinking about your experiences interacting with SA services online in the last 12 months to what extent do you agree or disagree with each of the following statementsrdquo
Figure 11 Satisfaction with attributes of online services
82 81 81 80 79 79 79 78
102030405060708090100
0102030405060708090
100
The content wascurrent and accurate
I achieved the outcomeby using servicesavailable online
I trust my informationwas handled securely
through thewebsiteapp
The format of contentmet my accessrequirements
I was satisfied with theoverall experience ofusing the websiteappto complete the task
The websiteapp wasuseful and allowed me
to do everything Ineeded to do
Content and supportprovided online was
sufficient to answer myquestions
I found the websiteapp simple and it waseasy to find what I was
looking for
Disagree (1-4) Neutral (5-6) Agree (7-10) Average
Axis 2 Average Score
Consumer (n=798)
Axis
1
Perc
enta
ge o
f re
spon
ses
+01 +01 +01 +02+01 +01 +02NA
18
Source Customer Service Commission Customer Satisfaction Measurement Survey 2019 Report developed in conjunction with the NSW Customer Service CommissionerPublic I1-A2
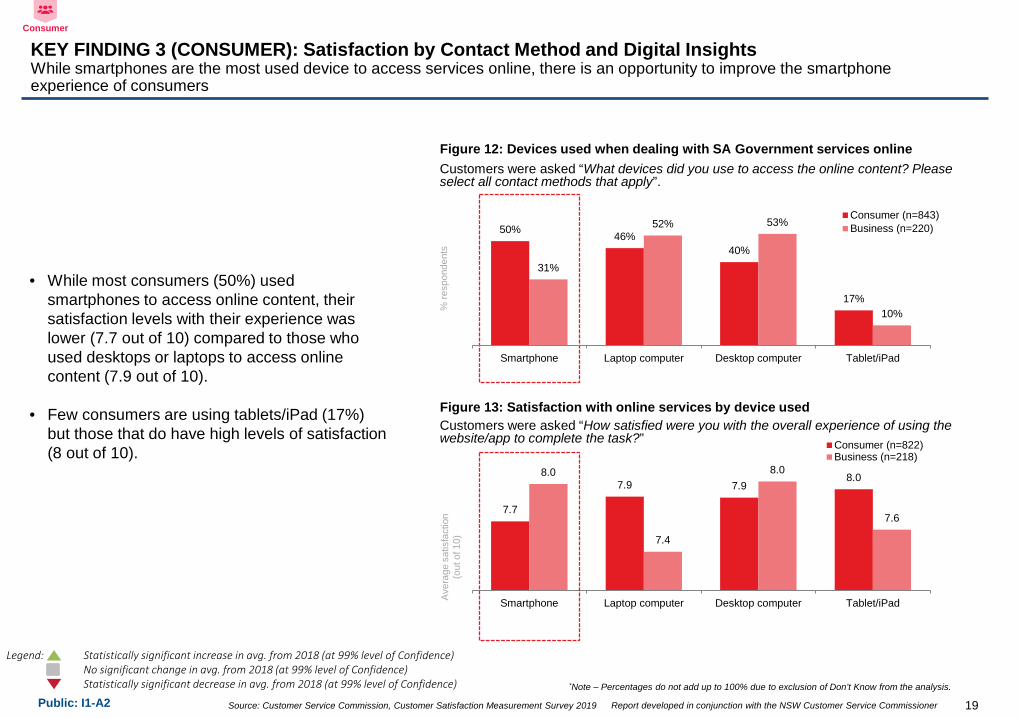
KEY FINDING 3 (CONSUMER) Satisfaction by Contact Method and Digital InsightsWhile smartphones are the most used device to access services online there is an opportunity to improve the smartphone experience of consumers
Note ndash Percentages do not add up to 100 due to exclusion of Donrsquot Know from the analysis
Consumer
Legend Statistically significant increase in avg from 2018 (at 99 level of Confidence)No significant change in avg from 2018 (at 99 level of Confidence)Statistically significant decrease in avg from 2018 (at 99 level of Confidence)
19
50 4640
17
31
52 53
10
Smartphone Laptop computer Desktop computer TabletiPad
Consumer (n=843)Business (n=220)
Customers were asked ldquoWhat devices did you use to access the online content Please select all contact methods that applyrdquo
Figure 12 Devices used when dealing with SA Government services online
Figure 13 Satisfaction with online services by device used Customers were asked ldquoHow satisfied were you with the overall experience of using the websiteapp to complete the taskrdquo
re
spon
dent
s
77
79 798080
74
80
76
Smartphone Laptop computer Desktop computer TabletiPad
Consumer (n=822)Business (n=218)
Aver
age
satis
fact
ion
(out
of 1
0)
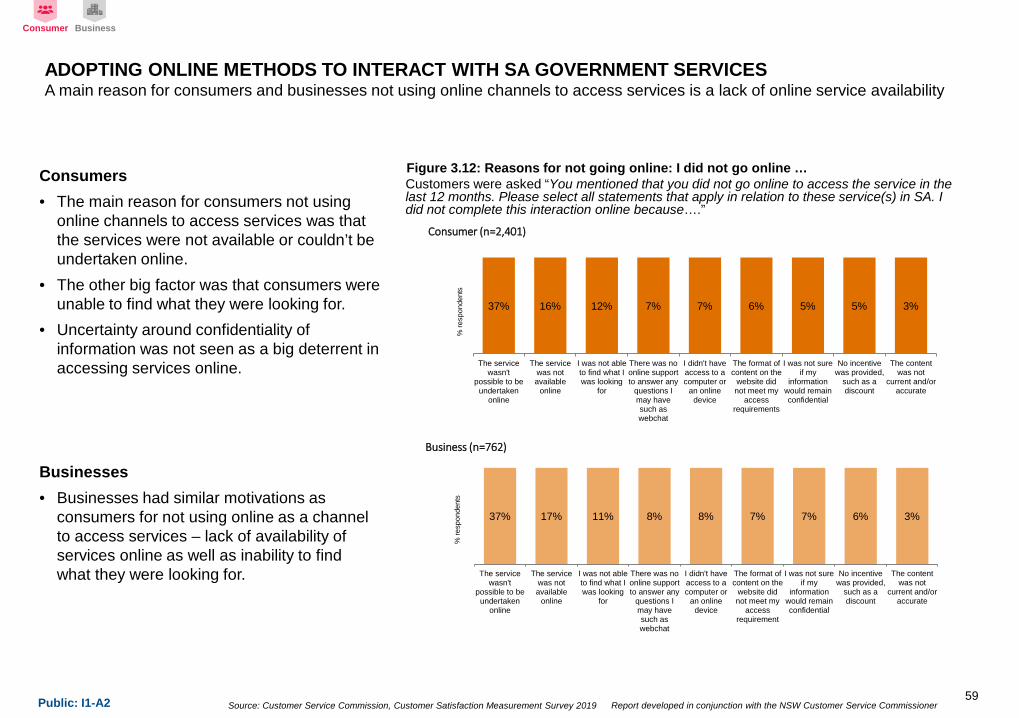
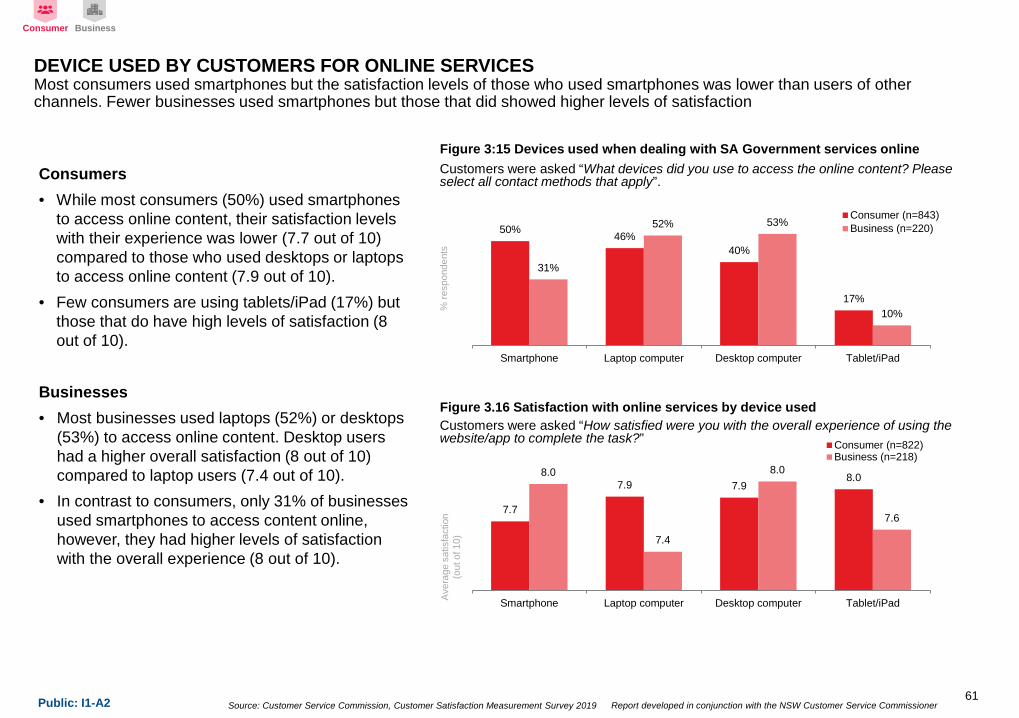
bull While most consumers (50) used smartphones to access online content their satisfaction levels with their experience was lower (77 out of 10) compared to those who used desktops or laptops to access online content (79 out of 10)
bull Few consumers are using tabletsiPad (17) but those that do have high levels of satisfaction (8 out of 10)
Source Customer Service Commission Customer Satisfaction Measurement Survey 2019 Report developed in conjunction with the NSW Customer Service CommissionerPublic I1-A2
51
4135
29
128
4740
29 27
15
6
In person Phone Online Email Mail fax Thirdparties
2018 Business (n=814) 2019 Business (n=762)
c
usto
mer
s w
ho h
ave
had
dire
ct
deal
ings
via
this
cha
nnel
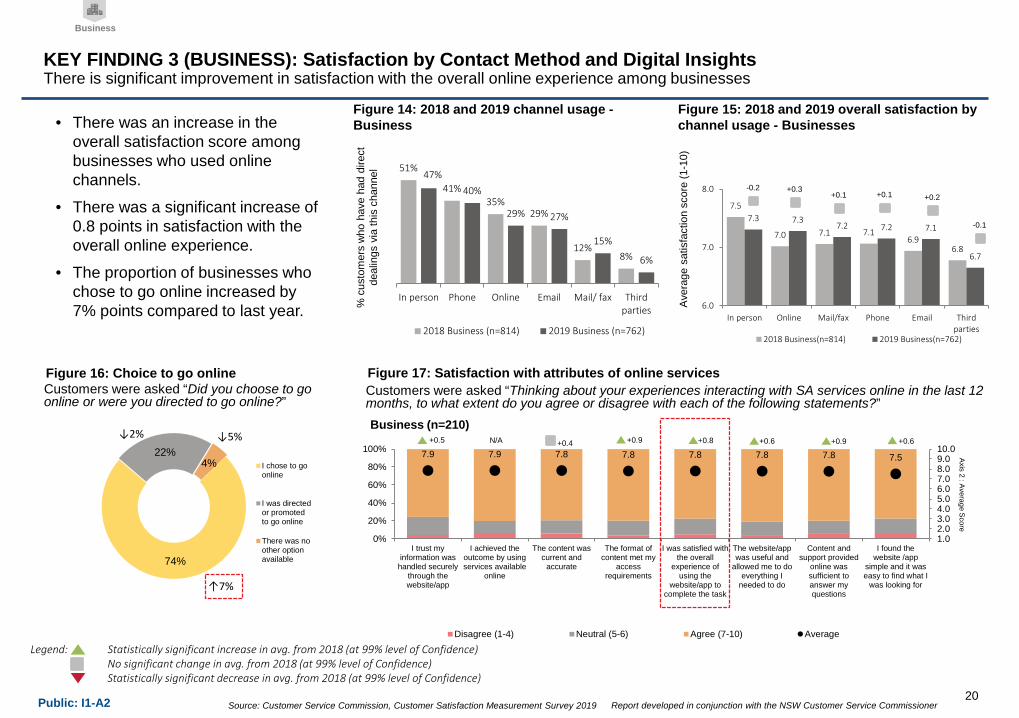
KEY FINDING 3 (BUSINESS) Satisfaction by Contact Method and Digital InsightsThere is significant improvement in satisfaction with the overall online experience among businesses
Figure 14 2018 and 2019 channel usage -Businessbull There was an increase in the
overall satisfaction score among businesses who used online channels
bull There was a significant increase of 08 points in satisfaction with the overall online experience
bull The proportion of businesses who chose to go online increased by 7 points compared to last year
Business
75
70 71 7169
68
73 7372 72 71
67
60
70
80
In person Online Mailfax Phone Email Thirdparties
2018 Business(n=814) 2019 Business(n=762)
Aver
age
satis
fact
ion
scor
e (1
-10)
Figure 15 2018 and 2019 overall satisfaction by channel usage - Businesses
-02+01 +01
+03+02
-01
Legend Statistically significant increase in avg from 2018 (at 99 level of Confidence)No significant change in avg from 2018 (at 99 level of Confidence)Statistically significant decrease in avg from 2018 (at 99 level of Confidence)
Customers were asked ldquoThinking about your experiences interacting with SA services online in the last 12 months to what extent do you agree or disagree with each of the following statementsrdquo
Figure 17 Satisfaction with attributes of online services
79 79 78 78 78 78 78 75
102030405060708090100
0
20
40
60
80
100
I trust myinformation washandled securely
through thewebsiteapp
I achieved theoutcome by usingservices available
online
The content wascurrent and
accurate
The format ofcontent met my
accessrequirements
I was satisfied withthe overall
experience ofusing the
websiteapp tocomplete the task
The websiteappwas useful and
allowed me to doeverything I
needed to do
Content andsupport provided
online wassufficient toanswer myquestions
I found thewebsite app
simple and it waseasy to find what I
was looking for
Disagree (1-4) Neutral (5-6) Agree (7-10) Average
Business (n=210)
Axis 2 Average Score
+05 NA +04 +09 +08 +06 +06+09
74
224 I chose to go
online
I was directedor promotedto go online
There was noother optionavailable
Customers were asked ldquoDid you choose to go online or were you directed to go onlinerdquo
Figure 16 Choice to go online
uarr7
darr2 darr5
20
Source Customer Service Commission Customer Satisfaction Measurement Survey 2019 Report developed in conjunction with the NSW Customer Service CommissionerPublic I1-A2
2922 22 22
2 4
3224 23
16
3 2
In person Email Phone Online Mailfax Third parties
2018 Business(n=795) 2019 Business(n=743)
51
4135
29
128
47
40
29 27
15
6
In person Phone Online Email Mail fax Third parties
2018 Business (n=814) 2019 Business (n=762)
c
usto
mer
s w
ho h
ave
had
dire
ct
deal
ings
via
this
cha
nnel
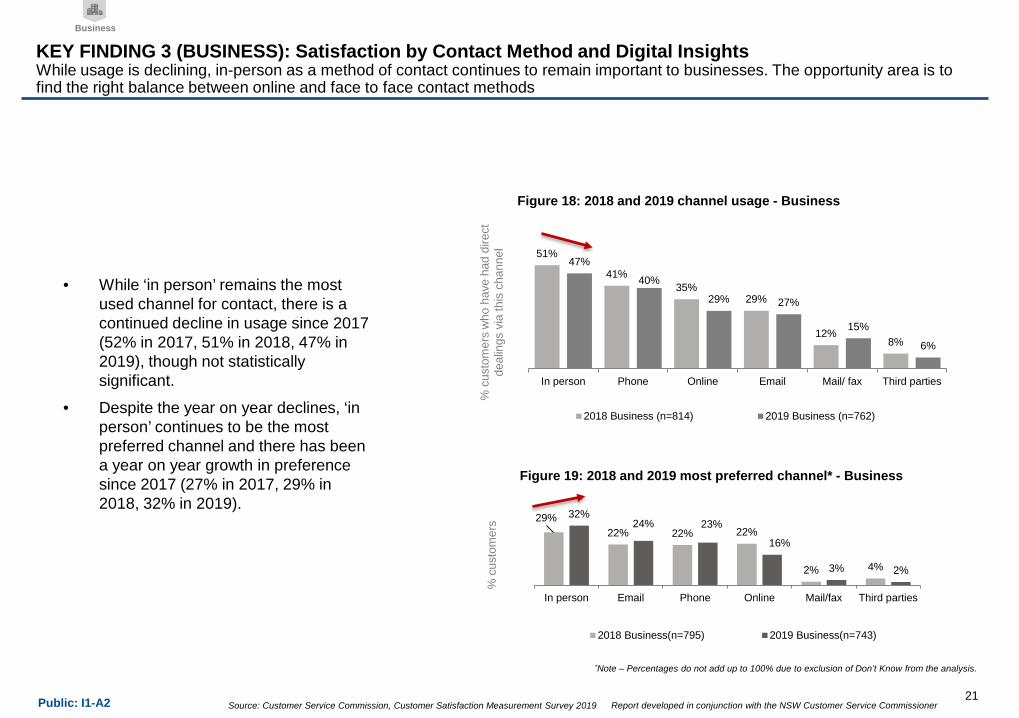
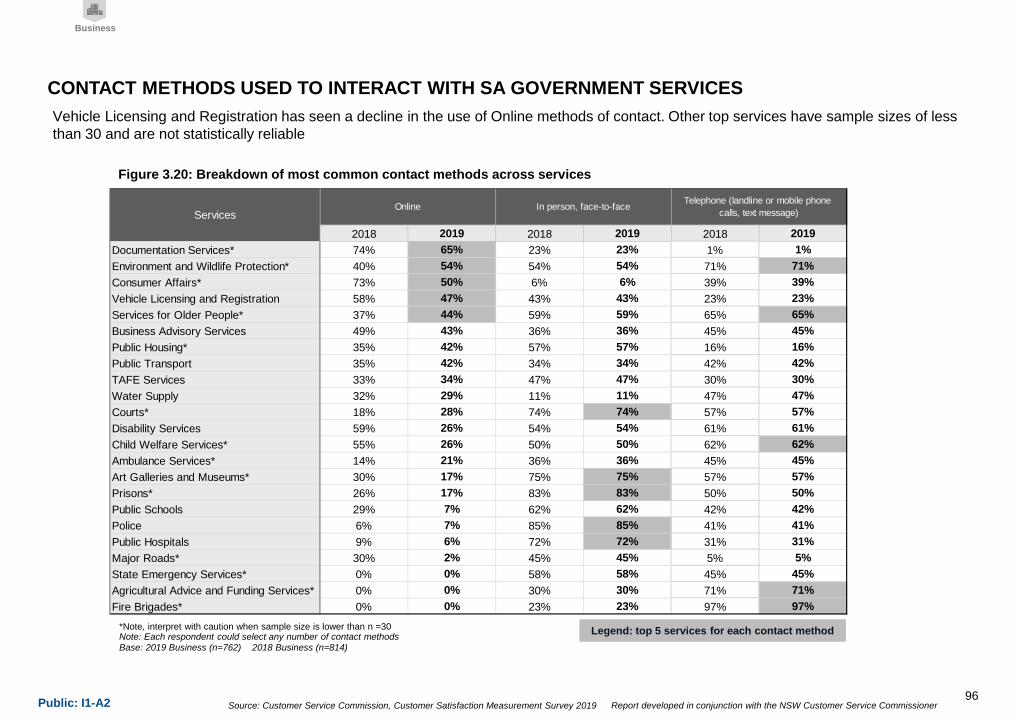
Figure 18 2018 and 2019 channel usage - Business
Figure 19 2018 and 2019 most preferred channel - Business
Note ndash Percentages do not add up to 100 due to exclusion of Donrsquot Know from the analysis
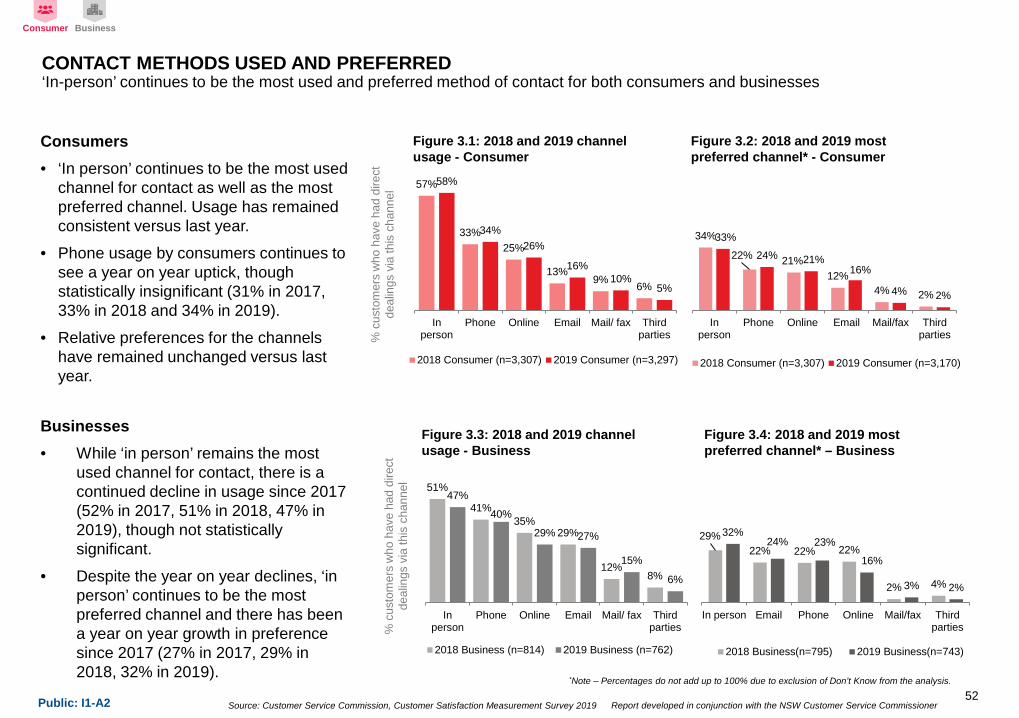
bull While lsquoin personrsquo remains the most used channel for contact there is a continued decline in usage since 2017 (52 in 2017 51 in 2018 47 in 2019) though not statistically significant
bull Despite the year on year declines lsquoin personrsquo continues to be the most preferred channel and there has been a year on year growth in preference since 2017 (27 in 2017 29 in 2018 32 in 2019)
Business
KEY FINDING 3 (BUSINESS) Satisfaction by Contact Method and Digital InsightsWhile usage is declining in-person as a method of contact continues to remain important to businesses The opportunity area is to find the right balance between online and face to face contact methods
21
c
usto
mer
s
Source Customer Service Commission Customer Satisfaction Measurement Survey 2019 Report developed in conjunction with the NSW Customer Service CommissionerPublic I1-A2
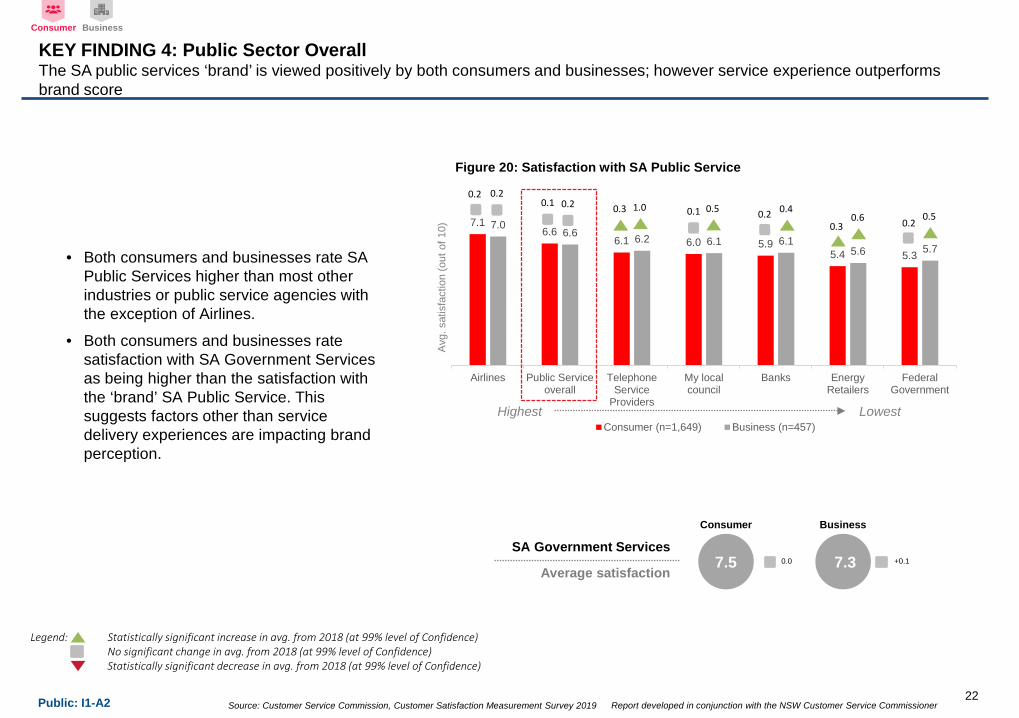
7166
61 60 5954 53
7066 62 61 61
56 57
Airlines Public Serviceoverall
TelephoneService
Providers
My localcouncil
Banks EnergyRetailers
FederalGovernment
Consumer (n=1649) Business (n=457)
02
Avg
sat
isfa
ctio
n (o
ut o
f 10)
LowestHighest
KEY FINDING 4 Public Sector OverallThe SA public services lsquobrandrsquo is viewed positively by both consumers and businesses however service experience outperforms brand score
0102
0203
0302
01 02
Figure 20 Satisfaction with SA Public Service
bull Both consumers and businesses rate SA Public Services higher than most other industries or public service agencies with the exception of Airlines
bull Both consumers and businesses rate satisfaction with SA Government Services as being higher than the satisfaction with the lsquobrandrsquo SA Public Service This suggests factors other than service delivery experiences are impacting brand perception
Consumer Business
10 05 0406 05
Legend Statistically significant increase in avg from 2018 (at 99 level of Confidence)No significant change in avg from 2018 (at 99 level of Confidence)Statistically significant decrease in avg from 2018 (at 99 level of Confidence)
7375 00 +01SA Government Services
Average satisfaction
Consumer Business
22
Source Customer Service Commission Customer Satisfaction Measurement Survey 2019 Report developed in conjunction with the NSW Customer Service CommissionerPublic I1-A2
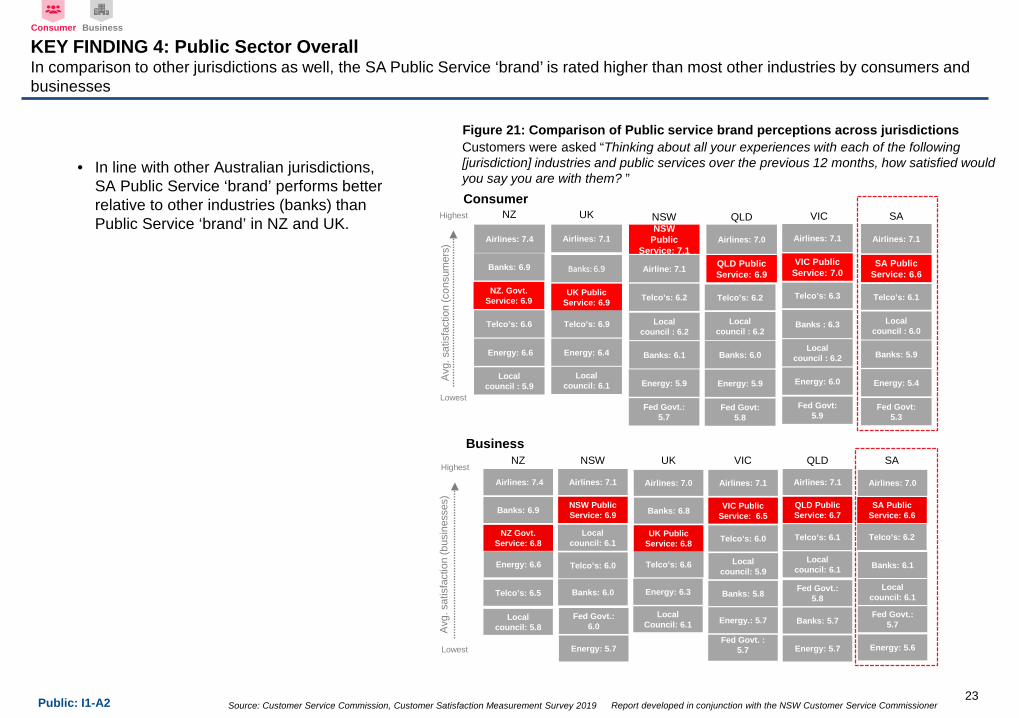
KEY FINDING 4 Public Sector OverallIn comparison to other jurisdictions as well the SA Public Service lsquobrandrsquo is rated higher than most other industries by consumers and businesses
bull In line with other Australian jurisdictions SA Public Service lsquobrandrsquo performs better relative to other industries (banks) than Public Service lsquobrandrsquo in NZ and UK
Consumer Business
Lowest
Highest
Avg
sat
isfa
ctio
n (b
usin
esse
s)NZ
NZ Govt Service 68
Banks 69
Energy 66
Local council 58
Airlines 74
Telcorsquos 65
NSW
Airlines 71
NSW Public Service 69
Banks 60
Energy 57
Telcorsquos 60
Local council 61
Fed Govt 60
QLD
Airlines 71
QLD Public Service 67
Telcorsquos 61
Local council 61
Banks 57
Energy 57
Fed Govt 58
VIC
Airlines 71
VIC Public Service 65
Banks 58
Energy 57
Local council 59
Fed Govt 57
Telcorsquos 60
SA
Airlines 70
Telcorsquos 62
SA Public Service 66
Banks 61
Energy 56
Local council 61
Fed Govt 57
UK
Airlines 70
Telcorsquos 66
Energy 63
UK Public Service 68
Local Council 61
Banks 68
Business
Figure 21 Comparison of Public service brand perceptions across jurisdictionsCustomers were asked ldquoThinking about all your experiences with each of the following [jurisdiction] industries and public services over the previous 12 months how satisfied would you say you are with them rdquoConsumer
NZ
NZ Govt Service 69
Banks 69
Airlines 74
Telcorsquos 66
Energy 66
Local council 59
NSW NSW
Public Service 71
Airline 71
Telcorsquos 62
Energy 59
Local council 62
Banks 61
Fed Govt 57
QLD
Airlines 70
QLD Public Service 69
VIC SA
Airlines 71
Telcorsquos 61
SA Public Service 66
Local council 60
Banks 59
Energy 54
Fed Govt 53
UK
Airlines 71
UK Public Service 69
Banks 69
Energy 64
Telcorsquos 69
Local council 61
Lowest
Highest
Avg
sat
isfa
ctio
n (c
onsu
mer
s)
Airlines 71
Telcorsquos 63
VIC Public Service 70
Banks 63
Local council 62
Energy 60
Fed Govt 59
Telcorsquos 62
Local council 62
Banks 60
Energy 59
Fed Govt 58
23
Source Customer Service Commission Customer Satisfaction Measurement Survey 2019 Report developed in conjunction with the NSW Customer Service CommissionerPublic I1-A2
06
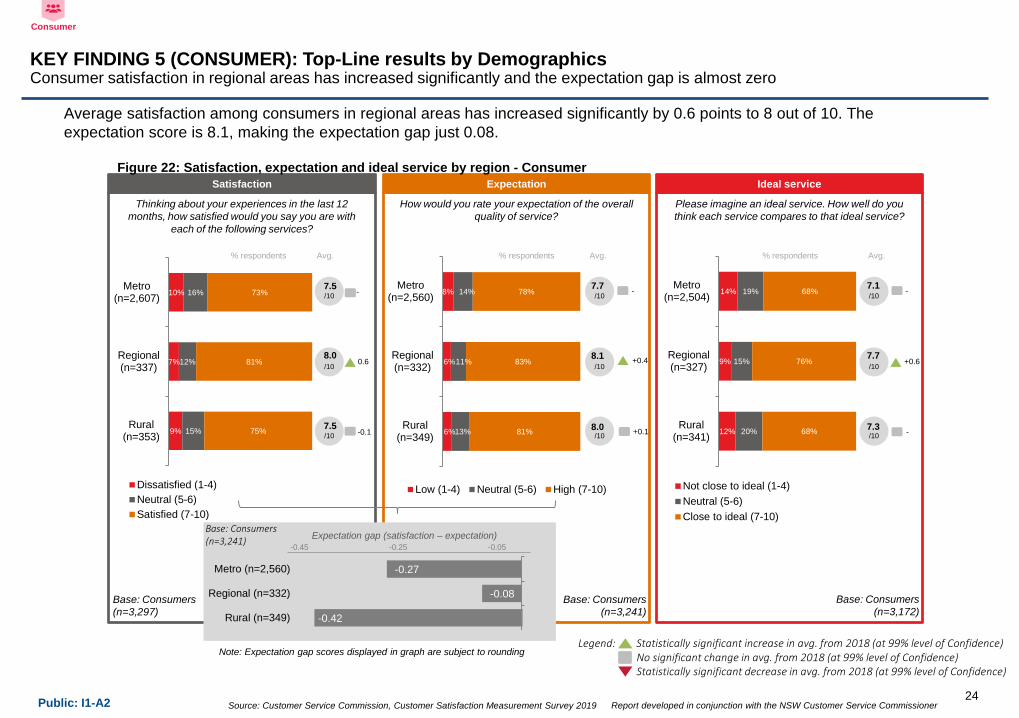
KEY FINDING 5 (CONSUMER) Top-Line results by DemographicsConsumer satisfaction in regional areas has increased significantly and the expectation gap is almost zero
Average satisfaction among consumers in regional areas has increased significantly by 06 points to 8 out of 10 The expectation score is 81 making the expectation gap just 008
How would you rate your expectation of the overall quality of service
Thinking about your experiences in the last 12 months how satisfied would you say you are with
each of the following services
10
10
106
6
8
13
11
14
81
83
78
80
81
77
Rural(n=349)
Regional(n=332)
Metro(n=2560)
Low (1-4) Neutral (5-6) High (7-10)
Satisfaction Expectation Ideal service
Please imagine an ideal service How well do you think each service compares to that ideal service
-042
-008
-027
-045 -025 -005
Rural (n=349)
Regional (n=332)
Metro (n=2560)
Expectation gap (satisfaction ndash expectation)
10
10
10
respondents Avg respondents Avg
10
10
10
respondents Avg
12
9
14
20
15
19
68
76
68
73
77
71
Rural(n=341)
Regional(n=327)
Metro(n=2504)
Not close to ideal (1-4)Neutral (5-6)Close to ideal (7-10)
Note Expectation gap scores displayed in graph are subject to rounding
9
7
10
15
12
16
75
81
73
75
80
75
Rural(n=353)
Regional(n=337)
Metro(n=2607)
Dissatisfied (1-4)Neutral (5-6)Satisfied (7-10)
Figure 22 Satisfaction expectation and ideal service by region - Consumer
Base Consumers(n=3297)
Base Consumers(n=3241)
Base Consumers(n=3172)
Base Consumers(n=3241)
-
-01
-
+04
+01
-
+06
-
Consumer
Legend Statistically significant increase in avg from 2018 (at 99 level of Confidence)No significant change in avg from 2018 (at 99 level of Confidence)Statistically significant decrease in avg from 2018 (at 99 level of Confidence)
24
Source Customer Service Commission Customer Satisfaction Measurement Survey 2019 Report developed in conjunction with the NSW Customer Service CommissionerPublic I1-A2
7765
727779
6975
81
never givenfeedback
I made acomplaint
I made asuggestionfor change
I gave acompliment
Satisfaction Expectation
7668 69 71
7971 74 75
never givenfeedback
I made acomplaint
I made asuggestion for
change
I gave acompliment
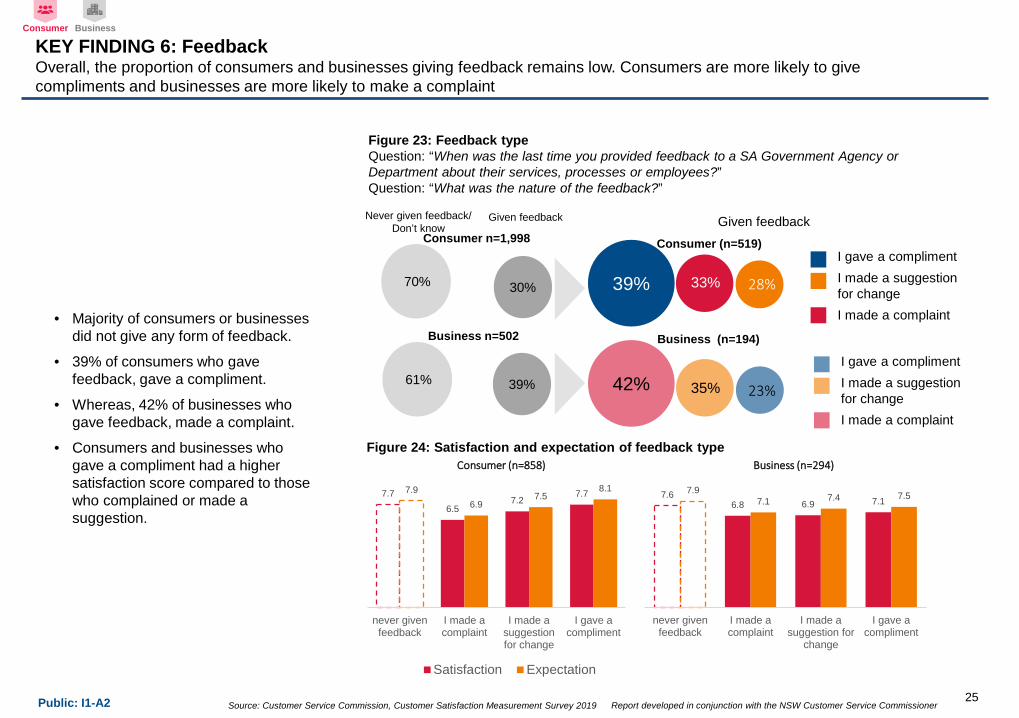
KEY FINDING 6 FeedbackOverall the proportion of consumers and businesses giving feedback remains low Consumers are more likely to give compliments and businesses are more likely to make a complaint
Consumer Business
bull Majority of consumers or businesses did not give any form of feedback
bull 39 of consumers who gave feedback gave a compliment
bull Whereas 42 of businesses who gave feedback made a complaint
bull Consumers and businesses who gave a compliment had a higher satisfaction score compared to those who complained or made a suggestion
Figure 23 Feedback typeQuestion ldquoWhen was the last time you provided feedback to a SA Government Agency or Department about their services processes or employeesrdquoQuestion ldquoWhat was the nature of the feedbackrdquo
Figure 24 Satisfaction and expectation of feedback type Consumer (n=858) Business (n=294)
3070
Consumer n=1998
3961
Business n=502
bull I gave a complimentbull I made a suggestion
for changebull I made a complaint
Business (n=194)
Consumer (n=519)
Given feedbackNever given feedback Donrsquot know
Given feedback
39
42 35
33
23
28
bull I gave a complimentbull I made a suggestion
for changebull I made a complaint
25
Source Customer Service Commission Customer Satisfaction Measurement Survey 2019 Report developed in conjunction with the NSW Customer Service CommissionerPublic I1-A2
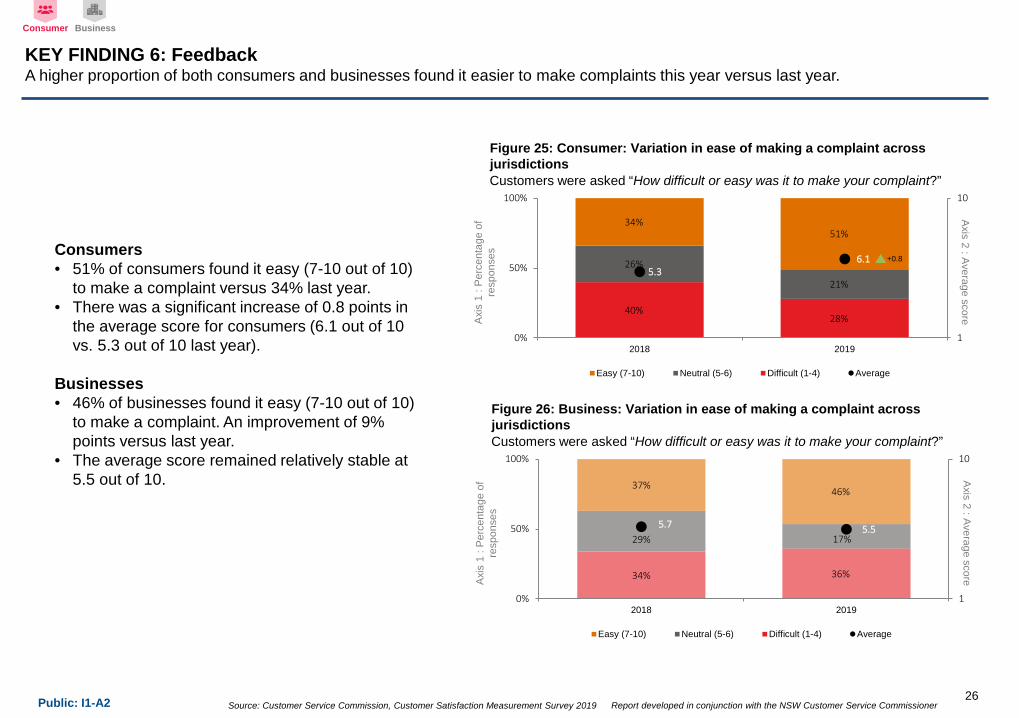
Figure 25 Consumer Variation in ease of making a complaint across jurisdictions
KEY FINDING 6 FeedbackA higher proportion of both consumers and businesses found it easier to make complaints this year versus last year
Consumer Business
26
Customers were asked ldquoHow difficult or easy was it to make your complaintrdquo
40 28
26
21
34 51
5361
1
10
0
50
100
2018 2019
Easy (7-10) Neutral (5-6) Difficult (1-4) Average
Axis 2 Average scoreAxis
1
Perc
enta
ge o
f re
spon
sesConsumers
bull 51 of consumers found it easy (7-10 out of 10) to make a complaint versus 34 last year
bull There was a significant increase of 08 points in the average score for consumers (61 out of 10 vs 53 out of 10 last year)
Businessesbull 46 of businesses found it easy (7-10 out of 10)
to make a complaint An improvement of 9 points versus last year
bull The average score remained relatively stable at 55 out of 10
Figure 26 Business Variation in ease of making a complaint across jurisdictionsCustomers were asked ldquoHow difficult or easy was it to make your complaintrdquo
34 36
29 17
3746
57 55
1
10
0
50
100
2018 2019
Easy (7-10) Neutral (5-6) Difficult (1-4) Average
Axis 2 Average scoreAxis
1
Perc
enta
ge o
f re
spon
ses
+08
Source Customer Service Commission Customer Satisfaction Measurement Survey 2019 Report developed in conjunction with the NSW Customer Service CommissionerPublic I1-A2
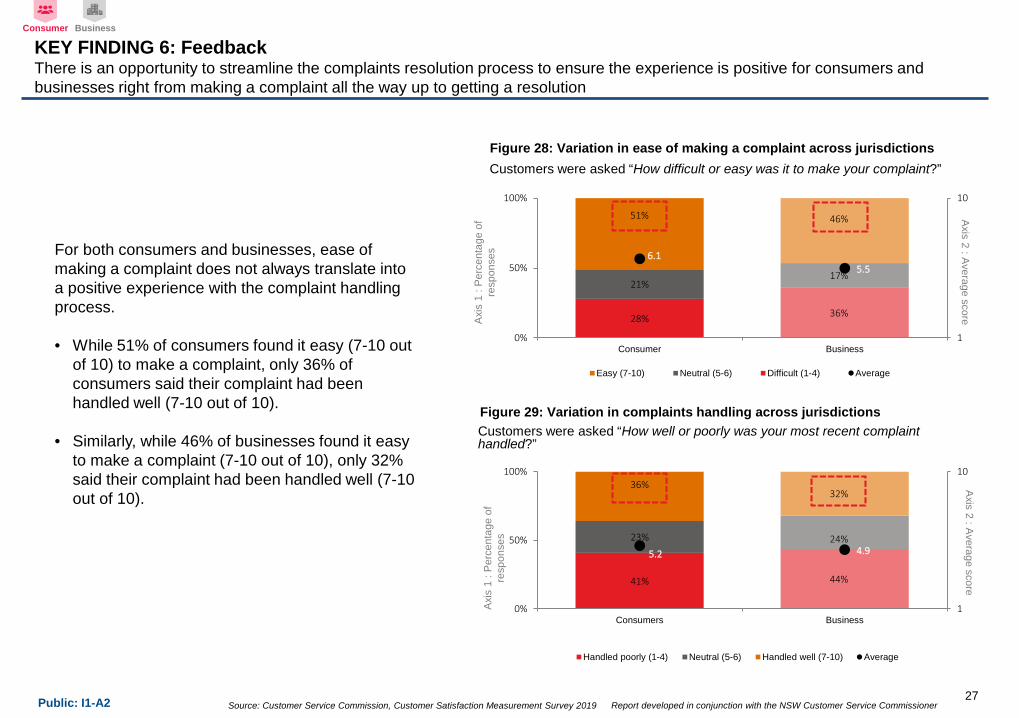
KEY FINDING 6 FeedbackThere is an opportunity to streamline the complaints resolution process to ensure the experience is positive for consumers and businesses right from making a complaint all the way up to getting a resolution
Consumer Business
27
Customers were asked ldquoHow difficult or easy was it to make your complaintrdquoFigure 28 Variation in ease of making a complaint across jurisdictions
28 36
2117
51 46
6155
1
10
0
50
100
Consumer Business
Easy (7-10) Neutral (5-6) Difficult (1-4) Average
Axis 2 Average scoreAxis
1
Perc
enta
ge o
f re
spon
ses
Customers were asked ldquoHow well or poorly was your most recent complaint handledrdquo
Figure 29 Variation in complaints handling across jurisdictions
41 44
23 24
3632
52 49
1
10
0
50
100
Consumers Business
Handled poorly (1-4) Neutral (5-6) Handled well (7-10) Average
Axis
1
Perc
enta
ge o
f re
spon
ses
Axis 2 Average score
For both consumers and businesses ease of making a complaint does not always translate into a positive experience with the complaint handling process
bull While 51 of consumers found it easy (7-10 out of 10) to make a complaint only 36 of consumers said their complaint had been handled well (7-10 out of 10)
bull Similarly while 46 of businesses found it easy to make a complaint (7-10 out of 10) only 32 said their complaint had been handled well (7-10 out of 10)
Source Customer Service Commission Customer Satisfaction Measurement Survey 2019 Report developed in conjunction with the NSW Customer Service CommissionerPublic I1-A2
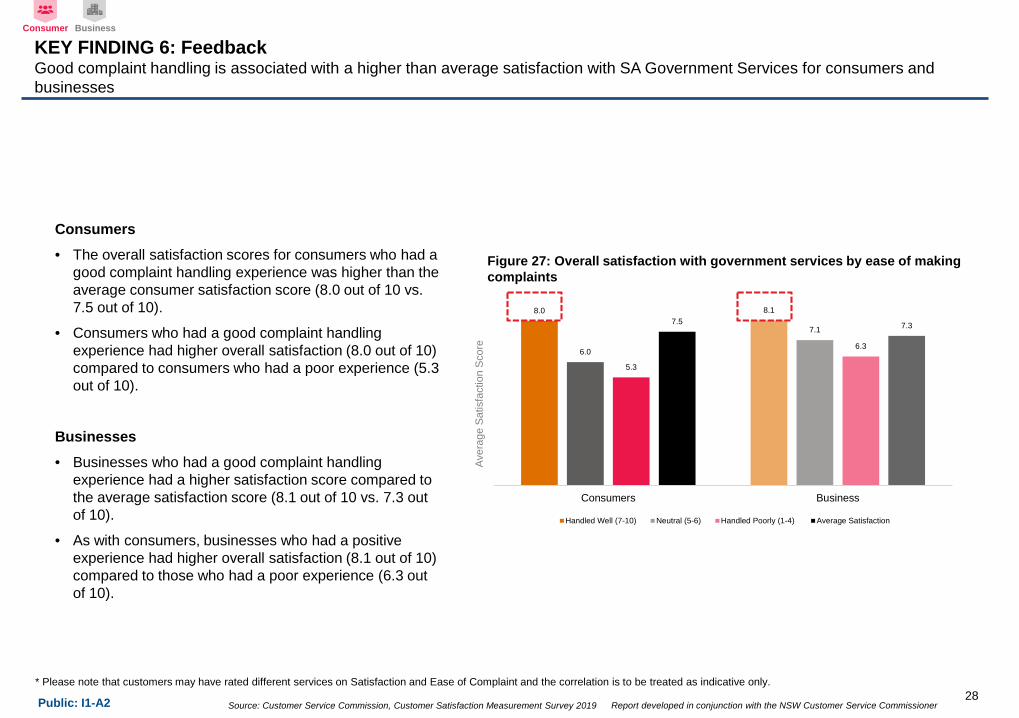
Consumersbull The overall satisfaction scores for consumers who had a
good complaint handling experience was higher than the average consumer satisfaction score (80 out of 10 vs 75 out of 10)
bull Consumers who had a good complaint handling experience had higher overall satisfaction (80 out of 10) compared to consumers who had a poor experience (53 out of 10)
Businessesbull Businesses who had a good complaint handling
experience had a higher satisfaction score compared to the average satisfaction score (81 out of 10 vs 73 out of 10)
bull As with consumers businesses who had a positive experience had higher overall satisfaction (81 out of 10) compared to those who had a poor experience (63 out of 10)
Consumer Business
28
80 81
60
71
53
63
75 73
Consumers Business
Handled Well (7-10) Neutral (5-6) Handled Poorly (1-4) Average Satisfaction
Figure 27 Overall satisfaction with government services by ease of making complaints
Aver
age
Satis
fact
ion
Scor
e
KEY FINDING 6 FeedbackGood complaint handling is associated with a higher than average satisfaction with SA Government Services for consumers and businesses
Please note that customers may have rated different services on Satisfaction and Ease of Complaint and the correlation is to be treated as indicative only
Public ndash I1-A2
SOUTH AUSTRALIAN CUSTOMER SATISFACTION MEASUREMENT SURVEY 2019
iii DETAILED FINDINGS
Public ndash I1-A2
SOUTH AUSTRALIAN CUSTOMER SATISFACTION MEASUREMENT SURVEY 2019
1 OVERALL MEASURES TOPLINE ANALYSIS
Source Customer Service Commission Customer Satisfaction Measurement Survey 2019 Report developed in conjunction with the NSW Customer Service CommissionerPublic I1-A2
Outcome Measures Avg responses
ExpectationHow would you rate your expectation of the overall quality of service
SatisfactionThinking about your experiences in the last 12 months how satisfied would you say you are with each of the following services in SA
Ideal servicehellipPlease imagine an ideal service How well do you think each service in SA compares to that ideal service
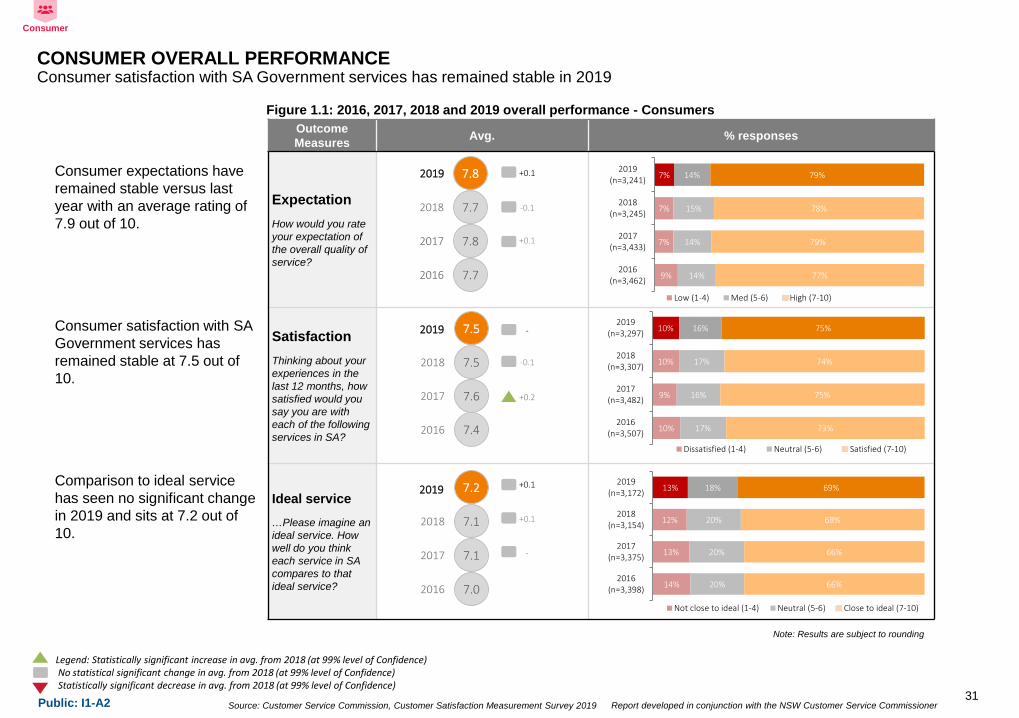
CONSUMER OVERALL PERFORMANCEConsumer satisfaction with SA Government services has remained stable in 2019
Note Results are subject to rounding
Consumer expectations have remained stable versus last year with an average rating of 79 out of 10
Consumer satisfaction with SA Government services has remained stable at 75 out of 10
Comparison to ideal service has seen no significant change in 2019 and sits at 72 out of 10
Figure 11 2016 2017 2018 and 2019 overall performance - Consumers
Consumer
77
78
77
78
2016
2017
2018
2019
74
76
75
75
2016
2017
2018
2019
70
71
71
72
2016
2017
2018
2019
9
7
7
7
14
14
15
14
77
79
78
79
2016(n=3462)
2017(n=3433)
2018(n=3245)
2019(n=3241)
Low (1-4) Med (5-6) High (7-10)
10
9
10
10
17
16
17
16
73
75
74
75
2016(n=3507)
2017(n=3482)
2018(n=3307)
2019(n=3297)
Dissatisfied (1-4) Neutral (5-6) Satisfied (7-10)
14
13
12
13
20
20
20
18
66
66
68
69
2016(n=3398)
2017(n=3375)
2018(n=3154)
2019(n=3172)
Not close to ideal (1-4) Neutral (5-6) Close to ideal (7-10)
-01
-01
+01
+01
-
+02
+01
-
+01
Legend Statistically significant increase in avg from 2018 (at 99 level of Confidence)No statistical significant change in avg from 2018 (at 99 level of Confidence)Statistically significant decrease in avg from 2018 (at 99 level of Confidence)
31
Source Customer Service Commission Customer Satisfaction Measurement Survey 2019 Report developed in conjunction with the NSW Customer Service CommissionerPublic I1-A2
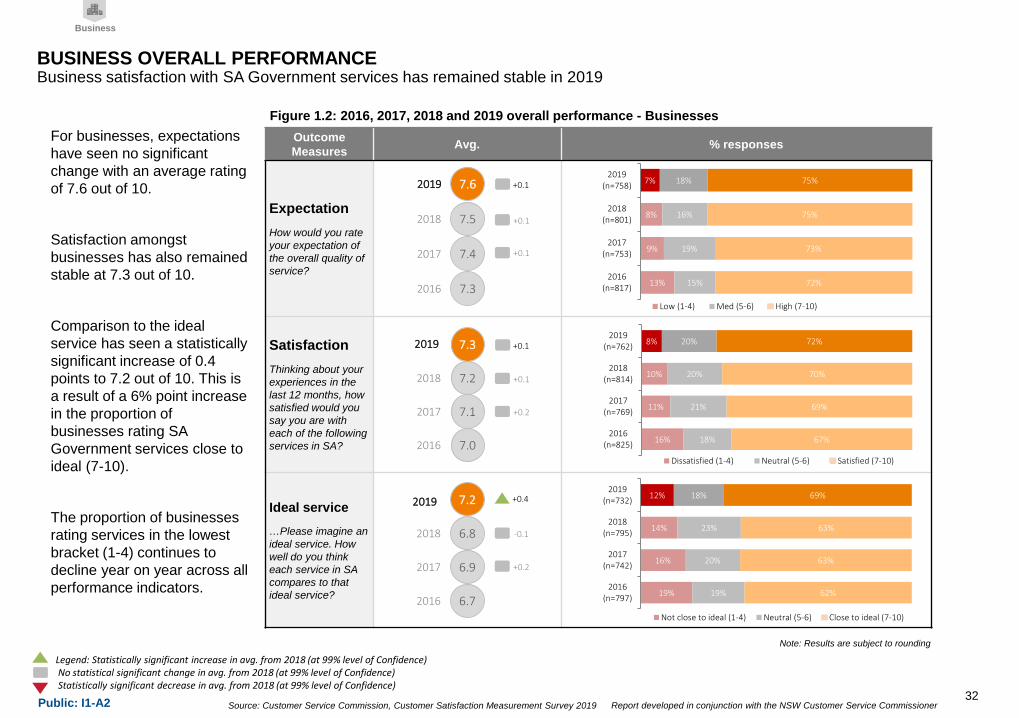
For businesses expectations have seen no significant change with an average rating of 76 out of 10
Satisfaction amongst businesses has also remained stable at 73 out of 10
Comparison to the ideal service has seen a statistically significant increase of 04 points to 72 out of 10 This is a result of a 6 point increase in the proportion of businesses rating SA Government services close to ideal (7-10)
The proportion of businesses rating services in the lowest bracket (1-4) continues to decline year on year across all performance indicators
Figure 12 2016 2017 2018 and 2019 overall performance - Businesses
Note Results are subject to rounding
Business
Outcome Measures Avg responses
ExpectationHow would you rate your expectation of the overall quality of service
SatisfactionThinking about your experiences in the last 12 months how satisfied would you say you are with each of the following services in SA
Ideal servicehellipPlease imagine an ideal service How well do you think each service in SA compares to that ideal service
13
9
8
7
15
19
16
18
72
73
75
75
2016(n=817)
2017(n=753)
2018(n=801)
2019(n=758)
Low (1-4) Med (5-6) High (7-10)
16
11
10
8
18
21
20
20
67
69
70
72
2016(n=825)
2017(n=769)
2018(n=814)
2019(n=762)
Dissatisfied (1-4) Neutral (5-6) Satisfied (7-10)
19
16
14
12
19
20
23
18
62
63
63
69
2016(n=797)
2017(n=742)
2018(n=795)
2019(n=732)
Not close to ideal (1-4) Neutral (5-6) Close to ideal (7-10)
73
74
75
76
2016
2017
2018
2019
+01
+01
+01
70
71
72
73
2016
2017
2018
2019
+02
+01
+01
67
69
68
72
2016
2017
2018
2019
+02
-01
+04
Legend Statistically significant increase in avg from 2018 (at 99 level of Confidence)No statistical significant change in avg from 2018 (at 99 level of Confidence)Statistically significant decrease in avg from 2018 (at 99 level of Confidence)
BUSINESS OVERALL PERFORMANCEBusiness satisfaction with SA Government services has remained stable in 2019
32
Source Customer Service Commission Customer Satisfaction Measurement Survey 2019 Report developed in conjunction with the NSW Customer Service CommissionerPublic I1-A2
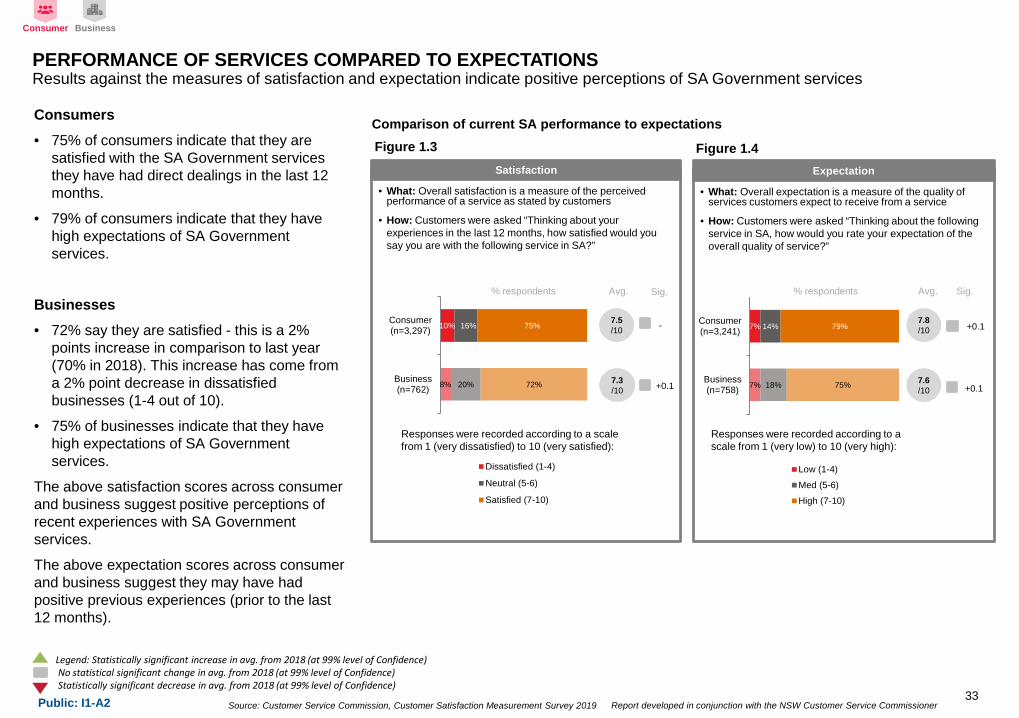
Consumersbull 75 of consumers indicate that they are
satisfied with the SA Government services they have had direct dealings in the last 12 months
bull 79 of consumers indicate that they have high expectations of SA Government services
Businessesbull 72 say they are satisfied - this is a 2
points increase in comparison to last year (70 in 2018) This increase has come from a 2 point decrease in dissatisfied businesses (1-4 out of 10)
bull 75 of businesses indicate that they have high expectations of SA Government services
The above satisfaction scores across consumer and business suggest positive perceptions of recent experiences with SA Government services
The above expectation scores across consumer and business suggest they may have had positive previous experiences (prior to the last 12 months)
bull What Overall expectation is a measure of the quality of services customers expect to receive from a service
bull How Customers were asked ldquoThinking about the following service in SA how would you rate your expectation of the overall quality of servicerdquo
Expectation
78 10
76 10
respondents Avg
7
7
18
14
75
79
Business(n=758)
Consumer(n=3241)
Low (1-4)Med (5-6)High (7-10)
Responses were recorded according to a scale from 1 (very low) to 10 (very high)
+01
+01
bull What Overall satisfaction is a measure of the perceived performance of a service as stated by customers
bull How Customers were asked ldquoThinking about your experiences in the last 12 months how satisfied would you say you are with the following service in SArdquo
Satisfaction
respondents Avg
Responses were recorded according to a scale from 1 (very dissatisfied) to 10 (very satisfied)
8
10
20
16
72
75
Business(n=762)
Consumer(n=3297)
Dissatisfied (1-4)
Neutral (5-6)
Satisfied (7-10)
75 10
73 10
-
+01
Sig Sig
Figure 13 Figure 14
Comparison of current SA performance to expectations
Consumer Business
Legend Statistically significant increase in avg from 2018 (at 99 level of Confidence)No statistical significant change in avg from 2018 (at 99 level of Confidence)Statistically significant decrease in avg from 2018 (at 99 level of Confidence)
PERFORMANCE OF SERVICES COMPARED TO EXPECTATIONSResults against the measures of satisfaction and expectation indicate positive perceptions of SA Government services
33
Source Customer Service Commission Customer Satisfaction Measurement Survey 2019 Report developed in conjunction with the NSW Customer Service CommissionerPublic I1-A2
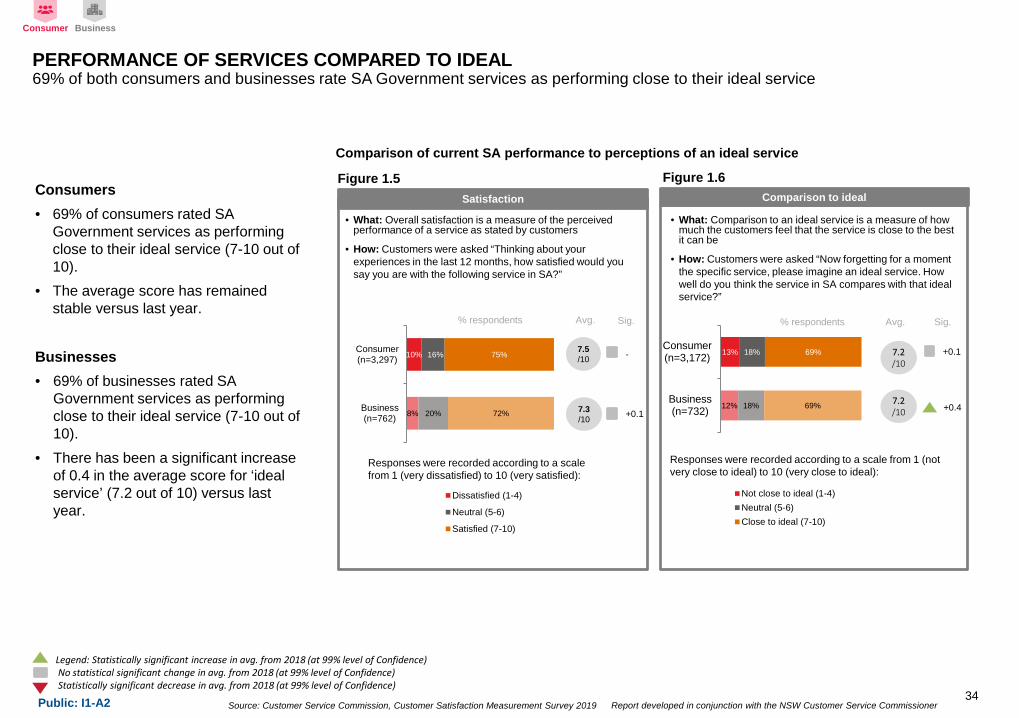
Consumersbull 69 of consumers rated SA
Government services as performing close to their ideal service (7-10 out of 10)
bull The average score has remained stable versus last year
Businessesbull 69 of businesses rated SA
Government services as performing close to their ideal service (7-10 out of 10)
bull There has been a significant increase of 04 in the average score for lsquoideal servicersquo (72 out of 10) versus last year
bull What Comparison to an ideal service is a measure of how much the customers feel that the service is close to the best it can be
bull How Customers were asked ldquoNow forgetting for a moment the specific service please imagine an ideal service How well do you think the service in SA compares with that ideal servicerdquo
12
13
18
18
69
69
Business(n=732)
Consumer(n=3172)
Not close to ideal (1-4)Neutral (5-6)Close to ideal (7-10)
Comparison to ideal
7210
7210
respondents Avg
Responses were recorded according to a scale from 1 (not very close to ideal) to 10 (very close to ideal)
Sig
+01
+04
Comparison of current SA performance to perceptions of an ideal service
Figure 15 Figure 16
bull What Overall satisfaction is a measure of the perceived performance of a service as stated by customers
bull How Customers were asked ldquoThinking about your experiences in the last 12 months how satisfied would you say you are with the following service in SArdquo
Satisfaction
respondents Avg
Responses were recorded according to a scale from 1 (very dissatisfied) to 10 (very satisfied)
8
10
20
16
72
75
Business(n=762)
Consumer(n=3297)
Dissatisfied (1-4)
Neutral (5-6)
Satisfied (7-10)
75 10
73 10
-
+01
Sig
Consumer Business
Legend Statistically significant increase in avg from 2018 (at 99 level of Confidence)No statistical significant change in avg from 2018 (at 99 level of Confidence)Statistically significant decrease in avg from 2018 (at 99 level of Confidence)
PERFORMANCE OF SERVICES COMPARED TO IDEAL69 of both consumers and businesses rate SA Government services as performing close to their ideal service
34
Source Customer Service Commission Customer Satisfaction Measurement Survey 2019 Report developed in conjunction with the NSW Customer Service CommissionerPublic I1-A2
Note Average satisfaction expectation comparison to ideal service and expectation gap scores are subject to rounding
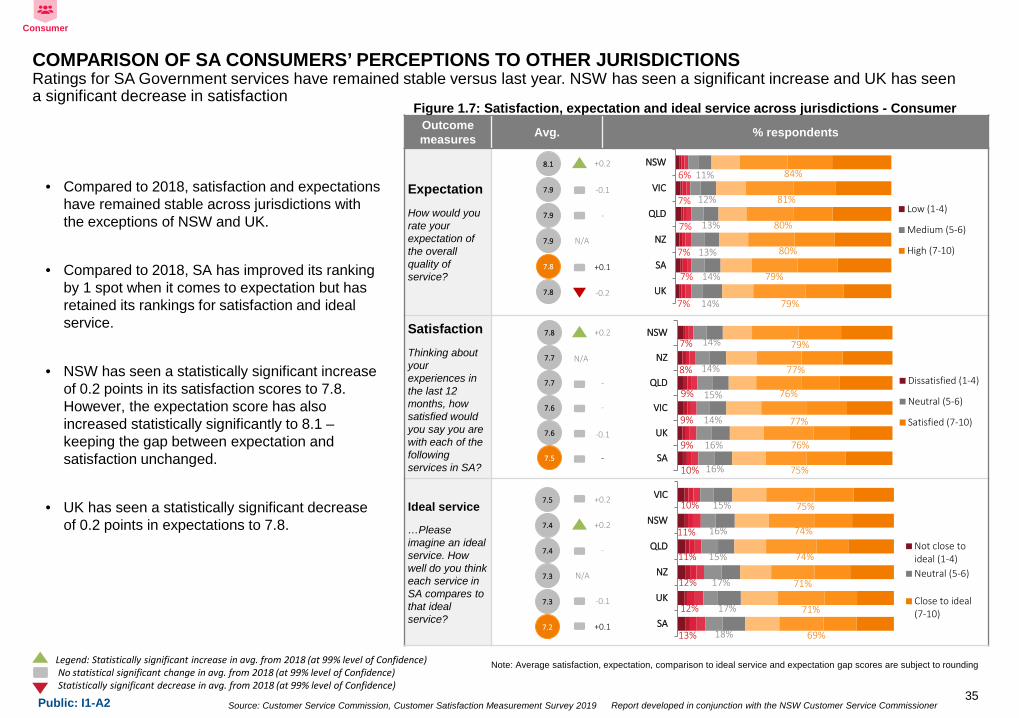
bull Compared to 2018 satisfaction and expectations have remained stable across jurisdictions with the exceptions of NSW and UK
bull Compared to 2018 SA has improved its ranking by 1 spot when it comes to expectation but has retained its rankings for satisfaction and ideal service
bull NSW has seen a statistically significant increase of 02 points in its satisfaction scores to 78 However the expectation score has also increased statistically significantly to 81 ndashkeeping the gap between expectation and satisfaction unchanged
bull UK has seen a statistically significant decrease of 02 points in expectations to 78
Figure 17 Satisfaction expectation and ideal service across jurisdictions - Consumer
Consumer
Outcomemeasures Avg respondents
ExpectationHow would you rate your expectation of the overall quality of service
SatisfactionThinking about your experiences in the last 12 months how satisfied would you say you are with each of the following services in SA
Ideal service
hellipPlease imagine an idealservice How well do you think each service in SA compares to that ideal service
7
7
7
7
7
6
14
14
13
13
12
11
79
79
80
80
81
84
UK
SA
NZ
QLD
VIC
NSW
Low (1-4)
Medium (5-6)
High (7-10)
78
79
79
79
81
78
10
9
9
9
8
7
16
16
14
15
14
14
75
76
77
76
77
79
SA
UK
VIC
QLD
NZ
NSW
Dissatisfied (1-4)
Neutral (5-6)
Satisfied (7-10)76
76
77
77
78
75
73
73
74
74
75
72
+02
+02
+02
-01
-
+02
-
-
-
+01
-
+01
NA
-01
-01
-02
NA
NA
13
12
12
11
11
10
18
17
17
15
16
15
69
71
71
74
74
75
SA
UK
NZ
QLD
NSW
VIC
Not close toideal (1-4)Neutral (5-6)
Close to ideal(7-10)
Legend Statistically significant increase in avg from 2018 (at 99 level of Confidence)No statistical significant change in avg from 2018 (at 99 level of Confidence)Statistically significant decrease in avg from 2018 (at 99 level of Confidence)
COMPARISON OF SA CONSUMERSrsquo PERCEPTIONS TO OTHER JURISDICTIONSRatings for SA Government services have remained stable versus last year NSW has seen a significant increase and UK has seena significant decrease in satisfaction
35
Source Customer Service Commission Customer Satisfaction Measurement Survey 2019 Report developed in conjunction with the NSW Customer Service CommissionerPublic I1-A2
Note Average satisfaction expectation comparison to ideal service and expectation gap scores are subject to rounding
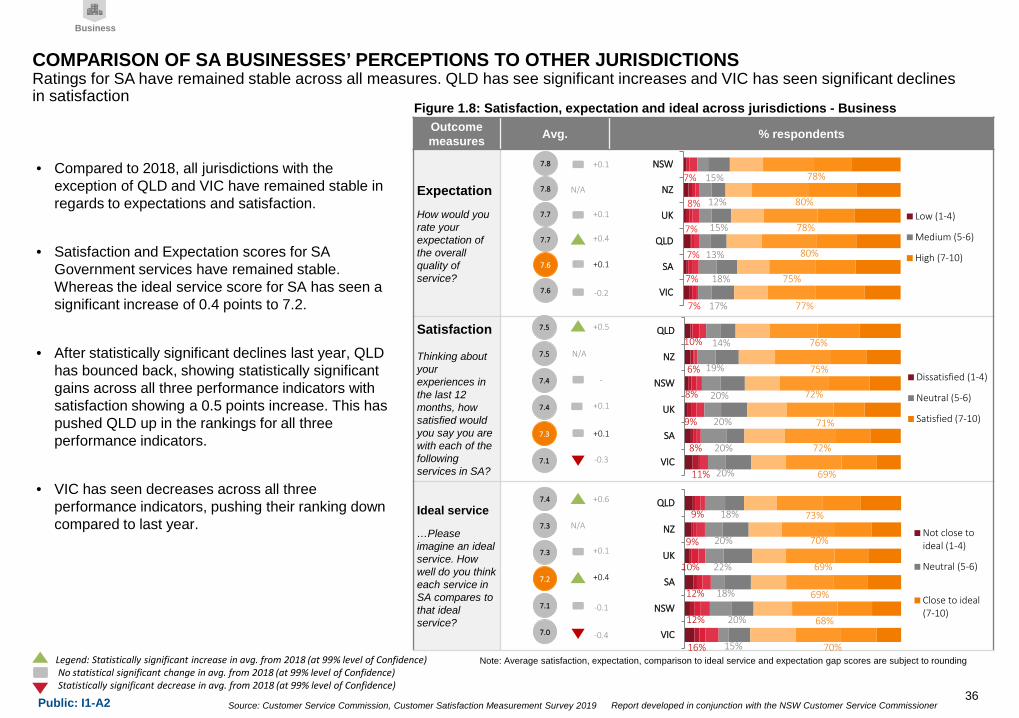
bull Compared to 2018 all jurisdictions with the exception of QLD and VIC have remained stable in regards to expectations and satisfaction
bull Satisfaction and Expectation scores for SA Government services have remained stable Whereas the ideal service score for SA has seen a significant increase of 04 points to 72
bull After statistically significant declines last year QLD has bounced back showing statistically significant gains across all three performance indicators with satisfaction showing a 05 points increase This has pushed QLD up in the rankings for all three performance indicators
bull VIC has seen decreases across all three performance indicators pushing their ranking down compared to last year
Figure 18 Satisfaction expectation and ideal across jurisdictions - Business
Business
Legend Statistically significant increase in avg from 2018 (at 99 level of Confidence)No statistical significant change in avg from 2018 (at 99 level of Confidence)Statistically significant decrease in avg from 2018 (at 99 level of Confidence)
Outcomemeasures Avg respondents
ExpectationHow would you rate your expectation of the overall quality of service
Satisfaction
Thinking about your experiences in the last 12 months how satisfied would you say you are with each of the following services in SA
Ideal service
hellipPlease imagine an idealservice How well do you think each service in SA compares to that ideal service
7
7
7
7
8
7
17
18
13
15
12
15
77
75
80
78
80
78
VIC
SA
QLD
UK
NZ
NSW
Low (1-4)
Medium (5-6)
High (7-10)
76
77
77
78
78
76
11
8
9
8
6
10
20
20
20
20
19
14
69
72
71
72
75
76
VIC
SA
UK
NSW
NZ
QLD
Dissatisfied (1-4)
Neutral (5-6)
Satisfied (7-10)
71
74
74
75
75
73
16
12
12
10
9
9
15
20
18
22
20
18
70
68
69
69
70
73
VIC
NSW
SA
UK
NZ
QLD
Not close toideal (1-4)
Neutral (5-6)
Close to ideal(7-10)
70
71
73
73
74
72
+06
+01
+01
+01
NA
-01
-
+01
NA
-04
+04
+05
-02
+04
+01
-03
+01
NA
COMPARISON OF SA BUSINESSESrsquo PERCEPTIONS TO OTHER JURISDICTIONSRatings for SA have remained stable across all measures QLD has see significant increases and VIC has seen significant declinesin satisfaction
36
Source Customer Service Commission Customer Satisfaction Measurement Survey 2019 Report developed in conjunction with the NSW Customer Service CommissionerPublic I1-A2
-037
-023
-028
-021
-032
-030
-027
-026
-022
-019
-017
-04 -02 00
VIC
SA
NSW
QLD
UK
NZ
2019 2018
Figure 110 2018 and 2019 expectation gap -Businesses
Note ndash Percentages do not add up to 100 due to exclusion of Donrsquot Know from the analysis
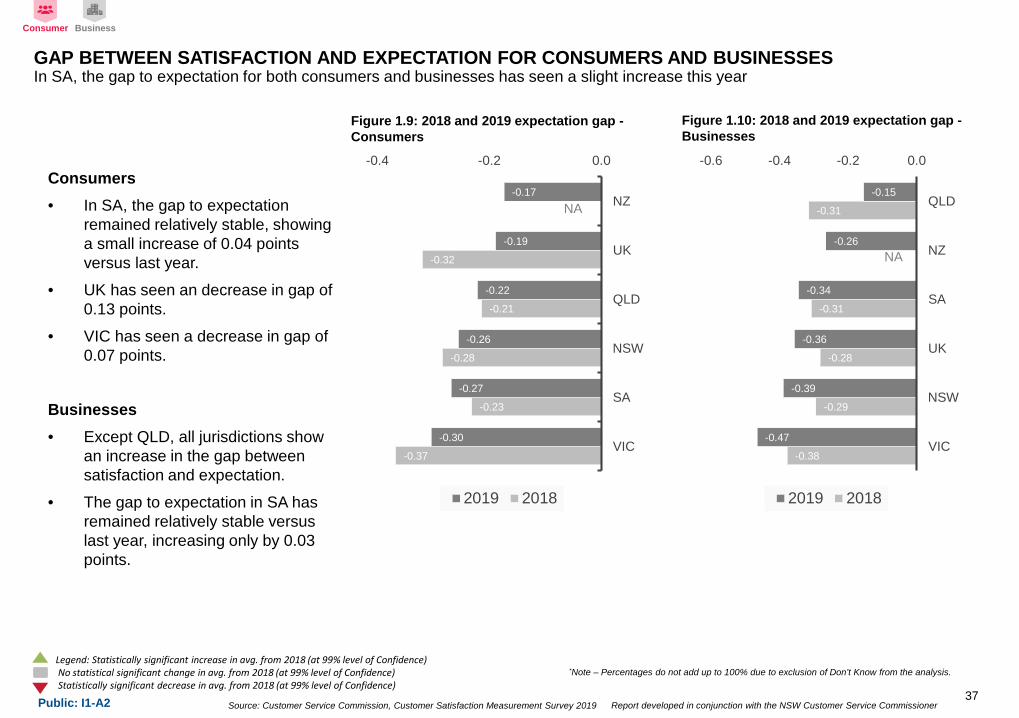
Consumersbull In SA the gap to expectation
remained relatively stable showing a small increase of 004 points versus last year
bull UK has seen an decrease in gap of 013 points
bull VIC has seen a decrease in gap of 007 points
Businessesbull Except QLD all jurisdictions show
an increase in the gap between satisfaction and expectation
bull The gap to expectation in SA has remained relatively stable versus last year increasing only by 003 points
Figure 19 2018 and 2019 expectation gap -Consumers
Consumer Business
-038
-029
-028
-031
-031
-047
-039
-036
-034
-026
-015
-06 -04 -02 00
VIC
NSW
UK
SA
NZ
QLD
2019 2018
NA
NA
Legend Statistically significant increase in avg from 2018 (at 99 level of Confidence)No statistical significant change in avg from 2018 (at 99 level of Confidence)Statistically significant decrease in avg from 2018 (at 99 level of Confidence)
GAP BETWEEN SATISFACTION AND EXPECTATION FOR CONSUMERS AND BUSINESSESIn SA the gap to expectation for both consumers and businesses has seen a slight increase this year
37
Source Customer Service Commission Customer Satisfaction Measurement Survey 2019 Report developed in conjunction with the NSW Customer Service CommissionerPublic I1-A2
-1 -05 0 05Avg
gap
bet
wee
n sa
tisfa
ctio
n an
d ex
pect
atio
n
-15 -1 -05 0 05 1
00
-13
-07
-07
Avg
gap
bet
wee
n sa
tisfa
ctio
n an
d ex
pect
atio
n01
-15
-13
-05
Services with the highest expectation gap
Services with the lowest expectation gap
Note Very small number of responses (nlt=30)All service comparisons will be shown in greater detail in the detailed chapters of this report For further service comparisons see Chapter 9
State Emergency Services (n=45)
Ambulance Services (n=24)
Figure 111 Satisfaction expectation gap - Consumer
Figure 112 Satisfaction expectation gap - Business
Child Welfare Services(n=51)
Courts(n=89)
Prisons(n=21)
Disability Services(n=33)Agricultural
Advice and Funding Services(n=10)
Public Housing (n=16)
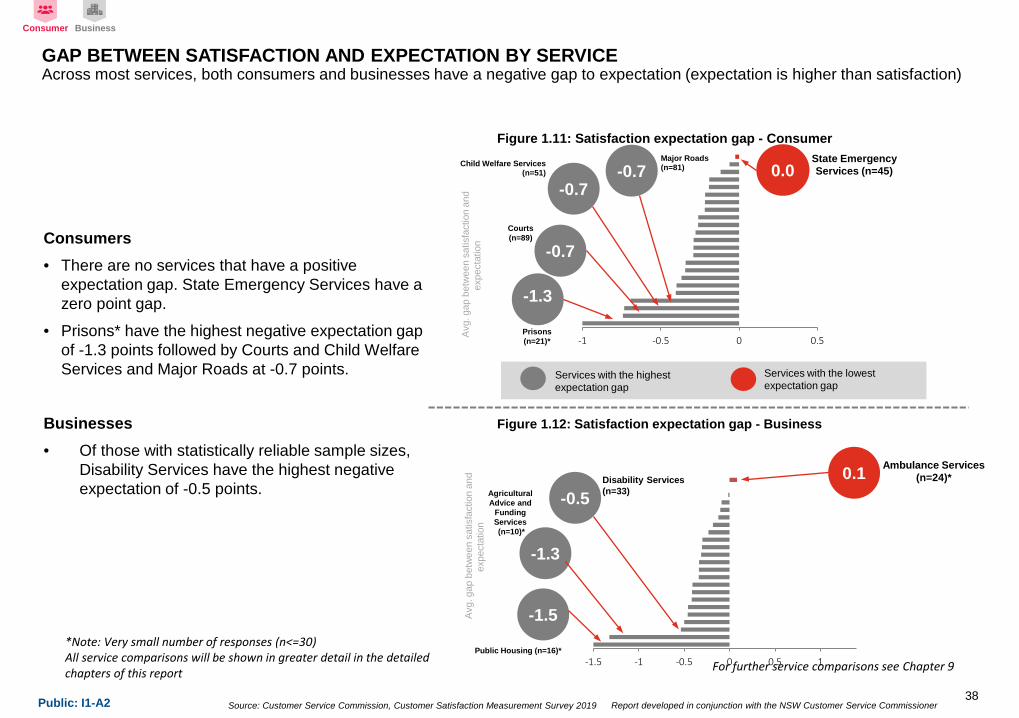
Consumersbull There are no services that have a positive
expectation gap State Emergency Services have a zero point gap
bull Prisons have the highest negative expectation gap of -13 points followed by Courts and Child Welfare Services and Major Roads at -07 points
Businessesbull Of those with statistically reliable sample sizes
Disability Services have the highest negative expectation of -05 points
Consumer Business
GAP BETWEEN SATISFACTION AND EXPECTATION BY SERVICEAcross most services both consumers and businesses have a negative gap to expectation (expectation is higher than satisfaction)
-07Major Roads(n=81)
38
Source Customer Service Commission Customer Satisfaction Measurement Survey 2019 Report developed in conjunction with the NSW Customer Service CommissionerPublic I1-A2
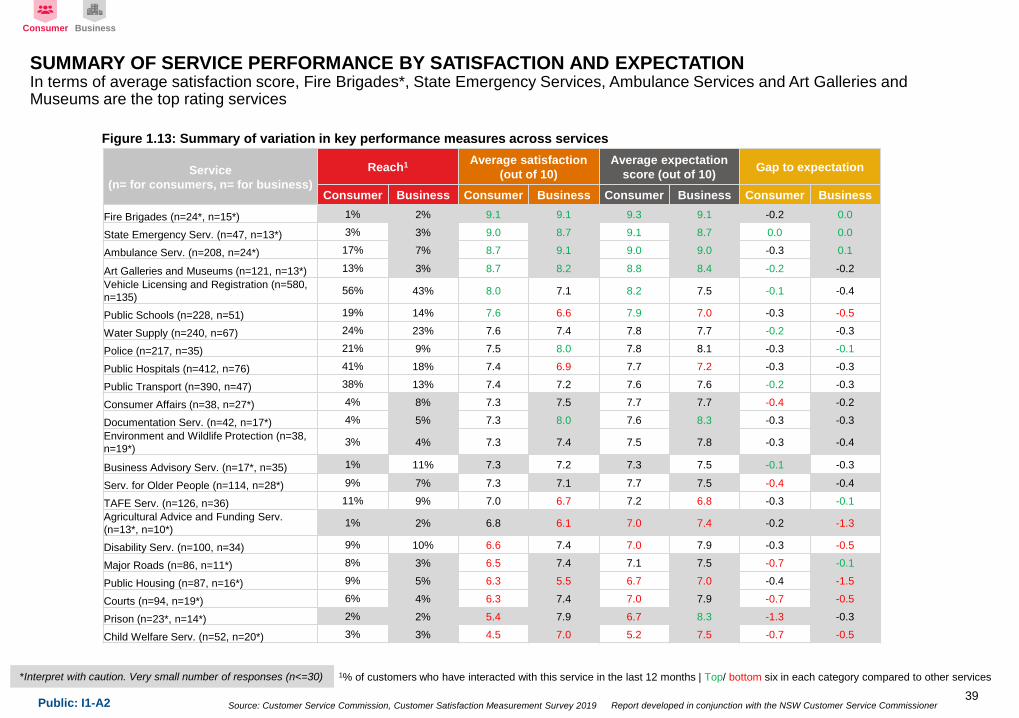
Consumer Business
Service(n= for consumers n= for business)
Reach1 Average satisfaction (out of 10)
Average expectation score (out of 10) Gap to expectation
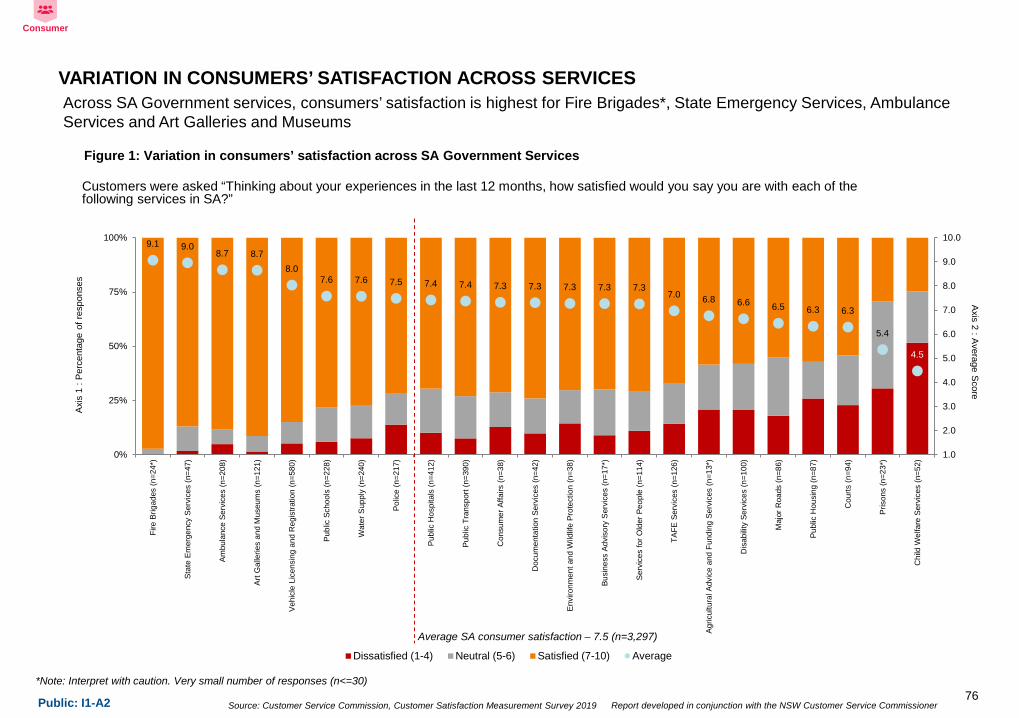
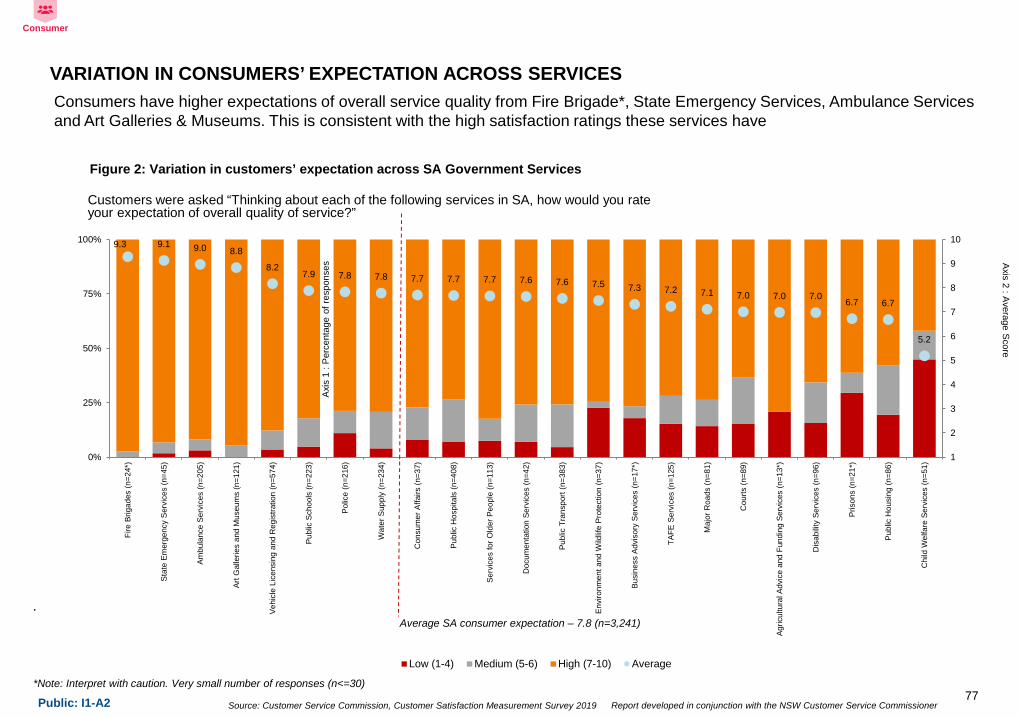
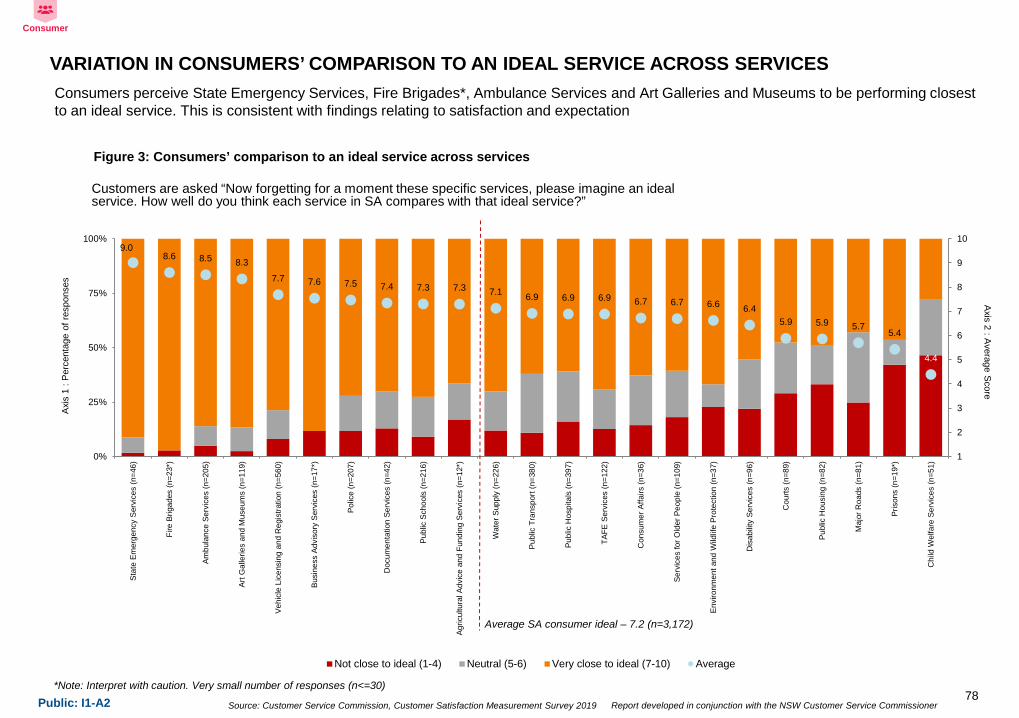
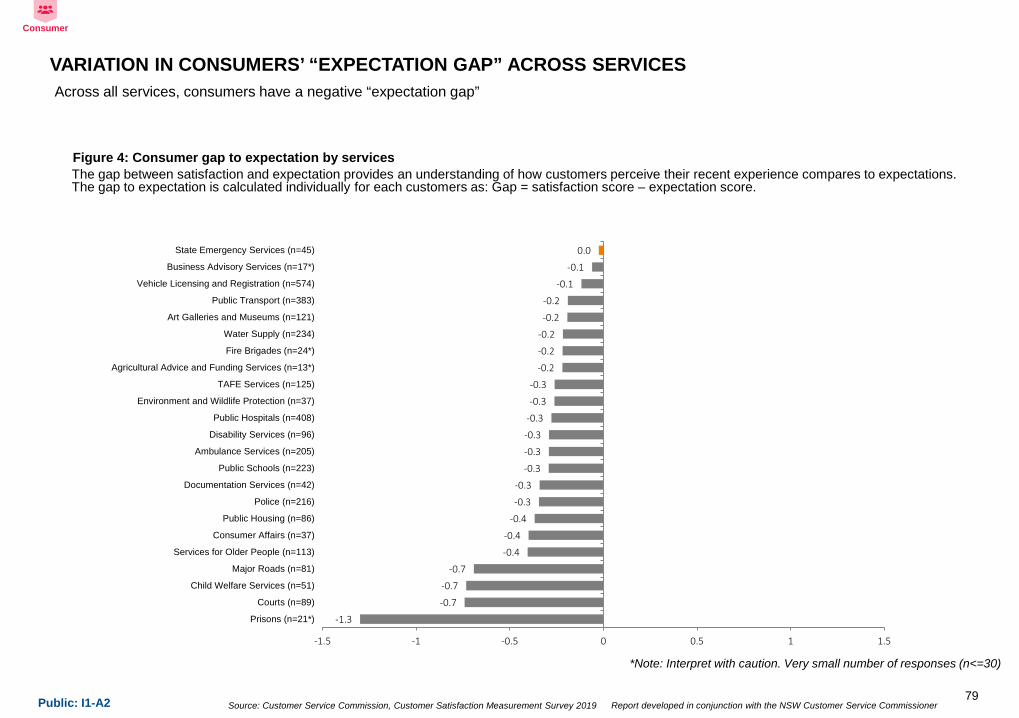
Consumer Business Consumer Business Consumer Business Consumer BusinessFire Brigades (n=24 n=15) 1 2 91 91 93 91 -02 00
State Emergency Serv (n=47 n=13) 3 3 90 87 91 87 00 00
Ambulance Serv (n=208 n=24) 17 7 87 91 90 90 -03 01
Art Galleries and Museums (n=121 n=13) 13 3 87 82 88 84 -02 -02Vehicle Licensing and Registration (n=580 n=135) 56 43 80 71 82 75 -01 -04
Public Schools (n=228 n=51) 19 14 76 66 79 70 -03 -05
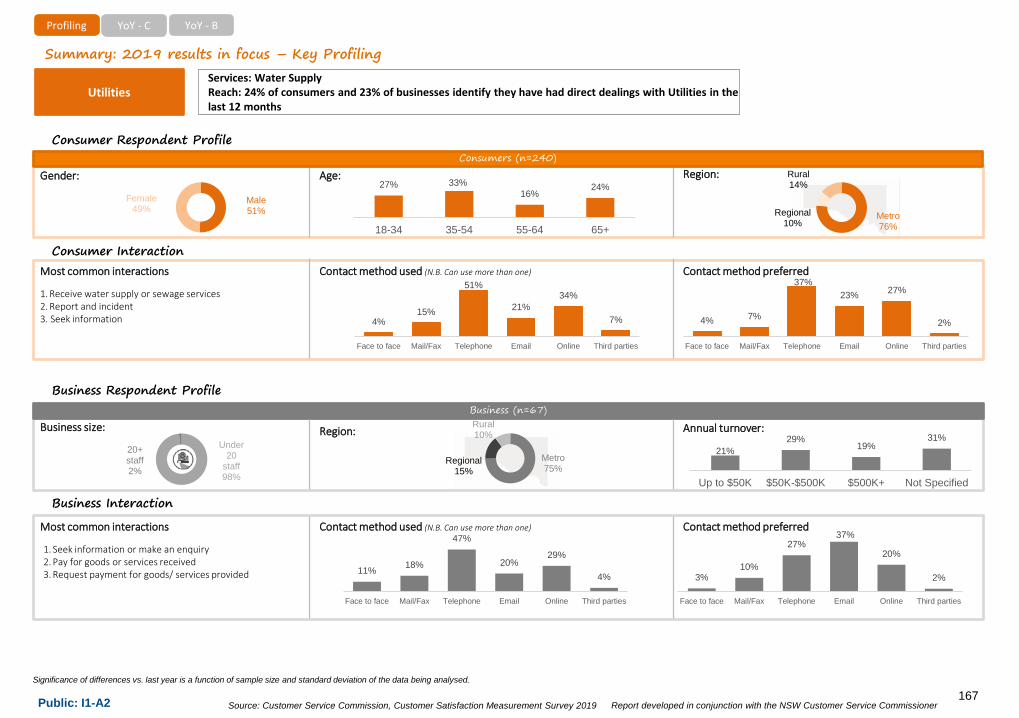
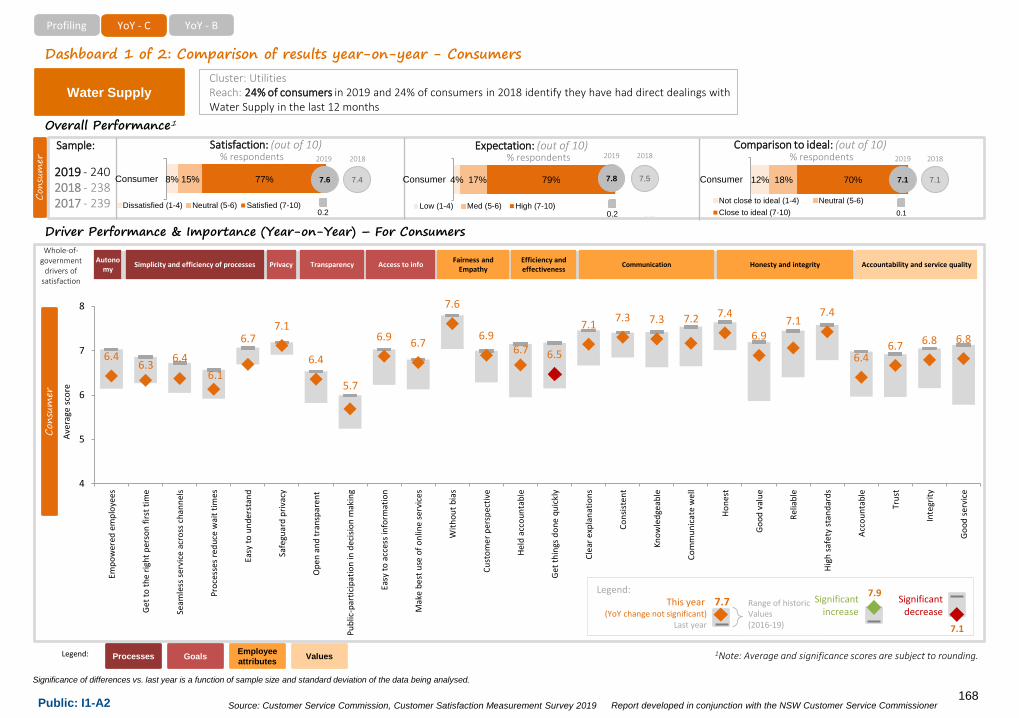
Water Supply (n=240 n=67) 24 23 76 74 78 77 -02 -03
Police (n=217 n=35) 21 9 75 80 78 81 -03 -01
Public Hospitals (n=412 n=76) 41 18 74 69 77 72 -03 -03
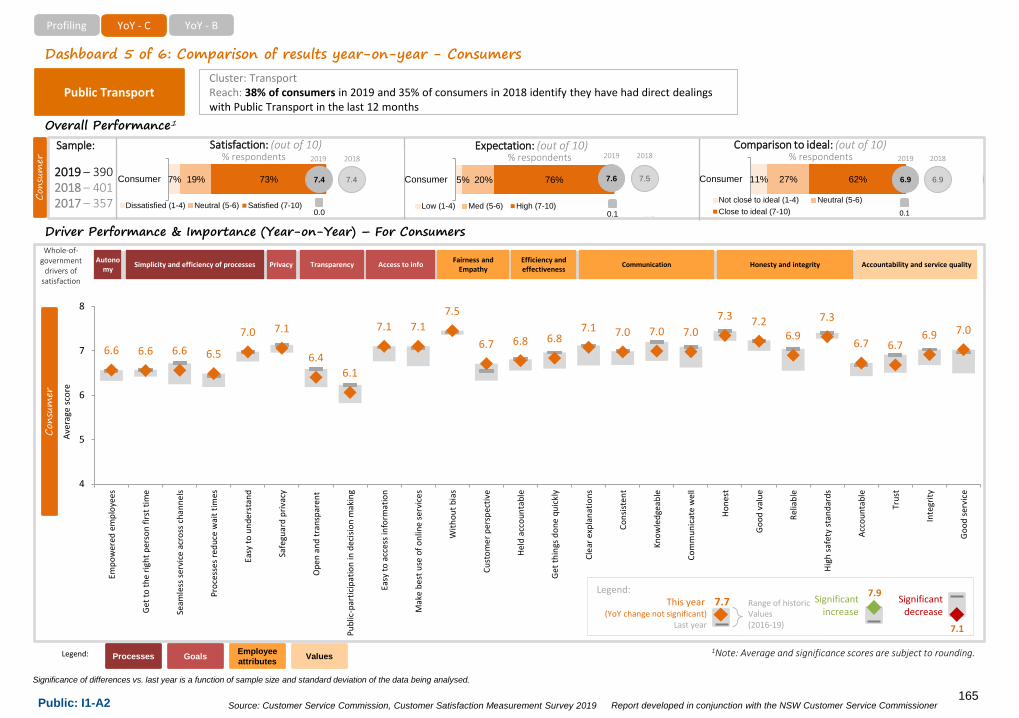
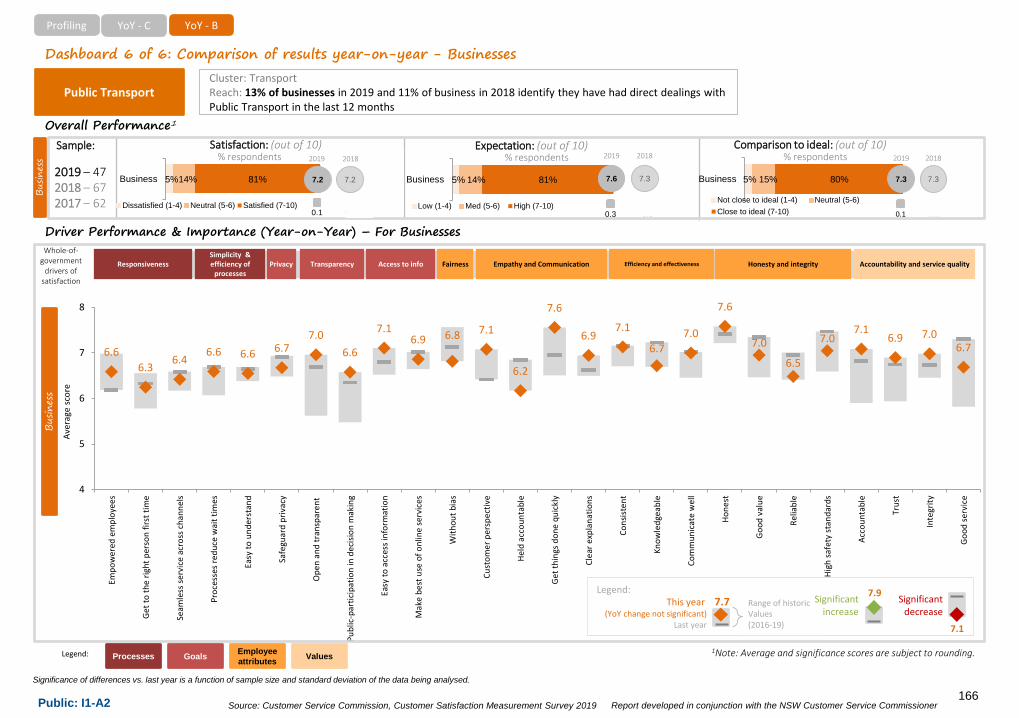
Public Transport (n=390 n=47) 38 13 74 72 76 76 -02 -03
Consumer Affairs (n=38 n=27) 4 8 73 75 77 77 -04 -02
Documentation Serv (n=42 n=17) 4 5 73 80 76 83 -03 -03Environment and Wildlife Protection (n=38 n=19) 3 4 73 74 75 78 -03 -04
Business Advisory Serv (n=17 n=35) 1 11 73 72 73 75 -01 -03
Serv for Older People (n=114 n=28) 9 7 73 71 77 75 -04 -04
TAFE Serv (n=126 n=36) 11 9 70 67 72 68 -03 -01Agricultural Advice and Funding Serv (n=13 n=10) 1 2 68 61 70 74 -02 -13
Disability Serv (n=100 n=34) 9 10 66 74 70 79 -03 -05
Major Roads (n=86 n=11) 8 3 65 74 71 75 -07 -01
Public Housing (n=87 n=16) 9 5 63 55 67 70 -04 -15
Courts (n=94 n=19) 6 4 63 74 70 79 -07 -05
Prison (n=23 n=14) 2 2 54 79 67 83 -13 -03
Child Welfare Serv (n=52 n=20) 3 3 45 70 52 75 -07 -05
Figure 113 Summary of variation in key performance measures across services
Interpret with caution Very small number of responses (nlt=30) 1 of customers who have interacted with this service in the last 12 months | Top bottom six in each category compared to other services
SUMMARY OF SERVICE PERFORMANCE BY SATISFACTION AND EXPECTATIONIn terms of average satisfaction score Fire Brigades State Emergency Services Ambulance Services and Art Galleries and Museums are the top rating services
39
Public ndash I1-A2
SOUTH AUSTRALIAN CUSTOMER SATISFACTION MEASUREMENT SURVEY 2019
2 PERFORMANCE AGAINST CUSTOMER SATISFACTION ATTRIBUTES
Source Customer Service Commission Customer Satisfaction Measurement Survey 2019 Report developed in conjunction with the NSW Customer Service CommissionerPublic I1-A2
Satisfaction Drivers Average score across respondents (out of 10 according to a scale from 1 strongly disagree to 10 strongly agree)
Employees for SA1) Honesty and integrity of
employees2) Efficiency and effectiveness of
employees3) Communication
Average across attributes
Employees across jurisdictions1) Honesty and integrity of
employees2) Efficiency and effectiveness of
employees3) Communication
Average across attributes
77 76 7675 74 74 74 74 73
7070 69
78 7877
76 76 76 76 7575
72
7172
65
70
75
80
Are
hone
st
Del
iver
hig
h sa
fety
sta
ndar
ds
Prov
ide
serv
ices
with
out b
ias
Expl
ain
inte
nded
act
ions
cle
arly
Enge
nder
con
fiden
ce in
thei
r kno
wle
dge
Com
mun
icat
e w
ell
Prov
ide
good
val
ue s
ervi
ces
Are
relia
ble
Are
cons
iste
nt
Are
held
acc
ount
able
See
thin
gs fr
om m
y pe
rspe
ctiv
e
Get
thin
gs d
one
as q
uick
ly a
s po
ssib
le
NZ (n=2815) UK (n=2897) SA (n=2727) VIC (n=2991) QLD (n=2844) NSW (n=5686)
Average 7410
7510
QLD
7510
NZ
7510
VIC
7510
NSW
7410
UK
Figure 21 Consumer perceptions of employee related attributes
Top 3 performing attributes include
bull lsquoAre honestrsquo (77 out of 10)bull lsquoDeliver high safety standardsrsquo (76 out
of 10) bull lsquoProvide services without biasrsquo (76 out if
10)
Bottom 3 lowest performing attributes include
bull lsquoGet things done as quickly as possiblersquo (69 out of 10)
bull lsquoSee things from my perspectiversquo (70 out of 10)
bull lsquoAre held accountablersquo (70 out of 10)
When compared with other jurisdictions
bull SA along with the UK was the lowest performing jurisdiction (74 out of 10) on average However the gap between highest and lowest performing jurisdictions is very small
Base(n)=2704
77 76 76 75 74 74 74 74 7370 70 69
556065707580
Are
hone
st
Del
iver
hig
hsa
fety
sta
ndar
ds
Prov
ide
serv
ices
with
out b
ias
Expl
ain
inte
nded
actio
ns c
lear
ly
Enge
nder
conf
iden
ce in
thei
r kno
wle
dge
Com
mun
icat
ew
ell
Prov
ide
good
valu
e se
rvic
es
Are
relia
ble
Are
cons
iste
nt
Are
held
acco
unta
ble
See
thin
gs fr
omm
y pe
rspe
ctiv
e
Get
thin
gs d
one
as q
uick
ly a
spo
ssib
le
Consumer
+01 +01 - - - - - - --
+01 -01
CONSUMER PERCEPTION OF EMPLOYEESThere were no statistically significant changes in perceptions of employees versus 2018
Legend Statistically significant increase in avg from 2018 (at 99 level of Confidence)No significant change in avg from 2018(at 99 level of Confidence)Statistically significant decrease in avg from 2018 (at 99 level of Confidence)
41
Source Customer Service Commission Customer Satisfaction Measurement Survey 2019 Report developed in conjunction with the NSW Customer Service CommissionerPublic I1-A2
Satisfaction Drivers Average score across respondents (according to a scale from 1 strongly disagree to 10 strongly agree)
Process for SA1) Simplicity and efficiency of
processes2) Employee autonomy
Average across attributes
Process across jurisdictions1) Simplicity and efficiency of
processes2) Employee autonomy
Average across attributes
7068
65 6563
55
65
75
Processes areeasy to
understand
Employees areempowered tomake decisions
I can get to theright person the
first time
Service feelsseamless even if I
have to usemultiple contact
methods
Are designed toreduce wait timesAverage 66
10
70
68
65 65
63
72
70
6868
67
60
65
70
75
Processes areeasy to understand
Employees areempowered tomake decisions
I can get to theright person the
first time
Service feelsseamless even if I
have to usemultiple contact
methods
Are designed toreduce wait times
NZ (n=2677) UK (n=2735) SA (n=2617) VIC (n=2924) QLD (n=2851) NSW (n=5638)
6910
QLD
6810
NZ
6910
VIC
6910
NSW
6710
UK
bull lsquoProcesses are easy to understandrsquo is the best performing attribute with a score of 7 out of 10 However as with previous years execution of these processes (empowered employees getting to the right person the first time seamless service and wait times) continue to have lower scores ranging from 68 to 63 out of 10 This pattern is observed across all jurisdictions
bull SA is behind other jurisdictions for all process attributes
bull Across all jurisdictions process attributes have the lowest average scores of all attribute categories (Values Goals and Employees) ndashsimplifying and bringing efficiencies to processes remains a challenge for all jurisdictions
Figure 22 Consumer perceptions of process related attributes
Base(n)=2668
Consumer
+01+01
-01 - -
CONSUMER PERCEPTION OF PROCESSESThere have been no statistically significant changes to any of the process attribute scores in comparison to last year
Legend Statistically significant increase in avg from 2018 (at 99 level of Confidence)No significant change in avg from 2018(at 99 level of Confidence)Statistically significant decrease in avg from 2018 (at 99 level of Confidence)
42
Source Customer Service Commission Customer Satisfaction Measurement Survey 2019 Report developed in conjunction with the NSW Customer Service CommissionerPublic I1-A2
Satisfaction Drivers Average score across respondents (according to a scale from 1 strongly disagree to 10 strongly agree)
Goals for SA1) Privacy2) Transparency3) Access
Average across attributes
Goals across jurisdictions1) Privacy2) Transparency3) Access
Average across attributes
7570 68 67
61
55
65
75
Safeguard privacyand confidentiality
Is making it easierto access
information abouttheir services
Is making best useof online services
to improveconvenience and
efficiency forcustomers
Demonstrateopenness andtransparency indecision-making
Encourage publicparticipation in
decision-makingAverage 68
10
75
70
6867
61
76
72
7170
65
60
65
70
75
80
Safeguard privacyand confidentiality
Is making it easierto access
information abouttheir services
Is making best useof online services
to improveconvenience and
efficiency forcustomers
Demonstrateopenness andtransparency indecision-making
Encourage publicparticipation in
decision-making
NZ (n=2681) UK (n=2785) SA (n=2582) VIC (n=2803) QLD (n=2732) NSW (n=5486)
7010
NZ
7010
QLD
7110
VIC
7110
NSW
6910
UK
bull lsquoSafeguard privacy and confidentialityrsquo is the highest rated goal attribute
bull In comparison to other jurisdictions SA continues to lag on all goal attributes
bull lsquoEncourage public participation in decision makingrsquo is the attribute that sees the lowest scores across all jurisdictions It is also the attribute with the widest gap between the top performing and lowest performing jurisdictions (VIC and SA) with a gap of 04 points
Figure 23 Consumer perceptions of goals related attributes
Base(n)=2561
Consumer
CONSUMER PERCEPTION OF GOALSConsumer perceptions of SA Government services against goal related attributes have remained statistically stable versus last year
+01
+01- - -01
Legend Statistically significant increase in avg from 2018 (at 99 level of Confidence)No significant change in avg from 2018(at 99 level of Confidence)Statistically significant decrease in avg from 2018 (at 99 level of Confidence)
43
Source Customer Service Commission Customer Satisfaction Measurement Survey 2019 Report developed in conjunction with the NSW Customer Service CommissionerPublic I1-A2
Satisfaction Drivers Average score across respondents (according to a scale from 1 strongly disagree to 10 strongly agree)
Values for SA1) Service Quality2) Accountability
Average across attributes
Values across jurisdictions1) Service Quality2) Accountability
Average across attributes
Average 7210
73 72 72 70
55
65
75
Operates with integrity Provides good service Is a body I can trust Is accountable for itsservices
7372 72
70
7575
74
73
65
70
75
80
Operates with integrity Provides good service Is a body I can trust Is accountable for itsservices
NZ (n=3108) UK (n=3068) SA (n=2936) VIC (n=3166) QLD (n=3059) NSW (n=6113)
7410
UK
7310
NZ
7410
VIC
7410
NSW
7310
QLD
bull Consumers rate SA Governmentservices high (above 7 out of 10)across all value attributes
bull At an overall level SA is behind all other jurisdictions with the lowest average score across all value attributes
Figure 24 Consumer perceptions of values related attributes
Base(n)=2916
Consumer
- - --
CONSUMER PERCEPTION OF VALUESThere have been no statistically significant changes to the ratings of value attributes versus last year
Legend Statistically significant increase in avg from 2018 (at 99 level of Confidence)No significant change in avg from 2018(at 99 level of Confidence)Statistically significant decrease in avg from 2018 (at 99 level of Confidence)
44
Source Customer Service Commission Customer Satisfaction Measurement Survey 2019 Report developed in conjunction with the NSW Customer Service CommissionerPublic I1-A2
Satisfaction Drivers Average score across respondents (according to a scale from 1 strongly disagree to 10 strongly agree)
Employees for SA1) Honesty and integrity of
employees2) Efficiency and effectiveness of
employees3) CommunicationAverage across attributes
Employees across jurisdictions1) Honesty and integrity of
employees2) Efficiency and effectiveness of
employees3) Communication
75 75 73 72 72 72 71 71 71 69 68 68
55
65
75
85
Are
hone
st
Del
iver
hig
hsa
fety
sta
ndar
ds
Prov
ide
serv
ices
with
out b
ias
Expl
ain
inte
nded
actio
ns c
lear
ly
Enge
nder
conf
iden
ce in
thei
r kno
wle
dge
Com
mun
icat
ew
ell
Are
cons
iste
nt
Prov
ide
good
valu
e se
rvic
es
Are
relia
ble
Are
held
acco
unta
ble
Get
thin
gs d
one
as q
uick
ly a
spo
ssib
le
See
thin
gs fr
omm
y pe
rspe
ctiv
e
7372 73
7271
7170
72 72
68 6968
77 7775
7574
75 75 74 74
7170 71
65
70
75
80
Are
hone
st
Del
iver
hig
h sa
fety
sta
ndar
ds
Prov
ide
serv
ices
with
out b
ias
Expl
ain
inte
nded
act
ions
cle
arly
Enge
nder
con
fiden
ce in
thei
rkn
owle
dge
Com
mun
icat
e w
ell
Are
cons
iste
nt
Prov
ide
good
val
ue s
ervi
ces
Are
relia
ble
Are
held
acc
ount
able
Get
thin
gs d
one
as q
uick
ly a
s po
ssib
le
See
thin
gs fr
om m
y pe
rspe
ctiv
e
NZ (n=757) UK (n=1327) SA (n=657) VIC (n=714) QLD (n=748) NSW (n=1586)
Average 7110
7210
UK
7210
NSW
7310
NZ
7410
QLD
7110
VIC
bull The attribute lsquoAre honestrsquo is the top ranking attribute this year
bull Other top attributes are lsquodeliver high safety standardsrsquo and lsquoprovide services without biasrsquo
Bottom 3 lowest performing attributes are
bull lsquoSee things from my perspectiversquo (68 out of 10)
bull lsquoGet things done as quickly as possiblersquo (69 out of 10)
bull lsquoAre held accountablersquo (68 out of 10)
Across jurisdictions VIC has the lowest average ratings for employee perceptions
QLD has the highest average rating in 2019 after being in the last spot in 2018
Figure 25 Business perceptions of employee related attributes
Base(n)=724
Business
BUSINESS PERCEPTION OF EMPLOYEESThere have been no statistically significant changes to the ratings of employee attributes versus last year
+02 +01 +02 +01 +01 +01 +01 +01 - +02
+01 +01
Legend Statistically significant increase in avg from 2018 (at 99 level of Confidence)No significant change in avg from 2018(at 99 level of Confidence)Statistically significant decrease in avg from 2018 (at 99 level of Confidence)
45
Source Customer Service Commission Customer Satisfaction Measurement Survey 2019 Report developed in conjunction with the NSW Customer Service CommissionerPublic I1-A2
Satisfaction Drivers Average score across respondents (according to a scale from 1 strongly disagree to 10 strongly agree)
Process for SA1) Simplicity and efficiency of
processes2) Employee autonomy
Average across attributes
Process across jurisdictions1) Simplicity and efficiency of
processes2) Employee autonomy
Average across attributes
68 66 65 6561
55
65
75
Processes areeasy to understand
Employees areempowered tomake decisions
Service feelsseamless even if I
have to usemultiple contact
methods
I can get to theright person the
first time
Are designed toreduce wait times
Average 6510
6710
UK
6510
NSW
6710
NZ
6810
QLD
6510
VIC
68
66 65
6561
71
68 6767 67
60
65
70
75
Processes areeasy to understand
Employees areempowered tomake decisions
Service feelsseamless even if I
have to usemultiple contact
methods
I can get to theright person the
first time
Are designed toreduce wait times
NZ (n=731) UK (N=1324) SA (n=661) VIC (n=711) QLD (n=745) NSW (n=1614)
bull Average rating for process attributes are the lowest in comparison to other attributes (employees ndash 71 goals ndash 68 values ndash 71)
bull Among all jurisdictions QLD has the highest average rating of 68 out of 10
bull SA ranks lowest among all jurisdictions for the statement lsquoAredesigned to reduce wait timesrsquo
Figure 26 Business perceptions of process related attributes
Base(n)= 712
Business
BUSINESS PERCEPTION OF PROCESSESAll the processes related attributes have remained stable from 2018 to 2019
+01+01
+01+01-01
Legend Statistically significant increase in avg from 2018 (at 99 level of Confidence)No significant change in avg from 2018(at 99 level of Confidence)Statistically significant decrease in avg from 2018 (at 99 level of Confidence)
46
Source Customer Service Commission Customer Satisfaction Measurement Survey 2019 Report developed in conjunction with the NSW Customer Service CommissionerPublic I1-A2
Satisfaction Drivers Average score across respondents (out of 10 on scale of according to a scale from 1 strongly disagree to 10 strongly agree)
Goals for SA1) Privacy2) Transparency3) Access
Average across attributes
Goals across jurisdictions1) Privacy2) Transparency3) Access
Average across attributes
7469 68 67
63
55
65
75
85
Safeguard privacyand confidentiality
Is making it easierto access
information abouttheir services
Is making best useof online services
to improveconvenience and
efficiency forcustomers
Demonstrateopenness andtransparency indecision-making
Encourage publicparticipation in
decision-makingAverage 68
10
6910
UK
6810
NSW
6910
NZ
6910
QLD
6710
VIC
77
71
69 67
62
71
6866 66
6260
65
70
75
80
Safeguard privacyand confidentiality
Is making it easierto access
information abouttheir services
Is making best useof online services
to improveconvenience and
efficiency forcustomers
Demonstrateopenness andtransparency indecision-making
Encourage publicparticipation in
decision-making
NZ (n=732) UK (n=1295) SA (n=641) VIC (n=681) QLD (n=708) NSW (n=1554)
bull Compared to 2018 lsquoEncourage public participation in decision makingrsquo has seen a statisticallysignificant increase of 04 points to 61 out of 10 However this continues to be the lowest rated goal related attribute
bull Across jurisdictions QLD has the highest average rating of 69
bull The largest gap between jurisdictions is seen for lsquoSafeguard privacy and confidentialityrsquo with NZ having the highest rating of 77 out of 10 and VIC having the lowest rating of 71 out of 10
Figure 27 Business perceptions of goals related attributes
Base(n)= 695
Business
04
Legend Statistically significant increase in avg from 2018 (at 99 level of Confidence)No significant change in avg from 2018(at 99 level of Confidence)Statistically significant decrease in avg from 2018 (at 99 level of Confidence)
BUSINESS PERCEPTION OF GOALSMost goal related attributes with the exception of lsquoEncourage public participation in decision-makingrsquo have remained stable versus last year
+03 -03 +03 +02
47
Source Customer Service Commission Customer Satisfaction Measurement Survey 2019 Report developed in conjunction with the NSW Customer Service CommissionerPublic I1-A2
Satisfaction Drivers Average score across respondents (out of 10 on scale of according to a scale from 1 strongly disagree to 10 strongly agree)
Values for SA1) Service Quality2) Accountability
Average across attributes
Values across jurisdictions1) Service Quality2) Accountability
Average across attributes
Average 7110
74 74 74
71
71 71 71
69
65
70
75
80
Operates with integrity Provides good service Is a body I can trust Is accountable for itsservices
NZ (n=803) UK (n=1367) SA (n=702) VIC (n=748) QLD (n=789) NSW (n=1676)
7210
UK
7110
NSW
7210
QLD
7310
NZ
7010
VIC
72 71 71 70
55
65
75
Operates with integrity Provides good service Is a body I can trust Is accountable for itsservices
bull lsquoIntegrityrsquo is the top rated value attribute with a rating of 72 out of 10
bull While lsquoaccountabilityrsquo is the least rated attribute there has been a 02 point increase (statistically insignificant) versus 2018
bull Across jurisdictions VIC has slipped to the lowest ranking after being the top performing Australian jurisdiction last year and NZ has the highest average rating of 73 out of 10 making it the top performingjurisdiction in 2019
bull The gap between the top performing jurisdiction and lowest performer have narrowed in comparison to last year indicating an improvement in performance across jurisdictions
Figure 28 Business perceptions of values related attributes
Base(n)= 758
Business
BUSINESS PERCEPTION OF VALUESValue related attributes continue to be statistically stable in 2019
+01 +01 +01 +02
Legend Statistically significant increase in avg from 2018 (at 99 level of Confidence)No significant change in avg from 2018(at 99 level of Confidence)Statistically significant decrease in avg from 2018 (at 99 level of Confidence)
48
Source Customer Service Commission Customer Satisfaction Measurement Survey 2019 Report developed in conjunction with the NSW Customer Service CommissionerPublic I1-A2
Employee attributes Goals Processes Values
1Note Groupings of drivers of satisfaction are based on analyses of NSW Government services however it is assumed that drivers of satisfaction are relatively consistent across jurisdictions and generally across service industries broadly
bull Safeguard privacy and confidentiality
Goa
ls
bull Provide good value servicesbull Are honestbull Are reliablebull Deliver high safety standards
Empl
oyee
s
bull Are consistentbull Explain intended actions clearlybull Communicate wellbull Engender confidence in their
knowledge
Communication of employees
bull Are held accountablebull Get things done as quickly as
possible
Efficiency and Effectiveness of employeesHonesty and integrity of employees
Employee autonomySimplicity and efficiency of processes
bull Processes are easy to understandbull Service feels seamless across channelsbull Processes are designed to reduce wait timesbull I can get to the right person the first time
bull Employees are empowered to make decisions
Accountability and Service Quality
bull Is a body that I can trustbull Operates with integritybull Provides good value servicesbull Is accountable for its services
Proc
esse
sVa
lues
Access to Information and Online services PrivacyTransparency
bull Demonstrate openness and transparency in decision making
bull Encourage public participation in decision making
bull Is making it easier to access information about their service
bull Is making best use of online services to improve efficiency for customers
bull See things from my perspective
bull Provide services without bias
Fairness and Empathy of employees
Consumer
GROUPINGS OF DRIVERS OF CUSTOMER SATIFACTION1
The groupings of drivers have changed from 2018 - lsquoFairness and Empathyrsquo is now a key standalone driver of consumer satisfaction differentiated from Communication which continues to be a key driver of consumer satisfaction
49
Source Customer Service Commission Customer Satisfaction Measurement Survey 2019 Report developed in conjunction with the NSW Customer Service CommissionerPublic I1-A2
KEY
When looking at the relative importance of satisfaction drivers in NSW Employee related attributes are seen to have the highest relative importance as drivers of satisfaction with lsquoHonesty and Integrityrsquo being the most important driverRelating this to the areas of improvement for the SA Governmentbull Honesty and Integrity is a strength that the SA
Government services can build on to improve consumer satisfaction
bull Access to information and online services as well as efficiency and effectiveness of employees are primary opportunities to drive higher consumer satisfaction
Note Groupings of drivers of satisfaction are based on analyses of NSW Government services however it is assumed that drivers of satisfaction are relatively consistent across jurisdictions and generally across service industries broadly
LOW
HIGH
Average score across attributes (SA)(out of 10)
LOW
HIGH
Rel
ativ
e im
port
ance
(NSW
)
Median across all attributes
1Note Analysis displayed is based on NSW customer data however similar results are observed for businesses Calculation is based on the relativity of parameters in the statistical analysis of drivers against satisfaction
Strengths to lsquobuild onrsquo
Median across drivers
Primary opportunities
Secondary opportunities
Fairness and Empathy
Simplicity and efficiency of processes
Transparency
Access to information and online services
Privacy
Employee autonomy
Employee attributes Goals Processes
Figure 211 Importance (NSW) versus performance (SA) against each of the drivers of satisfaction
Monitor
Communication
Consumer
Efficiency and effectiveness
Honesty and integrity
PRIORITISATION OF DRIVERS OF SATISFACTION1
Build on the honesty and integrity of employees and focus on improving their efficiency and effectiveness to drive higher satisfaction In addition focus on improving access to information and online services
50
Public ndash I1-A2
SOUTH AUSTRALIAN CUSTOMER SATISFACTION MEASUREMENT SURVEY 2019
3 SATISFACTION BY CONTACT METHOD AND DIGITAL INSIGHTS
Source Customer Service Commission Customer Satisfaction Measurement Survey 2019 Report developed in conjunction with the NSW Customer Service CommissionerPublic I1-A2
51
4135
29
128
47
40
29 27
15
6
Inperson
Phone Online Email Mail fax Thirdparties
2018 Business (n=814) 2019 Business (n=762)
c
usto
mer
s w
ho h
ave
had
dire
ct
deal
ings
via
this
cha
nnel
Figure 33 2018 and 2019 channel usage - Business
Figure 34 2018 and 2019 most preferred channel ndash Business
2922 22 22
2 4
3224 23
16
3 2
In person Email Phone Online Mailfax Thirdparties
2018 Business(n=795) 2019 Business(n=743)
Note ndash Percentages do not add up to 100 due to exclusion of Donrsquot Know from the analysis
Businessesbull While lsquoin personrsquo remains the most
used channel for contact there is a continued decline in usage since 2017 (52 in 2017 51 in 2018 47 in 2019) though not statistically significant
bull Despite the year on year declines lsquoin personrsquo continues to be the most preferred channel and there has been a year on year growth in preference since 2017 (27 in 2017 29 in 2018 32 in 2019)
57
3325
139 6
58
3426
1610
5
Inperson
Phone Online Email Mail fax Thirdparties
2018 Consumer (n=3307) 2019 Consumer (n=3297)
34
22 2112
4 2
3324 21
16
4 2
Inperson
Phone Online Email Mailfax Thirdparties
2018 Consumer (n=3307) 2019 Consumer (n=3170)
cus
tom
ers
who
hav
e ha
d di
rect
de
alin
gs v
ia th
is c
hann
el
Figure 31 2018 and 2019 channel usage - Consumer
Figure 32 2018 and 2019 most preferred channel - Consumer
Consumersbull lsquoIn personrsquo continues to be the most used
channel for contact as well as the most preferred channel Usage has remained consistent versus last year
bull Phone usage by consumers continues to see a year on year uptick though statistically insignificant (31 in 2017 33 in 2018 and 34 in 2019)
bull Relative preferences for the channels have remained unchanged versus last year
Consumer Business
CONTACT METHODS USED AND PREFERREDlsquoIn-personrsquo continues to be the most used and preferred method of contact for both consumers and businesses
52
Source Customer Service Commission Customer Satisfaction Measurement Survey 2019 Report developed in conjunction with the NSW Customer Service CommissionerPublic I1-A2
47
41
3130
12
5
4442
2529
96
56
40
24
31
96
4650
25
40
16
4
51
41
24
37
13
3
47
40
29 27
15
6
In person face toface
Telephone Online Email Mail posted letterfax
Third parties
NSW (n=1801) VIC (n=790) QLD (n=832)
UK (n=1420) NZ (n=868) SA (n=762)
Customers were asked ldquoWhich of the following contact methods have you used to carry out your direct dealings with the following services in [Jurisdiction] in the last 12 monthsrdquo
Figure 35 Contact method used to interact with government services across jurisdictions
59
31 31
16
84
54
33
2320
10
6
59
31
24
17
10
5
53
36
23 2116
2
57
31
24
19
13
2
58
34
26
16
105
In person face toface
Telephone Online Email Mail posted letterfax
Third parties
NSW (n=6771) VIC (n=3458) QLD (n=3346)UK (n=3310) NZ (n=3550) SA (n=3297)
Consumer
Business
Consumersbull Face to face is the most used channel
by consumers to access government services in all jurisdictions
bull NSW leads the way when it comes to the use of online channels
Businessesbull Face to face is the most used channel by
businesses to access government services in all jurisdictions
bull NSW leads in the adoption of online as a contact method followed by SA
bull Business usage of telephones and emails as a contact method is higher than that for consumers across all jurisdictions
Consumer Business
CONTACT METHODS USED AND PREFERREDlsquoIn-personrsquo is the most used contact method across all jurisdictions for both consumers and businesses SA is second to NSW in the usage of online as the method of contact for both consumers and businesses
53
Source Customer Service Commission Customer Satisfaction Measurement Survey 2019 Report developed in conjunction with the NSW Customer Service CommissionerPublic I1-A2
28
24 24
18
42
26
22
28
20
2 2
29
25
22
18
3 2
25
2826
16
5
0
29
26
23
18
31
32
24 23
16
32
In person face toface
Email Telephone Online Mail posted letterfax
Third parties
NSW (n=1759) VIC (n=774) QLD (n=809)UK (n=1401) NZ (n=850) SA (n=743)
35
18
24
18
32
33
23
19 19
52
34
21 20 20
42
31
2219
22
6
1
34
21 21 20
41
33
2421
16
42
In person face toface
Telephone Online Email Mail posted letterfax
Third parties
NSW (n=6491) VIC (n=3336) QLD (n=3246)UK (n=3177) NZ (n=3399) SA (n=3170)
CONTACT METHODS PREFERRED ACROSS JURISDICTIONSlsquoIn-personrsquo continues to be the most preferred channel across all jurisdictions for both consumers and businesses
Customers were asked ldquoGenerally which contact method do you most prefer when dealing directly with each of the following services inhelliprdquo
Figure 36 Contact method preferred to interact with government services across jurisdictions
Consumer
Business
Consumersbull Face to face is the preferred method of
contact for consumers to access government services in all jurisdictions
bull The pattern of preference is consistent with that of reported channel usage
Businessesbull Businesses prefer a variety of contact
methods to access government servicesbull Of all jurisdictions SA businesses have
the highest preference for face to face interactions
Consumer Business
54
Source Customer Service Commission Customer Satisfaction Measurement Survey 2019 Report developed in conjunction with the NSW Customer Service CommissionerPublic I1-A2
75
70 71 71 69 68
73 73 72 72 7167
50
60
70
80
In person Online Mailfax Phone Email Third parties2018 Business(n=814) 2019 Business(n=762)
Aver
age
satis
fact
ion
scor
e (1
-10)
76 7573 72 72
70
77 75 74 73 71 70
50
60
70
80
Online In person Third parties Phone Mailfax Email2018 Consumer (n=3307) 2019 Consumer (n=3297)
Aver
age
satis
fact
ion
scor
e (1
-10)
VARIATION IN CUSTOMER SATISFACTION BY CONTACT METHODWhile lsquoin-personrsquo is the most used and most preferred method of contact satisfaction of consumers with SA Government services is higher for those who use Online channels For businesses satisfaction is high for both in-person and online channel users
Customers were asked ldquoWhich of the following contact methods have you used to carry out your direct dealings with the following servicesrdquo
Figure 37 Variation in overall satisfaction by contact method
+01+01
+03
- -
+02+01
+01
+01
-01
Consumersbull Satisfaction ratings are high (7+ out
of 10) across all contact channelsbull Consumers who have used online
channels to contact have the highest satisfaction rating and this has remained relatively stable from last year
Businessesbull Satisfaction amongst businesses
using different channels have remained relatively stable compared to last year
bull Businesses who have used face to face or online methods of contact have the highest satisfaction rating
+01
Consumer Business
Legend Statistically significant increase in avg from 2018 (at 99 level of Confidence)No significant change in avg from 2018 (at 99 level of Confidence)Statistically significant decrease in avg from 2018 (at 99 level of Confidence)
-02
55
Source Customer Service Commission Customer Satisfaction Measurement Survey 2019 Report developed in conjunction with the NSW Customer Service CommissionerPublic I1-A2
7978
74
7675
74
76 77
7374
7273
7877
75 75 75
71
76 7675 75
71 71
77 76
7475
73
77
75
74 73
7170
Online In person face to face Third parties such asAustralia Post
Telephone Mail posted letter fax Email
NSW (n=6771) VIC (n=3458) QLD (n=3346) UK (n=3310) NZ (n=3550) SA (n=3297)
7575
71
7271 71
73 73 73
69
67
73
77
73
7776
71
68
75
72
68
74
71
70
74
79
76
71
73
77
73 7372 72 71
67
In person face toface
Online Mail posted letter fax Telephone Email Third parties such asAustralia Post
NSW (n=1801) VIC (n=790) QLD (n=832) UK (n=1420) NZ (n=868) SA (n=762)
Figure 38 Overall satisfaction with government services by contact method(s) used across jurisdictions
Aver
age
scor
e (1
-10)
Aver
age
scor
e (1
-10)
Consumer
Business
Consumersbull Across jurisdictions
consumers who use online channels have the highest satisfaction with their respective government services
bull Consumers in NZ using online channels show the highest satisfaction of all jurisdictions
Businessesbull In all jurisdictions except
NZ businesses that use face to face have the highest satisfaction with their respective government services In NZ online users have the highest satisfaction
bull SA businesses who use third party channels show the lowest satisfaction in comparison to businesses that use other channels
Consumer Business
VARIATION IN CUSTOMER SATISFACTION BY CONTACT METHOD ACROSS JURISDICTIONSConsumers who use online and businesses who use face to face have higher satisfaction with government services across jurisdiction
81
56
Source Customer Service Commission Customer Satisfaction Measurement Survey 2019 Report developed in conjunction with the NSW Customer Service CommissionerPublic I1-A2
7069
65 66
62
6765
63 6360
6866
63 6261
6461
59 59 58
70
67 66 6564
69 6865 65
62
Processes are easy tounderstand
Employees are empoweredto make decisions
Service feels seamlesseven if I have to
communicate acrossdifferent channels (ieonline phone email)
I can get to the right personthe first time
Are designed to reducewait times
In person face to face (n=1418) Mail posted letter fax (n=229)
Telephone (landline mobile calls text message) (n=883) Email (n=419)
Online (n=591) Third parties such as Australia Post (n=117)
6865 66 66
61
66 66 66 66
55
6462 62 62
57
65 6562 61
57
6865 63 63
60
74
69 6972
65
Processes are easy tounderstand
Service feels seamlesseven if I have to
communicate acrossdifferent channels
Employees are empoweredto make decisions
I can get to the right personthe first time
Are designed to reducewait times
In person face to face (n=300) Mail posted letter fax (n=87)
Telephone (landline mobile calls text message) (n=280) Email (n=207)
Online (n=178) Third parties such as Australia Post (n=31)
Figure 310 Perceptions of processes by channel(s) used - Business
Figure 39 Perceptions of processes by channel(s) used - Consumers
Aver
age
scor
e (1
-10)
Aver
age
scor
e (1
-10)
Consumersbull Consumers who have used in-person channels give
the highest scores for lsquoprocesses are easy to understandrsquo lsquoemployees are empowered to make decisionsrsquo and lsquoI can get to the right person the first timersquo
bull Consumers who have used online channels gave the highest ratings to lsquoService feels seamlessrsquo and lsquoare designed to reduce wait timesrsquo
bull Consumers who have used email rate the SA Government service lowest across all process attributes
Businessesbull Businesses who have used third party channels have
given the highest ratings for all process attributesbull Businesses that used mail posted letter or fax as
their method of contact rated the SA Government lowest on processes lsquoare designed to reduce wait timesrsquo attribute
bull Businesses that used telephone gave the lowest ratings to the attributes of lsquoprocesses are easy to understandrsquo lsquoservice feels seamlessrsquo and lsquoemployees are empowered to make decisionsrsquo
bull Business that used email gave the lowest rating to lsquoI can get to the right person the first timersquo
Consumer Business
PERCEPTIONS OF PROCESSES BY CONTACT METHODConsumers and businesses have different perceptions of processes based on the channels they have used
57
Source Customer Service Commission Customer Satisfaction Measurement Survey 2019 Report developed in conjunction with the NSW Customer Service CommissionerPublic I1-A2
79 79 78 78 78 78 78 75
102030405060708090100
0102030405060708090
100
I trust myinformation was
handledsecurely
through thewebsiteapp
I achieved theoutcome by
using servicesavailable online
The contentwas current
and accurate
The format ofcontent met my
accessrequirements
I was satisfiedwith the overallexperience of
using thewebsiteapp tocomplete the
task
Thewebsiteapp
was useful andallowed me todo everything Ineeded to do
Content andsupport
provided onlinewas sufficientto answer my
questions
I found thewebsite appsimple and itwas easy to
find what I waslooking for
Disagree (1-4) Neutral (5-6) Agree (7-10) Average
Customers were asked ldquoThinking about your experiences interacting with SA services online in the last 12 months to what extent do you agree or disagree with each of the following statementsrdquo
Figure 311 Satisfaction with attributes of online services
82 81 81 80 79 79 79 78
102030405060708090100
0102030405060708090
100
The contentwas current
and accurate
I achieved theoutcome by
using servicesavailable online
I trust myinformation
was handledsecurely
through thewebsiteapp
The format ofcontent met my
accessrequirements
I was satisfiedwith the overallexperience of
using thewebsiteapp tocomplete the
task
Thewebsiteapp
was useful andallowed me todo everything Ineeded to do
Content andsupport
provided onlinewas sufficientto answer my
questions
I found thewebsite appsimple and itwas easy to
find what I waslooking for
Disagree (1-4) Neutral (5-6) Agree (7-10) Average
Axis 2 Average Score
Consumer (n=798)
Business (n=210)
Axis
1
Perc
enta
ge o
f re
spon
ses
Axis 2 Average ScoreAxis
1
Perc
enta
ge o
f re
spon
ses
Consumersbull Consumers had an average rating of 79
out of 10 when asked about their satisfaction with the overall experience of using the website app to complete the task This rating has stayed stable since 2017
bull Consumers showed the highest levels of agreement with statements pertaining to accuracy of content achieving desired outcomes by using online services and trusting that their information was handled securely
Businessesbull There has been a significant increase in
the average rating across all attributes of online service except content accuracy ndash this has remained stable
bull The rating on satisfaction with the overall experience has gone up significantly by 08 points to 78
+01 +01 +01 +02+01 +01 +02
+05 NA +04 +09 +08 +06 +06
Consumer Business
Legend Statistically significant increase in avg from 2018 (at 99 level of Confidence)No significant change in avg from 2018 (at 99 level of Confidence)Statistically significant decrease in avg from 2018 (at 99 level of Confidence)
NA
+09
SATISFACTION WITH ONLINE SERVICES OVERALLConsumer satisfaction with overall experience of using online services has remained stable while business satisfaction has increased significantly from 2018 to 2019
58
Source Customer Service Commission Customer Satisfaction Measurement Survey 2019 Report developed in conjunction with the NSW Customer Service CommissionerPublic I1-A2
Businessesbull Businesses had similar motivations as
consumers for not using online as a channel to access services ndash lack of availability of services online as well as inability to find what they were looking for
Customers were asked ldquoYou mentioned that you did not go online to access the service in the last 12 months Please select all statements that apply in relation to these service(s) in SA I did not complete this interaction online becausehelliprdquo
Figure 312 Reasons for not going online I did not go online hellip
Consumer (n=2401)
Business (n=762)
37 16 12 7 7 6 5 5 3
The servicewasnt
possible to beundertaken
online
The servicewas notavailable
online
I was not ableto find what Iwas looking
for
There was noonline supportto answer any
questions Imay havesuch aswebchat
I didnt haveaccess to acomputer or
an onlinedevice
The format ofcontent on the
website didnot meet my
accessrequirements
I was not sureif my
informationwould remainconfidential
No incentivewas provided
such as adiscount
The contentwas not
current andoraccurate
Consumersbull The main reason for consumers not using
online channels to access services was that the services were not available or couldnrsquot be undertaken online
bull The other big factor was that consumers were unable to find what they were looking for
bull Uncertainty around confidentiality of information was not seen as a big deterrent in accessing services online
Consumer Business
37 17 11 8 8 7 7 6 3
The servicewasnt
possible to beundertaken
online
The servicewas notavailable
online
I was not ableto find what Iwas looking
for
There was noonline supportto answer any
questions Imay havesuch aswebchat
I didnt haveaccess to acomputer or
an onlinedevice
The format ofcontent on the
website didnot meet my
accessrequirement
I was not sureif my
informationwould remainconfidential
No incentivewas provided
such as adiscount
The contentwas not
current andoraccurate
ADOPTING ONLINE METHODS TO INTERACT WITH SA GOVERNMENT SERVICESA main reason for consumers and businesses not using online channels to access services is a lack of online service availability
re
spon
dent
s
resp
onde
nts
59
Source Customer Service Commission Customer Satisfaction Measurement Survey 2019 Report developed in conjunction with the NSW Customer Service CommissionerPublic I1-A2
77
15 8
I chose to go online I was directed to or was prompted to go online There was no other option available
10
10
10
Avg
10
10
10
Avg
Customers were asked ldquoDid you choose to go online or were you directed to go onlinerdquo
Figure 313 Choice to go online
18
11
5
16
19
11
65
70
84
70
73
81
There wasno otheroption
available
I wasdirected to
or wasprompted
to goonline
I chose togo online
Strong disagree (1-4) Neutral (5-6) Strongly agree (7-10)
respondents
15
14
2
19
16
49
66
83
62
75
80
There wasno otheroption
available
I wasdirected or
promoted togo online
I chose togo online
respondents
Consumer Business
74
224
Figure 314 Satisfaction with using websiteapp by choice to go onlineCustomers were asked ldquoHow satisfied were you with the overall experience of using the websiteapp to complete the taskrdquo
n=843 n=220
Consumer (n=822) Business (n=218)
uarr1 darr2
24
Consumersbull 77 of consumers who used online methods chose to
go online themselves while 8 said there was no other option available to them
bull Consumers who chose to go online were more satisfied with the overall experience of using the websiteapp to complete the task (81 out of 10 ndash an increase of 03 points versus 2018)
bull There was an increase in satisfaction across all 3 types of online users ndash voluntary (78 in 2018) prompted to (72 in 2018) didnrsquot have any other option (68 in 2018)
Businessesbull Businesses saw a 7 points increase in those choosing
to go online This was due to a 5 point decrease in those saying they had no other choice and 2 point decrease in those saying they were directed to or were prompted to go online
bull Businesses who chose to go online saw a 09 point increase in satisfaction versus last year (8 out of 10 in 2019 vs 71 out of 10 In 2018)
bull Even those who said they had no other option showed higher satisfaction of 62 out of 10 (+07 points vs 2018)
uarr7
Consumer Business
darr1
darr5
CUSTOMER CHOICE TO USE ONLINE SERVICES77 of consumers and 74 of businesses chose to go online to access government services and they have the highest satisfaction
60
Source Customer Service Commission Customer Satisfaction Measurement Survey 2019 Report developed in conjunction with the NSW Customer Service CommissionerPublic I1-A2
50 4640
17
31
52 53
10
Smartphone Laptop computer Desktop computer TabletiPad
Consumer (n=843)Business (n=220)
Customers were asked ldquoWhat devices did you use to access the online content Please select all contact methods that applyrdquo
Figure 315 Devices used when dealing with SA Government services online
Figure 316 Satisfaction with online services by device used Customers were asked ldquoHow satisfied were you with the overall experience of using the websiteapp to complete the taskrdquo
re
spon
dent
s
77
79 798080
74
80
76
Smartphone Laptop computer Desktop computer TabletiPad
Consumer (n=822)Business (n=218)
Aver
age
satis
fact
ion
(out
of 1
0)
Consumer Business
Consumersbull While most consumers (50) used smartphones
to access online content their satisfaction levels with their experience was lower (77 out of 10) compared to those who used desktops or laptops to access online content (79 out of 10)
bull Few consumers are using tabletsiPad (17) but those that do have high levels of satisfaction (8 out of 10)
Businessesbull Most businesses used laptops (52) or desktops
(53) to access online content Desktop users had a higher overall satisfaction (8 out of 10) compared to laptop users (74 out of 10)
bull In contrast to consumers only 31 of businessesused smartphones to access content online however they had higher levels of satisfaction with the overall experience (8 out of 10)
DEVICE USED BY CUSTOMERS FOR ONLINE SERVICESMost consumers used smartphones but the satisfaction levels of those who used smartphones was lower than users of other channels Fewer businesses used smartphones but those that did showed higher levels of satisfaction
61
Public ndash I1-A2
SOUTH AUSTRALIAN CUSTOMER SATISFACTION MEASUREMENT SURVEY 2019
4 PUBLIC SERVICE OVERALL
Source Customer Service Commission Customer Satisfaction Measurement Survey 2019 Report developed in conjunction with the NSW Customer Service CommissionerPublic I1-A2
Customers were asked ldquoThinking about all your experiences with each of the following Australian industries and public services over the previous 12 months how satisfied would you say you are with them rdquo
Figure 41 Satisfaction with SA Public Service overall compared to industries
bull Average satisfaction with the SA Public Service lsquobrandrsquo is 66 for both consumers and businesses ndashrelatively stable versus last year
bull Both consumers and businesses continue to rate SA Public Service lsquobrandrsquo higher than most other industries and public services except airlines
bull Satisfaction with SA Government services continues to be higher than satisfaction with the lsquobrandrsquo for both consumers and businesses This suggests a continued disconnect between service delivery and lsquobrandrsquo perceptions that are influenced by a range of factors such as media and reputation
+02
31
27
22
23
21
14
8
30
34
30
30
28
30
28
39
40
47
47
51
56
64
56
57
61
61
62
66
70
Energy Retailers(n=485)
FederalGovernment
(n=465)
My local council(n=477)
Banks (n=486)
Telephone ServProviders(n=477)
SA PublicService overall
(n=484)
Airlines (n=457)
Dissatisfied (1-4) Neutral (5-6) Satisfied (7-10)
respondents Avg
Business (n=457) respondents Avg
Consumer (n=1649)
7375 00 +01
+03
+01
+01
+02
+03
+02
+02
+02
+10
+04
+05
+05
+0636
35
27
25
24
15
9
26
28
26
27
26
27
24
38
37
47
49
49
59
67
53
54
59
60
61
66
71
FederalGovernment
(n=1835)
EnergyRetailers(n=1924)
Banks(n=1934)
My local council(n=1876)
Telephone ServProviders(n=1930)
SA PublicService overall
(n=1915)
Airlines(n=1649)
Dissatisfied (1-4) Neutral (5-6) Satisfied (7-10)
SA Government Services
Average satisfaction
Consumer Business
Legend Statistically significant increase in avg from 2018 (at 99 level of Confidence)No significant change in avg from 2018 (at 99 level of Confidence)Statistically significant decrease in avg from 2018 (at 99 level of Confidence)
Consumer Business
Note scores are subject to rounding and may not sum to 100
PERCEPTIONS OF THE SA PUBLIC SERVICE lsquoBRANDrsquoBoth consumers and businesses rate the SA Public Services lsquobrandrsquo higher than all other industries and public services with the exception of airlines
63
Source Customer Service Commission Customer Satisfaction Measurement Survey 2019 Report developed in conjunction with the NSW Customer Service CommissionerPublic I1-A2
bull NSW Public Service lsquobrandrsquo has the most positive perception amongst consumers Whereas the Public Service lsquobrandsrsquo in SA is second only to Airlines as with QLD and VIC
bull Businesses also have similar perceptions of the Public Service lsquobrandrsquo across all jurisdictions In Australia the average satisfaction ratings are second to airlines Whereas in UK and NZ airlines and banks have higher average satisfaction ratings
Lowest
Highest
Avg
sat
isfa
ctio
n (b
usin
esse
s)
NZ
NZ Govt Service 68
Banks 69
Energy 66
Local council 58
Airlines 74
Telcorsquos 65
NSW
Airlines 71
NSW Public Service 69
Banks 60
Energy 57
Telcorsquos 60
Local council 61
Fed Govt 60
QLD
Airlines 71
QLD Public Service 67
Telcorsquos 61
Local council 61
Banks 57
Energy 57
Fed Govt 58
VIC
Airlines 71
VIC Public Service 65
Banks 58
Energy 57
Local council 59
Fed Govt 57
Telcorsquos 60
SA
Airlines 70
Telcorsquos 62
SA Public Service 66
Banks 61
Energy 56
Local council 61
Fed Govt 57
UK
Airlines 70
Telcorsquos 66
Energy 63
UK Public Service 68
Local Council 61
Banks 68
Business
Figure 42 Comparison of Public service brand perceptions across jurisdictionsCustomers were asked ldquoThinking about all your experiences with each of the following [jurisdiction] industries and public services over the previous 12 months how satisfied would you say you are with them rdquoConsumer
NZ
NZ Govt Service 69
Banks 69
Airlines 74
Telcorsquos 66
Energy 66
Local council 59
NSW NSW
Public Service 71
Airline 71
Telcorsquos 62
Energy 59
Local council 62
Banks 61
Fed Govt 57
QLD
Airlines 70
QLD Public Service 69
VIC SA
Airlines 71
Telcorsquos 61
SA Public Service 66
Local council 60
Banks 59
Energy 54
Fed Govt 53
UK
Airlines 71
UK Public Service 69
Banks 69
Energy 64
Telcorsquos 69
Local council 61
Consumer Business
Lowest
Highest
Avg
sat
isfa
ctio
n (c
onsu
mer
s)
Airlines 71
Telcorsquos 63
VIC Public Service 70
Banks 63
Local council 62
Energy 60
Fed Govt 59
Telcorsquos 62
Local council 62
Banks 60
Energy 59
Fed Govt 58
PUBLIC SERVICE lsquoBRANDrsquo COMPARISON BY JURISDICTIONAustralian jurisdictions perform better than NZ and UK in perceptions of their public service lsquobrandsrsquo for both consumers andbusinesses relative to other industries
64
Source Customer Service Commission Customer Satisfaction Measurement Survey 2019 Report developed in conjunction with the NSW Customer Service CommissionerPublic I1-A2
Respondents were asked to select from a list of positive and negative descriptors of SA Public Service bull The top five descriptors of the SA Public Service
overall were all positive and consistent with 2018
bull The most commonly selected negative brand descriptors are lsquoinefficientrsquo lsquoimpersonalrsquo lsquoinflexiblersquo and lsquodifficultrsquo This pattern is similar to 2018
0
10
20
30
40Innovative
Motivated
Modern
Flexible
Accountable
Caring
EfficientHonest
Respectful
Knowledgeable
Capable
Friendly
Helpful
Figure 43 Positive Descriptors of the SA Public Service overall - Consumer
Customers were asked ldquoThinking now about the SA Public Service overall and all of the services and agencies which fall under it which of the following words would you use to describe the SA Public Service rdquo
0
10
20
30
40Lazy
Controlling
Patronising
Outdated in digitalservices
Complacent
Wasteful
Inflexible
Difficult
Impersonal
Inefficient
2018 Consumer (n=1999) 2019 Consumer (n=1998)
Figure 44 Negative Descriptors of the SA Public Service overall -Consumer
Top 5 descriptors
Consumer
CONSUMER DESCRIPTIONS OF THE SA PUBLIC SERVICE lsquoBRANDrsquoThe top 5 descriptors used by consumers to describe SA Public Service are lsquohelpfulrsquo lsquofriendlyrsquo lsquocapablersquo lsquoknowledgeablersquo and lsquorespectfulrsquo
65
Source Customer Service Commission Customer Satisfaction Measurement Survey 2019 Report developed in conjunction with the NSW Customer Service CommissionerPublic I1-A2
0
10
20
30
40
Outdated in digitalservices
Patronising
Lazy
Controlling
Complacent
Difficult
Inflexible
Impersonal
Wasteful
Inefficient
2018 Business (n=551) 2019 Business (n=502)
bull In contrast to last year businesses have described SA Public services more positively this year
bull All positive attributes have seen an increase in proportion of responses with the exception of lsquoinnovativersquo (-2 points vs last year) and lsquoaccountablersquo (-2 points vs last year)
bull The top 5 descriptors are lsquohelpfulrsquo (+6 points vs last year) lsquofriendlyrsquo (+4 points vs last year) lsquocapablersquo (+9 points vs last year) lsquoknowledgeablersquo (+3 points vs last year) and lsquorespectfulrsquo (+3 points vs last year)
bull Conversely all negative attributes have seen a decrease in proportion of responses compared to last year
0
10
20
30
40Innovative
Motivated
Modern
Flexible
Caring
Accountable
EfficientHonest
Respectful
Knowledgeable
Capable
Friendly
Helpful
Figure 45 Positive descriptors of the SA Public Service overall - business
Businesses were asked ldquoThinking now about the SA Public Service overall and all of the services and agencies which fall under it which of the following words would you use to describe the SA Public Service rdquo
Figure 46 Negative descriptors of the SA Public Service overall - business
Top 5 descriptors
Business
BUSINESS DESCRIPTIONS OF THE SA PUBLIC SERVICE lsquoBRANDrsquoThe top 5 descriptors used by businesses to describe SA Public Service are lsquohelpfulrsquo lsquofriendlyrsquo lsquocapablersquo lsquoknowledgeablersquo andlsquorespectfulrsquo
66
Public ndash I1-A2
SOUTH AUSTRALIAN CUSTOMER SATISFACTION MEASUREMENT SURVEY 2019
5 FEEDBACK
Source Customer Service Commission Customer Satisfaction Measurement Survey 2019 Report developed in conjunction with the NSW Customer Service CommissionerPublic I1-A2
NATURE OF FEEDBACK AND FEEDBACK CHANNELSProcesses are the most common source of complaints while employees are a more common source of compliments
68
Consumersbull Processes are the most common source of
complaints Consumers also complain about outcomes of their interactions
bull Compliments mainly relate to interactions with employees
bull Both complaints and compliments are mainly made in person whereas consumers take to emails to make suggestions for change
Businessesbull Complaints and suggestions are mainly made
about processes and outcomes of interactions
bull Compliments most often relate to the information available to businesses
bull As with consumers businesses complain or compliment mostly in-person
bull Businesses also use email to give compliments and emails are the preferred method to make suggestions
11
44
28
16
2
42
14
23
18
3
32
17
28
12
11
Theprocesses
Theemployees
youinteracted
with
Theoutcomes of
yourinteraction
Informationavailable to
you
Other
I gave a compliment I made a suggestion for change I made a complaint
22
22 26
30
0
47
17
14
22
0
36
18
33
13
0
Theprocesses
Theemployees
youinteracted
with
Theoutcomes of
yourinteraction
Informationavailable to
you
Other
Figure 51 Nature of feedback by feedback typeQuestion ldquoWhat did your feedback primarily relate to rdquo
Consumer (n = 519) Business (n = 192)
2242
30
5233
38
17 1416
4 6 105 4 5
I gave acompliment
I made asuggestion for
change
I made acomplaint
37 41 37
37 29 45
5 19921 11 5
04
I gave acompliment
I made asuggestion for
change
I made acomplaint
bull Other
bull Via postal letter
bull Via servicersquos website
bull In person face to face or via the phone
bull Via email
Figure 52 Nature of feedback and feedback channelsQuestion ldquoHow did you provide your feedbackrdquo
Consumer (n=519) Business (n=194)
Consumer Business
Source Customer Service Commission Customer Satisfaction Measurement Survey 2019 Report developed in conjunction with the NSW Customer Service CommissionerPublic I1-A2
37
44
3538
45
4041
3633
4036
42
21 20
31
2219 18
NSW (n=529) VIC (n=186) QLD (n=184) UK (n=456) SA (n=194) NZ (n=215)
Complaint Suggestion for change Compliment
28 28 29
33 33
2829
37
27 28 28
33
43
35
44
39 39 39
NSW (n=1203) VIC (n=569) QLD (n=528) UK (n=619) SA (n=519) NZ (n=520)
Complaint Suggestion for change Compliment
Figure 53 Overall satisfaction with Government services by contact method(s) used across jurisdictions
o
ffee
dbac
k ev
er re
ceiv
ed
of f
eedb
ack
ever
rece
ived
Consumer (Base Consumers in each jurisdiction who ever provided feedback)
Business (Base Businesses in each jurisdiction who ever provided feedback)
Consumer Business
JURISDICTIONAL COMPARISON OF NATURE OF FEEDBACKOf all jurisdictions SA received the highest proportion of complaints from both consumers and businesses
Consumersbull Compliments form the highest
proportion of all feedback received across all jurisdictions except VIC
bull Across jurisdictions SA and UK received the highest proportion of complaints
bull QLD was the jurisdiction to receive the highest proportion of compliments closely followed by NSW
Businessesbull Unlike consumers complaints and
suggestions form most of the feedback received from businesses
bull SA received the highest proportion of complaints Closely followed by VIC
bull QLD was the jurisdiction where businesses gave the highest proportion of compliments
69
Source Customer Service Commission Customer Satisfaction Measurement Survey 2019 Report developed in conjunction with the NSW Customer Service CommissionerPublic I1-A2
41
23
36
handled poorly (1-4)2neutral (5-6)Handled well (7-10)
Consumersbull Most consumers who gave feedback
(39) gave a compliment
bull Complaints make up 33 of all feedback This is consistent with last year
bull Of consumers who complained 41 said their complaint was handled poorly However this is an improvement from last year where 54 had said their feedback was handled poorly
Businessesbull In contrast the proportion of feedback
from businesses that were complaints went up to 42 from 27 last year
bull Of this 44 said their feedback was handled poorly ndash up from 38 in the last year
23
35
42
39
28
33
bull I gave a compliment
bull I made a suggestion for change
bull I made a complaint
Consumer (n=519)
Business (n=194)
Figure 5455 Complaint handling of consumers and businessesQuestion ldquoHow well or poorly was your most recent complaint handledFigure 56 Proportion of feedback types for consumers and businessesQuestion ldquoWhat was the nature of your feedbackrdquo
Base n=169 consumers who made a complaint
Base n=83 businesses who made a complaint
Base n=519 consumers and n=194 businesses who ever
provided feedback
Figure 56 Figure 55Figure 54
Consumer Business
44
24
32
handled poorly (1-4)2neutral (5-6)Handled well (7-10)
COMPLAINT HANDLING EXPERIENCE41 of consumers and 44 of businesses said their complaints had been handled poorly
70
Source Customer Service Commission Customer Satisfaction Measurement Survey 2019 Report developed in conjunction with the NSW Customer Service CommissionerPublic I1-A2
Customers were asked ldquoHow well or poorly was your most recent complaint handledrdquo
Figure 57 Variation in complaints handling across jurisdictions
Consumer
Business
Consumersbull VIC had the highest proportion of positive
ratings from consumers in relation to complaints handling (44 rated 7-10 out of 10) SA was second with 36 of complaints being handled well
bull The average rating was neutral (52 out of 10) ndash an improvement of 08 points compared to last year (44 out of 10) This was second highest behind VIC
Businessesbull The average rating was just below neutral at
49 out of 10 However this is an improvement of 02 points compared to last year (47 out of 10)
bull Of the Australian jurisdictions SA has the lowest proportion of poorly handled complaints and the highest average rating
bull UK has the lowest proportion of poorly handled complaints and the highest average rating of 53 out of 10 of all jurisdictions
39 41 41 46 50 55
17 2325
23 23 17
44 36 34 30 28 28
5652
50
48 45 43
1
10
0
50
100
VIC(n=154)
SA(n=169)
UK(n=196)
NZ(n=138)
QLD(n=140)
NSW(n=314)
Handled poorly (1-4) Neutral (5-6) Handled well (7-10) Average
Axis
1
Perc
enta
ge o
f re
spon
ses
Axis 2 Average score
35 44 49 45 50 52
24 2415
3418 22
41 32 3621
32 26
53 49
49
48 46 45
1
10
0
50
100
UK(n=174)
SA(n=83)
QLD(n=72)
VIC(n=69)
NSW(n=184)
NZ(n=76)
Handled well (7-10) Neutral (5-6) Handled poorly (1-4) Average
Axis
1
Perc
enta
ge o
f re
spon
ses
Axis 2 Average score
Responses were provided according to a scale from 1 (handled very poorly) to 10 (handled very well)
Consumer Business
COMPARISON OF PERFORMANCE IN COMPLAINTS MANAGEMENT ACROSS JURISDICTIONSFor consumers SA had the second highest proportion of complaints being handled well behind VIC For businesses SA had the lowest proportion of poorly handled complaints compared to all jurisdictions
71
Source Customer Service Commission Customer Satisfaction Measurement Survey 2019 Report developed in conjunction with the NSW Customer Service CommissionerPublic I1-A2
Customers were asked ldquoHow well or poorly was your most recent complaint handledrdquo
Figure 58 Variation in complaints handling by region
Consumer
Business
bull In metro areas over 40 of both consumers and businesses rated their complaints as being handled poorly (1-4 out of 10)
bull Sample sizes for both consumers and businesses in rural and regional SA are too small to be statistically representative and cannot be evaluated meaningfully
4626 22
17 41
44
37 32 34
50 56
58
1
10
0
50
100
Metro(n=139)
Regional(n=14)
Rural(n=16)
Handled poorly (1-4) Neutral (5-6) Handled well (7-10) Average
Axis
1
Perc
enta
ge o
f re
spon
ses
Axis 2 Average score
45
100
29
28
57
47
11
66
1
10
0
50
100
Metro(n=67)
Regional(n=4)
Rural(n=12)
Handled well (7-10) Neutral (5-6) Handled poorly (1-4) Average
Axis
1
Perc
enta
ge o
f re
spon
ses
Axis 2 Average score
Responses were provided according to a scale from 1 (handled very poorly) to 10 (handled very well)Note interpret with caution when sample size is lower than n =30
Consumer Business
COMPARISON OF PERFORMANCE IN COMPLAINTS MANAGEMENT BY REGION46 of consumers and 45 of businesses in Metro areas say their complaints were handled poorly
72
Source Customer Service Commission Customer Satisfaction Measurement Survey 2019 Report developed in conjunction with the NSW Customer Service CommissionerPublic I1-A2
Customers were asked ldquoHow difficult or easy was it to make your complaintrdquoFigure 59 Variation in ease of making a complaint across jurisdictions
Consumer
Business
Consumersbull 51 of consumers who made a complaint said it was
easy to do so (7-10 out of 10) This is an improvement from 34 in 2018
bull The average rating was neutral (61 out of 10) This is an improvement of 08 points compared to last year (53 out of 10 in 2018)
bull VIC had the highest proportion of consumers saying it was easy to make a complaint (56) Whereas NSW was the jurisdiction with the lowest proportion of consumers saying so (47)
Businessesbull 46 of businesses in SA who made a complaint said it
was easy to do so (7-10 out of 10) This is an improvement from 37 in 2018
bull 36 rated it as difficult (1-4 out of 10) ndash this is 2 points higher than last year (34) and makes SA the jurisdiction with the second highest proportion of lsquodifficultrsquo ratings behind QLD
bull Improvement in the proportion of businesses rating the process as lsquoeasyrsquo has pushed the average rating to 55 out of 10 (vs 47 out of 10 last year) However SA continues to be the jurisdiction with the lowest rating as other jurisdictions have also seen an improvement in their average rating
26 28 29 31 31 33
18 21 18 19 23 26
5651 54 50
47 4065 61 61 59 58 56
1
10
0
50
100
VIC(n=159)
SA(n=174)
NZ(n=148)
UK(n=199)
NSW(n=333)
QLD(n=150)
Easy (7-10) Neutral (5-6) Difficult (1-4) Average
21 28 25 31 37 36
30 19 29 24 31 17
4953 46 45 33
4662 61 59 58 55 55
1
10
0
50
100
NZ(n=78)
UK(n=176)
VIC(n=70)
NSW(n=188)
QLD(n=74)
SA(n=83)
Easy (7-10) Neutral (5-6) Difficult (1-4) Average
Responses were provided according to a scale from 1 (very difficult) to 10 (very easy)
Axis 2 Average scoreAxis 2 Average score
Axis
1
Perc
enta
ge o
f re
spon
ses
Axis
1
Perc
enta
ge o
f re
spon
ses
Consumer Business
COMPARISON OF PERFORMANCE IN EASE OF MAKING A COMPLAINT ACROSS JURISDICTIONSIn SA 51 of consumers said it was easy to make a complaint 46 of businesses echoed the sentiment ndash an improvement from 37 last year
73
Source Customer Service Commission Customer Satisfaction Measurement Survey 2019 Report developed in conjunction with the NSW Customer Service CommissionerPublic I1-A2
10
1
1
1
1
1
1
1
2
2
2
3
3
3
3
4
5
5
5
6
8
8
12
13
Other (n=57)
State Emergency Services (n=4)
Agricultural Advice and Fundinghellip
Environment and Wildlifehellip
Business Advisory Services (n=2)
Prisons (n=4)
Fire Brigades (n=4)
Child Welfare Services (n=9)
Courts (n=10)
Art Galleries and Museumshellip
Documentation Services (n=9)
Consumer Affairs (Fair Trading)hellip
Ambulance Services (n=17)
TAFE Services (n=23)
Services for Older People (n=20)
Major Roads (n=26)
Public Housing (n=25)
Disability Services (n=29)
Police (n=27)
Public Schools (n=33)
Water Supply (n=45)
Vehicle Licensing andhellip
Public Transport (n=63)
Public Hospitals (n=81)
13
1
1
1
1
1
2
2
2
2
3
3
5
5
5
5
6
6
7
7
9
15
Other (n=26)
Art Galleries (n=1)
Prisons (n=2)
Business Adv Serv (n=2)
Environ Protectn (n=5)
Ambulance Services (n=3)
Agri Advice and Funding (n=2)
Courts (n=4)
Vehicle Licensing amp Reg (n=8)
Child Welfare Services (n=5)
Documentation Services (n=3)
Disability Services (n=10)
Police (n=14)
TAFE Services (n=14)
Serv for Older (n=7)
Major Roads (n=11)
Public Transport (n=16)
Public Housing (n=8)
Public Hospitals (n=16)
Public Schools (n=8)
Consumer Affairs (n=12)
Water Supply (n=25)
Consumersbull Similar to last year Public Hospitals Public
Transport and Vehicle Licensing and Registration accounted for 30 of the most recent complaints received
bull Public Hospitals saw an increase of 1 points and Public Transport saw an increase of 2 points versus last year
bull Complaints to Vehicle Licensing declined by 2 points
Businessesbull Water Supply continued to receive the most
complaints and showed an increase of 3 points versus last year
Note that sample sizes are low for these services and while results may not be statistically representative they indicate potential trends to be investigated more robustly
Figure 512 Volume of complaints across servicesCustomers that had made a complaint in the past were asked ldquoWhich SA Government Department or Agency did you most recently complain tordquo
respondents respondentsConsumer Business
Note interpret with caution when sample size is lower than n =30 All businesses results have been provided for indicative purposes only as the sample size for all services is lt30
Data unavailable as nlt10
Consumer Business
VARIATION IN COMPLAINTS ACROSS SA GOVERNMENT SERVICESPublic Hospitals receive the highest proportion of complaints from consumers and Water Supply receive the highest proportion ofcomplaints from businesses
74
Public ndash I1-A2
SOUTH AUSTRALIAN CUSTOMER SATISFACTION MEASUREMENT SURVEY 2019
The data in this chapter compares the perceptions of SA government services Where sample sizes for segments are low (lt30) data is provided for indicative purposes only
APPENDIX 1ANALYSIS BY SERVICE
Source Customer Service Commission Customer Satisfaction Measurement Survey 2019 Report developed in conjunction with the NSW Customer Service CommissionerPublic I1-A2
Consumer
91 9087 87
8076 76 75 74 74 73 73 73 73 73
70 68 66 65 63 63
54
45
10
20
30
40
50
60
70
80
90
100
0
25
50
75
100
Fire
Brig
ades
(n=2
4)
Stat
e Em
erge
ncy
Serv
ices
(n=4
7)
Ambu
lanc
e Se
rvic
es (n
=208
)
Art G
alle
ries
and
Mus
eum
s (n
=121
)
Vehi
cle
Lice
nsin
g an
d R
egis
tratio
n (n
=580
)
Publ
ic S
choo
ls (n
=228
)
Wat
er S
uppl
y (n
=240
)
Polic
e (n
=217
)
Publ
ic H
ospi
tals
(n=4
12)
Publ
ic T
rans
port
(n=3
90)
Con
sum
er A
ffairs
(n=3
8)
Doc
umen
tatio
n Se
rvic
es (n
=42)
Envi
ronm
ent a
nd W
ildlif
e Pr
otec
tion
(n=3
8)
Busi
ness
Adv
isor
y Se
rvic
es (n
=17
)
Serv
ices
for O
lder
Peo
ple
(n=1
14)
TAFE
Ser
vice
s (n
=126
)
Agric
ultu
ral A
dvic
e an
d Fu
ndin
g Se
rvic
es (n
=13
)
Dis
abilit
y Se
rvic
es (n
=100
)
Maj
or R
oads
(n=8
6)
Publ
ic H
ousi
ng (n
=87)
Cou
rts (n
=94)
Pris
ons
(n=2
3)
Chi
ld W
elfa
re S
ervi
ces
(n=5
2)
Dissatisfied (1-4) Neutral (5-6) Satisfied (7-10) Average
Axis
1
Perc
enta
ge o
f res
pons
es
Axis 2 Average Score
Figure 1 Variation in consumersrsquo satisfaction across SA Government Services
Customers were asked ldquoThinking about your experiences in the last 12 months how satisfied would you say you are with each of the following services in SArdquo
VARIATION IN CONSUMERSrsquo SATISFACTION ACROSS SERVICESAcross SA Government services consumersrsquo satisfaction is highest for Fire Brigades State Emergency Services Ambulance Services and Art Galleries and Museums
Average SA consumer satisfaction ndash 75 (n=3297)
Note Interpret with caution Very small number of responses (nlt=30) 76
Source Customer Service Commission Customer Satisfaction Measurement Survey 2019 Report developed in conjunction with the NSW Customer Service CommissionerPublic I1-A2
Consumer
Figure 2 Variation in customersrsquo expectation across SA Government Services
Customers were asked ldquoThinking about each of the following services in SA how would you rate your expectation of overall quality of servicerdquo
VARIATION IN CONSUMERSrsquo EXPECTATION ACROSS SERVICESConsumers have higher expectations of overall service quality from Fire Brigade State Emergency Services Ambulance Services and Art Galleries amp Museums This is consistent with the high satisfaction ratings these services have
93 91 90 88
8279 78 78 77 77 77 76 76 75 73 72 71 70 70 70 67 67
52
1
2
3
4
5
6
7
8
9
10
0
25
50
75
100
Fire
Brig
ades
(n=2
4)
Stat
e Em
erge
ncy
Serv
ices
(n=4
5)
Ambu
lanc
e Se
rvic
es (n
=205
)
Art G
alle
ries
and
Mus
eum
s (n
=121
)
Vehi
cle
Lice
nsin
g an
d R
egis
tratio
n (n
=574
)
Publ
ic S
choo
ls (n
=223
)
Polic
e (n
=216
)
Wat
er S
uppl
y (n
=234
)
Con
sum
er A
ffairs
(n=3
7)
Publ
ic H
ospi
tals
(n=4
08)
Serv
ices
for O
lder
Peo
ple
(n=1
13)
Doc
umen
tatio
n Se
rvic
es (n
=42)
Publ
ic T
rans
port
(n=3
83)
Envi
ronm
ent a
nd W
ildlif
e Pr
otec
tion
(n=3
7)
Busi
ness
Adv
isor
y Se
rvic
es (n
=17
)
TAFE
Ser
vice
s (n
=125
)
Maj
or R
oads
(n=8
1)
Cou
rts (n
=89)
Agric
ultu
ral A
dvic
e an
d Fu
ndin
g Se
rvic
es (n
=13
)
Dis
abilit
y Se
rvic
es (n
=96)
Pris
ons
(n=2
1)
Publ
ic H
ousi
ng (n
=86)
Chi
ld W
elfa
re S
ervi
ces
(n=5
1)
Low (1-4) Medium (5-6) High (7-10) Average
Axis
1
Perc
enta
ge o
f res
pons
es
Axis 2 Average Score
Average SA consumer expectation ndash 78 (n=3241)
Note Interpret with caution Very small number of responses (nlt=30) 77
Source Customer Service Commission Customer Satisfaction Measurement Survey 2019 Report developed in conjunction with the NSW Customer Service CommissionerPublic I1-A2
VARIATION IN CONSUMERSrsquo COMPARISON TO AN IDEAL SERVICE ACROSS SERVICESConsumers perceive State Emergency Services Fire Brigades Ambulance Services and Art Galleries and Museums to be performing closest to an ideal service This is consistent with findings relating to satisfaction and expectation
Figure 3 Consumersrsquo comparison to an ideal service across services
Customers are asked ldquoNow forgetting for a moment these specific services please imagine an ideal service How well do you think each service in SA compares with that ideal servicerdquo
9086 85 83
77 76 75 74 73 73 71 69 69 69 67 67 66 6459 59 57
54
44
1
2
3
4
5
6
7
8
9
10
0
25
50
75
100
Stat
e Em
erge
ncy
Serv
ices
(n=4
6)
Fire
Brig
ades
(n=2
3)
Ambu
lanc
e Se
rvic
es (n
=205
)
Art G
alle
ries
and
Mus
eum
s (n
=119
)
Vehi
cle
Lice
nsin
g an
d R
egis
tratio
n (n
=560
)
Busi
ness
Adv
isor
y Se
rvic
es (n
=17
)
Polic
e (n
=207
)
Doc
umen
tatio
n Se
rvic
es (n
=42)
Publ
ic S
choo
ls (n
=216
)
Agric
ultu
ral A
dvic
e an
d Fu
ndin
g Se
rvic
es (n
=12
)
Wat
er S
uppl
y (n
=226
)
Publ
ic T
rans
port
(n=3
80)
Publ
ic H
ospi
tals
(n=3
97)
TAFE
Ser
vice
s (n
=122
)
Con
sum
er A
ffairs
(n=3
6)
Serv
ices
for O
lder
Peo
ple
(n=1
09)
Envi
ronm
ent a
nd W
ildlif
e Pr
otec
tion
(n=3
7)
Dis
abilit
y Se
rvic
es (n
=96)
Cou
rts (n
=89)
Publ
ic H
ousi
ng (n
=82)
Maj
or R
oads
(n=8
1)
Pris
ons
(n=1
9)
Chi
ld W
elfa
re S
ervi
ces
(n=5
1)
Not close to ideal (1-4) Neutral (5-6) Very close to ideal (7-10) Average
Axis
1
Perc
enta
ge o
f res
pons
es
Axis 2 Average Score
Average SA consumer ideal ndash 72 (n=3172)
Consumer
Note Interpret with caution Very small number of responses (nlt=30) 78
Source Customer Service Commission Customer Satisfaction Measurement Survey 2019 Report developed in conjunction with the NSW Customer Service CommissionerPublic I1-A2
VARIATION IN CONSUMERSrsquo ldquoEXPECTATION GAPrdquo ACROSS SERVICESAcross all services consumers have a negative ldquoexpectation gaprdquo
-13
-07
-07
-07
-04
-04
-04
-03
-03
-03
-03
-03
-03
-03
-03
-02
-02
-02
-02
-02
-01
-01
00
-15 -1 -05 0 05 1 15
Prisons (n=21)
Courts (n=89)
Child Welfare Services (n=51)
Major Roads (n=81)
Services for Older People (n=113)
Consumer Affairs (n=37)
Public Housing (n=86)
Police (n=216)
Documentation Services (n=42)
Public Schools (n=223)
Ambulance Services (n=205)
Disability Services (n=96)
Public Hospitals (n=408)
Environment and Wildlife Protection (n=37)
TAFE Services (n=125)
Agricultural Advice and Funding Services (n=13)
Fire Brigades (n=24)
Water Supply (n=234)
Art Galleries and Museums (n=121)
Public Transport (n=383)
Vehicle Licensing and Registration (n=574)
Business Advisory Services (n=17)
State Emergency Services (n=45)
Figure 4 Consumer gap to expectation by servicesThe gap between satisfaction and expectation provides an understanding of how customers perceive their recent experience compares to expectationsThe gap to expectation is calculated individually for each customers as Gap = satisfaction score ndash expectation score
Consumer
Note Interpret with caution Very small number of responses (nlt=30)
79
Source Customer Service Commission Customer Satisfaction Measurement Survey 2019 Report developed in conjunction with the NSW Customer Service CommissionerPublic I1-A2
91 9187
82 80 80 7975 74 74 74 74 74 72 72 71 71 70 69 67 66
6155
1
2
3
4
5
6
7
8
9
10
0
25
50
75
100
Fire
Brig
ades
(n=1
5)
Ambu
lanc
e Se
rvic
es (n
=24
)
Stat
e Em
erge
ncy
Serv
ices
(n=1
3)
Art G
alle
ries
and
Mus
eum
s (n
=13
)
Doc
umen
tatio
n Se
rvic
es (n
=17
)
Polic
e (n
=35)
Pris
ons
(n=1
4)
Con
sum
er A
ffairs
(n=2
7)
Envi
ronm
ent a
nd W
ildlif
e Pr
otec
tion
(n=1
9)
Maj
or R
oads
(n=1
1)
Dis
abilit
y Se
rvic
es (n
=34)
Wat
er S
uppl
y (n
=67)
Cou
rts (n
=19
)
Publ
ic T
rans
port
(n=4
7)
Busi
ness
Adv
isor
y Se
rvic
es (n
=35)
Vehi
cle
Lice
nsin
g an
d R
egis
tratio
n (n
=135
)
Serv
ices
for O
lder
Peo
ple
(n=2
8)
Chi
ld W
elfa
re S
ervi
ces
(n=2
0)
Publ
ic H
ospi
tals
(n=7
6)
TAFE
Ser
vice
s (n
=36)
Publ
ic S
choo
ls (n
=51)
Agric
ultu
ral A
dvic
e an
d Fu
ndin
g Se
rvic
es (n
=10
)
Publ
ic H
ousi
ng (n
=16
)
Dissatisfied (1-4) Neutral (5-6) Satisfied (7-10) Average
Axis
1
Perc
enta
ge o
f res
pons
es
Axis 2 Average Score
Figure 5 Variation in businessesrsquo satisfaction across SA Government Services
Customers were asked ldquoThinking about your experiences in the last 12 months how satisfied would you say you are with each of the following services in SArdquo
Average SA business satisfaction ndash 73 (n=762)
VARIATION IN BUSINESSESrsquo SATISFACTION ACROSS SERVICES
Business
Note Interpret with caution Very small number of responses (nlt=30)
Of the services with sufficient sample size (ngt30) Police Disability Services and Water Supply have above average satisfaction scores
80
Source Customer Service Commission Customer Satisfaction Measurement Survey 2019 Report developed in conjunction with the NSW Customer Service CommissionerPublic I1-A2
Figure 6 Variation in businessesrsquo expectation across SA Government Services
Customers were asked ldquoThinking about each of the following services in SA how would you rate your expectation of overall quality of servicerdquo
VARIATION IN BUSINESSESrsquo EXPECTATION ACROSS SERVICESOf the services with sufficient (ngt30) sample sizes Police Disability Services Water Supply and Public Transport have above average expectation scores
91 90 8784 83 83 81 79 79 78 77 77 76 75 75 75 75 75 74 72 70 70 68
1
2
3
4
5
6
7
8
9
10
0
25
50
75
100
Fire
Brig
ades
(n=1
5)
Ambu
lanc
e Se
rvic
es (n
=24
)
Stat
e Em
erge
ncy
Serv
ices
(n=1
3)
Art G
alle
ries
and
Mus
eum
s (n
=13
)
Doc
umen
tatio
n Se
rvic
es (n
=17
)
Pris
ons
(n=1
3)
Polic
e (n
=35)
Dis
abilit
y Se
rvic
es (n
=33)
Cou
rts (n
=19
)
Envi
ronm
ent a
nd W
ildlif
e Pr
otec
tion
(n=1
9)
Con
sum
er A
ffairs
(n=2
7)
Wat
er S
uppl
y (n
=67)
Publ
ic T
rans
port
(n=4
7)
Vehi
cle
Lice
nsin
g an
d R
egis
tratio
n (n
=134
)
Serv
ices
for O
lder
Peo
ple
(n=2
8)
Busi
ness
Adv
isor
y Se
rvic
es (n
=35)
Maj
or R
oads
(n=1
1)
Chi
ld W
elfa
re S
ervi
ces
(n=2
0)
Agric
ultu
ral A
dvic
e an
d Fu
ndin
g Se
rvic
es (n
=10
)
Publ
ic H
ospi
tals
(n=7
5)
Publ
ic S
choo
ls (n
=51)
Publ
ic H
ousi
ng (n
=16
)
TAFE
Ser
vice
s (n
=36)
High (7-10) Medium (5-6) Low (1-4) Average
Axis
1
Perc
enta
ge o
f res
pons
esAxis 2 Average Score
Average SA business expectation ndash76 (n=758)
Business
Note Interpret with caution Very small number of responses (nlt=30)
81
Source Customer Service Commission Customer Satisfaction Measurement Survey 2019 Report developed in conjunction with the NSW Customer Service CommissionerPublic I1-A2
95
87 8580 80 78 78
75 73 73 73 71 71 70 70 70 69 69 6966 66 65
59
1
2
3
4
5
6
7
8
9
10
0
25
50
75
100
Fire
Brig
ades
(n=1
5)
Ambu
lanc
e Se
rvic
es (n
=23
)
Stat
e Em
erge
ncy
Serv
ices
(n=1
2)
Art G
alle
ries
and
Mus
eum
s (n
=13
)
Polic
e (n
=33)
Envi
ronm
ent a
nd W
ildlif
e Pr
otec
tion
(n=1
7)
Doc
umen
tatio
n Se
rvic
es (n
=17
)
Cou
rts (n
=18
)
Publ
ic T
rans
port
(n=4
5)
Pris
ons
(n=1
4)
Vehi
cle
Lice
nsin
g an
d R
egis
tratio
n (n
=132
)
Agric
ultu
ral A
dvic
e an
d Fu
ndin
g Se
rvic
es (n
=10
)
Busi
ness
Adv
isor
y Se
rvic
es (n
=34)
Wat
er S
uppl
y (n
=63)
TAFE
Ser
vice
s (n
=33)
Serv
ices
for O
lder
Peo
ple
(n=2
8)
Maj
or R
oads
(n=1
1)
Con
sum
er A
ffairs
(n=2
5)
Dis
abilit
y Se
rvic
es (n
=32)
Chi
ld W
elfa
re S
ervi
ces
(n=2
0)
Publ
ic H
ospi
tals
(n=7
3)
Publ
ic S
choo
ls (n
=48)
Publ
ic H
ousi
ng (n
=16
)
Not close to ideal (1-4) Neutral (5-6) Very close to ideal (7-10) Average
Figure 7 Businessesrsquo comparison to an ideal service across services
Customers are asked ldquoNow forgetting for a moment these specific services please imagine an ideal service How well do you think each service in SA compares with that ideal servicerdquo
VARIATION IN BUSINESSESrsquo COMPARISON TO AN IDEAL SERVICE ACROSS SERVICESOf the services with sufficient (ngt30) sample sizes Police Public Transport and Vehicle Licensing and Registration have above average scores of comparison to ideal service
Axis
1
Perc
enta
ge o
f res
pons
esAxis 2 Average Score
Average SA business ideal ndash 72 (n=732)
Business
Note Interpret with caution Very small number of responses (nlt=30)
82
Source Customer Service Commission Customer Satisfaction Measurement Survey 2019 Report developed in conjunction with the NSW Customer Service CommissionerPublic I1-A2
Figure 8 Business gap to expectation by servicesThe gap between satisfaction and expectation provides an understanding of how customers perceive their recent experience compares to expectations The gap to expectation is calculated individually for each customers as Gap = satisfaction score ndash expectation score
VARIATION IN BUSINESSESrsquo ldquoEXPECTATION GAPrdquo ACROSS SERVICES
-13-05
-05-05-05
-04-04-04
-03-03-03-03-03-03
-02-02
-01-01-01
0000
01
-15 -1 -05 0 05 1 15
Public Housing (n=16)Agricultural Advice and Funding Services (n=10)
Disability Services (n=33)Courts (n=19)
Child Welfare Services (n=20)Public Schools (n=51)
Services for Older People (n=28)Vehicle Licensing and Registration (n=134)
Environment and Wildlife Protection (n=19)Documentation Services (n=17)
Public Transport (n=47)Business Advisory Services (n=35)
Public Hospitals (n=75)Prisons (n=13)
Water Supply (n=67)Consumer Affairs (n=27)
Art Galleries and Museums (n=13)TAFE Services (n=36)
Major Roads (n=11)Police (n=35)
Fire Brigades (n=15)State Emergency Services (n=13)
Ambulance Services (n=24)
Business
Note Interpret with caution Very small number of responses (nlt=30)
Majority of services have a negative lsquoexpectation gaprsquo from businesses However the sample sizes are low and observations are only indicative
83
Source Customer Service Commission Customer Satisfaction Measurement Survey 2019 Report developed in conjunction with the NSW Customer Service CommissionerPublic I1-A2
Average score higherlower compared to overall SA average
VARIATION IN CONSUMERSrsquo VIEWS OF EMPLOYEE PERFROMANCE ACROSS SERVICES
Customers are asked ldquoThinking now about its employees to what extent do you agree or disagree that each of the following statements describes [a particular government service] in SArdquo
Figure 9 Performance of SA Government Services against each of the employee attributes
Responses were provided according to a scale from 1 (strongly disagree) to 10 (strongly agree) The average score against each attribute by service is tabulated Note this analysis represents consumer data only
Base Consumers (n=2727)
Note Very small number of responses (nlt=30)
Services
Honesty and Integrity of Employees Efficiency and Effectiveness Communication of Employees Fairness and Empathy of employees
Are honest
Deliver high safety standards
Provide good value
services
Are reliable
Get things done as quickly as
possible
Held Accountable
Explain intended
actions clearlyAre consistent
Engender confidence in
their knowledge
Communicate well
Provide services
without bias
See things from my perspective
Agricultural Advice and Funding Services 80 71 80 74 74 82 74 79 74 81 68 68
Ambulance Services 92 92 88 89 90 87 90 89 90 90 92 84Art Galleries and Museums 87 87 87 85 79 81 83 84 84 85 84 81Business Advisory Services 73 72 69 76 70 70 74 73 73 75 69 66Child Welfare Services 53 55 50 47 43 50 53 45 51 55 52 50Consumer Affairs 74 71 71 71 64 67 74 74 73 72 73 66Courts 71 72 64 67 59 60 73 64 72 74 71 60Disability Services 71 67 63 63 56 58 64 61 65 65 68 63Documentation Services 78 77 69 72 62 69 70 71 73 71 76 67Environment and Wildlife Protection 70 71 69 70 65 66 65 76 68 73 69 66Fire Brigades 93 96 95 94 93 90 88 89 93 92 91 85Major Roads 69 64 61 61 52 55 63 67 60 63 70 58Police 75 77 74 74 68 71 74 71 73 73 71 68Prisons 56 78 66 68 59 56 69 65 60 64 64 64Public Hospitals 79 78 78 75 70 73 77 74 77 75 78 71Public Housing 65 64 63 60 57 55 65 62 62 61 62 55Public Schools 76 75 73 72 69 70 73 70 72 73 70 69Public Transport 73 73 72 69 68 68 71 70 70 70 75 67Services for Older People 76 73 74 72 66 68 74 72 72 74 77 72State Emergency Services 92 94 92 93 90 91 90 92 90 90 92 87TAFE Services 73 73 72 68 64 71 69 69 71 70 74 67Vehicle Licensing and Registration 80 78 74 78 73 73 78 77 76 76 79 72Water Supply 74 74 69 71 65 67 71 73 73 72 76 69Overall average 77 76 74 74 69 70 75 73 74 74 76 70
Consumer
Note Interpret with caution Very small number of responses (nlt=30)
Ambulance Services Art Galleries and Museums State Emergency Services and Fire Brigades perform well against employee attributes
84
Source Customer Service Commission Customer Satisfaction Measurement Survey 2019 Report developed in conjunction with the NSW Customer Service CommissionerPublic I1-A2
Customers are asked ldquoThinking about the values that they uphold to what extent would you agree with each of the following statements when thinking about [a particular government service] in SArdquo
Figure 10 Performance of SA Government Services against values
Responses were provided according to a scale from 1 (strongly disagree) to 10 (strongly agree) The average score against each attribute by service is tabulated Note this analysis represents consumer data only
Services
Accountability and Service quality
Is a body I can trust Operates with integrity Is accountable for its services Provides good values services
Agricultural Advice and Funding Services 77 78 75 76
Ambulance Services 91 90 90 89
Art Galleries and Museums 85 85 84 86
Business Advisory Services 72 74 71 74
Child Welfare Services 41 48 46 45
Consumer Affairs 67 68 64 70
Courts 64 66 59 64
Disability Services 61 63 61 59
Documentation Services 71 72 69 70
Environment and Wildlife Protection 65 64 61 64
Fire Brigades 92 92 91 94
Major Roads 58 59 58 58
Police 73 73 70 73
Prisons 55 62 62 61
Public Hospitals 74 75 71 73
Public Housing 58 57 57 58
Public Schools 73 74 72 74
Public Transport 67 69 67 70
Services for Older People 68 71 66 69
State Emergency Services 92 92 90 92
TAFE Services 69 69 68 70
Vehicle Licensing and Registration 75 75 73 74
Water Supply 67 68 64 68
Overall average 72 73 70 72
Average score higherlower compared to overall SA average
Base Consumers (n=2936)
VARIATION IN CONSUMERSrsquo VIEWS OF PERFORMANCE AGAINST VALUES ACROSS SERVICESConsumer
Note Interpret with caution Very small number of responses (nlt=30)
Services that have high scores across headline measures (satisfaction expectation and ideal service) also perform well against values related attributes These services are Ambulance Services Art Galleries and Museums State Emergency Services and Fire Brigades
85
Source Customer Service Commission Customer Satisfaction Measurement Survey 2019 Report developed in conjunction with the NSW Customer Service CommissionerPublic I1-A2
Average score higherlower compared to overall SA average
Base Consumers (n=2617)Customers are asked ldquoThinking now about its processes) to what extent do you agree or disagree the followingstatements describes [a particular Government Service] in SArdquo
Figure 11 Performance of SA Government Services against process attributes
Responses were provided according to a scale from 1 (strongly disagree) to 10 (strongly agree) The average score against each attribute by service is tabulated Note this analysis represents consumer data only
Services
Simplicity and Efficiency of Processes Employee autonomy
Processes are easy to understand
Processes are designed to reduce wait times
I can get to the right person the first time
Services feel seamless across channels
Employees are empowered to make decisions
Agricultural Advice and Funding Services 61 73 73 67 68
Ambulance Services 86 81 84 83 87
Art Galleries and Museums 79 74 78 76 73
Business Advisory Services 70 67 71 64 72
Child Welfare Services 49 45 43 42 48
Consumer Affairs 71 59 60 62 63
Courts 61 50 58 55 62
Disability Services 55 53 52 52 56
Documentation Services 67 66 68 64 68
Environment and Wildlife Protection 61 60 58 56 60
Fire Brigades 86 87 86 88 83
Major Roads 55 50 50 49 51
Police 70 65 65 65 73
Prisons 53 50 57 57 57
Public Hospitals 67 56 60 63 68
Public Housing 62 50 56 56 54
Public Schools 69 64 66 66 67
Public Transport 70 65 66 66 66
Services for Older People 65 59 61 62 63
State Emergency Services 86 87 85 84 83
TAFE Services 66 62 63 65 66
Vehicle Licensing and Registration 74 65 69 68 69
Water Supply 67 61 63 64 64
Overall Average 70 63 65 65 68
VARIATION IN CONSUMERSrsquo VIEWS OF PERFORMANCE AGAINST PROCESS ATTRIBUTES ACROSS SERVICES
Consumer
Note Interpret with caution Very small number of responses (nlt=30)
Services that have high scores across headline measures (satisfaction expectation and ideal service) also perform well against process attributes These services are Ambulance Services Art Galleries and Museums State Emergency Services and Fire Brigades
86
Source Customer Service Commission Customer Satisfaction Measurement Survey 2019 Report developed in conjunction with the NSW Customer Service CommissionerPublic I1-A2
Average score higherlower compared to overall SA average
Customers are asked ldquoThinking about the services they provide overall how would rate [a particular government service] in SA on the followingrdquoFigure 12 Performance of SA Government Services against goals
Base Consumers (n=2582)
Responses were provided according to a scale from 1 (strongly disagree) to 10 (strongly agree) The average score against each attribute by service is tabulated Note this analysis represents consumer data only
Services
Transparency Access to information Privacy
Demonstrate openness and transparency in decision
making
Encourage public participation in decision
making
Is making it easier to access information about their
services
Is making best use of online services to improve efficiency
for customers
Safeguard privacy and confidentiality
Agricultural Advice and Funding Services 74 71 73 75 78
Ambulance Services 83 77 84 80 89
Art Galleries and Museums 78 76 80 79 80
Business Advisory Services 71 68 70 65 72
Child Welfare Services 44 37 49 43 58
Consumer Affairs 64 56 66 67 74
Courts 61 49 64 57 70
Disability Services 56 54 57 59 69
Documentation Services 71 62 70 69 78
Environment and Wildlife Protection 60 56 69 60 71
Fire Brigades 82 80 85 82 90
Major Roads 56 53 56 58 68
Police 65 58 68 63 76
Prisons 54 49 56 49 64
Public Housing 69 61 68 63 76
Public Hospitals 54 50 54 52 69
Public Schools 67 66 71 68 73
Public Transport 64 61 71 71 71
Services for Older People 65 60 66 65 77
State Emergency Services 86 81 85 78 88
TAFE Services 67 64 69 69 74
Vehicle Licensing and Registration 69 58 73 74 78
Water Supply 64 57 69 67 71
Overall Average 67 61 70 68 75
VARIATION IN CONSUMERSrsquo VIEWS OF PERFORMANCE AGAINST GOALS ACROSS SERVICES
Consumer
Note Interpret with caution Very small number of responses (nlt=30)
Services that have high scores across headline measures (satisfaction expectation and ideal service) also perform well against goals attributes These services are Ambulance Services Art Galleries and Museums State Emergency Services and Fire Brigades
87
Source Customer Service Commission Customer Satisfaction Measurement Survey 2019 Report developed in conjunction with the NSW Customer Service CommissionerPublic I1-A2
Average score higherlower compared to overall SA average
VARIATION IN BUSINESSESrsquo VIEWS OF EMPLOYEE PERFROMANCE ACROSS SERVICES
Customers are asked ldquoThinking now about its employees to what extent do you agree or disagree that each of the following statements describes [a particular government service] in SArdquo
Figure 9 Performance of SA Government Services against each of the employee attributes
Responses were provided according to a scale from 1 (strongly disagree) to 10 (strongly agree) The average score against each attribute by service is tabulated Note this analysis represents consumer data only
Base Businesses (n=657)
Services
Honesty and Integrity of Employees Efficiency and Effectiveness Empathy and Communication of Employees Fairness
Are honest
Deliver high
safety standards
Provide good value
services
Are reliable
Communicate well
Are consistent
Engender confidence in
their knowledge
Explain intended actions clearly
Get things done as quickly as
possible
Held Accountable
See things from my perspective
Provide services
without bias
Agricultural Advice and Funding Services 59 52 53 56 52 53 54 53 45 53 46 50Ambulance Services 91 92 92 93 90 91 92 93 94 91 87 92Art Galleries and Museums 83 74 88 85 86 78 83 85 69 83 79 79Business Advisory Services 71 73 71 70 70 71 69 71 66 62 66 70Child Welfare Services 71 71 62 54 59 50 62 70 55 56 55 76Consumer Affairs 72 73 65 71 73 66 71 70 61 66 65 71Courts 76 68 63 68 70 74 66 75 63 53 61 73Disability Services 80 77 76 73 73 74 75 70 69 74 66 75Documentation Services 90 80 79 72 79 81 80 79 67 74 75 80Environment and Wildlife Protection 80 77 78 76 77 76 78 78 78 70 68 71Fire Brigades 85 99 89 85 85 99 93 83 96 96 88 99Major Roads 79 79 70 70 70 64 69 55 74 60 73 78Police 78 83 76 76 76 79 80 77 68 77 71 81Prisons 74 76 72 74 77 75 74 74 75 91 73 77Public Hospitals 70 69 68 68 67 67 65 69 64 61 64 70Public Housing 85 78 81 68 82 86 84 79 68 84 76 79Public Schools 70 71 65 65 65 62 66 66 58 66 64 64Public Transport 76 70 70 65 70 71 67 69 76 62 71 68Services for Older People 76 75 73 72 74 69 73 69 70 72 68 72State Emergency Services 83 86 85 83 81 80 80 82 79 82 86 89TAFE Services 69 64 67 66 63 66 59 64 61 64 61 63Vehicle Licensing and Registration 75 75 69 72 72 71 72 74 69 66 67 74Water Supply 66 75 67 69 70 70 74 71 62 66 61 74Overall Average 75 75 71 71 72 71 72 72 68 69 68 73
Note Interpret with caution Very small number of responses (nlt=30)
Business
Due to low sample sizes for most of the services data is to be viewed as indicative only
88
Source Customer Service Commission Customer Satisfaction Measurement Survey 2019 Report developed in conjunction with the NSW Customer Service CommissionerPublic I1-A2
Customers are asked ldquoThinking about the values that they uphold to what extent would you agree with each of the following statements when thinking about [a particular government service] in SArdquo
Figure 10 Performance of SA Government Services against values
Responses were provided according to a scale from 1 (strongly disagree) to 10 (strongly agree) The average score against each attribute by service is tabulated Note this analysis represents consumer data only
Services
Accountability and Service quality
Is a body I can trust Operates with integrity Is accountable for its services Provides good values services
Agricultural Advice and Funding Services 46 47 54 57
Ambulance Services 96 91 92 93
Art Galleries and Museums 89 89 93 91
Business Advisory Services 67 71 60 63
Child Welfare Services 65 71 66 59
Consumer Affairs 69 68 65 64
Courts 72 78 63 71
Disability Services 70 72 70 70
Documentation Services 80 80 76 82
Environment and Wildlife Protection 73 75 73 71
Fire Brigades 94 94 94 94
Major Roads 69 64 78 68
Police 80 79 78 82
Prisons 69 69 72 71
Public Hospitals 64 65 65 68
Public Housing 66 73 70 70
Public Schools 66 64 68 61
Public Transport 69 70 71 67
Services for Older People 74 76 73 76
State Emergency Services 87 89 86 85
TAFE Services 61 65 60 67
Vehicle Licensing and Registration 72 73 68 71
Water Supply 62 65 61 66
Overall Average 71 72 70 71
Average score higherlower compared to overall SA average
Base Businesses (n=702)
VARIATION IN BUSINESSESrsquo VIEWS OF PERFORMANCE AGAINST VALUES ACROSS SERVICES
Note Interpret with caution Very small number of responses (nlt=30)
Business
Due to low sample sizes for most of the services data is to be viewed as indicative only
89
Source Customer Service Commission Customer Satisfaction Measurement Survey 2019 Report developed in conjunction with the NSW Customer Service CommissionerPublic I1-A2
Average score higherlower compared to overall SA average
Base Businesses (n=661)Customers are asked ldquoThinking now about its processes to what extent do you agree or disagree the following statements describes [a particular GovernmentService] in SArdquo
Figure 11 Performance of SA Government Services against process attributes
Responses were provided according to a scale from 1 (strongly disagree) to 10 (strongly agree) The average score against each attribute by service is tabulated Note this analysis represents consumer data only
Services
Simplicity and Efficiency of Processes Responsiveness
Processes are easy to understand
Processes are designed to reduce wait times
I can get to the right person the first time
Services feel seamless across channels
Employees are empowered to make
decisions
Agricultural Advice and Funding Services 42 40 46 41 61
Ambulance Services 88 86 88 84 89
Art Galleries and Museums 86 84 77 74 70
Business Advisory Services 64 56 59 60 63
Child Welfare Services 66 51 51 51 45
Consumer Affairs 68 60 67 62 64
Courts 58 46 55 54 74
Disability Services 62 50 66 66 65
Documentation Services 72 69 63 80 75
Environment and Wildlife Protection 68 66 64 68 62
Fire Brigades 93 85 84 93 98
Major Roads 59 69 73 64 78
Police 69 64 69 63 76
Prisons 72 70 72 62 71
Public Hospitals 65 52 58 58 59
Public Housing 71 62 71 64 48
Public Schools 64 66 68 69 64
Public Transport 66 66 63 64 66
Services for Older People 67 59 68 67 68
State Emergency Services 84 82 72 80 84
TAFE Services 64 55 60 65 56
Vehicle Licensing and Registration 70 62 65 65 64
Water Supply 65 60 62 63 62
Overall Average 68 61 65 65 66
VARIATION IN BUSINESSESrsquo VIEWS OF PERFORMANCE AGAINST PROCESS ATTRIBUTES ACROSS SERVICES
Note Interpret with caution Very small number of responses (nlt=30)
Business
Due to low sample sizes for most of the services data is to be viewed as indicative only
90
Source Customer Service Commission Customer Satisfaction Measurement Survey 2019 Report developed in conjunction with the NSW Customer Service CommissionerPublic I1-A2
Average score higherlower compared to overall SA average
Customers are asked ldquoThinking about the services they provide overall how would rate [a particular government service] in SA on the followingrdquoFigure 12 Performance of SA Government Services against goals
Base Businesses (n=641)
Responses were provided according to a scale from 1 (strongly disagree) to 10 (strongly agree) The average score against each attribute by service is tabulated Note this analysis represents consumer data only
Services
Transparency Access to information Privacy
Demonstrate openness and transparency in decision
making
Encourage public participation in decision
making
Is making it easier to access information about their
services
Is making best use of online services to improve efficiency
for customers
Safeguard privacy and confidentiality
Agricultural Advice and Funding Services 48 51 43 51 59
Ambulance Services 92 78 89 69 94
Art Galleries and Museums 81 77 75 83 84
Business Advisory Services 64 61 66 69 71
Child Welfare Services 65 52 61 50 81
Consumer Affairs 65 54 67 69 69
Courts 59 44 69 63 83
Disability Services 69 69 62 73 81
Documentation Services 79 69 85 87 87
Environment and Wildlife Protection 69 71 77 74 67
Fire Brigades 98 95 78 54 97
Major Roads 59 69 74 78 74
Police 66 70 77 70 81
Prisons 71 55 54 55 74
Public Hospitals 64 59 61 61 71
Public Housing 75 66 76 73 72
Public Schools 65 70 64 67 69
Public Transport 70 66 71 69 67
Services for Older People 67 73 74 75 73
State Emergency Services 84 82 85 82 84
TAFE Services 58 61 65 60 62
Vehicle Licensing and Registration 66 58 70 71 75
Water Supply 62 55 65 66 70
Overall Average 67 63 69 68 74
VARIATION IN BUSINESSESrsquo VIEWS OF PERFORMANCE AGAINST GOALS ACROSS SERVICES
Note Interpret with caution Very small number of responses (nlt=30)
Business
Due to low sample sizes for most of the services data is to be viewed as indicative only
91
Public ndash I1-A2
SOUTH AUSTRALIAN CUSTOMER SATISFACTION MEASUREMENT SURVEY 2019
The data in this chapter is for informative purposes to compare the perceptions of SA government services Where sample sizes for segments are low (lt30) data is provided for indicative purposes only
APPENDIX 2CONTACT METHOD PREFERENCE BY SERVICE
Source Customer Service Commission Customer Satisfaction Measurement Survey 2019 Report developed in conjunction with the NSW Customer Service CommissionerPublic I1-A2
CONTACT METHODS PREFERRED TO INTERACT WITH SA GOVERNMENT SERVICESConsumers have different contact preferences for different types of services Agricultural Advice and Funding Services Vehicle Licensing andRegistration Documentation Services Major Roads and Public Transport and Water Supply are the top 6 services where online is the preferredcontact method Agricultural Advice and Funding Services Major Roads and Consumer Affairs have see the biggest growth in online preferenceversus last year
Consumer
Figure 13 Breakdown of most preferred contact methods across services
Note Each respondent could select any number of contact methodsBase 2019 Consumers (n=3170) 2018 Consumers (n=3152)
Note Interpret with caution Very small number of responses (nlt=30) Legend top 5 services for each contact method
2018 2019 2018 2019 2018 2019Agricultural Advice and Funding Services 37 46 14 17 0 0Vehicle Licensing and Registration 47 43 27 27 7 8Documentation Services 40 38 26 17 14 10Major Roads 21 29 29 19 20 19Public Transport 31 27 42 35 12 17Water Supply 20 27 9 4 46 37Consumer Affairs 15 26 7 13 44 26Business Advisory Services 21 22 27 21 31 15Environment and Wildlife Protection 37 21 8 27 19 19TAFE Services 18 20 29 21 16 17Art Galleries and Museums 17 18 44 60 12 6Child Welfare Services 13 14 37 19 28 43Ambulance Services 10 13 25 23 53 45Prisons 6 11 37 40 54 27Courts 8 11 52 44 19 23Services for Older People 13 11 33 28 40 46Police 6 10 53 47 25 30Public Schools 8 9 47 42 18 20Disability Services 5 9 39 32 37 37Fire Brigades 8 8 73 44 19 29Public Housing 11 7 27 39 44 39State Emergency Services 23 6 16 31 34 39Public Hospitals 5 6 58 53 23 29
ServicesOnline
In person face-to-face
Telephone (landline or mobile phone calls text message)
93
+9 pts
+8 pts
+11 pts
Source Customer Service Commission Customer Satisfaction Measurement Survey 2019 Report developed in conjunction with the NSW Customer Service CommissionerPublic I1-A2
Note Each respondent could select one preferred contact method
CONTACT METHODS PREFERRED TO USE TO INTERACT WITH SA GOVERNMENT SERVICES
Figure 14 Breakdown of most commonly preferred contact methods across services
Base 2019 Business (n=743) 2018 Business (n=795)
Preference for online has decreased for those who interacted with Vehicle Licensing and Registration with an increase inpreference for face to face Public Transport has also seen a decline in preference for online with preference moving to face toface as well as telephone
Business
Note Interpret with caution Very small number of responses (nlt=30)
2018 2019 2018 2019 2018 2019Documentation Services 41 52 0 23 7 0Major Roads 18 49 36 48 1 1Vehicle Licensing and Registration 52 33 20 36 4 9Consumer Affairs 13 30 13 6 46 23Public Transport 54 24 23 29 9 18Agricultural Advice and Funding Services 19 21 47 1 0 30Water Supply 22 20 14 3 37 27Services for Older People 10 20 23 24 30 34Business Advisory Services 29 19 15 19 23 26Disability Services 20 13 12 28 38 34Environment and Wildlife Protection 12 12 11 13 11 9Ambulance Services 14 12 41 13 44 50Police 6 7 50 56 34 29TAFE Services 4 6 31 23 41 18Public Schools 0 4 49 45 22 26Public Hospitals 5 3 53 54 11 21Fire Brigades 0 0 2 2 23 78Art Galleries and Museums 29 0 29 17 0 41State Emergency Services 0 0 0 58 79 14Child Welfare Services 12 0 33 24 33 38Courts 10 0 40 61 10 9Public Housing 18 0 34 83 14 15Prisons 0 0 27 34 46 34
ServicesOnline In person face-to-face Telephone (landline or mobile phone calls
text message)
Legend top 5 services for each contact method
94
-30 pts
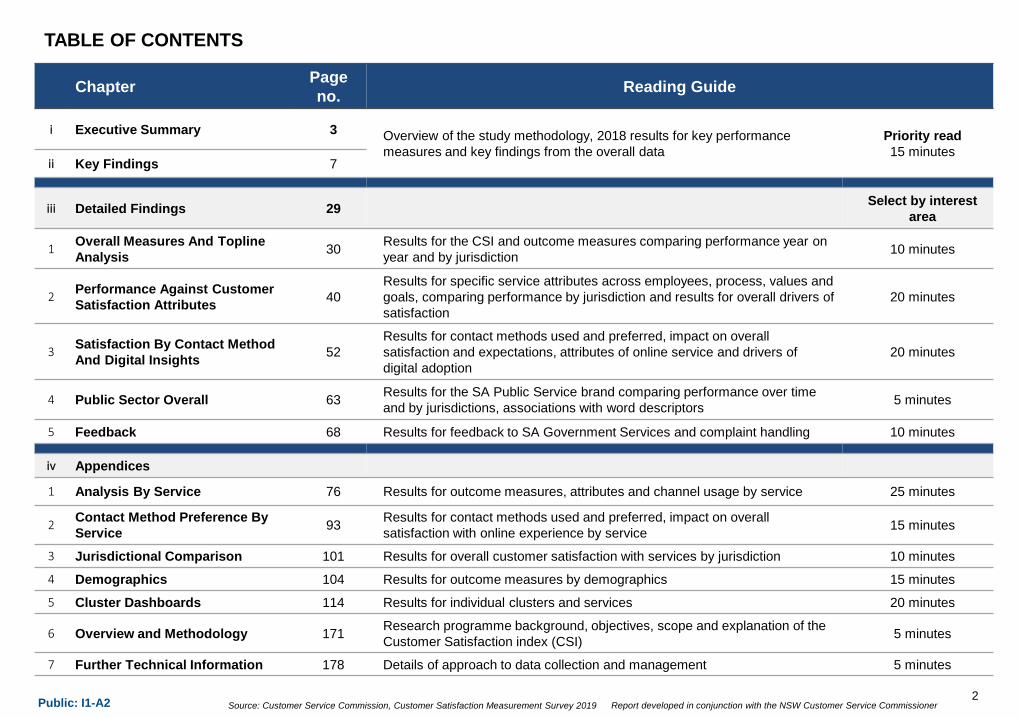
Source Customer Service Commission Customer Satisfaction Measurement Survey 2019 Report developed in conjunction with the NSW Customer Service CommissionerPublic I1-A2
TABLE ON CONTENTS
2
Chapter Page no Reading Guide
i Executive Summary 3 Overview of the study methodology 2018 results for key performance measures and key findings from the overall data
Priority read15 minutes
ii Key Findings 7
iii Detailed Findings 29 Select by interest area
1 Overall Measures And Topline Analysis 30 Results for the CSI and outcome measures comparing performance year on
year and by jurisdiction 10 minutes
2 Performance Against Customer Satisfaction Attributes 40
Results for specific service attributes across employees process values and goals comparing performance by jurisdiction and results for overall drivers of satisfaction
20 minutes
3 Satisfaction By Contact Method And Digital Insights 52
Results for contact methods used and preferred impact on overall satisfaction and expectations attributes of online service and drivers of digital adoption
20 minutes
4 Public Sector Overall 63 Results for the SA Public Service brand comparing performance over time and by jurisdictions associations with word descriptors 5 minutes
5 Feedback 68 Results for feedback to SA Government Services and complaint handling 10 minutes
iv Appendices
1 Analysis By Service 76 Results for outcome measures attributes and channel usage by service 25 minutes
2 Contact Method Preference By Service 93 Results for contact methods used and preferred impact on overall
satisfaction with online experience by service 15 minutes
3 Jurisdictional Comparison 101 Results for overall customer satisfaction with services by jurisdiction 10 minutes
4 Demographics 104 Results for outcome measures by demographics 15 minutes
5 Cluster Dashboards 114 Results for individual clusters and services 20 minutes
6 Overview and Methodology 171 Research programme background objectives scope and explanation of the Customer Satisfaction index (CSI) 5 minutes
7 Further Technical Information 178 Details of approach to data collection and management 5 minutes
TABLE OF CONTENTS
Public ndash I1-A2
SOUTH AUSTRALIAN CUSTOMER SATISFACTION MEASUREMENT SURVEY 2019
i EXECUTIVE SUMMARY
Source Customer Service Commission Customer Satisfaction Measurement Survey 2019 Report developed in conjunction with the NSW Customer Service CommissionerPublic I1-A2
Metro74
Regional13
Rural14
QLD
VIC
NSW
SA
Online survey
Other jurisdictions - Consumers
Queensland Victoria New South Wales
United Kingdom
New Zealand
Other jurisdictions - Businesses
Queensland Victoria New South Wales
United Kingdom
New Zealand
SA ndash Consumers
SA- Businesses
Age Gender Region
Business size Region
1998
502
49 male51
female18-3429
35-5432
55-6416
65+23
98 under 20
staff2
20+ staff
75 Metropolitan
11 Regional
14 Rural
2019 2073 4110 2019 2116
555 537 1261 1003 586
WE SURVEYED ~14300 CONSUMERS AND 4400 BUSINESSES ACROSS 6 JURISDICTIONS VIA THE ANNUAL CUSTOMER SATISFACTION MEASUREMENT SURVEY IN 2019
UK
Respondent Demographics
Note Results are subject to rounding and may not sum to 100
Consumer Business
NZ
4
Source Customer Service Commission Customer Satisfaction Measurement Survey 2019 Report developed in conjunction with the NSW Customer Service CommissionerPublic I1-A2
75 78
03
Satisfaction ExpectationGap
Expectation
Consumer satisfaction has remained stable versus last year Consumer expectations have increased slightly however not a statistically significant change
(00)
The SA consumer CSI is at 788 for 2019 and has been statistically stable since 2016
Consumersrsquo perceptions of the SA Public Services lsquobrandrsquo have remained stable in 2019 ranking second after airlines However satisfaction with the SA Public Service lsquobrandrsquo remains lower than customersrsquo satisfaction with SA Government services overall
Lowest
Highest
Avg
sat
isfac
tion
(con
sum
ers)
Airlines 71
SA Public Service 66
Telcorsquos 61
Local Council60
Banks59
Energy54
Fed Govt53
76(2017)
Nine drivers of consumer satisfaction are identified in 2019 Whereas lsquoCommunication and Empathyrsquo was a single driver last year this year lsquoFairness and Empathyrsquo is a unique driver of moderate importance separate to lsquoCommunicationrsquo which is of high importance
Efficiency and effectiveness of employees
Communication
Honesty and integrity of employees
Employee autonomy
Simplicity and efficiency of processes
Transparency
Privacy
Access to information and online services
High
High
High
Moderate
Moderate
Low
Low
Low
Drivers and relative importance
Performance of SA Government Services against baseline measures Customer Satisfaction Index (CSI) results
Drivers of satisfaction
75(2018)
+02
Perceptions of the SA Public Sector lsquobrandrsquo
SA Government Services
(avg satisfaction)
(+01)
75(2019)
Fairness and Empathy
Moderate
EXECUTIVE SUMMARY CONSUMER SATISFACTION WITH SA GOVERNMENT SERVICES HAS BEEN MAINTAINED IN 2019
Legend Statistically significant increase in avg from 2018 (at 99 level of Confidence)No significant change in avg from 2018 (at 99 level of Confidence)Statistically significant decrease in avg from 2018 (at 99 level of Confidence)
-01
Consumer CSI
Consumer
776
785784
788
77
78
79
2016 2017 2018 2019
74(2016)
00
Employee attributes Goals ProcessesKey
Groupings of drivers of satisfaction are based on analyses of NSW Government services however it is assumed that drivers of satisfaction are relatively consistent across jurisdictions and generally across service industries broadly
5
Source Customer Service Commission Customer Satisfaction Measurement Survey 2019 Report developed in conjunction with the NSW Customer Service CommissionerPublic I1-A2
Business satisfaction and expectation have remained stable since 2016
The SA business CSI is 780 for 2019 and has been statistically stable since 2016
Business perceptions of the SA Public Services lsquobrandrsquo have remained stable in 2019 ranking between Airlines andTelcos However satisfaction with the SA Public Service lsquobrandrsquo remains lower than customersrsquo satisfaction with SA Government services overall
Lowest
Highest
Avg
sat
isfac
tion
(con
sum
ers)
Airlines 70
SA Public Service 66
Telcorsquos62
Banks61
Local Council61
Fed Govt 57
Energy56
71(2017)
+02
Performance of SA Government services against baseline measures Customer Satisfaction Index (CSI) results
72(2018)
Perceptions of the SA Public Sector lsquobrandrsquo
SA Government services
(avg satisfaction)
73(2019)
EXECUTIVE SUMMARY BUSINESS SATISFACTION WITH SA GOVERNMENT SERVICES HAS BEEN MAINTAINED IN 2019
7376
03
Satisfaction ExpectationGap
Expectation
(+01)(+01)
+01
Business CSI
Business
741
754759
780
74
75
76
77
78
79
2016 2017 2018 2019
Contact Methods Used by Businesses
51
4135
29
128
4740
29 27
156
Inperson
Phone Online Email Mail fax Thirdparties
2018 Business (n=814)2019 Business (n=762)
Similar to last year lsquoIn personrsquo lsquophonersquo and lsquoonlinersquo continue to be the top 3 methods used by businesses to interact with the SA Government
70(2016)
+01
Legend Statistically significant increase in avg from 2018 (at 99 level of Confidence)No significant change in avg from 2018 (at 99 level of Confidence)Statistically significant decrease in avg from 2018 (at 99 level of Confidence)
6
Public ndash I1-A2
SOUTH AUSTRALIAN CUSTOMER SATISFACTION MEASUREMENT SURVEY 2019
ii KEY FINDINGS IN 2019
Source Customer Service Commission Customer Satisfaction Measurement Survey 2019 Report developed in conjunction with the NSW Customer Service CommissionerPublic I1-A2
SUMMARY OF KEY FINDINGS IN 2019
Theme Key Finding EvidenceOverall Measures and Topline Analysis
Average scores for all three headline measures (satisfaction expectation ideal score) have remained stableover last year and seen steady growth since 2016
bull Consumer satisfaction has remained stable at 75 out of 10 and expectation has increased slightly to 78 out of 10
bull The expectation gap is 03 points
Compared to 2016 all headline measures have seen a steady increase in average scores
bull Comparison to ideal service has increased significantly in 2019 by 04 points to 72 out of 10
bull The expectation gap has remained stable versus 2018 at 03 pointsbull The proportion of businesses in the lowest bracket (rated 1-4 out of 10) has been declining
since 2016 across all three performance indicators and continues to do so in 2019
Performance Against Customer Satisfaction Attributes
SA Government Services perform well against Employee attributes which have been identified as important drivers of customer satisfaction
The opportunity lies in improving process efficiencies to reduce the overall time taken by consumers and businesses to complete their task or interaction
bull For consumers SA Government services have an average score of 74 out of 10 across all employee attributes
bull lsquoProcesses are easy to understandrsquo rates higher than other process attributes The opportunity areas lie in making processes more efficient as lsquoGetting things done as quickly as possiblersquo and processes lsquoAre designed to reduce wait timesrsquo are two attributes where SA has the lowest ratings among all jurisdictions
bull lsquoPublic participation in decision makingrsquo is one of the lowest performing attributes across all jurisdictions for consumers However businesses in SA have rated this attribute significantly higher than last year ndash an increase of 04 points to 63 out of 10 vs 2019
Consumer
Business
BusinessConsumer
8
Source Customer Service Commission Customer Satisfaction Measurement Survey 2019 Report developed in conjunction with the NSW Customer Service CommissionerPublic I1-A2
SUMMARY OF KEY FINDINGS IN 2019
Theme Key Finding EvidenceSatisfaction by Contact Method and DigitalInsights
Usage and satisfaction with the overall experience of using websites appshas remained stable among consumers Overall satisfaction is highest amongst consumers who use online channels
While smartphones are the most commonly used device to access services online there is an opportunity to improve the smartphone experience of consumers
bull Of all jurisdictions SA has the second highest usage of online methods of contact among consumers behind NSW
bull Users of Online channels have the highest average satisfaction scores compared to all other channels They also rate the SA Government services highest on all process attributes
bull While half of all consumers have used smartphones to access services online satisfaction with the overall experience with using website apps is lowest for smartphone users Tablet users form the smallest proportion but have the highest satisfaction
There is significant improvement in satisfaction with the overall online experience among businesses compared to 2018
While usage of in-person as a contact method is declining it continues to remain important to businesses The opportunity area is to find the right balance between online and face to face contact methods
bull The proportion of businesses choosing to go online increased by 7 points in 2019 and these businesses also saw a 09 point increase in satisfaction which is high at 80 out of 10
bull There was a significant increase in satisfaction with the overall experience of using website app to complete a task ndash an increase of 08 points to 78 out of 10 versus last year
bull While smartphone usage was low compared to desktop and laptop businesses that used smartphones showed highest satisfaction along with desktop users
bull Businesses that used in-person channels had the highest satisfaction alongside online users Businesses using in-person methods also rate SA Government services highest on all process attributes
bull Preference for in-person in SA is the highest of all jurisdictions however usage has seen a steady decline since 2017
Consumer
Business
9
Source Customer Service Commission Customer Satisfaction Measurement Survey 2019 Report developed in conjunction with the NSW Customer Service CommissionerPublic I1-A2
Theme Key Finding Evidence
Public Sector Overall The SA Public Services lsquobrandrsquo is viewed positively by both consumers and businesses
Experiences with SA Government services outperforms overall SA Public Service perceptions
bull The perception of SA Public Service overall has remained stable and is ahead of all other industries with the exception of airlines for both consumers and businesses
bull In line with other Australian jurisdictions SA Public Service lsquobrandrsquo performs better relative to other industries than the Public Service lsquobrandrsquo in NZ and UK
bull Satisfaction with government services is higher than satisfaction with the SA Public Service lsquobrandrsquo suggesting factors other than service delivery experiences are impacting brand perception
bull SA Public Service is described more positively than negatively with lsquohelpfulrsquo lsquofriendlyrsquo lsquocapablersquo lsquoknowledgeablersquo and lsquorespectfulrsquo being the top five descriptors by both consumers and businesses
bull In contrast to last year businesses have described SA Public Services more positively this year with an increase in proportion of businesses selecting positive descriptors and decrease in proportion of businesses selecting negative descriptors
Topline by Demographics Consumer satisfaction in regional areas has increased significantly and the expectation gap is almost zero
bull For consumers all three headline measures have seen a significant increase in regional areas
bull Expectation has increased by 04 points to 81 out of 10 and satisfaction has increased by 06 points to 80 out of 10 This indicates that SA Government Services in regional areas are very close to meeting consumers expectations
Consumer Business
SUMMARY OF KEY FINDINGS IN 2019
10
Consumer
Source Customer Service Commission Customer Satisfaction Measurement Survey 2019 Report developed in conjunction with the NSW Customer Service CommissionerPublic I1-A2
Theme Key Finding Evidence
Feedback Overall the proportion of consumers and businesses giving feedback remains low
Consumers are more likely to give compliments and businesses are more likely to make a complaint
bull 30 of consumers and 39 of businesses gave some form of feedback in 2019bull 39 of all feedback received from consumers was a compliment Compliments are
related to employee interactions for consumers and businesses compliment about the information available to them
bull 42 of all feedback received from businesses was a complaint Compared to other jurisdictions SA received the highest proportion of all feedback as complaints from businesses but had the lowest proportion of poor handling of complaints within Australian jurisdictions
bull Processes are the main source of complaints for both consumers and businesses
A higher proportion of both consumers and businesses found it easier to make complaints this year versus last year
For both consumers and businesses ease of making a complaint does not always translate into a positive complaint handling experience There is an opportunity to streamline the complaints resolution process to ensure the experience is positive for consumers and businesses through the entire process
Good complaint handling is associated with higher than average satisfaction for both consumers and business
bull 51 of consumers found it easy to make a complaint (7-10 out of 10) versus 34 last year
bull 46 of businesses found it easy to make a complaint (7-10 out of 10) versus 37 last year
bull While there was improvement in the ease of making a complaint only 36 of consumers said their complaint had been handled well (7-10 out of 10)
bull Similarly for businesses only 32 said their complaint had been handled well (7-10 out of 10)
bull Consumers who had a good complaint handling experience had a satisfaction score of 80 out of 10 which is higher than the average consumer satisfaction score of 75 out of 10
bull Businesses gave a rating of 7-10 out of 10 for complaint handling had a satisfaction score of 81 out of 10 which is higher than the average business satisfaction score of 73 out of 10
Consumer Business
SUMMARY OF KEY FINDINGS IN 2019
11
Consumer Business
Please note that customers may have rated different services on Satisfaction and Complaint Handling and the correlation is to be treated as indicative only
Source Customer Service Commission Customer Satisfaction Measurement Survey 2019 Report developed in conjunction with the NSW Customer Service CommissionerPublic I1-A2
KEY FINDING 1 (CONSUMER) Overall Measures and Topline AnalysisAverage scores for all three headline measures (satisfaction expectation ideal score) have remained stable over last year and seen steady growth since 2016
7578
Satisfaction Expectation Gap Expectation
Figure 2 2019 Consumer satisfaction expectation and expectation gap
bull In 2019 consumer satisfaction with SA Government services has been maintained at 75 and consumer expectation has increased slightly to 78
bull The expectation gap is -03
+01-
Consumer
-03
Legend Statistically significant increase in avg from 2018 (at 99 level of Confidence)No significant change in avg from 2018 (at 99 level of Confidence)Statistically significant decrease in avg from 2018 (at 99 level of Confidence)
12
77
78
77
78
2016
2017
2018
2019
74
76
75
75
2016
2017
2018
2019
70
71
71
72
2016
2017
2018
2019
-01 -01 +01
+01 -+02
+01 - +01
Expectation Satisfaction Ideal Service
Figure 1 2019 Average scores for headline measures 2016 ndash 2019 - Consumers
Source Customer Service Commission Customer Satisfaction Measurement Survey 2019 Report developed in conjunction with the NSW Customer Service CommissionerPublic I1-A2
KEY FINDING 1 (BUSINESS) Overall Measures and Topline AnalysisCompared to 2016 all headline measures have seen a steady increase in average scores
bull Both satisfaction and expectation of businesses with SA Government have increased by 01 points in 2019 versus last year
bull As with consumers the expectation gap is -03
+01-
Business
Legend Statistically significant increase in avg from 2018 (at 99 level of Confidence)No significant change in avg from 2018 (at 99 level of Confidence)Statistically significant decrease in avg from 2018 (at 99 level of Confidence)
13
Expectation Satisfaction Ideal Service
Figure 3 2019 Average scores for headline measures 2016 ndash 2019 - Business
73
74
75
76
2016
2017
2018
2019
+01
+01
+01
70
71
72
73
2016
2017
2018
2019
+02
+01
+01
67
69
68
72
2016
2017
2018
2019
+02
-01
+04
+01 +01
7376
Satisfaction Expectation Gap Expectation
Figure 4 2018 Business satisfaction expectation and expectation gap
Aver
age
scor
e (o
ut o
f 10 )
-03
Source Customer Service Commission Customer Satisfaction Measurement Survey 2019 Report developed in conjunction with the NSW Customer Service CommissionerPublic I1-A2
Satisfaction Drivers Average score across respondents (out of 10 on scale of according to a scale from 1 strongly disagree to 10 strongly agree)
Employees1)Honesty amp integrity of employees2)Efficiency and effectiveness of employees3)Communication4) Fairness and Empathy
Average across attributes
Process1)Simplicity and efficiency of processes2)Employee autonomy
Average across attributes
73
This year (YoY change not significant)
Range of historicValues(2016-19)
Legend77
79
71
Significant increase
Significant decrease
Last year
72
73
73
74
2016
2017
2018
2019
76 76 76 75 74 74 74 74 7371
69
77 76 76 75 74 74 74 74 7370 70 70
69
60
65
70
75
80
Are
hone
st
Deliv
er h
igh
safe
tyst
anda
rds
Prov
ide
serv
ices
with
out b
ias
Expl
ain
inte
nded
actio
ns c
lear
ly
Enge
nder
con
fiden
cein
thei
r kno
wle
dge
Com
mun
icat
e w
ell
Prov
ide
good
val
uese
rvic
es
Are
relia
ble
Are
cons
iste
nt
Are
held
acc
ount
able
See
thin
gs fr
om m
ype
rspe
ctiv
e
Get
thin
gs d
one
asqu
ickl
y as
pos
sibl
e
66
65
66
66
2016
2017
2018
201969
6765 63
7068
6563
66
6560
65
70
75
80
Proc
esse
s ar
e ea
sy to
unde
rsta
nd
Empl
oyee
s ar
eem
pow
ered
to m
ake
deci
sions
I can
get
to th
e rig
htpe
rson
the
first
tim
e
Serv
ice
feel
s se
amle
ssev
en if
I ha
ve to
com
mun
icat
e ac
ross
diffe
rent
cha
nnel
s(i
e o
nlin
e p
hone
em
ail)
Are
desi
gned
tore
duce
wai
t tim
es
Consumer
KEY FINDING 2 (CONSUMER) Performance Against Customer Satisfaction AttributesWith an average score of 74 out of 10 for consumers SA Government Services perform well against employee attributes which havebeen identified as important drivers of customer satisfaction The opportunity area lies in improving process efficiencies to reduce the overall time taken by consumers to complete their task or interaction
Figure 5 Employee and Process attribute scores ndash Consumers
14
Source Customer Service Commission Customer Satisfaction Measurement Survey 2019 Report developed in conjunction with the NSW Customer Service CommissionerPublic I1-A2
Satisfaction Drivers Average score across respondents (out of 10 on scale of according to a scale from 1 strongly disagree to 10 strongly agree)
Goals 1)Privacy2)Transparency3)Access to info
Average across attributes
Values1)Service Quality2)Accountability
Average across attributes
67
66
68
68
2016
2017
2018
2019
74
69 68 67
7570 68 67
62
6155
60
65
70
75
80
Safe
guar
d pr
ivac
y an
dco
nfid
entia
lity
Is m
akin
g it
easi
er to
acce
ss in
form
atio
nab
out t
heir
serv
ices
Is m
akin
g be
st u
se o
fon
line
serv
ices
toim
prov
e co
nven
ienc
ean
d ef
ficie
ncy
for
cust
omer
s
Dem
onst
rate
open
ness
and
tran
spar
ency
inde
cisio
n-m
akin
g
Enco
urag
e pu
blic
part
icip
atio
n in
deci
sion-
mak
ing
70
71
72
72
2016
2017
2018
201973 72 72
70
73 72 7270
60
65
70
75
80
Ope
rate
s w
ithin
tegr
ity
Prov
ides
goo
dse
rvic
e
Is a
bod
y I c
an tr
ust
Is a
ccou
ntab
le fo
r its
serv
ices
73
This year (YoY change not significant)
Range of historicValues(2016-19)
Legend77
79
71
Significant increase
Significant decrease
Last year
Consumer
KEY FINDING 2 (CONSUMER) Performance Against Customer Satisfaction AttributesFor consumers lsquoPublic participation in decision makingrsquo is one of the lowest performing attributes and this is also the case the attribute scores are compared across all jurisdictions
Figure 6 Goals and Values attribute scores - Consumers
15
Source Customer Service Commission Customer Satisfaction Measurement Survey 2019 Report developed in conjunction with the NSW Customer Service CommissionerPublic I1-A2
Satisfaction Drivers Average score across respondents (out of 10 on scale of according to a scale from 1 strongly disagree to 10 strongly agree)
Employees1)Honesty amp integrity of employees2)Efficiency and effectiveness of employees3)Communication4) Fairness and Empathy
Average across attributes
Process1)Simplicity and efficiency of processes2)Responsiveness
Average across attributes
7374
71 71 71 71 7070 71
6767 67
75 7573 72 72 72 71 71 71
69 68 68
60
65
70
75
Are
hone
st
Deliv
er h
igh
safe
tyst
anda
rds
Prov
ide
serv
ices
with
out b
ias
Expl
ain
inte
nded
actio
ns c
lear
ly
Enge
nder
con
fiden
cein
thei
r kno
wle
dge
Com
mun
icat
e w
ell
Are
cons
iste
nt
Prov
ide
good
val
uese
rvic
es
Are
relia
ble
Are
held
acc
ount
able
Get
thin
gs d
one
asqu
ickl
y as
pos
sibl
e
See
thin
gs fr
om m
ype
rspe
ctiv
e
68
71
70
71
2016
2017
2018
2019
61
64
65
65
2016
2017
2018
2019 67 64 64 62
6865 65
6167
66
55
60
65
70
75
80
Proc
esse
s ar
e ea
sy to
unde
rsta
nd
Empl
oyee
s ar
eem
pow
ered
to m
ake
deci
sions
Serv
ice
feel
s se
amle
ssev
en if
I ha
ve to
com
mun
icat
e ac
ross
diffe
rent
cha
nnel
s (i
eon
line
pho
ne e
mai
l)
I can
get
to th
e rig
htpe
rson
the
first
tim
e
Are
desi
gned
tore
duce
wai
t tim
es
73
This year (YoY change not significant)
Range of historicValues(2016-19)
Legend77
79
71
Significant increase
Significant decrease
Last year
Business
Figure 7 Employee and Process attribute scores ndash Businesses
16
KEY FINDING 2 (BUSINESS) Performance Against Customer Satisfaction AttributesSA Government Services perform well against employee attributes which have been identified as important drivers of business satisfaction The opportunity lies in improving process efficiencies to reduce the overall time taken to complete a task or interaction
Source Customer Service Commission Customer Satisfaction Measurement Survey 2019 Report developed in conjunction with the NSW Customer Service CommissionerPublic I1-A2
Satisfaction Drivers Average score across respondents (out of 10 on scale of according to a scale from 1 strongly disagree to 10 strongly agree)
Goals 1)Privacy2)Transparency3)Access to info
Average across attributes
Values 1)Service Quality2)Accountability
Average across attributes
63
66
65
68
2016
2017
2018
2019
71
66 65 6559
7469 68 67
6363
50
55
60
65
70
75
80
Safe
guar
d pr
ivac
y an
dco
nfid
entia
lity
Is m
akin
g it
easi
er to
acce
ss in
form
atio
nab
out t
heir
serv
ices
Is m
akin
g be
st u
se o
fon
line
serv
ices
toim
prov
e co
nven
ienc
ean
d ef
ficie
ncy
for
cust
omer
s
Dem
onst
rate
ope
nnes
san
d tr
ansp
aren
cy in
deci
sion-
mak
ing
Enco
urag
e pu
blic
part
icip
atio
n in
deci
sion-
mak
ing
66
69
70
71
2016
2017
2018
201971 70 70
68
72 71 71 70
60
65
70
75
80
Ope
rate
s w
ith in
tegr
ity
Prov
ides
goo
d se
rvic
e
Is a
bod
y I c
an tr
ust
Is a
ccou
ntab
le fo
r its
serv
ices
73
This year (YoY change not significant)
Range of historicValues(2016-19)
Legend77
79
71
Significant increase
Significant decrease
Last year
Business
KEY FINDING 2 (BUSINESS) Performance Against Customer Satisfaction AttributesBusiness perception of lsquoPublic participation in decision makingrsquo has seen a significant increase of 04 points to 63 out of 10 this year
Figure 8 Goals and Values attribute scores - Businesses
17
Source Customer Service Commission Customer Satisfaction Measurement Survey 2019 Report developed in conjunction with the NSW Customer Service CommissionerPublic I1-A2
KEY FINDING 3 (CONSUMER) Satisfaction by Contact Method and Digital InsightsUsage and satisfaction with the overall experience with using websites apps has remained stable among consumers Overall satisfaction is highest amongst consumers who use online channels
Note ndash Percentages do not add up to 100 due to exclusion of Donrsquot Know from the analysis
bull 26 of consumers used online channels as a method of contact
bull Consumers who used online methods had the highest average overall satisfaction score of 77 out of 10
bull Satisfaction with the overall experience of using online services (via website app) was also high at 79 out of 10
57
3325
139
6
58
3426
1610
5
In person Phone Online Email Mail fax Thirdparties
2018 Consumer (n=3307) 2019 Consumer (n=3297)
cus
tom
ers
who
hav
e ha
d di
rect
de
alin
gs v
ia th
is c
hann
el
Figure 9 2018 and 2019 channel usage -Consumers
Consumer
Figure 10 2018 and 2019 overall satisfaction by channel usage - Consumers
7675
73 72 7270
7775
74 7371
70
50
60
70
80
Online In person Thirdparties
Phone Mailfax Email
2018 Consumer (n=3307) 2019 Consumer (n=3297)
Aver
age
satis
fact
ion
scor
e (1
-10) +01
+01+01 +01
--
Legend Statistically significant increase in avg from 2018 (at 99 level of Confidence)No significant change in avg from 2018 (at 99 level of Confidence)Statistically significant decrease in avg from 2018 (at 99 level of Confidence)
Customers were asked ldquoThinking about your experiences interacting with SA services online in the last 12 months to what extent do you agree or disagree with each of the following statementsrdquo
Figure 11 Satisfaction with attributes of online services
82 81 81 80 79 79 79 78
102030405060708090100
0102030405060708090
100
The content wascurrent and accurate
I achieved the outcomeby using servicesavailable online
I trust my informationwas handled securely
through thewebsiteapp
The format of contentmet my accessrequirements
I was satisfied with theoverall experience ofusing the websiteappto complete the task
The websiteapp wasuseful and allowed me
to do everything Ineeded to do
Content and supportprovided online was
sufficient to answer myquestions
I found the websiteapp simple and it waseasy to find what I was
looking for
Disagree (1-4) Neutral (5-6) Agree (7-10) Average
Axis 2 Average Score
Consumer (n=798)
Axis
1
Perc
enta
ge o
f re
spon
ses
+01 +01 +01 +02+01 +01 +02NA
18
Source Customer Service Commission Customer Satisfaction Measurement Survey 2019 Report developed in conjunction with the NSW Customer Service CommissionerPublic I1-A2
KEY FINDING 3 (CONSUMER) Satisfaction by Contact Method and Digital InsightsWhile smartphones are the most used device to access services online there is an opportunity to improve the smartphone experience of consumers
Note ndash Percentages do not add up to 100 due to exclusion of Donrsquot Know from the analysis
Consumer
Legend Statistically significant increase in avg from 2018 (at 99 level of Confidence)No significant change in avg from 2018 (at 99 level of Confidence)Statistically significant decrease in avg from 2018 (at 99 level of Confidence)
19
50 4640
17
31
52 53
10
Smartphone Laptop computer Desktop computer TabletiPad
Consumer (n=843)Business (n=220)
Customers were asked ldquoWhat devices did you use to access the online content Please select all contact methods that applyrdquo
Figure 12 Devices used when dealing with SA Government services online
Figure 13 Satisfaction with online services by device used Customers were asked ldquoHow satisfied were you with the overall experience of using the websiteapp to complete the taskrdquo
re
spon
dent
s
77
79 798080
74
80
76
Smartphone Laptop computer Desktop computer TabletiPad
Consumer (n=822)Business (n=218)
Aver
age
satis
fact
ion
(out
of 1
0)
bull While most consumers (50) used smartphones to access online content their satisfaction levels with their experience was lower (77 out of 10) compared to those who used desktops or laptops to access online content (79 out of 10)
bull Few consumers are using tabletsiPad (17) but those that do have high levels of satisfaction (8 out of 10)
Source Customer Service Commission Customer Satisfaction Measurement Survey 2019 Report developed in conjunction with the NSW Customer Service CommissionerPublic I1-A2
51
4135
29
128
4740
29 27
15
6
In person Phone Online Email Mail fax Thirdparties
2018 Business (n=814) 2019 Business (n=762)
c
usto
mer
s w
ho h
ave
had
dire
ct
deal
ings
via
this
cha
nnel
KEY FINDING 3 (BUSINESS) Satisfaction by Contact Method and Digital InsightsThere is significant improvement in satisfaction with the overall online experience among businesses
Figure 14 2018 and 2019 channel usage -Businessbull There was an increase in the
overall satisfaction score among businesses who used online channels
bull There was a significant increase of 08 points in satisfaction with the overall online experience
bull The proportion of businesses who chose to go online increased by 7 points compared to last year
Business
75
70 71 7169
68
73 7372 72 71
67
60
70
80
In person Online Mailfax Phone Email Thirdparties
2018 Business(n=814) 2019 Business(n=762)
Aver
age
satis
fact
ion
scor
e (1
-10)
Figure 15 2018 and 2019 overall satisfaction by channel usage - Businesses
-02+01 +01
+03+02
-01
Legend Statistically significant increase in avg from 2018 (at 99 level of Confidence)No significant change in avg from 2018 (at 99 level of Confidence)Statistically significant decrease in avg from 2018 (at 99 level of Confidence)
Customers were asked ldquoThinking about your experiences interacting with SA services online in the last 12 months to what extent do you agree or disagree with each of the following statementsrdquo
Figure 17 Satisfaction with attributes of online services
79 79 78 78 78 78 78 75
102030405060708090100
0
20
40
60
80
100
I trust myinformation washandled securely
through thewebsiteapp
I achieved theoutcome by usingservices available
online
The content wascurrent and
accurate
The format ofcontent met my
accessrequirements
I was satisfied withthe overall
experience ofusing the
websiteapp tocomplete the task
The websiteappwas useful and
allowed me to doeverything I
needed to do
Content andsupport provided
online wassufficient toanswer myquestions
I found thewebsite app
simple and it waseasy to find what I
was looking for
Disagree (1-4) Neutral (5-6) Agree (7-10) Average
Business (n=210)
Axis 2 Average Score
+05 NA +04 +09 +08 +06 +06+09
74
224 I chose to go
online
I was directedor promotedto go online
There was noother optionavailable
Customers were asked ldquoDid you choose to go online or were you directed to go onlinerdquo
Figure 16 Choice to go online
uarr7
darr2 darr5
20
Source Customer Service Commission Customer Satisfaction Measurement Survey 2019 Report developed in conjunction with the NSW Customer Service CommissionerPublic I1-A2
2922 22 22
2 4
3224 23
16
3 2
In person Email Phone Online Mailfax Third parties
2018 Business(n=795) 2019 Business(n=743)
51
4135
29
128
47
40
29 27
15
6
In person Phone Online Email Mail fax Third parties
2018 Business (n=814) 2019 Business (n=762)
c
usto
mer
s w
ho h
ave
had
dire
ct
deal
ings
via
this
cha
nnel
Figure 18 2018 and 2019 channel usage - Business
Figure 19 2018 and 2019 most preferred channel - Business
Note ndash Percentages do not add up to 100 due to exclusion of Donrsquot Know from the analysis
bull While lsquoin personrsquo remains the most used channel for contact there is a continued decline in usage since 2017 (52 in 2017 51 in 2018 47 in 2019) though not statistically significant
bull Despite the year on year declines lsquoin personrsquo continues to be the most preferred channel and there has been a year on year growth in preference since 2017 (27 in 2017 29 in 2018 32 in 2019)
Business
KEY FINDING 3 (BUSINESS) Satisfaction by Contact Method and Digital InsightsWhile usage is declining in-person as a method of contact continues to remain important to businesses The opportunity area is to find the right balance between online and face to face contact methods
21
c
usto
mer
s
Source Customer Service Commission Customer Satisfaction Measurement Survey 2019 Report developed in conjunction with the NSW Customer Service CommissionerPublic I1-A2
7166
61 60 5954 53
7066 62 61 61
56 57
Airlines Public Serviceoverall
TelephoneService
Providers
My localcouncil
Banks EnergyRetailers
FederalGovernment
Consumer (n=1649) Business (n=457)
02
Avg
sat
isfa
ctio
n (o
ut o
f 10)
LowestHighest
KEY FINDING 4 Public Sector OverallThe SA public services lsquobrandrsquo is viewed positively by both consumers and businesses however service experience outperforms brand score
0102
0203
0302
01 02
Figure 20 Satisfaction with SA Public Service
bull Both consumers and businesses rate SA Public Services higher than most other industries or public service agencies with the exception of Airlines
bull Both consumers and businesses rate satisfaction with SA Government Services as being higher than the satisfaction with the lsquobrandrsquo SA Public Service This suggests factors other than service delivery experiences are impacting brand perception
Consumer Business
10 05 0406 05
Legend Statistically significant increase in avg from 2018 (at 99 level of Confidence)No significant change in avg from 2018 (at 99 level of Confidence)Statistically significant decrease in avg from 2018 (at 99 level of Confidence)
7375 00 +01SA Government Services
Average satisfaction
Consumer Business
22
Source Customer Service Commission Customer Satisfaction Measurement Survey 2019 Report developed in conjunction with the NSW Customer Service CommissionerPublic I1-A2
KEY FINDING 4 Public Sector OverallIn comparison to other jurisdictions as well the SA Public Service lsquobrandrsquo is rated higher than most other industries by consumers and businesses
bull In line with other Australian jurisdictions SA Public Service lsquobrandrsquo performs better relative to other industries (banks) than Public Service lsquobrandrsquo in NZ and UK
Consumer Business
Lowest
Highest
Avg
sat
isfa
ctio
n (b
usin
esse
s)NZ
NZ Govt Service 68
Banks 69
Energy 66
Local council 58
Airlines 74
Telcorsquos 65
NSW
Airlines 71
NSW Public Service 69
Banks 60
Energy 57
Telcorsquos 60
Local council 61
Fed Govt 60
QLD
Airlines 71
QLD Public Service 67
Telcorsquos 61
Local council 61
Banks 57
Energy 57
Fed Govt 58
VIC
Airlines 71
VIC Public Service 65
Banks 58
Energy 57
Local council 59
Fed Govt 57
Telcorsquos 60
SA
Airlines 70
Telcorsquos 62
SA Public Service 66
Banks 61
Energy 56
Local council 61
Fed Govt 57
UK
Airlines 70
Telcorsquos 66
Energy 63
UK Public Service 68
Local Council 61
Banks 68
Business
Figure 21 Comparison of Public service brand perceptions across jurisdictionsCustomers were asked ldquoThinking about all your experiences with each of the following [jurisdiction] industries and public services over the previous 12 months how satisfied would you say you are with them rdquoConsumer
NZ
NZ Govt Service 69
Banks 69
Airlines 74
Telcorsquos 66
Energy 66
Local council 59
NSW NSW
Public Service 71
Airline 71
Telcorsquos 62
Energy 59
Local council 62
Banks 61
Fed Govt 57
QLD
Airlines 70
QLD Public Service 69
VIC SA
Airlines 71
Telcorsquos 61
SA Public Service 66
Local council 60
Banks 59
Energy 54
Fed Govt 53
UK
Airlines 71
UK Public Service 69
Banks 69
Energy 64
Telcorsquos 69
Local council 61
Lowest
Highest
Avg
sat
isfa
ctio
n (c
onsu
mer
s)
Airlines 71
Telcorsquos 63
VIC Public Service 70
Banks 63
Local council 62
Energy 60
Fed Govt 59
Telcorsquos 62
Local council 62
Banks 60
Energy 59
Fed Govt 58
23
Source Customer Service Commission Customer Satisfaction Measurement Survey 2019 Report developed in conjunction with the NSW Customer Service CommissionerPublic I1-A2
06
KEY FINDING 5 (CONSUMER) Top-Line results by DemographicsConsumer satisfaction in regional areas has increased significantly and the expectation gap is almost zero
Average satisfaction among consumers in regional areas has increased significantly by 06 points to 8 out of 10 The expectation score is 81 making the expectation gap just 008
How would you rate your expectation of the overall quality of service
Thinking about your experiences in the last 12 months how satisfied would you say you are with
each of the following services
10
10
106
6
8
13
11
14
81
83
78
80
81
77
Rural(n=349)
Regional(n=332)
Metro(n=2560)
Low (1-4) Neutral (5-6) High (7-10)
Satisfaction Expectation Ideal service
Please imagine an ideal service How well do you think each service compares to that ideal service
-042
-008
-027
-045 -025 -005
Rural (n=349)
Regional (n=332)
Metro (n=2560)
Expectation gap (satisfaction ndash expectation)
10
10
10
respondents Avg respondents Avg
10
10
10
respondents Avg
12
9
14
20
15
19
68
76
68
73
77
71
Rural(n=341)
Regional(n=327)
Metro(n=2504)
Not close to ideal (1-4)Neutral (5-6)Close to ideal (7-10)
Note Expectation gap scores displayed in graph are subject to rounding
9
7
10
15
12
16
75
81
73
75
80
75
Rural(n=353)
Regional(n=337)
Metro(n=2607)
Dissatisfied (1-4)Neutral (5-6)Satisfied (7-10)
Figure 22 Satisfaction expectation and ideal service by region - Consumer
Base Consumers(n=3297)
Base Consumers(n=3241)
Base Consumers(n=3172)
Base Consumers(n=3241)
-
-01
-
+04
+01
-
+06
-
Consumer
Legend Statistically significant increase in avg from 2018 (at 99 level of Confidence)No significant change in avg from 2018 (at 99 level of Confidence)Statistically significant decrease in avg from 2018 (at 99 level of Confidence)
24
Source Customer Service Commission Customer Satisfaction Measurement Survey 2019 Report developed in conjunction with the NSW Customer Service CommissionerPublic I1-A2
7765
727779
6975
81
never givenfeedback
I made acomplaint
I made asuggestionfor change
I gave acompliment
Satisfaction Expectation
7668 69 71
7971 74 75
never givenfeedback
I made acomplaint
I made asuggestion for
change
I gave acompliment
KEY FINDING 6 FeedbackOverall the proportion of consumers and businesses giving feedback remains low Consumers are more likely to give compliments and businesses are more likely to make a complaint
Consumer Business
bull Majority of consumers or businesses did not give any form of feedback
bull 39 of consumers who gave feedback gave a compliment
bull Whereas 42 of businesses who gave feedback made a complaint
bull Consumers and businesses who gave a compliment had a higher satisfaction score compared to those who complained or made a suggestion
Figure 23 Feedback typeQuestion ldquoWhen was the last time you provided feedback to a SA Government Agency or Department about their services processes or employeesrdquoQuestion ldquoWhat was the nature of the feedbackrdquo
Figure 24 Satisfaction and expectation of feedback type Consumer (n=858) Business (n=294)
3070
Consumer n=1998
3961
Business n=502
bull I gave a complimentbull I made a suggestion
for changebull I made a complaint
Business (n=194)
Consumer (n=519)
Given feedbackNever given feedback Donrsquot know
Given feedback
39
42 35
33
23
28
bull I gave a complimentbull I made a suggestion
for changebull I made a complaint
25
Source Customer Service Commission Customer Satisfaction Measurement Survey 2019 Report developed in conjunction with the NSW Customer Service CommissionerPublic I1-A2
Figure 25 Consumer Variation in ease of making a complaint across jurisdictions
KEY FINDING 6 FeedbackA higher proportion of both consumers and businesses found it easier to make complaints this year versus last year
Consumer Business
26
Customers were asked ldquoHow difficult or easy was it to make your complaintrdquo
40 28
26
21
34 51
5361
1
10
0
50
100
2018 2019
Easy (7-10) Neutral (5-6) Difficult (1-4) Average
Axis 2 Average scoreAxis
1
Perc
enta
ge o
f re
spon
sesConsumers
bull 51 of consumers found it easy (7-10 out of 10) to make a complaint versus 34 last year
bull There was a significant increase of 08 points in the average score for consumers (61 out of 10 vs 53 out of 10 last year)
Businessesbull 46 of businesses found it easy (7-10 out of 10)
to make a complaint An improvement of 9 points versus last year
bull The average score remained relatively stable at 55 out of 10
Figure 26 Business Variation in ease of making a complaint across jurisdictionsCustomers were asked ldquoHow difficult or easy was it to make your complaintrdquo
34 36
29 17
3746
57 55
1
10
0
50
100
2018 2019
Easy (7-10) Neutral (5-6) Difficult (1-4) Average
Axis 2 Average scoreAxis
1
Perc
enta
ge o
f re
spon
ses
+08
Source Customer Service Commission Customer Satisfaction Measurement Survey 2019 Report developed in conjunction with the NSW Customer Service CommissionerPublic I1-A2
KEY FINDING 6 FeedbackThere is an opportunity to streamline the complaints resolution process to ensure the experience is positive for consumers and businesses right from making a complaint all the way up to getting a resolution
Consumer Business
27
Customers were asked ldquoHow difficult or easy was it to make your complaintrdquoFigure 28 Variation in ease of making a complaint across jurisdictions
28 36
2117
51 46
6155
1
10
0
50
100
Consumer Business
Easy (7-10) Neutral (5-6) Difficult (1-4) Average
Axis 2 Average scoreAxis
1
Perc
enta
ge o
f re
spon
ses
Customers were asked ldquoHow well or poorly was your most recent complaint handledrdquo
Figure 29 Variation in complaints handling across jurisdictions
41 44
23 24
3632
52 49
1
10
0
50
100
Consumers Business
Handled poorly (1-4) Neutral (5-6) Handled well (7-10) Average
Axis
1
Perc
enta
ge o
f re
spon
ses
Axis 2 Average score
For both consumers and businesses ease of making a complaint does not always translate into a positive experience with the complaint handling process
bull While 51 of consumers found it easy (7-10 out of 10) to make a complaint only 36 of consumers said their complaint had been handled well (7-10 out of 10)
bull Similarly while 46 of businesses found it easy to make a complaint (7-10 out of 10) only 32 said their complaint had been handled well (7-10 out of 10)
Source Customer Service Commission Customer Satisfaction Measurement Survey 2019 Report developed in conjunction with the NSW Customer Service CommissionerPublic I1-A2
Consumersbull The overall satisfaction scores for consumers who had a
good complaint handling experience was higher than the average consumer satisfaction score (80 out of 10 vs 75 out of 10)
bull Consumers who had a good complaint handling experience had higher overall satisfaction (80 out of 10) compared to consumers who had a poor experience (53 out of 10)
Businessesbull Businesses who had a good complaint handling
experience had a higher satisfaction score compared to the average satisfaction score (81 out of 10 vs 73 out of 10)
bull As with consumers businesses who had a positive experience had higher overall satisfaction (81 out of 10) compared to those who had a poor experience (63 out of 10)
Consumer Business
28
80 81
60
71
53
63
75 73
Consumers Business
Handled Well (7-10) Neutral (5-6) Handled Poorly (1-4) Average Satisfaction
Figure 27 Overall satisfaction with government services by ease of making complaints
Aver
age
Satis
fact
ion
Scor
e
KEY FINDING 6 FeedbackGood complaint handling is associated with a higher than average satisfaction with SA Government Services for consumers and businesses
Please note that customers may have rated different services on Satisfaction and Ease of Complaint and the correlation is to be treated as indicative only
Public ndash I1-A2
SOUTH AUSTRALIAN CUSTOMER SATISFACTION MEASUREMENT SURVEY 2019
iii DETAILED FINDINGS
Public ndash I1-A2
SOUTH AUSTRALIAN CUSTOMER SATISFACTION MEASUREMENT SURVEY 2019
1 OVERALL MEASURES TOPLINE ANALYSIS
Source Customer Service Commission Customer Satisfaction Measurement Survey 2019 Report developed in conjunction with the NSW Customer Service CommissionerPublic I1-A2
Outcome Measures Avg responses
ExpectationHow would you rate your expectation of the overall quality of service
SatisfactionThinking about your experiences in the last 12 months how satisfied would you say you are with each of the following services in SA
Ideal servicehellipPlease imagine an ideal service How well do you think each service in SA compares to that ideal service
CONSUMER OVERALL PERFORMANCEConsumer satisfaction with SA Government services has remained stable in 2019
Note Results are subject to rounding
Consumer expectations have remained stable versus last year with an average rating of 79 out of 10
Consumer satisfaction with SA Government services has remained stable at 75 out of 10
Comparison to ideal service has seen no significant change in 2019 and sits at 72 out of 10
Figure 11 2016 2017 2018 and 2019 overall performance - Consumers
Consumer
77
78
77
78
2016
2017
2018
2019
74
76
75
75
2016
2017
2018
2019
70
71
71
72
2016
2017
2018
2019
9
7
7
7
14
14
15
14
77
79
78
79
2016(n=3462)
2017(n=3433)
2018(n=3245)
2019(n=3241)
Low (1-4) Med (5-6) High (7-10)
10
9
10
10
17
16
17
16
73
75
74
75
2016(n=3507)
2017(n=3482)
2018(n=3307)
2019(n=3297)
Dissatisfied (1-4) Neutral (5-6) Satisfied (7-10)
14
13
12
13
20
20
20
18
66
66
68
69
2016(n=3398)
2017(n=3375)
2018(n=3154)
2019(n=3172)
Not close to ideal (1-4) Neutral (5-6) Close to ideal (7-10)
-01
-01
+01
+01
-
+02
+01
-
+01
Legend Statistically significant increase in avg from 2018 (at 99 level of Confidence)No statistical significant change in avg from 2018 (at 99 level of Confidence)Statistically significant decrease in avg from 2018 (at 99 level of Confidence)
31
Source Customer Service Commission Customer Satisfaction Measurement Survey 2019 Report developed in conjunction with the NSW Customer Service CommissionerPublic I1-A2
For businesses expectations have seen no significant change with an average rating of 76 out of 10
Satisfaction amongst businesses has also remained stable at 73 out of 10
Comparison to the ideal service has seen a statistically significant increase of 04 points to 72 out of 10 This is a result of a 6 point increase in the proportion of businesses rating SA Government services close to ideal (7-10)
The proportion of businesses rating services in the lowest bracket (1-4) continues to decline year on year across all performance indicators
Figure 12 2016 2017 2018 and 2019 overall performance - Businesses
Note Results are subject to rounding
Business
Outcome Measures Avg responses
ExpectationHow would you rate your expectation of the overall quality of service
SatisfactionThinking about your experiences in the last 12 months how satisfied would you say you are with each of the following services in SA
Ideal servicehellipPlease imagine an ideal service How well do you think each service in SA compares to that ideal service
13
9
8
7
15
19
16
18
72
73
75
75
2016(n=817)
2017(n=753)
2018(n=801)
2019(n=758)
Low (1-4) Med (5-6) High (7-10)
16
11
10
8
18
21
20
20
67
69
70
72
2016(n=825)
2017(n=769)
2018(n=814)
2019(n=762)
Dissatisfied (1-4) Neutral (5-6) Satisfied (7-10)
19
16
14
12
19
20
23
18
62
63
63
69
2016(n=797)
2017(n=742)
2018(n=795)
2019(n=732)
Not close to ideal (1-4) Neutral (5-6) Close to ideal (7-10)
73
74
75
76
2016
2017
2018
2019
+01
+01
+01
70
71
72
73
2016
2017
2018
2019
+02
+01
+01
67
69
68
72
2016
2017
2018
2019
+02
-01
+04
Legend Statistically significant increase in avg from 2018 (at 99 level of Confidence)No statistical significant change in avg from 2018 (at 99 level of Confidence)Statistically significant decrease in avg from 2018 (at 99 level of Confidence)
BUSINESS OVERALL PERFORMANCEBusiness satisfaction with SA Government services has remained stable in 2019
32
Source Customer Service Commission Customer Satisfaction Measurement Survey 2019 Report developed in conjunction with the NSW Customer Service CommissionerPublic I1-A2
Consumersbull 75 of consumers indicate that they are
satisfied with the SA Government services they have had direct dealings in the last 12 months
bull 79 of consumers indicate that they have high expectations of SA Government services
Businessesbull 72 say they are satisfied - this is a 2
points increase in comparison to last year (70 in 2018) This increase has come from a 2 point decrease in dissatisfied businesses (1-4 out of 10)
bull 75 of businesses indicate that they have high expectations of SA Government services
The above satisfaction scores across consumer and business suggest positive perceptions of recent experiences with SA Government services
The above expectation scores across consumer and business suggest they may have had positive previous experiences (prior to the last 12 months)
bull What Overall expectation is a measure of the quality of services customers expect to receive from a service
bull How Customers were asked ldquoThinking about the following service in SA how would you rate your expectation of the overall quality of servicerdquo
Expectation
78 10
76 10
respondents Avg
7
7
18
14
75
79
Business(n=758)
Consumer(n=3241)
Low (1-4)Med (5-6)High (7-10)
Responses were recorded according to a scale from 1 (very low) to 10 (very high)
+01
+01
bull What Overall satisfaction is a measure of the perceived performance of a service as stated by customers
bull How Customers were asked ldquoThinking about your experiences in the last 12 months how satisfied would you say you are with the following service in SArdquo
Satisfaction
respondents Avg
Responses were recorded according to a scale from 1 (very dissatisfied) to 10 (very satisfied)
8
10
20
16
72
75
Business(n=762)
Consumer(n=3297)
Dissatisfied (1-4)
Neutral (5-6)
Satisfied (7-10)
75 10
73 10
-
+01
Sig Sig
Figure 13 Figure 14
Comparison of current SA performance to expectations
Consumer Business
Legend Statistically significant increase in avg from 2018 (at 99 level of Confidence)No statistical significant change in avg from 2018 (at 99 level of Confidence)Statistically significant decrease in avg from 2018 (at 99 level of Confidence)
PERFORMANCE OF SERVICES COMPARED TO EXPECTATIONSResults against the measures of satisfaction and expectation indicate positive perceptions of SA Government services
33
Source Customer Service Commission Customer Satisfaction Measurement Survey 2019 Report developed in conjunction with the NSW Customer Service CommissionerPublic I1-A2
Consumersbull 69 of consumers rated SA
Government services as performing close to their ideal service (7-10 out of 10)
bull The average score has remained stable versus last year
Businessesbull 69 of businesses rated SA
Government services as performing close to their ideal service (7-10 out of 10)
bull There has been a significant increase of 04 in the average score for lsquoideal servicersquo (72 out of 10) versus last year
bull What Comparison to an ideal service is a measure of how much the customers feel that the service is close to the best it can be
bull How Customers were asked ldquoNow forgetting for a moment the specific service please imagine an ideal service How well do you think the service in SA compares with that ideal servicerdquo
12
13
18
18
69
69
Business(n=732)
Consumer(n=3172)
Not close to ideal (1-4)Neutral (5-6)Close to ideal (7-10)
Comparison to ideal
7210
7210
respondents Avg
Responses were recorded according to a scale from 1 (not very close to ideal) to 10 (very close to ideal)
Sig
+01
+04
Comparison of current SA performance to perceptions of an ideal service
Figure 15 Figure 16
bull What Overall satisfaction is a measure of the perceived performance of a service as stated by customers
bull How Customers were asked ldquoThinking about your experiences in the last 12 months how satisfied would you say you are with the following service in SArdquo
Satisfaction
respondents Avg
Responses were recorded according to a scale from 1 (very dissatisfied) to 10 (very satisfied)
8
10
20
16
72
75
Business(n=762)
Consumer(n=3297)
Dissatisfied (1-4)
Neutral (5-6)
Satisfied (7-10)
75 10
73 10
-
+01
Sig
Consumer Business
Legend Statistically significant increase in avg from 2018 (at 99 level of Confidence)No statistical significant change in avg from 2018 (at 99 level of Confidence)Statistically significant decrease in avg from 2018 (at 99 level of Confidence)
PERFORMANCE OF SERVICES COMPARED TO IDEAL69 of both consumers and businesses rate SA Government services as performing close to their ideal service
34
Source Customer Service Commission Customer Satisfaction Measurement Survey 2019 Report developed in conjunction with the NSW Customer Service CommissionerPublic I1-A2
Note Average satisfaction expectation comparison to ideal service and expectation gap scores are subject to rounding
bull Compared to 2018 satisfaction and expectations have remained stable across jurisdictions with the exceptions of NSW and UK
bull Compared to 2018 SA has improved its ranking by 1 spot when it comes to expectation but has retained its rankings for satisfaction and ideal service
bull NSW has seen a statistically significant increase of 02 points in its satisfaction scores to 78 However the expectation score has also increased statistically significantly to 81 ndashkeeping the gap between expectation and satisfaction unchanged
bull UK has seen a statistically significant decrease of 02 points in expectations to 78
Figure 17 Satisfaction expectation and ideal service across jurisdictions - Consumer
Consumer
Outcomemeasures Avg respondents
ExpectationHow would you rate your expectation of the overall quality of service
SatisfactionThinking about your experiences in the last 12 months how satisfied would you say you are with each of the following services in SA
Ideal service
hellipPlease imagine an idealservice How well do you think each service in SA compares to that ideal service
7
7
7
7
7
6
14
14
13
13
12
11
79
79
80
80
81
84
UK
SA
NZ
QLD
VIC
NSW
Low (1-4)
Medium (5-6)
High (7-10)
78
79
79
79
81
78
10
9
9
9
8
7
16
16
14
15
14
14
75
76
77
76
77
79
SA
UK
VIC
QLD
NZ
NSW
Dissatisfied (1-4)
Neutral (5-6)
Satisfied (7-10)76
76
77
77
78
75
73
73
74
74
75
72
+02
+02
+02
-01
-
+02
-
-
-
+01
-
+01
NA
-01
-01
-02
NA
NA
13
12
12
11
11
10
18
17
17
15
16
15
69
71
71
74
74
75
SA
UK
NZ
QLD
NSW
VIC
Not close toideal (1-4)Neutral (5-6)
Close to ideal(7-10)
Legend Statistically significant increase in avg from 2018 (at 99 level of Confidence)No statistical significant change in avg from 2018 (at 99 level of Confidence)Statistically significant decrease in avg from 2018 (at 99 level of Confidence)
COMPARISON OF SA CONSUMERSrsquo PERCEPTIONS TO OTHER JURISDICTIONSRatings for SA Government services have remained stable versus last year NSW has seen a significant increase and UK has seena significant decrease in satisfaction
35
Source Customer Service Commission Customer Satisfaction Measurement Survey 2019 Report developed in conjunction with the NSW Customer Service CommissionerPublic I1-A2
Note Average satisfaction expectation comparison to ideal service and expectation gap scores are subject to rounding
bull Compared to 2018 all jurisdictions with the exception of QLD and VIC have remained stable in regards to expectations and satisfaction
bull Satisfaction and Expectation scores for SA Government services have remained stable Whereas the ideal service score for SA has seen a significant increase of 04 points to 72
bull After statistically significant declines last year QLD has bounced back showing statistically significant gains across all three performance indicators with satisfaction showing a 05 points increase This has pushed QLD up in the rankings for all three performance indicators
bull VIC has seen decreases across all three performance indicators pushing their ranking down compared to last year
Figure 18 Satisfaction expectation and ideal across jurisdictions - Business
Business
Legend Statistically significant increase in avg from 2018 (at 99 level of Confidence)No statistical significant change in avg from 2018 (at 99 level of Confidence)Statistically significant decrease in avg from 2018 (at 99 level of Confidence)
Outcomemeasures Avg respondents
ExpectationHow would you rate your expectation of the overall quality of service
Satisfaction
Thinking about your experiences in the last 12 months how satisfied would you say you are with each of the following services in SA
Ideal service
hellipPlease imagine an idealservice How well do you think each service in SA compares to that ideal service
7
7
7
7
8
7
17
18
13
15
12
15
77
75
80
78
80
78
VIC
SA
QLD
UK
NZ
NSW
Low (1-4)
Medium (5-6)
High (7-10)
76
77
77
78
78
76
11
8
9
8
6
10
20
20
20
20
19
14
69
72
71
72
75
76
VIC
SA
UK
NSW
NZ
QLD
Dissatisfied (1-4)
Neutral (5-6)
Satisfied (7-10)
71
74
74
75
75
73
16
12
12
10
9
9
15
20
18
22
20
18
70
68
69
69
70
73
VIC
NSW
SA
UK
NZ
QLD
Not close toideal (1-4)
Neutral (5-6)
Close to ideal(7-10)
70
71
73
73
74
72
+06
+01
+01
+01
NA
-01
-
+01
NA
-04
+04
+05
-02
+04
+01
-03
+01
NA
COMPARISON OF SA BUSINESSESrsquo PERCEPTIONS TO OTHER JURISDICTIONSRatings for SA have remained stable across all measures QLD has see significant increases and VIC has seen significant declinesin satisfaction
36
Source Customer Service Commission Customer Satisfaction Measurement Survey 2019 Report developed in conjunction with the NSW Customer Service CommissionerPublic I1-A2
-037
-023
-028
-021
-032
-030
-027
-026
-022
-019
-017
-04 -02 00
VIC
SA
NSW
QLD
UK
NZ
2019 2018
Figure 110 2018 and 2019 expectation gap -Businesses
Note ndash Percentages do not add up to 100 due to exclusion of Donrsquot Know from the analysis
Consumersbull In SA the gap to expectation
remained relatively stable showing a small increase of 004 points versus last year
bull UK has seen an decrease in gap of 013 points
bull VIC has seen a decrease in gap of 007 points
Businessesbull Except QLD all jurisdictions show
an increase in the gap between satisfaction and expectation
bull The gap to expectation in SA has remained relatively stable versus last year increasing only by 003 points
Figure 19 2018 and 2019 expectation gap -Consumers
Consumer Business
-038
-029
-028
-031
-031
-047
-039
-036
-034
-026
-015
-06 -04 -02 00
VIC
NSW
UK
SA
NZ
QLD
2019 2018
NA
NA
Legend Statistically significant increase in avg from 2018 (at 99 level of Confidence)No statistical significant change in avg from 2018 (at 99 level of Confidence)Statistically significant decrease in avg from 2018 (at 99 level of Confidence)
GAP BETWEEN SATISFACTION AND EXPECTATION FOR CONSUMERS AND BUSINESSESIn SA the gap to expectation for both consumers and businesses has seen a slight increase this year
37
Source Customer Service Commission Customer Satisfaction Measurement Survey 2019 Report developed in conjunction with the NSW Customer Service CommissionerPublic I1-A2
-1 -05 0 05Avg
gap
bet
wee
n sa
tisfa
ctio
n an
d ex
pect
atio
n
-15 -1 -05 0 05 1
00
-13
-07
-07
Avg
gap
bet
wee
n sa
tisfa
ctio
n an
d ex
pect
atio
n01
-15
-13
-05
Services with the highest expectation gap
Services with the lowest expectation gap
Note Very small number of responses (nlt=30)All service comparisons will be shown in greater detail in the detailed chapters of this report For further service comparisons see Chapter 9
State Emergency Services (n=45)
Ambulance Services (n=24)
Figure 111 Satisfaction expectation gap - Consumer
Figure 112 Satisfaction expectation gap - Business
Child Welfare Services(n=51)
Courts(n=89)
Prisons(n=21)
Disability Services(n=33)Agricultural
Advice and Funding Services(n=10)
Public Housing (n=16)
Consumersbull There are no services that have a positive
expectation gap State Emergency Services have a zero point gap
bull Prisons have the highest negative expectation gap of -13 points followed by Courts and Child Welfare Services and Major Roads at -07 points
Businessesbull Of those with statistically reliable sample sizes
Disability Services have the highest negative expectation of -05 points
Consumer Business
GAP BETWEEN SATISFACTION AND EXPECTATION BY SERVICEAcross most services both consumers and businesses have a negative gap to expectation (expectation is higher than satisfaction)
-07Major Roads(n=81)
38
Source Customer Service Commission Customer Satisfaction Measurement Survey 2019 Report developed in conjunction with the NSW Customer Service CommissionerPublic I1-A2
Consumer Business
Service(n= for consumers n= for business)
Reach1 Average satisfaction (out of 10)
Average expectation score (out of 10) Gap to expectation
Consumer Business Consumer Business Consumer Business Consumer BusinessFire Brigades (n=24 n=15) 1 2 91 91 93 91 -02 00
State Emergency Serv (n=47 n=13) 3 3 90 87 91 87 00 00
Ambulance Serv (n=208 n=24) 17 7 87 91 90 90 -03 01
Art Galleries and Museums (n=121 n=13) 13 3 87 82 88 84 -02 -02Vehicle Licensing and Registration (n=580 n=135) 56 43 80 71 82 75 -01 -04
Public Schools (n=228 n=51) 19 14 76 66 79 70 -03 -05
Water Supply (n=240 n=67) 24 23 76 74 78 77 -02 -03
Police (n=217 n=35) 21 9 75 80 78 81 -03 -01
Public Hospitals (n=412 n=76) 41 18 74 69 77 72 -03 -03
Public Transport (n=390 n=47) 38 13 74 72 76 76 -02 -03
Consumer Affairs (n=38 n=27) 4 8 73 75 77 77 -04 -02
Documentation Serv (n=42 n=17) 4 5 73 80 76 83 -03 -03Environment and Wildlife Protection (n=38 n=19) 3 4 73 74 75 78 -03 -04
Business Advisory Serv (n=17 n=35) 1 11 73 72 73 75 -01 -03
Serv for Older People (n=114 n=28) 9 7 73 71 77 75 -04 -04
TAFE Serv (n=126 n=36) 11 9 70 67 72 68 -03 -01Agricultural Advice and Funding Serv (n=13 n=10) 1 2 68 61 70 74 -02 -13
Disability Serv (n=100 n=34) 9 10 66 74 70 79 -03 -05
Major Roads (n=86 n=11) 8 3 65 74 71 75 -07 -01
Public Housing (n=87 n=16) 9 5 63 55 67 70 -04 -15
Courts (n=94 n=19) 6 4 63 74 70 79 -07 -05
Prison (n=23 n=14) 2 2 54 79 67 83 -13 -03
Child Welfare Serv (n=52 n=20) 3 3 45 70 52 75 -07 -05
Figure 113 Summary of variation in key performance measures across services
Interpret with caution Very small number of responses (nlt=30) 1 of customers who have interacted with this service in the last 12 months | Top bottom six in each category compared to other services
SUMMARY OF SERVICE PERFORMANCE BY SATISFACTION AND EXPECTATIONIn terms of average satisfaction score Fire Brigades State Emergency Services Ambulance Services and Art Galleries and Museums are the top rating services
39
Public ndash I1-A2
SOUTH AUSTRALIAN CUSTOMER SATISFACTION MEASUREMENT SURVEY 2019
2 PERFORMANCE AGAINST CUSTOMER SATISFACTION ATTRIBUTES
Source Customer Service Commission Customer Satisfaction Measurement Survey 2019 Report developed in conjunction with the NSW Customer Service CommissionerPublic I1-A2
Satisfaction Drivers Average score across respondents (out of 10 according to a scale from 1 strongly disagree to 10 strongly agree)
Employees for SA1) Honesty and integrity of
employees2) Efficiency and effectiveness of
employees3) Communication
Average across attributes
Employees across jurisdictions1) Honesty and integrity of
employees2) Efficiency and effectiveness of
employees3) Communication
Average across attributes
77 76 7675 74 74 74 74 73
7070 69
78 7877
76 76 76 76 7575
72
7172
65
70
75
80
Are
hone
st
Del
iver
hig
h sa
fety
sta
ndar
ds
Prov
ide
serv
ices
with
out b
ias
Expl
ain
inte
nded
act
ions
cle
arly
Enge
nder
con
fiden
ce in
thei
r kno
wle
dge
Com
mun
icat
e w
ell
Prov
ide
good
val
ue s
ervi
ces
Are
relia
ble
Are
cons
iste
nt
Are
held
acc
ount
able
See
thin
gs fr
om m
y pe
rspe
ctiv
e
Get
thin
gs d
one
as q
uick
ly a
s po
ssib
le
NZ (n=2815) UK (n=2897) SA (n=2727) VIC (n=2991) QLD (n=2844) NSW (n=5686)
Average 7410
7510
QLD
7510
NZ
7510
VIC
7510
NSW
7410
UK
Figure 21 Consumer perceptions of employee related attributes
Top 3 performing attributes include
bull lsquoAre honestrsquo (77 out of 10)bull lsquoDeliver high safety standardsrsquo (76 out
of 10) bull lsquoProvide services without biasrsquo (76 out if
10)
Bottom 3 lowest performing attributes include
bull lsquoGet things done as quickly as possiblersquo (69 out of 10)
bull lsquoSee things from my perspectiversquo (70 out of 10)
bull lsquoAre held accountablersquo (70 out of 10)
When compared with other jurisdictions
bull SA along with the UK was the lowest performing jurisdiction (74 out of 10) on average However the gap between highest and lowest performing jurisdictions is very small
Base(n)=2704
77 76 76 75 74 74 74 74 7370 70 69
556065707580
Are
hone
st
Del
iver
hig
hsa
fety
sta
ndar
ds
Prov
ide
serv
ices
with
out b
ias
Expl
ain
inte
nded
actio
ns c
lear
ly
Enge
nder
conf
iden
ce in
thei
r kno
wle
dge
Com
mun
icat
ew
ell
Prov
ide
good
valu
e se
rvic
es
Are
relia
ble
Are
cons
iste
nt
Are
held
acco
unta
ble
See
thin
gs fr
omm
y pe
rspe
ctiv
e
Get
thin
gs d
one
as q
uick
ly a
spo
ssib
le
Consumer
+01 +01 - - - - - - --
+01 -01
CONSUMER PERCEPTION OF EMPLOYEESThere were no statistically significant changes in perceptions of employees versus 2018
Legend Statistically significant increase in avg from 2018 (at 99 level of Confidence)No significant change in avg from 2018(at 99 level of Confidence)Statistically significant decrease in avg from 2018 (at 99 level of Confidence)
41
Source Customer Service Commission Customer Satisfaction Measurement Survey 2019 Report developed in conjunction with the NSW Customer Service CommissionerPublic I1-A2
Satisfaction Drivers Average score across respondents (according to a scale from 1 strongly disagree to 10 strongly agree)
Process for SA1) Simplicity and efficiency of
processes2) Employee autonomy
Average across attributes
Process across jurisdictions1) Simplicity and efficiency of
processes2) Employee autonomy
Average across attributes
7068
65 6563
55
65
75
Processes areeasy to
understand
Employees areempowered tomake decisions
I can get to theright person the
first time
Service feelsseamless even if I
have to usemultiple contact
methods
Are designed toreduce wait timesAverage 66
10
70
68
65 65
63
72
70
6868
67
60
65
70
75
Processes areeasy to understand
Employees areempowered tomake decisions
I can get to theright person the
first time
Service feelsseamless even if I
have to usemultiple contact
methods
Are designed toreduce wait times
NZ (n=2677) UK (n=2735) SA (n=2617) VIC (n=2924) QLD (n=2851) NSW (n=5638)
6910
QLD
6810
NZ
6910
VIC
6910
NSW
6710
UK
bull lsquoProcesses are easy to understandrsquo is the best performing attribute with a score of 7 out of 10 However as with previous years execution of these processes (empowered employees getting to the right person the first time seamless service and wait times) continue to have lower scores ranging from 68 to 63 out of 10 This pattern is observed across all jurisdictions
bull SA is behind other jurisdictions for all process attributes
bull Across all jurisdictions process attributes have the lowest average scores of all attribute categories (Values Goals and Employees) ndashsimplifying and bringing efficiencies to processes remains a challenge for all jurisdictions
Figure 22 Consumer perceptions of process related attributes
Base(n)=2668
Consumer
+01+01
-01 - -
CONSUMER PERCEPTION OF PROCESSESThere have been no statistically significant changes to any of the process attribute scores in comparison to last year
Legend Statistically significant increase in avg from 2018 (at 99 level of Confidence)No significant change in avg from 2018(at 99 level of Confidence)Statistically significant decrease in avg from 2018 (at 99 level of Confidence)
42
Source Customer Service Commission Customer Satisfaction Measurement Survey 2019 Report developed in conjunction with the NSW Customer Service CommissionerPublic I1-A2
Satisfaction Drivers Average score across respondents (according to a scale from 1 strongly disagree to 10 strongly agree)
Goals for SA1) Privacy2) Transparency3) Access
Average across attributes
Goals across jurisdictions1) Privacy2) Transparency3) Access
Average across attributes
7570 68 67
61
55
65
75
Safeguard privacyand confidentiality
Is making it easierto access
information abouttheir services
Is making best useof online services
to improveconvenience and
efficiency forcustomers
Demonstrateopenness andtransparency indecision-making
Encourage publicparticipation in
decision-makingAverage 68
10
75
70
6867
61
76
72
7170
65
60
65
70
75
80
Safeguard privacyand confidentiality
Is making it easierto access
information abouttheir services
Is making best useof online services
to improveconvenience and
efficiency forcustomers
Demonstrateopenness andtransparency indecision-making
Encourage publicparticipation in
decision-making
NZ (n=2681) UK (n=2785) SA (n=2582) VIC (n=2803) QLD (n=2732) NSW (n=5486)
7010
NZ
7010
QLD
7110
VIC
7110
NSW
6910
UK
bull lsquoSafeguard privacy and confidentialityrsquo is the highest rated goal attribute
bull In comparison to other jurisdictions SA continues to lag on all goal attributes
bull lsquoEncourage public participation in decision makingrsquo is the attribute that sees the lowest scores across all jurisdictions It is also the attribute with the widest gap between the top performing and lowest performing jurisdictions (VIC and SA) with a gap of 04 points
Figure 23 Consumer perceptions of goals related attributes
Base(n)=2561
Consumer
CONSUMER PERCEPTION OF GOALSConsumer perceptions of SA Government services against goal related attributes have remained statistically stable versus last year
+01
+01- - -01
Legend Statistically significant increase in avg from 2018 (at 99 level of Confidence)No significant change in avg from 2018(at 99 level of Confidence)Statistically significant decrease in avg from 2018 (at 99 level of Confidence)
43
Source Customer Service Commission Customer Satisfaction Measurement Survey 2019 Report developed in conjunction with the NSW Customer Service CommissionerPublic I1-A2
Satisfaction Drivers Average score across respondents (according to a scale from 1 strongly disagree to 10 strongly agree)
Values for SA1) Service Quality2) Accountability
Average across attributes
Values across jurisdictions1) Service Quality2) Accountability
Average across attributes
Average 7210
73 72 72 70
55
65
75
Operates with integrity Provides good service Is a body I can trust Is accountable for itsservices
7372 72
70
7575
74
73
65
70
75
80
Operates with integrity Provides good service Is a body I can trust Is accountable for itsservices
NZ (n=3108) UK (n=3068) SA (n=2936) VIC (n=3166) QLD (n=3059) NSW (n=6113)
7410
UK
7310
NZ
7410
VIC
7410
NSW
7310
QLD
bull Consumers rate SA Governmentservices high (above 7 out of 10)across all value attributes
bull At an overall level SA is behind all other jurisdictions with the lowest average score across all value attributes
Figure 24 Consumer perceptions of values related attributes
Base(n)=2916
Consumer
- - --
CONSUMER PERCEPTION OF VALUESThere have been no statistically significant changes to the ratings of value attributes versus last year
Legend Statistically significant increase in avg from 2018 (at 99 level of Confidence)No significant change in avg from 2018(at 99 level of Confidence)Statistically significant decrease in avg from 2018 (at 99 level of Confidence)
44
Source Customer Service Commission Customer Satisfaction Measurement Survey 2019 Report developed in conjunction with the NSW Customer Service CommissionerPublic I1-A2
Satisfaction Drivers Average score across respondents (according to a scale from 1 strongly disagree to 10 strongly agree)
Employees for SA1) Honesty and integrity of
employees2) Efficiency and effectiveness of
employees3) CommunicationAverage across attributes
Employees across jurisdictions1) Honesty and integrity of
employees2) Efficiency and effectiveness of
employees3) Communication
75 75 73 72 72 72 71 71 71 69 68 68
55
65
75
85
Are
hone
st
Del
iver
hig
hsa
fety
sta
ndar
ds
Prov
ide
serv
ices
with
out b
ias
Expl
ain
inte
nded
actio
ns c
lear
ly
Enge
nder
conf
iden
ce in
thei
r kno
wle
dge
Com
mun
icat
ew
ell
Are
cons
iste
nt
Prov
ide
good
valu
e se
rvic
es
Are
relia
ble
Are
held
acco
unta
ble
Get
thin
gs d
one
as q
uick
ly a
spo
ssib
le
See
thin
gs fr
omm
y pe
rspe
ctiv
e
7372 73
7271
7170
72 72
68 6968
77 7775
7574
75 75 74 74
7170 71
65
70
75
80
Are
hone
st
Del
iver
hig
h sa
fety
sta
ndar
ds
Prov
ide
serv
ices
with
out b
ias
Expl
ain
inte
nded
act
ions
cle
arly
Enge
nder
con
fiden
ce in
thei
rkn
owle
dge
Com
mun
icat
e w
ell
Are
cons
iste
nt
Prov
ide
good
val
ue s
ervi
ces
Are
relia
ble
Are
held
acc
ount
able
Get
thin
gs d
one
as q
uick
ly a
s po
ssib
le
See
thin
gs fr
om m
y pe
rspe
ctiv
e
NZ (n=757) UK (n=1327) SA (n=657) VIC (n=714) QLD (n=748) NSW (n=1586)
Average 7110
7210
UK
7210
NSW
7310
NZ
7410
QLD
7110
VIC
bull The attribute lsquoAre honestrsquo is the top ranking attribute this year
bull Other top attributes are lsquodeliver high safety standardsrsquo and lsquoprovide services without biasrsquo
Bottom 3 lowest performing attributes are
bull lsquoSee things from my perspectiversquo (68 out of 10)
bull lsquoGet things done as quickly as possiblersquo (69 out of 10)
bull lsquoAre held accountablersquo (68 out of 10)
Across jurisdictions VIC has the lowest average ratings for employee perceptions
QLD has the highest average rating in 2019 after being in the last spot in 2018
Figure 25 Business perceptions of employee related attributes
Base(n)=724
Business
BUSINESS PERCEPTION OF EMPLOYEESThere have been no statistically significant changes to the ratings of employee attributes versus last year
+02 +01 +02 +01 +01 +01 +01 +01 - +02
+01 +01
Legend Statistically significant increase in avg from 2018 (at 99 level of Confidence)No significant change in avg from 2018(at 99 level of Confidence)Statistically significant decrease in avg from 2018 (at 99 level of Confidence)
45
Source Customer Service Commission Customer Satisfaction Measurement Survey 2019 Report developed in conjunction with the NSW Customer Service CommissionerPublic I1-A2
Satisfaction Drivers Average score across respondents (according to a scale from 1 strongly disagree to 10 strongly agree)
Process for SA1) Simplicity and efficiency of
processes2) Employee autonomy
Average across attributes
Process across jurisdictions1) Simplicity and efficiency of
processes2) Employee autonomy
Average across attributes
68 66 65 6561
55
65
75
Processes areeasy to understand
Employees areempowered tomake decisions
Service feelsseamless even if I
have to usemultiple contact
methods
I can get to theright person the
first time
Are designed toreduce wait times
Average 6510
6710
UK
6510
NSW
6710
NZ
6810
QLD
6510
VIC
68
66 65
6561
71
68 6767 67
60
65
70
75
Processes areeasy to understand
Employees areempowered tomake decisions
Service feelsseamless even if I
have to usemultiple contact
methods
I can get to theright person the
first time
Are designed toreduce wait times
NZ (n=731) UK (N=1324) SA (n=661) VIC (n=711) QLD (n=745) NSW (n=1614)
bull Average rating for process attributes are the lowest in comparison to other attributes (employees ndash 71 goals ndash 68 values ndash 71)
bull Among all jurisdictions QLD has the highest average rating of 68 out of 10
bull SA ranks lowest among all jurisdictions for the statement lsquoAredesigned to reduce wait timesrsquo
Figure 26 Business perceptions of process related attributes
Base(n)= 712
Business
BUSINESS PERCEPTION OF PROCESSESAll the processes related attributes have remained stable from 2018 to 2019
+01+01
+01+01-01
Legend Statistically significant increase in avg from 2018 (at 99 level of Confidence)No significant change in avg from 2018(at 99 level of Confidence)Statistically significant decrease in avg from 2018 (at 99 level of Confidence)
46
Source Customer Service Commission Customer Satisfaction Measurement Survey 2019 Report developed in conjunction with the NSW Customer Service CommissionerPublic I1-A2
Satisfaction Drivers Average score across respondents (out of 10 on scale of according to a scale from 1 strongly disagree to 10 strongly agree)
Goals for SA1) Privacy2) Transparency3) Access
Average across attributes
Goals across jurisdictions1) Privacy2) Transparency3) Access
Average across attributes
7469 68 67
63
55
65
75
85
Safeguard privacyand confidentiality
Is making it easierto access
information abouttheir services
Is making best useof online services
to improveconvenience and
efficiency forcustomers
Demonstrateopenness andtransparency indecision-making
Encourage publicparticipation in
decision-makingAverage 68
10
6910
UK
6810
NSW
6910
NZ
6910
QLD
6710
VIC
77
71
69 67
62
71
6866 66
6260
65
70
75
80
Safeguard privacyand confidentiality
Is making it easierto access
information abouttheir services
Is making best useof online services
to improveconvenience and
efficiency forcustomers
Demonstrateopenness andtransparency indecision-making
Encourage publicparticipation in
decision-making
NZ (n=732) UK (n=1295) SA (n=641) VIC (n=681) QLD (n=708) NSW (n=1554)
bull Compared to 2018 lsquoEncourage public participation in decision makingrsquo has seen a statisticallysignificant increase of 04 points to 61 out of 10 However this continues to be the lowest rated goal related attribute
bull Across jurisdictions QLD has the highest average rating of 69
bull The largest gap between jurisdictions is seen for lsquoSafeguard privacy and confidentialityrsquo with NZ having the highest rating of 77 out of 10 and VIC having the lowest rating of 71 out of 10
Figure 27 Business perceptions of goals related attributes
Base(n)= 695
Business
04
Legend Statistically significant increase in avg from 2018 (at 99 level of Confidence)No significant change in avg from 2018(at 99 level of Confidence)Statistically significant decrease in avg from 2018 (at 99 level of Confidence)
BUSINESS PERCEPTION OF GOALSMost goal related attributes with the exception of lsquoEncourage public participation in decision-makingrsquo have remained stable versus last year
+03 -03 +03 +02
47
Source Customer Service Commission Customer Satisfaction Measurement Survey 2019 Report developed in conjunction with the NSW Customer Service CommissionerPublic I1-A2
Satisfaction Drivers Average score across respondents (out of 10 on scale of according to a scale from 1 strongly disagree to 10 strongly agree)
Values for SA1) Service Quality2) Accountability
Average across attributes
Values across jurisdictions1) Service Quality2) Accountability
Average across attributes
Average 7110
74 74 74
71
71 71 71
69
65
70
75
80
Operates with integrity Provides good service Is a body I can trust Is accountable for itsservices
NZ (n=803) UK (n=1367) SA (n=702) VIC (n=748) QLD (n=789) NSW (n=1676)
7210
UK
7110
NSW
7210
QLD
7310
NZ
7010
VIC
72 71 71 70
55
65
75
Operates with integrity Provides good service Is a body I can trust Is accountable for itsservices
bull lsquoIntegrityrsquo is the top rated value attribute with a rating of 72 out of 10
bull While lsquoaccountabilityrsquo is the least rated attribute there has been a 02 point increase (statistically insignificant) versus 2018
bull Across jurisdictions VIC has slipped to the lowest ranking after being the top performing Australian jurisdiction last year and NZ has the highest average rating of 73 out of 10 making it the top performingjurisdiction in 2019
bull The gap between the top performing jurisdiction and lowest performer have narrowed in comparison to last year indicating an improvement in performance across jurisdictions
Figure 28 Business perceptions of values related attributes
Base(n)= 758
Business
BUSINESS PERCEPTION OF VALUESValue related attributes continue to be statistically stable in 2019
+01 +01 +01 +02
Legend Statistically significant increase in avg from 2018 (at 99 level of Confidence)No significant change in avg from 2018(at 99 level of Confidence)Statistically significant decrease in avg from 2018 (at 99 level of Confidence)
48
Source Customer Service Commission Customer Satisfaction Measurement Survey 2019 Report developed in conjunction with the NSW Customer Service CommissionerPublic I1-A2
Employee attributes Goals Processes Values
1Note Groupings of drivers of satisfaction are based on analyses of NSW Government services however it is assumed that drivers of satisfaction are relatively consistent across jurisdictions and generally across service industries broadly
bull Safeguard privacy and confidentiality
Goa
ls
bull Provide good value servicesbull Are honestbull Are reliablebull Deliver high safety standards
Empl
oyee
s
bull Are consistentbull Explain intended actions clearlybull Communicate wellbull Engender confidence in their
knowledge
Communication of employees
bull Are held accountablebull Get things done as quickly as
possible
Efficiency and Effectiveness of employeesHonesty and integrity of employees
Employee autonomySimplicity and efficiency of processes
bull Processes are easy to understandbull Service feels seamless across channelsbull Processes are designed to reduce wait timesbull I can get to the right person the first time
bull Employees are empowered to make decisions
Accountability and Service Quality
bull Is a body that I can trustbull Operates with integritybull Provides good value servicesbull Is accountable for its services
Proc
esse
sVa
lues
Access to Information and Online services PrivacyTransparency
bull Demonstrate openness and transparency in decision making
bull Encourage public participation in decision making
bull Is making it easier to access information about their service
bull Is making best use of online services to improve efficiency for customers
bull See things from my perspective
bull Provide services without bias
Fairness and Empathy of employees
Consumer
GROUPINGS OF DRIVERS OF CUSTOMER SATIFACTION1
The groupings of drivers have changed from 2018 - lsquoFairness and Empathyrsquo is now a key standalone driver of consumer satisfaction differentiated from Communication which continues to be a key driver of consumer satisfaction
49
Source Customer Service Commission Customer Satisfaction Measurement Survey 2019 Report developed in conjunction with the NSW Customer Service CommissionerPublic I1-A2
KEY
When looking at the relative importance of satisfaction drivers in NSW Employee related attributes are seen to have the highest relative importance as drivers of satisfaction with lsquoHonesty and Integrityrsquo being the most important driverRelating this to the areas of improvement for the SA Governmentbull Honesty and Integrity is a strength that the SA
Government services can build on to improve consumer satisfaction
bull Access to information and online services as well as efficiency and effectiveness of employees are primary opportunities to drive higher consumer satisfaction
Note Groupings of drivers of satisfaction are based on analyses of NSW Government services however it is assumed that drivers of satisfaction are relatively consistent across jurisdictions and generally across service industries broadly
LOW
HIGH
Average score across attributes (SA)(out of 10)
LOW
HIGH
Rel
ativ
e im
port
ance
(NSW
)
Median across all attributes
1Note Analysis displayed is based on NSW customer data however similar results are observed for businesses Calculation is based on the relativity of parameters in the statistical analysis of drivers against satisfaction
Strengths to lsquobuild onrsquo
Median across drivers
Primary opportunities
Secondary opportunities
Fairness and Empathy
Simplicity and efficiency of processes
Transparency
Access to information and online services
Privacy
Employee autonomy
Employee attributes Goals Processes
Figure 211 Importance (NSW) versus performance (SA) against each of the drivers of satisfaction
Monitor
Communication
Consumer
Efficiency and effectiveness
Honesty and integrity
PRIORITISATION OF DRIVERS OF SATISFACTION1
Build on the honesty and integrity of employees and focus on improving their efficiency and effectiveness to drive higher satisfaction In addition focus on improving access to information and online services
50
Public ndash I1-A2
SOUTH AUSTRALIAN CUSTOMER SATISFACTION MEASUREMENT SURVEY 2019
3 SATISFACTION BY CONTACT METHOD AND DIGITAL INSIGHTS
Source Customer Service Commission Customer Satisfaction Measurement Survey 2019 Report developed in conjunction with the NSW Customer Service CommissionerPublic I1-A2
51
4135
29
128
47
40
29 27
15
6
Inperson
Phone Online Email Mail fax Thirdparties
2018 Business (n=814) 2019 Business (n=762)
c
usto
mer
s w
ho h
ave
had
dire
ct
deal
ings
via
this
cha
nnel
Figure 33 2018 and 2019 channel usage - Business
Figure 34 2018 and 2019 most preferred channel ndash Business
2922 22 22
2 4
3224 23
16
3 2
In person Email Phone Online Mailfax Thirdparties
2018 Business(n=795) 2019 Business(n=743)
Note ndash Percentages do not add up to 100 due to exclusion of Donrsquot Know from the analysis
Businessesbull While lsquoin personrsquo remains the most
used channel for contact there is a continued decline in usage since 2017 (52 in 2017 51 in 2018 47 in 2019) though not statistically significant
bull Despite the year on year declines lsquoin personrsquo continues to be the most preferred channel and there has been a year on year growth in preference since 2017 (27 in 2017 29 in 2018 32 in 2019)
57
3325
139 6
58
3426
1610
5
Inperson
Phone Online Email Mail fax Thirdparties
2018 Consumer (n=3307) 2019 Consumer (n=3297)
34
22 2112
4 2
3324 21
16
4 2
Inperson
Phone Online Email Mailfax Thirdparties
2018 Consumer (n=3307) 2019 Consumer (n=3170)
cus
tom
ers
who
hav
e ha
d di
rect
de
alin
gs v
ia th
is c
hann
el
Figure 31 2018 and 2019 channel usage - Consumer
Figure 32 2018 and 2019 most preferred channel - Consumer
Consumersbull lsquoIn personrsquo continues to be the most used
channel for contact as well as the most preferred channel Usage has remained consistent versus last year
bull Phone usage by consumers continues to see a year on year uptick though statistically insignificant (31 in 2017 33 in 2018 and 34 in 2019)
bull Relative preferences for the channels have remained unchanged versus last year
Consumer Business
CONTACT METHODS USED AND PREFERREDlsquoIn-personrsquo continues to be the most used and preferred method of contact for both consumers and businesses
52
Source Customer Service Commission Customer Satisfaction Measurement Survey 2019 Report developed in conjunction with the NSW Customer Service CommissionerPublic I1-A2
47
41
3130
12
5
4442
2529
96
56
40
24
31
96
4650
25
40
16
4
51
41
24
37
13
3
47
40
29 27
15
6
In person face toface
Telephone Online Email Mail posted letterfax
Third parties
NSW (n=1801) VIC (n=790) QLD (n=832)
UK (n=1420) NZ (n=868) SA (n=762)
Customers were asked ldquoWhich of the following contact methods have you used to carry out your direct dealings with the following services in [Jurisdiction] in the last 12 monthsrdquo
Figure 35 Contact method used to interact with government services across jurisdictions
59
31 31
16
84
54
33
2320
10
6
59
31
24
17
10
5
53
36
23 2116
2
57
31
24
19
13
2
58
34
26
16
105
In person face toface
Telephone Online Email Mail posted letterfax
Third parties
NSW (n=6771) VIC (n=3458) QLD (n=3346)UK (n=3310) NZ (n=3550) SA (n=3297)
Consumer
Business
Consumersbull Face to face is the most used channel
by consumers to access government services in all jurisdictions
bull NSW leads the way when it comes to the use of online channels
Businessesbull Face to face is the most used channel by
businesses to access government services in all jurisdictions
bull NSW leads in the adoption of online as a contact method followed by SA
bull Business usage of telephones and emails as a contact method is higher than that for consumers across all jurisdictions
Consumer Business
CONTACT METHODS USED AND PREFERREDlsquoIn-personrsquo is the most used contact method across all jurisdictions for both consumers and businesses SA is second to NSW in the usage of online as the method of contact for both consumers and businesses
53
Source Customer Service Commission Customer Satisfaction Measurement Survey 2019 Report developed in conjunction with the NSW Customer Service CommissionerPublic I1-A2
28
24 24
18
42
26
22
28
20
2 2
29
25
22
18
3 2
25
2826
16
5
0
29
26
23
18
31
32
24 23
16
32
In person face toface
Email Telephone Online Mail posted letterfax
Third parties
NSW (n=1759) VIC (n=774) QLD (n=809)UK (n=1401) NZ (n=850) SA (n=743)
35
18
24
18
32
33
23
19 19
52
34
21 20 20
42
31
2219
22
6
1
34
21 21 20
41
33
2421
16
42
In person face toface
Telephone Online Email Mail posted letterfax
Third parties
NSW (n=6491) VIC (n=3336) QLD (n=3246)UK (n=3177) NZ (n=3399) SA (n=3170)
CONTACT METHODS PREFERRED ACROSS JURISDICTIONSlsquoIn-personrsquo continues to be the most preferred channel across all jurisdictions for both consumers and businesses
Customers were asked ldquoGenerally which contact method do you most prefer when dealing directly with each of the following services inhelliprdquo
Figure 36 Contact method preferred to interact with government services across jurisdictions
Consumer
Business
Consumersbull Face to face is the preferred method of
contact for consumers to access government services in all jurisdictions
bull The pattern of preference is consistent with that of reported channel usage
Businessesbull Businesses prefer a variety of contact
methods to access government servicesbull Of all jurisdictions SA businesses have
the highest preference for face to face interactions
Consumer Business
54
Source Customer Service Commission Customer Satisfaction Measurement Survey 2019 Report developed in conjunction with the NSW Customer Service CommissionerPublic I1-A2
75
70 71 71 69 68
73 73 72 72 7167
50
60
70
80
In person Online Mailfax Phone Email Third parties2018 Business(n=814) 2019 Business(n=762)
Aver
age
satis
fact
ion
scor
e (1
-10)
76 7573 72 72
70
77 75 74 73 71 70
50
60
70
80
Online In person Third parties Phone Mailfax Email2018 Consumer (n=3307) 2019 Consumer (n=3297)
Aver
age
satis
fact
ion
scor
e (1
-10)
VARIATION IN CUSTOMER SATISFACTION BY CONTACT METHODWhile lsquoin-personrsquo is the most used and most preferred method of contact satisfaction of consumers with SA Government services is higher for those who use Online channels For businesses satisfaction is high for both in-person and online channel users
Customers were asked ldquoWhich of the following contact methods have you used to carry out your direct dealings with the following servicesrdquo
Figure 37 Variation in overall satisfaction by contact method
+01+01
+03
- -
+02+01
+01
+01
-01
Consumersbull Satisfaction ratings are high (7+ out
of 10) across all contact channelsbull Consumers who have used online
channels to contact have the highest satisfaction rating and this has remained relatively stable from last year
Businessesbull Satisfaction amongst businesses
using different channels have remained relatively stable compared to last year
bull Businesses who have used face to face or online methods of contact have the highest satisfaction rating
+01
Consumer Business
Legend Statistically significant increase in avg from 2018 (at 99 level of Confidence)No significant change in avg from 2018 (at 99 level of Confidence)Statistically significant decrease in avg from 2018 (at 99 level of Confidence)
-02
55
Source Customer Service Commission Customer Satisfaction Measurement Survey 2019 Report developed in conjunction with the NSW Customer Service CommissionerPublic I1-A2
7978
74
7675
74
76 77
7374
7273
7877
75 75 75
71
76 7675 75
71 71
77 76
7475
73
77
75
74 73
7170
Online In person face to face Third parties such asAustralia Post
Telephone Mail posted letter fax Email
NSW (n=6771) VIC (n=3458) QLD (n=3346) UK (n=3310) NZ (n=3550) SA (n=3297)
7575
71
7271 71
73 73 73
69
67
73
77
73
7776
71
68
75
72
68
74
71
70
74
79
76
71
73
77
73 7372 72 71
67
In person face toface
Online Mail posted letter fax Telephone Email Third parties such asAustralia Post
NSW (n=1801) VIC (n=790) QLD (n=832) UK (n=1420) NZ (n=868) SA (n=762)
Figure 38 Overall satisfaction with government services by contact method(s) used across jurisdictions
Aver
age
scor
e (1
-10)
Aver
age
scor
e (1
-10)
Consumer
Business
Consumersbull Across jurisdictions
consumers who use online channels have the highest satisfaction with their respective government services
bull Consumers in NZ using online channels show the highest satisfaction of all jurisdictions
Businessesbull In all jurisdictions except
NZ businesses that use face to face have the highest satisfaction with their respective government services In NZ online users have the highest satisfaction
bull SA businesses who use third party channels show the lowest satisfaction in comparison to businesses that use other channels
Consumer Business
VARIATION IN CUSTOMER SATISFACTION BY CONTACT METHOD ACROSS JURISDICTIONSConsumers who use online and businesses who use face to face have higher satisfaction with government services across jurisdiction
81
56
Source Customer Service Commission Customer Satisfaction Measurement Survey 2019 Report developed in conjunction with the NSW Customer Service CommissionerPublic I1-A2
7069
65 66
62
6765
63 6360
6866
63 6261
6461
59 59 58
70
67 66 6564
69 6865 65
62
Processes are easy tounderstand
Employees are empoweredto make decisions
Service feels seamlesseven if I have to
communicate acrossdifferent channels (ieonline phone email)
I can get to the right personthe first time
Are designed to reducewait times
In person face to face (n=1418) Mail posted letter fax (n=229)
Telephone (landline mobile calls text message) (n=883) Email (n=419)
Online (n=591) Third parties such as Australia Post (n=117)
6865 66 66
61
66 66 66 66
55
6462 62 62
57
65 6562 61
57
6865 63 63
60
74
69 6972
65
Processes are easy tounderstand
Service feels seamlesseven if I have to
communicate acrossdifferent channels
Employees are empoweredto make decisions
I can get to the right personthe first time
Are designed to reducewait times
In person face to face (n=300) Mail posted letter fax (n=87)
Telephone (landline mobile calls text message) (n=280) Email (n=207)
Online (n=178) Third parties such as Australia Post (n=31)
Figure 310 Perceptions of processes by channel(s) used - Business
Figure 39 Perceptions of processes by channel(s) used - Consumers
Aver
age
scor
e (1
-10)
Aver
age
scor
e (1
-10)
Consumersbull Consumers who have used in-person channels give
the highest scores for lsquoprocesses are easy to understandrsquo lsquoemployees are empowered to make decisionsrsquo and lsquoI can get to the right person the first timersquo
bull Consumers who have used online channels gave the highest ratings to lsquoService feels seamlessrsquo and lsquoare designed to reduce wait timesrsquo
bull Consumers who have used email rate the SA Government service lowest across all process attributes
Businessesbull Businesses who have used third party channels have
given the highest ratings for all process attributesbull Businesses that used mail posted letter or fax as
their method of contact rated the SA Government lowest on processes lsquoare designed to reduce wait timesrsquo attribute
bull Businesses that used telephone gave the lowest ratings to the attributes of lsquoprocesses are easy to understandrsquo lsquoservice feels seamlessrsquo and lsquoemployees are empowered to make decisionsrsquo
bull Business that used email gave the lowest rating to lsquoI can get to the right person the first timersquo
Consumer Business
PERCEPTIONS OF PROCESSES BY CONTACT METHODConsumers and businesses have different perceptions of processes based on the channels they have used
57
Source Customer Service Commission Customer Satisfaction Measurement Survey 2019 Report developed in conjunction with the NSW Customer Service CommissionerPublic I1-A2
79 79 78 78 78 78 78 75
102030405060708090100
0102030405060708090
100
I trust myinformation was
handledsecurely
through thewebsiteapp
I achieved theoutcome by
using servicesavailable online
The contentwas current
and accurate
The format ofcontent met my
accessrequirements
I was satisfiedwith the overallexperience of
using thewebsiteapp tocomplete the
task
Thewebsiteapp
was useful andallowed me todo everything Ineeded to do
Content andsupport
provided onlinewas sufficientto answer my
questions
I found thewebsite appsimple and itwas easy to
find what I waslooking for
Disagree (1-4) Neutral (5-6) Agree (7-10) Average
Customers were asked ldquoThinking about your experiences interacting with SA services online in the last 12 months to what extent do you agree or disagree with each of the following statementsrdquo
Figure 311 Satisfaction with attributes of online services
82 81 81 80 79 79 79 78
102030405060708090100
0102030405060708090
100
The contentwas current
and accurate
I achieved theoutcome by
using servicesavailable online
I trust myinformation
was handledsecurely
through thewebsiteapp
The format ofcontent met my
accessrequirements
I was satisfiedwith the overallexperience of
using thewebsiteapp tocomplete the
task
Thewebsiteapp
was useful andallowed me todo everything Ineeded to do
Content andsupport
provided onlinewas sufficientto answer my
questions
I found thewebsite appsimple and itwas easy to
find what I waslooking for
Disagree (1-4) Neutral (5-6) Agree (7-10) Average
Axis 2 Average Score
Consumer (n=798)
Business (n=210)
Axis
1
Perc
enta
ge o
f re
spon
ses
Axis 2 Average ScoreAxis
1
Perc
enta
ge o
f re
spon
ses
Consumersbull Consumers had an average rating of 79
out of 10 when asked about their satisfaction with the overall experience of using the website app to complete the task This rating has stayed stable since 2017
bull Consumers showed the highest levels of agreement with statements pertaining to accuracy of content achieving desired outcomes by using online services and trusting that their information was handled securely
Businessesbull There has been a significant increase in
the average rating across all attributes of online service except content accuracy ndash this has remained stable
bull The rating on satisfaction with the overall experience has gone up significantly by 08 points to 78
+01 +01 +01 +02+01 +01 +02
+05 NA +04 +09 +08 +06 +06
Consumer Business
Legend Statistically significant increase in avg from 2018 (at 99 level of Confidence)No significant change in avg from 2018 (at 99 level of Confidence)Statistically significant decrease in avg from 2018 (at 99 level of Confidence)
NA
+09
SATISFACTION WITH ONLINE SERVICES OVERALLConsumer satisfaction with overall experience of using online services has remained stable while business satisfaction has increased significantly from 2018 to 2019
58
Source Customer Service Commission Customer Satisfaction Measurement Survey 2019 Report developed in conjunction with the NSW Customer Service CommissionerPublic I1-A2
Businessesbull Businesses had similar motivations as
consumers for not using online as a channel to access services ndash lack of availability of services online as well as inability to find what they were looking for
Customers were asked ldquoYou mentioned that you did not go online to access the service in the last 12 months Please select all statements that apply in relation to these service(s) in SA I did not complete this interaction online becausehelliprdquo
Figure 312 Reasons for not going online I did not go online hellip
Consumer (n=2401)
Business (n=762)
37 16 12 7 7 6 5 5 3
The servicewasnt
possible to beundertaken
online
The servicewas notavailable
online
I was not ableto find what Iwas looking
for
There was noonline supportto answer any
questions Imay havesuch aswebchat
I didnt haveaccess to acomputer or
an onlinedevice
The format ofcontent on the
website didnot meet my
accessrequirements
I was not sureif my
informationwould remainconfidential
No incentivewas provided
such as adiscount
The contentwas not
current andoraccurate
Consumersbull The main reason for consumers not using
online channels to access services was that the services were not available or couldnrsquot be undertaken online
bull The other big factor was that consumers were unable to find what they were looking for
bull Uncertainty around confidentiality of information was not seen as a big deterrent in accessing services online
Consumer Business
37 17 11 8 8 7 7 6 3
The servicewasnt
possible to beundertaken
online
The servicewas notavailable
online
I was not ableto find what Iwas looking
for
There was noonline supportto answer any
questions Imay havesuch aswebchat
I didnt haveaccess to acomputer or
an onlinedevice
The format ofcontent on the
website didnot meet my
accessrequirement
I was not sureif my
informationwould remainconfidential
No incentivewas provided
such as adiscount
The contentwas not
current andoraccurate
ADOPTING ONLINE METHODS TO INTERACT WITH SA GOVERNMENT SERVICESA main reason for consumers and businesses not using online channels to access services is a lack of online service availability
re
spon
dent
s
resp
onde
nts
59
Source Customer Service Commission Customer Satisfaction Measurement Survey 2019 Report developed in conjunction with the NSW Customer Service CommissionerPublic I1-A2
77
15 8
I chose to go online I was directed to or was prompted to go online There was no other option available
10
10
10
Avg
10
10
10
Avg
Customers were asked ldquoDid you choose to go online or were you directed to go onlinerdquo
Figure 313 Choice to go online
18
11
5
16
19
11
65
70
84
70
73
81
There wasno otheroption
available
I wasdirected to
or wasprompted
to goonline
I chose togo online
Strong disagree (1-4) Neutral (5-6) Strongly agree (7-10)
respondents
15
14
2
19
16
49
66
83
62
75
80
There wasno otheroption
available
I wasdirected or
promoted togo online
I chose togo online
respondents
Consumer Business
74
224
Figure 314 Satisfaction with using websiteapp by choice to go onlineCustomers were asked ldquoHow satisfied were you with the overall experience of using the websiteapp to complete the taskrdquo
n=843 n=220
Consumer (n=822) Business (n=218)
uarr1 darr2
24
Consumersbull 77 of consumers who used online methods chose to
go online themselves while 8 said there was no other option available to them
bull Consumers who chose to go online were more satisfied with the overall experience of using the websiteapp to complete the task (81 out of 10 ndash an increase of 03 points versus 2018)
bull There was an increase in satisfaction across all 3 types of online users ndash voluntary (78 in 2018) prompted to (72 in 2018) didnrsquot have any other option (68 in 2018)
Businessesbull Businesses saw a 7 points increase in those choosing
to go online This was due to a 5 point decrease in those saying they had no other choice and 2 point decrease in those saying they were directed to or were prompted to go online
bull Businesses who chose to go online saw a 09 point increase in satisfaction versus last year (8 out of 10 in 2019 vs 71 out of 10 In 2018)
bull Even those who said they had no other option showed higher satisfaction of 62 out of 10 (+07 points vs 2018)
uarr7
Consumer Business
darr1
darr5
CUSTOMER CHOICE TO USE ONLINE SERVICES77 of consumers and 74 of businesses chose to go online to access government services and they have the highest satisfaction
60
Source Customer Service Commission Customer Satisfaction Measurement Survey 2019 Report developed in conjunction with the NSW Customer Service CommissionerPublic I1-A2
50 4640
17
31
52 53
10
Smartphone Laptop computer Desktop computer TabletiPad
Consumer (n=843)Business (n=220)
Customers were asked ldquoWhat devices did you use to access the online content Please select all contact methods that applyrdquo
Figure 315 Devices used when dealing with SA Government services online
Figure 316 Satisfaction with online services by device used Customers were asked ldquoHow satisfied were you with the overall experience of using the websiteapp to complete the taskrdquo
re
spon
dent
s
77
79 798080
74
80
76
Smartphone Laptop computer Desktop computer TabletiPad
Consumer (n=822)Business (n=218)
Aver
age
satis
fact
ion
(out
of 1
0)
Consumer Business
Consumersbull While most consumers (50) used smartphones
to access online content their satisfaction levels with their experience was lower (77 out of 10) compared to those who used desktops or laptops to access online content (79 out of 10)
bull Few consumers are using tabletsiPad (17) but those that do have high levels of satisfaction (8 out of 10)
Businessesbull Most businesses used laptops (52) or desktops
(53) to access online content Desktop users had a higher overall satisfaction (8 out of 10) compared to laptop users (74 out of 10)
bull In contrast to consumers only 31 of businessesused smartphones to access content online however they had higher levels of satisfaction with the overall experience (8 out of 10)
DEVICE USED BY CUSTOMERS FOR ONLINE SERVICESMost consumers used smartphones but the satisfaction levels of those who used smartphones was lower than users of other channels Fewer businesses used smartphones but those that did showed higher levels of satisfaction
61
Public ndash I1-A2
SOUTH AUSTRALIAN CUSTOMER SATISFACTION MEASUREMENT SURVEY 2019
4 PUBLIC SERVICE OVERALL
Source Customer Service Commission Customer Satisfaction Measurement Survey 2019 Report developed in conjunction with the NSW Customer Service CommissionerPublic I1-A2
Customers were asked ldquoThinking about all your experiences with each of the following Australian industries and public services over the previous 12 months how satisfied would you say you are with them rdquo
Figure 41 Satisfaction with SA Public Service overall compared to industries
bull Average satisfaction with the SA Public Service lsquobrandrsquo is 66 for both consumers and businesses ndashrelatively stable versus last year
bull Both consumers and businesses continue to rate SA Public Service lsquobrandrsquo higher than most other industries and public services except airlines
bull Satisfaction with SA Government services continues to be higher than satisfaction with the lsquobrandrsquo for both consumers and businesses This suggests a continued disconnect between service delivery and lsquobrandrsquo perceptions that are influenced by a range of factors such as media and reputation
+02
31
27
22
23
21
14
8
30
34
30
30
28
30
28
39
40
47
47
51
56
64
56
57
61
61
62
66
70
Energy Retailers(n=485)
FederalGovernment
(n=465)
My local council(n=477)
Banks (n=486)
Telephone ServProviders(n=477)
SA PublicService overall
(n=484)
Airlines (n=457)
Dissatisfied (1-4) Neutral (5-6) Satisfied (7-10)
respondents Avg
Business (n=457) respondents Avg
Consumer (n=1649)
7375 00 +01
+03
+01
+01
+02
+03
+02
+02
+02
+10
+04
+05
+05
+0636
35
27
25
24
15
9
26
28
26
27
26
27
24
38
37
47
49
49
59
67
53
54
59
60
61
66
71
FederalGovernment
(n=1835)
EnergyRetailers(n=1924)
Banks(n=1934)
My local council(n=1876)
Telephone ServProviders(n=1930)
SA PublicService overall
(n=1915)
Airlines(n=1649)
Dissatisfied (1-4) Neutral (5-6) Satisfied (7-10)
SA Government Services
Average satisfaction
Consumer Business
Legend Statistically significant increase in avg from 2018 (at 99 level of Confidence)No significant change in avg from 2018 (at 99 level of Confidence)Statistically significant decrease in avg from 2018 (at 99 level of Confidence)
Consumer Business
Note scores are subject to rounding and may not sum to 100
PERCEPTIONS OF THE SA PUBLIC SERVICE lsquoBRANDrsquoBoth consumers and businesses rate the SA Public Services lsquobrandrsquo higher than all other industries and public services with the exception of airlines
63
Source Customer Service Commission Customer Satisfaction Measurement Survey 2019 Report developed in conjunction with the NSW Customer Service CommissionerPublic I1-A2
bull NSW Public Service lsquobrandrsquo has the most positive perception amongst consumers Whereas the Public Service lsquobrandsrsquo in SA is second only to Airlines as with QLD and VIC
bull Businesses also have similar perceptions of the Public Service lsquobrandrsquo across all jurisdictions In Australia the average satisfaction ratings are second to airlines Whereas in UK and NZ airlines and banks have higher average satisfaction ratings
Lowest
Highest
Avg
sat
isfa
ctio
n (b
usin
esse
s)
NZ
NZ Govt Service 68
Banks 69
Energy 66
Local council 58
Airlines 74
Telcorsquos 65
NSW
Airlines 71
NSW Public Service 69
Banks 60
Energy 57
Telcorsquos 60
Local council 61
Fed Govt 60
QLD
Airlines 71
QLD Public Service 67
Telcorsquos 61
Local council 61
Banks 57
Energy 57
Fed Govt 58
VIC
Airlines 71
VIC Public Service 65
Banks 58
Energy 57
Local council 59
Fed Govt 57
Telcorsquos 60
SA
Airlines 70
Telcorsquos 62
SA Public Service 66
Banks 61
Energy 56
Local council 61
Fed Govt 57
UK
Airlines 70
Telcorsquos 66
Energy 63
UK Public Service 68
Local Council 61
Banks 68
Business
Figure 42 Comparison of Public service brand perceptions across jurisdictionsCustomers were asked ldquoThinking about all your experiences with each of the following [jurisdiction] industries and public services over the previous 12 months how satisfied would you say you are with them rdquoConsumer
NZ
NZ Govt Service 69
Banks 69
Airlines 74
Telcorsquos 66
Energy 66
Local council 59
NSW NSW
Public Service 71
Airline 71
Telcorsquos 62
Energy 59
Local council 62
Banks 61
Fed Govt 57
QLD
Airlines 70
QLD Public Service 69
VIC SA
Airlines 71
Telcorsquos 61
SA Public Service 66
Local council 60
Banks 59
Energy 54
Fed Govt 53
UK
Airlines 71
UK Public Service 69
Banks 69
Energy 64
Telcorsquos 69
Local council 61
Consumer Business
Lowest
Highest
Avg
sat
isfa
ctio
n (c
onsu
mer
s)
Airlines 71
Telcorsquos 63
VIC Public Service 70
Banks 63
Local council 62
Energy 60
Fed Govt 59
Telcorsquos 62
Local council 62
Banks 60
Energy 59
Fed Govt 58
PUBLIC SERVICE lsquoBRANDrsquo COMPARISON BY JURISDICTIONAustralian jurisdictions perform better than NZ and UK in perceptions of their public service lsquobrandsrsquo for both consumers andbusinesses relative to other industries
64
Source Customer Service Commission Customer Satisfaction Measurement Survey 2019 Report developed in conjunction with the NSW Customer Service CommissionerPublic I1-A2
Respondents were asked to select from a list of positive and negative descriptors of SA Public Service bull The top five descriptors of the SA Public Service
overall were all positive and consistent with 2018
bull The most commonly selected negative brand descriptors are lsquoinefficientrsquo lsquoimpersonalrsquo lsquoinflexiblersquo and lsquodifficultrsquo This pattern is similar to 2018
0
10
20
30
40Innovative
Motivated
Modern
Flexible
Accountable
Caring
EfficientHonest
Respectful
Knowledgeable
Capable
Friendly
Helpful
Figure 43 Positive Descriptors of the SA Public Service overall - Consumer
Customers were asked ldquoThinking now about the SA Public Service overall and all of the services and agencies which fall under it which of the following words would you use to describe the SA Public Service rdquo
0
10
20
30
40Lazy
Controlling
Patronising
Outdated in digitalservices
Complacent
Wasteful
Inflexible
Difficult
Impersonal
Inefficient
2018 Consumer (n=1999) 2019 Consumer (n=1998)
Figure 44 Negative Descriptors of the SA Public Service overall -Consumer
Top 5 descriptors
Consumer
CONSUMER DESCRIPTIONS OF THE SA PUBLIC SERVICE lsquoBRANDrsquoThe top 5 descriptors used by consumers to describe SA Public Service are lsquohelpfulrsquo lsquofriendlyrsquo lsquocapablersquo lsquoknowledgeablersquo and lsquorespectfulrsquo
65
Source Customer Service Commission Customer Satisfaction Measurement Survey 2019 Report developed in conjunction with the NSW Customer Service CommissionerPublic I1-A2
0
10
20
30
40
Outdated in digitalservices
Patronising
Lazy
Controlling
Complacent
Difficult
Inflexible
Impersonal
Wasteful
Inefficient
2018 Business (n=551) 2019 Business (n=502)
bull In contrast to last year businesses have described SA Public services more positively this year
bull All positive attributes have seen an increase in proportion of responses with the exception of lsquoinnovativersquo (-2 points vs last year) and lsquoaccountablersquo (-2 points vs last year)
bull The top 5 descriptors are lsquohelpfulrsquo (+6 points vs last year) lsquofriendlyrsquo (+4 points vs last year) lsquocapablersquo (+9 points vs last year) lsquoknowledgeablersquo (+3 points vs last year) and lsquorespectfulrsquo (+3 points vs last year)
bull Conversely all negative attributes have seen a decrease in proportion of responses compared to last year
0
10
20
30
40Innovative
Motivated
Modern
Flexible
Caring
Accountable
EfficientHonest
Respectful
Knowledgeable
Capable
Friendly
Helpful
Figure 45 Positive descriptors of the SA Public Service overall - business
Businesses were asked ldquoThinking now about the SA Public Service overall and all of the services and agencies which fall under it which of the following words would you use to describe the SA Public Service rdquo
Figure 46 Negative descriptors of the SA Public Service overall - business
Top 5 descriptors
Business
BUSINESS DESCRIPTIONS OF THE SA PUBLIC SERVICE lsquoBRANDrsquoThe top 5 descriptors used by businesses to describe SA Public Service are lsquohelpfulrsquo lsquofriendlyrsquo lsquocapablersquo lsquoknowledgeablersquo andlsquorespectfulrsquo
66
Public ndash I1-A2
SOUTH AUSTRALIAN CUSTOMER SATISFACTION MEASUREMENT SURVEY 2019
5 FEEDBACK
Source Customer Service Commission Customer Satisfaction Measurement Survey 2019 Report developed in conjunction with the NSW Customer Service CommissionerPublic I1-A2
NATURE OF FEEDBACK AND FEEDBACK CHANNELSProcesses are the most common source of complaints while employees are a more common source of compliments
68
Consumersbull Processes are the most common source of
complaints Consumers also complain about outcomes of their interactions
bull Compliments mainly relate to interactions with employees
bull Both complaints and compliments are mainly made in person whereas consumers take to emails to make suggestions for change
Businessesbull Complaints and suggestions are mainly made
about processes and outcomes of interactions
bull Compliments most often relate to the information available to businesses
bull As with consumers businesses complain or compliment mostly in-person
bull Businesses also use email to give compliments and emails are the preferred method to make suggestions
11
44
28
16
2
42
14
23
18
3
32
17
28
12
11
Theprocesses
Theemployees
youinteracted
with
Theoutcomes of
yourinteraction
Informationavailable to
you
Other
I gave a compliment I made a suggestion for change I made a complaint
22
22 26
30
0
47
17
14
22
0
36
18
33
13
0
Theprocesses
Theemployees
youinteracted
with
Theoutcomes of
yourinteraction
Informationavailable to
you
Other
Figure 51 Nature of feedback by feedback typeQuestion ldquoWhat did your feedback primarily relate to rdquo
Consumer (n = 519) Business (n = 192)
2242
30
5233
38
17 1416
4 6 105 4 5
I gave acompliment
I made asuggestion for
change
I made acomplaint
37 41 37
37 29 45
5 19921 11 5
04
I gave acompliment
I made asuggestion for
change
I made acomplaint
bull Other
bull Via postal letter
bull Via servicersquos website
bull In person face to face or via the phone
bull Via email
Figure 52 Nature of feedback and feedback channelsQuestion ldquoHow did you provide your feedbackrdquo
Consumer (n=519) Business (n=194)
Consumer Business
Source Customer Service Commission Customer Satisfaction Measurement Survey 2019 Report developed in conjunction with the NSW Customer Service CommissionerPublic I1-A2
37
44
3538
45
4041
3633
4036
42
21 20
31
2219 18
NSW (n=529) VIC (n=186) QLD (n=184) UK (n=456) SA (n=194) NZ (n=215)
Complaint Suggestion for change Compliment
28 28 29
33 33
2829
37
27 28 28
33
43
35
44
39 39 39
NSW (n=1203) VIC (n=569) QLD (n=528) UK (n=619) SA (n=519) NZ (n=520)
Complaint Suggestion for change Compliment
Figure 53 Overall satisfaction with Government services by contact method(s) used across jurisdictions
o
ffee
dbac
k ev
er re
ceiv
ed
of f
eedb
ack
ever
rece
ived
Consumer (Base Consumers in each jurisdiction who ever provided feedback)
Business (Base Businesses in each jurisdiction who ever provided feedback)
Consumer Business
JURISDICTIONAL COMPARISON OF NATURE OF FEEDBACKOf all jurisdictions SA received the highest proportion of complaints from both consumers and businesses
Consumersbull Compliments form the highest
proportion of all feedback received across all jurisdictions except VIC
bull Across jurisdictions SA and UK received the highest proportion of complaints
bull QLD was the jurisdiction to receive the highest proportion of compliments closely followed by NSW
Businessesbull Unlike consumers complaints and
suggestions form most of the feedback received from businesses
bull SA received the highest proportion of complaints Closely followed by VIC
bull QLD was the jurisdiction where businesses gave the highest proportion of compliments
69
Source Customer Service Commission Customer Satisfaction Measurement Survey 2019 Report developed in conjunction with the NSW Customer Service CommissionerPublic I1-A2
41
23
36
handled poorly (1-4)2neutral (5-6)Handled well (7-10)
Consumersbull Most consumers who gave feedback
(39) gave a compliment
bull Complaints make up 33 of all feedback This is consistent with last year
bull Of consumers who complained 41 said their complaint was handled poorly However this is an improvement from last year where 54 had said their feedback was handled poorly
Businessesbull In contrast the proportion of feedback
from businesses that were complaints went up to 42 from 27 last year
bull Of this 44 said their feedback was handled poorly ndash up from 38 in the last year
23
35
42
39
28
33
bull I gave a compliment
bull I made a suggestion for change
bull I made a complaint
Consumer (n=519)
Business (n=194)
Figure 5455 Complaint handling of consumers and businessesQuestion ldquoHow well or poorly was your most recent complaint handledFigure 56 Proportion of feedback types for consumers and businessesQuestion ldquoWhat was the nature of your feedbackrdquo
Base n=169 consumers who made a complaint
Base n=83 businesses who made a complaint
Base n=519 consumers and n=194 businesses who ever
provided feedback
Figure 56 Figure 55Figure 54
Consumer Business
44
24
32
handled poorly (1-4)2neutral (5-6)Handled well (7-10)
COMPLAINT HANDLING EXPERIENCE41 of consumers and 44 of businesses said their complaints had been handled poorly
70
Source Customer Service Commission Customer Satisfaction Measurement Survey 2019 Report developed in conjunction with the NSW Customer Service CommissionerPublic I1-A2
Customers were asked ldquoHow well or poorly was your most recent complaint handledrdquo
Figure 57 Variation in complaints handling across jurisdictions
Consumer
Business
Consumersbull VIC had the highest proportion of positive
ratings from consumers in relation to complaints handling (44 rated 7-10 out of 10) SA was second with 36 of complaints being handled well
bull The average rating was neutral (52 out of 10) ndash an improvement of 08 points compared to last year (44 out of 10) This was second highest behind VIC
Businessesbull The average rating was just below neutral at
49 out of 10 However this is an improvement of 02 points compared to last year (47 out of 10)
bull Of the Australian jurisdictions SA has the lowest proportion of poorly handled complaints and the highest average rating
bull UK has the lowest proportion of poorly handled complaints and the highest average rating of 53 out of 10 of all jurisdictions
39 41 41 46 50 55
17 2325
23 23 17
44 36 34 30 28 28
5652
50
48 45 43
1
10
0
50
100
VIC(n=154)
SA(n=169)
UK(n=196)
NZ(n=138)
QLD(n=140)
NSW(n=314)
Handled poorly (1-4) Neutral (5-6) Handled well (7-10) Average
Axis
1
Perc
enta
ge o
f re
spon
ses
Axis 2 Average score
35 44 49 45 50 52
24 2415
3418 22
41 32 3621
32 26
53 49
49
48 46 45
1
10
0
50
100
UK(n=174)
SA(n=83)
QLD(n=72)
VIC(n=69)
NSW(n=184)
NZ(n=76)
Handled well (7-10) Neutral (5-6) Handled poorly (1-4) Average
Axis
1
Perc
enta
ge o
f re
spon
ses
Axis 2 Average score
Responses were provided according to a scale from 1 (handled very poorly) to 10 (handled very well)
Consumer Business
COMPARISON OF PERFORMANCE IN COMPLAINTS MANAGEMENT ACROSS JURISDICTIONSFor consumers SA had the second highest proportion of complaints being handled well behind VIC For businesses SA had the lowest proportion of poorly handled complaints compared to all jurisdictions
71
Source Customer Service Commission Customer Satisfaction Measurement Survey 2019 Report developed in conjunction with the NSW Customer Service CommissionerPublic I1-A2
Customers were asked ldquoHow well or poorly was your most recent complaint handledrdquo
Figure 58 Variation in complaints handling by region
Consumer
Business
bull In metro areas over 40 of both consumers and businesses rated their complaints as being handled poorly (1-4 out of 10)
bull Sample sizes for both consumers and businesses in rural and regional SA are too small to be statistically representative and cannot be evaluated meaningfully
4626 22
17 41
44
37 32 34
50 56
58
1
10
0
50
100
Metro(n=139)
Regional(n=14)
Rural(n=16)
Handled poorly (1-4) Neutral (5-6) Handled well (7-10) Average
Axis
1
Perc
enta
ge o
f re
spon
ses
Axis 2 Average score
45
100
29
28
57
47
11
66
1
10
0
50
100
Metro(n=67)
Regional(n=4)
Rural(n=12)
Handled well (7-10) Neutral (5-6) Handled poorly (1-4) Average
Axis
1
Perc
enta
ge o
f re
spon
ses
Axis 2 Average score
Responses were provided according to a scale from 1 (handled very poorly) to 10 (handled very well)Note interpret with caution when sample size is lower than n =30
Consumer Business
COMPARISON OF PERFORMANCE IN COMPLAINTS MANAGEMENT BY REGION46 of consumers and 45 of businesses in Metro areas say their complaints were handled poorly
72
Source Customer Service Commission Customer Satisfaction Measurement Survey 2019 Report developed in conjunction with the NSW Customer Service CommissionerPublic I1-A2
Customers were asked ldquoHow difficult or easy was it to make your complaintrdquoFigure 59 Variation in ease of making a complaint across jurisdictions
Consumer
Business
Consumersbull 51 of consumers who made a complaint said it was
easy to do so (7-10 out of 10) This is an improvement from 34 in 2018
bull The average rating was neutral (61 out of 10) This is an improvement of 08 points compared to last year (53 out of 10 in 2018)
bull VIC had the highest proportion of consumers saying it was easy to make a complaint (56) Whereas NSW was the jurisdiction with the lowest proportion of consumers saying so (47)
Businessesbull 46 of businesses in SA who made a complaint said it
was easy to do so (7-10 out of 10) This is an improvement from 37 in 2018
bull 36 rated it as difficult (1-4 out of 10) ndash this is 2 points higher than last year (34) and makes SA the jurisdiction with the second highest proportion of lsquodifficultrsquo ratings behind QLD
bull Improvement in the proportion of businesses rating the process as lsquoeasyrsquo has pushed the average rating to 55 out of 10 (vs 47 out of 10 last year) However SA continues to be the jurisdiction with the lowest rating as other jurisdictions have also seen an improvement in their average rating
26 28 29 31 31 33
18 21 18 19 23 26
5651 54 50
47 4065 61 61 59 58 56
1
10
0
50
100
VIC(n=159)
SA(n=174)
NZ(n=148)
UK(n=199)
NSW(n=333)
QLD(n=150)
Easy (7-10) Neutral (5-6) Difficult (1-4) Average
21 28 25 31 37 36
30 19 29 24 31 17
4953 46 45 33
4662 61 59 58 55 55
1
10
0
50
100
NZ(n=78)
UK(n=176)
VIC(n=70)
NSW(n=188)
QLD(n=74)
SA(n=83)
Easy (7-10) Neutral (5-6) Difficult (1-4) Average
Responses were provided according to a scale from 1 (very difficult) to 10 (very easy)
Axis 2 Average scoreAxis 2 Average score
Axis
1
Perc
enta
ge o
f re
spon
ses
Axis
1
Perc
enta
ge o
f re
spon
ses
Consumer Business
COMPARISON OF PERFORMANCE IN EASE OF MAKING A COMPLAINT ACROSS JURISDICTIONSIn SA 51 of consumers said it was easy to make a complaint 46 of businesses echoed the sentiment ndash an improvement from 37 last year
73
Source Customer Service Commission Customer Satisfaction Measurement Survey 2019 Report developed in conjunction with the NSW Customer Service CommissionerPublic I1-A2
10
1
1
1
1
1
1
1
2
2
2
3
3
3
3
4
5
5
5
6
8
8
12
13
Other (n=57)
State Emergency Services (n=4)
Agricultural Advice and Fundinghellip
Environment and Wildlifehellip
Business Advisory Services (n=2)
Prisons (n=4)
Fire Brigades (n=4)
Child Welfare Services (n=9)
Courts (n=10)
Art Galleries and Museumshellip
Documentation Services (n=9)
Consumer Affairs (Fair Trading)hellip
Ambulance Services (n=17)
TAFE Services (n=23)
Services for Older People (n=20)
Major Roads (n=26)
Public Housing (n=25)
Disability Services (n=29)
Police (n=27)
Public Schools (n=33)
Water Supply (n=45)
Vehicle Licensing andhellip
Public Transport (n=63)
Public Hospitals (n=81)
13
1
1
1
1
1
2
2
2
2
3
3
5
5
5
5
6
6
7
7
9
15
Other (n=26)
Art Galleries (n=1)
Prisons (n=2)
Business Adv Serv (n=2)
Environ Protectn (n=5)
Ambulance Services (n=3)
Agri Advice and Funding (n=2)
Courts (n=4)
Vehicle Licensing amp Reg (n=8)
Child Welfare Services (n=5)
Documentation Services (n=3)
Disability Services (n=10)
Police (n=14)
TAFE Services (n=14)
Serv for Older (n=7)
Major Roads (n=11)
Public Transport (n=16)
Public Housing (n=8)
Public Hospitals (n=16)
Public Schools (n=8)
Consumer Affairs (n=12)
Water Supply (n=25)
Consumersbull Similar to last year Public Hospitals Public
Transport and Vehicle Licensing and Registration accounted for 30 of the most recent complaints received
bull Public Hospitals saw an increase of 1 points and Public Transport saw an increase of 2 points versus last year
bull Complaints to Vehicle Licensing declined by 2 points
Businessesbull Water Supply continued to receive the most
complaints and showed an increase of 3 points versus last year
Note that sample sizes are low for these services and while results may not be statistically representative they indicate potential trends to be investigated more robustly
Figure 512 Volume of complaints across servicesCustomers that had made a complaint in the past were asked ldquoWhich SA Government Department or Agency did you most recently complain tordquo
respondents respondentsConsumer Business
Note interpret with caution when sample size is lower than n =30 All businesses results have been provided for indicative purposes only as the sample size for all services is lt30
Data unavailable as nlt10
Consumer Business
VARIATION IN COMPLAINTS ACROSS SA GOVERNMENT SERVICESPublic Hospitals receive the highest proportion of complaints from consumers and Water Supply receive the highest proportion ofcomplaints from businesses
74
Public ndash I1-A2
SOUTH AUSTRALIAN CUSTOMER SATISFACTION MEASUREMENT SURVEY 2019
The data in this chapter compares the perceptions of SA government services Where sample sizes for segments are low (lt30) data is provided for indicative purposes only
APPENDIX 1ANALYSIS BY SERVICE
Source Customer Service Commission Customer Satisfaction Measurement Survey 2019 Report developed in conjunction with the NSW Customer Service CommissionerPublic I1-A2
Consumer
91 9087 87
8076 76 75 74 74 73 73 73 73 73
70 68 66 65 63 63
54
45
10
20
30
40
50
60
70
80
90
100
0
25
50
75
100
Fire
Brig
ades
(n=2
4)
Stat
e Em
erge
ncy
Serv
ices
(n=4
7)
Ambu
lanc
e Se
rvic
es (n
=208
)
Art G
alle
ries
and
Mus
eum
s (n
=121
)
Vehi
cle
Lice
nsin
g an
d R
egis
tratio
n (n
=580
)
Publ
ic S
choo
ls (n
=228
)
Wat
er S
uppl
y (n
=240
)
Polic
e (n
=217
)
Publ
ic H
ospi
tals
(n=4
12)
Publ
ic T
rans
port
(n=3
90)
Con
sum
er A
ffairs
(n=3
8)
Doc
umen
tatio
n Se
rvic
es (n
=42)
Envi
ronm
ent a
nd W
ildlif
e Pr
otec
tion
(n=3
8)
Busi
ness
Adv
isor
y Se
rvic
es (n
=17
)
Serv
ices
for O
lder
Peo
ple
(n=1
14)
TAFE
Ser
vice
s (n
=126
)
Agric
ultu
ral A
dvic
e an
d Fu
ndin
g Se
rvic
es (n
=13
)
Dis
abilit
y Se
rvic
es (n
=100
)
Maj
or R
oads
(n=8
6)
Publ
ic H
ousi
ng (n
=87)
Cou
rts (n
=94)
Pris
ons
(n=2
3)
Chi
ld W
elfa
re S
ervi
ces
(n=5
2)
Dissatisfied (1-4) Neutral (5-6) Satisfied (7-10) Average
Axis
1
Perc
enta
ge o
f res
pons
es
Axis 2 Average Score
Figure 1 Variation in consumersrsquo satisfaction across SA Government Services
Customers were asked ldquoThinking about your experiences in the last 12 months how satisfied would you say you are with each of the following services in SArdquo
VARIATION IN CONSUMERSrsquo SATISFACTION ACROSS SERVICESAcross SA Government services consumersrsquo satisfaction is highest for Fire Brigades State Emergency Services Ambulance Services and Art Galleries and Museums
Average SA consumer satisfaction ndash 75 (n=3297)
Note Interpret with caution Very small number of responses (nlt=30) 76
Source Customer Service Commission Customer Satisfaction Measurement Survey 2019 Report developed in conjunction with the NSW Customer Service CommissionerPublic I1-A2
Consumer
Figure 2 Variation in customersrsquo expectation across SA Government Services
Customers were asked ldquoThinking about each of the following services in SA how would you rate your expectation of overall quality of servicerdquo
VARIATION IN CONSUMERSrsquo EXPECTATION ACROSS SERVICESConsumers have higher expectations of overall service quality from Fire Brigade State Emergency Services Ambulance Services and Art Galleries amp Museums This is consistent with the high satisfaction ratings these services have
93 91 90 88
8279 78 78 77 77 77 76 76 75 73 72 71 70 70 70 67 67
52
1
2
3
4
5
6
7
8
9
10
0
25
50
75
100
Fire
Brig
ades
(n=2
4)
Stat
e Em
erge
ncy
Serv
ices
(n=4
5)
Ambu
lanc
e Se
rvic
es (n
=205
)
Art G
alle
ries
and
Mus
eum
s (n
=121
)
Vehi
cle
Lice
nsin
g an
d R
egis
tratio
n (n
=574
)
Publ
ic S
choo
ls (n
=223
)
Polic
e (n
=216
)
Wat
er S
uppl
y (n
=234
)
Con
sum
er A
ffairs
(n=3
7)
Publ
ic H
ospi
tals
(n=4
08)
Serv
ices
for O
lder
Peo
ple
(n=1
13)
Doc
umen
tatio
n Se
rvic
es (n
=42)
Publ
ic T
rans
port
(n=3
83)
Envi
ronm
ent a
nd W
ildlif
e Pr
otec
tion
(n=3
7)
Busi
ness
Adv
isor
y Se
rvic
es (n
=17
)
TAFE
Ser
vice
s (n
=125
)
Maj
or R
oads
(n=8
1)
Cou
rts (n
=89)
Agric
ultu
ral A
dvic
e an
d Fu
ndin
g Se
rvic
es (n
=13
)
Dis
abilit
y Se
rvic
es (n
=96)
Pris
ons
(n=2
1)
Publ
ic H
ousi
ng (n
=86)
Chi
ld W
elfa
re S
ervi
ces
(n=5
1)
Low (1-4) Medium (5-6) High (7-10) Average
Axis
1
Perc
enta
ge o
f res
pons
es
Axis 2 Average Score
Average SA consumer expectation ndash 78 (n=3241)
Note Interpret with caution Very small number of responses (nlt=30) 77
Source Customer Service Commission Customer Satisfaction Measurement Survey 2019 Report developed in conjunction with the NSW Customer Service CommissionerPublic I1-A2
VARIATION IN CONSUMERSrsquo COMPARISON TO AN IDEAL SERVICE ACROSS SERVICESConsumers perceive State Emergency Services Fire Brigades Ambulance Services and Art Galleries and Museums to be performing closest to an ideal service This is consistent with findings relating to satisfaction and expectation
Figure 3 Consumersrsquo comparison to an ideal service across services
Customers are asked ldquoNow forgetting for a moment these specific services please imagine an ideal service How well do you think each service in SA compares with that ideal servicerdquo
9086 85 83
77 76 75 74 73 73 71 69 69 69 67 67 66 6459 59 57
54
44
1
2
3
4
5
6
7
8
9
10
0
25
50
75
100
Stat
e Em
erge
ncy
Serv
ices
(n=4
6)
Fire
Brig
ades
(n=2
3)
Ambu
lanc
e Se
rvic
es (n
=205
)
Art G
alle
ries
and
Mus
eum
s (n
=119
)
Vehi
cle
Lice
nsin
g an
d R
egis
tratio
n (n
=560
)
Busi
ness
Adv
isor
y Se
rvic
es (n
=17
)
Polic
e (n
=207
)
Doc
umen
tatio
n Se
rvic
es (n
=42)
Publ
ic S
choo
ls (n
=216
)
Agric
ultu
ral A
dvic
e an
d Fu
ndin
g Se
rvic
es (n
=12
)
Wat
er S
uppl
y (n
=226
)
Publ
ic T
rans
port
(n=3
80)
Publ
ic H
ospi
tals
(n=3
97)
TAFE
Ser
vice
s (n
=122
)
Con
sum
er A
ffairs
(n=3
6)
Serv
ices
for O
lder
Peo
ple
(n=1
09)
Envi
ronm
ent a
nd W
ildlif
e Pr
otec
tion
(n=3
7)
Dis
abilit
y Se
rvic
es (n
=96)
Cou
rts (n
=89)
Publ
ic H
ousi
ng (n
=82)
Maj
or R
oads
(n=8
1)
Pris
ons
(n=1
9)
Chi
ld W
elfa
re S
ervi
ces
(n=5
1)
Not close to ideal (1-4) Neutral (5-6) Very close to ideal (7-10) Average
Axis
1
Perc
enta
ge o
f res
pons
es
Axis 2 Average Score
Average SA consumer ideal ndash 72 (n=3172)
Consumer
Note Interpret with caution Very small number of responses (nlt=30) 78
Source Customer Service Commission Customer Satisfaction Measurement Survey 2019 Report developed in conjunction with the NSW Customer Service CommissionerPublic I1-A2
VARIATION IN CONSUMERSrsquo ldquoEXPECTATION GAPrdquo ACROSS SERVICESAcross all services consumers have a negative ldquoexpectation gaprdquo
-13
-07
-07
-07
-04
-04
-04
-03
-03
-03
-03
-03
-03
-03
-03
-02
-02
-02
-02
-02
-01
-01
00
-15 -1 -05 0 05 1 15
Prisons (n=21)
Courts (n=89)
Child Welfare Services (n=51)
Major Roads (n=81)
Services for Older People (n=113)
Consumer Affairs (n=37)
Public Housing (n=86)
Police (n=216)
Documentation Services (n=42)
Public Schools (n=223)
Ambulance Services (n=205)
Disability Services (n=96)
Public Hospitals (n=408)
Environment and Wildlife Protection (n=37)
TAFE Services (n=125)
Agricultural Advice and Funding Services (n=13)
Fire Brigades (n=24)
Water Supply (n=234)
Art Galleries and Museums (n=121)
Public Transport (n=383)
Vehicle Licensing and Registration (n=574)
Business Advisory Services (n=17)
State Emergency Services (n=45)
Figure 4 Consumer gap to expectation by servicesThe gap between satisfaction and expectation provides an understanding of how customers perceive their recent experience compares to expectationsThe gap to expectation is calculated individually for each customers as Gap = satisfaction score ndash expectation score
Consumer
Note Interpret with caution Very small number of responses (nlt=30)
79
Source Customer Service Commission Customer Satisfaction Measurement Survey 2019 Report developed in conjunction with the NSW Customer Service CommissionerPublic I1-A2
91 9187
82 80 80 7975 74 74 74 74 74 72 72 71 71 70 69 67 66
6155
1
2
3
4
5
6
7
8
9
10
0
25
50
75
100
Fire
Brig
ades
(n=1
5)
Ambu
lanc
e Se
rvic
es (n
=24
)
Stat
e Em
erge
ncy
Serv
ices
(n=1
3)
Art G
alle
ries
and
Mus
eum
s (n
=13
)
Doc
umen
tatio
n Se
rvic
es (n
=17
)
Polic
e (n
=35)
Pris
ons
(n=1
4)
Con
sum
er A
ffairs
(n=2
7)
Envi
ronm
ent a
nd W
ildlif
e Pr
otec
tion
(n=1
9)
Maj
or R
oads
(n=1
1)
Dis
abilit
y Se
rvic
es (n
=34)
Wat
er S
uppl
y (n
=67)
Cou
rts (n
=19
)
Publ
ic T
rans
port
(n=4
7)
Busi
ness
Adv
isor
y Se
rvic
es (n
=35)
Vehi
cle
Lice
nsin
g an
d R
egis
tratio
n (n
=135
)
Serv
ices
for O
lder
Peo
ple
(n=2
8)
Chi
ld W
elfa
re S
ervi
ces
(n=2
0)
Publ
ic H
ospi
tals
(n=7
6)
TAFE
Ser
vice
s (n
=36)
Publ
ic S
choo
ls (n
=51)
Agric
ultu
ral A
dvic
e an
d Fu
ndin
g Se
rvic
es (n
=10
)
Publ
ic H
ousi
ng (n
=16
)
Dissatisfied (1-4) Neutral (5-6) Satisfied (7-10) Average
Axis
1
Perc
enta
ge o
f res
pons
es
Axis 2 Average Score
Figure 5 Variation in businessesrsquo satisfaction across SA Government Services
Customers were asked ldquoThinking about your experiences in the last 12 months how satisfied would you say you are with each of the following services in SArdquo
Average SA business satisfaction ndash 73 (n=762)
VARIATION IN BUSINESSESrsquo SATISFACTION ACROSS SERVICES
Business
Note Interpret with caution Very small number of responses (nlt=30)
Of the services with sufficient sample size (ngt30) Police Disability Services and Water Supply have above average satisfaction scores
80
Source Customer Service Commission Customer Satisfaction Measurement Survey 2019 Report developed in conjunction with the NSW Customer Service CommissionerPublic I1-A2
Figure 6 Variation in businessesrsquo expectation across SA Government Services
Customers were asked ldquoThinking about each of the following services in SA how would you rate your expectation of overall quality of servicerdquo
VARIATION IN BUSINESSESrsquo EXPECTATION ACROSS SERVICESOf the services with sufficient (ngt30) sample sizes Police Disability Services Water Supply and Public Transport have above average expectation scores
91 90 8784 83 83 81 79 79 78 77 77 76 75 75 75 75 75 74 72 70 70 68
1
2
3
4
5
6
7
8
9
10
0
25
50
75
100
Fire
Brig
ades
(n=1
5)
Ambu
lanc
e Se
rvic
es (n
=24
)
Stat
e Em
erge
ncy
Serv
ices
(n=1
3)
Art G
alle
ries
and
Mus
eum
s (n
=13
)
Doc
umen
tatio
n Se
rvic
es (n
=17
)
Pris
ons
(n=1
3)
Polic
e (n
=35)
Dis
abilit
y Se
rvic
es (n
=33)
Cou
rts (n
=19
)
Envi
ronm
ent a
nd W
ildlif
e Pr
otec
tion
(n=1
9)
Con
sum
er A
ffairs
(n=2
7)
Wat
er S
uppl
y (n
=67)
Publ
ic T
rans
port
(n=4
7)
Vehi
cle
Lice
nsin
g an
d R
egis
tratio
n (n
=134
)
Serv
ices
for O
lder
Peo
ple
(n=2
8)
Busi
ness
Adv
isor
y Se
rvic
es (n
=35)
Maj
or R
oads
(n=1
1)
Chi
ld W
elfa
re S
ervi
ces
(n=2
0)
Agric
ultu
ral A
dvic
e an
d Fu
ndin
g Se
rvic
es (n
=10
)
Publ
ic H
ospi
tals
(n=7
5)
Publ
ic S
choo
ls (n
=51)
Publ
ic H
ousi
ng (n
=16
)
TAFE
Ser
vice
s (n
=36)
High (7-10) Medium (5-6) Low (1-4) Average
Axis
1
Perc
enta
ge o
f res
pons
esAxis 2 Average Score
Average SA business expectation ndash76 (n=758)
Business
Note Interpret with caution Very small number of responses (nlt=30)
81
Source Customer Service Commission Customer Satisfaction Measurement Survey 2019 Report developed in conjunction with the NSW Customer Service CommissionerPublic I1-A2
95
87 8580 80 78 78
75 73 73 73 71 71 70 70 70 69 69 6966 66 65
59
1
2
3
4
5
6
7
8
9
10
0
25
50
75
100
Fire
Brig
ades
(n=1
5)
Ambu
lanc
e Se
rvic
es (n
=23
)
Stat
e Em
erge
ncy
Serv
ices
(n=1
2)
Art G
alle
ries
and
Mus
eum
s (n
=13
)
Polic
e (n
=33)
Envi
ronm
ent a
nd W
ildlif
e Pr
otec
tion
(n=1
7)
Doc
umen
tatio
n Se
rvic
es (n
=17
)
Cou
rts (n
=18
)
Publ
ic T
rans
port
(n=4
5)
Pris
ons
(n=1
4)
Vehi
cle
Lice
nsin
g an
d R
egis
tratio
n (n
=132
)
Agric
ultu
ral A
dvic
e an
d Fu
ndin
g Se
rvic
es (n
=10
)
Busi
ness
Adv
isor
y Se
rvic
es (n
=34)
Wat
er S
uppl
y (n
=63)
TAFE
Ser
vice
s (n
=33)
Serv
ices
for O
lder
Peo
ple
(n=2
8)
Maj
or R
oads
(n=1
1)
Con
sum
er A
ffairs
(n=2
5)
Dis
abilit
y Se
rvic
es (n
=32)
Chi
ld W
elfa
re S
ervi
ces
(n=2
0)
Publ
ic H
ospi
tals
(n=7
3)
Publ
ic S
choo
ls (n
=48)
Publ
ic H
ousi
ng (n
=16
)
Not close to ideal (1-4) Neutral (5-6) Very close to ideal (7-10) Average
Figure 7 Businessesrsquo comparison to an ideal service across services
Customers are asked ldquoNow forgetting for a moment these specific services please imagine an ideal service How well do you think each service in SA compares with that ideal servicerdquo
VARIATION IN BUSINESSESrsquo COMPARISON TO AN IDEAL SERVICE ACROSS SERVICESOf the services with sufficient (ngt30) sample sizes Police Public Transport and Vehicle Licensing and Registration have above average scores of comparison to ideal service
Axis
1
Perc
enta
ge o
f res
pons
esAxis 2 Average Score
Average SA business ideal ndash 72 (n=732)
Business
Note Interpret with caution Very small number of responses (nlt=30)
82
Source Customer Service Commission Customer Satisfaction Measurement Survey 2019 Report developed in conjunction with the NSW Customer Service CommissionerPublic I1-A2
Figure 8 Business gap to expectation by servicesThe gap between satisfaction and expectation provides an understanding of how customers perceive their recent experience compares to expectations The gap to expectation is calculated individually for each customers as Gap = satisfaction score ndash expectation score
VARIATION IN BUSINESSESrsquo ldquoEXPECTATION GAPrdquo ACROSS SERVICES
-13-05
-05-05-05
-04-04-04
-03-03-03-03-03-03
-02-02
-01-01-01
0000
01
-15 -1 -05 0 05 1 15
Public Housing (n=16)Agricultural Advice and Funding Services (n=10)
Disability Services (n=33)Courts (n=19)
Child Welfare Services (n=20)Public Schools (n=51)
Services for Older People (n=28)Vehicle Licensing and Registration (n=134)
Environment and Wildlife Protection (n=19)Documentation Services (n=17)
Public Transport (n=47)Business Advisory Services (n=35)
Public Hospitals (n=75)Prisons (n=13)
Water Supply (n=67)Consumer Affairs (n=27)
Art Galleries and Museums (n=13)TAFE Services (n=36)
Major Roads (n=11)Police (n=35)
Fire Brigades (n=15)State Emergency Services (n=13)
Ambulance Services (n=24)
Business
Note Interpret with caution Very small number of responses (nlt=30)
Majority of services have a negative lsquoexpectation gaprsquo from businesses However the sample sizes are low and observations are only indicative
83
Source Customer Service Commission Customer Satisfaction Measurement Survey 2019 Report developed in conjunction with the NSW Customer Service CommissionerPublic I1-A2
Average score higherlower compared to overall SA average
VARIATION IN CONSUMERSrsquo VIEWS OF EMPLOYEE PERFROMANCE ACROSS SERVICES
Customers are asked ldquoThinking now about its employees to what extent do you agree or disagree that each of the following statements describes [a particular government service] in SArdquo
Figure 9 Performance of SA Government Services against each of the employee attributes
Responses were provided according to a scale from 1 (strongly disagree) to 10 (strongly agree) The average score against each attribute by service is tabulated Note this analysis represents consumer data only
Base Consumers (n=2727)
Note Very small number of responses (nlt=30)
Services
Honesty and Integrity of Employees Efficiency and Effectiveness Communication of Employees Fairness and Empathy of employees
Are honest
Deliver high safety standards
Provide good value
services
Are reliable
Get things done as quickly as
possible
Held Accountable
Explain intended
actions clearlyAre consistent
Engender confidence in
their knowledge
Communicate well
Provide services
without bias
See things from my perspective
Agricultural Advice and Funding Services 80 71 80 74 74 82 74 79 74 81 68 68
Ambulance Services 92 92 88 89 90 87 90 89 90 90 92 84Art Galleries and Museums 87 87 87 85 79 81 83 84 84 85 84 81Business Advisory Services 73 72 69 76 70 70 74 73 73 75 69 66Child Welfare Services 53 55 50 47 43 50 53 45 51 55 52 50Consumer Affairs 74 71 71 71 64 67 74 74 73 72 73 66Courts 71 72 64 67 59 60 73 64 72 74 71 60Disability Services 71 67 63 63 56 58 64 61 65 65 68 63Documentation Services 78 77 69 72 62 69 70 71 73 71 76 67Environment and Wildlife Protection 70 71 69 70 65 66 65 76 68 73 69 66Fire Brigades 93 96 95 94 93 90 88 89 93 92 91 85Major Roads 69 64 61 61 52 55 63 67 60 63 70 58Police 75 77 74 74 68 71 74 71 73 73 71 68Prisons 56 78 66 68 59 56 69 65 60 64 64 64Public Hospitals 79 78 78 75 70 73 77 74 77 75 78 71Public Housing 65 64 63 60 57 55 65 62 62 61 62 55Public Schools 76 75 73 72 69 70 73 70 72 73 70 69Public Transport 73 73 72 69 68 68 71 70 70 70 75 67Services for Older People 76 73 74 72 66 68 74 72 72 74 77 72State Emergency Services 92 94 92 93 90 91 90 92 90 90 92 87TAFE Services 73 73 72 68 64 71 69 69 71 70 74 67Vehicle Licensing and Registration 80 78 74 78 73 73 78 77 76 76 79 72Water Supply 74 74 69 71 65 67 71 73 73 72 76 69Overall average 77 76 74 74 69 70 75 73 74 74 76 70
Consumer
Note Interpret with caution Very small number of responses (nlt=30)
Ambulance Services Art Galleries and Museums State Emergency Services and Fire Brigades perform well against employee attributes
84
Source Customer Service Commission Customer Satisfaction Measurement Survey 2019 Report developed in conjunction with the NSW Customer Service CommissionerPublic I1-A2
Customers are asked ldquoThinking about the values that they uphold to what extent would you agree with each of the following statements when thinking about [a particular government service] in SArdquo
Figure 10 Performance of SA Government Services against values
Responses were provided according to a scale from 1 (strongly disagree) to 10 (strongly agree) The average score against each attribute by service is tabulated Note this analysis represents consumer data only
Services
Accountability and Service quality
Is a body I can trust Operates with integrity Is accountable for its services Provides good values services
Agricultural Advice and Funding Services 77 78 75 76
Ambulance Services 91 90 90 89
Art Galleries and Museums 85 85 84 86
Business Advisory Services 72 74 71 74
Child Welfare Services 41 48 46 45
Consumer Affairs 67 68 64 70
Courts 64 66 59 64
Disability Services 61 63 61 59
Documentation Services 71 72 69 70
Environment and Wildlife Protection 65 64 61 64
Fire Brigades 92 92 91 94
Major Roads 58 59 58 58
Police 73 73 70 73
Prisons 55 62 62 61
Public Hospitals 74 75 71 73
Public Housing 58 57 57 58
Public Schools 73 74 72 74
Public Transport 67 69 67 70
Services for Older People 68 71 66 69
State Emergency Services 92 92 90 92
TAFE Services 69 69 68 70
Vehicle Licensing and Registration 75 75 73 74
Water Supply 67 68 64 68
Overall average 72 73 70 72
Average score higherlower compared to overall SA average
Base Consumers (n=2936)
VARIATION IN CONSUMERSrsquo VIEWS OF PERFORMANCE AGAINST VALUES ACROSS SERVICESConsumer
Note Interpret with caution Very small number of responses (nlt=30)
Services that have high scores across headline measures (satisfaction expectation and ideal service) also perform well against values related attributes These services are Ambulance Services Art Galleries and Museums State Emergency Services and Fire Brigades
85
Source Customer Service Commission Customer Satisfaction Measurement Survey 2019 Report developed in conjunction with the NSW Customer Service CommissionerPublic I1-A2
Average score higherlower compared to overall SA average
Base Consumers (n=2617)Customers are asked ldquoThinking now about its processes) to what extent do you agree or disagree the followingstatements describes [a particular Government Service] in SArdquo
Figure 11 Performance of SA Government Services against process attributes
Responses were provided according to a scale from 1 (strongly disagree) to 10 (strongly agree) The average score against each attribute by service is tabulated Note this analysis represents consumer data only
Services
Simplicity and Efficiency of Processes Employee autonomy
Processes are easy to understand
Processes are designed to reduce wait times
I can get to the right person the first time
Services feel seamless across channels
Employees are empowered to make decisions
Agricultural Advice and Funding Services 61 73 73 67 68
Ambulance Services 86 81 84 83 87
Art Galleries and Museums 79 74 78 76 73
Business Advisory Services 70 67 71 64 72
Child Welfare Services 49 45 43 42 48
Consumer Affairs 71 59 60 62 63
Courts 61 50 58 55 62
Disability Services 55 53 52 52 56
Documentation Services 67 66 68 64 68
Environment and Wildlife Protection 61 60 58 56 60
Fire Brigades 86 87 86 88 83
Major Roads 55 50 50 49 51
Police 70 65 65 65 73
Prisons 53 50 57 57 57
Public Hospitals 67 56 60 63 68
Public Housing 62 50 56 56 54
Public Schools 69 64 66 66 67
Public Transport 70 65 66 66 66
Services for Older People 65 59 61 62 63
State Emergency Services 86 87 85 84 83
TAFE Services 66 62 63 65 66
Vehicle Licensing and Registration 74 65 69 68 69
Water Supply 67 61 63 64 64
Overall Average 70 63 65 65 68
VARIATION IN CONSUMERSrsquo VIEWS OF PERFORMANCE AGAINST PROCESS ATTRIBUTES ACROSS SERVICES
Consumer
Note Interpret with caution Very small number of responses (nlt=30)
Services that have high scores across headline measures (satisfaction expectation and ideal service) also perform well against process attributes These services are Ambulance Services Art Galleries and Museums State Emergency Services and Fire Brigades
86
Source Customer Service Commission Customer Satisfaction Measurement Survey 2019 Report developed in conjunction with the NSW Customer Service CommissionerPublic I1-A2
Average score higherlower compared to overall SA average
Customers are asked ldquoThinking about the services they provide overall how would rate [a particular government service] in SA on the followingrdquoFigure 12 Performance of SA Government Services against goals
Base Consumers (n=2582)
Responses were provided according to a scale from 1 (strongly disagree) to 10 (strongly agree) The average score against each attribute by service is tabulated Note this analysis represents consumer data only
Services
Transparency Access to information Privacy
Demonstrate openness and transparency in decision
making
Encourage public participation in decision
making
Is making it easier to access information about their
services
Is making best use of online services to improve efficiency
for customers
Safeguard privacy and confidentiality
Agricultural Advice and Funding Services 74 71 73 75 78
Ambulance Services 83 77 84 80 89
Art Galleries and Museums 78 76 80 79 80
Business Advisory Services 71 68 70 65 72
Child Welfare Services 44 37 49 43 58
Consumer Affairs 64 56 66 67 74
Courts 61 49 64 57 70
Disability Services 56 54 57 59 69
Documentation Services 71 62 70 69 78
Environment and Wildlife Protection 60 56 69 60 71
Fire Brigades 82 80 85 82 90
Major Roads 56 53 56 58 68
Police 65 58 68 63 76
Prisons 54 49 56 49 64
Public Housing 69 61 68 63 76
Public Hospitals 54 50 54 52 69
Public Schools 67 66 71 68 73
Public Transport 64 61 71 71 71
Services for Older People 65 60 66 65 77
State Emergency Services 86 81 85 78 88
TAFE Services 67 64 69 69 74
Vehicle Licensing and Registration 69 58 73 74 78
Water Supply 64 57 69 67 71
Overall Average 67 61 70 68 75
VARIATION IN CONSUMERSrsquo VIEWS OF PERFORMANCE AGAINST GOALS ACROSS SERVICES
Consumer
Note Interpret with caution Very small number of responses (nlt=30)
Services that have high scores across headline measures (satisfaction expectation and ideal service) also perform well against goals attributes These services are Ambulance Services Art Galleries and Museums State Emergency Services and Fire Brigades
87
Source Customer Service Commission Customer Satisfaction Measurement Survey 2019 Report developed in conjunction with the NSW Customer Service CommissionerPublic I1-A2
Average score higherlower compared to overall SA average
VARIATION IN BUSINESSESrsquo VIEWS OF EMPLOYEE PERFROMANCE ACROSS SERVICES
Customers are asked ldquoThinking now about its employees to what extent do you agree or disagree that each of the following statements describes [a particular government service] in SArdquo
Figure 9 Performance of SA Government Services against each of the employee attributes
Responses were provided according to a scale from 1 (strongly disagree) to 10 (strongly agree) The average score against each attribute by service is tabulated Note this analysis represents consumer data only
Base Businesses (n=657)
Services
Honesty and Integrity of Employees Efficiency and Effectiveness Empathy and Communication of Employees Fairness
Are honest
Deliver high
safety standards
Provide good value
services
Are reliable
Communicate well
Are consistent
Engender confidence in
their knowledge
Explain intended actions clearly
Get things done as quickly as
possible
Held Accountable
See things from my perspective
Provide services
without bias
Agricultural Advice and Funding Services 59 52 53 56 52 53 54 53 45 53 46 50Ambulance Services 91 92 92 93 90 91 92 93 94 91 87 92Art Galleries and Museums 83 74 88 85 86 78 83 85 69 83 79 79Business Advisory Services 71 73 71 70 70 71 69 71 66 62 66 70Child Welfare Services 71 71 62 54 59 50 62 70 55 56 55 76Consumer Affairs 72 73 65 71 73 66 71 70 61 66 65 71Courts 76 68 63 68 70 74 66 75 63 53 61 73Disability Services 80 77 76 73 73 74 75 70 69 74 66 75Documentation Services 90 80 79 72 79 81 80 79 67 74 75 80Environment and Wildlife Protection 80 77 78 76 77 76 78 78 78 70 68 71Fire Brigades 85 99 89 85 85 99 93 83 96 96 88 99Major Roads 79 79 70 70 70 64 69 55 74 60 73 78Police 78 83 76 76 76 79 80 77 68 77 71 81Prisons 74 76 72 74 77 75 74 74 75 91 73 77Public Hospitals 70 69 68 68 67 67 65 69 64 61 64 70Public Housing 85 78 81 68 82 86 84 79 68 84 76 79Public Schools 70 71 65 65 65 62 66 66 58 66 64 64Public Transport 76 70 70 65 70 71 67 69 76 62 71 68Services for Older People 76 75 73 72 74 69 73 69 70 72 68 72State Emergency Services 83 86 85 83 81 80 80 82 79 82 86 89TAFE Services 69 64 67 66 63 66 59 64 61 64 61 63Vehicle Licensing and Registration 75 75 69 72 72 71 72 74 69 66 67 74Water Supply 66 75 67 69 70 70 74 71 62 66 61 74Overall Average 75 75 71 71 72 71 72 72 68 69 68 73
Note Interpret with caution Very small number of responses (nlt=30)
Business
Due to low sample sizes for most of the services data is to be viewed as indicative only
88
Source Customer Service Commission Customer Satisfaction Measurement Survey 2019 Report developed in conjunction with the NSW Customer Service CommissionerPublic I1-A2
Customers are asked ldquoThinking about the values that they uphold to what extent would you agree with each of the following statements when thinking about [a particular government service] in SArdquo
Figure 10 Performance of SA Government Services against values
Responses were provided according to a scale from 1 (strongly disagree) to 10 (strongly agree) The average score against each attribute by service is tabulated Note this analysis represents consumer data only
Services
Accountability and Service quality
Is a body I can trust Operates with integrity Is accountable for its services Provides good values services
Agricultural Advice and Funding Services 46 47 54 57
Ambulance Services 96 91 92 93
Art Galleries and Museums 89 89 93 91
Business Advisory Services 67 71 60 63
Child Welfare Services 65 71 66 59
Consumer Affairs 69 68 65 64
Courts 72 78 63 71
Disability Services 70 72 70 70
Documentation Services 80 80 76 82
Environment and Wildlife Protection 73 75 73 71
Fire Brigades 94 94 94 94
Major Roads 69 64 78 68
Police 80 79 78 82
Prisons 69 69 72 71
Public Hospitals 64 65 65 68
Public Housing 66 73 70 70
Public Schools 66 64 68 61
Public Transport 69 70 71 67
Services for Older People 74 76 73 76
State Emergency Services 87 89 86 85
TAFE Services 61 65 60 67
Vehicle Licensing and Registration 72 73 68 71
Water Supply 62 65 61 66
Overall Average 71 72 70 71
Average score higherlower compared to overall SA average
Base Businesses (n=702)
VARIATION IN BUSINESSESrsquo VIEWS OF PERFORMANCE AGAINST VALUES ACROSS SERVICES
Note Interpret with caution Very small number of responses (nlt=30)
Business
Due to low sample sizes for most of the services data is to be viewed as indicative only
89
Source Customer Service Commission Customer Satisfaction Measurement Survey 2019 Report developed in conjunction with the NSW Customer Service CommissionerPublic I1-A2
Average score higherlower compared to overall SA average
Base Businesses (n=661)Customers are asked ldquoThinking now about its processes to what extent do you agree or disagree the following statements describes [a particular GovernmentService] in SArdquo
Figure 11 Performance of SA Government Services against process attributes
Responses were provided according to a scale from 1 (strongly disagree) to 10 (strongly agree) The average score against each attribute by service is tabulated Note this analysis represents consumer data only
Services
Simplicity and Efficiency of Processes Responsiveness
Processes are easy to understand
Processes are designed to reduce wait times
I can get to the right person the first time
Services feel seamless across channels
Employees are empowered to make
decisions
Agricultural Advice and Funding Services 42 40 46 41 61
Ambulance Services 88 86 88 84 89
Art Galleries and Museums 86 84 77 74 70
Business Advisory Services 64 56 59 60 63
Child Welfare Services 66 51 51 51 45
Consumer Affairs 68 60 67 62 64
Courts 58 46 55 54 74
Disability Services 62 50 66 66 65
Documentation Services 72 69 63 80 75
Environment and Wildlife Protection 68 66 64 68 62
Fire Brigades 93 85 84 93 98
Major Roads 59 69 73 64 78
Police 69 64 69 63 76
Prisons 72 70 72 62 71
Public Hospitals 65 52 58 58 59
Public Housing 71 62 71 64 48
Public Schools 64 66 68 69 64
Public Transport 66 66 63 64 66
Services for Older People 67 59 68 67 68
State Emergency Services 84 82 72 80 84
TAFE Services 64 55 60 65 56
Vehicle Licensing and Registration 70 62 65 65 64
Water Supply 65 60 62 63 62
Overall Average 68 61 65 65 66
VARIATION IN BUSINESSESrsquo VIEWS OF PERFORMANCE AGAINST PROCESS ATTRIBUTES ACROSS SERVICES
Note Interpret with caution Very small number of responses (nlt=30)
Business
Due to low sample sizes for most of the services data is to be viewed as indicative only
90
Source Customer Service Commission Customer Satisfaction Measurement Survey 2019 Report developed in conjunction with the NSW Customer Service CommissionerPublic I1-A2
Average score higherlower compared to overall SA average
Customers are asked ldquoThinking about the services they provide overall how would rate [a particular government service] in SA on the followingrdquoFigure 12 Performance of SA Government Services against goals
Base Businesses (n=641)
Responses were provided according to a scale from 1 (strongly disagree) to 10 (strongly agree) The average score against each attribute by service is tabulated Note this analysis represents consumer data only
Services
Transparency Access to information Privacy
Demonstrate openness and transparency in decision
making
Encourage public participation in decision
making
Is making it easier to access information about their
services
Is making best use of online services to improve efficiency
for customers
Safeguard privacy and confidentiality
Agricultural Advice and Funding Services 48 51 43 51 59
Ambulance Services 92 78 89 69 94
Art Galleries and Museums 81 77 75 83 84
Business Advisory Services 64 61 66 69 71
Child Welfare Services 65 52 61 50 81
Consumer Affairs 65 54 67 69 69
Courts 59 44 69 63 83
Disability Services 69 69 62 73 81
Documentation Services 79 69 85 87 87
Environment and Wildlife Protection 69 71 77 74 67
Fire Brigades 98 95 78 54 97
Major Roads 59 69 74 78 74
Police 66 70 77 70 81
Prisons 71 55 54 55 74
Public Hospitals 64 59 61 61 71
Public Housing 75 66 76 73 72
Public Schools 65 70 64 67 69
Public Transport 70 66 71 69 67
Services for Older People 67 73 74 75 73
State Emergency Services 84 82 85 82 84
TAFE Services 58 61 65 60 62
Vehicle Licensing and Registration 66 58 70 71 75
Water Supply 62 55 65 66 70
Overall Average 67 63 69 68 74
VARIATION IN BUSINESSESrsquo VIEWS OF PERFORMANCE AGAINST GOALS ACROSS SERVICES
Note Interpret with caution Very small number of responses (nlt=30)
Business
Due to low sample sizes for most of the services data is to be viewed as indicative only
91
Public ndash I1-A2
SOUTH AUSTRALIAN CUSTOMER SATISFACTION MEASUREMENT SURVEY 2019
The data in this chapter is for informative purposes to compare the perceptions of SA government services Where sample sizes for segments are low (lt30) data is provided for indicative purposes only
APPENDIX 2CONTACT METHOD PREFERENCE BY SERVICE
Source Customer Service Commission Customer Satisfaction Measurement Survey 2019 Report developed in conjunction with the NSW Customer Service CommissionerPublic I1-A2
CONTACT METHODS PREFERRED TO INTERACT WITH SA GOVERNMENT SERVICESConsumers have different contact preferences for different types of services Agricultural Advice and Funding Services Vehicle Licensing andRegistration Documentation Services Major Roads and Public Transport and Water Supply are the top 6 services where online is the preferredcontact method Agricultural Advice and Funding Services Major Roads and Consumer Affairs have see the biggest growth in online preferenceversus last year
Consumer
Figure 13 Breakdown of most preferred contact methods across services
Note Each respondent could select any number of contact methodsBase 2019 Consumers (n=3170) 2018 Consumers (n=3152)
Note Interpret with caution Very small number of responses (nlt=30) Legend top 5 services for each contact method
2018 2019 2018 2019 2018 2019Agricultural Advice and Funding Services 37 46 14 17 0 0Vehicle Licensing and Registration 47 43 27 27 7 8Documentation Services 40 38 26 17 14 10Major Roads 21 29 29 19 20 19Public Transport 31 27 42 35 12 17Water Supply 20 27 9 4 46 37Consumer Affairs 15 26 7 13 44 26Business Advisory Services 21 22 27 21 31 15Environment and Wildlife Protection 37 21 8 27 19 19TAFE Services 18 20 29 21 16 17Art Galleries and Museums 17 18 44 60 12 6Child Welfare Services 13 14 37 19 28 43Ambulance Services 10 13 25 23 53 45Prisons 6 11 37 40 54 27Courts 8 11 52 44 19 23Services for Older People 13 11 33 28 40 46Police 6 10 53 47 25 30Public Schools 8 9 47 42 18 20Disability Services 5 9 39 32 37 37Fire Brigades 8 8 73 44 19 29Public Housing 11 7 27 39 44 39State Emergency Services 23 6 16 31 34 39Public Hospitals 5 6 58 53 23 29
ServicesOnline
In person face-to-face
Telephone (landline or mobile phone calls text message)
93
+9 pts
+8 pts
+11 pts
Source Customer Service Commission Customer Satisfaction Measurement Survey 2019 Report developed in conjunction with the NSW Customer Service CommissionerPublic I1-A2
Note Each respondent could select one preferred contact method
CONTACT METHODS PREFERRED TO USE TO INTERACT WITH SA GOVERNMENT SERVICES
Figure 14 Breakdown of most commonly preferred contact methods across services
Base 2019 Business (n=743) 2018 Business (n=795)
Preference for online has decreased for those who interacted with Vehicle Licensing and Registration with an increase inpreference for face to face Public Transport has also seen a decline in preference for online with preference moving to face toface as well as telephone
Business
Note Interpret with caution Very small number of responses (nlt=30)
2018 2019 2018 2019 2018 2019Documentation Services 41 52 0 23 7 0Major Roads 18 49 36 48 1 1Vehicle Licensing and Registration 52 33 20 36 4 9Consumer Affairs 13 30 13 6 46 23Public Transport 54 24 23 29 9 18Agricultural Advice and Funding Services 19 21 47 1 0 30Water Supply 22 20 14 3 37 27Services for Older People 10 20 23 24 30 34Business Advisory Services 29 19 15 19 23 26Disability Services 20 13 12 28 38 34Environment and Wildlife Protection 12 12 11 13 11 9Ambulance Services 14 12 41 13 44 50Police 6 7 50 56 34 29TAFE Services 4 6 31 23 41 18Public Schools 0 4 49 45 22 26Public Hospitals 5 3 53 54 11 21Fire Brigades 0 0 2 2 23 78Art Galleries and Museums 29 0 29 17 0 41State Emergency Services 0 0 0 58 79 14Child Welfare Services 12 0 33 24 33 38Courts 10 0 40 61 10 9Public Housing 18 0 34 83 14 15Prisons 0 0 27 34 46 34
ServicesOnline In person face-to-face Telephone (landline or mobile phone calls
text message)
Legend top 5 services for each contact method
94
-30 pts
Public ndash I1-A2
SOUTH AUSTRALIAN CUSTOMER SATISFACTION MEASUREMENT SURVEY 2019
i EXECUTIVE SUMMARY
Source Customer Service Commission Customer Satisfaction Measurement Survey 2019 Report developed in conjunction with the NSW Customer Service CommissionerPublic I1-A2
Metro74
Regional13
Rural14
QLD
VIC
NSW
SA
Online survey
Other jurisdictions - Consumers
Queensland Victoria New South Wales
United Kingdom
New Zealand
Other jurisdictions - Businesses
Queensland Victoria New South Wales
United Kingdom
New Zealand
SA ndash Consumers
SA- Businesses
Age Gender Region
Business size Region
1998
502
49 male51
female18-3429
35-5432
55-6416
65+23
98 under 20
staff2
20+ staff
75 Metropolitan
11 Regional
14 Rural
2019 2073 4110 2019 2116
555 537 1261 1003 586
WE SURVEYED ~14300 CONSUMERS AND 4400 BUSINESSES ACROSS 6 JURISDICTIONS VIA THE ANNUAL CUSTOMER SATISFACTION MEASUREMENT SURVEY IN 2019
UK
Respondent Demographics
Note Results are subject to rounding and may not sum to 100
Consumer Business
NZ
4
Source Customer Service Commission Customer Satisfaction Measurement Survey 2019 Report developed in conjunction with the NSW Customer Service CommissionerPublic I1-A2
75 78
03
Satisfaction ExpectationGap
Expectation
Consumer satisfaction has remained stable versus last year Consumer expectations have increased slightly however not a statistically significant change
(00)
The SA consumer CSI is at 788 for 2019 and has been statistically stable since 2016
Consumersrsquo perceptions of the SA Public Services lsquobrandrsquo have remained stable in 2019 ranking second after airlines However satisfaction with the SA Public Service lsquobrandrsquo remains lower than customersrsquo satisfaction with SA Government services overall
Lowest
Highest
Avg
sat
isfac
tion
(con
sum
ers)
Airlines 71
SA Public Service 66
Telcorsquos 61
Local Council60
Banks59
Energy54
Fed Govt53
76(2017)
Nine drivers of consumer satisfaction are identified in 2019 Whereas lsquoCommunication and Empathyrsquo was a single driver last year this year lsquoFairness and Empathyrsquo is a unique driver of moderate importance separate to lsquoCommunicationrsquo which is of high importance
Efficiency and effectiveness of employees
Communication
Honesty and integrity of employees
Employee autonomy
Simplicity and efficiency of processes
Transparency
Privacy
Access to information and online services
High
High
High
Moderate
Moderate
Low
Low
Low
Drivers and relative importance
Performance of SA Government Services against baseline measures Customer Satisfaction Index (CSI) results
Drivers of satisfaction
75(2018)
+02
Perceptions of the SA Public Sector lsquobrandrsquo
SA Government Services
(avg satisfaction)
(+01)
75(2019)
Fairness and Empathy
Moderate
EXECUTIVE SUMMARY CONSUMER SATISFACTION WITH SA GOVERNMENT SERVICES HAS BEEN MAINTAINED IN 2019
Legend Statistically significant increase in avg from 2018 (at 99 level of Confidence)No significant change in avg from 2018 (at 99 level of Confidence)Statistically significant decrease in avg from 2018 (at 99 level of Confidence)
-01
Consumer CSI
Consumer
776
785784
788
77
78
79
2016 2017 2018 2019
74(2016)
00
Employee attributes Goals ProcessesKey
Groupings of drivers of satisfaction are based on analyses of NSW Government services however it is assumed that drivers of satisfaction are relatively consistent across jurisdictions and generally across service industries broadly
5
Source Customer Service Commission Customer Satisfaction Measurement Survey 2019 Report developed in conjunction with the NSW Customer Service CommissionerPublic I1-A2
Business satisfaction and expectation have remained stable since 2016
The SA business CSI is 780 for 2019 and has been statistically stable since 2016
Business perceptions of the SA Public Services lsquobrandrsquo have remained stable in 2019 ranking between Airlines andTelcos However satisfaction with the SA Public Service lsquobrandrsquo remains lower than customersrsquo satisfaction with SA Government services overall
Lowest
Highest
Avg
sat
isfac
tion
(con
sum
ers)
Airlines 70
SA Public Service 66
Telcorsquos62
Banks61
Local Council61
Fed Govt 57
Energy56
71(2017)
+02
Performance of SA Government services against baseline measures Customer Satisfaction Index (CSI) results
72(2018)
Perceptions of the SA Public Sector lsquobrandrsquo
SA Government services
(avg satisfaction)
73(2019)
EXECUTIVE SUMMARY BUSINESS SATISFACTION WITH SA GOVERNMENT SERVICES HAS BEEN MAINTAINED IN 2019
7376
03
Satisfaction ExpectationGap
Expectation
(+01)(+01)
+01
Business CSI
Business
741
754759
780
74
75
76
77
78
79
2016 2017 2018 2019
Contact Methods Used by Businesses
51
4135
29
128
4740
29 27
156
Inperson
Phone Online Email Mail fax Thirdparties
2018 Business (n=814)2019 Business (n=762)
Similar to last year lsquoIn personrsquo lsquophonersquo and lsquoonlinersquo continue to be the top 3 methods used by businesses to interact with the SA Government
70(2016)
+01
Legend Statistically significant increase in avg from 2018 (at 99 level of Confidence)No significant change in avg from 2018 (at 99 level of Confidence)Statistically significant decrease in avg from 2018 (at 99 level of Confidence)
6
Public ndash I1-A2
SOUTH AUSTRALIAN CUSTOMER SATISFACTION MEASUREMENT SURVEY 2019
ii KEY FINDINGS IN 2019
Source Customer Service Commission Customer Satisfaction Measurement Survey 2019 Report developed in conjunction with the NSW Customer Service CommissionerPublic I1-A2
SUMMARY OF KEY FINDINGS IN 2019
Theme Key Finding EvidenceOverall Measures and Topline Analysis
Average scores for all three headline measures (satisfaction expectation ideal score) have remained stableover last year and seen steady growth since 2016
bull Consumer satisfaction has remained stable at 75 out of 10 and expectation has increased slightly to 78 out of 10
bull The expectation gap is 03 points
Compared to 2016 all headline measures have seen a steady increase in average scores
bull Comparison to ideal service has increased significantly in 2019 by 04 points to 72 out of 10
bull The expectation gap has remained stable versus 2018 at 03 pointsbull The proportion of businesses in the lowest bracket (rated 1-4 out of 10) has been declining
since 2016 across all three performance indicators and continues to do so in 2019
Performance Against Customer Satisfaction Attributes
SA Government Services perform well against Employee attributes which have been identified as important drivers of customer satisfaction
The opportunity lies in improving process efficiencies to reduce the overall time taken by consumers and businesses to complete their task or interaction
bull For consumers SA Government services have an average score of 74 out of 10 across all employee attributes
bull lsquoProcesses are easy to understandrsquo rates higher than other process attributes The opportunity areas lie in making processes more efficient as lsquoGetting things done as quickly as possiblersquo and processes lsquoAre designed to reduce wait timesrsquo are two attributes where SA has the lowest ratings among all jurisdictions
bull lsquoPublic participation in decision makingrsquo is one of the lowest performing attributes across all jurisdictions for consumers However businesses in SA have rated this attribute significantly higher than last year ndash an increase of 04 points to 63 out of 10 vs 2019
Consumer
Business
BusinessConsumer
8
Source Customer Service Commission Customer Satisfaction Measurement Survey 2019 Report developed in conjunction with the NSW Customer Service CommissionerPublic I1-A2
SUMMARY OF KEY FINDINGS IN 2019
Theme Key Finding EvidenceSatisfaction by Contact Method and DigitalInsights
Usage and satisfaction with the overall experience of using websites appshas remained stable among consumers Overall satisfaction is highest amongst consumers who use online channels
While smartphones are the most commonly used device to access services online there is an opportunity to improve the smartphone experience of consumers
bull Of all jurisdictions SA has the second highest usage of online methods of contact among consumers behind NSW
bull Users of Online channels have the highest average satisfaction scores compared to all other channels They also rate the SA Government services highest on all process attributes
bull While half of all consumers have used smartphones to access services online satisfaction with the overall experience with using website apps is lowest for smartphone users Tablet users form the smallest proportion but have the highest satisfaction
There is significant improvement in satisfaction with the overall online experience among businesses compared to 2018
While usage of in-person as a contact method is declining it continues to remain important to businesses The opportunity area is to find the right balance between online and face to face contact methods
bull The proportion of businesses choosing to go online increased by 7 points in 2019 and these businesses also saw a 09 point increase in satisfaction which is high at 80 out of 10
bull There was a significant increase in satisfaction with the overall experience of using website app to complete a task ndash an increase of 08 points to 78 out of 10 versus last year
bull While smartphone usage was low compared to desktop and laptop businesses that used smartphones showed highest satisfaction along with desktop users
bull Businesses that used in-person channels had the highest satisfaction alongside online users Businesses using in-person methods also rate SA Government services highest on all process attributes
bull Preference for in-person in SA is the highest of all jurisdictions however usage has seen a steady decline since 2017
Consumer
Business
9
Source Customer Service Commission Customer Satisfaction Measurement Survey 2019 Report developed in conjunction with the NSW Customer Service CommissionerPublic I1-A2
Theme Key Finding Evidence
Public Sector Overall The SA Public Services lsquobrandrsquo is viewed positively by both consumers and businesses
Experiences with SA Government services outperforms overall SA Public Service perceptions
bull The perception of SA Public Service overall has remained stable and is ahead of all other industries with the exception of airlines for both consumers and businesses
bull In line with other Australian jurisdictions SA Public Service lsquobrandrsquo performs better relative to other industries than the Public Service lsquobrandrsquo in NZ and UK
bull Satisfaction with government services is higher than satisfaction with the SA Public Service lsquobrandrsquo suggesting factors other than service delivery experiences are impacting brand perception
bull SA Public Service is described more positively than negatively with lsquohelpfulrsquo lsquofriendlyrsquo lsquocapablersquo lsquoknowledgeablersquo and lsquorespectfulrsquo being the top five descriptors by both consumers and businesses
bull In contrast to last year businesses have described SA Public Services more positively this year with an increase in proportion of businesses selecting positive descriptors and decrease in proportion of businesses selecting negative descriptors
Topline by Demographics Consumer satisfaction in regional areas has increased significantly and the expectation gap is almost zero
bull For consumers all three headline measures have seen a significant increase in regional areas
bull Expectation has increased by 04 points to 81 out of 10 and satisfaction has increased by 06 points to 80 out of 10 This indicates that SA Government Services in regional areas are very close to meeting consumers expectations
Consumer Business
SUMMARY OF KEY FINDINGS IN 2019
10
Consumer
Source Customer Service Commission Customer Satisfaction Measurement Survey 2019 Report developed in conjunction with the NSW Customer Service CommissionerPublic I1-A2
Theme Key Finding Evidence
Feedback Overall the proportion of consumers and businesses giving feedback remains low
Consumers are more likely to give compliments and businesses are more likely to make a complaint
bull 30 of consumers and 39 of businesses gave some form of feedback in 2019bull 39 of all feedback received from consumers was a compliment Compliments are
related to employee interactions for consumers and businesses compliment about the information available to them
bull 42 of all feedback received from businesses was a complaint Compared to other jurisdictions SA received the highest proportion of all feedback as complaints from businesses but had the lowest proportion of poor handling of complaints within Australian jurisdictions
bull Processes are the main source of complaints for both consumers and businesses
A higher proportion of both consumers and businesses found it easier to make complaints this year versus last year
For both consumers and businesses ease of making a complaint does not always translate into a positive complaint handling experience There is an opportunity to streamline the complaints resolution process to ensure the experience is positive for consumers and businesses through the entire process
Good complaint handling is associated with higher than average satisfaction for both consumers and business
bull 51 of consumers found it easy to make a complaint (7-10 out of 10) versus 34 last year
bull 46 of businesses found it easy to make a complaint (7-10 out of 10) versus 37 last year
bull While there was improvement in the ease of making a complaint only 36 of consumers said their complaint had been handled well (7-10 out of 10)
bull Similarly for businesses only 32 said their complaint had been handled well (7-10 out of 10)
bull Consumers who had a good complaint handling experience had a satisfaction score of 80 out of 10 which is higher than the average consumer satisfaction score of 75 out of 10
bull Businesses gave a rating of 7-10 out of 10 for complaint handling had a satisfaction score of 81 out of 10 which is higher than the average business satisfaction score of 73 out of 10
Consumer Business
SUMMARY OF KEY FINDINGS IN 2019
11
Consumer Business
Please note that customers may have rated different services on Satisfaction and Complaint Handling and the correlation is to be treated as indicative only
Source Customer Service Commission Customer Satisfaction Measurement Survey 2019 Report developed in conjunction with the NSW Customer Service CommissionerPublic I1-A2
KEY FINDING 1 (CONSUMER) Overall Measures and Topline AnalysisAverage scores for all three headline measures (satisfaction expectation ideal score) have remained stable over last year and seen steady growth since 2016
7578
Satisfaction Expectation Gap Expectation
Figure 2 2019 Consumer satisfaction expectation and expectation gap
bull In 2019 consumer satisfaction with SA Government services has been maintained at 75 and consumer expectation has increased slightly to 78
bull The expectation gap is -03
+01-
Consumer
-03
Legend Statistically significant increase in avg from 2018 (at 99 level of Confidence)No significant change in avg from 2018 (at 99 level of Confidence)Statistically significant decrease in avg from 2018 (at 99 level of Confidence)
12
77
78
77
78
2016
2017
2018
2019
74
76
75
75
2016
2017
2018
2019
70
71
71
72
2016
2017
2018
2019
-01 -01 +01
+01 -+02
+01 - +01
Expectation Satisfaction Ideal Service
Figure 1 2019 Average scores for headline measures 2016 ndash 2019 - Consumers
Source Customer Service Commission Customer Satisfaction Measurement Survey 2019 Report developed in conjunction with the NSW Customer Service CommissionerPublic I1-A2
KEY FINDING 1 (BUSINESS) Overall Measures and Topline AnalysisCompared to 2016 all headline measures have seen a steady increase in average scores
bull Both satisfaction and expectation of businesses with SA Government have increased by 01 points in 2019 versus last year
bull As with consumers the expectation gap is -03
+01-
Business
Legend Statistically significant increase in avg from 2018 (at 99 level of Confidence)No significant change in avg from 2018 (at 99 level of Confidence)Statistically significant decrease in avg from 2018 (at 99 level of Confidence)
13
Expectation Satisfaction Ideal Service
Figure 3 2019 Average scores for headline measures 2016 ndash 2019 - Business
73
74
75
76
2016
2017
2018
2019
+01
+01
+01
70
71
72
73
2016
2017
2018
2019
+02
+01
+01
67
69
68
72
2016
2017
2018
2019
+02
-01
+04
+01 +01
7376
Satisfaction Expectation Gap Expectation
Figure 4 2018 Business satisfaction expectation and expectation gap
Aver
age
scor
e (o
ut o
f 10 )
-03
Source Customer Service Commission Customer Satisfaction Measurement Survey 2019 Report developed in conjunction with the NSW Customer Service CommissionerPublic I1-A2
Satisfaction Drivers Average score across respondents (out of 10 on scale of according to a scale from 1 strongly disagree to 10 strongly agree)
Employees1)Honesty amp integrity of employees2)Efficiency and effectiveness of employees3)Communication4) Fairness and Empathy
Average across attributes
Process1)Simplicity and efficiency of processes2)Employee autonomy
Average across attributes
73
This year (YoY change not significant)
Range of historicValues(2016-19)
Legend77
79
71
Significant increase
Significant decrease
Last year
72
73
73
74
2016
2017
2018
2019
76 76 76 75 74 74 74 74 7371
69
77 76 76 75 74 74 74 74 7370 70 70
69
60
65
70
75
80
Are
hone
st
Deliv
er h
igh
safe
tyst
anda
rds
Prov
ide
serv
ices
with
out b
ias
Expl
ain
inte
nded
actio
ns c
lear
ly
Enge
nder
con
fiden
cein
thei
r kno
wle
dge
Com
mun
icat
e w
ell
Prov
ide
good
val
uese
rvic
es
Are
relia
ble
Are
cons
iste
nt
Are
held
acc
ount
able
See
thin
gs fr
om m
ype
rspe
ctiv
e
Get
thin
gs d
one
asqu
ickl
y as
pos
sibl
e
66
65
66
66
2016
2017
2018
201969
6765 63
7068
6563
66
6560
65
70
75
80
Proc
esse
s ar
e ea
sy to
unde
rsta
nd
Empl
oyee
s ar
eem
pow
ered
to m
ake
deci
sions
I can
get
to th
e rig
htpe
rson
the
first
tim
e
Serv
ice
feel
s se
amle
ssev
en if
I ha
ve to
com
mun
icat
e ac
ross
diffe
rent
cha
nnel
s(i
e o
nlin
e p
hone
em
ail)
Are
desi
gned
tore
duce
wai
t tim
es
Consumer
KEY FINDING 2 (CONSUMER) Performance Against Customer Satisfaction AttributesWith an average score of 74 out of 10 for consumers SA Government Services perform well against employee attributes which havebeen identified as important drivers of customer satisfaction The opportunity area lies in improving process efficiencies to reduce the overall time taken by consumers to complete their task or interaction
Figure 5 Employee and Process attribute scores ndash Consumers
14
Source Customer Service Commission Customer Satisfaction Measurement Survey 2019 Report developed in conjunction with the NSW Customer Service CommissionerPublic I1-A2
Satisfaction Drivers Average score across respondents (out of 10 on scale of according to a scale from 1 strongly disagree to 10 strongly agree)
Goals 1)Privacy2)Transparency3)Access to info
Average across attributes
Values1)Service Quality2)Accountability
Average across attributes
67
66
68
68
2016
2017
2018
2019
74
69 68 67
7570 68 67
62
6155
60
65
70
75
80
Safe
guar
d pr
ivac
y an
dco
nfid
entia
lity
Is m
akin
g it
easi
er to
acce
ss in
form
atio
nab
out t
heir
serv
ices
Is m
akin
g be
st u
se o
fon
line
serv
ices
toim
prov
e co
nven
ienc
ean
d ef
ficie
ncy
for
cust
omer
s
Dem
onst
rate
open
ness
and
tran
spar
ency
inde
cisio
n-m
akin
g
Enco
urag
e pu
blic
part
icip
atio
n in
deci
sion-
mak
ing
70
71
72
72
2016
2017
2018
201973 72 72
70
73 72 7270
60
65
70
75
80
Ope
rate
s w
ithin
tegr
ity
Prov
ides
goo
dse
rvic
e
Is a
bod
y I c
an tr
ust
Is a
ccou
ntab
le fo
r its
serv
ices
73
This year (YoY change not significant)
Range of historicValues(2016-19)
Legend77
79
71
Significant increase
Significant decrease
Last year
Consumer
KEY FINDING 2 (CONSUMER) Performance Against Customer Satisfaction AttributesFor consumers lsquoPublic participation in decision makingrsquo is one of the lowest performing attributes and this is also the case the attribute scores are compared across all jurisdictions
Figure 6 Goals and Values attribute scores - Consumers
15
Source Customer Service Commission Customer Satisfaction Measurement Survey 2019 Report developed in conjunction with the NSW Customer Service CommissionerPublic I1-A2
Satisfaction Drivers Average score across respondents (out of 10 on scale of according to a scale from 1 strongly disagree to 10 strongly agree)
Employees1)Honesty amp integrity of employees2)Efficiency and effectiveness of employees3)Communication4) Fairness and Empathy
Average across attributes
Process1)Simplicity and efficiency of processes2)Responsiveness
Average across attributes
7374
71 71 71 71 7070 71
6767 67
75 7573 72 72 72 71 71 71
69 68 68
60
65
70
75
Are
hone
st
Deliv
er h
igh
safe
tyst
anda
rds
Prov
ide
serv
ices
with
out b
ias
Expl
ain
inte
nded
actio
ns c
lear
ly
Enge
nder
con
fiden
cein
thei
r kno
wle
dge
Com
mun
icat
e w
ell
Are
cons
iste
nt
Prov
ide
good
val
uese
rvic
es
Are
relia
ble
Are
held
acc
ount
able
Get
thin
gs d
one
asqu
ickl
y as
pos
sibl
e
See
thin
gs fr
om m
ype
rspe
ctiv
e
68
71
70
71
2016
2017
2018
2019
61
64
65
65
2016
2017
2018
2019 67 64 64 62
6865 65
6167
66
55
60
65
70
75
80
Proc
esse
s ar
e ea
sy to
unde
rsta
nd
Empl
oyee
s ar
eem
pow
ered
to m
ake
deci
sions
Serv
ice
feel
s se
amle
ssev
en if
I ha
ve to
com
mun
icat
e ac
ross
diffe
rent
cha
nnel
s (i
eon
line
pho
ne e
mai
l)
I can
get
to th
e rig
htpe
rson
the
first
tim
e
Are
desi
gned
tore
duce
wai
t tim
es
73
This year (YoY change not significant)
Range of historicValues(2016-19)
Legend77
79
71
Significant increase
Significant decrease
Last year
Business
Figure 7 Employee and Process attribute scores ndash Businesses
16
KEY FINDING 2 (BUSINESS) Performance Against Customer Satisfaction AttributesSA Government Services perform well against employee attributes which have been identified as important drivers of business satisfaction The opportunity lies in improving process efficiencies to reduce the overall time taken to complete a task or interaction
Source Customer Service Commission Customer Satisfaction Measurement Survey 2019 Report developed in conjunction with the NSW Customer Service CommissionerPublic I1-A2
Satisfaction Drivers Average score across respondents (out of 10 on scale of according to a scale from 1 strongly disagree to 10 strongly agree)
Goals 1)Privacy2)Transparency3)Access to info
Average across attributes
Values 1)Service Quality2)Accountability
Average across attributes
63
66
65
68
2016
2017
2018
2019
71
66 65 6559
7469 68 67
6363
50
55
60
65
70
75
80
Safe
guar
d pr
ivac
y an
dco
nfid
entia
lity
Is m
akin
g it
easi
er to
acce
ss in
form
atio
nab
out t
heir
serv
ices
Is m
akin
g be
st u
se o
fon
line
serv
ices
toim
prov
e co
nven
ienc
ean
d ef
ficie
ncy
for
cust
omer
s
Dem
onst
rate
ope
nnes
san
d tr
ansp
aren
cy in
deci
sion-
mak
ing
Enco
urag
e pu
blic
part
icip
atio
n in
deci
sion-
mak
ing
66
69
70
71
2016
2017
2018
201971 70 70
68
72 71 71 70
60
65
70
75
80
Ope
rate
s w
ith in
tegr
ity
Prov
ides
goo
d se
rvic
e
Is a
bod
y I c
an tr
ust
Is a
ccou
ntab
le fo
r its
serv
ices
73
This year (YoY change not significant)
Range of historicValues(2016-19)
Legend77
79
71
Significant increase
Significant decrease
Last year
Business
KEY FINDING 2 (BUSINESS) Performance Against Customer Satisfaction AttributesBusiness perception of lsquoPublic participation in decision makingrsquo has seen a significant increase of 04 points to 63 out of 10 this year
Figure 8 Goals and Values attribute scores - Businesses
17
Source Customer Service Commission Customer Satisfaction Measurement Survey 2019 Report developed in conjunction with the NSW Customer Service CommissionerPublic I1-A2
KEY FINDING 3 (CONSUMER) Satisfaction by Contact Method and Digital InsightsUsage and satisfaction with the overall experience with using websites apps has remained stable among consumers Overall satisfaction is highest amongst consumers who use online channels
Note ndash Percentages do not add up to 100 due to exclusion of Donrsquot Know from the analysis
bull 26 of consumers used online channels as a method of contact
bull Consumers who used online methods had the highest average overall satisfaction score of 77 out of 10
bull Satisfaction with the overall experience of using online services (via website app) was also high at 79 out of 10
57
3325
139
6
58
3426
1610
5
In person Phone Online Email Mail fax Thirdparties
2018 Consumer (n=3307) 2019 Consumer (n=3297)
cus
tom
ers
who
hav
e ha
d di
rect
de
alin
gs v
ia th
is c
hann
el
Figure 9 2018 and 2019 channel usage -Consumers
Consumer
Figure 10 2018 and 2019 overall satisfaction by channel usage - Consumers
7675
73 72 7270
7775
74 7371
70
50
60
70
80
Online In person Thirdparties
Phone Mailfax Email
2018 Consumer (n=3307) 2019 Consumer (n=3297)
Aver
age
satis
fact
ion
scor
e (1
-10) +01
+01+01 +01
--
Legend Statistically significant increase in avg from 2018 (at 99 level of Confidence)No significant change in avg from 2018 (at 99 level of Confidence)Statistically significant decrease in avg from 2018 (at 99 level of Confidence)
Customers were asked ldquoThinking about your experiences interacting with SA services online in the last 12 months to what extent do you agree or disagree with each of the following statementsrdquo
Figure 11 Satisfaction with attributes of online services
82 81 81 80 79 79 79 78
102030405060708090100
0102030405060708090
100
The content wascurrent and accurate
I achieved the outcomeby using servicesavailable online
I trust my informationwas handled securely
through thewebsiteapp
The format of contentmet my accessrequirements
I was satisfied with theoverall experience ofusing the websiteappto complete the task
The websiteapp wasuseful and allowed me
to do everything Ineeded to do
Content and supportprovided online was
sufficient to answer myquestions
I found the websiteapp simple and it waseasy to find what I was
looking for
Disagree (1-4) Neutral (5-6) Agree (7-10) Average
Axis 2 Average Score
Consumer (n=798)
Axis
1
Perc
enta
ge o
f re
spon
ses
+01 +01 +01 +02+01 +01 +02NA
18
Source Customer Service Commission Customer Satisfaction Measurement Survey 2019 Report developed in conjunction with the NSW Customer Service CommissionerPublic I1-A2
KEY FINDING 3 (CONSUMER) Satisfaction by Contact Method and Digital InsightsWhile smartphones are the most used device to access services online there is an opportunity to improve the smartphone experience of consumers
Note ndash Percentages do not add up to 100 due to exclusion of Donrsquot Know from the analysis
Consumer
Legend Statistically significant increase in avg from 2018 (at 99 level of Confidence)No significant change in avg from 2018 (at 99 level of Confidence)Statistically significant decrease in avg from 2018 (at 99 level of Confidence)
19
50 4640
17
31
52 53
10
Smartphone Laptop computer Desktop computer TabletiPad
Consumer (n=843)Business (n=220)
Customers were asked ldquoWhat devices did you use to access the online content Please select all contact methods that applyrdquo
Figure 12 Devices used when dealing with SA Government services online
Figure 13 Satisfaction with online services by device used Customers were asked ldquoHow satisfied were you with the overall experience of using the websiteapp to complete the taskrdquo
re
spon
dent
s
77
79 798080
74
80
76
Smartphone Laptop computer Desktop computer TabletiPad
Consumer (n=822)Business (n=218)
Aver
age
satis
fact
ion
(out
of 1
0)
bull While most consumers (50) used smartphones to access online content their satisfaction levels with their experience was lower (77 out of 10) compared to those who used desktops or laptops to access online content (79 out of 10)
bull Few consumers are using tabletsiPad (17) but those that do have high levels of satisfaction (8 out of 10)
Source Customer Service Commission Customer Satisfaction Measurement Survey 2019 Report developed in conjunction with the NSW Customer Service CommissionerPublic I1-A2
51
4135
29
128
4740
29 27
15
6
In person Phone Online Email Mail fax Thirdparties
2018 Business (n=814) 2019 Business (n=762)
c
usto
mer
s w
ho h
ave
had
dire
ct
deal
ings
via
this
cha
nnel
KEY FINDING 3 (BUSINESS) Satisfaction by Contact Method and Digital InsightsThere is significant improvement in satisfaction with the overall online experience among businesses
Figure 14 2018 and 2019 channel usage -Businessbull There was an increase in the
overall satisfaction score among businesses who used online channels
bull There was a significant increase of 08 points in satisfaction with the overall online experience
bull The proportion of businesses who chose to go online increased by 7 points compared to last year
Business
75
70 71 7169
68
73 7372 72 71
67
60
70
80
In person Online Mailfax Phone Email Thirdparties
2018 Business(n=814) 2019 Business(n=762)
Aver
age
satis
fact
ion
scor
e (1
-10)
Figure 15 2018 and 2019 overall satisfaction by channel usage - Businesses
-02+01 +01
+03+02
-01
Legend Statistically significant increase in avg from 2018 (at 99 level of Confidence)No significant change in avg from 2018 (at 99 level of Confidence)Statistically significant decrease in avg from 2018 (at 99 level of Confidence)
Customers were asked ldquoThinking about your experiences interacting with SA services online in the last 12 months to what extent do you agree or disagree with each of the following statementsrdquo
Figure 17 Satisfaction with attributes of online services
79 79 78 78 78 78 78 75
102030405060708090100
0
20
40
60
80
100
I trust myinformation washandled securely
through thewebsiteapp
I achieved theoutcome by usingservices available
online
The content wascurrent and
accurate
The format ofcontent met my
accessrequirements
I was satisfied withthe overall
experience ofusing the
websiteapp tocomplete the task
The websiteappwas useful and
allowed me to doeverything I
needed to do
Content andsupport provided
online wassufficient toanswer myquestions
I found thewebsite app
simple and it waseasy to find what I
was looking for
Disagree (1-4) Neutral (5-6) Agree (7-10) Average
Business (n=210)
Axis 2 Average Score
+05 NA +04 +09 +08 +06 +06+09
74
224 I chose to go
online
I was directedor promotedto go online
There was noother optionavailable
Customers were asked ldquoDid you choose to go online or were you directed to go onlinerdquo
Figure 16 Choice to go online
uarr7
darr2 darr5
20
Source Customer Service Commission Customer Satisfaction Measurement Survey 2019 Report developed in conjunction with the NSW Customer Service CommissionerPublic I1-A2
2922 22 22
2 4
3224 23
16
3 2
In person Email Phone Online Mailfax Third parties
2018 Business(n=795) 2019 Business(n=743)
51
4135
29
128
47
40
29 27
15
6
In person Phone Online Email Mail fax Third parties
2018 Business (n=814) 2019 Business (n=762)
c
usto
mer
s w
ho h
ave
had
dire
ct
deal
ings
via
this
cha
nnel
Figure 18 2018 and 2019 channel usage - Business
Figure 19 2018 and 2019 most preferred channel - Business
Note ndash Percentages do not add up to 100 due to exclusion of Donrsquot Know from the analysis
bull While lsquoin personrsquo remains the most used channel for contact there is a continued decline in usage since 2017 (52 in 2017 51 in 2018 47 in 2019) though not statistically significant
bull Despite the year on year declines lsquoin personrsquo continues to be the most preferred channel and there has been a year on year growth in preference since 2017 (27 in 2017 29 in 2018 32 in 2019)
Business
KEY FINDING 3 (BUSINESS) Satisfaction by Contact Method and Digital InsightsWhile usage is declining in-person as a method of contact continues to remain important to businesses The opportunity area is to find the right balance between online and face to face contact methods
21
c
usto
mer
s
Source Customer Service Commission Customer Satisfaction Measurement Survey 2019 Report developed in conjunction with the NSW Customer Service CommissionerPublic I1-A2
7166
61 60 5954 53
7066 62 61 61
56 57
Airlines Public Serviceoverall
TelephoneService
Providers
My localcouncil
Banks EnergyRetailers
FederalGovernment
Consumer (n=1649) Business (n=457)
02
Avg
sat
isfa
ctio
n (o
ut o
f 10)
LowestHighest
KEY FINDING 4 Public Sector OverallThe SA public services lsquobrandrsquo is viewed positively by both consumers and businesses however service experience outperforms brand score
0102
0203
0302
01 02
Figure 20 Satisfaction with SA Public Service
bull Both consumers and businesses rate SA Public Services higher than most other industries or public service agencies with the exception of Airlines
bull Both consumers and businesses rate satisfaction with SA Government Services as being higher than the satisfaction with the lsquobrandrsquo SA Public Service This suggests factors other than service delivery experiences are impacting brand perception
Consumer Business
10 05 0406 05
Legend Statistically significant increase in avg from 2018 (at 99 level of Confidence)No significant change in avg from 2018 (at 99 level of Confidence)Statistically significant decrease in avg from 2018 (at 99 level of Confidence)
7375 00 +01SA Government Services
Average satisfaction
Consumer Business
22
Source Customer Service Commission Customer Satisfaction Measurement Survey 2019 Report developed in conjunction with the NSW Customer Service CommissionerPublic I1-A2
KEY FINDING 4 Public Sector OverallIn comparison to other jurisdictions as well the SA Public Service lsquobrandrsquo is rated higher than most other industries by consumers and businesses
bull In line with other Australian jurisdictions SA Public Service lsquobrandrsquo performs better relative to other industries (banks) than Public Service lsquobrandrsquo in NZ and UK
Consumer Business
Lowest
Highest
Avg
sat
isfa
ctio
n (b
usin
esse
s)NZ
NZ Govt Service 68
Banks 69
Energy 66
Local council 58
Airlines 74
Telcorsquos 65
NSW
Airlines 71
NSW Public Service 69
Banks 60
Energy 57
Telcorsquos 60
Local council 61
Fed Govt 60
QLD
Airlines 71
QLD Public Service 67
Telcorsquos 61
Local council 61
Banks 57
Energy 57
Fed Govt 58
VIC
Airlines 71
VIC Public Service 65
Banks 58
Energy 57
Local council 59
Fed Govt 57
Telcorsquos 60
SA
Airlines 70
Telcorsquos 62
SA Public Service 66
Banks 61
Energy 56
Local council 61
Fed Govt 57
UK
Airlines 70
Telcorsquos 66
Energy 63
UK Public Service 68
Local Council 61
Banks 68
Business
Figure 21 Comparison of Public service brand perceptions across jurisdictionsCustomers were asked ldquoThinking about all your experiences with each of the following [jurisdiction] industries and public services over the previous 12 months how satisfied would you say you are with them rdquoConsumer
NZ
NZ Govt Service 69
Banks 69
Airlines 74
Telcorsquos 66
Energy 66
Local council 59
NSW NSW
Public Service 71
Airline 71
Telcorsquos 62
Energy 59
Local council 62
Banks 61
Fed Govt 57
QLD
Airlines 70
QLD Public Service 69
VIC SA
Airlines 71
Telcorsquos 61
SA Public Service 66
Local council 60
Banks 59
Energy 54
Fed Govt 53
UK
Airlines 71
UK Public Service 69
Banks 69
Energy 64
Telcorsquos 69
Local council 61
Lowest
Highest
Avg
sat
isfa
ctio
n (c
onsu
mer
s)
Airlines 71
Telcorsquos 63
VIC Public Service 70
Banks 63
Local council 62
Energy 60
Fed Govt 59
Telcorsquos 62
Local council 62
Banks 60
Energy 59
Fed Govt 58
23
Source Customer Service Commission Customer Satisfaction Measurement Survey 2019 Report developed in conjunction with the NSW Customer Service CommissionerPublic I1-A2
06
KEY FINDING 5 (CONSUMER) Top-Line results by DemographicsConsumer satisfaction in regional areas has increased significantly and the expectation gap is almost zero
Average satisfaction among consumers in regional areas has increased significantly by 06 points to 8 out of 10 The expectation score is 81 making the expectation gap just 008
How would you rate your expectation of the overall quality of service
Thinking about your experiences in the last 12 months how satisfied would you say you are with
each of the following services
10
10
106
6
8
13
11
14
81
83
78
80
81
77
Rural(n=349)
Regional(n=332)
Metro(n=2560)
Low (1-4) Neutral (5-6) High (7-10)
Satisfaction Expectation Ideal service
Please imagine an ideal service How well do you think each service compares to that ideal service
-042
-008
-027
-045 -025 -005
Rural (n=349)
Regional (n=332)
Metro (n=2560)
Expectation gap (satisfaction ndash expectation)
10
10
10
respondents Avg respondents Avg
10
10
10
respondents Avg
12
9
14
20
15
19
68
76
68
73
77
71
Rural(n=341)
Regional(n=327)
Metro(n=2504)
Not close to ideal (1-4)Neutral (5-6)Close to ideal (7-10)
Note Expectation gap scores displayed in graph are subject to rounding
9
7
10
15
12
16
75
81
73
75
80
75
Rural(n=353)
Regional(n=337)
Metro(n=2607)
Dissatisfied (1-4)Neutral (5-6)Satisfied (7-10)
Figure 22 Satisfaction expectation and ideal service by region - Consumer
Base Consumers(n=3297)
Base Consumers(n=3241)
Base Consumers(n=3172)
Base Consumers(n=3241)
-
-01
-
+04
+01
-
+06
-
Consumer
Legend Statistically significant increase in avg from 2018 (at 99 level of Confidence)No significant change in avg from 2018 (at 99 level of Confidence)Statistically significant decrease in avg from 2018 (at 99 level of Confidence)
24
Source Customer Service Commission Customer Satisfaction Measurement Survey 2019 Report developed in conjunction with the NSW Customer Service CommissionerPublic I1-A2
7765
727779
6975
81
never givenfeedback
I made acomplaint
I made asuggestionfor change
I gave acompliment
Satisfaction Expectation
7668 69 71
7971 74 75
never givenfeedback
I made acomplaint
I made asuggestion for
change
I gave acompliment
KEY FINDING 6 FeedbackOverall the proportion of consumers and businesses giving feedback remains low Consumers are more likely to give compliments and businesses are more likely to make a complaint
Consumer Business
bull Majority of consumers or businesses did not give any form of feedback
bull 39 of consumers who gave feedback gave a compliment
bull Whereas 42 of businesses who gave feedback made a complaint
bull Consumers and businesses who gave a compliment had a higher satisfaction score compared to those who complained or made a suggestion
Figure 23 Feedback typeQuestion ldquoWhen was the last time you provided feedback to a SA Government Agency or Department about their services processes or employeesrdquoQuestion ldquoWhat was the nature of the feedbackrdquo
Figure 24 Satisfaction and expectation of feedback type Consumer (n=858) Business (n=294)
3070
Consumer n=1998
3961
Business n=502
bull I gave a complimentbull I made a suggestion
for changebull I made a complaint
Business (n=194)
Consumer (n=519)
Given feedbackNever given feedback Donrsquot know
Given feedback
39
42 35
33
23
28
bull I gave a complimentbull I made a suggestion
for changebull I made a complaint
25
Source Customer Service Commission Customer Satisfaction Measurement Survey 2019 Report developed in conjunction with the NSW Customer Service CommissionerPublic I1-A2
Figure 25 Consumer Variation in ease of making a complaint across jurisdictions
KEY FINDING 6 FeedbackA higher proportion of both consumers and businesses found it easier to make complaints this year versus last year
Consumer Business
26
Customers were asked ldquoHow difficult or easy was it to make your complaintrdquo
40 28
26
21
34 51
5361
1
10
0
50
100
2018 2019
Easy (7-10) Neutral (5-6) Difficult (1-4) Average
Axis 2 Average scoreAxis
1
Perc
enta
ge o
f re
spon
sesConsumers
bull 51 of consumers found it easy (7-10 out of 10) to make a complaint versus 34 last year
bull There was a significant increase of 08 points in the average score for consumers (61 out of 10 vs 53 out of 10 last year)
Businessesbull 46 of businesses found it easy (7-10 out of 10)
to make a complaint An improvement of 9 points versus last year
bull The average score remained relatively stable at 55 out of 10
Figure 26 Business Variation in ease of making a complaint across jurisdictionsCustomers were asked ldquoHow difficult or easy was it to make your complaintrdquo
34 36
29 17
3746
57 55
1
10
0
50
100
2018 2019
Easy (7-10) Neutral (5-6) Difficult (1-4) Average
Axis 2 Average scoreAxis
1
Perc
enta
ge o
f re
spon
ses
+08
Source Customer Service Commission Customer Satisfaction Measurement Survey 2019 Report developed in conjunction with the NSW Customer Service CommissionerPublic I1-A2
KEY FINDING 6 FeedbackThere is an opportunity to streamline the complaints resolution process to ensure the experience is positive for consumers and businesses right from making a complaint all the way up to getting a resolution
Consumer Business
27
Customers were asked ldquoHow difficult or easy was it to make your complaintrdquoFigure 28 Variation in ease of making a complaint across jurisdictions
28 36
2117
51 46
6155
1
10
0
50
100
Consumer Business
Easy (7-10) Neutral (5-6) Difficult (1-4) Average
Axis 2 Average scoreAxis
1
Perc
enta
ge o
f re
spon
ses
Customers were asked ldquoHow well or poorly was your most recent complaint handledrdquo
Figure 29 Variation in complaints handling across jurisdictions
41 44
23 24
3632
52 49
1
10
0
50
100
Consumers Business
Handled poorly (1-4) Neutral (5-6) Handled well (7-10) Average
Axis
1
Perc
enta
ge o
f re
spon
ses
Axis 2 Average score
For both consumers and businesses ease of making a complaint does not always translate into a positive experience with the complaint handling process
bull While 51 of consumers found it easy (7-10 out of 10) to make a complaint only 36 of consumers said their complaint had been handled well (7-10 out of 10)
bull Similarly while 46 of businesses found it easy to make a complaint (7-10 out of 10) only 32 said their complaint had been handled well (7-10 out of 10)
Source Customer Service Commission Customer Satisfaction Measurement Survey 2019 Report developed in conjunction with the NSW Customer Service CommissionerPublic I1-A2
Consumersbull The overall satisfaction scores for consumers who had a
good complaint handling experience was higher than the average consumer satisfaction score (80 out of 10 vs 75 out of 10)
bull Consumers who had a good complaint handling experience had higher overall satisfaction (80 out of 10) compared to consumers who had a poor experience (53 out of 10)
Businessesbull Businesses who had a good complaint handling
experience had a higher satisfaction score compared to the average satisfaction score (81 out of 10 vs 73 out of 10)
bull As with consumers businesses who had a positive experience had higher overall satisfaction (81 out of 10) compared to those who had a poor experience (63 out of 10)
Consumer Business
28
80 81
60
71
53
63
75 73
Consumers Business
Handled Well (7-10) Neutral (5-6) Handled Poorly (1-4) Average Satisfaction
Figure 27 Overall satisfaction with government services by ease of making complaints
Aver
age
Satis
fact
ion
Scor
e
KEY FINDING 6 FeedbackGood complaint handling is associated with a higher than average satisfaction with SA Government Services for consumers and businesses
Please note that customers may have rated different services on Satisfaction and Ease of Complaint and the correlation is to be treated as indicative only
Public ndash I1-A2
SOUTH AUSTRALIAN CUSTOMER SATISFACTION MEASUREMENT SURVEY 2019
iii DETAILED FINDINGS
Public ndash I1-A2
SOUTH AUSTRALIAN CUSTOMER SATISFACTION MEASUREMENT SURVEY 2019
1 OVERALL MEASURES TOPLINE ANALYSIS
Source Customer Service Commission Customer Satisfaction Measurement Survey 2019 Report developed in conjunction with the NSW Customer Service CommissionerPublic I1-A2
Outcome Measures Avg responses
ExpectationHow would you rate your expectation of the overall quality of service
SatisfactionThinking about your experiences in the last 12 months how satisfied would you say you are with each of the following services in SA
Ideal servicehellipPlease imagine an ideal service How well do you think each service in SA compares to that ideal service
CONSUMER OVERALL PERFORMANCEConsumer satisfaction with SA Government services has remained stable in 2019
Note Results are subject to rounding
Consumer expectations have remained stable versus last year with an average rating of 79 out of 10
Consumer satisfaction with SA Government services has remained stable at 75 out of 10
Comparison to ideal service has seen no significant change in 2019 and sits at 72 out of 10
Figure 11 2016 2017 2018 and 2019 overall performance - Consumers
Consumer
77
78
77
78
2016
2017
2018
2019
74
76
75
75
2016
2017
2018
2019
70
71
71
72
2016
2017
2018
2019
9
7
7
7
14
14
15
14
77
79
78
79
2016(n=3462)
2017(n=3433)
2018(n=3245)
2019(n=3241)
Low (1-4) Med (5-6) High (7-10)
10
9
10
10
17
16
17
16
73
75
74
75
2016(n=3507)
2017(n=3482)
2018(n=3307)
2019(n=3297)
Dissatisfied (1-4) Neutral (5-6) Satisfied (7-10)
14
13
12
13
20
20
20
18
66
66
68
69
2016(n=3398)
2017(n=3375)
2018(n=3154)
2019(n=3172)
Not close to ideal (1-4) Neutral (5-6) Close to ideal (7-10)
-01
-01
+01
+01
-
+02
+01
-
+01
Legend Statistically significant increase in avg from 2018 (at 99 level of Confidence)No statistical significant change in avg from 2018 (at 99 level of Confidence)Statistically significant decrease in avg from 2018 (at 99 level of Confidence)
31
Source Customer Service Commission Customer Satisfaction Measurement Survey 2019 Report developed in conjunction with the NSW Customer Service CommissionerPublic I1-A2
For businesses expectations have seen no significant change with an average rating of 76 out of 10
Satisfaction amongst businesses has also remained stable at 73 out of 10
Comparison to the ideal service has seen a statistically significant increase of 04 points to 72 out of 10 This is a result of a 6 point increase in the proportion of businesses rating SA Government services close to ideal (7-10)
The proportion of businesses rating services in the lowest bracket (1-4) continues to decline year on year across all performance indicators
Figure 12 2016 2017 2018 and 2019 overall performance - Businesses
Note Results are subject to rounding
Business
Outcome Measures Avg responses
ExpectationHow would you rate your expectation of the overall quality of service
SatisfactionThinking about your experiences in the last 12 months how satisfied would you say you are with each of the following services in SA
Ideal servicehellipPlease imagine an ideal service How well do you think each service in SA compares to that ideal service
13
9
8
7
15
19
16
18
72
73
75
75
2016(n=817)
2017(n=753)
2018(n=801)
2019(n=758)
Low (1-4) Med (5-6) High (7-10)
16
11
10
8
18
21
20
20
67
69
70
72
2016(n=825)
2017(n=769)
2018(n=814)
2019(n=762)
Dissatisfied (1-4) Neutral (5-6) Satisfied (7-10)
19
16
14
12
19
20
23
18
62
63
63
69
2016(n=797)
2017(n=742)
2018(n=795)
2019(n=732)
Not close to ideal (1-4) Neutral (5-6) Close to ideal (7-10)
73
74
75
76
2016
2017
2018
2019
+01
+01
+01
70
71
72
73
2016
2017
2018
2019
+02
+01
+01
67
69
68
72
2016
2017
2018
2019
+02
-01
+04
Legend Statistically significant increase in avg from 2018 (at 99 level of Confidence)No statistical significant change in avg from 2018 (at 99 level of Confidence)Statistically significant decrease in avg from 2018 (at 99 level of Confidence)
BUSINESS OVERALL PERFORMANCEBusiness satisfaction with SA Government services has remained stable in 2019
32
Source Customer Service Commission Customer Satisfaction Measurement Survey 2019 Report developed in conjunction with the NSW Customer Service CommissionerPublic I1-A2
Consumersbull 75 of consumers indicate that they are
satisfied with the SA Government services they have had direct dealings in the last 12 months
bull 79 of consumers indicate that they have high expectations of SA Government services
Businessesbull 72 say they are satisfied - this is a 2
points increase in comparison to last year (70 in 2018) This increase has come from a 2 point decrease in dissatisfied businesses (1-4 out of 10)
bull 75 of businesses indicate that they have high expectations of SA Government services
The above satisfaction scores across consumer and business suggest positive perceptions of recent experiences with SA Government services
The above expectation scores across consumer and business suggest they may have had positive previous experiences (prior to the last 12 months)
bull What Overall expectation is a measure of the quality of services customers expect to receive from a service
bull How Customers were asked ldquoThinking about the following service in SA how would you rate your expectation of the overall quality of servicerdquo
Expectation
78 10
76 10
respondents Avg
7
7
18
14
75
79
Business(n=758)
Consumer(n=3241)
Low (1-4)Med (5-6)High (7-10)
Responses were recorded according to a scale from 1 (very low) to 10 (very high)
+01
+01
bull What Overall satisfaction is a measure of the perceived performance of a service as stated by customers
bull How Customers were asked ldquoThinking about your experiences in the last 12 months how satisfied would you say you are with the following service in SArdquo
Satisfaction
respondents Avg
Responses were recorded according to a scale from 1 (very dissatisfied) to 10 (very satisfied)
8
10
20
16
72
75
Business(n=762)
Consumer(n=3297)
Dissatisfied (1-4)
Neutral (5-6)
Satisfied (7-10)
75 10
73 10
-
+01
Sig Sig
Figure 13 Figure 14
Comparison of current SA performance to expectations
Consumer Business
Legend Statistically significant increase in avg from 2018 (at 99 level of Confidence)No statistical significant change in avg from 2018 (at 99 level of Confidence)Statistically significant decrease in avg from 2018 (at 99 level of Confidence)
PERFORMANCE OF SERVICES COMPARED TO EXPECTATIONSResults against the measures of satisfaction and expectation indicate positive perceptions of SA Government services
33
Source Customer Service Commission Customer Satisfaction Measurement Survey 2019 Report developed in conjunction with the NSW Customer Service CommissionerPublic I1-A2
Consumersbull 69 of consumers rated SA
Government services as performing close to their ideal service (7-10 out of 10)
bull The average score has remained stable versus last year
Businessesbull 69 of businesses rated SA
Government services as performing close to their ideal service (7-10 out of 10)
bull There has been a significant increase of 04 in the average score for lsquoideal servicersquo (72 out of 10) versus last year
bull What Comparison to an ideal service is a measure of how much the customers feel that the service is close to the best it can be
bull How Customers were asked ldquoNow forgetting for a moment the specific service please imagine an ideal service How well do you think the service in SA compares with that ideal servicerdquo
12
13
18
18
69
69
Business(n=732)
Consumer(n=3172)
Not close to ideal (1-4)Neutral (5-6)Close to ideal (7-10)
Comparison to ideal
7210
7210
respondents Avg
Responses were recorded according to a scale from 1 (not very close to ideal) to 10 (very close to ideal)
Sig
+01
+04
Comparison of current SA performance to perceptions of an ideal service
Figure 15 Figure 16
bull What Overall satisfaction is a measure of the perceived performance of a service as stated by customers
bull How Customers were asked ldquoThinking about your experiences in the last 12 months how satisfied would you say you are with the following service in SArdquo
Satisfaction
respondents Avg
Responses were recorded according to a scale from 1 (very dissatisfied) to 10 (very satisfied)
8
10
20
16
72
75
Business(n=762)
Consumer(n=3297)
Dissatisfied (1-4)
Neutral (5-6)
Satisfied (7-10)
75 10
73 10
-
+01
Sig
Consumer Business
Legend Statistically significant increase in avg from 2018 (at 99 level of Confidence)No statistical significant change in avg from 2018 (at 99 level of Confidence)Statistically significant decrease in avg from 2018 (at 99 level of Confidence)
PERFORMANCE OF SERVICES COMPARED TO IDEAL69 of both consumers and businesses rate SA Government services as performing close to their ideal service
34
Source Customer Service Commission Customer Satisfaction Measurement Survey 2019 Report developed in conjunction with the NSW Customer Service CommissionerPublic I1-A2
Note Average satisfaction expectation comparison to ideal service and expectation gap scores are subject to rounding
bull Compared to 2018 satisfaction and expectations have remained stable across jurisdictions with the exceptions of NSW and UK
bull Compared to 2018 SA has improved its ranking by 1 spot when it comes to expectation but has retained its rankings for satisfaction and ideal service
bull NSW has seen a statistically significant increase of 02 points in its satisfaction scores to 78 However the expectation score has also increased statistically significantly to 81 ndashkeeping the gap between expectation and satisfaction unchanged
bull UK has seen a statistically significant decrease of 02 points in expectations to 78
Figure 17 Satisfaction expectation and ideal service across jurisdictions - Consumer
Consumer
Outcomemeasures Avg respondents
ExpectationHow would you rate your expectation of the overall quality of service
SatisfactionThinking about your experiences in the last 12 months how satisfied would you say you are with each of the following services in SA
Ideal service
hellipPlease imagine an idealservice How well do you think each service in SA compares to that ideal service
7
7
7
7
7
6
14
14
13
13
12
11
79
79
80
80
81
84
UK
SA
NZ
QLD
VIC
NSW
Low (1-4)
Medium (5-6)
High (7-10)
78
79
79
79
81
78
10
9
9
9
8
7
16
16
14
15
14
14
75
76
77
76
77
79
SA
UK
VIC
QLD
NZ
NSW
Dissatisfied (1-4)
Neutral (5-6)
Satisfied (7-10)76
76
77
77
78
75
73
73
74
74
75
72
+02
+02
+02
-01
-
+02
-
-
-
+01
-
+01
NA
-01
-01
-02
NA
NA
13
12
12
11
11
10
18
17
17
15
16
15
69
71
71
74
74
75
SA
UK
NZ
QLD
NSW
VIC
Not close toideal (1-4)Neutral (5-6)
Close to ideal(7-10)
Legend Statistically significant increase in avg from 2018 (at 99 level of Confidence)No statistical significant change in avg from 2018 (at 99 level of Confidence)Statistically significant decrease in avg from 2018 (at 99 level of Confidence)
COMPARISON OF SA CONSUMERSrsquo PERCEPTIONS TO OTHER JURISDICTIONSRatings for SA Government services have remained stable versus last year NSW has seen a significant increase and UK has seena significant decrease in satisfaction
35
Source Customer Service Commission Customer Satisfaction Measurement Survey 2019 Report developed in conjunction with the NSW Customer Service CommissionerPublic I1-A2
Note Average satisfaction expectation comparison to ideal service and expectation gap scores are subject to rounding
bull Compared to 2018 all jurisdictions with the exception of QLD and VIC have remained stable in regards to expectations and satisfaction
bull Satisfaction and Expectation scores for SA Government services have remained stable Whereas the ideal service score for SA has seen a significant increase of 04 points to 72
bull After statistically significant declines last year QLD has bounced back showing statistically significant gains across all three performance indicators with satisfaction showing a 05 points increase This has pushed QLD up in the rankings for all three performance indicators
bull VIC has seen decreases across all three performance indicators pushing their ranking down compared to last year
Figure 18 Satisfaction expectation and ideal across jurisdictions - Business
Business
Legend Statistically significant increase in avg from 2018 (at 99 level of Confidence)No statistical significant change in avg from 2018 (at 99 level of Confidence)Statistically significant decrease in avg from 2018 (at 99 level of Confidence)
Outcomemeasures Avg respondents
ExpectationHow would you rate your expectation of the overall quality of service
Satisfaction
Thinking about your experiences in the last 12 months how satisfied would you say you are with each of the following services in SA
Ideal service
hellipPlease imagine an idealservice How well do you think each service in SA compares to that ideal service
7
7
7
7
8
7
17
18
13
15
12
15
77
75
80
78
80
78
VIC
SA
QLD
UK
NZ
NSW
Low (1-4)
Medium (5-6)
High (7-10)
76
77
77
78
78
76
11
8
9
8
6
10
20
20
20
20
19
14
69
72
71
72
75
76
VIC
SA
UK
NSW
NZ
QLD
Dissatisfied (1-4)
Neutral (5-6)
Satisfied (7-10)
71
74
74
75
75
73
16
12
12
10
9
9
15
20
18
22
20
18
70
68
69
69
70
73
VIC
NSW
SA
UK
NZ
QLD
Not close toideal (1-4)
Neutral (5-6)
Close to ideal(7-10)
70
71
73
73
74
72
+06
+01
+01
+01
NA
-01
-
+01
NA
-04
+04
+05
-02
+04
+01
-03
+01
NA
COMPARISON OF SA BUSINESSESrsquo PERCEPTIONS TO OTHER JURISDICTIONSRatings for SA have remained stable across all measures QLD has see significant increases and VIC has seen significant declinesin satisfaction
36
Source Customer Service Commission Customer Satisfaction Measurement Survey 2019 Report developed in conjunction with the NSW Customer Service CommissionerPublic I1-A2
-037
-023
-028
-021
-032
-030
-027
-026
-022
-019
-017
-04 -02 00
VIC
SA
NSW
QLD
UK
NZ
2019 2018
Figure 110 2018 and 2019 expectation gap -Businesses
Note ndash Percentages do not add up to 100 due to exclusion of Donrsquot Know from the analysis
Consumersbull In SA the gap to expectation
remained relatively stable showing a small increase of 004 points versus last year
bull UK has seen an decrease in gap of 013 points
bull VIC has seen a decrease in gap of 007 points
Businessesbull Except QLD all jurisdictions show
an increase in the gap between satisfaction and expectation
bull The gap to expectation in SA has remained relatively stable versus last year increasing only by 003 points
Figure 19 2018 and 2019 expectation gap -Consumers
Consumer Business
-038
-029
-028
-031
-031
-047
-039
-036
-034
-026
-015
-06 -04 -02 00
VIC
NSW
UK
SA
NZ
QLD
2019 2018
NA
NA
Legend Statistically significant increase in avg from 2018 (at 99 level of Confidence)No statistical significant change in avg from 2018 (at 99 level of Confidence)Statistically significant decrease in avg from 2018 (at 99 level of Confidence)
GAP BETWEEN SATISFACTION AND EXPECTATION FOR CONSUMERS AND BUSINESSESIn SA the gap to expectation for both consumers and businesses has seen a slight increase this year
37
Source Customer Service Commission Customer Satisfaction Measurement Survey 2019 Report developed in conjunction with the NSW Customer Service CommissionerPublic I1-A2
-1 -05 0 05Avg
gap
bet
wee
n sa
tisfa
ctio
n an
d ex
pect
atio
n
-15 -1 -05 0 05 1
00
-13
-07
-07
Avg
gap
bet
wee
n sa
tisfa
ctio
n an
d ex
pect
atio
n01
-15
-13
-05
Services with the highest expectation gap
Services with the lowest expectation gap
Note Very small number of responses (nlt=30)All service comparisons will be shown in greater detail in the detailed chapters of this report For further service comparisons see Chapter 9
State Emergency Services (n=45)
Ambulance Services (n=24)
Figure 111 Satisfaction expectation gap - Consumer
Figure 112 Satisfaction expectation gap - Business
Child Welfare Services(n=51)
Courts(n=89)
Prisons(n=21)
Disability Services(n=33)Agricultural
Advice and Funding Services(n=10)
Public Housing (n=16)
Consumersbull There are no services that have a positive
expectation gap State Emergency Services have a zero point gap
bull Prisons have the highest negative expectation gap of -13 points followed by Courts and Child Welfare Services and Major Roads at -07 points
Businessesbull Of those with statistically reliable sample sizes
Disability Services have the highest negative expectation of -05 points
Consumer Business
GAP BETWEEN SATISFACTION AND EXPECTATION BY SERVICEAcross most services both consumers and businesses have a negative gap to expectation (expectation is higher than satisfaction)
-07Major Roads(n=81)
38
Source Customer Service Commission Customer Satisfaction Measurement Survey 2019 Report developed in conjunction with the NSW Customer Service CommissionerPublic I1-A2
Consumer Business
Service(n= for consumers n= for business)
Reach1 Average satisfaction (out of 10)
Average expectation score (out of 10) Gap to expectation
Consumer Business Consumer Business Consumer Business Consumer BusinessFire Brigades (n=24 n=15) 1 2 91 91 93 91 -02 00
State Emergency Serv (n=47 n=13) 3 3 90 87 91 87 00 00
Ambulance Serv (n=208 n=24) 17 7 87 91 90 90 -03 01
Art Galleries and Museums (n=121 n=13) 13 3 87 82 88 84 -02 -02Vehicle Licensing and Registration (n=580 n=135) 56 43 80 71 82 75 -01 -04
Public Schools (n=228 n=51) 19 14 76 66 79 70 -03 -05
Water Supply (n=240 n=67) 24 23 76 74 78 77 -02 -03
Police (n=217 n=35) 21 9 75 80 78 81 -03 -01
Public Hospitals (n=412 n=76) 41 18 74 69 77 72 -03 -03
Public Transport (n=390 n=47) 38 13 74 72 76 76 -02 -03
Consumer Affairs (n=38 n=27) 4 8 73 75 77 77 -04 -02
Documentation Serv (n=42 n=17) 4 5 73 80 76 83 -03 -03Environment and Wildlife Protection (n=38 n=19) 3 4 73 74 75 78 -03 -04
Business Advisory Serv (n=17 n=35) 1 11 73 72 73 75 -01 -03
Serv for Older People (n=114 n=28) 9 7 73 71 77 75 -04 -04
TAFE Serv (n=126 n=36) 11 9 70 67 72 68 -03 -01Agricultural Advice and Funding Serv (n=13 n=10) 1 2 68 61 70 74 -02 -13
Disability Serv (n=100 n=34) 9 10 66 74 70 79 -03 -05
Major Roads (n=86 n=11) 8 3 65 74 71 75 -07 -01
Public Housing (n=87 n=16) 9 5 63 55 67 70 -04 -15
Courts (n=94 n=19) 6 4 63 74 70 79 -07 -05
Prison (n=23 n=14) 2 2 54 79 67 83 -13 -03
Child Welfare Serv (n=52 n=20) 3 3 45 70 52 75 -07 -05
Figure 113 Summary of variation in key performance measures across services
Interpret with caution Very small number of responses (nlt=30) 1 of customers who have interacted with this service in the last 12 months | Top bottom six in each category compared to other services
SUMMARY OF SERVICE PERFORMANCE BY SATISFACTION AND EXPECTATIONIn terms of average satisfaction score Fire Brigades State Emergency Services Ambulance Services and Art Galleries and Museums are the top rating services
39
Public ndash I1-A2
SOUTH AUSTRALIAN CUSTOMER SATISFACTION MEASUREMENT SURVEY 2019
2 PERFORMANCE AGAINST CUSTOMER SATISFACTION ATTRIBUTES
Source Customer Service Commission Customer Satisfaction Measurement Survey 2019 Report developed in conjunction with the NSW Customer Service CommissionerPublic I1-A2
Satisfaction Drivers Average score across respondents (out of 10 according to a scale from 1 strongly disagree to 10 strongly agree)
Employees for SA1) Honesty and integrity of
employees2) Efficiency and effectiveness of
employees3) Communication
Average across attributes
Employees across jurisdictions1) Honesty and integrity of
employees2) Efficiency and effectiveness of
employees3) Communication
Average across attributes
77 76 7675 74 74 74 74 73
7070 69
78 7877
76 76 76 76 7575
72
7172
65
70
75
80
Are
hone
st
Del
iver
hig
h sa
fety
sta
ndar
ds
Prov
ide
serv
ices
with
out b
ias
Expl
ain
inte
nded
act
ions
cle
arly
Enge
nder
con
fiden
ce in
thei
r kno
wle
dge
Com
mun
icat
e w
ell
Prov
ide
good
val
ue s
ervi
ces
Are
relia
ble
Are
cons
iste
nt
Are
held
acc
ount
able
See
thin
gs fr
om m
y pe
rspe
ctiv
e
Get
thin
gs d
one
as q
uick
ly a
s po
ssib
le
NZ (n=2815) UK (n=2897) SA (n=2727) VIC (n=2991) QLD (n=2844) NSW (n=5686)
Average 7410
7510
QLD
7510
NZ
7510
VIC
7510
NSW
7410
UK
Figure 21 Consumer perceptions of employee related attributes
Top 3 performing attributes include
bull lsquoAre honestrsquo (77 out of 10)bull lsquoDeliver high safety standardsrsquo (76 out
of 10) bull lsquoProvide services without biasrsquo (76 out if
10)
Bottom 3 lowest performing attributes include
bull lsquoGet things done as quickly as possiblersquo (69 out of 10)
bull lsquoSee things from my perspectiversquo (70 out of 10)
bull lsquoAre held accountablersquo (70 out of 10)
When compared with other jurisdictions
bull SA along with the UK was the lowest performing jurisdiction (74 out of 10) on average However the gap between highest and lowest performing jurisdictions is very small
Base(n)=2704
77 76 76 75 74 74 74 74 7370 70 69
556065707580
Are
hone
st
Del
iver
hig
hsa
fety
sta
ndar
ds
Prov
ide
serv
ices
with
out b
ias
Expl
ain
inte
nded
actio
ns c
lear
ly
Enge
nder
conf
iden
ce in
thei
r kno
wle
dge
Com
mun
icat
ew
ell
Prov
ide
good
valu
e se
rvic
es
Are
relia
ble
Are
cons
iste
nt
Are
held
acco
unta
ble
See
thin
gs fr
omm
y pe
rspe
ctiv
e
Get
thin
gs d
one
as q
uick
ly a
spo
ssib
le
Consumer
+01 +01 - - - - - - --
+01 -01
CONSUMER PERCEPTION OF EMPLOYEESThere were no statistically significant changes in perceptions of employees versus 2018
Legend Statistically significant increase in avg from 2018 (at 99 level of Confidence)No significant change in avg from 2018(at 99 level of Confidence)Statistically significant decrease in avg from 2018 (at 99 level of Confidence)
41
Source Customer Service Commission Customer Satisfaction Measurement Survey 2019 Report developed in conjunction with the NSW Customer Service CommissionerPublic I1-A2
Satisfaction Drivers Average score across respondents (according to a scale from 1 strongly disagree to 10 strongly agree)
Process for SA1) Simplicity and efficiency of
processes2) Employee autonomy
Average across attributes
Process across jurisdictions1) Simplicity and efficiency of
processes2) Employee autonomy
Average across attributes
7068
65 6563
55
65
75
Processes areeasy to
understand
Employees areempowered tomake decisions
I can get to theright person the
first time
Service feelsseamless even if I
have to usemultiple contact
methods
Are designed toreduce wait timesAverage 66
10
70
68
65 65
63
72
70
6868
67
60
65
70
75
Processes areeasy to understand
Employees areempowered tomake decisions
I can get to theright person the
first time
Service feelsseamless even if I
have to usemultiple contact
methods
Are designed toreduce wait times
NZ (n=2677) UK (n=2735) SA (n=2617) VIC (n=2924) QLD (n=2851) NSW (n=5638)
6910
QLD
6810
NZ
6910
VIC
6910
NSW
6710
UK
bull lsquoProcesses are easy to understandrsquo is the best performing attribute with a score of 7 out of 10 However as with previous years execution of these processes (empowered employees getting to the right person the first time seamless service and wait times) continue to have lower scores ranging from 68 to 63 out of 10 This pattern is observed across all jurisdictions
bull SA is behind other jurisdictions for all process attributes
bull Across all jurisdictions process attributes have the lowest average scores of all attribute categories (Values Goals and Employees) ndashsimplifying and bringing efficiencies to processes remains a challenge for all jurisdictions
Figure 22 Consumer perceptions of process related attributes
Base(n)=2668
Consumer
+01+01
-01 - -
CONSUMER PERCEPTION OF PROCESSESThere have been no statistically significant changes to any of the process attribute scores in comparison to last year
Legend Statistically significant increase in avg from 2018 (at 99 level of Confidence)No significant change in avg from 2018(at 99 level of Confidence)Statistically significant decrease in avg from 2018 (at 99 level of Confidence)
42
Source Customer Service Commission Customer Satisfaction Measurement Survey 2019 Report developed in conjunction with the NSW Customer Service CommissionerPublic I1-A2
Satisfaction Drivers Average score across respondents (according to a scale from 1 strongly disagree to 10 strongly agree)
Goals for SA1) Privacy2) Transparency3) Access
Average across attributes
Goals across jurisdictions1) Privacy2) Transparency3) Access
Average across attributes
7570 68 67
61
55
65
75
Safeguard privacyand confidentiality
Is making it easierto access
information abouttheir services
Is making best useof online services
to improveconvenience and
efficiency forcustomers
Demonstrateopenness andtransparency indecision-making
Encourage publicparticipation in
decision-makingAverage 68
10
75
70
6867
61
76
72
7170
65
60
65
70
75
80
Safeguard privacyand confidentiality
Is making it easierto access
information abouttheir services
Is making best useof online services
to improveconvenience and
efficiency forcustomers
Demonstrateopenness andtransparency indecision-making
Encourage publicparticipation in
decision-making
NZ (n=2681) UK (n=2785) SA (n=2582) VIC (n=2803) QLD (n=2732) NSW (n=5486)
7010
NZ
7010
QLD
7110
VIC
7110
NSW
6910
UK
bull lsquoSafeguard privacy and confidentialityrsquo is the highest rated goal attribute
bull In comparison to other jurisdictions SA continues to lag on all goal attributes
bull lsquoEncourage public participation in decision makingrsquo is the attribute that sees the lowest scores across all jurisdictions It is also the attribute with the widest gap between the top performing and lowest performing jurisdictions (VIC and SA) with a gap of 04 points
Figure 23 Consumer perceptions of goals related attributes
Base(n)=2561
Consumer
CONSUMER PERCEPTION OF GOALSConsumer perceptions of SA Government services against goal related attributes have remained statistically stable versus last year
+01
+01- - -01
Legend Statistically significant increase in avg from 2018 (at 99 level of Confidence)No significant change in avg from 2018(at 99 level of Confidence)Statistically significant decrease in avg from 2018 (at 99 level of Confidence)
43
Source Customer Service Commission Customer Satisfaction Measurement Survey 2019 Report developed in conjunction with the NSW Customer Service CommissionerPublic I1-A2
Satisfaction Drivers Average score across respondents (according to a scale from 1 strongly disagree to 10 strongly agree)
Values for SA1) Service Quality2) Accountability
Average across attributes
Values across jurisdictions1) Service Quality2) Accountability
Average across attributes
Average 7210
73 72 72 70
55
65
75
Operates with integrity Provides good service Is a body I can trust Is accountable for itsservices
7372 72
70
7575
74
73
65
70
75
80
Operates with integrity Provides good service Is a body I can trust Is accountable for itsservices
NZ (n=3108) UK (n=3068) SA (n=2936) VIC (n=3166) QLD (n=3059) NSW (n=6113)
7410
UK
7310
NZ
7410
VIC
7410
NSW
7310
QLD
bull Consumers rate SA Governmentservices high (above 7 out of 10)across all value attributes
bull At an overall level SA is behind all other jurisdictions with the lowest average score across all value attributes
Figure 24 Consumer perceptions of values related attributes
Base(n)=2916
Consumer
- - --
CONSUMER PERCEPTION OF VALUESThere have been no statistically significant changes to the ratings of value attributes versus last year
Legend Statistically significant increase in avg from 2018 (at 99 level of Confidence)No significant change in avg from 2018(at 99 level of Confidence)Statistically significant decrease in avg from 2018 (at 99 level of Confidence)
44
Source Customer Service Commission Customer Satisfaction Measurement Survey 2019 Report developed in conjunction with the NSW Customer Service CommissionerPublic I1-A2
Satisfaction Drivers Average score across respondents (according to a scale from 1 strongly disagree to 10 strongly agree)
Employees for SA1) Honesty and integrity of
employees2) Efficiency and effectiveness of
employees3) CommunicationAverage across attributes
Employees across jurisdictions1) Honesty and integrity of
employees2) Efficiency and effectiveness of
employees3) Communication
75 75 73 72 72 72 71 71 71 69 68 68
55
65
75
85
Are
hone
st
Del
iver
hig
hsa
fety
sta
ndar
ds
Prov
ide
serv
ices
with
out b
ias
Expl
ain
inte
nded
actio
ns c
lear
ly
Enge
nder
conf
iden
ce in
thei
r kno
wle
dge
Com
mun
icat
ew
ell
Are
cons
iste
nt
Prov
ide
good
valu
e se
rvic
es
Are
relia
ble
Are
held
acco
unta
ble
Get
thin
gs d
one
as q
uick
ly a
spo
ssib
le
See
thin
gs fr
omm
y pe
rspe
ctiv
e
7372 73
7271
7170
72 72
68 6968
77 7775
7574
75 75 74 74
7170 71
65
70
75
80
Are
hone
st
Del
iver
hig
h sa
fety
sta
ndar
ds
Prov
ide
serv
ices
with
out b
ias
Expl
ain
inte
nded
act
ions
cle
arly
Enge
nder
con
fiden
ce in
thei
rkn
owle
dge
Com
mun
icat
e w
ell
Are
cons
iste
nt
Prov
ide
good
val
ue s
ervi
ces
Are
relia
ble
Are
held
acc
ount
able
Get
thin
gs d
one
as q
uick
ly a
s po
ssib
le
See
thin
gs fr
om m
y pe
rspe
ctiv
e
NZ (n=757) UK (n=1327) SA (n=657) VIC (n=714) QLD (n=748) NSW (n=1586)
Average 7110
7210
UK
7210
NSW
7310
NZ
7410
QLD
7110
VIC
bull The attribute lsquoAre honestrsquo is the top ranking attribute this year
bull Other top attributes are lsquodeliver high safety standardsrsquo and lsquoprovide services without biasrsquo
Bottom 3 lowest performing attributes are
bull lsquoSee things from my perspectiversquo (68 out of 10)
bull lsquoGet things done as quickly as possiblersquo (69 out of 10)
bull lsquoAre held accountablersquo (68 out of 10)
Across jurisdictions VIC has the lowest average ratings for employee perceptions
QLD has the highest average rating in 2019 after being in the last spot in 2018
Figure 25 Business perceptions of employee related attributes
Base(n)=724
Business
BUSINESS PERCEPTION OF EMPLOYEESThere have been no statistically significant changes to the ratings of employee attributes versus last year
+02 +01 +02 +01 +01 +01 +01 +01 - +02
+01 +01
Legend Statistically significant increase in avg from 2018 (at 99 level of Confidence)No significant change in avg from 2018(at 99 level of Confidence)Statistically significant decrease in avg from 2018 (at 99 level of Confidence)
45
Source Customer Service Commission Customer Satisfaction Measurement Survey 2019 Report developed in conjunction with the NSW Customer Service CommissionerPublic I1-A2
Satisfaction Drivers Average score across respondents (according to a scale from 1 strongly disagree to 10 strongly agree)
Process for SA1) Simplicity and efficiency of
processes2) Employee autonomy
Average across attributes
Process across jurisdictions1) Simplicity and efficiency of
processes2) Employee autonomy
Average across attributes
68 66 65 6561
55
65
75
Processes areeasy to understand
Employees areempowered tomake decisions
Service feelsseamless even if I
have to usemultiple contact
methods
I can get to theright person the
first time
Are designed toreduce wait times
Average 6510
6710
UK
6510
NSW
6710
NZ
6810
QLD
6510
VIC
68
66 65
6561
71
68 6767 67
60
65
70
75
Processes areeasy to understand
Employees areempowered tomake decisions
Service feelsseamless even if I
have to usemultiple contact
methods
I can get to theright person the
first time
Are designed toreduce wait times
NZ (n=731) UK (N=1324) SA (n=661) VIC (n=711) QLD (n=745) NSW (n=1614)
bull Average rating for process attributes are the lowest in comparison to other attributes (employees ndash 71 goals ndash 68 values ndash 71)
bull Among all jurisdictions QLD has the highest average rating of 68 out of 10
bull SA ranks lowest among all jurisdictions for the statement lsquoAredesigned to reduce wait timesrsquo
Figure 26 Business perceptions of process related attributes
Base(n)= 712
Business
BUSINESS PERCEPTION OF PROCESSESAll the processes related attributes have remained stable from 2018 to 2019
+01+01
+01+01-01
Legend Statistically significant increase in avg from 2018 (at 99 level of Confidence)No significant change in avg from 2018(at 99 level of Confidence)Statistically significant decrease in avg from 2018 (at 99 level of Confidence)
46
Source Customer Service Commission Customer Satisfaction Measurement Survey 2019 Report developed in conjunction with the NSW Customer Service CommissionerPublic I1-A2
Satisfaction Drivers Average score across respondents (out of 10 on scale of according to a scale from 1 strongly disagree to 10 strongly agree)
Goals for SA1) Privacy2) Transparency3) Access
Average across attributes
Goals across jurisdictions1) Privacy2) Transparency3) Access
Average across attributes
7469 68 67
63
55
65
75
85
Safeguard privacyand confidentiality
Is making it easierto access
information abouttheir services
Is making best useof online services
to improveconvenience and
efficiency forcustomers
Demonstrateopenness andtransparency indecision-making
Encourage publicparticipation in
decision-makingAverage 68
10
6910
UK
6810
NSW
6910
NZ
6910
QLD
6710
VIC
77
71
69 67
62
71
6866 66
6260
65
70
75
80
Safeguard privacyand confidentiality
Is making it easierto access
information abouttheir services
Is making best useof online services
to improveconvenience and
efficiency forcustomers
Demonstrateopenness andtransparency indecision-making
Encourage publicparticipation in
decision-making
NZ (n=732) UK (n=1295) SA (n=641) VIC (n=681) QLD (n=708) NSW (n=1554)
bull Compared to 2018 lsquoEncourage public participation in decision makingrsquo has seen a statisticallysignificant increase of 04 points to 61 out of 10 However this continues to be the lowest rated goal related attribute
bull Across jurisdictions QLD has the highest average rating of 69
bull The largest gap between jurisdictions is seen for lsquoSafeguard privacy and confidentialityrsquo with NZ having the highest rating of 77 out of 10 and VIC having the lowest rating of 71 out of 10
Figure 27 Business perceptions of goals related attributes
Base(n)= 695
Business
04
Legend Statistically significant increase in avg from 2018 (at 99 level of Confidence)No significant change in avg from 2018(at 99 level of Confidence)Statistically significant decrease in avg from 2018 (at 99 level of Confidence)
BUSINESS PERCEPTION OF GOALSMost goal related attributes with the exception of lsquoEncourage public participation in decision-makingrsquo have remained stable versus last year
+03 -03 +03 +02
47
Source Customer Service Commission Customer Satisfaction Measurement Survey 2019 Report developed in conjunction with the NSW Customer Service CommissionerPublic I1-A2
Satisfaction Drivers Average score across respondents (out of 10 on scale of according to a scale from 1 strongly disagree to 10 strongly agree)
Values for SA1) Service Quality2) Accountability
Average across attributes
Values across jurisdictions1) Service Quality2) Accountability
Average across attributes
Average 7110
74 74 74
71
71 71 71
69
65
70
75
80
Operates with integrity Provides good service Is a body I can trust Is accountable for itsservices
NZ (n=803) UK (n=1367) SA (n=702) VIC (n=748) QLD (n=789) NSW (n=1676)
7210
UK
7110
NSW
7210
QLD
7310
NZ
7010
VIC
72 71 71 70
55
65
75
Operates with integrity Provides good service Is a body I can trust Is accountable for itsservices
bull lsquoIntegrityrsquo is the top rated value attribute with a rating of 72 out of 10
bull While lsquoaccountabilityrsquo is the least rated attribute there has been a 02 point increase (statistically insignificant) versus 2018
bull Across jurisdictions VIC has slipped to the lowest ranking after being the top performing Australian jurisdiction last year and NZ has the highest average rating of 73 out of 10 making it the top performingjurisdiction in 2019
bull The gap between the top performing jurisdiction and lowest performer have narrowed in comparison to last year indicating an improvement in performance across jurisdictions
Figure 28 Business perceptions of values related attributes
Base(n)= 758
Business
BUSINESS PERCEPTION OF VALUESValue related attributes continue to be statistically stable in 2019
+01 +01 +01 +02
Legend Statistically significant increase in avg from 2018 (at 99 level of Confidence)No significant change in avg from 2018(at 99 level of Confidence)Statistically significant decrease in avg from 2018 (at 99 level of Confidence)
48
Source Customer Service Commission Customer Satisfaction Measurement Survey 2019 Report developed in conjunction with the NSW Customer Service CommissionerPublic I1-A2
Employee attributes Goals Processes Values
1Note Groupings of drivers of satisfaction are based on analyses of NSW Government services however it is assumed that drivers of satisfaction are relatively consistent across jurisdictions and generally across service industries broadly
bull Safeguard privacy and confidentiality
Goa
ls
bull Provide good value servicesbull Are honestbull Are reliablebull Deliver high safety standards
Empl
oyee
s
bull Are consistentbull Explain intended actions clearlybull Communicate wellbull Engender confidence in their
knowledge
Communication of employees
bull Are held accountablebull Get things done as quickly as
possible
Efficiency and Effectiveness of employeesHonesty and integrity of employees
Employee autonomySimplicity and efficiency of processes
bull Processes are easy to understandbull Service feels seamless across channelsbull Processes are designed to reduce wait timesbull I can get to the right person the first time
bull Employees are empowered to make decisions
Accountability and Service Quality
bull Is a body that I can trustbull Operates with integritybull Provides good value servicesbull Is accountable for its services
Proc
esse
sVa
lues
Access to Information and Online services PrivacyTransparency
bull Demonstrate openness and transparency in decision making
bull Encourage public participation in decision making
bull Is making it easier to access information about their service
bull Is making best use of online services to improve efficiency for customers
bull See things from my perspective
bull Provide services without bias
Fairness and Empathy of employees
Consumer
GROUPINGS OF DRIVERS OF CUSTOMER SATIFACTION1
The groupings of drivers have changed from 2018 - lsquoFairness and Empathyrsquo is now a key standalone driver of consumer satisfaction differentiated from Communication which continues to be a key driver of consumer satisfaction
49
Source Customer Service Commission Customer Satisfaction Measurement Survey 2019 Report developed in conjunction with the NSW Customer Service CommissionerPublic I1-A2
KEY
When looking at the relative importance of satisfaction drivers in NSW Employee related attributes are seen to have the highest relative importance as drivers of satisfaction with lsquoHonesty and Integrityrsquo being the most important driverRelating this to the areas of improvement for the SA Governmentbull Honesty and Integrity is a strength that the SA
Government services can build on to improve consumer satisfaction
bull Access to information and online services as well as efficiency and effectiveness of employees are primary opportunities to drive higher consumer satisfaction
Note Groupings of drivers of satisfaction are based on analyses of NSW Government services however it is assumed that drivers of satisfaction are relatively consistent across jurisdictions and generally across service industries broadly
LOW
HIGH
Average score across attributes (SA)(out of 10)
LOW
HIGH
Rel
ativ
e im
port
ance
(NSW
)
Median across all attributes
1Note Analysis displayed is based on NSW customer data however similar results are observed for businesses Calculation is based on the relativity of parameters in the statistical analysis of drivers against satisfaction
Strengths to lsquobuild onrsquo
Median across drivers
Primary opportunities
Secondary opportunities
Fairness and Empathy
Simplicity and efficiency of processes
Transparency
Access to information and online services
Privacy
Employee autonomy
Employee attributes Goals Processes
Figure 211 Importance (NSW) versus performance (SA) against each of the drivers of satisfaction
Monitor
Communication
Consumer
Efficiency and effectiveness
Honesty and integrity
PRIORITISATION OF DRIVERS OF SATISFACTION1
Build on the honesty and integrity of employees and focus on improving their efficiency and effectiveness to drive higher satisfaction In addition focus on improving access to information and online services
50
Public ndash I1-A2
SOUTH AUSTRALIAN CUSTOMER SATISFACTION MEASUREMENT SURVEY 2019
3 SATISFACTION BY CONTACT METHOD AND DIGITAL INSIGHTS
Source Customer Service Commission Customer Satisfaction Measurement Survey 2019 Report developed in conjunction with the NSW Customer Service CommissionerPublic I1-A2
51
4135
29
128
47
40
29 27
15
6
Inperson
Phone Online Email Mail fax Thirdparties
2018 Business (n=814) 2019 Business (n=762)
c
usto
mer
s w
ho h
ave
had
dire
ct
deal
ings
via
this
cha
nnel
Figure 33 2018 and 2019 channel usage - Business
Figure 34 2018 and 2019 most preferred channel ndash Business
2922 22 22
2 4
3224 23
16
3 2
In person Email Phone Online Mailfax Thirdparties
2018 Business(n=795) 2019 Business(n=743)
Note ndash Percentages do not add up to 100 due to exclusion of Donrsquot Know from the analysis
Businessesbull While lsquoin personrsquo remains the most
used channel for contact there is a continued decline in usage since 2017 (52 in 2017 51 in 2018 47 in 2019) though not statistically significant
bull Despite the year on year declines lsquoin personrsquo continues to be the most preferred channel and there has been a year on year growth in preference since 2017 (27 in 2017 29 in 2018 32 in 2019)
57
3325
139 6
58
3426
1610
5
Inperson
Phone Online Email Mail fax Thirdparties
2018 Consumer (n=3307) 2019 Consumer (n=3297)
34
22 2112
4 2
3324 21
16
4 2
Inperson
Phone Online Email Mailfax Thirdparties
2018 Consumer (n=3307) 2019 Consumer (n=3170)
cus
tom
ers
who
hav
e ha
d di
rect
de
alin
gs v
ia th
is c
hann
el
Figure 31 2018 and 2019 channel usage - Consumer
Figure 32 2018 and 2019 most preferred channel - Consumer
Consumersbull lsquoIn personrsquo continues to be the most used
channel for contact as well as the most preferred channel Usage has remained consistent versus last year
bull Phone usage by consumers continues to see a year on year uptick though statistically insignificant (31 in 2017 33 in 2018 and 34 in 2019)
bull Relative preferences for the channels have remained unchanged versus last year
Consumer Business
CONTACT METHODS USED AND PREFERREDlsquoIn-personrsquo continues to be the most used and preferred method of contact for both consumers and businesses
52
Source Customer Service Commission Customer Satisfaction Measurement Survey 2019 Report developed in conjunction with the NSW Customer Service CommissionerPublic I1-A2
47
41
3130
12
5
4442
2529
96
56
40
24
31
96
4650
25
40
16
4
51
41
24
37
13
3
47
40
29 27
15
6
In person face toface
Telephone Online Email Mail posted letterfax
Third parties
NSW (n=1801) VIC (n=790) QLD (n=832)
UK (n=1420) NZ (n=868) SA (n=762)
Customers were asked ldquoWhich of the following contact methods have you used to carry out your direct dealings with the following services in [Jurisdiction] in the last 12 monthsrdquo
Figure 35 Contact method used to interact with government services across jurisdictions
59
31 31
16
84
54
33
2320
10
6
59
31
24
17
10
5
53
36
23 2116
2
57
31
24
19
13
2
58
34
26
16
105
In person face toface
Telephone Online Email Mail posted letterfax
Third parties
NSW (n=6771) VIC (n=3458) QLD (n=3346)UK (n=3310) NZ (n=3550) SA (n=3297)
Consumer
Business
Consumersbull Face to face is the most used channel
by consumers to access government services in all jurisdictions
bull NSW leads the way when it comes to the use of online channels
Businessesbull Face to face is the most used channel by
businesses to access government services in all jurisdictions
bull NSW leads in the adoption of online as a contact method followed by SA
bull Business usage of telephones and emails as a contact method is higher than that for consumers across all jurisdictions
Consumer Business
CONTACT METHODS USED AND PREFERREDlsquoIn-personrsquo is the most used contact method across all jurisdictions for both consumers and businesses SA is second to NSW in the usage of online as the method of contact for both consumers and businesses
53
Source Customer Service Commission Customer Satisfaction Measurement Survey 2019 Report developed in conjunction with the NSW Customer Service CommissionerPublic I1-A2
28
24 24
18
42
26
22
28
20
2 2
29
25
22
18
3 2
25
2826
16
5
0
29
26
23
18
31
32
24 23
16
32
In person face toface
Email Telephone Online Mail posted letterfax
Third parties
NSW (n=1759) VIC (n=774) QLD (n=809)UK (n=1401) NZ (n=850) SA (n=743)
35
18
24
18
32
33
23
19 19
52
34
21 20 20
42
31
2219
22
6
1
34
21 21 20
41
33
2421
16
42
In person face toface
Telephone Online Email Mail posted letterfax
Third parties
NSW (n=6491) VIC (n=3336) QLD (n=3246)UK (n=3177) NZ (n=3399) SA (n=3170)
CONTACT METHODS PREFERRED ACROSS JURISDICTIONSlsquoIn-personrsquo continues to be the most preferred channel across all jurisdictions for both consumers and businesses
Customers were asked ldquoGenerally which contact method do you most prefer when dealing directly with each of the following services inhelliprdquo
Figure 36 Contact method preferred to interact with government services across jurisdictions
Consumer
Business
Consumersbull Face to face is the preferred method of
contact for consumers to access government services in all jurisdictions
bull The pattern of preference is consistent with that of reported channel usage
Businessesbull Businesses prefer a variety of contact
methods to access government servicesbull Of all jurisdictions SA businesses have
the highest preference for face to face interactions
Consumer Business
54
Source Customer Service Commission Customer Satisfaction Measurement Survey 2019 Report developed in conjunction with the NSW Customer Service CommissionerPublic I1-A2
75
70 71 71 69 68
73 73 72 72 7167
50
60
70
80
In person Online Mailfax Phone Email Third parties2018 Business(n=814) 2019 Business(n=762)
Aver
age
satis
fact
ion
scor
e (1
-10)
76 7573 72 72
70
77 75 74 73 71 70
50
60
70
80
Online In person Third parties Phone Mailfax Email2018 Consumer (n=3307) 2019 Consumer (n=3297)
Aver
age
satis
fact
ion
scor
e (1
-10)
VARIATION IN CUSTOMER SATISFACTION BY CONTACT METHODWhile lsquoin-personrsquo is the most used and most preferred method of contact satisfaction of consumers with SA Government services is higher for those who use Online channels For businesses satisfaction is high for both in-person and online channel users
Customers were asked ldquoWhich of the following contact methods have you used to carry out your direct dealings with the following servicesrdquo
Figure 37 Variation in overall satisfaction by contact method
+01+01
+03
- -
+02+01
+01
+01
-01
Consumersbull Satisfaction ratings are high (7+ out
of 10) across all contact channelsbull Consumers who have used online
channels to contact have the highest satisfaction rating and this has remained relatively stable from last year
Businessesbull Satisfaction amongst businesses
using different channels have remained relatively stable compared to last year
bull Businesses who have used face to face or online methods of contact have the highest satisfaction rating
+01
Consumer Business
Legend Statistically significant increase in avg from 2018 (at 99 level of Confidence)No significant change in avg from 2018 (at 99 level of Confidence)Statistically significant decrease in avg from 2018 (at 99 level of Confidence)
-02
55
Source Customer Service Commission Customer Satisfaction Measurement Survey 2019 Report developed in conjunction with the NSW Customer Service CommissionerPublic I1-A2
7978
74
7675
74
76 77
7374
7273
7877
75 75 75
71
76 7675 75
71 71
77 76
7475
73
77
75
74 73
7170
Online In person face to face Third parties such asAustralia Post
Telephone Mail posted letter fax Email
NSW (n=6771) VIC (n=3458) QLD (n=3346) UK (n=3310) NZ (n=3550) SA (n=3297)
7575
71
7271 71
73 73 73
69
67
73
77
73
7776
71
68
75
72
68
74
71
70
74
79
76
71
73
77
73 7372 72 71
67
In person face toface
Online Mail posted letter fax Telephone Email Third parties such asAustralia Post
NSW (n=1801) VIC (n=790) QLD (n=832) UK (n=1420) NZ (n=868) SA (n=762)
Figure 38 Overall satisfaction with government services by contact method(s) used across jurisdictions
Aver
age
scor
e (1
-10)
Aver
age
scor
e (1
-10)
Consumer
Business
Consumersbull Across jurisdictions
consumers who use online channels have the highest satisfaction with their respective government services
bull Consumers in NZ using online channels show the highest satisfaction of all jurisdictions
Businessesbull In all jurisdictions except
NZ businesses that use face to face have the highest satisfaction with their respective government services In NZ online users have the highest satisfaction
bull SA businesses who use third party channels show the lowest satisfaction in comparison to businesses that use other channels
Consumer Business
VARIATION IN CUSTOMER SATISFACTION BY CONTACT METHOD ACROSS JURISDICTIONSConsumers who use online and businesses who use face to face have higher satisfaction with government services across jurisdiction
81
56
Source Customer Service Commission Customer Satisfaction Measurement Survey 2019 Report developed in conjunction with the NSW Customer Service CommissionerPublic I1-A2
7069
65 66
62
6765
63 6360
6866
63 6261
6461
59 59 58
70
67 66 6564
69 6865 65
62
Processes are easy tounderstand
Employees are empoweredto make decisions
Service feels seamlesseven if I have to
communicate acrossdifferent channels (ieonline phone email)
I can get to the right personthe first time
Are designed to reducewait times
In person face to face (n=1418) Mail posted letter fax (n=229)
Telephone (landline mobile calls text message) (n=883) Email (n=419)
Online (n=591) Third parties such as Australia Post (n=117)
6865 66 66
61
66 66 66 66
55
6462 62 62
57
65 6562 61
57
6865 63 63
60
74
69 6972
65
Processes are easy tounderstand
Service feels seamlesseven if I have to
communicate acrossdifferent channels
Employees are empoweredto make decisions
I can get to the right personthe first time
Are designed to reducewait times
In person face to face (n=300) Mail posted letter fax (n=87)
Telephone (landline mobile calls text message) (n=280) Email (n=207)
Online (n=178) Third parties such as Australia Post (n=31)
Figure 310 Perceptions of processes by channel(s) used - Business
Figure 39 Perceptions of processes by channel(s) used - Consumers
Aver
age
scor
e (1
-10)
Aver
age
scor
e (1
-10)
Consumersbull Consumers who have used in-person channels give
the highest scores for lsquoprocesses are easy to understandrsquo lsquoemployees are empowered to make decisionsrsquo and lsquoI can get to the right person the first timersquo
bull Consumers who have used online channels gave the highest ratings to lsquoService feels seamlessrsquo and lsquoare designed to reduce wait timesrsquo
bull Consumers who have used email rate the SA Government service lowest across all process attributes
Businessesbull Businesses who have used third party channels have
given the highest ratings for all process attributesbull Businesses that used mail posted letter or fax as
their method of contact rated the SA Government lowest on processes lsquoare designed to reduce wait timesrsquo attribute
bull Businesses that used telephone gave the lowest ratings to the attributes of lsquoprocesses are easy to understandrsquo lsquoservice feels seamlessrsquo and lsquoemployees are empowered to make decisionsrsquo
bull Business that used email gave the lowest rating to lsquoI can get to the right person the first timersquo
Consumer Business
PERCEPTIONS OF PROCESSES BY CONTACT METHODConsumers and businesses have different perceptions of processes based on the channels they have used
57
Source Customer Service Commission Customer Satisfaction Measurement Survey 2019 Report developed in conjunction with the NSW Customer Service CommissionerPublic I1-A2
79 79 78 78 78 78 78 75
102030405060708090100
0102030405060708090
100
I trust myinformation was
handledsecurely
through thewebsiteapp
I achieved theoutcome by
using servicesavailable online
The contentwas current
and accurate
The format ofcontent met my
accessrequirements
I was satisfiedwith the overallexperience of
using thewebsiteapp tocomplete the
task
Thewebsiteapp
was useful andallowed me todo everything Ineeded to do
Content andsupport
provided onlinewas sufficientto answer my
questions
I found thewebsite appsimple and itwas easy to
find what I waslooking for
Disagree (1-4) Neutral (5-6) Agree (7-10) Average
Customers were asked ldquoThinking about your experiences interacting with SA services online in the last 12 months to what extent do you agree or disagree with each of the following statementsrdquo
Figure 311 Satisfaction with attributes of online services
82 81 81 80 79 79 79 78
102030405060708090100
0102030405060708090
100
The contentwas current
and accurate
I achieved theoutcome by
using servicesavailable online
I trust myinformation
was handledsecurely
through thewebsiteapp
The format ofcontent met my
accessrequirements
I was satisfiedwith the overallexperience of
using thewebsiteapp tocomplete the
task
Thewebsiteapp
was useful andallowed me todo everything Ineeded to do
Content andsupport
provided onlinewas sufficientto answer my
questions
I found thewebsite appsimple and itwas easy to
find what I waslooking for
Disagree (1-4) Neutral (5-6) Agree (7-10) Average
Axis 2 Average Score
Consumer (n=798)
Business (n=210)
Axis
1
Perc
enta
ge o
f re
spon
ses
Axis 2 Average ScoreAxis
1
Perc
enta
ge o
f re
spon
ses
Consumersbull Consumers had an average rating of 79
out of 10 when asked about their satisfaction with the overall experience of using the website app to complete the task This rating has stayed stable since 2017
bull Consumers showed the highest levels of agreement with statements pertaining to accuracy of content achieving desired outcomes by using online services and trusting that their information was handled securely
Businessesbull There has been a significant increase in
the average rating across all attributes of online service except content accuracy ndash this has remained stable
bull The rating on satisfaction with the overall experience has gone up significantly by 08 points to 78
+01 +01 +01 +02+01 +01 +02
+05 NA +04 +09 +08 +06 +06
Consumer Business
Legend Statistically significant increase in avg from 2018 (at 99 level of Confidence)No significant change in avg from 2018 (at 99 level of Confidence)Statistically significant decrease in avg from 2018 (at 99 level of Confidence)
NA
+09
SATISFACTION WITH ONLINE SERVICES OVERALLConsumer satisfaction with overall experience of using online services has remained stable while business satisfaction has increased significantly from 2018 to 2019
58
Source Customer Service Commission Customer Satisfaction Measurement Survey 2019 Report developed in conjunction with the NSW Customer Service CommissionerPublic I1-A2
Businessesbull Businesses had similar motivations as
consumers for not using online as a channel to access services ndash lack of availability of services online as well as inability to find what they were looking for
Customers were asked ldquoYou mentioned that you did not go online to access the service in the last 12 months Please select all statements that apply in relation to these service(s) in SA I did not complete this interaction online becausehelliprdquo
Figure 312 Reasons for not going online I did not go online hellip
Consumer (n=2401)
Business (n=762)
37 16 12 7 7 6 5 5 3
The servicewasnt
possible to beundertaken
online
The servicewas notavailable
online
I was not ableto find what Iwas looking
for
There was noonline supportto answer any
questions Imay havesuch aswebchat
I didnt haveaccess to acomputer or
an onlinedevice
The format ofcontent on the
website didnot meet my
accessrequirements
I was not sureif my
informationwould remainconfidential
No incentivewas provided
such as adiscount
The contentwas not
current andoraccurate
Consumersbull The main reason for consumers not using
online channels to access services was that the services were not available or couldnrsquot be undertaken online
bull The other big factor was that consumers were unable to find what they were looking for
bull Uncertainty around confidentiality of information was not seen as a big deterrent in accessing services online
Consumer Business
37 17 11 8 8 7 7 6 3
The servicewasnt
possible to beundertaken
online
The servicewas notavailable
online
I was not ableto find what Iwas looking
for
There was noonline supportto answer any
questions Imay havesuch aswebchat
I didnt haveaccess to acomputer or
an onlinedevice
The format ofcontent on the
website didnot meet my
accessrequirement
I was not sureif my
informationwould remainconfidential
No incentivewas provided
such as adiscount
The contentwas not
current andoraccurate
ADOPTING ONLINE METHODS TO INTERACT WITH SA GOVERNMENT SERVICESA main reason for consumers and businesses not using online channels to access services is a lack of online service availability
re
spon
dent
s
resp
onde
nts
59
Source Customer Service Commission Customer Satisfaction Measurement Survey 2019 Report developed in conjunction with the NSW Customer Service CommissionerPublic I1-A2
77
15 8
I chose to go online I was directed to or was prompted to go online There was no other option available
10
10
10
Avg
10
10
10
Avg
Customers were asked ldquoDid you choose to go online or were you directed to go onlinerdquo
Figure 313 Choice to go online
18
11
5
16
19
11
65
70
84
70
73
81
There wasno otheroption
available
I wasdirected to
or wasprompted
to goonline
I chose togo online
Strong disagree (1-4) Neutral (5-6) Strongly agree (7-10)
respondents
15
14
2
19
16
49
66
83
62
75
80
There wasno otheroption
available
I wasdirected or
promoted togo online
I chose togo online
respondents
Consumer Business
74
224
Figure 314 Satisfaction with using websiteapp by choice to go onlineCustomers were asked ldquoHow satisfied were you with the overall experience of using the websiteapp to complete the taskrdquo
n=843 n=220
Consumer (n=822) Business (n=218)
uarr1 darr2
24
Consumersbull 77 of consumers who used online methods chose to
go online themselves while 8 said there was no other option available to them
bull Consumers who chose to go online were more satisfied with the overall experience of using the websiteapp to complete the task (81 out of 10 ndash an increase of 03 points versus 2018)
bull There was an increase in satisfaction across all 3 types of online users ndash voluntary (78 in 2018) prompted to (72 in 2018) didnrsquot have any other option (68 in 2018)
Businessesbull Businesses saw a 7 points increase in those choosing
to go online This was due to a 5 point decrease in those saying they had no other choice and 2 point decrease in those saying they were directed to or were prompted to go online
bull Businesses who chose to go online saw a 09 point increase in satisfaction versus last year (8 out of 10 in 2019 vs 71 out of 10 In 2018)
bull Even those who said they had no other option showed higher satisfaction of 62 out of 10 (+07 points vs 2018)
uarr7
Consumer Business
darr1
darr5
CUSTOMER CHOICE TO USE ONLINE SERVICES77 of consumers and 74 of businesses chose to go online to access government services and they have the highest satisfaction
60
Source Customer Service Commission Customer Satisfaction Measurement Survey 2019 Report developed in conjunction with the NSW Customer Service CommissionerPublic I1-A2
50 4640
17
31
52 53
10
Smartphone Laptop computer Desktop computer TabletiPad
Consumer (n=843)Business (n=220)
Customers were asked ldquoWhat devices did you use to access the online content Please select all contact methods that applyrdquo
Figure 315 Devices used when dealing with SA Government services online
Figure 316 Satisfaction with online services by device used Customers were asked ldquoHow satisfied were you with the overall experience of using the websiteapp to complete the taskrdquo
re
spon
dent
s
77
79 798080
74
80
76
Smartphone Laptop computer Desktop computer TabletiPad
Consumer (n=822)Business (n=218)
Aver
age
satis
fact
ion
(out
of 1
0)
Consumer Business
Consumersbull While most consumers (50) used smartphones
to access online content their satisfaction levels with their experience was lower (77 out of 10) compared to those who used desktops or laptops to access online content (79 out of 10)
bull Few consumers are using tabletsiPad (17) but those that do have high levels of satisfaction (8 out of 10)
Businessesbull Most businesses used laptops (52) or desktops
(53) to access online content Desktop users had a higher overall satisfaction (8 out of 10) compared to laptop users (74 out of 10)
bull In contrast to consumers only 31 of businessesused smartphones to access content online however they had higher levels of satisfaction with the overall experience (8 out of 10)
DEVICE USED BY CUSTOMERS FOR ONLINE SERVICESMost consumers used smartphones but the satisfaction levels of those who used smartphones was lower than users of other channels Fewer businesses used smartphones but those that did showed higher levels of satisfaction
61
Public ndash I1-A2
SOUTH AUSTRALIAN CUSTOMER SATISFACTION MEASUREMENT SURVEY 2019
4 PUBLIC SERVICE OVERALL
Source Customer Service Commission Customer Satisfaction Measurement Survey 2019 Report developed in conjunction with the NSW Customer Service CommissionerPublic I1-A2
Customers were asked ldquoThinking about all your experiences with each of the following Australian industries and public services over the previous 12 months how satisfied would you say you are with them rdquo
Figure 41 Satisfaction with SA Public Service overall compared to industries
bull Average satisfaction with the SA Public Service lsquobrandrsquo is 66 for both consumers and businesses ndashrelatively stable versus last year
bull Both consumers and businesses continue to rate SA Public Service lsquobrandrsquo higher than most other industries and public services except airlines
bull Satisfaction with SA Government services continues to be higher than satisfaction with the lsquobrandrsquo for both consumers and businesses This suggests a continued disconnect between service delivery and lsquobrandrsquo perceptions that are influenced by a range of factors such as media and reputation
+02
31
27
22
23
21
14
8
30
34
30
30
28
30
28
39
40
47
47
51
56
64
56
57
61
61
62
66
70
Energy Retailers(n=485)
FederalGovernment
(n=465)
My local council(n=477)
Banks (n=486)
Telephone ServProviders(n=477)
SA PublicService overall
(n=484)
Airlines (n=457)
Dissatisfied (1-4) Neutral (5-6) Satisfied (7-10)
respondents Avg
Business (n=457) respondents Avg
Consumer (n=1649)
7375 00 +01
+03
+01
+01
+02
+03
+02
+02
+02
+10
+04
+05
+05
+0636
35
27
25
24
15
9
26
28
26
27
26
27
24
38
37
47
49
49
59
67
53
54
59
60
61
66
71
FederalGovernment
(n=1835)
EnergyRetailers(n=1924)
Banks(n=1934)
My local council(n=1876)
Telephone ServProviders(n=1930)
SA PublicService overall
(n=1915)
Airlines(n=1649)
Dissatisfied (1-4) Neutral (5-6) Satisfied (7-10)
SA Government Services
Average satisfaction
Consumer Business
Legend Statistically significant increase in avg from 2018 (at 99 level of Confidence)No significant change in avg from 2018 (at 99 level of Confidence)Statistically significant decrease in avg from 2018 (at 99 level of Confidence)
Consumer Business
Note scores are subject to rounding and may not sum to 100
PERCEPTIONS OF THE SA PUBLIC SERVICE lsquoBRANDrsquoBoth consumers and businesses rate the SA Public Services lsquobrandrsquo higher than all other industries and public services with the exception of airlines
63
Source Customer Service Commission Customer Satisfaction Measurement Survey 2019 Report developed in conjunction with the NSW Customer Service CommissionerPublic I1-A2
bull NSW Public Service lsquobrandrsquo has the most positive perception amongst consumers Whereas the Public Service lsquobrandsrsquo in SA is second only to Airlines as with QLD and VIC
bull Businesses also have similar perceptions of the Public Service lsquobrandrsquo across all jurisdictions In Australia the average satisfaction ratings are second to airlines Whereas in UK and NZ airlines and banks have higher average satisfaction ratings
Lowest
Highest
Avg
sat
isfa
ctio
n (b
usin
esse
s)
NZ
NZ Govt Service 68
Banks 69
Energy 66
Local council 58
Airlines 74
Telcorsquos 65
NSW
Airlines 71
NSW Public Service 69
Banks 60
Energy 57
Telcorsquos 60
Local council 61
Fed Govt 60
QLD
Airlines 71
QLD Public Service 67
Telcorsquos 61
Local council 61
Banks 57
Energy 57
Fed Govt 58
VIC
Airlines 71
VIC Public Service 65
Banks 58
Energy 57
Local council 59
Fed Govt 57
Telcorsquos 60
SA
Airlines 70
Telcorsquos 62
SA Public Service 66
Banks 61
Energy 56
Local council 61
Fed Govt 57
UK
Airlines 70
Telcorsquos 66
Energy 63
UK Public Service 68
Local Council 61
Banks 68
Business
Figure 42 Comparison of Public service brand perceptions across jurisdictionsCustomers were asked ldquoThinking about all your experiences with each of the following [jurisdiction] industries and public services over the previous 12 months how satisfied would you say you are with them rdquoConsumer
NZ
NZ Govt Service 69
Banks 69
Airlines 74
Telcorsquos 66
Energy 66
Local council 59
NSW NSW
Public Service 71
Airline 71
Telcorsquos 62
Energy 59
Local council 62
Banks 61
Fed Govt 57
QLD
Airlines 70
QLD Public Service 69
VIC SA
Airlines 71
Telcorsquos 61
SA Public Service 66
Local council 60
Banks 59
Energy 54
Fed Govt 53
UK
Airlines 71
UK Public Service 69
Banks 69
Energy 64
Telcorsquos 69
Local council 61
Consumer Business
Lowest
Highest
Avg
sat
isfa
ctio
n (c
onsu
mer
s)
Airlines 71
Telcorsquos 63
VIC Public Service 70
Banks 63
Local council 62
Energy 60
Fed Govt 59
Telcorsquos 62
Local council 62
Banks 60
Energy 59
Fed Govt 58
PUBLIC SERVICE lsquoBRANDrsquo COMPARISON BY JURISDICTIONAustralian jurisdictions perform better than NZ and UK in perceptions of their public service lsquobrandsrsquo for both consumers andbusinesses relative to other industries
64
Source Customer Service Commission Customer Satisfaction Measurement Survey 2019 Report developed in conjunction with the NSW Customer Service CommissionerPublic I1-A2
Respondents were asked to select from a list of positive and negative descriptors of SA Public Service bull The top five descriptors of the SA Public Service
overall were all positive and consistent with 2018
bull The most commonly selected negative brand descriptors are lsquoinefficientrsquo lsquoimpersonalrsquo lsquoinflexiblersquo and lsquodifficultrsquo This pattern is similar to 2018
0
10
20
30
40Innovative
Motivated
Modern
Flexible
Accountable
Caring
EfficientHonest
Respectful
Knowledgeable
Capable
Friendly
Helpful
Figure 43 Positive Descriptors of the SA Public Service overall - Consumer
Customers were asked ldquoThinking now about the SA Public Service overall and all of the services and agencies which fall under it which of the following words would you use to describe the SA Public Service rdquo
0
10
20
30
40Lazy
Controlling
Patronising
Outdated in digitalservices
Complacent
Wasteful
Inflexible
Difficult
Impersonal
Inefficient
2018 Consumer (n=1999) 2019 Consumer (n=1998)
Figure 44 Negative Descriptors of the SA Public Service overall -Consumer
Top 5 descriptors
Consumer
CONSUMER DESCRIPTIONS OF THE SA PUBLIC SERVICE lsquoBRANDrsquoThe top 5 descriptors used by consumers to describe SA Public Service are lsquohelpfulrsquo lsquofriendlyrsquo lsquocapablersquo lsquoknowledgeablersquo and lsquorespectfulrsquo
65
Source Customer Service Commission Customer Satisfaction Measurement Survey 2019 Report developed in conjunction with the NSW Customer Service CommissionerPublic I1-A2
0
10
20
30
40
Outdated in digitalservices
Patronising
Lazy
Controlling
Complacent
Difficult
Inflexible
Impersonal
Wasteful
Inefficient
2018 Business (n=551) 2019 Business (n=502)
bull In contrast to last year businesses have described SA Public services more positively this year
bull All positive attributes have seen an increase in proportion of responses with the exception of lsquoinnovativersquo (-2 points vs last year) and lsquoaccountablersquo (-2 points vs last year)
bull The top 5 descriptors are lsquohelpfulrsquo (+6 points vs last year) lsquofriendlyrsquo (+4 points vs last year) lsquocapablersquo (+9 points vs last year) lsquoknowledgeablersquo (+3 points vs last year) and lsquorespectfulrsquo (+3 points vs last year)
bull Conversely all negative attributes have seen a decrease in proportion of responses compared to last year
0
10
20
30
40Innovative
Motivated
Modern
Flexible
Caring
Accountable
EfficientHonest
Respectful
Knowledgeable
Capable
Friendly
Helpful
Figure 45 Positive descriptors of the SA Public Service overall - business
Businesses were asked ldquoThinking now about the SA Public Service overall and all of the services and agencies which fall under it which of the following words would you use to describe the SA Public Service rdquo
Figure 46 Negative descriptors of the SA Public Service overall - business
Top 5 descriptors
Business
BUSINESS DESCRIPTIONS OF THE SA PUBLIC SERVICE lsquoBRANDrsquoThe top 5 descriptors used by businesses to describe SA Public Service are lsquohelpfulrsquo lsquofriendlyrsquo lsquocapablersquo lsquoknowledgeablersquo andlsquorespectfulrsquo
66
Public ndash I1-A2
SOUTH AUSTRALIAN CUSTOMER SATISFACTION MEASUREMENT SURVEY 2019
5 FEEDBACK
Source Customer Service Commission Customer Satisfaction Measurement Survey 2019 Report developed in conjunction with the NSW Customer Service CommissionerPublic I1-A2
NATURE OF FEEDBACK AND FEEDBACK CHANNELSProcesses are the most common source of complaints while employees are a more common source of compliments
68
Consumersbull Processes are the most common source of
complaints Consumers also complain about outcomes of their interactions
bull Compliments mainly relate to interactions with employees
bull Both complaints and compliments are mainly made in person whereas consumers take to emails to make suggestions for change
Businessesbull Complaints and suggestions are mainly made
about processes and outcomes of interactions
bull Compliments most often relate to the information available to businesses
bull As with consumers businesses complain or compliment mostly in-person
bull Businesses also use email to give compliments and emails are the preferred method to make suggestions
11
44
28
16
2
42
14
23
18
3
32
17
28
12
11
Theprocesses
Theemployees
youinteracted
with
Theoutcomes of
yourinteraction
Informationavailable to
you
Other
I gave a compliment I made a suggestion for change I made a complaint
22
22 26
30
0
47
17
14
22
0
36
18
33
13
0
Theprocesses
Theemployees
youinteracted
with
Theoutcomes of
yourinteraction
Informationavailable to
you
Other
Figure 51 Nature of feedback by feedback typeQuestion ldquoWhat did your feedback primarily relate to rdquo
Consumer (n = 519) Business (n = 192)
2242
30
5233
38
17 1416
4 6 105 4 5
I gave acompliment
I made asuggestion for
change
I made acomplaint
37 41 37
37 29 45
5 19921 11 5
04
I gave acompliment
I made asuggestion for
change
I made acomplaint
bull Other
bull Via postal letter
bull Via servicersquos website
bull In person face to face or via the phone
bull Via email
Figure 52 Nature of feedback and feedback channelsQuestion ldquoHow did you provide your feedbackrdquo
Consumer (n=519) Business (n=194)
Consumer Business
Source Customer Service Commission Customer Satisfaction Measurement Survey 2019 Report developed in conjunction with the NSW Customer Service CommissionerPublic I1-A2
37
44
3538
45
4041
3633
4036
42
21 20
31
2219 18
NSW (n=529) VIC (n=186) QLD (n=184) UK (n=456) SA (n=194) NZ (n=215)
Complaint Suggestion for change Compliment
28 28 29
33 33
2829
37
27 28 28
33
43
35
44
39 39 39
NSW (n=1203) VIC (n=569) QLD (n=528) UK (n=619) SA (n=519) NZ (n=520)
Complaint Suggestion for change Compliment
Figure 53 Overall satisfaction with Government services by contact method(s) used across jurisdictions
o
ffee
dbac
k ev
er re
ceiv
ed
of f
eedb
ack
ever
rece
ived
Consumer (Base Consumers in each jurisdiction who ever provided feedback)
Business (Base Businesses in each jurisdiction who ever provided feedback)
Consumer Business
JURISDICTIONAL COMPARISON OF NATURE OF FEEDBACKOf all jurisdictions SA received the highest proportion of complaints from both consumers and businesses
Consumersbull Compliments form the highest
proportion of all feedback received across all jurisdictions except VIC
bull Across jurisdictions SA and UK received the highest proportion of complaints
bull QLD was the jurisdiction to receive the highest proportion of compliments closely followed by NSW
Businessesbull Unlike consumers complaints and
suggestions form most of the feedback received from businesses
bull SA received the highest proportion of complaints Closely followed by VIC
bull QLD was the jurisdiction where businesses gave the highest proportion of compliments
69
Source Customer Service Commission Customer Satisfaction Measurement Survey 2019 Report developed in conjunction with the NSW Customer Service CommissionerPublic I1-A2
41
23
36
handled poorly (1-4)2neutral (5-6)Handled well (7-10)
Consumersbull Most consumers who gave feedback
(39) gave a compliment
bull Complaints make up 33 of all feedback This is consistent with last year
bull Of consumers who complained 41 said their complaint was handled poorly However this is an improvement from last year where 54 had said their feedback was handled poorly
Businessesbull In contrast the proportion of feedback
from businesses that were complaints went up to 42 from 27 last year
bull Of this 44 said their feedback was handled poorly ndash up from 38 in the last year
23
35
42
39
28
33
bull I gave a compliment
bull I made a suggestion for change
bull I made a complaint
Consumer (n=519)
Business (n=194)
Figure 5455 Complaint handling of consumers and businessesQuestion ldquoHow well or poorly was your most recent complaint handledFigure 56 Proportion of feedback types for consumers and businessesQuestion ldquoWhat was the nature of your feedbackrdquo
Base n=169 consumers who made a complaint
Base n=83 businesses who made a complaint
Base n=519 consumers and n=194 businesses who ever
provided feedback
Figure 56 Figure 55Figure 54
Consumer Business
44
24
32
handled poorly (1-4)2neutral (5-6)Handled well (7-10)
COMPLAINT HANDLING EXPERIENCE41 of consumers and 44 of businesses said their complaints had been handled poorly
70
Source Customer Service Commission Customer Satisfaction Measurement Survey 2019 Report developed in conjunction with the NSW Customer Service CommissionerPublic I1-A2
Customers were asked ldquoHow well or poorly was your most recent complaint handledrdquo
Figure 57 Variation in complaints handling across jurisdictions
Consumer
Business
Consumersbull VIC had the highest proportion of positive
ratings from consumers in relation to complaints handling (44 rated 7-10 out of 10) SA was second with 36 of complaints being handled well
bull The average rating was neutral (52 out of 10) ndash an improvement of 08 points compared to last year (44 out of 10) This was second highest behind VIC
Businessesbull The average rating was just below neutral at
49 out of 10 However this is an improvement of 02 points compared to last year (47 out of 10)
bull Of the Australian jurisdictions SA has the lowest proportion of poorly handled complaints and the highest average rating
bull UK has the lowest proportion of poorly handled complaints and the highest average rating of 53 out of 10 of all jurisdictions
39 41 41 46 50 55
17 2325
23 23 17
44 36 34 30 28 28
5652
50
48 45 43
1
10
0
50
100
VIC(n=154)
SA(n=169)
UK(n=196)
NZ(n=138)
QLD(n=140)
NSW(n=314)
Handled poorly (1-4) Neutral (5-6) Handled well (7-10) Average
Axis
1
Perc
enta
ge o
f re
spon
ses
Axis 2 Average score
35 44 49 45 50 52
24 2415
3418 22
41 32 3621
32 26
53 49
49
48 46 45
1
10
0
50
100
UK(n=174)
SA(n=83)
QLD(n=72)
VIC(n=69)
NSW(n=184)
NZ(n=76)
Handled well (7-10) Neutral (5-6) Handled poorly (1-4) Average
Axis
1
Perc
enta
ge o
f re
spon
ses
Axis 2 Average score
Responses were provided according to a scale from 1 (handled very poorly) to 10 (handled very well)
Consumer Business
COMPARISON OF PERFORMANCE IN COMPLAINTS MANAGEMENT ACROSS JURISDICTIONSFor consumers SA had the second highest proportion of complaints being handled well behind VIC For businesses SA had the lowest proportion of poorly handled complaints compared to all jurisdictions
71
Source Customer Service Commission Customer Satisfaction Measurement Survey 2019 Report developed in conjunction with the NSW Customer Service CommissionerPublic I1-A2
Customers were asked ldquoHow well or poorly was your most recent complaint handledrdquo
Figure 58 Variation in complaints handling by region
Consumer
Business
bull In metro areas over 40 of both consumers and businesses rated their complaints as being handled poorly (1-4 out of 10)
bull Sample sizes for both consumers and businesses in rural and regional SA are too small to be statistically representative and cannot be evaluated meaningfully
4626 22
17 41
44
37 32 34
50 56
58
1
10
0
50
100
Metro(n=139)
Regional(n=14)
Rural(n=16)
Handled poorly (1-4) Neutral (5-6) Handled well (7-10) Average
Axis
1
Perc
enta
ge o
f re
spon
ses
Axis 2 Average score
45
100
29
28
57
47
11
66
1
10
0
50
100
Metro(n=67)
Regional(n=4)
Rural(n=12)
Handled well (7-10) Neutral (5-6) Handled poorly (1-4) Average
Axis
1
Perc
enta
ge o
f re
spon
ses
Axis 2 Average score
Responses were provided according to a scale from 1 (handled very poorly) to 10 (handled very well)Note interpret with caution when sample size is lower than n =30
Consumer Business
COMPARISON OF PERFORMANCE IN COMPLAINTS MANAGEMENT BY REGION46 of consumers and 45 of businesses in Metro areas say their complaints were handled poorly
72
Source Customer Service Commission Customer Satisfaction Measurement Survey 2019 Report developed in conjunction with the NSW Customer Service CommissionerPublic I1-A2
Customers were asked ldquoHow difficult or easy was it to make your complaintrdquoFigure 59 Variation in ease of making a complaint across jurisdictions
Consumer
Business
Consumersbull 51 of consumers who made a complaint said it was
easy to do so (7-10 out of 10) This is an improvement from 34 in 2018
bull The average rating was neutral (61 out of 10) This is an improvement of 08 points compared to last year (53 out of 10 in 2018)
bull VIC had the highest proportion of consumers saying it was easy to make a complaint (56) Whereas NSW was the jurisdiction with the lowest proportion of consumers saying so (47)
Businessesbull 46 of businesses in SA who made a complaint said it
was easy to do so (7-10 out of 10) This is an improvement from 37 in 2018
bull 36 rated it as difficult (1-4 out of 10) ndash this is 2 points higher than last year (34) and makes SA the jurisdiction with the second highest proportion of lsquodifficultrsquo ratings behind QLD
bull Improvement in the proportion of businesses rating the process as lsquoeasyrsquo has pushed the average rating to 55 out of 10 (vs 47 out of 10 last year) However SA continues to be the jurisdiction with the lowest rating as other jurisdictions have also seen an improvement in their average rating
26 28 29 31 31 33
18 21 18 19 23 26
5651 54 50
47 4065 61 61 59 58 56
1
10
0
50
100
VIC(n=159)
SA(n=174)
NZ(n=148)
UK(n=199)
NSW(n=333)
QLD(n=150)
Easy (7-10) Neutral (5-6) Difficult (1-4) Average
21 28 25 31 37 36
30 19 29 24 31 17
4953 46 45 33
4662 61 59 58 55 55
1
10
0
50
100
NZ(n=78)
UK(n=176)
VIC(n=70)
NSW(n=188)
QLD(n=74)
SA(n=83)
Easy (7-10) Neutral (5-6) Difficult (1-4) Average
Responses were provided according to a scale from 1 (very difficult) to 10 (very easy)
Axis 2 Average scoreAxis 2 Average score
Axis
1
Perc
enta
ge o
f re
spon
ses
Axis
1
Perc
enta
ge o
f re
spon
ses
Consumer Business
COMPARISON OF PERFORMANCE IN EASE OF MAKING A COMPLAINT ACROSS JURISDICTIONSIn SA 51 of consumers said it was easy to make a complaint 46 of businesses echoed the sentiment ndash an improvement from 37 last year
73
Source Customer Service Commission Customer Satisfaction Measurement Survey 2019 Report developed in conjunction with the NSW Customer Service CommissionerPublic I1-A2
10
1
1
1
1
1
1
1
2
2
2
3
3
3
3
4
5
5
5
6
8
8
12
13
Other (n=57)
State Emergency Services (n=4)
Agricultural Advice and Fundinghellip
Environment and Wildlifehellip
Business Advisory Services (n=2)
Prisons (n=4)
Fire Brigades (n=4)
Child Welfare Services (n=9)
Courts (n=10)
Art Galleries and Museumshellip
Documentation Services (n=9)
Consumer Affairs (Fair Trading)hellip
Ambulance Services (n=17)
TAFE Services (n=23)
Services for Older People (n=20)
Major Roads (n=26)
Public Housing (n=25)
Disability Services (n=29)
Police (n=27)
Public Schools (n=33)
Water Supply (n=45)
Vehicle Licensing andhellip
Public Transport (n=63)
Public Hospitals (n=81)
13
1
1
1
1
1
2
2
2
2
3
3
5
5
5
5
6
6
7
7
9
15
Other (n=26)
Art Galleries (n=1)
Prisons (n=2)
Business Adv Serv (n=2)
Environ Protectn (n=5)
Ambulance Services (n=3)
Agri Advice and Funding (n=2)
Courts (n=4)
Vehicle Licensing amp Reg (n=8)
Child Welfare Services (n=5)
Documentation Services (n=3)
Disability Services (n=10)
Police (n=14)
TAFE Services (n=14)
Serv for Older (n=7)
Major Roads (n=11)
Public Transport (n=16)
Public Housing (n=8)
Public Hospitals (n=16)
Public Schools (n=8)
Consumer Affairs (n=12)
Water Supply (n=25)
Consumersbull Similar to last year Public Hospitals Public
Transport and Vehicle Licensing and Registration accounted for 30 of the most recent complaints received
bull Public Hospitals saw an increase of 1 points and Public Transport saw an increase of 2 points versus last year
bull Complaints to Vehicle Licensing declined by 2 points
Businessesbull Water Supply continued to receive the most
complaints and showed an increase of 3 points versus last year
Note that sample sizes are low for these services and while results may not be statistically representative they indicate potential trends to be investigated more robustly
Figure 512 Volume of complaints across servicesCustomers that had made a complaint in the past were asked ldquoWhich SA Government Department or Agency did you most recently complain tordquo
respondents respondentsConsumer Business
Note interpret with caution when sample size is lower than n =30 All businesses results have been provided for indicative purposes only as the sample size for all services is lt30
Data unavailable as nlt10
Consumer Business
VARIATION IN COMPLAINTS ACROSS SA GOVERNMENT SERVICESPublic Hospitals receive the highest proportion of complaints from consumers and Water Supply receive the highest proportion ofcomplaints from businesses
74
Public ndash I1-A2
SOUTH AUSTRALIAN CUSTOMER SATISFACTION MEASUREMENT SURVEY 2019
The data in this chapter compares the perceptions of SA government services Where sample sizes for segments are low (lt30) data is provided for indicative purposes only
APPENDIX 1ANALYSIS BY SERVICE
Source Customer Service Commission Customer Satisfaction Measurement Survey 2019 Report developed in conjunction with the NSW Customer Service CommissionerPublic I1-A2
Consumer
91 9087 87
8076 76 75 74 74 73 73 73 73 73
70 68 66 65 63 63
54
45
10
20
30
40
50
60
70
80
90
100
0
25
50
75
100
Fire
Brig
ades
(n=2
4)
Stat
e Em
erge
ncy
Serv
ices
(n=4
7)
Ambu
lanc
e Se
rvic
es (n
=208
)
Art G
alle
ries
and
Mus
eum
s (n
=121
)
Vehi
cle
Lice
nsin
g an
d R
egis
tratio
n (n
=580
)
Publ
ic S
choo
ls (n
=228
)
Wat
er S
uppl
y (n
=240
)
Polic
e (n
=217
)
Publ
ic H
ospi
tals
(n=4
12)
Publ
ic T
rans
port
(n=3
90)
Con
sum
er A
ffairs
(n=3
8)
Doc
umen
tatio
n Se
rvic
es (n
=42)
Envi
ronm
ent a
nd W
ildlif
e Pr
otec
tion
(n=3
8)
Busi
ness
Adv
isor
y Se
rvic
es (n
=17
)
Serv
ices
for O
lder
Peo
ple
(n=1
14)
TAFE
Ser
vice
s (n
=126
)
Agric
ultu
ral A
dvic
e an
d Fu
ndin
g Se
rvic
es (n
=13
)
Dis
abilit
y Se
rvic
es (n
=100
)
Maj
or R
oads
(n=8
6)
Publ
ic H
ousi
ng (n
=87)
Cou
rts (n
=94)
Pris
ons
(n=2
3)
Chi
ld W
elfa
re S
ervi
ces
(n=5
2)
Dissatisfied (1-4) Neutral (5-6) Satisfied (7-10) Average
Axis
1
Perc
enta
ge o
f res
pons
es
Axis 2 Average Score
Figure 1 Variation in consumersrsquo satisfaction across SA Government Services
Customers were asked ldquoThinking about your experiences in the last 12 months how satisfied would you say you are with each of the following services in SArdquo
VARIATION IN CONSUMERSrsquo SATISFACTION ACROSS SERVICESAcross SA Government services consumersrsquo satisfaction is highest for Fire Brigades State Emergency Services Ambulance Services and Art Galleries and Museums
Average SA consumer satisfaction ndash 75 (n=3297)
Note Interpret with caution Very small number of responses (nlt=30) 76
Source Customer Service Commission Customer Satisfaction Measurement Survey 2019 Report developed in conjunction with the NSW Customer Service CommissionerPublic I1-A2
Consumer
Figure 2 Variation in customersrsquo expectation across SA Government Services
Customers were asked ldquoThinking about each of the following services in SA how would you rate your expectation of overall quality of servicerdquo
VARIATION IN CONSUMERSrsquo EXPECTATION ACROSS SERVICESConsumers have higher expectations of overall service quality from Fire Brigade State Emergency Services Ambulance Services and Art Galleries amp Museums This is consistent with the high satisfaction ratings these services have
93 91 90 88
8279 78 78 77 77 77 76 76 75 73 72 71 70 70 70 67 67
52
1
2
3
4
5
6
7
8
9
10
0
25
50
75
100
Fire
Brig
ades
(n=2
4)
Stat
e Em
erge
ncy
Serv
ices
(n=4
5)
Ambu
lanc
e Se
rvic
es (n
=205
)
Art G
alle
ries
and
Mus
eum
s (n
=121
)
Vehi
cle
Lice
nsin
g an
d R
egis
tratio
n (n
=574
)
Publ
ic S
choo
ls (n
=223
)
Polic
e (n
=216
)
Wat
er S
uppl
y (n
=234
)
Con
sum
er A
ffairs
(n=3
7)
Publ
ic H
ospi
tals
(n=4
08)
Serv
ices
for O
lder
Peo
ple
(n=1
13)
Doc
umen
tatio
n Se
rvic
es (n
=42)
Publ
ic T
rans
port
(n=3
83)
Envi
ronm
ent a
nd W
ildlif
e Pr
otec
tion
(n=3
7)
Busi
ness
Adv
isor
y Se
rvic
es (n
=17
)
TAFE
Ser
vice
s (n
=125
)
Maj
or R
oads
(n=8
1)
Cou
rts (n
=89)
Agric
ultu
ral A
dvic
e an
d Fu
ndin
g Se
rvic
es (n
=13
)
Dis
abilit
y Se
rvic
es (n
=96)
Pris
ons
(n=2
1)
Publ
ic H
ousi
ng (n
=86)
Chi
ld W
elfa
re S
ervi
ces
(n=5
1)
Low (1-4) Medium (5-6) High (7-10) Average
Axis
1
Perc
enta
ge o
f res
pons
es
Axis 2 Average Score
Average SA consumer expectation ndash 78 (n=3241)
Note Interpret with caution Very small number of responses (nlt=30) 77
Source Customer Service Commission Customer Satisfaction Measurement Survey 2019 Report developed in conjunction with the NSW Customer Service CommissionerPublic I1-A2
VARIATION IN CONSUMERSrsquo COMPARISON TO AN IDEAL SERVICE ACROSS SERVICESConsumers perceive State Emergency Services Fire Brigades Ambulance Services and Art Galleries and Museums to be performing closest to an ideal service This is consistent with findings relating to satisfaction and expectation
Figure 3 Consumersrsquo comparison to an ideal service across services
Customers are asked ldquoNow forgetting for a moment these specific services please imagine an ideal service How well do you think each service in SA compares with that ideal servicerdquo
9086 85 83
77 76 75 74 73 73 71 69 69 69 67 67 66 6459 59 57
54
44
1
2
3
4
5
6
7
8
9
10
0
25
50
75
100
Stat
e Em
erge
ncy
Serv
ices
(n=4
6)
Fire
Brig
ades
(n=2
3)
Ambu
lanc
e Se
rvic
es (n
=205
)
Art G
alle
ries
and
Mus
eum
s (n
=119
)
Vehi
cle
Lice
nsin
g an
d R
egis
tratio
n (n
=560
)
Busi
ness
Adv
isor
y Se
rvic
es (n
=17
)
Polic
e (n
=207
)
Doc
umen
tatio
n Se
rvic
es (n
=42)
Publ
ic S
choo
ls (n
=216
)
Agric
ultu
ral A
dvic
e an
d Fu
ndin
g Se
rvic
es (n
=12
)
Wat
er S
uppl
y (n
=226
)
Publ
ic T
rans
port
(n=3
80)
Publ
ic H
ospi
tals
(n=3
97)
TAFE
Ser
vice
s (n
=122
)
Con
sum
er A
ffairs
(n=3
6)
Serv
ices
for O
lder
Peo
ple
(n=1
09)
Envi
ronm
ent a
nd W
ildlif
e Pr
otec
tion
(n=3
7)
Dis
abilit
y Se
rvic
es (n
=96)
Cou
rts (n
=89)
Publ
ic H
ousi
ng (n
=82)
Maj
or R
oads
(n=8
1)
Pris
ons
(n=1
9)
Chi
ld W
elfa
re S
ervi
ces
(n=5
1)
Not close to ideal (1-4) Neutral (5-6) Very close to ideal (7-10) Average
Axis
1
Perc
enta
ge o
f res
pons
es
Axis 2 Average Score
Average SA consumer ideal ndash 72 (n=3172)
Consumer
Note Interpret with caution Very small number of responses (nlt=30) 78
Source Customer Service Commission Customer Satisfaction Measurement Survey 2019 Report developed in conjunction with the NSW Customer Service CommissionerPublic I1-A2
VARIATION IN CONSUMERSrsquo ldquoEXPECTATION GAPrdquo ACROSS SERVICESAcross all services consumers have a negative ldquoexpectation gaprdquo
-13
-07
-07
-07
-04
-04
-04
-03
-03
-03
-03
-03
-03
-03
-03
-02
-02
-02
-02
-02
-01
-01
00
-15 -1 -05 0 05 1 15
Prisons (n=21)
Courts (n=89)
Child Welfare Services (n=51)
Major Roads (n=81)
Services for Older People (n=113)
Consumer Affairs (n=37)
Public Housing (n=86)
Police (n=216)
Documentation Services (n=42)
Public Schools (n=223)
Ambulance Services (n=205)
Disability Services (n=96)
Public Hospitals (n=408)
Environment and Wildlife Protection (n=37)
TAFE Services (n=125)
Agricultural Advice and Funding Services (n=13)
Fire Brigades (n=24)
Water Supply (n=234)
Art Galleries and Museums (n=121)
Public Transport (n=383)
Vehicle Licensing and Registration (n=574)
Business Advisory Services (n=17)
State Emergency Services (n=45)
Figure 4 Consumer gap to expectation by servicesThe gap between satisfaction and expectation provides an understanding of how customers perceive their recent experience compares to expectationsThe gap to expectation is calculated individually for each customers as Gap = satisfaction score ndash expectation score
Consumer
Note Interpret with caution Very small number of responses (nlt=30)
79
Source Customer Service Commission Customer Satisfaction Measurement Survey 2019 Report developed in conjunction with the NSW Customer Service CommissionerPublic I1-A2
91 9187
82 80 80 7975 74 74 74 74 74 72 72 71 71 70 69 67 66
6155
1
2
3
4
5
6
7
8
9
10
0
25
50
75
100
Fire
Brig
ades
(n=1
5)
Ambu
lanc
e Se
rvic
es (n
=24
)
Stat
e Em
erge
ncy
Serv
ices
(n=1
3)
Art G
alle
ries
and
Mus
eum
s (n
=13
)
Doc
umen
tatio
n Se
rvic
es (n
=17
)
Polic
e (n
=35)
Pris
ons
(n=1
4)
Con
sum
er A
ffairs
(n=2
7)
Envi
ronm
ent a
nd W
ildlif
e Pr
otec
tion
(n=1
9)
Maj
or R
oads
(n=1
1)
Dis
abilit
y Se
rvic
es (n
=34)
Wat
er S
uppl
y (n
=67)
Cou
rts (n
=19
)
Publ
ic T
rans
port
(n=4
7)
Busi
ness
Adv
isor
y Se
rvic
es (n
=35)
Vehi
cle
Lice
nsin
g an
d R
egis
tratio
n (n
=135
)
Serv
ices
for O
lder
Peo
ple
(n=2
8)
Chi
ld W
elfa
re S
ervi
ces
(n=2
0)
Publ
ic H
ospi
tals
(n=7
6)
TAFE
Ser
vice
s (n
=36)
Publ
ic S
choo
ls (n
=51)
Agric
ultu
ral A
dvic
e an
d Fu
ndin
g Se
rvic
es (n
=10
)
Publ
ic H
ousi
ng (n
=16
)
Dissatisfied (1-4) Neutral (5-6) Satisfied (7-10) Average
Axis
1
Perc
enta
ge o
f res
pons
es
Axis 2 Average Score
Figure 5 Variation in businessesrsquo satisfaction across SA Government Services
Customers were asked ldquoThinking about your experiences in the last 12 months how satisfied would you say you are with each of the following services in SArdquo
Average SA business satisfaction ndash 73 (n=762)
VARIATION IN BUSINESSESrsquo SATISFACTION ACROSS SERVICES
Business
Note Interpret with caution Very small number of responses (nlt=30)
Of the services with sufficient sample size (ngt30) Police Disability Services and Water Supply have above average satisfaction scores
80
Source Customer Service Commission Customer Satisfaction Measurement Survey 2019 Report developed in conjunction with the NSW Customer Service CommissionerPublic I1-A2
Figure 6 Variation in businessesrsquo expectation across SA Government Services
Customers were asked ldquoThinking about each of the following services in SA how would you rate your expectation of overall quality of servicerdquo
VARIATION IN BUSINESSESrsquo EXPECTATION ACROSS SERVICESOf the services with sufficient (ngt30) sample sizes Police Disability Services Water Supply and Public Transport have above average expectation scores
91 90 8784 83 83 81 79 79 78 77 77 76 75 75 75 75 75 74 72 70 70 68
1
2
3
4
5
6
7
8
9
10
0
25
50
75
100
Fire
Brig
ades
(n=1
5)
Ambu
lanc
e Se
rvic
es (n
=24
)
Stat
e Em
erge
ncy
Serv
ices
(n=1
3)
Art G
alle
ries
and
Mus
eum
s (n
=13
)
Doc
umen
tatio
n Se
rvic
es (n
=17
)
Pris
ons
(n=1
3)
Polic
e (n
=35)
Dis
abilit
y Se
rvic
es (n
=33)
Cou
rts (n
=19
)
Envi
ronm
ent a
nd W
ildlif
e Pr
otec
tion
(n=1
9)
Con
sum
er A
ffairs
(n=2
7)
Wat
er S
uppl
y (n
=67)
Publ
ic T
rans
port
(n=4
7)
Vehi
cle
Lice
nsin
g an
d R
egis
tratio
n (n
=134
)
Serv
ices
for O
lder
Peo
ple
(n=2
8)
Busi
ness
Adv
isor
y Se
rvic
es (n
=35)
Maj
or R
oads
(n=1
1)
Chi
ld W
elfa
re S
ervi
ces
(n=2
0)
Agric
ultu
ral A
dvic
e an
d Fu
ndin
g Se
rvic
es (n
=10
)
Publ
ic H
ospi
tals
(n=7
5)
Publ
ic S
choo
ls (n
=51)
Publ
ic H
ousi
ng (n
=16
)
TAFE
Ser
vice
s (n
=36)
High (7-10) Medium (5-6) Low (1-4) Average
Axis
1
Perc
enta
ge o
f res
pons
esAxis 2 Average Score
Average SA business expectation ndash76 (n=758)
Business
Note Interpret with caution Very small number of responses (nlt=30)
81
Source Customer Service Commission Customer Satisfaction Measurement Survey 2019 Report developed in conjunction with the NSW Customer Service CommissionerPublic I1-A2
95
87 8580 80 78 78
75 73 73 73 71 71 70 70 70 69 69 6966 66 65
59
1
2
3
4
5
6
7
8
9
10
0
25
50
75
100
Fire
Brig
ades
(n=1
5)
Ambu
lanc
e Se
rvic
es (n
=23
)
Stat
e Em
erge
ncy
Serv
ices
(n=1
2)
Art G
alle
ries
and
Mus
eum
s (n
=13
)
Polic
e (n
=33)
Envi
ronm
ent a
nd W
ildlif
e Pr
otec
tion
(n=1
7)
Doc
umen
tatio
n Se
rvic
es (n
=17
)
Cou
rts (n
=18
)
Publ
ic T
rans
port
(n=4
5)
Pris
ons
(n=1
4)
Vehi
cle
Lice
nsin
g an
d R
egis
tratio
n (n
=132
)
Agric
ultu
ral A
dvic
e an
d Fu
ndin
g Se
rvic
es (n
=10
)
Busi
ness
Adv
isor
y Se
rvic
es (n
=34)
Wat
er S
uppl
y (n
=63)
TAFE
Ser
vice
s (n
=33)
Serv
ices
for O
lder
Peo
ple
(n=2
8)
Maj
or R
oads
(n=1
1)
Con
sum
er A
ffairs
(n=2
5)
Dis
abilit
y Se
rvic
es (n
=32)
Chi
ld W
elfa
re S
ervi
ces
(n=2
0)
Publ
ic H
ospi
tals
(n=7
3)
Publ
ic S
choo
ls (n
=48)
Publ
ic H
ousi
ng (n
=16
)
Not close to ideal (1-4) Neutral (5-6) Very close to ideal (7-10) Average
Figure 7 Businessesrsquo comparison to an ideal service across services
Customers are asked ldquoNow forgetting for a moment these specific services please imagine an ideal service How well do you think each service in SA compares with that ideal servicerdquo
VARIATION IN BUSINESSESrsquo COMPARISON TO AN IDEAL SERVICE ACROSS SERVICESOf the services with sufficient (ngt30) sample sizes Police Public Transport and Vehicle Licensing and Registration have above average scores of comparison to ideal service
Axis
1
Perc
enta
ge o
f res
pons
esAxis 2 Average Score
Average SA business ideal ndash 72 (n=732)
Business
Note Interpret with caution Very small number of responses (nlt=30)
82
Source Customer Service Commission Customer Satisfaction Measurement Survey 2019 Report developed in conjunction with the NSW Customer Service CommissionerPublic I1-A2
Figure 8 Business gap to expectation by servicesThe gap between satisfaction and expectation provides an understanding of how customers perceive their recent experience compares to expectations The gap to expectation is calculated individually for each customers as Gap = satisfaction score ndash expectation score
VARIATION IN BUSINESSESrsquo ldquoEXPECTATION GAPrdquo ACROSS SERVICES
-13-05
-05-05-05
-04-04-04
-03-03-03-03-03-03
-02-02
-01-01-01
0000
01
-15 -1 -05 0 05 1 15
Public Housing (n=16)Agricultural Advice and Funding Services (n=10)
Disability Services (n=33)Courts (n=19)
Child Welfare Services (n=20)Public Schools (n=51)
Services for Older People (n=28)Vehicle Licensing and Registration (n=134)
Environment and Wildlife Protection (n=19)Documentation Services (n=17)
Public Transport (n=47)Business Advisory Services (n=35)
Public Hospitals (n=75)Prisons (n=13)
Water Supply (n=67)Consumer Affairs (n=27)
Art Galleries and Museums (n=13)TAFE Services (n=36)
Major Roads (n=11)Police (n=35)
Fire Brigades (n=15)State Emergency Services (n=13)
Ambulance Services (n=24)
Business
Note Interpret with caution Very small number of responses (nlt=30)
Majority of services have a negative lsquoexpectation gaprsquo from businesses However the sample sizes are low and observations are only indicative
83
Source Customer Service Commission Customer Satisfaction Measurement Survey 2019 Report developed in conjunction with the NSW Customer Service CommissionerPublic I1-A2
Average score higherlower compared to overall SA average
VARIATION IN CONSUMERSrsquo VIEWS OF EMPLOYEE PERFROMANCE ACROSS SERVICES
Customers are asked ldquoThinking now about its employees to what extent do you agree or disagree that each of the following statements describes [a particular government service] in SArdquo
Figure 9 Performance of SA Government Services against each of the employee attributes
Responses were provided according to a scale from 1 (strongly disagree) to 10 (strongly agree) The average score against each attribute by service is tabulated Note this analysis represents consumer data only
Base Consumers (n=2727)
Note Very small number of responses (nlt=30)
Services
Honesty and Integrity of Employees Efficiency and Effectiveness Communication of Employees Fairness and Empathy of employees
Are honest
Deliver high safety standards
Provide good value
services
Are reliable
Get things done as quickly as
possible
Held Accountable
Explain intended
actions clearlyAre consistent
Engender confidence in
their knowledge
Communicate well
Provide services
without bias
See things from my perspective
Agricultural Advice and Funding Services 80 71 80 74 74 82 74 79 74 81 68 68
Ambulance Services 92 92 88 89 90 87 90 89 90 90 92 84Art Galleries and Museums 87 87 87 85 79 81 83 84 84 85 84 81Business Advisory Services 73 72 69 76 70 70 74 73 73 75 69 66Child Welfare Services 53 55 50 47 43 50 53 45 51 55 52 50Consumer Affairs 74 71 71 71 64 67 74 74 73 72 73 66Courts 71 72 64 67 59 60 73 64 72 74 71 60Disability Services 71 67 63 63 56 58 64 61 65 65 68 63Documentation Services 78 77 69 72 62 69 70 71 73 71 76 67Environment and Wildlife Protection 70 71 69 70 65 66 65 76 68 73 69 66Fire Brigades 93 96 95 94 93 90 88 89 93 92 91 85Major Roads 69 64 61 61 52 55 63 67 60 63 70 58Police 75 77 74 74 68 71 74 71 73 73 71 68Prisons 56 78 66 68 59 56 69 65 60 64 64 64Public Hospitals 79 78 78 75 70 73 77 74 77 75 78 71Public Housing 65 64 63 60 57 55 65 62 62 61 62 55Public Schools 76 75 73 72 69 70 73 70 72 73 70 69Public Transport 73 73 72 69 68 68 71 70 70 70 75 67Services for Older People 76 73 74 72 66 68 74 72 72 74 77 72State Emergency Services 92 94 92 93 90 91 90 92 90 90 92 87TAFE Services 73 73 72 68 64 71 69 69 71 70 74 67Vehicle Licensing and Registration 80 78 74 78 73 73 78 77 76 76 79 72Water Supply 74 74 69 71 65 67 71 73 73 72 76 69Overall average 77 76 74 74 69 70 75 73 74 74 76 70
Consumer
Note Interpret with caution Very small number of responses (nlt=30)
Ambulance Services Art Galleries and Museums State Emergency Services and Fire Brigades perform well against employee attributes
84
Source Customer Service Commission Customer Satisfaction Measurement Survey 2019 Report developed in conjunction with the NSW Customer Service CommissionerPublic I1-A2
Customers are asked ldquoThinking about the values that they uphold to what extent would you agree with each of the following statements when thinking about [a particular government service] in SArdquo
Figure 10 Performance of SA Government Services against values
Responses were provided according to a scale from 1 (strongly disagree) to 10 (strongly agree) The average score against each attribute by service is tabulated Note this analysis represents consumer data only
Services
Accountability and Service quality
Is a body I can trust Operates with integrity Is accountable for its services Provides good values services
Agricultural Advice and Funding Services 77 78 75 76
Ambulance Services 91 90 90 89
Art Galleries and Museums 85 85 84 86
Business Advisory Services 72 74 71 74
Child Welfare Services 41 48 46 45
Consumer Affairs 67 68 64 70
Courts 64 66 59 64
Disability Services 61 63 61 59
Documentation Services 71 72 69 70
Environment and Wildlife Protection 65 64 61 64
Fire Brigades 92 92 91 94
Major Roads 58 59 58 58
Police 73 73 70 73
Prisons 55 62 62 61
Public Hospitals 74 75 71 73
Public Housing 58 57 57 58
Public Schools 73 74 72 74
Public Transport 67 69 67 70
Services for Older People 68 71 66 69
State Emergency Services 92 92 90 92
TAFE Services 69 69 68 70
Vehicle Licensing and Registration 75 75 73 74
Water Supply 67 68 64 68
Overall average 72 73 70 72
Average score higherlower compared to overall SA average
Base Consumers (n=2936)
VARIATION IN CONSUMERSrsquo VIEWS OF PERFORMANCE AGAINST VALUES ACROSS SERVICESConsumer
Note Interpret with caution Very small number of responses (nlt=30)
Services that have high scores across headline measures (satisfaction expectation and ideal service) also perform well against values related attributes These services are Ambulance Services Art Galleries and Museums State Emergency Services and Fire Brigades
85
Source Customer Service Commission Customer Satisfaction Measurement Survey 2019 Report developed in conjunction with the NSW Customer Service CommissionerPublic I1-A2
Average score higherlower compared to overall SA average
Base Consumers (n=2617)Customers are asked ldquoThinking now about its processes) to what extent do you agree or disagree the followingstatements describes [a particular Government Service] in SArdquo
Figure 11 Performance of SA Government Services against process attributes
Responses were provided according to a scale from 1 (strongly disagree) to 10 (strongly agree) The average score against each attribute by service is tabulated Note this analysis represents consumer data only
Services
Simplicity and Efficiency of Processes Employee autonomy
Processes are easy to understand
Processes are designed to reduce wait times
I can get to the right person the first time
Services feel seamless across channels
Employees are empowered to make decisions
Agricultural Advice and Funding Services 61 73 73 67 68
Ambulance Services 86 81 84 83 87
Art Galleries and Museums 79 74 78 76 73
Business Advisory Services 70 67 71 64 72
Child Welfare Services 49 45 43 42 48
Consumer Affairs 71 59 60 62 63
Courts 61 50 58 55 62
Disability Services 55 53 52 52 56
Documentation Services 67 66 68 64 68
Environment and Wildlife Protection 61 60 58 56 60
Fire Brigades 86 87 86 88 83
Major Roads 55 50 50 49 51
Police 70 65 65 65 73
Prisons 53 50 57 57 57
Public Hospitals 67 56 60 63 68
Public Housing 62 50 56 56 54
Public Schools 69 64 66 66 67
Public Transport 70 65 66 66 66
Services for Older People 65 59 61 62 63
State Emergency Services 86 87 85 84 83
TAFE Services 66 62 63 65 66
Vehicle Licensing and Registration 74 65 69 68 69
Water Supply 67 61 63 64 64
Overall Average 70 63 65 65 68
VARIATION IN CONSUMERSrsquo VIEWS OF PERFORMANCE AGAINST PROCESS ATTRIBUTES ACROSS SERVICES
Consumer
Note Interpret with caution Very small number of responses (nlt=30)
Services that have high scores across headline measures (satisfaction expectation and ideal service) also perform well against process attributes These services are Ambulance Services Art Galleries and Museums State Emergency Services and Fire Brigades
86
Source Customer Service Commission Customer Satisfaction Measurement Survey 2019 Report developed in conjunction with the NSW Customer Service CommissionerPublic I1-A2
Average score higherlower compared to overall SA average
Customers are asked ldquoThinking about the services they provide overall how would rate [a particular government service] in SA on the followingrdquoFigure 12 Performance of SA Government Services against goals
Base Consumers (n=2582)
Responses were provided according to a scale from 1 (strongly disagree) to 10 (strongly agree) The average score against each attribute by service is tabulated Note this analysis represents consumer data only
Services
Transparency Access to information Privacy
Demonstrate openness and transparency in decision
making
Encourage public participation in decision
making
Is making it easier to access information about their
services
Is making best use of online services to improve efficiency
for customers
Safeguard privacy and confidentiality
Agricultural Advice and Funding Services 74 71 73 75 78
Ambulance Services 83 77 84 80 89
Art Galleries and Museums 78 76 80 79 80
Business Advisory Services 71 68 70 65 72
Child Welfare Services 44 37 49 43 58
Consumer Affairs 64 56 66 67 74
Courts 61 49 64 57 70
Disability Services 56 54 57 59 69
Documentation Services 71 62 70 69 78
Environment and Wildlife Protection 60 56 69 60 71
Fire Brigades 82 80 85 82 90
Major Roads 56 53 56 58 68
Police 65 58 68 63 76
Prisons 54 49 56 49 64
Public Housing 69 61 68 63 76
Public Hospitals 54 50 54 52 69
Public Schools 67 66 71 68 73
Public Transport 64 61 71 71 71
Services for Older People 65 60 66 65 77
State Emergency Services 86 81 85 78 88
TAFE Services 67 64 69 69 74
Vehicle Licensing and Registration 69 58 73 74 78
Water Supply 64 57 69 67 71
Overall Average 67 61 70 68 75
VARIATION IN CONSUMERSrsquo VIEWS OF PERFORMANCE AGAINST GOALS ACROSS SERVICES
Consumer
Note Interpret with caution Very small number of responses (nlt=30)
Services that have high scores across headline measures (satisfaction expectation and ideal service) also perform well against goals attributes These services are Ambulance Services Art Galleries and Museums State Emergency Services and Fire Brigades
87
Source Customer Service Commission Customer Satisfaction Measurement Survey 2019 Report developed in conjunction with the NSW Customer Service CommissionerPublic I1-A2
Average score higherlower compared to overall SA average
VARIATION IN BUSINESSESrsquo VIEWS OF EMPLOYEE PERFROMANCE ACROSS SERVICES
Customers are asked ldquoThinking now about its employees to what extent do you agree or disagree that each of the following statements describes [a particular government service] in SArdquo
Figure 9 Performance of SA Government Services against each of the employee attributes
Responses were provided according to a scale from 1 (strongly disagree) to 10 (strongly agree) The average score against each attribute by service is tabulated Note this analysis represents consumer data only
Base Businesses (n=657)
Services
Honesty and Integrity of Employees Efficiency and Effectiveness Empathy and Communication of Employees Fairness
Are honest
Deliver high
safety standards
Provide good value
services
Are reliable
Communicate well
Are consistent
Engender confidence in
their knowledge
Explain intended actions clearly
Get things done as quickly as
possible
Held Accountable
See things from my perspective
Provide services
without bias
Agricultural Advice and Funding Services 59 52 53 56 52 53 54 53 45 53 46 50Ambulance Services 91 92 92 93 90 91 92 93 94 91 87 92Art Galleries and Museums 83 74 88 85 86 78 83 85 69 83 79 79Business Advisory Services 71 73 71 70 70 71 69 71 66 62 66 70Child Welfare Services 71 71 62 54 59 50 62 70 55 56 55 76Consumer Affairs 72 73 65 71 73 66 71 70 61 66 65 71Courts 76 68 63 68 70 74 66 75 63 53 61 73Disability Services 80 77 76 73 73 74 75 70 69 74 66 75Documentation Services 90 80 79 72 79 81 80 79 67 74 75 80Environment and Wildlife Protection 80 77 78 76 77 76 78 78 78 70 68 71Fire Brigades 85 99 89 85 85 99 93 83 96 96 88 99Major Roads 79 79 70 70 70 64 69 55 74 60 73 78Police 78 83 76 76 76 79 80 77 68 77 71 81Prisons 74 76 72 74 77 75 74 74 75 91 73 77Public Hospitals 70 69 68 68 67 67 65 69 64 61 64 70Public Housing 85 78 81 68 82 86 84 79 68 84 76 79Public Schools 70 71 65 65 65 62 66 66 58 66 64 64Public Transport 76 70 70 65 70 71 67 69 76 62 71 68Services for Older People 76 75 73 72 74 69 73 69 70 72 68 72State Emergency Services 83 86 85 83 81 80 80 82 79 82 86 89TAFE Services 69 64 67 66 63 66 59 64 61 64 61 63Vehicle Licensing and Registration 75 75 69 72 72 71 72 74 69 66 67 74Water Supply 66 75 67 69 70 70 74 71 62 66 61 74Overall Average 75 75 71 71 72 71 72 72 68 69 68 73
Note Interpret with caution Very small number of responses (nlt=30)
Business
Due to low sample sizes for most of the services data is to be viewed as indicative only
88
Source Customer Service Commission Customer Satisfaction Measurement Survey 2019 Report developed in conjunction with the NSW Customer Service CommissionerPublic I1-A2
Customers are asked ldquoThinking about the values that they uphold to what extent would you agree with each of the following statements when thinking about [a particular government service] in SArdquo
Figure 10 Performance of SA Government Services against values
Responses were provided according to a scale from 1 (strongly disagree) to 10 (strongly agree) The average score against each attribute by service is tabulated Note this analysis represents consumer data only
Services
Accountability and Service quality
Is a body I can trust Operates with integrity Is accountable for its services Provides good values services
Agricultural Advice and Funding Services 46 47 54 57
Ambulance Services 96 91 92 93
Art Galleries and Museums 89 89 93 91
Business Advisory Services 67 71 60 63
Child Welfare Services 65 71 66 59
Consumer Affairs 69 68 65 64
Courts 72 78 63 71
Disability Services 70 72 70 70
Documentation Services 80 80 76 82
Environment and Wildlife Protection 73 75 73 71
Fire Brigades 94 94 94 94
Major Roads 69 64 78 68
Police 80 79 78 82
Prisons 69 69 72 71
Public Hospitals 64 65 65 68
Public Housing 66 73 70 70
Public Schools 66 64 68 61
Public Transport 69 70 71 67
Services for Older People 74 76 73 76
State Emergency Services 87 89 86 85
TAFE Services 61 65 60 67
Vehicle Licensing and Registration 72 73 68 71
Water Supply 62 65 61 66
Overall Average 71 72 70 71
Average score higherlower compared to overall SA average
Base Businesses (n=702)
VARIATION IN BUSINESSESrsquo VIEWS OF PERFORMANCE AGAINST VALUES ACROSS SERVICES
Note Interpret with caution Very small number of responses (nlt=30)
Business
Due to low sample sizes for most of the services data is to be viewed as indicative only
89
Source Customer Service Commission Customer Satisfaction Measurement Survey 2019 Report developed in conjunction with the NSW Customer Service CommissionerPublic I1-A2
Average score higherlower compared to overall SA average
Base Businesses (n=661)Customers are asked ldquoThinking now about its processes to what extent do you agree or disagree the following statements describes [a particular GovernmentService] in SArdquo
Figure 11 Performance of SA Government Services against process attributes
Responses were provided according to a scale from 1 (strongly disagree) to 10 (strongly agree) The average score against each attribute by service is tabulated Note this analysis represents consumer data only
Services
Simplicity and Efficiency of Processes Responsiveness
Processes are easy to understand
Processes are designed to reduce wait times
I can get to the right person the first time
Services feel seamless across channels
Employees are empowered to make
decisions
Agricultural Advice and Funding Services 42 40 46 41 61
Ambulance Services 88 86 88 84 89
Art Galleries and Museums 86 84 77 74 70
Business Advisory Services 64 56 59 60 63
Child Welfare Services 66 51 51 51 45
Consumer Affairs 68 60 67 62 64
Courts 58 46 55 54 74
Disability Services 62 50 66 66 65
Documentation Services 72 69 63 80 75
Environment and Wildlife Protection 68 66 64 68 62
Fire Brigades 93 85 84 93 98
Major Roads 59 69 73 64 78
Police 69 64 69 63 76
Prisons 72 70 72 62 71
Public Hospitals 65 52 58 58 59
Public Housing 71 62 71 64 48
Public Schools 64 66 68 69 64
Public Transport 66 66 63 64 66
Services for Older People 67 59 68 67 68
State Emergency Services 84 82 72 80 84
TAFE Services 64 55 60 65 56
Vehicle Licensing and Registration 70 62 65 65 64
Water Supply 65 60 62 63 62
Overall Average 68 61 65 65 66
VARIATION IN BUSINESSESrsquo VIEWS OF PERFORMANCE AGAINST PROCESS ATTRIBUTES ACROSS SERVICES
Note Interpret with caution Very small number of responses (nlt=30)
Business
Due to low sample sizes for most of the services data is to be viewed as indicative only
90
Source Customer Service Commission Customer Satisfaction Measurement Survey 2019 Report developed in conjunction with the NSW Customer Service CommissionerPublic I1-A2
Average score higherlower compared to overall SA average
Customers are asked ldquoThinking about the services they provide overall how would rate [a particular government service] in SA on the followingrdquoFigure 12 Performance of SA Government Services against goals
Base Businesses (n=641)
Responses were provided according to a scale from 1 (strongly disagree) to 10 (strongly agree) The average score against each attribute by service is tabulated Note this analysis represents consumer data only
Services
Transparency Access to information Privacy
Demonstrate openness and transparency in decision
making
Encourage public participation in decision
making
Is making it easier to access information about their
services
Is making best use of online services to improve efficiency
for customers
Safeguard privacy and confidentiality
Agricultural Advice and Funding Services 48 51 43 51 59
Ambulance Services 92 78 89 69 94
Art Galleries and Museums 81 77 75 83 84
Business Advisory Services 64 61 66 69 71
Child Welfare Services 65 52 61 50 81
Consumer Affairs 65 54 67 69 69
Courts 59 44 69 63 83
Disability Services 69 69 62 73 81
Documentation Services 79 69 85 87 87
Environment and Wildlife Protection 69 71 77 74 67
Fire Brigades 98 95 78 54 97
Major Roads 59 69 74 78 74
Police 66 70 77 70 81
Prisons 71 55 54 55 74
Public Hospitals 64 59 61 61 71
Public Housing 75 66 76 73 72
Public Schools 65 70 64 67 69
Public Transport 70 66 71 69 67
Services for Older People 67 73 74 75 73
State Emergency Services 84 82 85 82 84
TAFE Services 58 61 65 60 62
Vehicle Licensing and Registration 66 58 70 71 75
Water Supply 62 55 65 66 70
Overall Average 67 63 69 68 74
VARIATION IN BUSINESSESrsquo VIEWS OF PERFORMANCE AGAINST GOALS ACROSS SERVICES
Note Interpret with caution Very small number of responses (nlt=30)
Business
Due to low sample sizes for most of the services data is to be viewed as indicative only
91
Public ndash I1-A2
SOUTH AUSTRALIAN CUSTOMER SATISFACTION MEASUREMENT SURVEY 2019
The data in this chapter is for informative purposes to compare the perceptions of SA government services Where sample sizes for segments are low (lt30) data is provided for indicative purposes only
APPENDIX 2CONTACT METHOD PREFERENCE BY SERVICE
Source Customer Service Commission Customer Satisfaction Measurement Survey 2019 Report developed in conjunction with the NSW Customer Service CommissionerPublic I1-A2
CONTACT METHODS PREFERRED TO INTERACT WITH SA GOVERNMENT SERVICESConsumers have different contact preferences for different types of services Agricultural Advice and Funding Services Vehicle Licensing andRegistration Documentation Services Major Roads and Public Transport and Water Supply are the top 6 services where online is the preferredcontact method Agricultural Advice and Funding Services Major Roads and Consumer Affairs have see the biggest growth in online preferenceversus last year
Consumer
Figure 13 Breakdown of most preferred contact methods across services
Note Each respondent could select any number of contact methodsBase 2019 Consumers (n=3170) 2018 Consumers (n=3152)
Note Interpret with caution Very small number of responses (nlt=30) Legend top 5 services for each contact method
2018 2019 2018 2019 2018 2019Agricultural Advice and Funding Services 37 46 14 17 0 0Vehicle Licensing and Registration 47 43 27 27 7 8Documentation Services 40 38 26 17 14 10Major Roads 21 29 29 19 20 19Public Transport 31 27 42 35 12 17Water Supply 20 27 9 4 46 37Consumer Affairs 15 26 7 13 44 26Business Advisory Services 21 22 27 21 31 15Environment and Wildlife Protection 37 21 8 27 19 19TAFE Services 18 20 29 21 16 17Art Galleries and Museums 17 18 44 60 12 6Child Welfare Services 13 14 37 19 28 43Ambulance Services 10 13 25 23 53 45Prisons 6 11 37 40 54 27Courts 8 11 52 44 19 23Services for Older People 13 11 33 28 40 46Police 6 10 53 47 25 30Public Schools 8 9 47 42 18 20Disability Services 5 9 39 32 37 37Fire Brigades 8 8 73 44 19 29Public Housing 11 7 27 39 44 39State Emergency Services 23 6 16 31 34 39Public Hospitals 5 6 58 53 23 29
ServicesOnline
In person face-to-face
Telephone (landline or mobile phone calls text message)
93
+9 pts
+8 pts
+11 pts
Source Customer Service Commission Customer Satisfaction Measurement Survey 2019 Report developed in conjunction with the NSW Customer Service CommissionerPublic I1-A2
Note Each respondent could select one preferred contact method
CONTACT METHODS PREFERRED TO USE TO INTERACT WITH SA GOVERNMENT SERVICES
Figure 14 Breakdown of most commonly preferred contact methods across services
Base 2019 Business (n=743) 2018 Business (n=795)
Preference for online has decreased for those who interacted with Vehicle Licensing and Registration with an increase inpreference for face to face Public Transport has also seen a decline in preference for online with preference moving to face toface as well as telephone
Business
Note Interpret with caution Very small number of responses (nlt=30)
2018 2019 2018 2019 2018 2019Documentation Services 41 52 0 23 7 0Major Roads 18 49 36 48 1 1Vehicle Licensing and Registration 52 33 20 36 4 9Consumer Affairs 13 30 13 6 46 23Public Transport 54 24 23 29 9 18Agricultural Advice and Funding Services 19 21 47 1 0 30Water Supply 22 20 14 3 37 27Services for Older People 10 20 23 24 30 34Business Advisory Services 29 19 15 19 23 26Disability Services 20 13 12 28 38 34Environment and Wildlife Protection 12 12 11 13 11 9Ambulance Services 14 12 41 13 44 50Police 6 7 50 56 34 29TAFE Services 4 6 31 23 41 18Public Schools 0 4 49 45 22 26Public Hospitals 5 3 53 54 11 21Fire Brigades 0 0 2 2 23 78Art Galleries and Museums 29 0 29 17 0 41State Emergency Services 0 0 0 58 79 14Child Welfare Services 12 0 33 24 33 38Courts 10 0 40 61 10 9Public Housing 18 0 34 83 14 15Prisons 0 0 27 34 46 34
ServicesOnline In person face-to-face Telephone (landline or mobile phone calls
text message)
Legend top 5 services for each contact method
94
-30 pts
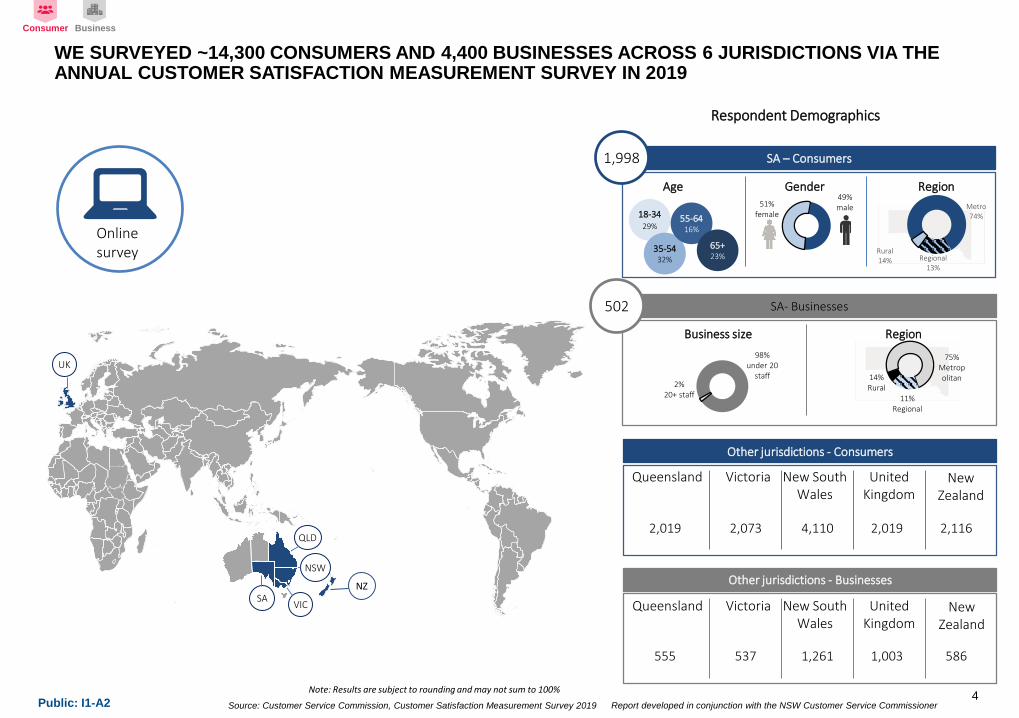
Source Customer Service Commission Customer Satisfaction Measurement Survey 2019 Report developed in conjunction with the NSW Customer Service CommissionerPublic I1-A2
Metro74
Regional13
Rural14
QLD
VIC
NSW
SA
Online survey
Other jurisdictions - Consumers
Queensland Victoria New South Wales
United Kingdom
New Zealand
Other jurisdictions - Businesses
Queensland Victoria New South Wales
United Kingdom
New Zealand
SA ndash Consumers
SA- Businesses
Age Gender Region
Business size Region
1998
502
49 male51
female18-3429
35-5432
55-6416
65+23
98 under 20
staff2
20+ staff
75 Metropolitan
11 Regional
14 Rural
2019 2073 4110 2019 2116
555 537 1261 1003 586
WE SURVEYED ~14300 CONSUMERS AND 4400 BUSINESSES ACROSS 6 JURISDICTIONS VIA THE ANNUAL CUSTOMER SATISFACTION MEASUREMENT SURVEY IN 2019
UK
Respondent Demographics
Note Results are subject to rounding and may not sum to 100
Consumer Business
NZ
4
Source Customer Service Commission Customer Satisfaction Measurement Survey 2019 Report developed in conjunction with the NSW Customer Service CommissionerPublic I1-A2
75 78
03
Satisfaction ExpectationGap
Expectation
Consumer satisfaction has remained stable versus last year Consumer expectations have increased slightly however not a statistically significant change
(00)
The SA consumer CSI is at 788 for 2019 and has been statistically stable since 2016
Consumersrsquo perceptions of the SA Public Services lsquobrandrsquo have remained stable in 2019 ranking second after airlines However satisfaction with the SA Public Service lsquobrandrsquo remains lower than customersrsquo satisfaction with SA Government services overall
Lowest
Highest
Avg
sat
isfac
tion
(con
sum
ers)
Airlines 71
SA Public Service 66
Telcorsquos 61
Local Council60
Banks59
Energy54
Fed Govt53
76(2017)
Nine drivers of consumer satisfaction are identified in 2019 Whereas lsquoCommunication and Empathyrsquo was a single driver last year this year lsquoFairness and Empathyrsquo is a unique driver of moderate importance separate to lsquoCommunicationrsquo which is of high importance
Efficiency and effectiveness of employees
Communication
Honesty and integrity of employees
Employee autonomy
Simplicity and efficiency of processes
Transparency
Privacy
Access to information and online services
High
High
High
Moderate
Moderate
Low
Low
Low
Drivers and relative importance
Performance of SA Government Services against baseline measures Customer Satisfaction Index (CSI) results
Drivers of satisfaction
75(2018)
+02
Perceptions of the SA Public Sector lsquobrandrsquo
SA Government Services
(avg satisfaction)
(+01)
75(2019)
Fairness and Empathy
Moderate
EXECUTIVE SUMMARY CONSUMER SATISFACTION WITH SA GOVERNMENT SERVICES HAS BEEN MAINTAINED IN 2019
Legend Statistically significant increase in avg from 2018 (at 99 level of Confidence)No significant change in avg from 2018 (at 99 level of Confidence)Statistically significant decrease in avg from 2018 (at 99 level of Confidence)
-01
Consumer CSI
Consumer
776
785784
788
77
78
79
2016 2017 2018 2019
74(2016)
00
Employee attributes Goals ProcessesKey
Groupings of drivers of satisfaction are based on analyses of NSW Government services however it is assumed that drivers of satisfaction are relatively consistent across jurisdictions and generally across service industries broadly
5
Source Customer Service Commission Customer Satisfaction Measurement Survey 2019 Report developed in conjunction with the NSW Customer Service CommissionerPublic I1-A2
Business satisfaction and expectation have remained stable since 2016
The SA business CSI is 780 for 2019 and has been statistically stable since 2016
Business perceptions of the SA Public Services lsquobrandrsquo have remained stable in 2019 ranking between Airlines andTelcos However satisfaction with the SA Public Service lsquobrandrsquo remains lower than customersrsquo satisfaction with SA Government services overall
Lowest
Highest
Avg
sat
isfac
tion
(con
sum
ers)
Airlines 70
SA Public Service 66
Telcorsquos62
Banks61
Local Council61
Fed Govt 57
Energy56
71(2017)
+02
Performance of SA Government services against baseline measures Customer Satisfaction Index (CSI) results
72(2018)
Perceptions of the SA Public Sector lsquobrandrsquo
SA Government services
(avg satisfaction)
73(2019)
EXECUTIVE SUMMARY BUSINESS SATISFACTION WITH SA GOVERNMENT SERVICES HAS BEEN MAINTAINED IN 2019
7376
03
Satisfaction ExpectationGap
Expectation
(+01)(+01)
+01
Business CSI
Business
741
754759
780
74
75
76
77
78
79
2016 2017 2018 2019
Contact Methods Used by Businesses
51
4135
29
128
4740
29 27
156
Inperson
Phone Online Email Mail fax Thirdparties
2018 Business (n=814)2019 Business (n=762)
Similar to last year lsquoIn personrsquo lsquophonersquo and lsquoonlinersquo continue to be the top 3 methods used by businesses to interact with the SA Government
70(2016)
+01
Legend Statistically significant increase in avg from 2018 (at 99 level of Confidence)No significant change in avg from 2018 (at 99 level of Confidence)Statistically significant decrease in avg from 2018 (at 99 level of Confidence)
6
Public ndash I1-A2
SOUTH AUSTRALIAN CUSTOMER SATISFACTION MEASUREMENT SURVEY 2019
ii KEY FINDINGS IN 2019
Source Customer Service Commission Customer Satisfaction Measurement Survey 2019 Report developed in conjunction with the NSW Customer Service CommissionerPublic I1-A2
SUMMARY OF KEY FINDINGS IN 2019
Theme Key Finding EvidenceOverall Measures and Topline Analysis
Average scores for all three headline measures (satisfaction expectation ideal score) have remained stableover last year and seen steady growth since 2016
bull Consumer satisfaction has remained stable at 75 out of 10 and expectation has increased slightly to 78 out of 10
bull The expectation gap is 03 points
Compared to 2016 all headline measures have seen a steady increase in average scores
bull Comparison to ideal service has increased significantly in 2019 by 04 points to 72 out of 10
bull The expectation gap has remained stable versus 2018 at 03 pointsbull The proportion of businesses in the lowest bracket (rated 1-4 out of 10) has been declining
since 2016 across all three performance indicators and continues to do so in 2019
Performance Against Customer Satisfaction Attributes
SA Government Services perform well against Employee attributes which have been identified as important drivers of customer satisfaction
The opportunity lies in improving process efficiencies to reduce the overall time taken by consumers and businesses to complete their task or interaction
bull For consumers SA Government services have an average score of 74 out of 10 across all employee attributes
bull lsquoProcesses are easy to understandrsquo rates higher than other process attributes The opportunity areas lie in making processes more efficient as lsquoGetting things done as quickly as possiblersquo and processes lsquoAre designed to reduce wait timesrsquo are two attributes where SA has the lowest ratings among all jurisdictions
bull lsquoPublic participation in decision makingrsquo is one of the lowest performing attributes across all jurisdictions for consumers However businesses in SA have rated this attribute significantly higher than last year ndash an increase of 04 points to 63 out of 10 vs 2019
Consumer
Business
BusinessConsumer
8
Source Customer Service Commission Customer Satisfaction Measurement Survey 2019 Report developed in conjunction with the NSW Customer Service CommissionerPublic I1-A2
SUMMARY OF KEY FINDINGS IN 2019
Theme Key Finding EvidenceSatisfaction by Contact Method and DigitalInsights
Usage and satisfaction with the overall experience of using websites appshas remained stable among consumers Overall satisfaction is highest amongst consumers who use online channels
While smartphones are the most commonly used device to access services online there is an opportunity to improve the smartphone experience of consumers
bull Of all jurisdictions SA has the second highest usage of online methods of contact among consumers behind NSW
bull Users of Online channels have the highest average satisfaction scores compared to all other channels They also rate the SA Government services highest on all process attributes
bull While half of all consumers have used smartphones to access services online satisfaction with the overall experience with using website apps is lowest for smartphone users Tablet users form the smallest proportion but have the highest satisfaction
There is significant improvement in satisfaction with the overall online experience among businesses compared to 2018
While usage of in-person as a contact method is declining it continues to remain important to businesses The opportunity area is to find the right balance between online and face to face contact methods
bull The proportion of businesses choosing to go online increased by 7 points in 2019 and these businesses also saw a 09 point increase in satisfaction which is high at 80 out of 10
bull There was a significant increase in satisfaction with the overall experience of using website app to complete a task ndash an increase of 08 points to 78 out of 10 versus last year
bull While smartphone usage was low compared to desktop and laptop businesses that used smartphones showed highest satisfaction along with desktop users
bull Businesses that used in-person channels had the highest satisfaction alongside online users Businesses using in-person methods also rate SA Government services highest on all process attributes
bull Preference for in-person in SA is the highest of all jurisdictions however usage has seen a steady decline since 2017
Consumer
Business
9
Source Customer Service Commission Customer Satisfaction Measurement Survey 2019 Report developed in conjunction with the NSW Customer Service CommissionerPublic I1-A2
Theme Key Finding Evidence
Public Sector Overall The SA Public Services lsquobrandrsquo is viewed positively by both consumers and businesses
Experiences with SA Government services outperforms overall SA Public Service perceptions
bull The perception of SA Public Service overall has remained stable and is ahead of all other industries with the exception of airlines for both consumers and businesses
bull In line with other Australian jurisdictions SA Public Service lsquobrandrsquo performs better relative to other industries than the Public Service lsquobrandrsquo in NZ and UK
bull Satisfaction with government services is higher than satisfaction with the SA Public Service lsquobrandrsquo suggesting factors other than service delivery experiences are impacting brand perception
bull SA Public Service is described more positively than negatively with lsquohelpfulrsquo lsquofriendlyrsquo lsquocapablersquo lsquoknowledgeablersquo and lsquorespectfulrsquo being the top five descriptors by both consumers and businesses
bull In contrast to last year businesses have described SA Public Services more positively this year with an increase in proportion of businesses selecting positive descriptors and decrease in proportion of businesses selecting negative descriptors
Topline by Demographics Consumer satisfaction in regional areas has increased significantly and the expectation gap is almost zero
bull For consumers all three headline measures have seen a significant increase in regional areas
bull Expectation has increased by 04 points to 81 out of 10 and satisfaction has increased by 06 points to 80 out of 10 This indicates that SA Government Services in regional areas are very close to meeting consumers expectations
Consumer Business
SUMMARY OF KEY FINDINGS IN 2019
10
Consumer
Source Customer Service Commission Customer Satisfaction Measurement Survey 2019 Report developed in conjunction with the NSW Customer Service CommissionerPublic I1-A2
Theme Key Finding Evidence
Feedback Overall the proportion of consumers and businesses giving feedback remains low
Consumers are more likely to give compliments and businesses are more likely to make a complaint
bull 30 of consumers and 39 of businesses gave some form of feedback in 2019bull 39 of all feedback received from consumers was a compliment Compliments are
related to employee interactions for consumers and businesses compliment about the information available to them
bull 42 of all feedback received from businesses was a complaint Compared to other jurisdictions SA received the highest proportion of all feedback as complaints from businesses but had the lowest proportion of poor handling of complaints within Australian jurisdictions
bull Processes are the main source of complaints for both consumers and businesses
A higher proportion of both consumers and businesses found it easier to make complaints this year versus last year
For both consumers and businesses ease of making a complaint does not always translate into a positive complaint handling experience There is an opportunity to streamline the complaints resolution process to ensure the experience is positive for consumers and businesses through the entire process
Good complaint handling is associated with higher than average satisfaction for both consumers and business
bull 51 of consumers found it easy to make a complaint (7-10 out of 10) versus 34 last year
bull 46 of businesses found it easy to make a complaint (7-10 out of 10) versus 37 last year
bull While there was improvement in the ease of making a complaint only 36 of consumers said their complaint had been handled well (7-10 out of 10)
bull Similarly for businesses only 32 said their complaint had been handled well (7-10 out of 10)
bull Consumers who had a good complaint handling experience had a satisfaction score of 80 out of 10 which is higher than the average consumer satisfaction score of 75 out of 10
bull Businesses gave a rating of 7-10 out of 10 for complaint handling had a satisfaction score of 81 out of 10 which is higher than the average business satisfaction score of 73 out of 10
Consumer Business
SUMMARY OF KEY FINDINGS IN 2019
11
Consumer Business
Please note that customers may have rated different services on Satisfaction and Complaint Handling and the correlation is to be treated as indicative only
Source Customer Service Commission Customer Satisfaction Measurement Survey 2019 Report developed in conjunction with the NSW Customer Service CommissionerPublic I1-A2
KEY FINDING 1 (CONSUMER) Overall Measures and Topline AnalysisAverage scores for all three headline measures (satisfaction expectation ideal score) have remained stable over last year and seen steady growth since 2016
7578
Satisfaction Expectation Gap Expectation
Figure 2 2019 Consumer satisfaction expectation and expectation gap
bull In 2019 consumer satisfaction with SA Government services has been maintained at 75 and consumer expectation has increased slightly to 78
bull The expectation gap is -03
+01-
Consumer
-03
Legend Statistically significant increase in avg from 2018 (at 99 level of Confidence)No significant change in avg from 2018 (at 99 level of Confidence)Statistically significant decrease in avg from 2018 (at 99 level of Confidence)
12
77
78
77
78
2016
2017
2018
2019
74
76
75
75
2016
2017
2018
2019
70
71
71
72
2016
2017
2018
2019
-01 -01 +01
+01 -+02
+01 - +01
Expectation Satisfaction Ideal Service
Figure 1 2019 Average scores for headline measures 2016 ndash 2019 - Consumers
Source Customer Service Commission Customer Satisfaction Measurement Survey 2019 Report developed in conjunction with the NSW Customer Service CommissionerPublic I1-A2
KEY FINDING 1 (BUSINESS) Overall Measures and Topline AnalysisCompared to 2016 all headline measures have seen a steady increase in average scores
bull Both satisfaction and expectation of businesses with SA Government have increased by 01 points in 2019 versus last year
bull As with consumers the expectation gap is -03
+01-
Business
Legend Statistically significant increase in avg from 2018 (at 99 level of Confidence)No significant change in avg from 2018 (at 99 level of Confidence)Statistically significant decrease in avg from 2018 (at 99 level of Confidence)
13
Expectation Satisfaction Ideal Service
Figure 3 2019 Average scores for headline measures 2016 ndash 2019 - Business
73
74
75
76
2016
2017
2018
2019
+01
+01
+01
70
71
72
73
2016
2017
2018
2019
+02
+01
+01
67
69
68
72
2016
2017
2018
2019
+02
-01
+04
+01 +01
7376
Satisfaction Expectation Gap Expectation
Figure 4 2018 Business satisfaction expectation and expectation gap
Aver
age
scor
e (o
ut o
f 10 )
-03
Source Customer Service Commission Customer Satisfaction Measurement Survey 2019 Report developed in conjunction with the NSW Customer Service CommissionerPublic I1-A2
Satisfaction Drivers Average score across respondents (out of 10 on scale of according to a scale from 1 strongly disagree to 10 strongly agree)
Employees1)Honesty amp integrity of employees2)Efficiency and effectiveness of employees3)Communication4) Fairness and Empathy
Average across attributes
Process1)Simplicity and efficiency of processes2)Employee autonomy
Average across attributes
73
This year (YoY change not significant)
Range of historicValues(2016-19)
Legend77
79
71
Significant increase
Significant decrease
Last year
72
73
73
74
2016
2017
2018
2019
76 76 76 75 74 74 74 74 7371
69
77 76 76 75 74 74 74 74 7370 70 70
69
60
65
70
75
80
Are
hone
st
Deliv
er h
igh
safe
tyst
anda
rds
Prov
ide
serv
ices
with
out b
ias
Expl
ain
inte
nded
actio
ns c
lear
ly
Enge
nder
con
fiden
cein
thei
r kno
wle
dge
Com
mun
icat
e w
ell
Prov
ide
good
val
uese
rvic
es
Are
relia
ble
Are
cons
iste
nt
Are
held
acc
ount
able
See
thin
gs fr
om m
ype
rspe
ctiv
e
Get
thin
gs d
one
asqu
ickl
y as
pos
sibl
e
66
65
66
66
2016
2017
2018
201969
6765 63
7068
6563
66
6560
65
70
75
80
Proc
esse
s ar
e ea
sy to
unde
rsta
nd
Empl
oyee
s ar
eem
pow
ered
to m
ake
deci
sions
I can
get
to th
e rig
htpe
rson
the
first
tim
e
Serv
ice
feel
s se
amle
ssev
en if
I ha
ve to
com
mun
icat
e ac
ross
diffe
rent
cha
nnel
s(i
e o
nlin
e p
hone
em
ail)
Are
desi
gned
tore
duce
wai
t tim
es
Consumer
KEY FINDING 2 (CONSUMER) Performance Against Customer Satisfaction AttributesWith an average score of 74 out of 10 for consumers SA Government Services perform well against employee attributes which havebeen identified as important drivers of customer satisfaction The opportunity area lies in improving process efficiencies to reduce the overall time taken by consumers to complete their task or interaction
Figure 5 Employee and Process attribute scores ndash Consumers
14
Source Customer Service Commission Customer Satisfaction Measurement Survey 2019 Report developed in conjunction with the NSW Customer Service CommissionerPublic I1-A2
Satisfaction Drivers Average score across respondents (out of 10 on scale of according to a scale from 1 strongly disagree to 10 strongly agree)
Goals 1)Privacy2)Transparency3)Access to info
Average across attributes
Values1)Service Quality2)Accountability
Average across attributes
67
66
68
68
2016
2017
2018
2019
74
69 68 67
7570 68 67
62
6155
60
65
70
75
80
Safe
guar
d pr
ivac
y an
dco
nfid
entia
lity
Is m
akin
g it
easi
er to
acce
ss in
form
atio
nab
out t
heir
serv
ices
Is m
akin
g be
st u
se o
fon
line
serv
ices
toim
prov
e co
nven
ienc
ean
d ef
ficie
ncy
for
cust
omer
s
Dem
onst
rate
open
ness
and
tran
spar
ency
inde
cisio
n-m
akin
g
Enco
urag
e pu
blic
part
icip
atio
n in
deci
sion-
mak
ing
70
71
72
72
2016
2017
2018
201973 72 72
70
73 72 7270
60
65
70
75
80
Ope
rate
s w
ithin
tegr
ity
Prov
ides
goo
dse
rvic
e
Is a
bod
y I c
an tr
ust
Is a
ccou
ntab
le fo
r its
serv
ices
73
This year (YoY change not significant)
Range of historicValues(2016-19)
Legend77
79
71
Significant increase
Significant decrease
Last year
Consumer
KEY FINDING 2 (CONSUMER) Performance Against Customer Satisfaction AttributesFor consumers lsquoPublic participation in decision makingrsquo is one of the lowest performing attributes and this is also the case the attribute scores are compared across all jurisdictions
Figure 6 Goals and Values attribute scores - Consumers
15
Source Customer Service Commission Customer Satisfaction Measurement Survey 2019 Report developed in conjunction with the NSW Customer Service CommissionerPublic I1-A2
Satisfaction Drivers Average score across respondents (out of 10 on scale of according to a scale from 1 strongly disagree to 10 strongly agree)
Employees1)Honesty amp integrity of employees2)Efficiency and effectiveness of employees3)Communication4) Fairness and Empathy
Average across attributes
Process1)Simplicity and efficiency of processes2)Responsiveness
Average across attributes
7374
71 71 71 71 7070 71
6767 67
75 7573 72 72 72 71 71 71
69 68 68
60
65
70
75
Are
hone
st
Deliv
er h
igh
safe
tyst
anda
rds
Prov
ide
serv
ices
with
out b
ias
Expl
ain
inte
nded
actio
ns c
lear
ly
Enge
nder
con
fiden
cein
thei
r kno
wle
dge
Com
mun
icat
e w
ell
Are
cons
iste
nt
Prov
ide
good
val
uese
rvic
es
Are
relia
ble
Are
held
acc
ount
able
Get
thin
gs d
one
asqu
ickl
y as
pos
sibl
e
See
thin
gs fr
om m
ype
rspe
ctiv
e
68
71
70
71
2016
2017
2018
2019
61
64
65
65
2016
2017
2018
2019 67 64 64 62
6865 65
6167
66
55
60
65
70
75
80
Proc
esse
s ar
e ea
sy to
unde
rsta
nd
Empl
oyee
s ar
eem
pow
ered
to m
ake
deci
sions
Serv
ice
feel
s se
amle
ssev
en if
I ha
ve to
com
mun
icat
e ac
ross
diffe
rent
cha
nnel
s (i
eon
line
pho
ne e
mai
l)
I can
get
to th
e rig
htpe
rson
the
first
tim
e
Are
desi
gned
tore
duce
wai
t tim
es
73
This year (YoY change not significant)
Range of historicValues(2016-19)
Legend77
79
71
Significant increase
Significant decrease
Last year
Business
Figure 7 Employee and Process attribute scores ndash Businesses
16
KEY FINDING 2 (BUSINESS) Performance Against Customer Satisfaction AttributesSA Government Services perform well against employee attributes which have been identified as important drivers of business satisfaction The opportunity lies in improving process efficiencies to reduce the overall time taken to complete a task or interaction
Source Customer Service Commission Customer Satisfaction Measurement Survey 2019 Report developed in conjunction with the NSW Customer Service CommissionerPublic I1-A2
Satisfaction Drivers Average score across respondents (out of 10 on scale of according to a scale from 1 strongly disagree to 10 strongly agree)
Goals 1)Privacy2)Transparency3)Access to info
Average across attributes
Values 1)Service Quality2)Accountability
Average across attributes
63
66
65
68
2016
2017
2018
2019
71
66 65 6559
7469 68 67
6363
50
55
60
65
70
75
80
Safe
guar
d pr
ivac
y an
dco
nfid
entia
lity
Is m
akin
g it
easi
er to
acce
ss in
form
atio
nab
out t
heir
serv
ices
Is m
akin
g be
st u
se o
fon
line
serv
ices
toim
prov
e co
nven
ienc
ean
d ef
ficie
ncy
for
cust
omer
s
Dem
onst
rate
ope
nnes
san
d tr
ansp
aren
cy in
deci
sion-
mak
ing
Enco
urag
e pu
blic
part
icip
atio
n in
deci
sion-
mak
ing
66
69
70
71
2016
2017
2018
201971 70 70
68
72 71 71 70
60
65
70
75
80
Ope
rate
s w
ith in
tegr
ity
Prov
ides
goo
d se
rvic
e
Is a
bod
y I c
an tr
ust
Is a
ccou
ntab
le fo
r its
serv
ices
73
This year (YoY change not significant)
Range of historicValues(2016-19)
Legend77
79
71
Significant increase
Significant decrease
Last year
Business
KEY FINDING 2 (BUSINESS) Performance Against Customer Satisfaction AttributesBusiness perception of lsquoPublic participation in decision makingrsquo has seen a significant increase of 04 points to 63 out of 10 this year
Figure 8 Goals and Values attribute scores - Businesses
17
Source Customer Service Commission Customer Satisfaction Measurement Survey 2019 Report developed in conjunction with the NSW Customer Service CommissionerPublic I1-A2
KEY FINDING 3 (CONSUMER) Satisfaction by Contact Method and Digital InsightsUsage and satisfaction with the overall experience with using websites apps has remained stable among consumers Overall satisfaction is highest amongst consumers who use online channels
Note ndash Percentages do not add up to 100 due to exclusion of Donrsquot Know from the analysis
bull 26 of consumers used online channels as a method of contact
bull Consumers who used online methods had the highest average overall satisfaction score of 77 out of 10
bull Satisfaction with the overall experience of using online services (via website app) was also high at 79 out of 10
57
3325
139
6
58
3426
1610
5
In person Phone Online Email Mail fax Thirdparties
2018 Consumer (n=3307) 2019 Consumer (n=3297)
cus
tom
ers
who
hav
e ha
d di
rect
de
alin
gs v
ia th
is c
hann
el
Figure 9 2018 and 2019 channel usage -Consumers
Consumer
Figure 10 2018 and 2019 overall satisfaction by channel usage - Consumers
7675
73 72 7270
7775
74 7371
70
50
60
70
80
Online In person Thirdparties
Phone Mailfax Email
2018 Consumer (n=3307) 2019 Consumer (n=3297)
Aver
age
satis
fact
ion
scor
e (1
-10) +01
+01+01 +01
--
Legend Statistically significant increase in avg from 2018 (at 99 level of Confidence)No significant change in avg from 2018 (at 99 level of Confidence)Statistically significant decrease in avg from 2018 (at 99 level of Confidence)
Customers were asked ldquoThinking about your experiences interacting with SA services online in the last 12 months to what extent do you agree or disagree with each of the following statementsrdquo
Figure 11 Satisfaction with attributes of online services
82 81 81 80 79 79 79 78
102030405060708090100
0102030405060708090
100
The content wascurrent and accurate
I achieved the outcomeby using servicesavailable online
I trust my informationwas handled securely
through thewebsiteapp
The format of contentmet my accessrequirements
I was satisfied with theoverall experience ofusing the websiteappto complete the task
The websiteapp wasuseful and allowed me
to do everything Ineeded to do
Content and supportprovided online was
sufficient to answer myquestions
I found the websiteapp simple and it waseasy to find what I was
looking for
Disagree (1-4) Neutral (5-6) Agree (7-10) Average
Axis 2 Average Score
Consumer (n=798)
Axis
1
Perc
enta
ge o
f re
spon
ses
+01 +01 +01 +02+01 +01 +02NA
18
Source Customer Service Commission Customer Satisfaction Measurement Survey 2019 Report developed in conjunction with the NSW Customer Service CommissionerPublic I1-A2
KEY FINDING 3 (CONSUMER) Satisfaction by Contact Method and Digital InsightsWhile smartphones are the most used device to access services online there is an opportunity to improve the smartphone experience of consumers
Note ndash Percentages do not add up to 100 due to exclusion of Donrsquot Know from the analysis
Consumer
Legend Statistically significant increase in avg from 2018 (at 99 level of Confidence)No significant change in avg from 2018 (at 99 level of Confidence)Statistically significant decrease in avg from 2018 (at 99 level of Confidence)
19
50 4640
17
31
52 53
10
Smartphone Laptop computer Desktop computer TabletiPad
Consumer (n=843)Business (n=220)
Customers were asked ldquoWhat devices did you use to access the online content Please select all contact methods that applyrdquo
Figure 12 Devices used when dealing with SA Government services online
Figure 13 Satisfaction with online services by device used Customers were asked ldquoHow satisfied were you with the overall experience of using the websiteapp to complete the taskrdquo
re
spon
dent
s
77
79 798080
74
80
76
Smartphone Laptop computer Desktop computer TabletiPad
Consumer (n=822)Business (n=218)
Aver
age
satis
fact
ion
(out
of 1
0)
bull While most consumers (50) used smartphones to access online content their satisfaction levels with their experience was lower (77 out of 10) compared to those who used desktops or laptops to access online content (79 out of 10)
bull Few consumers are using tabletsiPad (17) but those that do have high levels of satisfaction (8 out of 10)
Source Customer Service Commission Customer Satisfaction Measurement Survey 2019 Report developed in conjunction with the NSW Customer Service CommissionerPublic I1-A2
51
4135
29
128
4740
29 27
15
6
In person Phone Online Email Mail fax Thirdparties
2018 Business (n=814) 2019 Business (n=762)
c
usto
mer
s w
ho h
ave
had
dire
ct
deal
ings
via
this
cha
nnel
KEY FINDING 3 (BUSINESS) Satisfaction by Contact Method and Digital InsightsThere is significant improvement in satisfaction with the overall online experience among businesses
Figure 14 2018 and 2019 channel usage -Businessbull There was an increase in the
overall satisfaction score among businesses who used online channels
bull There was a significant increase of 08 points in satisfaction with the overall online experience
bull The proportion of businesses who chose to go online increased by 7 points compared to last year
Business
75
70 71 7169
68
73 7372 72 71
67
60
70
80
In person Online Mailfax Phone Email Thirdparties
2018 Business(n=814) 2019 Business(n=762)
Aver
age
satis
fact
ion
scor
e (1
-10)
Figure 15 2018 and 2019 overall satisfaction by channel usage - Businesses
-02+01 +01
+03+02
-01
Legend Statistically significant increase in avg from 2018 (at 99 level of Confidence)No significant change in avg from 2018 (at 99 level of Confidence)Statistically significant decrease in avg from 2018 (at 99 level of Confidence)
Customers were asked ldquoThinking about your experiences interacting with SA services online in the last 12 months to what extent do you agree or disagree with each of the following statementsrdquo
Figure 17 Satisfaction with attributes of online services
79 79 78 78 78 78 78 75
102030405060708090100
0
20
40
60
80
100
I trust myinformation washandled securely
through thewebsiteapp
I achieved theoutcome by usingservices available
online
The content wascurrent and
accurate
The format ofcontent met my
accessrequirements
I was satisfied withthe overall
experience ofusing the
websiteapp tocomplete the task
The websiteappwas useful and
allowed me to doeverything I
needed to do
Content andsupport provided
online wassufficient toanswer myquestions
I found thewebsite app
simple and it waseasy to find what I
was looking for
Disagree (1-4) Neutral (5-6) Agree (7-10) Average
Business (n=210)
Axis 2 Average Score
+05 NA +04 +09 +08 +06 +06+09
74
224 I chose to go
online
I was directedor promotedto go online
There was noother optionavailable
Customers were asked ldquoDid you choose to go online or were you directed to go onlinerdquo
Figure 16 Choice to go online
uarr7
darr2 darr5
20
Source Customer Service Commission Customer Satisfaction Measurement Survey 2019 Report developed in conjunction with the NSW Customer Service CommissionerPublic I1-A2
2922 22 22
2 4
3224 23
16
3 2
In person Email Phone Online Mailfax Third parties
2018 Business(n=795) 2019 Business(n=743)
51
4135
29
128
47
40
29 27
15
6
In person Phone Online Email Mail fax Third parties
2018 Business (n=814) 2019 Business (n=762)
c
usto
mer
s w
ho h
ave
had
dire
ct
deal
ings
via
this
cha
nnel
Figure 18 2018 and 2019 channel usage - Business
Figure 19 2018 and 2019 most preferred channel - Business
Note ndash Percentages do not add up to 100 due to exclusion of Donrsquot Know from the analysis
bull While lsquoin personrsquo remains the most used channel for contact there is a continued decline in usage since 2017 (52 in 2017 51 in 2018 47 in 2019) though not statistically significant
bull Despite the year on year declines lsquoin personrsquo continues to be the most preferred channel and there has been a year on year growth in preference since 2017 (27 in 2017 29 in 2018 32 in 2019)
Business
KEY FINDING 3 (BUSINESS) Satisfaction by Contact Method and Digital InsightsWhile usage is declining in-person as a method of contact continues to remain important to businesses The opportunity area is to find the right balance between online and face to face contact methods
21
c
usto
mer
s
Source Customer Service Commission Customer Satisfaction Measurement Survey 2019 Report developed in conjunction with the NSW Customer Service CommissionerPublic I1-A2
7166
61 60 5954 53
7066 62 61 61
56 57
Airlines Public Serviceoverall
TelephoneService
Providers
My localcouncil
Banks EnergyRetailers
FederalGovernment
Consumer (n=1649) Business (n=457)
02
Avg
sat
isfa
ctio
n (o
ut o
f 10)
LowestHighest
KEY FINDING 4 Public Sector OverallThe SA public services lsquobrandrsquo is viewed positively by both consumers and businesses however service experience outperforms brand score
0102
0203
0302
01 02
Figure 20 Satisfaction with SA Public Service
bull Both consumers and businesses rate SA Public Services higher than most other industries or public service agencies with the exception of Airlines
bull Both consumers and businesses rate satisfaction with SA Government Services as being higher than the satisfaction with the lsquobrandrsquo SA Public Service This suggests factors other than service delivery experiences are impacting brand perception
Consumer Business
10 05 0406 05
Legend Statistically significant increase in avg from 2018 (at 99 level of Confidence)No significant change in avg from 2018 (at 99 level of Confidence)Statistically significant decrease in avg from 2018 (at 99 level of Confidence)
7375 00 +01SA Government Services
Average satisfaction
Consumer Business
22
Source Customer Service Commission Customer Satisfaction Measurement Survey 2019 Report developed in conjunction with the NSW Customer Service CommissionerPublic I1-A2
KEY FINDING 4 Public Sector OverallIn comparison to other jurisdictions as well the SA Public Service lsquobrandrsquo is rated higher than most other industries by consumers and businesses
bull In line with other Australian jurisdictions SA Public Service lsquobrandrsquo performs better relative to other industries (banks) than Public Service lsquobrandrsquo in NZ and UK
Consumer Business
Lowest
Highest
Avg
sat
isfa
ctio
n (b
usin
esse
s)NZ
NZ Govt Service 68
Banks 69
Energy 66
Local council 58
Airlines 74
Telcorsquos 65
NSW
Airlines 71
NSW Public Service 69
Banks 60
Energy 57
Telcorsquos 60
Local council 61
Fed Govt 60
QLD
Airlines 71
QLD Public Service 67
Telcorsquos 61
Local council 61
Banks 57
Energy 57
Fed Govt 58
VIC
Airlines 71
VIC Public Service 65
Banks 58
Energy 57
Local council 59
Fed Govt 57
Telcorsquos 60
SA
Airlines 70
Telcorsquos 62
SA Public Service 66
Banks 61
Energy 56
Local council 61
Fed Govt 57
UK
Airlines 70
Telcorsquos 66
Energy 63
UK Public Service 68
Local Council 61
Banks 68
Business
Figure 21 Comparison of Public service brand perceptions across jurisdictionsCustomers were asked ldquoThinking about all your experiences with each of the following [jurisdiction] industries and public services over the previous 12 months how satisfied would you say you are with them rdquoConsumer
NZ
NZ Govt Service 69
Banks 69
Airlines 74
Telcorsquos 66
Energy 66
Local council 59
NSW NSW
Public Service 71
Airline 71
Telcorsquos 62
Energy 59
Local council 62
Banks 61
Fed Govt 57
QLD
Airlines 70
QLD Public Service 69
VIC SA
Airlines 71
Telcorsquos 61
SA Public Service 66
Local council 60
Banks 59
Energy 54
Fed Govt 53
UK
Airlines 71
UK Public Service 69
Banks 69
Energy 64
Telcorsquos 69
Local council 61
Lowest
Highest
Avg
sat
isfa
ctio
n (c
onsu
mer
s)
Airlines 71
Telcorsquos 63
VIC Public Service 70
Banks 63
Local council 62
Energy 60
Fed Govt 59
Telcorsquos 62
Local council 62
Banks 60
Energy 59
Fed Govt 58
23
Source Customer Service Commission Customer Satisfaction Measurement Survey 2019 Report developed in conjunction with the NSW Customer Service CommissionerPublic I1-A2
06
KEY FINDING 5 (CONSUMER) Top-Line results by DemographicsConsumer satisfaction in regional areas has increased significantly and the expectation gap is almost zero
Average satisfaction among consumers in regional areas has increased significantly by 06 points to 8 out of 10 The expectation score is 81 making the expectation gap just 008
How would you rate your expectation of the overall quality of service
Thinking about your experiences in the last 12 months how satisfied would you say you are with
each of the following services
10
10
106
6
8
13
11
14
81
83
78
80
81
77
Rural(n=349)
Regional(n=332)
Metro(n=2560)
Low (1-4) Neutral (5-6) High (7-10)
Satisfaction Expectation Ideal service
Please imagine an ideal service How well do you think each service compares to that ideal service
-042
-008
-027
-045 -025 -005
Rural (n=349)
Regional (n=332)
Metro (n=2560)
Expectation gap (satisfaction ndash expectation)
10
10
10
respondents Avg respondents Avg
10
10
10
respondents Avg
12
9
14
20
15
19
68
76
68
73
77
71
Rural(n=341)
Regional(n=327)
Metro(n=2504)
Not close to ideal (1-4)Neutral (5-6)Close to ideal (7-10)
Note Expectation gap scores displayed in graph are subject to rounding
9
7
10
15
12
16
75
81
73
75
80
75
Rural(n=353)
Regional(n=337)
Metro(n=2607)
Dissatisfied (1-4)Neutral (5-6)Satisfied (7-10)
Figure 22 Satisfaction expectation and ideal service by region - Consumer
Base Consumers(n=3297)
Base Consumers(n=3241)
Base Consumers(n=3172)
Base Consumers(n=3241)
-
-01
-
+04
+01
-
+06
-
Consumer
Legend Statistically significant increase in avg from 2018 (at 99 level of Confidence)No significant change in avg from 2018 (at 99 level of Confidence)Statistically significant decrease in avg from 2018 (at 99 level of Confidence)
24
Source Customer Service Commission Customer Satisfaction Measurement Survey 2019 Report developed in conjunction with the NSW Customer Service CommissionerPublic I1-A2
7765
727779
6975
81
never givenfeedback
I made acomplaint
I made asuggestionfor change
I gave acompliment
Satisfaction Expectation
7668 69 71
7971 74 75
never givenfeedback
I made acomplaint
I made asuggestion for
change
I gave acompliment
KEY FINDING 6 FeedbackOverall the proportion of consumers and businesses giving feedback remains low Consumers are more likely to give compliments and businesses are more likely to make a complaint
Consumer Business
bull Majority of consumers or businesses did not give any form of feedback
bull 39 of consumers who gave feedback gave a compliment
bull Whereas 42 of businesses who gave feedback made a complaint
bull Consumers and businesses who gave a compliment had a higher satisfaction score compared to those who complained or made a suggestion
Figure 23 Feedback typeQuestion ldquoWhen was the last time you provided feedback to a SA Government Agency or Department about their services processes or employeesrdquoQuestion ldquoWhat was the nature of the feedbackrdquo
Figure 24 Satisfaction and expectation of feedback type Consumer (n=858) Business (n=294)
3070
Consumer n=1998
3961
Business n=502
bull I gave a complimentbull I made a suggestion
for changebull I made a complaint
Business (n=194)
Consumer (n=519)
Given feedbackNever given feedback Donrsquot know
Given feedback
39
42 35
33
23
28
bull I gave a complimentbull I made a suggestion
for changebull I made a complaint
25
Source Customer Service Commission Customer Satisfaction Measurement Survey 2019 Report developed in conjunction with the NSW Customer Service CommissionerPublic I1-A2
Figure 25 Consumer Variation in ease of making a complaint across jurisdictions
KEY FINDING 6 FeedbackA higher proportion of both consumers and businesses found it easier to make complaints this year versus last year
Consumer Business
26
Customers were asked ldquoHow difficult or easy was it to make your complaintrdquo
40 28
26
21
34 51
5361
1
10
0
50
100
2018 2019
Easy (7-10) Neutral (5-6) Difficult (1-4) Average
Axis 2 Average scoreAxis
1
Perc
enta
ge o
f re
spon
sesConsumers
bull 51 of consumers found it easy (7-10 out of 10) to make a complaint versus 34 last year
bull There was a significant increase of 08 points in the average score for consumers (61 out of 10 vs 53 out of 10 last year)
Businessesbull 46 of businesses found it easy (7-10 out of 10)
to make a complaint An improvement of 9 points versus last year
bull The average score remained relatively stable at 55 out of 10
Figure 26 Business Variation in ease of making a complaint across jurisdictionsCustomers were asked ldquoHow difficult or easy was it to make your complaintrdquo
34 36
29 17
3746
57 55
1
10
0
50
100
2018 2019
Easy (7-10) Neutral (5-6) Difficult (1-4) Average
Axis 2 Average scoreAxis
1
Perc
enta
ge o
f re
spon
ses
+08
Source Customer Service Commission Customer Satisfaction Measurement Survey 2019 Report developed in conjunction with the NSW Customer Service CommissionerPublic I1-A2
KEY FINDING 6 FeedbackThere is an opportunity to streamline the complaints resolution process to ensure the experience is positive for consumers and businesses right from making a complaint all the way up to getting a resolution
Consumer Business
27
Customers were asked ldquoHow difficult or easy was it to make your complaintrdquoFigure 28 Variation in ease of making a complaint across jurisdictions
28 36
2117
51 46
6155
1
10
0
50
100
Consumer Business
Easy (7-10) Neutral (5-6) Difficult (1-4) Average
Axis 2 Average scoreAxis
1
Perc
enta
ge o
f re
spon
ses
Customers were asked ldquoHow well or poorly was your most recent complaint handledrdquo
Figure 29 Variation in complaints handling across jurisdictions
41 44
23 24
3632
52 49
1
10
0
50
100
Consumers Business
Handled poorly (1-4) Neutral (5-6) Handled well (7-10) Average
Axis
1
Perc
enta
ge o
f re
spon
ses
Axis 2 Average score
For both consumers and businesses ease of making a complaint does not always translate into a positive experience with the complaint handling process
bull While 51 of consumers found it easy (7-10 out of 10) to make a complaint only 36 of consumers said their complaint had been handled well (7-10 out of 10)
bull Similarly while 46 of businesses found it easy to make a complaint (7-10 out of 10) only 32 said their complaint had been handled well (7-10 out of 10)
Source Customer Service Commission Customer Satisfaction Measurement Survey 2019 Report developed in conjunction with the NSW Customer Service CommissionerPublic I1-A2
Consumersbull The overall satisfaction scores for consumers who had a
good complaint handling experience was higher than the average consumer satisfaction score (80 out of 10 vs 75 out of 10)
bull Consumers who had a good complaint handling experience had higher overall satisfaction (80 out of 10) compared to consumers who had a poor experience (53 out of 10)
Businessesbull Businesses who had a good complaint handling
experience had a higher satisfaction score compared to the average satisfaction score (81 out of 10 vs 73 out of 10)
bull As with consumers businesses who had a positive experience had higher overall satisfaction (81 out of 10) compared to those who had a poor experience (63 out of 10)
Consumer Business
28
80 81
60
71
53
63
75 73
Consumers Business
Handled Well (7-10) Neutral (5-6) Handled Poorly (1-4) Average Satisfaction
Figure 27 Overall satisfaction with government services by ease of making complaints
Aver
age
Satis
fact
ion
Scor
e
KEY FINDING 6 FeedbackGood complaint handling is associated with a higher than average satisfaction with SA Government Services for consumers and businesses
Please note that customers may have rated different services on Satisfaction and Ease of Complaint and the correlation is to be treated as indicative only
Public ndash I1-A2
SOUTH AUSTRALIAN CUSTOMER SATISFACTION MEASUREMENT SURVEY 2019
iii DETAILED FINDINGS
Public ndash I1-A2
SOUTH AUSTRALIAN CUSTOMER SATISFACTION MEASUREMENT SURVEY 2019
1 OVERALL MEASURES TOPLINE ANALYSIS
Source Customer Service Commission Customer Satisfaction Measurement Survey 2019 Report developed in conjunction with the NSW Customer Service CommissionerPublic I1-A2
Outcome Measures Avg responses
ExpectationHow would you rate your expectation of the overall quality of service
SatisfactionThinking about your experiences in the last 12 months how satisfied would you say you are with each of the following services in SA
Ideal servicehellipPlease imagine an ideal service How well do you think each service in SA compares to that ideal service
CONSUMER OVERALL PERFORMANCEConsumer satisfaction with SA Government services has remained stable in 2019
Note Results are subject to rounding
Consumer expectations have remained stable versus last year with an average rating of 79 out of 10
Consumer satisfaction with SA Government services has remained stable at 75 out of 10
Comparison to ideal service has seen no significant change in 2019 and sits at 72 out of 10
Figure 11 2016 2017 2018 and 2019 overall performance - Consumers
Consumer
77
78
77
78
2016
2017
2018
2019
74
76
75
75
2016
2017
2018
2019
70
71
71
72
2016
2017
2018
2019
9
7
7
7
14
14
15
14
77
79
78
79
2016(n=3462)
2017(n=3433)
2018(n=3245)
2019(n=3241)
Low (1-4) Med (5-6) High (7-10)
10
9
10
10
17
16
17
16
73
75
74
75
2016(n=3507)
2017(n=3482)
2018(n=3307)
2019(n=3297)
Dissatisfied (1-4) Neutral (5-6) Satisfied (7-10)
14
13
12
13
20
20
20
18
66
66
68
69
2016(n=3398)
2017(n=3375)
2018(n=3154)
2019(n=3172)
Not close to ideal (1-4) Neutral (5-6) Close to ideal (7-10)
-01
-01
+01
+01
-
+02
+01
-
+01
Legend Statistically significant increase in avg from 2018 (at 99 level of Confidence)No statistical significant change in avg from 2018 (at 99 level of Confidence)Statistically significant decrease in avg from 2018 (at 99 level of Confidence)
31
Source Customer Service Commission Customer Satisfaction Measurement Survey 2019 Report developed in conjunction with the NSW Customer Service CommissionerPublic I1-A2
For businesses expectations have seen no significant change with an average rating of 76 out of 10
Satisfaction amongst businesses has also remained stable at 73 out of 10
Comparison to the ideal service has seen a statistically significant increase of 04 points to 72 out of 10 This is a result of a 6 point increase in the proportion of businesses rating SA Government services close to ideal (7-10)
The proportion of businesses rating services in the lowest bracket (1-4) continues to decline year on year across all performance indicators
Figure 12 2016 2017 2018 and 2019 overall performance - Businesses
Note Results are subject to rounding
Business
Outcome Measures Avg responses
ExpectationHow would you rate your expectation of the overall quality of service
SatisfactionThinking about your experiences in the last 12 months how satisfied would you say you are with each of the following services in SA
Ideal servicehellipPlease imagine an ideal service How well do you think each service in SA compares to that ideal service
13
9
8
7
15
19
16
18
72
73
75
75
2016(n=817)
2017(n=753)
2018(n=801)
2019(n=758)
Low (1-4) Med (5-6) High (7-10)
16
11
10
8
18
21
20
20
67
69
70
72
2016(n=825)
2017(n=769)
2018(n=814)
2019(n=762)
Dissatisfied (1-4) Neutral (5-6) Satisfied (7-10)
19
16
14
12
19
20
23
18
62
63
63
69
2016(n=797)
2017(n=742)
2018(n=795)
2019(n=732)
Not close to ideal (1-4) Neutral (5-6) Close to ideal (7-10)
73
74
75
76
2016
2017
2018
2019
+01
+01
+01
70
71
72
73
2016
2017
2018
2019
+02
+01
+01
67
69
68
72
2016
2017
2018
2019
+02
-01
+04
Legend Statistically significant increase in avg from 2018 (at 99 level of Confidence)No statistical significant change in avg from 2018 (at 99 level of Confidence)Statistically significant decrease in avg from 2018 (at 99 level of Confidence)
BUSINESS OVERALL PERFORMANCEBusiness satisfaction with SA Government services has remained stable in 2019
32
Source Customer Service Commission Customer Satisfaction Measurement Survey 2019 Report developed in conjunction with the NSW Customer Service CommissionerPublic I1-A2
Consumersbull 75 of consumers indicate that they are
satisfied with the SA Government services they have had direct dealings in the last 12 months
bull 79 of consumers indicate that they have high expectations of SA Government services
Businessesbull 72 say they are satisfied - this is a 2
points increase in comparison to last year (70 in 2018) This increase has come from a 2 point decrease in dissatisfied businesses (1-4 out of 10)
bull 75 of businesses indicate that they have high expectations of SA Government services
The above satisfaction scores across consumer and business suggest positive perceptions of recent experiences with SA Government services
The above expectation scores across consumer and business suggest they may have had positive previous experiences (prior to the last 12 months)
bull What Overall expectation is a measure of the quality of services customers expect to receive from a service
bull How Customers were asked ldquoThinking about the following service in SA how would you rate your expectation of the overall quality of servicerdquo
Expectation
78 10
76 10
respondents Avg
7
7
18
14
75
79
Business(n=758)
Consumer(n=3241)
Low (1-4)Med (5-6)High (7-10)
Responses were recorded according to a scale from 1 (very low) to 10 (very high)
+01
+01
bull What Overall satisfaction is a measure of the perceived performance of a service as stated by customers
bull How Customers were asked ldquoThinking about your experiences in the last 12 months how satisfied would you say you are with the following service in SArdquo
Satisfaction
respondents Avg
Responses were recorded according to a scale from 1 (very dissatisfied) to 10 (very satisfied)
8
10
20
16
72
75
Business(n=762)
Consumer(n=3297)
Dissatisfied (1-4)
Neutral (5-6)
Satisfied (7-10)
75 10
73 10
-
+01
Sig Sig
Figure 13 Figure 14
Comparison of current SA performance to expectations
Consumer Business
Legend Statistically significant increase in avg from 2018 (at 99 level of Confidence)No statistical significant change in avg from 2018 (at 99 level of Confidence)Statistically significant decrease in avg from 2018 (at 99 level of Confidence)
PERFORMANCE OF SERVICES COMPARED TO EXPECTATIONSResults against the measures of satisfaction and expectation indicate positive perceptions of SA Government services
33
Source Customer Service Commission Customer Satisfaction Measurement Survey 2019 Report developed in conjunction with the NSW Customer Service CommissionerPublic I1-A2
Consumersbull 69 of consumers rated SA
Government services as performing close to their ideal service (7-10 out of 10)
bull The average score has remained stable versus last year
Businessesbull 69 of businesses rated SA
Government services as performing close to their ideal service (7-10 out of 10)
bull There has been a significant increase of 04 in the average score for lsquoideal servicersquo (72 out of 10) versus last year
bull What Comparison to an ideal service is a measure of how much the customers feel that the service is close to the best it can be
bull How Customers were asked ldquoNow forgetting for a moment the specific service please imagine an ideal service How well do you think the service in SA compares with that ideal servicerdquo
12
13
18
18
69
69
Business(n=732)
Consumer(n=3172)
Not close to ideal (1-4)Neutral (5-6)Close to ideal (7-10)
Comparison to ideal
7210
7210
respondents Avg
Responses were recorded according to a scale from 1 (not very close to ideal) to 10 (very close to ideal)
Sig
+01
+04
Comparison of current SA performance to perceptions of an ideal service
Figure 15 Figure 16
bull What Overall satisfaction is a measure of the perceived performance of a service as stated by customers
bull How Customers were asked ldquoThinking about your experiences in the last 12 months how satisfied would you say you are with the following service in SArdquo
Satisfaction
respondents Avg
Responses were recorded according to a scale from 1 (very dissatisfied) to 10 (very satisfied)
8
10
20
16
72
75
Business(n=762)
Consumer(n=3297)
Dissatisfied (1-4)
Neutral (5-6)
Satisfied (7-10)
75 10
73 10
-
+01
Sig
Consumer Business
Legend Statistically significant increase in avg from 2018 (at 99 level of Confidence)No statistical significant change in avg from 2018 (at 99 level of Confidence)Statistically significant decrease in avg from 2018 (at 99 level of Confidence)
PERFORMANCE OF SERVICES COMPARED TO IDEAL69 of both consumers and businesses rate SA Government services as performing close to their ideal service
34
Source Customer Service Commission Customer Satisfaction Measurement Survey 2019 Report developed in conjunction with the NSW Customer Service CommissionerPublic I1-A2
Note Average satisfaction expectation comparison to ideal service and expectation gap scores are subject to rounding
bull Compared to 2018 satisfaction and expectations have remained stable across jurisdictions with the exceptions of NSW and UK
bull Compared to 2018 SA has improved its ranking by 1 spot when it comes to expectation but has retained its rankings for satisfaction and ideal service
bull NSW has seen a statistically significant increase of 02 points in its satisfaction scores to 78 However the expectation score has also increased statistically significantly to 81 ndashkeeping the gap between expectation and satisfaction unchanged
bull UK has seen a statistically significant decrease of 02 points in expectations to 78
Figure 17 Satisfaction expectation and ideal service across jurisdictions - Consumer
Consumer
Outcomemeasures Avg respondents
ExpectationHow would you rate your expectation of the overall quality of service
SatisfactionThinking about your experiences in the last 12 months how satisfied would you say you are with each of the following services in SA
Ideal service
hellipPlease imagine an idealservice How well do you think each service in SA compares to that ideal service
7
7
7
7
7
6
14
14
13
13
12
11
79
79
80
80
81
84
UK
SA
NZ
QLD
VIC
NSW
Low (1-4)
Medium (5-6)
High (7-10)
78
79
79
79
81
78
10
9
9
9
8
7
16
16
14
15
14
14
75
76
77
76
77
79
SA
UK
VIC
QLD
NZ
NSW
Dissatisfied (1-4)
Neutral (5-6)
Satisfied (7-10)76
76
77
77
78
75
73
73
74
74
75
72
+02
+02
+02
-01
-
+02
-
-
-
+01
-
+01
NA
-01
-01
-02
NA
NA
13
12
12
11
11
10
18
17
17
15
16
15
69
71
71
74
74
75
SA
UK
NZ
QLD
NSW
VIC
Not close toideal (1-4)Neutral (5-6)
Close to ideal(7-10)
Legend Statistically significant increase in avg from 2018 (at 99 level of Confidence)No statistical significant change in avg from 2018 (at 99 level of Confidence)Statistically significant decrease in avg from 2018 (at 99 level of Confidence)
COMPARISON OF SA CONSUMERSrsquo PERCEPTIONS TO OTHER JURISDICTIONSRatings for SA Government services have remained stable versus last year NSW has seen a significant increase and UK has seena significant decrease in satisfaction
35
Source Customer Service Commission Customer Satisfaction Measurement Survey 2019 Report developed in conjunction with the NSW Customer Service CommissionerPublic I1-A2
Note Average satisfaction expectation comparison to ideal service and expectation gap scores are subject to rounding
bull Compared to 2018 all jurisdictions with the exception of QLD and VIC have remained stable in regards to expectations and satisfaction
bull Satisfaction and Expectation scores for SA Government services have remained stable Whereas the ideal service score for SA has seen a significant increase of 04 points to 72
bull After statistically significant declines last year QLD has bounced back showing statistically significant gains across all three performance indicators with satisfaction showing a 05 points increase This has pushed QLD up in the rankings for all three performance indicators
bull VIC has seen decreases across all three performance indicators pushing their ranking down compared to last year
Figure 18 Satisfaction expectation and ideal across jurisdictions - Business
Business
Legend Statistically significant increase in avg from 2018 (at 99 level of Confidence)No statistical significant change in avg from 2018 (at 99 level of Confidence)Statistically significant decrease in avg from 2018 (at 99 level of Confidence)
Outcomemeasures Avg respondents
ExpectationHow would you rate your expectation of the overall quality of service
Satisfaction
Thinking about your experiences in the last 12 months how satisfied would you say you are with each of the following services in SA
Ideal service
hellipPlease imagine an idealservice How well do you think each service in SA compares to that ideal service
7
7
7
7
8
7
17
18
13
15
12
15
77
75
80
78
80
78
VIC
SA
QLD
UK
NZ
NSW
Low (1-4)
Medium (5-6)
High (7-10)
76
77
77
78
78
76
11
8
9
8
6
10
20
20
20
20
19
14
69
72
71
72
75
76
VIC
SA
UK
NSW
NZ
QLD
Dissatisfied (1-4)
Neutral (5-6)
Satisfied (7-10)
71
74
74
75
75
73
16
12
12
10
9
9
15
20
18
22
20
18
70
68
69
69
70
73
VIC
NSW
SA
UK
NZ
QLD
Not close toideal (1-4)
Neutral (5-6)
Close to ideal(7-10)
70
71
73
73
74
72
+06
+01
+01
+01
NA
-01
-
+01
NA
-04
+04
+05
-02
+04
+01
-03
+01
NA
COMPARISON OF SA BUSINESSESrsquo PERCEPTIONS TO OTHER JURISDICTIONSRatings for SA have remained stable across all measures QLD has see significant increases and VIC has seen significant declinesin satisfaction
36
Source Customer Service Commission Customer Satisfaction Measurement Survey 2019 Report developed in conjunction with the NSW Customer Service CommissionerPublic I1-A2
-037
-023
-028
-021
-032
-030
-027
-026
-022
-019
-017
-04 -02 00
VIC
SA
NSW
QLD
UK
NZ
2019 2018
Figure 110 2018 and 2019 expectation gap -Businesses
Note ndash Percentages do not add up to 100 due to exclusion of Donrsquot Know from the analysis
Consumersbull In SA the gap to expectation
remained relatively stable showing a small increase of 004 points versus last year
bull UK has seen an decrease in gap of 013 points
bull VIC has seen a decrease in gap of 007 points
Businessesbull Except QLD all jurisdictions show
an increase in the gap between satisfaction and expectation
bull The gap to expectation in SA has remained relatively stable versus last year increasing only by 003 points
Figure 19 2018 and 2019 expectation gap -Consumers
Consumer Business
-038
-029
-028
-031
-031
-047
-039
-036
-034
-026
-015
-06 -04 -02 00
VIC
NSW
UK
SA
NZ
QLD
2019 2018
NA
NA
Legend Statistically significant increase in avg from 2018 (at 99 level of Confidence)No statistical significant change in avg from 2018 (at 99 level of Confidence)Statistically significant decrease in avg from 2018 (at 99 level of Confidence)
GAP BETWEEN SATISFACTION AND EXPECTATION FOR CONSUMERS AND BUSINESSESIn SA the gap to expectation for both consumers and businesses has seen a slight increase this year
37
Source Customer Service Commission Customer Satisfaction Measurement Survey 2019 Report developed in conjunction with the NSW Customer Service CommissionerPublic I1-A2
-1 -05 0 05Avg
gap
bet
wee
n sa
tisfa
ctio
n an
d ex
pect
atio
n
-15 -1 -05 0 05 1
00
-13
-07
-07
Avg
gap
bet
wee
n sa
tisfa
ctio
n an
d ex
pect
atio
n01
-15
-13
-05
Services with the highest expectation gap
Services with the lowest expectation gap
Note Very small number of responses (nlt=30)All service comparisons will be shown in greater detail in the detailed chapters of this report For further service comparisons see Chapter 9
State Emergency Services (n=45)
Ambulance Services (n=24)
Figure 111 Satisfaction expectation gap - Consumer
Figure 112 Satisfaction expectation gap - Business
Child Welfare Services(n=51)
Courts(n=89)
Prisons(n=21)
Disability Services(n=33)Agricultural
Advice and Funding Services(n=10)
Public Housing (n=16)
Consumersbull There are no services that have a positive
expectation gap State Emergency Services have a zero point gap
bull Prisons have the highest negative expectation gap of -13 points followed by Courts and Child Welfare Services and Major Roads at -07 points
Businessesbull Of those with statistically reliable sample sizes
Disability Services have the highest negative expectation of -05 points
Consumer Business
GAP BETWEEN SATISFACTION AND EXPECTATION BY SERVICEAcross most services both consumers and businesses have a negative gap to expectation (expectation is higher than satisfaction)
-07Major Roads(n=81)
38
Source Customer Service Commission Customer Satisfaction Measurement Survey 2019 Report developed in conjunction with the NSW Customer Service CommissionerPublic I1-A2
Consumer Business
Service(n= for consumers n= for business)
Reach1 Average satisfaction (out of 10)
Average expectation score (out of 10) Gap to expectation
Consumer Business Consumer Business Consumer Business Consumer BusinessFire Brigades (n=24 n=15) 1 2 91 91 93 91 -02 00
State Emergency Serv (n=47 n=13) 3 3 90 87 91 87 00 00
Ambulance Serv (n=208 n=24) 17 7 87 91 90 90 -03 01
Art Galleries and Museums (n=121 n=13) 13 3 87 82 88 84 -02 -02Vehicle Licensing and Registration (n=580 n=135) 56 43 80 71 82 75 -01 -04
Public Schools (n=228 n=51) 19 14 76 66 79 70 -03 -05
Water Supply (n=240 n=67) 24 23 76 74 78 77 -02 -03
Police (n=217 n=35) 21 9 75 80 78 81 -03 -01
Public Hospitals (n=412 n=76) 41 18 74 69 77 72 -03 -03
Public Transport (n=390 n=47) 38 13 74 72 76 76 -02 -03
Consumer Affairs (n=38 n=27) 4 8 73 75 77 77 -04 -02
Documentation Serv (n=42 n=17) 4 5 73 80 76 83 -03 -03Environment and Wildlife Protection (n=38 n=19) 3 4 73 74 75 78 -03 -04
Business Advisory Serv (n=17 n=35) 1 11 73 72 73 75 -01 -03
Serv for Older People (n=114 n=28) 9 7 73 71 77 75 -04 -04
TAFE Serv (n=126 n=36) 11 9 70 67 72 68 -03 -01Agricultural Advice and Funding Serv (n=13 n=10) 1 2 68 61 70 74 -02 -13
Disability Serv (n=100 n=34) 9 10 66 74 70 79 -03 -05
Major Roads (n=86 n=11) 8 3 65 74 71 75 -07 -01
Public Housing (n=87 n=16) 9 5 63 55 67 70 -04 -15
Courts (n=94 n=19) 6 4 63 74 70 79 -07 -05
Prison (n=23 n=14) 2 2 54 79 67 83 -13 -03
Child Welfare Serv (n=52 n=20) 3 3 45 70 52 75 -07 -05
Figure 113 Summary of variation in key performance measures across services
Interpret with caution Very small number of responses (nlt=30) 1 of customers who have interacted with this service in the last 12 months | Top bottom six in each category compared to other services
SUMMARY OF SERVICE PERFORMANCE BY SATISFACTION AND EXPECTATIONIn terms of average satisfaction score Fire Brigades State Emergency Services Ambulance Services and Art Galleries and Museums are the top rating services
39
Public ndash I1-A2
SOUTH AUSTRALIAN CUSTOMER SATISFACTION MEASUREMENT SURVEY 2019
2 PERFORMANCE AGAINST CUSTOMER SATISFACTION ATTRIBUTES
Source Customer Service Commission Customer Satisfaction Measurement Survey 2019 Report developed in conjunction with the NSW Customer Service CommissionerPublic I1-A2
Satisfaction Drivers Average score across respondents (out of 10 according to a scale from 1 strongly disagree to 10 strongly agree)
Employees for SA1) Honesty and integrity of
employees2) Efficiency and effectiveness of
employees3) Communication
Average across attributes
Employees across jurisdictions1) Honesty and integrity of
employees2) Efficiency and effectiveness of
employees3) Communication
Average across attributes
77 76 7675 74 74 74 74 73
7070 69
78 7877
76 76 76 76 7575
72
7172
65
70
75
80
Are
hone
st
Del
iver
hig
h sa
fety
sta
ndar
ds
Prov
ide
serv
ices
with
out b
ias
Expl
ain
inte
nded
act
ions
cle
arly
Enge
nder
con
fiden
ce in
thei
r kno
wle
dge
Com
mun
icat
e w
ell
Prov
ide
good
val
ue s
ervi
ces
Are
relia
ble
Are
cons
iste
nt
Are
held
acc
ount
able
See
thin
gs fr
om m
y pe
rspe
ctiv
e
Get
thin
gs d
one
as q
uick
ly a
s po
ssib
le
NZ (n=2815) UK (n=2897) SA (n=2727) VIC (n=2991) QLD (n=2844) NSW (n=5686)
Average 7410
7510
QLD
7510
NZ
7510
VIC
7510
NSW
7410
UK
Figure 21 Consumer perceptions of employee related attributes
Top 3 performing attributes include
bull lsquoAre honestrsquo (77 out of 10)bull lsquoDeliver high safety standardsrsquo (76 out
of 10) bull lsquoProvide services without biasrsquo (76 out if
10)
Bottom 3 lowest performing attributes include
bull lsquoGet things done as quickly as possiblersquo (69 out of 10)
bull lsquoSee things from my perspectiversquo (70 out of 10)
bull lsquoAre held accountablersquo (70 out of 10)
When compared with other jurisdictions
bull SA along with the UK was the lowest performing jurisdiction (74 out of 10) on average However the gap between highest and lowest performing jurisdictions is very small
Base(n)=2704
77 76 76 75 74 74 74 74 7370 70 69
556065707580
Are
hone
st
Del
iver
hig
hsa
fety
sta
ndar
ds
Prov
ide
serv
ices
with
out b
ias
Expl
ain
inte
nded
actio
ns c
lear
ly
Enge
nder
conf
iden
ce in
thei
r kno
wle
dge
Com
mun
icat
ew
ell
Prov
ide
good
valu
e se
rvic
es
Are
relia
ble
Are
cons
iste
nt
Are
held
acco
unta
ble
See
thin
gs fr
omm
y pe
rspe
ctiv
e
Get
thin
gs d
one
as q
uick
ly a
spo
ssib
le
Consumer
+01 +01 - - - - - - --
+01 -01
CONSUMER PERCEPTION OF EMPLOYEESThere were no statistically significant changes in perceptions of employees versus 2018
Legend Statistically significant increase in avg from 2018 (at 99 level of Confidence)No significant change in avg from 2018(at 99 level of Confidence)Statistically significant decrease in avg from 2018 (at 99 level of Confidence)
41
Source Customer Service Commission Customer Satisfaction Measurement Survey 2019 Report developed in conjunction with the NSW Customer Service CommissionerPublic I1-A2
Satisfaction Drivers Average score across respondents (according to a scale from 1 strongly disagree to 10 strongly agree)
Process for SA1) Simplicity and efficiency of
processes2) Employee autonomy
Average across attributes
Process across jurisdictions1) Simplicity and efficiency of
processes2) Employee autonomy
Average across attributes
7068
65 6563
55
65
75
Processes areeasy to
understand
Employees areempowered tomake decisions
I can get to theright person the
first time
Service feelsseamless even if I
have to usemultiple contact
methods
Are designed toreduce wait timesAverage 66
10
70
68
65 65
63
72
70
6868
67
60
65
70
75
Processes areeasy to understand
Employees areempowered tomake decisions
I can get to theright person the
first time
Service feelsseamless even if I
have to usemultiple contact
methods
Are designed toreduce wait times
NZ (n=2677) UK (n=2735) SA (n=2617) VIC (n=2924) QLD (n=2851) NSW (n=5638)
6910
QLD
6810
NZ
6910
VIC
6910
NSW
6710
UK
bull lsquoProcesses are easy to understandrsquo is the best performing attribute with a score of 7 out of 10 However as with previous years execution of these processes (empowered employees getting to the right person the first time seamless service and wait times) continue to have lower scores ranging from 68 to 63 out of 10 This pattern is observed across all jurisdictions
bull SA is behind other jurisdictions for all process attributes
bull Across all jurisdictions process attributes have the lowest average scores of all attribute categories (Values Goals and Employees) ndashsimplifying and bringing efficiencies to processes remains a challenge for all jurisdictions
Figure 22 Consumer perceptions of process related attributes
Base(n)=2668
Consumer
+01+01
-01 - -
CONSUMER PERCEPTION OF PROCESSESThere have been no statistically significant changes to any of the process attribute scores in comparison to last year
Legend Statistically significant increase in avg from 2018 (at 99 level of Confidence)No significant change in avg from 2018(at 99 level of Confidence)Statistically significant decrease in avg from 2018 (at 99 level of Confidence)
42
Source Customer Service Commission Customer Satisfaction Measurement Survey 2019 Report developed in conjunction with the NSW Customer Service CommissionerPublic I1-A2
Satisfaction Drivers Average score across respondents (according to a scale from 1 strongly disagree to 10 strongly agree)
Goals for SA1) Privacy2) Transparency3) Access
Average across attributes
Goals across jurisdictions1) Privacy2) Transparency3) Access
Average across attributes
7570 68 67
61
55
65
75
Safeguard privacyand confidentiality
Is making it easierto access
information abouttheir services
Is making best useof online services
to improveconvenience and
efficiency forcustomers
Demonstrateopenness andtransparency indecision-making
Encourage publicparticipation in
decision-makingAverage 68
10
75
70
6867
61
76
72
7170
65
60
65
70
75
80
Safeguard privacyand confidentiality
Is making it easierto access
information abouttheir services
Is making best useof online services
to improveconvenience and
efficiency forcustomers
Demonstrateopenness andtransparency indecision-making
Encourage publicparticipation in
decision-making
NZ (n=2681) UK (n=2785) SA (n=2582) VIC (n=2803) QLD (n=2732) NSW (n=5486)
7010
NZ
7010
QLD
7110
VIC
7110
NSW
6910
UK
bull lsquoSafeguard privacy and confidentialityrsquo is the highest rated goal attribute
bull In comparison to other jurisdictions SA continues to lag on all goal attributes
bull lsquoEncourage public participation in decision makingrsquo is the attribute that sees the lowest scores across all jurisdictions It is also the attribute with the widest gap between the top performing and lowest performing jurisdictions (VIC and SA) with a gap of 04 points
Figure 23 Consumer perceptions of goals related attributes
Base(n)=2561
Consumer
CONSUMER PERCEPTION OF GOALSConsumer perceptions of SA Government services against goal related attributes have remained statistically stable versus last year
+01
+01- - -01
Legend Statistically significant increase in avg from 2018 (at 99 level of Confidence)No significant change in avg from 2018(at 99 level of Confidence)Statistically significant decrease in avg from 2018 (at 99 level of Confidence)
43
Source Customer Service Commission Customer Satisfaction Measurement Survey 2019 Report developed in conjunction with the NSW Customer Service CommissionerPublic I1-A2
Satisfaction Drivers Average score across respondents (according to a scale from 1 strongly disagree to 10 strongly agree)
Values for SA1) Service Quality2) Accountability
Average across attributes
Values across jurisdictions1) Service Quality2) Accountability
Average across attributes
Average 7210
73 72 72 70
55
65
75
Operates with integrity Provides good service Is a body I can trust Is accountable for itsservices
7372 72
70
7575
74
73
65
70
75
80
Operates with integrity Provides good service Is a body I can trust Is accountable for itsservices
NZ (n=3108) UK (n=3068) SA (n=2936) VIC (n=3166) QLD (n=3059) NSW (n=6113)
7410
UK
7310
NZ
7410
VIC
7410
NSW
7310
QLD
bull Consumers rate SA Governmentservices high (above 7 out of 10)across all value attributes
bull At an overall level SA is behind all other jurisdictions with the lowest average score across all value attributes
Figure 24 Consumer perceptions of values related attributes
Base(n)=2916
Consumer
- - --
CONSUMER PERCEPTION OF VALUESThere have been no statistically significant changes to the ratings of value attributes versus last year
Legend Statistically significant increase in avg from 2018 (at 99 level of Confidence)No significant change in avg from 2018(at 99 level of Confidence)Statistically significant decrease in avg from 2018 (at 99 level of Confidence)
44
Source Customer Service Commission Customer Satisfaction Measurement Survey 2019 Report developed in conjunction with the NSW Customer Service CommissionerPublic I1-A2
Satisfaction Drivers Average score across respondents (according to a scale from 1 strongly disagree to 10 strongly agree)
Employees for SA1) Honesty and integrity of
employees2) Efficiency and effectiveness of
employees3) CommunicationAverage across attributes
Employees across jurisdictions1) Honesty and integrity of
employees2) Efficiency and effectiveness of
employees3) Communication
75 75 73 72 72 72 71 71 71 69 68 68
55
65
75
85
Are
hone
st
Del
iver
hig
hsa
fety
sta
ndar
ds
Prov
ide
serv
ices
with
out b
ias
Expl
ain
inte
nded
actio
ns c
lear
ly
Enge
nder
conf
iden
ce in
thei
r kno
wle
dge
Com
mun
icat
ew
ell
Are
cons
iste
nt
Prov
ide
good
valu
e se
rvic
es
Are
relia
ble
Are
held
acco
unta
ble
Get
thin
gs d
one
as q
uick
ly a
spo
ssib
le
See
thin
gs fr
omm
y pe
rspe
ctiv
e
7372 73
7271
7170
72 72
68 6968
77 7775
7574
75 75 74 74
7170 71
65
70
75
80
Are
hone
st
Del
iver
hig
h sa
fety
sta
ndar
ds
Prov
ide
serv
ices
with
out b
ias
Expl
ain
inte
nded
act
ions
cle
arly
Enge
nder
con
fiden
ce in
thei
rkn
owle
dge
Com
mun
icat
e w
ell
Are
cons
iste
nt
Prov
ide
good
val
ue s
ervi
ces
Are
relia
ble
Are
held
acc
ount
able
Get
thin
gs d
one
as q
uick
ly a
s po
ssib
le
See
thin
gs fr
om m
y pe
rspe
ctiv
e
NZ (n=757) UK (n=1327) SA (n=657) VIC (n=714) QLD (n=748) NSW (n=1586)
Average 7110
7210
UK
7210
NSW
7310
NZ
7410
QLD
7110
VIC
bull The attribute lsquoAre honestrsquo is the top ranking attribute this year
bull Other top attributes are lsquodeliver high safety standardsrsquo and lsquoprovide services without biasrsquo
Bottom 3 lowest performing attributes are
bull lsquoSee things from my perspectiversquo (68 out of 10)
bull lsquoGet things done as quickly as possiblersquo (69 out of 10)
bull lsquoAre held accountablersquo (68 out of 10)
Across jurisdictions VIC has the lowest average ratings for employee perceptions
QLD has the highest average rating in 2019 after being in the last spot in 2018
Figure 25 Business perceptions of employee related attributes
Base(n)=724
Business
BUSINESS PERCEPTION OF EMPLOYEESThere have been no statistically significant changes to the ratings of employee attributes versus last year
+02 +01 +02 +01 +01 +01 +01 +01 - +02
+01 +01
Legend Statistically significant increase in avg from 2018 (at 99 level of Confidence)No significant change in avg from 2018(at 99 level of Confidence)Statistically significant decrease in avg from 2018 (at 99 level of Confidence)
45
Source Customer Service Commission Customer Satisfaction Measurement Survey 2019 Report developed in conjunction with the NSW Customer Service CommissionerPublic I1-A2
Satisfaction Drivers Average score across respondents (according to a scale from 1 strongly disagree to 10 strongly agree)
Process for SA1) Simplicity and efficiency of
processes2) Employee autonomy
Average across attributes
Process across jurisdictions1) Simplicity and efficiency of
processes2) Employee autonomy
Average across attributes
68 66 65 6561
55
65
75
Processes areeasy to understand
Employees areempowered tomake decisions
Service feelsseamless even if I
have to usemultiple contact
methods
I can get to theright person the
first time
Are designed toreduce wait times
Average 6510
6710
UK
6510
NSW
6710
NZ
6810
QLD
6510
VIC
68
66 65
6561
71
68 6767 67
60
65
70
75
Processes areeasy to understand
Employees areempowered tomake decisions
Service feelsseamless even if I
have to usemultiple contact
methods
I can get to theright person the
first time
Are designed toreduce wait times
NZ (n=731) UK (N=1324) SA (n=661) VIC (n=711) QLD (n=745) NSW (n=1614)
bull Average rating for process attributes are the lowest in comparison to other attributes (employees ndash 71 goals ndash 68 values ndash 71)
bull Among all jurisdictions QLD has the highest average rating of 68 out of 10
bull SA ranks lowest among all jurisdictions for the statement lsquoAredesigned to reduce wait timesrsquo
Figure 26 Business perceptions of process related attributes
Base(n)= 712
Business
BUSINESS PERCEPTION OF PROCESSESAll the processes related attributes have remained stable from 2018 to 2019
+01+01
+01+01-01
Legend Statistically significant increase in avg from 2018 (at 99 level of Confidence)No significant change in avg from 2018(at 99 level of Confidence)Statistically significant decrease in avg from 2018 (at 99 level of Confidence)
46
Source Customer Service Commission Customer Satisfaction Measurement Survey 2019 Report developed in conjunction with the NSW Customer Service CommissionerPublic I1-A2
Satisfaction Drivers Average score across respondents (out of 10 on scale of according to a scale from 1 strongly disagree to 10 strongly agree)
Goals for SA1) Privacy2) Transparency3) Access
Average across attributes
Goals across jurisdictions1) Privacy2) Transparency3) Access
Average across attributes
7469 68 67
63
55
65
75
85
Safeguard privacyand confidentiality
Is making it easierto access
information abouttheir services
Is making best useof online services
to improveconvenience and
efficiency forcustomers
Demonstrateopenness andtransparency indecision-making
Encourage publicparticipation in
decision-makingAverage 68
10
6910
UK
6810
NSW
6910
NZ
6910
QLD
6710
VIC
77
71
69 67
62
71
6866 66
6260
65
70
75
80
Safeguard privacyand confidentiality
Is making it easierto access
information abouttheir services
Is making best useof online services
to improveconvenience and
efficiency forcustomers
Demonstrateopenness andtransparency indecision-making
Encourage publicparticipation in
decision-making
NZ (n=732) UK (n=1295) SA (n=641) VIC (n=681) QLD (n=708) NSW (n=1554)
bull Compared to 2018 lsquoEncourage public participation in decision makingrsquo has seen a statisticallysignificant increase of 04 points to 61 out of 10 However this continues to be the lowest rated goal related attribute
bull Across jurisdictions QLD has the highest average rating of 69
bull The largest gap between jurisdictions is seen for lsquoSafeguard privacy and confidentialityrsquo with NZ having the highest rating of 77 out of 10 and VIC having the lowest rating of 71 out of 10
Figure 27 Business perceptions of goals related attributes
Base(n)= 695
Business
04
Legend Statistically significant increase in avg from 2018 (at 99 level of Confidence)No significant change in avg from 2018(at 99 level of Confidence)Statistically significant decrease in avg from 2018 (at 99 level of Confidence)
BUSINESS PERCEPTION OF GOALSMost goal related attributes with the exception of lsquoEncourage public participation in decision-makingrsquo have remained stable versus last year
+03 -03 +03 +02
47
Source Customer Service Commission Customer Satisfaction Measurement Survey 2019 Report developed in conjunction with the NSW Customer Service CommissionerPublic I1-A2
Satisfaction Drivers Average score across respondents (out of 10 on scale of according to a scale from 1 strongly disagree to 10 strongly agree)
Values for SA1) Service Quality2) Accountability
Average across attributes
Values across jurisdictions1) Service Quality2) Accountability
Average across attributes
Average 7110
74 74 74
71
71 71 71
69
65
70
75
80
Operates with integrity Provides good service Is a body I can trust Is accountable for itsservices
NZ (n=803) UK (n=1367) SA (n=702) VIC (n=748) QLD (n=789) NSW (n=1676)
7210
UK
7110
NSW
7210
QLD
7310
NZ
7010
VIC
72 71 71 70
55
65
75
Operates with integrity Provides good service Is a body I can trust Is accountable for itsservices
bull lsquoIntegrityrsquo is the top rated value attribute with a rating of 72 out of 10
bull While lsquoaccountabilityrsquo is the least rated attribute there has been a 02 point increase (statistically insignificant) versus 2018
bull Across jurisdictions VIC has slipped to the lowest ranking after being the top performing Australian jurisdiction last year and NZ has the highest average rating of 73 out of 10 making it the top performingjurisdiction in 2019
bull The gap between the top performing jurisdiction and lowest performer have narrowed in comparison to last year indicating an improvement in performance across jurisdictions
Figure 28 Business perceptions of values related attributes
Base(n)= 758
Business
BUSINESS PERCEPTION OF VALUESValue related attributes continue to be statistically stable in 2019
+01 +01 +01 +02
Legend Statistically significant increase in avg from 2018 (at 99 level of Confidence)No significant change in avg from 2018(at 99 level of Confidence)Statistically significant decrease in avg from 2018 (at 99 level of Confidence)
48
Source Customer Service Commission Customer Satisfaction Measurement Survey 2019 Report developed in conjunction with the NSW Customer Service CommissionerPublic I1-A2
Employee attributes Goals Processes Values
1Note Groupings of drivers of satisfaction are based on analyses of NSW Government services however it is assumed that drivers of satisfaction are relatively consistent across jurisdictions and generally across service industries broadly
bull Safeguard privacy and confidentiality
Goa
ls
bull Provide good value servicesbull Are honestbull Are reliablebull Deliver high safety standards
Empl
oyee
s
bull Are consistentbull Explain intended actions clearlybull Communicate wellbull Engender confidence in their
knowledge
Communication of employees
bull Are held accountablebull Get things done as quickly as
possible
Efficiency and Effectiveness of employeesHonesty and integrity of employees
Employee autonomySimplicity and efficiency of processes
bull Processes are easy to understandbull Service feels seamless across channelsbull Processes are designed to reduce wait timesbull I can get to the right person the first time
bull Employees are empowered to make decisions
Accountability and Service Quality
bull Is a body that I can trustbull Operates with integritybull Provides good value servicesbull Is accountable for its services
Proc
esse
sVa
lues
Access to Information and Online services PrivacyTransparency
bull Demonstrate openness and transparency in decision making
bull Encourage public participation in decision making
bull Is making it easier to access information about their service
bull Is making best use of online services to improve efficiency for customers
bull See things from my perspective
bull Provide services without bias
Fairness and Empathy of employees
Consumer
GROUPINGS OF DRIVERS OF CUSTOMER SATIFACTION1
The groupings of drivers have changed from 2018 - lsquoFairness and Empathyrsquo is now a key standalone driver of consumer satisfaction differentiated from Communication which continues to be a key driver of consumer satisfaction
49
Source Customer Service Commission Customer Satisfaction Measurement Survey 2019 Report developed in conjunction with the NSW Customer Service CommissionerPublic I1-A2
KEY
When looking at the relative importance of satisfaction drivers in NSW Employee related attributes are seen to have the highest relative importance as drivers of satisfaction with lsquoHonesty and Integrityrsquo being the most important driverRelating this to the areas of improvement for the SA Governmentbull Honesty and Integrity is a strength that the SA
Government services can build on to improve consumer satisfaction
bull Access to information and online services as well as efficiency and effectiveness of employees are primary opportunities to drive higher consumer satisfaction
Note Groupings of drivers of satisfaction are based on analyses of NSW Government services however it is assumed that drivers of satisfaction are relatively consistent across jurisdictions and generally across service industries broadly
LOW
HIGH
Average score across attributes (SA)(out of 10)
LOW
HIGH
Rel
ativ
e im
port
ance
(NSW
)
Median across all attributes
1Note Analysis displayed is based on NSW customer data however similar results are observed for businesses Calculation is based on the relativity of parameters in the statistical analysis of drivers against satisfaction
Strengths to lsquobuild onrsquo
Median across drivers
Primary opportunities
Secondary opportunities
Fairness and Empathy
Simplicity and efficiency of processes
Transparency
Access to information and online services
Privacy
Employee autonomy
Employee attributes Goals Processes
Figure 211 Importance (NSW) versus performance (SA) against each of the drivers of satisfaction
Monitor
Communication
Consumer
Efficiency and effectiveness
Honesty and integrity
PRIORITISATION OF DRIVERS OF SATISFACTION1
Build on the honesty and integrity of employees and focus on improving their efficiency and effectiveness to drive higher satisfaction In addition focus on improving access to information and online services
50
Public ndash I1-A2
SOUTH AUSTRALIAN CUSTOMER SATISFACTION MEASUREMENT SURVEY 2019
3 SATISFACTION BY CONTACT METHOD AND DIGITAL INSIGHTS
Source Customer Service Commission Customer Satisfaction Measurement Survey 2019 Report developed in conjunction with the NSW Customer Service CommissionerPublic I1-A2
51
4135
29
128
47
40
29 27
15
6
Inperson
Phone Online Email Mail fax Thirdparties
2018 Business (n=814) 2019 Business (n=762)
c
usto
mer
s w
ho h
ave
had
dire
ct
deal
ings
via
this
cha
nnel
Figure 33 2018 and 2019 channel usage - Business
Figure 34 2018 and 2019 most preferred channel ndash Business
2922 22 22
2 4
3224 23
16
3 2
In person Email Phone Online Mailfax Thirdparties
2018 Business(n=795) 2019 Business(n=743)
Note ndash Percentages do not add up to 100 due to exclusion of Donrsquot Know from the analysis
Businessesbull While lsquoin personrsquo remains the most
used channel for contact there is a continued decline in usage since 2017 (52 in 2017 51 in 2018 47 in 2019) though not statistically significant
bull Despite the year on year declines lsquoin personrsquo continues to be the most preferred channel and there has been a year on year growth in preference since 2017 (27 in 2017 29 in 2018 32 in 2019)
57
3325
139 6
58
3426
1610
5
Inperson
Phone Online Email Mail fax Thirdparties
2018 Consumer (n=3307) 2019 Consumer (n=3297)
34
22 2112
4 2
3324 21
16
4 2
Inperson
Phone Online Email Mailfax Thirdparties
2018 Consumer (n=3307) 2019 Consumer (n=3170)
cus
tom
ers
who
hav
e ha
d di
rect
de
alin
gs v
ia th
is c
hann
el
Figure 31 2018 and 2019 channel usage - Consumer
Figure 32 2018 and 2019 most preferred channel - Consumer
Consumersbull lsquoIn personrsquo continues to be the most used
channel for contact as well as the most preferred channel Usage has remained consistent versus last year
bull Phone usage by consumers continues to see a year on year uptick though statistically insignificant (31 in 2017 33 in 2018 and 34 in 2019)
bull Relative preferences for the channels have remained unchanged versus last year
Consumer Business
CONTACT METHODS USED AND PREFERREDlsquoIn-personrsquo continues to be the most used and preferred method of contact for both consumers and businesses
52
Source Customer Service Commission Customer Satisfaction Measurement Survey 2019 Report developed in conjunction with the NSW Customer Service CommissionerPublic I1-A2
47
41
3130
12
5
4442
2529
96
56
40
24
31
96
4650
25
40
16
4
51
41
24
37
13
3
47
40
29 27
15
6
In person face toface
Telephone Online Email Mail posted letterfax
Third parties
NSW (n=1801) VIC (n=790) QLD (n=832)
UK (n=1420) NZ (n=868) SA (n=762)
Customers were asked ldquoWhich of the following contact methods have you used to carry out your direct dealings with the following services in [Jurisdiction] in the last 12 monthsrdquo
Figure 35 Contact method used to interact with government services across jurisdictions
59
31 31
16
84
54
33
2320
10
6
59
31
24
17
10
5
53
36
23 2116
2
57
31
24
19
13
2
58
34
26
16
105
In person face toface
Telephone Online Email Mail posted letterfax
Third parties
NSW (n=6771) VIC (n=3458) QLD (n=3346)UK (n=3310) NZ (n=3550) SA (n=3297)
Consumer
Business
Consumersbull Face to face is the most used channel
by consumers to access government services in all jurisdictions
bull NSW leads the way when it comes to the use of online channels
Businessesbull Face to face is the most used channel by
businesses to access government services in all jurisdictions
bull NSW leads in the adoption of online as a contact method followed by SA
bull Business usage of telephones and emails as a contact method is higher than that for consumers across all jurisdictions
Consumer Business
CONTACT METHODS USED AND PREFERREDlsquoIn-personrsquo is the most used contact method across all jurisdictions for both consumers and businesses SA is second to NSW in the usage of online as the method of contact for both consumers and businesses
53
Source Customer Service Commission Customer Satisfaction Measurement Survey 2019 Report developed in conjunction with the NSW Customer Service CommissionerPublic I1-A2
28
24 24
18
42
26
22
28
20
2 2
29
25
22
18
3 2
25
2826
16
5
0
29
26
23
18
31
32
24 23
16
32
In person face toface
Email Telephone Online Mail posted letterfax
Third parties
NSW (n=1759) VIC (n=774) QLD (n=809)UK (n=1401) NZ (n=850) SA (n=743)
35
18
24
18
32
33
23
19 19
52
34
21 20 20
42
31
2219
22
6
1
34
21 21 20
41
33
2421
16
42
In person face toface
Telephone Online Email Mail posted letterfax
Third parties
NSW (n=6491) VIC (n=3336) QLD (n=3246)UK (n=3177) NZ (n=3399) SA (n=3170)
CONTACT METHODS PREFERRED ACROSS JURISDICTIONSlsquoIn-personrsquo continues to be the most preferred channel across all jurisdictions for both consumers and businesses
Customers were asked ldquoGenerally which contact method do you most prefer when dealing directly with each of the following services inhelliprdquo
Figure 36 Contact method preferred to interact with government services across jurisdictions
Consumer
Business
Consumersbull Face to face is the preferred method of
contact for consumers to access government services in all jurisdictions
bull The pattern of preference is consistent with that of reported channel usage
Businessesbull Businesses prefer a variety of contact
methods to access government servicesbull Of all jurisdictions SA businesses have
the highest preference for face to face interactions
Consumer Business
54
Source Customer Service Commission Customer Satisfaction Measurement Survey 2019 Report developed in conjunction with the NSW Customer Service CommissionerPublic I1-A2
75
70 71 71 69 68
73 73 72 72 7167
50
60
70
80
In person Online Mailfax Phone Email Third parties2018 Business(n=814) 2019 Business(n=762)
Aver
age
satis
fact
ion
scor
e (1
-10)
76 7573 72 72
70
77 75 74 73 71 70
50
60
70
80
Online In person Third parties Phone Mailfax Email2018 Consumer (n=3307) 2019 Consumer (n=3297)
Aver
age
satis
fact
ion
scor
e (1
-10)
VARIATION IN CUSTOMER SATISFACTION BY CONTACT METHODWhile lsquoin-personrsquo is the most used and most preferred method of contact satisfaction of consumers with SA Government services is higher for those who use Online channels For businesses satisfaction is high for both in-person and online channel users
Customers were asked ldquoWhich of the following contact methods have you used to carry out your direct dealings with the following servicesrdquo
Figure 37 Variation in overall satisfaction by contact method
+01+01
+03
- -
+02+01
+01
+01
-01
Consumersbull Satisfaction ratings are high (7+ out
of 10) across all contact channelsbull Consumers who have used online
channels to contact have the highest satisfaction rating and this has remained relatively stable from last year
Businessesbull Satisfaction amongst businesses
using different channels have remained relatively stable compared to last year
bull Businesses who have used face to face or online methods of contact have the highest satisfaction rating
+01
Consumer Business
Legend Statistically significant increase in avg from 2018 (at 99 level of Confidence)No significant change in avg from 2018 (at 99 level of Confidence)Statistically significant decrease in avg from 2018 (at 99 level of Confidence)
-02
55
Source Customer Service Commission Customer Satisfaction Measurement Survey 2019 Report developed in conjunction with the NSW Customer Service CommissionerPublic I1-A2
7978
74
7675
74
76 77
7374
7273
7877
75 75 75
71
76 7675 75
71 71
77 76
7475
73
77
75
74 73
7170
Online In person face to face Third parties such asAustralia Post
Telephone Mail posted letter fax Email
NSW (n=6771) VIC (n=3458) QLD (n=3346) UK (n=3310) NZ (n=3550) SA (n=3297)
7575
71
7271 71
73 73 73
69
67
73
77
73
7776
71
68
75
72
68
74
71
70
74
79
76
71
73
77
73 7372 72 71
67
In person face toface
Online Mail posted letter fax Telephone Email Third parties such asAustralia Post
NSW (n=1801) VIC (n=790) QLD (n=832) UK (n=1420) NZ (n=868) SA (n=762)
Figure 38 Overall satisfaction with government services by contact method(s) used across jurisdictions
Aver
age
scor
e (1
-10)
Aver
age
scor
e (1
-10)
Consumer
Business
Consumersbull Across jurisdictions
consumers who use online channels have the highest satisfaction with their respective government services
bull Consumers in NZ using online channels show the highest satisfaction of all jurisdictions
Businessesbull In all jurisdictions except
NZ businesses that use face to face have the highest satisfaction with their respective government services In NZ online users have the highest satisfaction
bull SA businesses who use third party channels show the lowest satisfaction in comparison to businesses that use other channels
Consumer Business
VARIATION IN CUSTOMER SATISFACTION BY CONTACT METHOD ACROSS JURISDICTIONSConsumers who use online and businesses who use face to face have higher satisfaction with government services across jurisdiction
81
56
Source Customer Service Commission Customer Satisfaction Measurement Survey 2019 Report developed in conjunction with the NSW Customer Service CommissionerPublic I1-A2
7069
65 66
62
6765
63 6360
6866
63 6261
6461
59 59 58
70
67 66 6564
69 6865 65
62
Processes are easy tounderstand
Employees are empoweredto make decisions
Service feels seamlesseven if I have to
communicate acrossdifferent channels (ieonline phone email)
I can get to the right personthe first time
Are designed to reducewait times
In person face to face (n=1418) Mail posted letter fax (n=229)
Telephone (landline mobile calls text message) (n=883) Email (n=419)
Online (n=591) Third parties such as Australia Post (n=117)
6865 66 66
61
66 66 66 66
55
6462 62 62
57
65 6562 61
57
6865 63 63
60
74
69 6972
65
Processes are easy tounderstand
Service feels seamlesseven if I have to
communicate acrossdifferent channels
Employees are empoweredto make decisions
I can get to the right personthe first time
Are designed to reducewait times
In person face to face (n=300) Mail posted letter fax (n=87)
Telephone (landline mobile calls text message) (n=280) Email (n=207)
Online (n=178) Third parties such as Australia Post (n=31)
Figure 310 Perceptions of processes by channel(s) used - Business
Figure 39 Perceptions of processes by channel(s) used - Consumers
Aver
age
scor
e (1
-10)
Aver
age
scor
e (1
-10)
Consumersbull Consumers who have used in-person channels give
the highest scores for lsquoprocesses are easy to understandrsquo lsquoemployees are empowered to make decisionsrsquo and lsquoI can get to the right person the first timersquo
bull Consumers who have used online channels gave the highest ratings to lsquoService feels seamlessrsquo and lsquoare designed to reduce wait timesrsquo
bull Consumers who have used email rate the SA Government service lowest across all process attributes
Businessesbull Businesses who have used third party channels have
given the highest ratings for all process attributesbull Businesses that used mail posted letter or fax as
their method of contact rated the SA Government lowest on processes lsquoare designed to reduce wait timesrsquo attribute
bull Businesses that used telephone gave the lowest ratings to the attributes of lsquoprocesses are easy to understandrsquo lsquoservice feels seamlessrsquo and lsquoemployees are empowered to make decisionsrsquo
bull Business that used email gave the lowest rating to lsquoI can get to the right person the first timersquo
Consumer Business
PERCEPTIONS OF PROCESSES BY CONTACT METHODConsumers and businesses have different perceptions of processes based on the channels they have used
57
Source Customer Service Commission Customer Satisfaction Measurement Survey 2019 Report developed in conjunction with the NSW Customer Service CommissionerPublic I1-A2
79 79 78 78 78 78 78 75
102030405060708090100
0102030405060708090
100
I trust myinformation was
handledsecurely
through thewebsiteapp
I achieved theoutcome by
using servicesavailable online
The contentwas current
and accurate
The format ofcontent met my
accessrequirements
I was satisfiedwith the overallexperience of
using thewebsiteapp tocomplete the
task
Thewebsiteapp
was useful andallowed me todo everything Ineeded to do
Content andsupport
provided onlinewas sufficientto answer my
questions
I found thewebsite appsimple and itwas easy to
find what I waslooking for
Disagree (1-4) Neutral (5-6) Agree (7-10) Average
Customers were asked ldquoThinking about your experiences interacting with SA services online in the last 12 months to what extent do you agree or disagree with each of the following statementsrdquo
Figure 311 Satisfaction with attributes of online services
82 81 81 80 79 79 79 78
102030405060708090100
0102030405060708090
100
The contentwas current
and accurate
I achieved theoutcome by
using servicesavailable online
I trust myinformation
was handledsecurely
through thewebsiteapp
The format ofcontent met my
accessrequirements
I was satisfiedwith the overallexperience of
using thewebsiteapp tocomplete the
task
Thewebsiteapp
was useful andallowed me todo everything Ineeded to do
Content andsupport
provided onlinewas sufficientto answer my
questions
I found thewebsite appsimple and itwas easy to
find what I waslooking for
Disagree (1-4) Neutral (5-6) Agree (7-10) Average
Axis 2 Average Score
Consumer (n=798)
Business (n=210)
Axis
1
Perc
enta
ge o
f re
spon
ses
Axis 2 Average ScoreAxis
1
Perc
enta
ge o
f re
spon
ses
Consumersbull Consumers had an average rating of 79
out of 10 when asked about their satisfaction with the overall experience of using the website app to complete the task This rating has stayed stable since 2017
bull Consumers showed the highest levels of agreement with statements pertaining to accuracy of content achieving desired outcomes by using online services and trusting that their information was handled securely
Businessesbull There has been a significant increase in
the average rating across all attributes of online service except content accuracy ndash this has remained stable
bull The rating on satisfaction with the overall experience has gone up significantly by 08 points to 78
+01 +01 +01 +02+01 +01 +02
+05 NA +04 +09 +08 +06 +06
Consumer Business
Legend Statistically significant increase in avg from 2018 (at 99 level of Confidence)No significant change in avg from 2018 (at 99 level of Confidence)Statistically significant decrease in avg from 2018 (at 99 level of Confidence)
NA
+09
SATISFACTION WITH ONLINE SERVICES OVERALLConsumer satisfaction with overall experience of using online services has remained stable while business satisfaction has increased significantly from 2018 to 2019
58
Source Customer Service Commission Customer Satisfaction Measurement Survey 2019 Report developed in conjunction with the NSW Customer Service CommissionerPublic I1-A2
Businessesbull Businesses had similar motivations as
consumers for not using online as a channel to access services ndash lack of availability of services online as well as inability to find what they were looking for
Customers were asked ldquoYou mentioned that you did not go online to access the service in the last 12 months Please select all statements that apply in relation to these service(s) in SA I did not complete this interaction online becausehelliprdquo
Figure 312 Reasons for not going online I did not go online hellip
Consumer (n=2401)
Business (n=762)
37 16 12 7 7 6 5 5 3
The servicewasnt
possible to beundertaken
online
The servicewas notavailable
online
I was not ableto find what Iwas looking
for
There was noonline supportto answer any
questions Imay havesuch aswebchat
I didnt haveaccess to acomputer or
an onlinedevice
The format ofcontent on the
website didnot meet my
accessrequirements
I was not sureif my
informationwould remainconfidential
No incentivewas provided
such as adiscount
The contentwas not
current andoraccurate
Consumersbull The main reason for consumers not using
online channels to access services was that the services were not available or couldnrsquot be undertaken online
bull The other big factor was that consumers were unable to find what they were looking for
bull Uncertainty around confidentiality of information was not seen as a big deterrent in accessing services online
Consumer Business
37 17 11 8 8 7 7 6 3
The servicewasnt
possible to beundertaken
online
The servicewas notavailable
online
I was not ableto find what Iwas looking
for
There was noonline supportto answer any
questions Imay havesuch aswebchat
I didnt haveaccess to acomputer or
an onlinedevice
The format ofcontent on the
website didnot meet my
accessrequirement
I was not sureif my
informationwould remainconfidential
No incentivewas provided
such as adiscount
The contentwas not
current andoraccurate
ADOPTING ONLINE METHODS TO INTERACT WITH SA GOVERNMENT SERVICESA main reason for consumers and businesses not using online channels to access services is a lack of online service availability
re
spon
dent
s
resp
onde
nts
59
Source Customer Service Commission Customer Satisfaction Measurement Survey 2019 Report developed in conjunction with the NSW Customer Service CommissionerPublic I1-A2
77
15 8
I chose to go online I was directed to or was prompted to go online There was no other option available
10
10
10
Avg
10
10
10
Avg
Customers were asked ldquoDid you choose to go online or were you directed to go onlinerdquo
Figure 313 Choice to go online
18
11
5
16
19
11
65
70
84
70
73
81
There wasno otheroption
available
I wasdirected to
or wasprompted
to goonline
I chose togo online
Strong disagree (1-4) Neutral (5-6) Strongly agree (7-10)
respondents
15
14
2
19
16
49
66
83
62
75
80
There wasno otheroption
available
I wasdirected or
promoted togo online
I chose togo online
respondents
Consumer Business
74
224
Figure 314 Satisfaction with using websiteapp by choice to go onlineCustomers were asked ldquoHow satisfied were you with the overall experience of using the websiteapp to complete the taskrdquo
n=843 n=220
Consumer (n=822) Business (n=218)
uarr1 darr2
24
Consumersbull 77 of consumers who used online methods chose to
go online themselves while 8 said there was no other option available to them
bull Consumers who chose to go online were more satisfied with the overall experience of using the websiteapp to complete the task (81 out of 10 ndash an increase of 03 points versus 2018)
bull There was an increase in satisfaction across all 3 types of online users ndash voluntary (78 in 2018) prompted to (72 in 2018) didnrsquot have any other option (68 in 2018)
Businessesbull Businesses saw a 7 points increase in those choosing
to go online This was due to a 5 point decrease in those saying they had no other choice and 2 point decrease in those saying they were directed to or were prompted to go online
bull Businesses who chose to go online saw a 09 point increase in satisfaction versus last year (8 out of 10 in 2019 vs 71 out of 10 In 2018)
bull Even those who said they had no other option showed higher satisfaction of 62 out of 10 (+07 points vs 2018)
uarr7
Consumer Business
darr1
darr5
CUSTOMER CHOICE TO USE ONLINE SERVICES77 of consumers and 74 of businesses chose to go online to access government services and they have the highest satisfaction
60
Source Customer Service Commission Customer Satisfaction Measurement Survey 2019 Report developed in conjunction with the NSW Customer Service CommissionerPublic I1-A2
50 4640
17
31
52 53
10
Smartphone Laptop computer Desktop computer TabletiPad
Consumer (n=843)Business (n=220)
Customers were asked ldquoWhat devices did you use to access the online content Please select all contact methods that applyrdquo
Figure 315 Devices used when dealing with SA Government services online
Figure 316 Satisfaction with online services by device used Customers were asked ldquoHow satisfied were you with the overall experience of using the websiteapp to complete the taskrdquo
re
spon
dent
s
77
79 798080
74
80
76
Smartphone Laptop computer Desktop computer TabletiPad
Consumer (n=822)Business (n=218)
Aver
age
satis
fact
ion
(out
of 1
0)
Consumer Business
Consumersbull While most consumers (50) used smartphones
to access online content their satisfaction levels with their experience was lower (77 out of 10) compared to those who used desktops or laptops to access online content (79 out of 10)
bull Few consumers are using tabletsiPad (17) but those that do have high levels of satisfaction (8 out of 10)
Businessesbull Most businesses used laptops (52) or desktops
(53) to access online content Desktop users had a higher overall satisfaction (8 out of 10) compared to laptop users (74 out of 10)
bull In contrast to consumers only 31 of businessesused smartphones to access content online however they had higher levels of satisfaction with the overall experience (8 out of 10)
DEVICE USED BY CUSTOMERS FOR ONLINE SERVICESMost consumers used smartphones but the satisfaction levels of those who used smartphones was lower than users of other channels Fewer businesses used smartphones but those that did showed higher levels of satisfaction
61
Public ndash I1-A2
SOUTH AUSTRALIAN CUSTOMER SATISFACTION MEASUREMENT SURVEY 2019
4 PUBLIC SERVICE OVERALL
Source Customer Service Commission Customer Satisfaction Measurement Survey 2019 Report developed in conjunction with the NSW Customer Service CommissionerPublic I1-A2
Customers were asked ldquoThinking about all your experiences with each of the following Australian industries and public services over the previous 12 months how satisfied would you say you are with them rdquo
Figure 41 Satisfaction with SA Public Service overall compared to industries
bull Average satisfaction with the SA Public Service lsquobrandrsquo is 66 for both consumers and businesses ndashrelatively stable versus last year
bull Both consumers and businesses continue to rate SA Public Service lsquobrandrsquo higher than most other industries and public services except airlines
bull Satisfaction with SA Government services continues to be higher than satisfaction with the lsquobrandrsquo for both consumers and businesses This suggests a continued disconnect between service delivery and lsquobrandrsquo perceptions that are influenced by a range of factors such as media and reputation
+02
31
27
22
23
21
14
8
30
34
30
30
28
30
28
39
40
47
47
51
56
64
56
57
61
61
62
66
70
Energy Retailers(n=485)
FederalGovernment
(n=465)
My local council(n=477)
Banks (n=486)
Telephone ServProviders(n=477)
SA PublicService overall
(n=484)
Airlines (n=457)
Dissatisfied (1-4) Neutral (5-6) Satisfied (7-10)
respondents Avg
Business (n=457) respondents Avg
Consumer (n=1649)
7375 00 +01
+03
+01
+01
+02
+03
+02
+02
+02
+10
+04
+05
+05
+0636
35
27
25
24
15
9
26
28
26
27
26
27
24
38
37
47
49
49
59
67
53
54
59
60
61
66
71
FederalGovernment
(n=1835)
EnergyRetailers(n=1924)
Banks(n=1934)
My local council(n=1876)
Telephone ServProviders(n=1930)
SA PublicService overall
(n=1915)
Airlines(n=1649)
Dissatisfied (1-4) Neutral (5-6) Satisfied (7-10)
SA Government Services
Average satisfaction
Consumer Business
Legend Statistically significant increase in avg from 2018 (at 99 level of Confidence)No significant change in avg from 2018 (at 99 level of Confidence)Statistically significant decrease in avg from 2018 (at 99 level of Confidence)
Consumer Business
Note scores are subject to rounding and may not sum to 100
PERCEPTIONS OF THE SA PUBLIC SERVICE lsquoBRANDrsquoBoth consumers and businesses rate the SA Public Services lsquobrandrsquo higher than all other industries and public services with the exception of airlines
63
Source Customer Service Commission Customer Satisfaction Measurement Survey 2019 Report developed in conjunction with the NSW Customer Service CommissionerPublic I1-A2
bull NSW Public Service lsquobrandrsquo has the most positive perception amongst consumers Whereas the Public Service lsquobrandsrsquo in SA is second only to Airlines as with QLD and VIC
bull Businesses also have similar perceptions of the Public Service lsquobrandrsquo across all jurisdictions In Australia the average satisfaction ratings are second to airlines Whereas in UK and NZ airlines and banks have higher average satisfaction ratings
Lowest
Highest
Avg
sat
isfa
ctio
n (b
usin
esse
s)
NZ
NZ Govt Service 68
Banks 69
Energy 66
Local council 58
Airlines 74
Telcorsquos 65
NSW
Airlines 71
NSW Public Service 69
Banks 60
Energy 57
Telcorsquos 60
Local council 61
Fed Govt 60
QLD
Airlines 71
QLD Public Service 67
Telcorsquos 61
Local council 61
Banks 57
Energy 57
Fed Govt 58
VIC
Airlines 71
VIC Public Service 65
Banks 58
Energy 57
Local council 59
Fed Govt 57
Telcorsquos 60
SA
Airlines 70
Telcorsquos 62
SA Public Service 66
Banks 61
Energy 56
Local council 61
Fed Govt 57
UK
Airlines 70
Telcorsquos 66
Energy 63
UK Public Service 68
Local Council 61
Banks 68
Business
Figure 42 Comparison of Public service brand perceptions across jurisdictionsCustomers were asked ldquoThinking about all your experiences with each of the following [jurisdiction] industries and public services over the previous 12 months how satisfied would you say you are with them rdquoConsumer
NZ
NZ Govt Service 69
Banks 69
Airlines 74
Telcorsquos 66
Energy 66
Local council 59
NSW NSW
Public Service 71
Airline 71
Telcorsquos 62
Energy 59
Local council 62
Banks 61
Fed Govt 57
QLD
Airlines 70
QLD Public Service 69
VIC SA
Airlines 71
Telcorsquos 61
SA Public Service 66
Local council 60
Banks 59
Energy 54
Fed Govt 53
UK
Airlines 71
UK Public Service 69
Banks 69
Energy 64
Telcorsquos 69
Local council 61
Consumer Business
Lowest
Highest
Avg
sat
isfa
ctio
n (c
onsu
mer
s)
Airlines 71
Telcorsquos 63
VIC Public Service 70
Banks 63
Local council 62
Energy 60
Fed Govt 59
Telcorsquos 62
Local council 62
Banks 60
Energy 59
Fed Govt 58
PUBLIC SERVICE lsquoBRANDrsquo COMPARISON BY JURISDICTIONAustralian jurisdictions perform better than NZ and UK in perceptions of their public service lsquobrandsrsquo for both consumers andbusinesses relative to other industries
64
Source Customer Service Commission Customer Satisfaction Measurement Survey 2019 Report developed in conjunction with the NSW Customer Service CommissionerPublic I1-A2
Respondents were asked to select from a list of positive and negative descriptors of SA Public Service bull The top five descriptors of the SA Public Service
overall were all positive and consistent with 2018
bull The most commonly selected negative brand descriptors are lsquoinefficientrsquo lsquoimpersonalrsquo lsquoinflexiblersquo and lsquodifficultrsquo This pattern is similar to 2018
0
10
20
30
40Innovative
Motivated
Modern
Flexible
Accountable
Caring
EfficientHonest
Respectful
Knowledgeable
Capable
Friendly
Helpful
Figure 43 Positive Descriptors of the SA Public Service overall - Consumer
Customers were asked ldquoThinking now about the SA Public Service overall and all of the services and agencies which fall under it which of the following words would you use to describe the SA Public Service rdquo
0
10
20
30
40Lazy
Controlling
Patronising
Outdated in digitalservices
Complacent
Wasteful
Inflexible
Difficult
Impersonal
Inefficient
2018 Consumer (n=1999) 2019 Consumer (n=1998)
Figure 44 Negative Descriptors of the SA Public Service overall -Consumer
Top 5 descriptors
Consumer
CONSUMER DESCRIPTIONS OF THE SA PUBLIC SERVICE lsquoBRANDrsquoThe top 5 descriptors used by consumers to describe SA Public Service are lsquohelpfulrsquo lsquofriendlyrsquo lsquocapablersquo lsquoknowledgeablersquo and lsquorespectfulrsquo
65
Source Customer Service Commission Customer Satisfaction Measurement Survey 2019 Report developed in conjunction with the NSW Customer Service CommissionerPublic I1-A2
0
10
20
30
40
Outdated in digitalservices
Patronising
Lazy
Controlling
Complacent
Difficult
Inflexible
Impersonal
Wasteful
Inefficient
2018 Business (n=551) 2019 Business (n=502)
bull In contrast to last year businesses have described SA Public services more positively this year
bull All positive attributes have seen an increase in proportion of responses with the exception of lsquoinnovativersquo (-2 points vs last year) and lsquoaccountablersquo (-2 points vs last year)
bull The top 5 descriptors are lsquohelpfulrsquo (+6 points vs last year) lsquofriendlyrsquo (+4 points vs last year) lsquocapablersquo (+9 points vs last year) lsquoknowledgeablersquo (+3 points vs last year) and lsquorespectfulrsquo (+3 points vs last year)
bull Conversely all negative attributes have seen a decrease in proportion of responses compared to last year
0
10
20
30
40Innovative
Motivated
Modern
Flexible
Caring
Accountable
EfficientHonest
Respectful
Knowledgeable
Capable
Friendly
Helpful
Figure 45 Positive descriptors of the SA Public Service overall - business
Businesses were asked ldquoThinking now about the SA Public Service overall and all of the services and agencies which fall under it which of the following words would you use to describe the SA Public Service rdquo
Figure 46 Negative descriptors of the SA Public Service overall - business
Top 5 descriptors
Business
BUSINESS DESCRIPTIONS OF THE SA PUBLIC SERVICE lsquoBRANDrsquoThe top 5 descriptors used by businesses to describe SA Public Service are lsquohelpfulrsquo lsquofriendlyrsquo lsquocapablersquo lsquoknowledgeablersquo andlsquorespectfulrsquo
66
Public ndash I1-A2
SOUTH AUSTRALIAN CUSTOMER SATISFACTION MEASUREMENT SURVEY 2019
5 FEEDBACK
Source Customer Service Commission Customer Satisfaction Measurement Survey 2019 Report developed in conjunction with the NSW Customer Service CommissionerPublic I1-A2
NATURE OF FEEDBACK AND FEEDBACK CHANNELSProcesses are the most common source of complaints while employees are a more common source of compliments
68
Consumersbull Processes are the most common source of
complaints Consumers also complain about outcomes of their interactions
bull Compliments mainly relate to interactions with employees
bull Both complaints and compliments are mainly made in person whereas consumers take to emails to make suggestions for change
Businessesbull Complaints and suggestions are mainly made
about processes and outcomes of interactions
bull Compliments most often relate to the information available to businesses
bull As with consumers businesses complain or compliment mostly in-person
bull Businesses also use email to give compliments and emails are the preferred method to make suggestions
11
44
28
16
2
42
14
23
18
3
32
17
28
12
11
Theprocesses
Theemployees
youinteracted
with
Theoutcomes of
yourinteraction
Informationavailable to
you
Other
I gave a compliment I made a suggestion for change I made a complaint
22
22 26
30
0
47
17
14
22
0
36
18
33
13
0
Theprocesses
Theemployees
youinteracted
with
Theoutcomes of
yourinteraction
Informationavailable to
you
Other
Figure 51 Nature of feedback by feedback typeQuestion ldquoWhat did your feedback primarily relate to rdquo
Consumer (n = 519) Business (n = 192)
2242
30
5233
38
17 1416
4 6 105 4 5
I gave acompliment
I made asuggestion for
change
I made acomplaint
37 41 37
37 29 45
5 19921 11 5
04
I gave acompliment
I made asuggestion for
change
I made acomplaint
bull Other
bull Via postal letter
bull Via servicersquos website
bull In person face to face or via the phone
bull Via email
Figure 52 Nature of feedback and feedback channelsQuestion ldquoHow did you provide your feedbackrdquo
Consumer (n=519) Business (n=194)
Consumer Business
Source Customer Service Commission Customer Satisfaction Measurement Survey 2019 Report developed in conjunction with the NSW Customer Service CommissionerPublic I1-A2
37
44
3538
45
4041
3633
4036
42
21 20
31
2219 18
NSW (n=529) VIC (n=186) QLD (n=184) UK (n=456) SA (n=194) NZ (n=215)
Complaint Suggestion for change Compliment
28 28 29
33 33
2829
37
27 28 28
33
43
35
44
39 39 39
NSW (n=1203) VIC (n=569) QLD (n=528) UK (n=619) SA (n=519) NZ (n=520)
Complaint Suggestion for change Compliment
Figure 53 Overall satisfaction with Government services by contact method(s) used across jurisdictions
o
ffee
dbac
k ev
er re
ceiv
ed
of f
eedb
ack
ever
rece
ived
Consumer (Base Consumers in each jurisdiction who ever provided feedback)
Business (Base Businesses in each jurisdiction who ever provided feedback)
Consumer Business
JURISDICTIONAL COMPARISON OF NATURE OF FEEDBACKOf all jurisdictions SA received the highest proportion of complaints from both consumers and businesses
Consumersbull Compliments form the highest
proportion of all feedback received across all jurisdictions except VIC
bull Across jurisdictions SA and UK received the highest proportion of complaints
bull QLD was the jurisdiction to receive the highest proportion of compliments closely followed by NSW
Businessesbull Unlike consumers complaints and
suggestions form most of the feedback received from businesses
bull SA received the highest proportion of complaints Closely followed by VIC
bull QLD was the jurisdiction where businesses gave the highest proportion of compliments
69
Source Customer Service Commission Customer Satisfaction Measurement Survey 2019 Report developed in conjunction with the NSW Customer Service CommissionerPublic I1-A2
41
23
36
handled poorly (1-4)2neutral (5-6)Handled well (7-10)
Consumersbull Most consumers who gave feedback
(39) gave a compliment
bull Complaints make up 33 of all feedback This is consistent with last year
bull Of consumers who complained 41 said their complaint was handled poorly However this is an improvement from last year where 54 had said their feedback was handled poorly
Businessesbull In contrast the proportion of feedback
from businesses that were complaints went up to 42 from 27 last year
bull Of this 44 said their feedback was handled poorly ndash up from 38 in the last year
23
35
42
39
28
33
bull I gave a compliment
bull I made a suggestion for change
bull I made a complaint
Consumer (n=519)
Business (n=194)
Figure 5455 Complaint handling of consumers and businessesQuestion ldquoHow well or poorly was your most recent complaint handledFigure 56 Proportion of feedback types for consumers and businessesQuestion ldquoWhat was the nature of your feedbackrdquo
Base n=169 consumers who made a complaint
Base n=83 businesses who made a complaint
Base n=519 consumers and n=194 businesses who ever
provided feedback
Figure 56 Figure 55Figure 54
Consumer Business
44
24
32
handled poorly (1-4)2neutral (5-6)Handled well (7-10)
COMPLAINT HANDLING EXPERIENCE41 of consumers and 44 of businesses said their complaints had been handled poorly
70
Source Customer Service Commission Customer Satisfaction Measurement Survey 2019 Report developed in conjunction with the NSW Customer Service CommissionerPublic I1-A2
Customers were asked ldquoHow well or poorly was your most recent complaint handledrdquo
Figure 57 Variation in complaints handling across jurisdictions
Consumer
Business
Consumersbull VIC had the highest proportion of positive
ratings from consumers in relation to complaints handling (44 rated 7-10 out of 10) SA was second with 36 of complaints being handled well
bull The average rating was neutral (52 out of 10) ndash an improvement of 08 points compared to last year (44 out of 10) This was second highest behind VIC
Businessesbull The average rating was just below neutral at
49 out of 10 However this is an improvement of 02 points compared to last year (47 out of 10)
bull Of the Australian jurisdictions SA has the lowest proportion of poorly handled complaints and the highest average rating
bull UK has the lowest proportion of poorly handled complaints and the highest average rating of 53 out of 10 of all jurisdictions
39 41 41 46 50 55
17 2325
23 23 17
44 36 34 30 28 28
5652
50
48 45 43
1
10
0
50
100
VIC(n=154)
SA(n=169)
UK(n=196)
NZ(n=138)
QLD(n=140)
NSW(n=314)
Handled poorly (1-4) Neutral (5-6) Handled well (7-10) Average
Axis
1
Perc
enta
ge o
f re
spon
ses
Axis 2 Average score
35 44 49 45 50 52
24 2415
3418 22
41 32 3621
32 26
53 49
49
48 46 45
1
10
0
50
100
UK(n=174)
SA(n=83)
QLD(n=72)
VIC(n=69)
NSW(n=184)
NZ(n=76)
Handled well (7-10) Neutral (5-6) Handled poorly (1-4) Average
Axis
1
Perc
enta
ge o
f re
spon
ses
Axis 2 Average score
Responses were provided according to a scale from 1 (handled very poorly) to 10 (handled very well)
Consumer Business
COMPARISON OF PERFORMANCE IN COMPLAINTS MANAGEMENT ACROSS JURISDICTIONSFor consumers SA had the second highest proportion of complaints being handled well behind VIC For businesses SA had the lowest proportion of poorly handled complaints compared to all jurisdictions
71
Source Customer Service Commission Customer Satisfaction Measurement Survey 2019 Report developed in conjunction with the NSW Customer Service CommissionerPublic I1-A2
Customers were asked ldquoHow well or poorly was your most recent complaint handledrdquo
Figure 58 Variation in complaints handling by region
Consumer
Business
bull In metro areas over 40 of both consumers and businesses rated their complaints as being handled poorly (1-4 out of 10)
bull Sample sizes for both consumers and businesses in rural and regional SA are too small to be statistically representative and cannot be evaluated meaningfully
4626 22
17 41
44
37 32 34
50 56
58
1
10
0
50
100
Metro(n=139)
Regional(n=14)
Rural(n=16)
Handled poorly (1-4) Neutral (5-6) Handled well (7-10) Average
Axis
1
Perc
enta
ge o
f re
spon
ses
Axis 2 Average score
45
100
29
28
57
47
11
66
1
10
0
50
100
Metro(n=67)
Regional(n=4)
Rural(n=12)
Handled well (7-10) Neutral (5-6) Handled poorly (1-4) Average
Axis
1
Perc
enta
ge o
f re
spon
ses
Axis 2 Average score
Responses were provided according to a scale from 1 (handled very poorly) to 10 (handled very well)Note interpret with caution when sample size is lower than n =30
Consumer Business
COMPARISON OF PERFORMANCE IN COMPLAINTS MANAGEMENT BY REGION46 of consumers and 45 of businesses in Metro areas say their complaints were handled poorly
72
Source Customer Service Commission Customer Satisfaction Measurement Survey 2019 Report developed in conjunction with the NSW Customer Service CommissionerPublic I1-A2
Customers were asked ldquoHow difficult or easy was it to make your complaintrdquoFigure 59 Variation in ease of making a complaint across jurisdictions
Consumer
Business
Consumersbull 51 of consumers who made a complaint said it was
easy to do so (7-10 out of 10) This is an improvement from 34 in 2018
bull The average rating was neutral (61 out of 10) This is an improvement of 08 points compared to last year (53 out of 10 in 2018)
bull VIC had the highest proportion of consumers saying it was easy to make a complaint (56) Whereas NSW was the jurisdiction with the lowest proportion of consumers saying so (47)
Businessesbull 46 of businesses in SA who made a complaint said it
was easy to do so (7-10 out of 10) This is an improvement from 37 in 2018
bull 36 rated it as difficult (1-4 out of 10) ndash this is 2 points higher than last year (34) and makes SA the jurisdiction with the second highest proportion of lsquodifficultrsquo ratings behind QLD
bull Improvement in the proportion of businesses rating the process as lsquoeasyrsquo has pushed the average rating to 55 out of 10 (vs 47 out of 10 last year) However SA continues to be the jurisdiction with the lowest rating as other jurisdictions have also seen an improvement in their average rating
26 28 29 31 31 33
18 21 18 19 23 26
5651 54 50
47 4065 61 61 59 58 56
1
10
0
50
100
VIC(n=159)
SA(n=174)
NZ(n=148)
UK(n=199)
NSW(n=333)
QLD(n=150)
Easy (7-10) Neutral (5-6) Difficult (1-4) Average
21 28 25 31 37 36
30 19 29 24 31 17
4953 46 45 33
4662 61 59 58 55 55
1
10
0
50
100
NZ(n=78)
UK(n=176)
VIC(n=70)
NSW(n=188)
QLD(n=74)
SA(n=83)
Easy (7-10) Neutral (5-6) Difficult (1-4) Average
Responses were provided according to a scale from 1 (very difficult) to 10 (very easy)
Axis 2 Average scoreAxis 2 Average score
Axis
1
Perc
enta
ge o
f re
spon
ses
Axis
1
Perc
enta
ge o
f re
spon
ses
Consumer Business
COMPARISON OF PERFORMANCE IN EASE OF MAKING A COMPLAINT ACROSS JURISDICTIONSIn SA 51 of consumers said it was easy to make a complaint 46 of businesses echoed the sentiment ndash an improvement from 37 last year
73
Source Customer Service Commission Customer Satisfaction Measurement Survey 2019 Report developed in conjunction with the NSW Customer Service CommissionerPublic I1-A2
10
1
1
1
1
1
1
1
2
2
2
3
3
3
3
4
5
5
5
6
8
8
12
13
Other (n=57)
State Emergency Services (n=4)
Agricultural Advice and Fundinghellip
Environment and Wildlifehellip
Business Advisory Services (n=2)
Prisons (n=4)
Fire Brigades (n=4)
Child Welfare Services (n=9)
Courts (n=10)
Art Galleries and Museumshellip
Documentation Services (n=9)
Consumer Affairs (Fair Trading)hellip
Ambulance Services (n=17)
TAFE Services (n=23)
Services for Older People (n=20)
Major Roads (n=26)
Public Housing (n=25)
Disability Services (n=29)
Police (n=27)
Public Schools (n=33)
Water Supply (n=45)
Vehicle Licensing andhellip
Public Transport (n=63)
Public Hospitals (n=81)
13
1
1
1
1
1
2
2
2
2
3
3
5
5
5
5
6
6
7
7
9
15
Other (n=26)
Art Galleries (n=1)
Prisons (n=2)
Business Adv Serv (n=2)
Environ Protectn (n=5)
Ambulance Services (n=3)
Agri Advice and Funding (n=2)
Courts (n=4)
Vehicle Licensing amp Reg (n=8)
Child Welfare Services (n=5)
Documentation Services (n=3)
Disability Services (n=10)
Police (n=14)
TAFE Services (n=14)
Serv for Older (n=7)
Major Roads (n=11)
Public Transport (n=16)
Public Housing (n=8)
Public Hospitals (n=16)
Public Schools (n=8)
Consumer Affairs (n=12)
Water Supply (n=25)
Consumersbull Similar to last year Public Hospitals Public
Transport and Vehicle Licensing and Registration accounted for 30 of the most recent complaints received
bull Public Hospitals saw an increase of 1 points and Public Transport saw an increase of 2 points versus last year
bull Complaints to Vehicle Licensing declined by 2 points
Businessesbull Water Supply continued to receive the most
complaints and showed an increase of 3 points versus last year
Note that sample sizes are low for these services and while results may not be statistically representative they indicate potential trends to be investigated more robustly
Figure 512 Volume of complaints across servicesCustomers that had made a complaint in the past were asked ldquoWhich SA Government Department or Agency did you most recently complain tordquo
respondents respondentsConsumer Business
Note interpret with caution when sample size is lower than n =30 All businesses results have been provided for indicative purposes only as the sample size for all services is lt30
Data unavailable as nlt10
Consumer Business
VARIATION IN COMPLAINTS ACROSS SA GOVERNMENT SERVICESPublic Hospitals receive the highest proportion of complaints from consumers and Water Supply receive the highest proportion ofcomplaints from businesses
74
Public ndash I1-A2
SOUTH AUSTRALIAN CUSTOMER SATISFACTION MEASUREMENT SURVEY 2019
The data in this chapter compares the perceptions of SA government services Where sample sizes for segments are low (lt30) data is provided for indicative purposes only
APPENDIX 1ANALYSIS BY SERVICE
Source Customer Service Commission Customer Satisfaction Measurement Survey 2019 Report developed in conjunction with the NSW Customer Service CommissionerPublic I1-A2
Consumer
91 9087 87
8076 76 75 74 74 73 73 73 73 73
70 68 66 65 63 63
54
45
10
20
30
40
50
60
70
80
90
100
0
25
50
75
100
Fire
Brig
ades
(n=2
4)
Stat
e Em
erge
ncy
Serv
ices
(n=4
7)
Ambu
lanc
e Se
rvic
es (n
=208
)
Art G
alle
ries
and
Mus
eum
s (n
=121
)
Vehi
cle
Lice
nsin
g an
d R
egis
tratio
n (n
=580
)
Publ
ic S
choo
ls (n
=228
)
Wat
er S
uppl
y (n
=240
)
Polic
e (n
=217
)
Publ
ic H
ospi
tals
(n=4
12)
Publ
ic T
rans
port
(n=3
90)
Con
sum
er A
ffairs
(n=3
8)
Doc
umen
tatio
n Se
rvic
es (n
=42)
Envi
ronm
ent a
nd W
ildlif
e Pr
otec
tion
(n=3
8)
Busi
ness
Adv
isor
y Se
rvic
es (n
=17
)
Serv
ices
for O
lder
Peo
ple
(n=1
14)
TAFE
Ser
vice
s (n
=126
)
Agric
ultu
ral A
dvic
e an
d Fu
ndin
g Se
rvic
es (n
=13
)
Dis
abilit
y Se
rvic
es (n
=100
)
Maj
or R
oads
(n=8
6)
Publ
ic H
ousi
ng (n
=87)
Cou
rts (n
=94)
Pris
ons
(n=2
3)
Chi
ld W
elfa
re S
ervi
ces
(n=5
2)
Dissatisfied (1-4) Neutral (5-6) Satisfied (7-10) Average
Axis
1
Perc
enta
ge o
f res
pons
es
Axis 2 Average Score
Figure 1 Variation in consumersrsquo satisfaction across SA Government Services
Customers were asked ldquoThinking about your experiences in the last 12 months how satisfied would you say you are with each of the following services in SArdquo
VARIATION IN CONSUMERSrsquo SATISFACTION ACROSS SERVICESAcross SA Government services consumersrsquo satisfaction is highest for Fire Brigades State Emergency Services Ambulance Services and Art Galleries and Museums
Average SA consumer satisfaction ndash 75 (n=3297)
Note Interpret with caution Very small number of responses (nlt=30) 76
Source Customer Service Commission Customer Satisfaction Measurement Survey 2019 Report developed in conjunction with the NSW Customer Service CommissionerPublic I1-A2
Consumer
Figure 2 Variation in customersrsquo expectation across SA Government Services
Customers were asked ldquoThinking about each of the following services in SA how would you rate your expectation of overall quality of servicerdquo
VARIATION IN CONSUMERSrsquo EXPECTATION ACROSS SERVICESConsumers have higher expectations of overall service quality from Fire Brigade State Emergency Services Ambulance Services and Art Galleries amp Museums This is consistent with the high satisfaction ratings these services have
93 91 90 88
8279 78 78 77 77 77 76 76 75 73 72 71 70 70 70 67 67
52
1
2
3
4
5
6
7
8
9
10
0
25
50
75
100
Fire
Brig
ades
(n=2
4)
Stat
e Em
erge
ncy
Serv
ices
(n=4
5)
Ambu
lanc
e Se
rvic
es (n
=205
)
Art G
alle
ries
and
Mus
eum
s (n
=121
)
Vehi
cle
Lice
nsin
g an
d R
egis
tratio
n (n
=574
)
Publ
ic S
choo
ls (n
=223
)
Polic
e (n
=216
)
Wat
er S
uppl
y (n
=234
)
Con
sum
er A
ffairs
(n=3
7)
Publ
ic H
ospi
tals
(n=4
08)
Serv
ices
for O
lder
Peo
ple
(n=1
13)
Doc
umen
tatio
n Se
rvic
es (n
=42)
Publ
ic T
rans
port
(n=3
83)
Envi
ronm
ent a
nd W
ildlif
e Pr
otec
tion
(n=3
7)
Busi
ness
Adv
isor
y Se
rvic
es (n
=17
)
TAFE
Ser
vice
s (n
=125
)
Maj
or R
oads
(n=8
1)
Cou
rts (n
=89)
Agric
ultu
ral A
dvic
e an
d Fu
ndin
g Se
rvic
es (n
=13
)
Dis
abilit
y Se
rvic
es (n
=96)
Pris
ons
(n=2
1)
Publ
ic H
ousi
ng (n
=86)
Chi
ld W
elfa
re S
ervi
ces
(n=5
1)
Low (1-4) Medium (5-6) High (7-10) Average
Axis
1
Perc
enta
ge o
f res
pons
es
Axis 2 Average Score
Average SA consumer expectation ndash 78 (n=3241)
Note Interpret with caution Very small number of responses (nlt=30) 77
Source Customer Service Commission Customer Satisfaction Measurement Survey 2019 Report developed in conjunction with the NSW Customer Service CommissionerPublic I1-A2
VARIATION IN CONSUMERSrsquo COMPARISON TO AN IDEAL SERVICE ACROSS SERVICESConsumers perceive State Emergency Services Fire Brigades Ambulance Services and Art Galleries and Museums to be performing closest to an ideal service This is consistent with findings relating to satisfaction and expectation
Figure 3 Consumersrsquo comparison to an ideal service across services
Customers are asked ldquoNow forgetting for a moment these specific services please imagine an ideal service How well do you think each service in SA compares with that ideal servicerdquo
9086 85 83
77 76 75 74 73 73 71 69 69 69 67 67 66 6459 59 57
54
44
1
2
3
4
5
6
7
8
9
10
0
25
50
75
100
Stat
e Em
erge
ncy
Serv
ices
(n=4
6)
Fire
Brig
ades
(n=2
3)
Ambu
lanc
e Se
rvic
es (n
=205
)
Art G
alle
ries
and
Mus
eum
s (n
=119
)
Vehi
cle
Lice
nsin
g an
d R
egis
tratio
n (n
=560
)
Busi
ness
Adv
isor
y Se
rvic
es (n
=17
)
Polic
e (n
=207
)
Doc
umen
tatio
n Se
rvic
es (n
=42)
Publ
ic S
choo
ls (n
=216
)
Agric
ultu
ral A
dvic
e an
d Fu
ndin
g Se
rvic
es (n
=12
)
Wat
er S
uppl
y (n
=226
)
Publ
ic T
rans
port
(n=3
80)
Publ
ic H
ospi
tals
(n=3
97)
TAFE
Ser
vice
s (n
=122
)
Con
sum
er A
ffairs
(n=3
6)
Serv
ices
for O
lder
Peo
ple
(n=1
09)
Envi
ronm
ent a
nd W
ildlif
e Pr
otec
tion
(n=3
7)
Dis
abilit
y Se
rvic
es (n
=96)
Cou
rts (n
=89)
Publ
ic H
ousi
ng (n
=82)
Maj
or R
oads
(n=8
1)
Pris
ons
(n=1
9)
Chi
ld W
elfa
re S
ervi
ces
(n=5
1)
Not close to ideal (1-4) Neutral (5-6) Very close to ideal (7-10) Average
Axis
1
Perc
enta
ge o
f res
pons
es
Axis 2 Average Score
Average SA consumer ideal ndash 72 (n=3172)
Consumer
Note Interpret with caution Very small number of responses (nlt=30) 78
Source Customer Service Commission Customer Satisfaction Measurement Survey 2019 Report developed in conjunction with the NSW Customer Service CommissionerPublic I1-A2
VARIATION IN CONSUMERSrsquo ldquoEXPECTATION GAPrdquo ACROSS SERVICESAcross all services consumers have a negative ldquoexpectation gaprdquo
-13
-07
-07
-07
-04
-04
-04
-03
-03
-03
-03
-03
-03
-03
-03
-02
-02
-02
-02
-02
-01
-01
00
-15 -1 -05 0 05 1 15
Prisons (n=21)
Courts (n=89)
Child Welfare Services (n=51)
Major Roads (n=81)
Services for Older People (n=113)
Consumer Affairs (n=37)
Public Housing (n=86)
Police (n=216)
Documentation Services (n=42)
Public Schools (n=223)
Ambulance Services (n=205)
Disability Services (n=96)
Public Hospitals (n=408)
Environment and Wildlife Protection (n=37)
TAFE Services (n=125)
Agricultural Advice and Funding Services (n=13)
Fire Brigades (n=24)
Water Supply (n=234)
Art Galleries and Museums (n=121)
Public Transport (n=383)
Vehicle Licensing and Registration (n=574)
Business Advisory Services (n=17)
State Emergency Services (n=45)
Figure 4 Consumer gap to expectation by servicesThe gap between satisfaction and expectation provides an understanding of how customers perceive their recent experience compares to expectationsThe gap to expectation is calculated individually for each customers as Gap = satisfaction score ndash expectation score
Consumer
Note Interpret with caution Very small number of responses (nlt=30)
79
Source Customer Service Commission Customer Satisfaction Measurement Survey 2019 Report developed in conjunction with the NSW Customer Service CommissionerPublic I1-A2
91 9187
82 80 80 7975 74 74 74 74 74 72 72 71 71 70 69 67 66
6155
1
2
3
4
5
6
7
8
9
10
0
25
50
75
100
Fire
Brig
ades
(n=1
5)
Ambu
lanc
e Se
rvic
es (n
=24
)
Stat
e Em
erge
ncy
Serv
ices
(n=1
3)
Art G
alle
ries
and
Mus
eum
s (n
=13
)
Doc
umen
tatio
n Se
rvic
es (n
=17
)
Polic
e (n
=35)
Pris
ons
(n=1
4)
Con
sum
er A
ffairs
(n=2
7)
Envi
ronm
ent a
nd W
ildlif
e Pr
otec
tion
(n=1
9)
Maj
or R
oads
(n=1
1)
Dis
abilit
y Se
rvic
es (n
=34)
Wat
er S
uppl
y (n
=67)
Cou
rts (n
=19
)
Publ
ic T
rans
port
(n=4
7)
Busi
ness
Adv
isor
y Se
rvic
es (n
=35)
Vehi
cle
Lice
nsin
g an
d R
egis
tratio
n (n
=135
)
Serv
ices
for O
lder
Peo
ple
(n=2
8)
Chi
ld W
elfa
re S
ervi
ces
(n=2
0)
Publ
ic H
ospi
tals
(n=7
6)
TAFE
Ser
vice
s (n
=36)
Publ
ic S
choo
ls (n
=51)
Agric
ultu
ral A
dvic
e an
d Fu
ndin
g Se
rvic
es (n
=10
)
Publ
ic H
ousi
ng (n
=16
)
Dissatisfied (1-4) Neutral (5-6) Satisfied (7-10) Average
Axis
1
Perc
enta
ge o
f res
pons
es
Axis 2 Average Score
Figure 5 Variation in businessesrsquo satisfaction across SA Government Services
Customers were asked ldquoThinking about your experiences in the last 12 months how satisfied would you say you are with each of the following services in SArdquo
Average SA business satisfaction ndash 73 (n=762)
VARIATION IN BUSINESSESrsquo SATISFACTION ACROSS SERVICES
Business
Note Interpret with caution Very small number of responses (nlt=30)
Of the services with sufficient sample size (ngt30) Police Disability Services and Water Supply have above average satisfaction scores
80
Source Customer Service Commission Customer Satisfaction Measurement Survey 2019 Report developed in conjunction with the NSW Customer Service CommissionerPublic I1-A2
Figure 6 Variation in businessesrsquo expectation across SA Government Services
Customers were asked ldquoThinking about each of the following services in SA how would you rate your expectation of overall quality of servicerdquo
VARIATION IN BUSINESSESrsquo EXPECTATION ACROSS SERVICESOf the services with sufficient (ngt30) sample sizes Police Disability Services Water Supply and Public Transport have above average expectation scores
91 90 8784 83 83 81 79 79 78 77 77 76 75 75 75 75 75 74 72 70 70 68
1
2
3
4
5
6
7
8
9
10
0
25
50
75
100
Fire
Brig
ades
(n=1
5)
Ambu
lanc
e Se
rvic
es (n
=24
)
Stat
e Em
erge
ncy
Serv
ices
(n=1
3)
Art G
alle
ries
and
Mus
eum
s (n
=13
)
Doc
umen
tatio
n Se
rvic
es (n
=17
)
Pris
ons
(n=1
3)
Polic
e (n
=35)
Dis
abilit
y Se
rvic
es (n
=33)
Cou
rts (n
=19
)
Envi
ronm
ent a
nd W
ildlif
e Pr
otec
tion
(n=1
9)
Con
sum
er A
ffairs
(n=2
7)
Wat
er S
uppl
y (n
=67)
Publ
ic T
rans
port
(n=4
7)
Vehi
cle
Lice
nsin
g an
d R
egis
tratio
n (n
=134
)
Serv
ices
for O
lder
Peo
ple
(n=2
8)
Busi
ness
Adv
isor
y Se
rvic
es (n
=35)
Maj
or R
oads
(n=1
1)
Chi
ld W
elfa
re S
ervi
ces
(n=2
0)
Agric
ultu
ral A
dvic
e an
d Fu
ndin
g Se
rvic
es (n
=10
)
Publ
ic H
ospi
tals
(n=7
5)
Publ
ic S
choo
ls (n
=51)
Publ
ic H
ousi
ng (n
=16
)
TAFE
Ser
vice
s (n
=36)
High (7-10) Medium (5-6) Low (1-4) Average
Axis
1
Perc
enta
ge o
f res
pons
esAxis 2 Average Score
Average SA business expectation ndash76 (n=758)
Business
Note Interpret with caution Very small number of responses (nlt=30)
81
Source Customer Service Commission Customer Satisfaction Measurement Survey 2019 Report developed in conjunction with the NSW Customer Service CommissionerPublic I1-A2
95
87 8580 80 78 78
75 73 73 73 71 71 70 70 70 69 69 6966 66 65
59
1
2
3
4
5
6
7
8
9
10
0
25
50
75
100
Fire
Brig
ades
(n=1
5)
Ambu
lanc
e Se
rvic
es (n
=23
)
Stat
e Em
erge
ncy
Serv
ices
(n=1
2)
Art G
alle
ries
and
Mus
eum
s (n
=13
)
Polic
e (n
=33)
Envi
ronm
ent a
nd W
ildlif
e Pr
otec
tion
(n=1
7)
Doc
umen
tatio
n Se
rvic
es (n
=17
)
Cou
rts (n
=18
)
Publ
ic T
rans
port
(n=4
5)
Pris
ons
(n=1
4)
Vehi
cle
Lice
nsin
g an
d R
egis
tratio
n (n
=132
)
Agric
ultu
ral A
dvic
e an
d Fu
ndin
g Se
rvic
es (n
=10
)
Busi
ness
Adv
isor
y Se
rvic
es (n
=34)
Wat
er S
uppl
y (n
=63)
TAFE
Ser
vice
s (n
=33)
Serv
ices
for O
lder
Peo
ple
(n=2
8)
Maj
or R
oads
(n=1
1)
Con
sum
er A
ffairs
(n=2
5)
Dis
abilit
y Se
rvic
es (n
=32)
Chi
ld W
elfa
re S
ervi
ces
(n=2
0)
Publ
ic H
ospi
tals
(n=7
3)
Publ
ic S
choo
ls (n
=48)
Publ
ic H
ousi
ng (n
=16
)
Not close to ideal (1-4) Neutral (5-6) Very close to ideal (7-10) Average
Figure 7 Businessesrsquo comparison to an ideal service across services
Customers are asked ldquoNow forgetting for a moment these specific services please imagine an ideal service How well do you think each service in SA compares with that ideal servicerdquo
VARIATION IN BUSINESSESrsquo COMPARISON TO AN IDEAL SERVICE ACROSS SERVICESOf the services with sufficient (ngt30) sample sizes Police Public Transport and Vehicle Licensing and Registration have above average scores of comparison to ideal service
Axis
1
Perc
enta
ge o
f res
pons
esAxis 2 Average Score
Average SA business ideal ndash 72 (n=732)
Business
Note Interpret with caution Very small number of responses (nlt=30)
82
Source Customer Service Commission Customer Satisfaction Measurement Survey 2019 Report developed in conjunction with the NSW Customer Service CommissionerPublic I1-A2
Figure 8 Business gap to expectation by servicesThe gap between satisfaction and expectation provides an understanding of how customers perceive their recent experience compares to expectations The gap to expectation is calculated individually for each customers as Gap = satisfaction score ndash expectation score
VARIATION IN BUSINESSESrsquo ldquoEXPECTATION GAPrdquo ACROSS SERVICES
-13-05
-05-05-05
-04-04-04
-03-03-03-03-03-03
-02-02
-01-01-01
0000
01
-15 -1 -05 0 05 1 15
Public Housing (n=16)Agricultural Advice and Funding Services (n=10)
Disability Services (n=33)Courts (n=19)
Child Welfare Services (n=20)Public Schools (n=51)
Services for Older People (n=28)Vehicle Licensing and Registration (n=134)
Environment and Wildlife Protection (n=19)Documentation Services (n=17)
Public Transport (n=47)Business Advisory Services (n=35)
Public Hospitals (n=75)Prisons (n=13)
Water Supply (n=67)Consumer Affairs (n=27)
Art Galleries and Museums (n=13)TAFE Services (n=36)
Major Roads (n=11)Police (n=35)
Fire Brigades (n=15)State Emergency Services (n=13)
Ambulance Services (n=24)
Business
Note Interpret with caution Very small number of responses (nlt=30)
Majority of services have a negative lsquoexpectation gaprsquo from businesses However the sample sizes are low and observations are only indicative
83
Source Customer Service Commission Customer Satisfaction Measurement Survey 2019 Report developed in conjunction with the NSW Customer Service CommissionerPublic I1-A2
Average score higherlower compared to overall SA average
VARIATION IN CONSUMERSrsquo VIEWS OF EMPLOYEE PERFROMANCE ACROSS SERVICES
Customers are asked ldquoThinking now about its employees to what extent do you agree or disagree that each of the following statements describes [a particular government service] in SArdquo
Figure 9 Performance of SA Government Services against each of the employee attributes
Responses were provided according to a scale from 1 (strongly disagree) to 10 (strongly agree) The average score against each attribute by service is tabulated Note this analysis represents consumer data only
Base Consumers (n=2727)
Note Very small number of responses (nlt=30)
Services
Honesty and Integrity of Employees Efficiency and Effectiveness Communication of Employees Fairness and Empathy of employees
Are honest
Deliver high safety standards
Provide good value
services
Are reliable
Get things done as quickly as
possible
Held Accountable
Explain intended
actions clearlyAre consistent
Engender confidence in
their knowledge
Communicate well
Provide services
without bias
See things from my perspective
Agricultural Advice and Funding Services 80 71 80 74 74 82 74 79 74 81 68 68
Ambulance Services 92 92 88 89 90 87 90 89 90 90 92 84Art Galleries and Museums 87 87 87 85 79 81 83 84 84 85 84 81Business Advisory Services 73 72 69 76 70 70 74 73 73 75 69 66Child Welfare Services 53 55 50 47 43 50 53 45 51 55 52 50Consumer Affairs 74 71 71 71 64 67 74 74 73 72 73 66Courts 71 72 64 67 59 60 73 64 72 74 71 60Disability Services 71 67 63 63 56 58 64 61 65 65 68 63Documentation Services 78 77 69 72 62 69 70 71 73 71 76 67Environment and Wildlife Protection 70 71 69 70 65 66 65 76 68 73 69 66Fire Brigades 93 96 95 94 93 90 88 89 93 92 91 85Major Roads 69 64 61 61 52 55 63 67 60 63 70 58Police 75 77 74 74 68 71 74 71 73 73 71 68Prisons 56 78 66 68 59 56 69 65 60 64 64 64Public Hospitals 79 78 78 75 70 73 77 74 77 75 78 71Public Housing 65 64 63 60 57 55 65 62 62 61 62 55Public Schools 76 75 73 72 69 70 73 70 72 73 70 69Public Transport 73 73 72 69 68 68 71 70 70 70 75 67Services for Older People 76 73 74 72 66 68 74 72 72 74 77 72State Emergency Services 92 94 92 93 90 91 90 92 90 90 92 87TAFE Services 73 73 72 68 64 71 69 69 71 70 74 67Vehicle Licensing and Registration 80 78 74 78 73 73 78 77 76 76 79 72Water Supply 74 74 69 71 65 67 71 73 73 72 76 69Overall average 77 76 74 74 69 70 75 73 74 74 76 70
Consumer
Note Interpret with caution Very small number of responses (nlt=30)
Ambulance Services Art Galleries and Museums State Emergency Services and Fire Brigades perform well against employee attributes
84
Source Customer Service Commission Customer Satisfaction Measurement Survey 2019 Report developed in conjunction with the NSW Customer Service CommissionerPublic I1-A2
Customers are asked ldquoThinking about the values that they uphold to what extent would you agree with each of the following statements when thinking about [a particular government service] in SArdquo
Figure 10 Performance of SA Government Services against values
Responses were provided according to a scale from 1 (strongly disagree) to 10 (strongly agree) The average score against each attribute by service is tabulated Note this analysis represents consumer data only
Services
Accountability and Service quality
Is a body I can trust Operates with integrity Is accountable for its services Provides good values services
Agricultural Advice and Funding Services 77 78 75 76
Ambulance Services 91 90 90 89
Art Galleries and Museums 85 85 84 86
Business Advisory Services 72 74 71 74
Child Welfare Services 41 48 46 45
Consumer Affairs 67 68 64 70
Courts 64 66 59 64
Disability Services 61 63 61 59
Documentation Services 71 72 69 70
Environment and Wildlife Protection 65 64 61 64
Fire Brigades 92 92 91 94
Major Roads 58 59 58 58
Police 73 73 70 73
Prisons 55 62 62 61
Public Hospitals 74 75 71 73
Public Housing 58 57 57 58
Public Schools 73 74 72 74
Public Transport 67 69 67 70
Services for Older People 68 71 66 69
State Emergency Services 92 92 90 92
TAFE Services 69 69 68 70
Vehicle Licensing and Registration 75 75 73 74
Water Supply 67 68 64 68
Overall average 72 73 70 72
Average score higherlower compared to overall SA average
Base Consumers (n=2936)
VARIATION IN CONSUMERSrsquo VIEWS OF PERFORMANCE AGAINST VALUES ACROSS SERVICESConsumer
Note Interpret with caution Very small number of responses (nlt=30)
Services that have high scores across headline measures (satisfaction expectation and ideal service) also perform well against values related attributes These services are Ambulance Services Art Galleries and Museums State Emergency Services and Fire Brigades
85
Source Customer Service Commission Customer Satisfaction Measurement Survey 2019 Report developed in conjunction with the NSW Customer Service CommissionerPublic I1-A2
Average score higherlower compared to overall SA average
Base Consumers (n=2617)Customers are asked ldquoThinking now about its processes) to what extent do you agree or disagree the followingstatements describes [a particular Government Service] in SArdquo
Figure 11 Performance of SA Government Services against process attributes
Responses were provided according to a scale from 1 (strongly disagree) to 10 (strongly agree) The average score against each attribute by service is tabulated Note this analysis represents consumer data only
Services
Simplicity and Efficiency of Processes Employee autonomy
Processes are easy to understand
Processes are designed to reduce wait times
I can get to the right person the first time
Services feel seamless across channels
Employees are empowered to make decisions
Agricultural Advice and Funding Services 61 73 73 67 68
Ambulance Services 86 81 84 83 87
Art Galleries and Museums 79 74 78 76 73
Business Advisory Services 70 67 71 64 72
Child Welfare Services 49 45 43 42 48
Consumer Affairs 71 59 60 62 63
Courts 61 50 58 55 62
Disability Services 55 53 52 52 56
Documentation Services 67 66 68 64 68
Environment and Wildlife Protection 61 60 58 56 60
Fire Brigades 86 87 86 88 83
Major Roads 55 50 50 49 51
Police 70 65 65 65 73
Prisons 53 50 57 57 57
Public Hospitals 67 56 60 63 68
Public Housing 62 50 56 56 54
Public Schools 69 64 66 66 67
Public Transport 70 65 66 66 66
Services for Older People 65 59 61 62 63
State Emergency Services 86 87 85 84 83
TAFE Services 66 62 63 65 66
Vehicle Licensing and Registration 74 65 69 68 69
Water Supply 67 61 63 64 64
Overall Average 70 63 65 65 68
VARIATION IN CONSUMERSrsquo VIEWS OF PERFORMANCE AGAINST PROCESS ATTRIBUTES ACROSS SERVICES
Consumer
Note Interpret with caution Very small number of responses (nlt=30)
Services that have high scores across headline measures (satisfaction expectation and ideal service) also perform well against process attributes These services are Ambulance Services Art Galleries and Museums State Emergency Services and Fire Brigades
86
Source Customer Service Commission Customer Satisfaction Measurement Survey 2019 Report developed in conjunction with the NSW Customer Service CommissionerPublic I1-A2
Average score higherlower compared to overall SA average
Customers are asked ldquoThinking about the services they provide overall how would rate [a particular government service] in SA on the followingrdquoFigure 12 Performance of SA Government Services against goals
Base Consumers (n=2582)
Responses were provided according to a scale from 1 (strongly disagree) to 10 (strongly agree) The average score against each attribute by service is tabulated Note this analysis represents consumer data only
Services
Transparency Access to information Privacy
Demonstrate openness and transparency in decision
making
Encourage public participation in decision
making
Is making it easier to access information about their
services
Is making best use of online services to improve efficiency
for customers
Safeguard privacy and confidentiality
Agricultural Advice and Funding Services 74 71 73 75 78
Ambulance Services 83 77 84 80 89
Art Galleries and Museums 78 76 80 79 80
Business Advisory Services 71 68 70 65 72
Child Welfare Services 44 37 49 43 58
Consumer Affairs 64 56 66 67 74
Courts 61 49 64 57 70
Disability Services 56 54 57 59 69
Documentation Services 71 62 70 69 78
Environment and Wildlife Protection 60 56 69 60 71
Fire Brigades 82 80 85 82 90
Major Roads 56 53 56 58 68
Police 65 58 68 63 76
Prisons 54 49 56 49 64
Public Housing 69 61 68 63 76
Public Hospitals 54 50 54 52 69
Public Schools 67 66 71 68 73
Public Transport 64 61 71 71 71
Services for Older People 65 60 66 65 77
State Emergency Services 86 81 85 78 88
TAFE Services 67 64 69 69 74
Vehicle Licensing and Registration 69 58 73 74 78
Water Supply 64 57 69 67 71
Overall Average 67 61 70 68 75
VARIATION IN CONSUMERSrsquo VIEWS OF PERFORMANCE AGAINST GOALS ACROSS SERVICES
Consumer
Note Interpret with caution Very small number of responses (nlt=30)
Services that have high scores across headline measures (satisfaction expectation and ideal service) also perform well against goals attributes These services are Ambulance Services Art Galleries and Museums State Emergency Services and Fire Brigades
87
Source Customer Service Commission Customer Satisfaction Measurement Survey 2019 Report developed in conjunction with the NSW Customer Service CommissionerPublic I1-A2
Average score higherlower compared to overall SA average
VARIATION IN BUSINESSESrsquo VIEWS OF EMPLOYEE PERFROMANCE ACROSS SERVICES
Customers are asked ldquoThinking now about its employees to what extent do you agree or disagree that each of the following statements describes [a particular government service] in SArdquo
Figure 9 Performance of SA Government Services against each of the employee attributes
Responses were provided according to a scale from 1 (strongly disagree) to 10 (strongly agree) The average score against each attribute by service is tabulated Note this analysis represents consumer data only
Base Businesses (n=657)
Services
Honesty and Integrity of Employees Efficiency and Effectiveness Empathy and Communication of Employees Fairness
Are honest
Deliver high
safety standards
Provide good value
services
Are reliable
Communicate well
Are consistent
Engender confidence in
their knowledge
Explain intended actions clearly
Get things done as quickly as
possible
Held Accountable
See things from my perspective
Provide services
without bias
Agricultural Advice and Funding Services 59 52 53 56 52 53 54 53 45 53 46 50Ambulance Services 91 92 92 93 90 91 92 93 94 91 87 92Art Galleries and Museums 83 74 88 85 86 78 83 85 69 83 79 79Business Advisory Services 71 73 71 70 70 71 69 71 66 62 66 70Child Welfare Services 71 71 62 54 59 50 62 70 55 56 55 76Consumer Affairs 72 73 65 71 73 66 71 70 61 66 65 71Courts 76 68 63 68 70 74 66 75 63 53 61 73Disability Services 80 77 76 73 73 74 75 70 69 74 66 75Documentation Services 90 80 79 72 79 81 80 79 67 74 75 80Environment and Wildlife Protection 80 77 78 76 77 76 78 78 78 70 68 71Fire Brigades 85 99 89 85 85 99 93 83 96 96 88 99Major Roads 79 79 70 70 70 64 69 55 74 60 73 78Police 78 83 76 76 76 79 80 77 68 77 71 81Prisons 74 76 72 74 77 75 74 74 75 91 73 77Public Hospitals 70 69 68 68 67 67 65 69 64 61 64 70Public Housing 85 78 81 68 82 86 84 79 68 84 76 79Public Schools 70 71 65 65 65 62 66 66 58 66 64 64Public Transport 76 70 70 65 70 71 67 69 76 62 71 68Services for Older People 76 75 73 72 74 69 73 69 70 72 68 72State Emergency Services 83 86 85 83 81 80 80 82 79 82 86 89TAFE Services 69 64 67 66 63 66 59 64 61 64 61 63Vehicle Licensing and Registration 75 75 69 72 72 71 72 74 69 66 67 74Water Supply 66 75 67 69 70 70 74 71 62 66 61 74Overall Average 75 75 71 71 72 71 72 72 68 69 68 73
Note Interpret with caution Very small number of responses (nlt=30)
Business
Due to low sample sizes for most of the services data is to be viewed as indicative only
88
Source Customer Service Commission Customer Satisfaction Measurement Survey 2019 Report developed in conjunction with the NSW Customer Service CommissionerPublic I1-A2
Customers are asked ldquoThinking about the values that they uphold to what extent would you agree with each of the following statements when thinking about [a particular government service] in SArdquo
Figure 10 Performance of SA Government Services against values
Responses were provided according to a scale from 1 (strongly disagree) to 10 (strongly agree) The average score against each attribute by service is tabulated Note this analysis represents consumer data only
Services
Accountability and Service quality
Is a body I can trust Operates with integrity Is accountable for its services Provides good values services
Agricultural Advice and Funding Services 46 47 54 57
Ambulance Services 96 91 92 93
Art Galleries and Museums 89 89 93 91
Business Advisory Services 67 71 60 63
Child Welfare Services 65 71 66 59
Consumer Affairs 69 68 65 64
Courts 72 78 63 71
Disability Services 70 72 70 70
Documentation Services 80 80 76 82
Environment and Wildlife Protection 73 75 73 71
Fire Brigades 94 94 94 94
Major Roads 69 64 78 68
Police 80 79 78 82
Prisons 69 69 72 71
Public Hospitals 64 65 65 68
Public Housing 66 73 70 70
Public Schools 66 64 68 61
Public Transport 69 70 71 67
Services for Older People 74 76 73 76
State Emergency Services 87 89 86 85
TAFE Services 61 65 60 67
Vehicle Licensing and Registration 72 73 68 71
Water Supply 62 65 61 66
Overall Average 71 72 70 71
Average score higherlower compared to overall SA average
Base Businesses (n=702)
VARIATION IN BUSINESSESrsquo VIEWS OF PERFORMANCE AGAINST VALUES ACROSS SERVICES
Note Interpret with caution Very small number of responses (nlt=30)
Business
Due to low sample sizes for most of the services data is to be viewed as indicative only
89
Source Customer Service Commission Customer Satisfaction Measurement Survey 2019 Report developed in conjunction with the NSW Customer Service CommissionerPublic I1-A2
Average score higherlower compared to overall SA average
Base Businesses (n=661)Customers are asked ldquoThinking now about its processes to what extent do you agree or disagree the following statements describes [a particular GovernmentService] in SArdquo
Figure 11 Performance of SA Government Services against process attributes
Responses were provided according to a scale from 1 (strongly disagree) to 10 (strongly agree) The average score against each attribute by service is tabulated Note this analysis represents consumer data only
Services
Simplicity and Efficiency of Processes Responsiveness
Processes are easy to understand
Processes are designed to reduce wait times
I can get to the right person the first time
Services feel seamless across channels
Employees are empowered to make
decisions
Agricultural Advice and Funding Services 42 40 46 41 61
Ambulance Services 88 86 88 84 89
Art Galleries and Museums 86 84 77 74 70
Business Advisory Services 64 56 59 60 63
Child Welfare Services 66 51 51 51 45
Consumer Affairs 68 60 67 62 64
Courts 58 46 55 54 74
Disability Services 62 50 66 66 65
Documentation Services 72 69 63 80 75
Environment and Wildlife Protection 68 66 64 68 62
Fire Brigades 93 85 84 93 98
Major Roads 59 69 73 64 78
Police 69 64 69 63 76
Prisons 72 70 72 62 71
Public Hospitals 65 52 58 58 59
Public Housing 71 62 71 64 48
Public Schools 64 66 68 69 64
Public Transport 66 66 63 64 66
Services for Older People 67 59 68 67 68
State Emergency Services 84 82 72 80 84
TAFE Services 64 55 60 65 56
Vehicle Licensing and Registration 70 62 65 65 64
Water Supply 65 60 62 63 62
Overall Average 68 61 65 65 66
VARIATION IN BUSINESSESrsquo VIEWS OF PERFORMANCE AGAINST PROCESS ATTRIBUTES ACROSS SERVICES
Note Interpret with caution Very small number of responses (nlt=30)
Business
Due to low sample sizes for most of the services data is to be viewed as indicative only
90
Source Customer Service Commission Customer Satisfaction Measurement Survey 2019 Report developed in conjunction with the NSW Customer Service CommissionerPublic I1-A2
Average score higherlower compared to overall SA average
Customers are asked ldquoThinking about the services they provide overall how would rate [a particular government service] in SA on the followingrdquoFigure 12 Performance of SA Government Services against goals
Base Businesses (n=641)
Responses were provided according to a scale from 1 (strongly disagree) to 10 (strongly agree) The average score against each attribute by service is tabulated Note this analysis represents consumer data only
Services
Transparency Access to information Privacy
Demonstrate openness and transparency in decision
making
Encourage public participation in decision
making
Is making it easier to access information about their
services
Is making best use of online services to improve efficiency
for customers
Safeguard privacy and confidentiality
Agricultural Advice and Funding Services 48 51 43 51 59
Ambulance Services 92 78 89 69 94
Art Galleries and Museums 81 77 75 83 84
Business Advisory Services 64 61 66 69 71
Child Welfare Services 65 52 61 50 81
Consumer Affairs 65 54 67 69 69
Courts 59 44 69 63 83
Disability Services 69 69 62 73 81
Documentation Services 79 69 85 87 87
Environment and Wildlife Protection 69 71 77 74 67
Fire Brigades 98 95 78 54 97
Major Roads 59 69 74 78 74
Police 66 70 77 70 81
Prisons 71 55 54 55 74
Public Hospitals 64 59 61 61 71
Public Housing 75 66 76 73 72
Public Schools 65 70 64 67 69
Public Transport 70 66 71 69 67
Services for Older People 67 73 74 75 73
State Emergency Services 84 82 85 82 84
TAFE Services 58 61 65 60 62
Vehicle Licensing and Registration 66 58 70 71 75
Water Supply 62 55 65 66 70
Overall Average 67 63 69 68 74
VARIATION IN BUSINESSESrsquo VIEWS OF PERFORMANCE AGAINST GOALS ACROSS SERVICES
Note Interpret with caution Very small number of responses (nlt=30)
Business
Due to low sample sizes for most of the services data is to be viewed as indicative only
91
Public ndash I1-A2
SOUTH AUSTRALIAN CUSTOMER SATISFACTION MEASUREMENT SURVEY 2019
The data in this chapter is for informative purposes to compare the perceptions of SA government services Where sample sizes for segments are low (lt30) data is provided for indicative purposes only
APPENDIX 2CONTACT METHOD PREFERENCE BY SERVICE
Source Customer Service Commission Customer Satisfaction Measurement Survey 2019 Report developed in conjunction with the NSW Customer Service CommissionerPublic I1-A2
CONTACT METHODS PREFERRED TO INTERACT WITH SA GOVERNMENT SERVICESConsumers have different contact preferences for different types of services Agricultural Advice and Funding Services Vehicle Licensing andRegistration Documentation Services Major Roads and Public Transport and Water Supply are the top 6 services where online is the preferredcontact method Agricultural Advice and Funding Services Major Roads and Consumer Affairs have see the biggest growth in online preferenceversus last year
Consumer
Figure 13 Breakdown of most preferred contact methods across services
Note Each respondent could select any number of contact methodsBase 2019 Consumers (n=3170) 2018 Consumers (n=3152)
Note Interpret with caution Very small number of responses (nlt=30) Legend top 5 services for each contact method
2018 2019 2018 2019 2018 2019Agricultural Advice and Funding Services 37 46 14 17 0 0Vehicle Licensing and Registration 47 43 27 27 7 8Documentation Services 40 38 26 17 14 10Major Roads 21 29 29 19 20 19Public Transport 31 27 42 35 12 17Water Supply 20 27 9 4 46 37Consumer Affairs 15 26 7 13 44 26Business Advisory Services 21 22 27 21 31 15Environment and Wildlife Protection 37 21 8 27 19 19TAFE Services 18 20 29 21 16 17Art Galleries and Museums 17 18 44 60 12 6Child Welfare Services 13 14 37 19 28 43Ambulance Services 10 13 25 23 53 45Prisons 6 11 37 40 54 27Courts 8 11 52 44 19 23Services for Older People 13 11 33 28 40 46Police 6 10 53 47 25 30Public Schools 8 9 47 42 18 20Disability Services 5 9 39 32 37 37Fire Brigades 8 8 73 44 19 29Public Housing 11 7 27 39 44 39State Emergency Services 23 6 16 31 34 39Public Hospitals 5 6 58 53 23 29
ServicesOnline
In person face-to-face
Telephone (landline or mobile phone calls text message)
93
+9 pts
+8 pts
+11 pts
Source Customer Service Commission Customer Satisfaction Measurement Survey 2019 Report developed in conjunction with the NSW Customer Service CommissionerPublic I1-A2
Note Each respondent could select one preferred contact method
CONTACT METHODS PREFERRED TO USE TO INTERACT WITH SA GOVERNMENT SERVICES
Figure 14 Breakdown of most commonly preferred contact methods across services
Base 2019 Business (n=743) 2018 Business (n=795)
Preference for online has decreased for those who interacted with Vehicle Licensing and Registration with an increase inpreference for face to face Public Transport has also seen a decline in preference for online with preference moving to face toface as well as telephone
Business
Note Interpret with caution Very small number of responses (nlt=30)
2018 2019 2018 2019 2018 2019Documentation Services 41 52 0 23 7 0Major Roads 18 49 36 48 1 1Vehicle Licensing and Registration 52 33 20 36 4 9Consumer Affairs 13 30 13 6 46 23Public Transport 54 24 23 29 9 18Agricultural Advice and Funding Services 19 21 47 1 0 30Water Supply 22 20 14 3 37 27Services for Older People 10 20 23 24 30 34Business Advisory Services 29 19 15 19 23 26Disability Services 20 13 12 28 38 34Environment and Wildlife Protection 12 12 11 13 11 9Ambulance Services 14 12 41 13 44 50Police 6 7 50 56 34 29TAFE Services 4 6 31 23 41 18Public Schools 0 4 49 45 22 26Public Hospitals 5 3 53 54 11 21Fire Brigades 0 0 2 2 23 78Art Galleries and Museums 29 0 29 17 0 41State Emergency Services 0 0 0 58 79 14Child Welfare Services 12 0 33 24 33 38Courts 10 0 40 61 10 9Public Housing 18 0 34 83 14 15Prisons 0 0 27 34 46 34
ServicesOnline In person face-to-face Telephone (landline or mobile phone calls
text message)
Legend top 5 services for each contact method
94
-30 pts
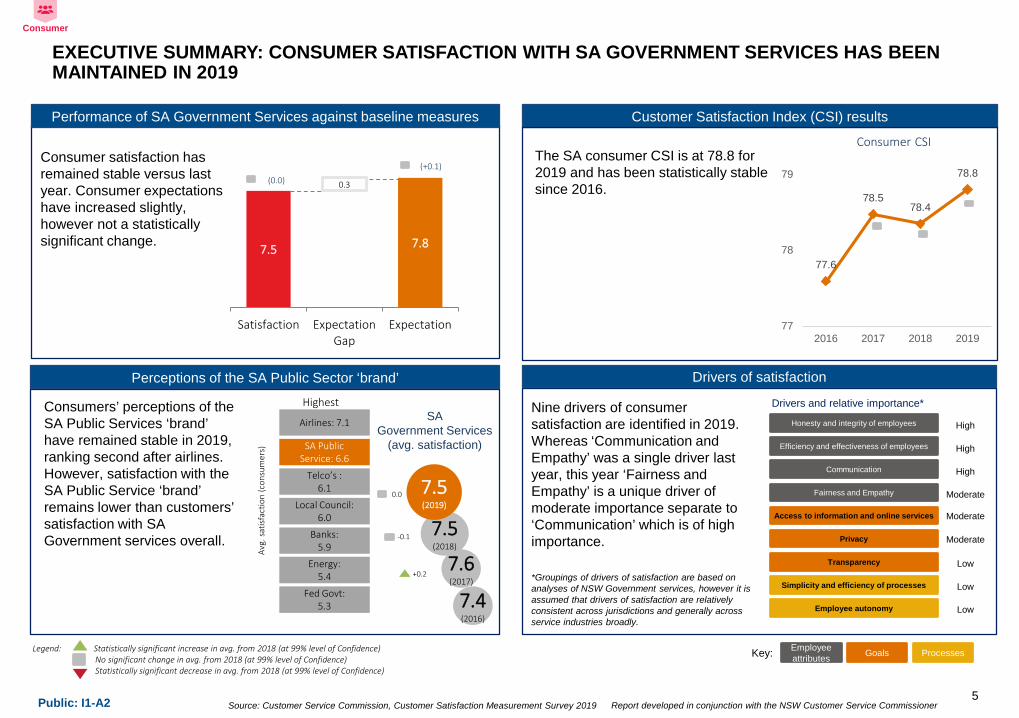
Source Customer Service Commission Customer Satisfaction Measurement Survey 2019 Report developed in conjunction with the NSW Customer Service CommissionerPublic I1-A2
75 78
03
Satisfaction ExpectationGap
Expectation
Consumer satisfaction has remained stable versus last year Consumer expectations have increased slightly however not a statistically significant change
(00)
The SA consumer CSI is at 788 for 2019 and has been statistically stable since 2016
Consumersrsquo perceptions of the SA Public Services lsquobrandrsquo have remained stable in 2019 ranking second after airlines However satisfaction with the SA Public Service lsquobrandrsquo remains lower than customersrsquo satisfaction with SA Government services overall
Lowest
Highest
Avg
sat
isfac
tion
(con
sum
ers)
Airlines 71
SA Public Service 66
Telcorsquos 61
Local Council60
Banks59
Energy54
Fed Govt53
76(2017)
Nine drivers of consumer satisfaction are identified in 2019 Whereas lsquoCommunication and Empathyrsquo was a single driver last year this year lsquoFairness and Empathyrsquo is a unique driver of moderate importance separate to lsquoCommunicationrsquo which is of high importance
Efficiency and effectiveness of employees
Communication
Honesty and integrity of employees
Employee autonomy
Simplicity and efficiency of processes
Transparency
Privacy
Access to information and online services
High
High
High
Moderate
Moderate
Low
Low
Low
Drivers and relative importance
Performance of SA Government Services against baseline measures Customer Satisfaction Index (CSI) results
Drivers of satisfaction
75(2018)
+02
Perceptions of the SA Public Sector lsquobrandrsquo
SA Government Services
(avg satisfaction)
(+01)
75(2019)
Fairness and Empathy
Moderate
EXECUTIVE SUMMARY CONSUMER SATISFACTION WITH SA GOVERNMENT SERVICES HAS BEEN MAINTAINED IN 2019
Legend Statistically significant increase in avg from 2018 (at 99 level of Confidence)No significant change in avg from 2018 (at 99 level of Confidence)Statistically significant decrease in avg from 2018 (at 99 level of Confidence)
-01
Consumer CSI
Consumer
776
785784
788
77
78
79
2016 2017 2018 2019
74(2016)
00
Employee attributes Goals ProcessesKey
Groupings of drivers of satisfaction are based on analyses of NSW Government services however it is assumed that drivers of satisfaction are relatively consistent across jurisdictions and generally across service industries broadly
5
Source Customer Service Commission Customer Satisfaction Measurement Survey 2019 Report developed in conjunction with the NSW Customer Service CommissionerPublic I1-A2
Business satisfaction and expectation have remained stable since 2016
The SA business CSI is 780 for 2019 and has been statistically stable since 2016
Business perceptions of the SA Public Services lsquobrandrsquo have remained stable in 2019 ranking between Airlines andTelcos However satisfaction with the SA Public Service lsquobrandrsquo remains lower than customersrsquo satisfaction with SA Government services overall
Lowest
Highest
Avg
sat
isfac
tion
(con
sum
ers)
Airlines 70
SA Public Service 66
Telcorsquos62
Banks61
Local Council61
Fed Govt 57
Energy56
71(2017)
+02
Performance of SA Government services against baseline measures Customer Satisfaction Index (CSI) results
72(2018)
Perceptions of the SA Public Sector lsquobrandrsquo
SA Government services
(avg satisfaction)
73(2019)
EXECUTIVE SUMMARY BUSINESS SATISFACTION WITH SA GOVERNMENT SERVICES HAS BEEN MAINTAINED IN 2019
7376
03
Satisfaction ExpectationGap
Expectation
(+01)(+01)
+01
Business CSI
Business
741
754759
780
74
75
76
77
78
79
2016 2017 2018 2019
Contact Methods Used by Businesses
51
4135
29
128
4740
29 27
156
Inperson
Phone Online Email Mail fax Thirdparties
2018 Business (n=814)2019 Business (n=762)
Similar to last year lsquoIn personrsquo lsquophonersquo and lsquoonlinersquo continue to be the top 3 methods used by businesses to interact with the SA Government
70(2016)
+01
Legend Statistically significant increase in avg from 2018 (at 99 level of Confidence)No significant change in avg from 2018 (at 99 level of Confidence)Statistically significant decrease in avg from 2018 (at 99 level of Confidence)
6
Public ndash I1-A2
SOUTH AUSTRALIAN CUSTOMER SATISFACTION MEASUREMENT SURVEY 2019
ii KEY FINDINGS IN 2019
Source Customer Service Commission Customer Satisfaction Measurement Survey 2019 Report developed in conjunction with the NSW Customer Service CommissionerPublic I1-A2
SUMMARY OF KEY FINDINGS IN 2019
Theme Key Finding EvidenceOverall Measures and Topline Analysis
Average scores for all three headline measures (satisfaction expectation ideal score) have remained stableover last year and seen steady growth since 2016
bull Consumer satisfaction has remained stable at 75 out of 10 and expectation has increased slightly to 78 out of 10
bull The expectation gap is 03 points
Compared to 2016 all headline measures have seen a steady increase in average scores
bull Comparison to ideal service has increased significantly in 2019 by 04 points to 72 out of 10
bull The expectation gap has remained stable versus 2018 at 03 pointsbull The proportion of businesses in the lowest bracket (rated 1-4 out of 10) has been declining
since 2016 across all three performance indicators and continues to do so in 2019
Performance Against Customer Satisfaction Attributes
SA Government Services perform well against Employee attributes which have been identified as important drivers of customer satisfaction
The opportunity lies in improving process efficiencies to reduce the overall time taken by consumers and businesses to complete their task or interaction
bull For consumers SA Government services have an average score of 74 out of 10 across all employee attributes
bull lsquoProcesses are easy to understandrsquo rates higher than other process attributes The opportunity areas lie in making processes more efficient as lsquoGetting things done as quickly as possiblersquo and processes lsquoAre designed to reduce wait timesrsquo are two attributes where SA has the lowest ratings among all jurisdictions
bull lsquoPublic participation in decision makingrsquo is one of the lowest performing attributes across all jurisdictions for consumers However businesses in SA have rated this attribute significantly higher than last year ndash an increase of 04 points to 63 out of 10 vs 2019
Consumer
Business
BusinessConsumer
8
Source Customer Service Commission Customer Satisfaction Measurement Survey 2019 Report developed in conjunction with the NSW Customer Service CommissionerPublic I1-A2
SUMMARY OF KEY FINDINGS IN 2019
Theme Key Finding EvidenceSatisfaction by Contact Method and DigitalInsights
Usage and satisfaction with the overall experience of using websites appshas remained stable among consumers Overall satisfaction is highest amongst consumers who use online channels
While smartphones are the most commonly used device to access services online there is an opportunity to improve the smartphone experience of consumers
bull Of all jurisdictions SA has the second highest usage of online methods of contact among consumers behind NSW
bull Users of Online channels have the highest average satisfaction scores compared to all other channels They also rate the SA Government services highest on all process attributes
bull While half of all consumers have used smartphones to access services online satisfaction with the overall experience with using website apps is lowest for smartphone users Tablet users form the smallest proportion but have the highest satisfaction
There is significant improvement in satisfaction with the overall online experience among businesses compared to 2018
While usage of in-person as a contact method is declining it continues to remain important to businesses The opportunity area is to find the right balance between online and face to face contact methods
bull The proportion of businesses choosing to go online increased by 7 points in 2019 and these businesses also saw a 09 point increase in satisfaction which is high at 80 out of 10
bull There was a significant increase in satisfaction with the overall experience of using website app to complete a task ndash an increase of 08 points to 78 out of 10 versus last year
bull While smartphone usage was low compared to desktop and laptop businesses that used smartphones showed highest satisfaction along with desktop users
bull Businesses that used in-person channels had the highest satisfaction alongside online users Businesses using in-person methods also rate SA Government services highest on all process attributes
bull Preference for in-person in SA is the highest of all jurisdictions however usage has seen a steady decline since 2017
Consumer
Business
9
Source Customer Service Commission Customer Satisfaction Measurement Survey 2019 Report developed in conjunction with the NSW Customer Service CommissionerPublic I1-A2
Theme Key Finding Evidence
Public Sector Overall The SA Public Services lsquobrandrsquo is viewed positively by both consumers and businesses
Experiences with SA Government services outperforms overall SA Public Service perceptions
bull The perception of SA Public Service overall has remained stable and is ahead of all other industries with the exception of airlines for both consumers and businesses
bull In line with other Australian jurisdictions SA Public Service lsquobrandrsquo performs better relative to other industries than the Public Service lsquobrandrsquo in NZ and UK
bull Satisfaction with government services is higher than satisfaction with the SA Public Service lsquobrandrsquo suggesting factors other than service delivery experiences are impacting brand perception
bull SA Public Service is described more positively than negatively with lsquohelpfulrsquo lsquofriendlyrsquo lsquocapablersquo lsquoknowledgeablersquo and lsquorespectfulrsquo being the top five descriptors by both consumers and businesses
bull In contrast to last year businesses have described SA Public Services more positively this year with an increase in proportion of businesses selecting positive descriptors and decrease in proportion of businesses selecting negative descriptors
Topline by Demographics Consumer satisfaction in regional areas has increased significantly and the expectation gap is almost zero
bull For consumers all three headline measures have seen a significant increase in regional areas
bull Expectation has increased by 04 points to 81 out of 10 and satisfaction has increased by 06 points to 80 out of 10 This indicates that SA Government Services in regional areas are very close to meeting consumers expectations
Consumer Business
SUMMARY OF KEY FINDINGS IN 2019
10
Consumer
Source Customer Service Commission Customer Satisfaction Measurement Survey 2019 Report developed in conjunction with the NSW Customer Service CommissionerPublic I1-A2
Theme Key Finding Evidence
Feedback Overall the proportion of consumers and businesses giving feedback remains low
Consumers are more likely to give compliments and businesses are more likely to make a complaint
bull 30 of consumers and 39 of businesses gave some form of feedback in 2019bull 39 of all feedback received from consumers was a compliment Compliments are
related to employee interactions for consumers and businesses compliment about the information available to them
bull 42 of all feedback received from businesses was a complaint Compared to other jurisdictions SA received the highest proportion of all feedback as complaints from businesses but had the lowest proportion of poor handling of complaints within Australian jurisdictions
bull Processes are the main source of complaints for both consumers and businesses
A higher proportion of both consumers and businesses found it easier to make complaints this year versus last year
For both consumers and businesses ease of making a complaint does not always translate into a positive complaint handling experience There is an opportunity to streamline the complaints resolution process to ensure the experience is positive for consumers and businesses through the entire process
Good complaint handling is associated with higher than average satisfaction for both consumers and business
bull 51 of consumers found it easy to make a complaint (7-10 out of 10) versus 34 last year
bull 46 of businesses found it easy to make a complaint (7-10 out of 10) versus 37 last year
bull While there was improvement in the ease of making a complaint only 36 of consumers said their complaint had been handled well (7-10 out of 10)
bull Similarly for businesses only 32 said their complaint had been handled well (7-10 out of 10)
bull Consumers who had a good complaint handling experience had a satisfaction score of 80 out of 10 which is higher than the average consumer satisfaction score of 75 out of 10
bull Businesses gave a rating of 7-10 out of 10 for complaint handling had a satisfaction score of 81 out of 10 which is higher than the average business satisfaction score of 73 out of 10
Consumer Business
SUMMARY OF KEY FINDINGS IN 2019
11
Consumer Business
Please note that customers may have rated different services on Satisfaction and Complaint Handling and the correlation is to be treated as indicative only
Source Customer Service Commission Customer Satisfaction Measurement Survey 2019 Report developed in conjunction with the NSW Customer Service CommissionerPublic I1-A2
KEY FINDING 1 (CONSUMER) Overall Measures and Topline AnalysisAverage scores for all three headline measures (satisfaction expectation ideal score) have remained stable over last year and seen steady growth since 2016
7578
Satisfaction Expectation Gap Expectation
Figure 2 2019 Consumer satisfaction expectation and expectation gap
bull In 2019 consumer satisfaction with SA Government services has been maintained at 75 and consumer expectation has increased slightly to 78
bull The expectation gap is -03
+01-
Consumer
-03
Legend Statistically significant increase in avg from 2018 (at 99 level of Confidence)No significant change in avg from 2018 (at 99 level of Confidence)Statistically significant decrease in avg from 2018 (at 99 level of Confidence)
12
77
78
77
78
2016
2017
2018
2019
74
76
75
75
2016
2017
2018
2019
70
71
71
72
2016
2017
2018
2019
-01 -01 +01
+01 -+02
+01 - +01
Expectation Satisfaction Ideal Service
Figure 1 2019 Average scores for headline measures 2016 ndash 2019 - Consumers
Source Customer Service Commission Customer Satisfaction Measurement Survey 2019 Report developed in conjunction with the NSW Customer Service CommissionerPublic I1-A2
KEY FINDING 1 (BUSINESS) Overall Measures and Topline AnalysisCompared to 2016 all headline measures have seen a steady increase in average scores
bull Both satisfaction and expectation of businesses with SA Government have increased by 01 points in 2019 versus last year
bull As with consumers the expectation gap is -03
+01-
Business
Legend Statistically significant increase in avg from 2018 (at 99 level of Confidence)No significant change in avg from 2018 (at 99 level of Confidence)Statistically significant decrease in avg from 2018 (at 99 level of Confidence)
13
Expectation Satisfaction Ideal Service
Figure 3 2019 Average scores for headline measures 2016 ndash 2019 - Business
73
74
75
76
2016
2017
2018
2019
+01
+01
+01
70
71
72
73
2016
2017
2018
2019
+02
+01
+01
67
69
68
72
2016
2017
2018
2019
+02
-01
+04
+01 +01
7376
Satisfaction Expectation Gap Expectation
Figure 4 2018 Business satisfaction expectation and expectation gap
Aver
age
scor
e (o
ut o
f 10 )
-03
Source Customer Service Commission Customer Satisfaction Measurement Survey 2019 Report developed in conjunction with the NSW Customer Service CommissionerPublic I1-A2
Satisfaction Drivers Average score across respondents (out of 10 on scale of according to a scale from 1 strongly disagree to 10 strongly agree)
Employees1)Honesty amp integrity of employees2)Efficiency and effectiveness of employees3)Communication4) Fairness and Empathy
Average across attributes
Process1)Simplicity and efficiency of processes2)Employee autonomy
Average across attributes
73
This year (YoY change not significant)
Range of historicValues(2016-19)
Legend77
79
71
Significant increase
Significant decrease
Last year
72
73
73
74
2016
2017
2018
2019
76 76 76 75 74 74 74 74 7371
69
77 76 76 75 74 74 74 74 7370 70 70
69
60
65
70
75
80
Are
hone
st
Deliv
er h
igh
safe
tyst
anda
rds
Prov
ide
serv
ices
with
out b
ias
Expl
ain
inte
nded
actio
ns c
lear
ly
Enge
nder
con
fiden
cein
thei
r kno
wle
dge
Com
mun
icat
e w
ell
Prov
ide
good
val
uese
rvic
es
Are
relia
ble
Are
cons
iste
nt
Are
held
acc
ount
able
See
thin
gs fr
om m
ype
rspe
ctiv
e
Get
thin
gs d
one
asqu
ickl
y as
pos
sibl
e
66
65
66
66
2016
2017
2018
201969
6765 63
7068
6563
66
6560
65
70
75
80
Proc
esse
s ar
e ea
sy to
unde
rsta
nd
Empl
oyee
s ar
eem
pow
ered
to m
ake
deci
sions
I can
get
to th
e rig
htpe
rson
the
first
tim
e
Serv
ice
feel
s se
amle
ssev
en if
I ha
ve to
com
mun
icat
e ac
ross
diffe
rent
cha
nnel
s(i
e o
nlin
e p
hone
em
ail)
Are
desi
gned
tore
duce
wai
t tim
es
Consumer
KEY FINDING 2 (CONSUMER) Performance Against Customer Satisfaction AttributesWith an average score of 74 out of 10 for consumers SA Government Services perform well against employee attributes which havebeen identified as important drivers of customer satisfaction The opportunity area lies in improving process efficiencies to reduce the overall time taken by consumers to complete their task or interaction
Figure 5 Employee and Process attribute scores ndash Consumers
14
Source Customer Service Commission Customer Satisfaction Measurement Survey 2019 Report developed in conjunction with the NSW Customer Service CommissionerPublic I1-A2
Satisfaction Drivers Average score across respondents (out of 10 on scale of according to a scale from 1 strongly disagree to 10 strongly agree)
Goals 1)Privacy2)Transparency3)Access to info
Average across attributes
Values1)Service Quality2)Accountability
Average across attributes
67
66
68
68
2016
2017
2018
2019
74
69 68 67
7570 68 67
62
6155
60
65
70
75
80
Safe
guar
d pr
ivac
y an
dco
nfid
entia
lity
Is m
akin
g it
easi
er to
acce
ss in
form
atio
nab
out t
heir
serv
ices
Is m
akin
g be
st u
se o
fon
line
serv
ices
toim
prov
e co
nven
ienc
ean
d ef
ficie
ncy
for
cust
omer
s
Dem
onst
rate
open
ness
and
tran
spar
ency
inde
cisio
n-m
akin
g
Enco
urag
e pu
blic
part
icip
atio
n in
deci
sion-
mak
ing
70
71
72
72
2016
2017
2018
201973 72 72
70
73 72 7270
60
65
70
75
80
Ope
rate
s w
ithin
tegr
ity
Prov
ides
goo
dse
rvic
e
Is a
bod
y I c
an tr
ust
Is a
ccou
ntab
le fo
r its
serv
ices
73
This year (YoY change not significant)
Range of historicValues(2016-19)
Legend77
79
71
Significant increase
Significant decrease
Last year
Consumer
KEY FINDING 2 (CONSUMER) Performance Against Customer Satisfaction AttributesFor consumers lsquoPublic participation in decision makingrsquo is one of the lowest performing attributes and this is also the case the attribute scores are compared across all jurisdictions
Figure 6 Goals and Values attribute scores - Consumers
15
Source Customer Service Commission Customer Satisfaction Measurement Survey 2019 Report developed in conjunction with the NSW Customer Service CommissionerPublic I1-A2
Satisfaction Drivers Average score across respondents (out of 10 on scale of according to a scale from 1 strongly disagree to 10 strongly agree)
Employees1)Honesty amp integrity of employees2)Efficiency and effectiveness of employees3)Communication4) Fairness and Empathy
Average across attributes
Process1)Simplicity and efficiency of processes2)Responsiveness
Average across attributes
7374
71 71 71 71 7070 71
6767 67
75 7573 72 72 72 71 71 71
69 68 68
60
65
70
75
Are
hone
st
Deliv
er h
igh
safe
tyst
anda
rds
Prov
ide
serv
ices
with
out b
ias
Expl
ain
inte
nded
actio
ns c
lear
ly
Enge
nder
con
fiden
cein
thei
r kno
wle
dge
Com
mun
icat
e w
ell
Are
cons
iste
nt
Prov
ide
good
val
uese
rvic
es
Are
relia
ble
Are
held
acc
ount
able
Get
thin
gs d
one
asqu
ickl
y as
pos
sibl
e
See
thin
gs fr
om m
ype
rspe
ctiv
e
68
71
70
71
2016
2017
2018
2019
61
64
65
65
2016
2017
2018
2019 67 64 64 62
6865 65
6167
66
55
60
65
70
75
80
Proc
esse
s ar
e ea
sy to
unde
rsta
nd
Empl
oyee
s ar
eem
pow
ered
to m
ake
deci
sions
Serv
ice
feel
s se
amle
ssev
en if
I ha
ve to
com
mun
icat
e ac
ross
diffe
rent
cha
nnel
s (i
eon
line
pho
ne e
mai
l)
I can
get
to th
e rig
htpe
rson
the
first
tim
e
Are
desi
gned
tore
duce
wai
t tim
es
73
This year (YoY change not significant)
Range of historicValues(2016-19)
Legend77
79
71
Significant increase
Significant decrease
Last year
Business
Figure 7 Employee and Process attribute scores ndash Businesses
16
KEY FINDING 2 (BUSINESS) Performance Against Customer Satisfaction AttributesSA Government Services perform well against employee attributes which have been identified as important drivers of business satisfaction The opportunity lies in improving process efficiencies to reduce the overall time taken to complete a task or interaction
Source Customer Service Commission Customer Satisfaction Measurement Survey 2019 Report developed in conjunction with the NSW Customer Service CommissionerPublic I1-A2
Satisfaction Drivers Average score across respondents (out of 10 on scale of according to a scale from 1 strongly disagree to 10 strongly agree)
Goals 1)Privacy2)Transparency3)Access to info
Average across attributes
Values 1)Service Quality2)Accountability
Average across attributes
63
66
65
68
2016
2017
2018
2019
71
66 65 6559
7469 68 67
6363
50
55
60
65
70
75
80
Safe
guar
d pr
ivac
y an
dco
nfid
entia
lity
Is m
akin
g it
easi
er to
acce
ss in
form
atio
nab
out t
heir
serv
ices
Is m
akin
g be
st u
se o
fon
line
serv
ices
toim
prov
e co
nven
ienc
ean
d ef
ficie
ncy
for
cust
omer
s
Dem
onst
rate
ope
nnes
san
d tr
ansp
aren
cy in
deci
sion-
mak
ing
Enco
urag
e pu
blic
part
icip
atio
n in
deci
sion-
mak
ing
66
69
70
71
2016
2017
2018
201971 70 70
68
72 71 71 70
60
65
70
75
80
Ope
rate
s w
ith in
tegr
ity
Prov
ides
goo
d se
rvic
e
Is a
bod
y I c
an tr
ust
Is a
ccou
ntab
le fo
r its
serv
ices
73
This year (YoY change not significant)
Range of historicValues(2016-19)
Legend77
79
71
Significant increase
Significant decrease
Last year
Business
KEY FINDING 2 (BUSINESS) Performance Against Customer Satisfaction AttributesBusiness perception of lsquoPublic participation in decision makingrsquo has seen a significant increase of 04 points to 63 out of 10 this year
Figure 8 Goals and Values attribute scores - Businesses
17
Source Customer Service Commission Customer Satisfaction Measurement Survey 2019 Report developed in conjunction with the NSW Customer Service CommissionerPublic I1-A2
KEY FINDING 3 (CONSUMER) Satisfaction by Contact Method and Digital InsightsUsage and satisfaction with the overall experience with using websites apps has remained stable among consumers Overall satisfaction is highest amongst consumers who use online channels
Note ndash Percentages do not add up to 100 due to exclusion of Donrsquot Know from the analysis
bull 26 of consumers used online channels as a method of contact
bull Consumers who used online methods had the highest average overall satisfaction score of 77 out of 10
bull Satisfaction with the overall experience of using online services (via website app) was also high at 79 out of 10
57
3325
139
6
58
3426
1610
5
In person Phone Online Email Mail fax Thirdparties
2018 Consumer (n=3307) 2019 Consumer (n=3297)
cus
tom
ers
who
hav
e ha
d di
rect
de
alin
gs v
ia th
is c
hann
el
Figure 9 2018 and 2019 channel usage -Consumers
Consumer
Figure 10 2018 and 2019 overall satisfaction by channel usage - Consumers
7675
73 72 7270
7775
74 7371
70
50
60
70
80
Online In person Thirdparties
Phone Mailfax Email
2018 Consumer (n=3307) 2019 Consumer (n=3297)
Aver
age
satis
fact
ion
scor
e (1
-10) +01
+01+01 +01
--
Legend Statistically significant increase in avg from 2018 (at 99 level of Confidence)No significant change in avg from 2018 (at 99 level of Confidence)Statistically significant decrease in avg from 2018 (at 99 level of Confidence)
Customers were asked ldquoThinking about your experiences interacting with SA services online in the last 12 months to what extent do you agree or disagree with each of the following statementsrdquo
Figure 11 Satisfaction with attributes of online services
82 81 81 80 79 79 79 78
102030405060708090100
0102030405060708090
100
The content wascurrent and accurate
I achieved the outcomeby using servicesavailable online
I trust my informationwas handled securely
through thewebsiteapp
The format of contentmet my accessrequirements
I was satisfied with theoverall experience ofusing the websiteappto complete the task
The websiteapp wasuseful and allowed me
to do everything Ineeded to do
Content and supportprovided online was
sufficient to answer myquestions
I found the websiteapp simple and it waseasy to find what I was
looking for
Disagree (1-4) Neutral (5-6) Agree (7-10) Average
Axis 2 Average Score
Consumer (n=798)
Axis
1
Perc
enta
ge o
f re
spon
ses
+01 +01 +01 +02+01 +01 +02NA
18
Source Customer Service Commission Customer Satisfaction Measurement Survey 2019 Report developed in conjunction with the NSW Customer Service CommissionerPublic I1-A2
KEY FINDING 3 (CONSUMER) Satisfaction by Contact Method and Digital InsightsWhile smartphones are the most used device to access services online there is an opportunity to improve the smartphone experience of consumers
Note ndash Percentages do not add up to 100 due to exclusion of Donrsquot Know from the analysis
Consumer
Legend Statistically significant increase in avg from 2018 (at 99 level of Confidence)No significant change in avg from 2018 (at 99 level of Confidence)Statistically significant decrease in avg from 2018 (at 99 level of Confidence)
19
50 4640
17
31
52 53
10
Smartphone Laptop computer Desktop computer TabletiPad
Consumer (n=843)Business (n=220)
Customers were asked ldquoWhat devices did you use to access the online content Please select all contact methods that applyrdquo
Figure 12 Devices used when dealing with SA Government services online
Figure 13 Satisfaction with online services by device used Customers were asked ldquoHow satisfied were you with the overall experience of using the websiteapp to complete the taskrdquo
re
spon
dent
s
77
79 798080
74
80
76
Smartphone Laptop computer Desktop computer TabletiPad
Consumer (n=822)Business (n=218)
Aver
age
satis
fact
ion
(out
of 1
0)
bull While most consumers (50) used smartphones to access online content their satisfaction levels with their experience was lower (77 out of 10) compared to those who used desktops or laptops to access online content (79 out of 10)
bull Few consumers are using tabletsiPad (17) but those that do have high levels of satisfaction (8 out of 10)
Source Customer Service Commission Customer Satisfaction Measurement Survey 2019 Report developed in conjunction with the NSW Customer Service CommissionerPublic I1-A2
51
4135
29
128
4740
29 27
15
6
In person Phone Online Email Mail fax Thirdparties
2018 Business (n=814) 2019 Business (n=762)
c
usto
mer
s w
ho h
ave
had
dire
ct
deal
ings
via
this
cha
nnel
KEY FINDING 3 (BUSINESS) Satisfaction by Contact Method and Digital InsightsThere is significant improvement in satisfaction with the overall online experience among businesses
Figure 14 2018 and 2019 channel usage -Businessbull There was an increase in the
overall satisfaction score among businesses who used online channels
bull There was a significant increase of 08 points in satisfaction with the overall online experience
bull The proportion of businesses who chose to go online increased by 7 points compared to last year
Business
75
70 71 7169
68
73 7372 72 71
67
60
70
80
In person Online Mailfax Phone Email Thirdparties
2018 Business(n=814) 2019 Business(n=762)
Aver
age
satis
fact
ion
scor
e (1
-10)
Figure 15 2018 and 2019 overall satisfaction by channel usage - Businesses
-02+01 +01
+03+02
-01
Legend Statistically significant increase in avg from 2018 (at 99 level of Confidence)No significant change in avg from 2018 (at 99 level of Confidence)Statistically significant decrease in avg from 2018 (at 99 level of Confidence)
Customers were asked ldquoThinking about your experiences interacting with SA services online in the last 12 months to what extent do you agree or disagree with each of the following statementsrdquo
Figure 17 Satisfaction with attributes of online services
79 79 78 78 78 78 78 75
102030405060708090100
0
20
40
60
80
100
I trust myinformation washandled securely
through thewebsiteapp
I achieved theoutcome by usingservices available
online
The content wascurrent and
accurate
The format ofcontent met my
accessrequirements
I was satisfied withthe overall
experience ofusing the
websiteapp tocomplete the task
The websiteappwas useful and
allowed me to doeverything I
needed to do
Content andsupport provided
online wassufficient toanswer myquestions
I found thewebsite app
simple and it waseasy to find what I
was looking for
Disagree (1-4) Neutral (5-6) Agree (7-10) Average
Business (n=210)
Axis 2 Average Score
+05 NA +04 +09 +08 +06 +06+09
74
224 I chose to go
online
I was directedor promotedto go online
There was noother optionavailable
Customers were asked ldquoDid you choose to go online or were you directed to go onlinerdquo
Figure 16 Choice to go online
uarr7
darr2 darr5
20
Source Customer Service Commission Customer Satisfaction Measurement Survey 2019 Report developed in conjunction with the NSW Customer Service CommissionerPublic I1-A2
2922 22 22
2 4
3224 23
16
3 2
In person Email Phone Online Mailfax Third parties
2018 Business(n=795) 2019 Business(n=743)
51
4135
29
128
47
40
29 27
15
6
In person Phone Online Email Mail fax Third parties
2018 Business (n=814) 2019 Business (n=762)
c
usto
mer
s w
ho h
ave
had
dire
ct
deal
ings
via
this
cha
nnel
Figure 18 2018 and 2019 channel usage - Business
Figure 19 2018 and 2019 most preferred channel - Business
Note ndash Percentages do not add up to 100 due to exclusion of Donrsquot Know from the analysis
bull While lsquoin personrsquo remains the most used channel for contact there is a continued decline in usage since 2017 (52 in 2017 51 in 2018 47 in 2019) though not statistically significant
bull Despite the year on year declines lsquoin personrsquo continues to be the most preferred channel and there has been a year on year growth in preference since 2017 (27 in 2017 29 in 2018 32 in 2019)
Business
KEY FINDING 3 (BUSINESS) Satisfaction by Contact Method and Digital InsightsWhile usage is declining in-person as a method of contact continues to remain important to businesses The opportunity area is to find the right balance between online and face to face contact methods
21
c
usto
mer
s
Source Customer Service Commission Customer Satisfaction Measurement Survey 2019 Report developed in conjunction with the NSW Customer Service CommissionerPublic I1-A2
7166
61 60 5954 53
7066 62 61 61
56 57
Airlines Public Serviceoverall
TelephoneService
Providers
My localcouncil
Banks EnergyRetailers
FederalGovernment
Consumer (n=1649) Business (n=457)
02
Avg
sat
isfa
ctio
n (o
ut o
f 10)
LowestHighest
KEY FINDING 4 Public Sector OverallThe SA public services lsquobrandrsquo is viewed positively by both consumers and businesses however service experience outperforms brand score
0102
0203
0302
01 02
Figure 20 Satisfaction with SA Public Service
bull Both consumers and businesses rate SA Public Services higher than most other industries or public service agencies with the exception of Airlines
bull Both consumers and businesses rate satisfaction with SA Government Services as being higher than the satisfaction with the lsquobrandrsquo SA Public Service This suggests factors other than service delivery experiences are impacting brand perception
Consumer Business
10 05 0406 05
Legend Statistically significant increase in avg from 2018 (at 99 level of Confidence)No significant change in avg from 2018 (at 99 level of Confidence)Statistically significant decrease in avg from 2018 (at 99 level of Confidence)
7375 00 +01SA Government Services
Average satisfaction
Consumer Business
22
Source Customer Service Commission Customer Satisfaction Measurement Survey 2019 Report developed in conjunction with the NSW Customer Service CommissionerPublic I1-A2
KEY FINDING 4 Public Sector OverallIn comparison to other jurisdictions as well the SA Public Service lsquobrandrsquo is rated higher than most other industries by consumers and businesses
bull In line with other Australian jurisdictions SA Public Service lsquobrandrsquo performs better relative to other industries (banks) than Public Service lsquobrandrsquo in NZ and UK
Consumer Business
Lowest
Highest
Avg
sat
isfa
ctio
n (b
usin
esse
s)NZ
NZ Govt Service 68
Banks 69
Energy 66
Local council 58
Airlines 74
Telcorsquos 65
NSW
Airlines 71
NSW Public Service 69
Banks 60
Energy 57
Telcorsquos 60
Local council 61
Fed Govt 60
QLD
Airlines 71
QLD Public Service 67
Telcorsquos 61
Local council 61
Banks 57
Energy 57
Fed Govt 58
VIC
Airlines 71
VIC Public Service 65
Banks 58
Energy 57
Local council 59
Fed Govt 57
Telcorsquos 60
SA
Airlines 70
Telcorsquos 62
SA Public Service 66
Banks 61
Energy 56
Local council 61
Fed Govt 57
UK
Airlines 70
Telcorsquos 66
Energy 63
UK Public Service 68
Local Council 61
Banks 68
Business
Figure 21 Comparison of Public service brand perceptions across jurisdictionsCustomers were asked ldquoThinking about all your experiences with each of the following [jurisdiction] industries and public services over the previous 12 months how satisfied would you say you are with them rdquoConsumer
NZ
NZ Govt Service 69
Banks 69
Airlines 74
Telcorsquos 66
Energy 66
Local council 59
NSW NSW
Public Service 71
Airline 71
Telcorsquos 62
Energy 59
Local council 62
Banks 61
Fed Govt 57
QLD
Airlines 70
QLD Public Service 69
VIC SA
Airlines 71
Telcorsquos 61
SA Public Service 66
Local council 60
Banks 59
Energy 54
Fed Govt 53
UK
Airlines 71
UK Public Service 69
Banks 69
Energy 64
Telcorsquos 69
Local council 61
Lowest
Highest
Avg
sat
isfa
ctio
n (c
onsu
mer
s)
Airlines 71
Telcorsquos 63
VIC Public Service 70
Banks 63
Local council 62
Energy 60
Fed Govt 59
Telcorsquos 62
Local council 62
Banks 60
Energy 59
Fed Govt 58
23
Source Customer Service Commission Customer Satisfaction Measurement Survey 2019 Report developed in conjunction with the NSW Customer Service CommissionerPublic I1-A2
06
KEY FINDING 5 (CONSUMER) Top-Line results by DemographicsConsumer satisfaction in regional areas has increased significantly and the expectation gap is almost zero
Average satisfaction among consumers in regional areas has increased significantly by 06 points to 8 out of 10 The expectation score is 81 making the expectation gap just 008
How would you rate your expectation of the overall quality of service
Thinking about your experiences in the last 12 months how satisfied would you say you are with
each of the following services
10
10
106
6
8
13
11
14
81
83
78
80
81
77
Rural(n=349)
Regional(n=332)
Metro(n=2560)
Low (1-4) Neutral (5-6) High (7-10)
Satisfaction Expectation Ideal service
Please imagine an ideal service How well do you think each service compares to that ideal service
-042
-008
-027
-045 -025 -005
Rural (n=349)
Regional (n=332)
Metro (n=2560)
Expectation gap (satisfaction ndash expectation)
10
10
10
respondents Avg respondents Avg
10
10
10
respondents Avg
12
9
14
20
15
19
68
76
68
73
77
71
Rural(n=341)
Regional(n=327)
Metro(n=2504)
Not close to ideal (1-4)Neutral (5-6)Close to ideal (7-10)
Note Expectation gap scores displayed in graph are subject to rounding
9
7
10
15
12
16
75
81
73
75
80
75
Rural(n=353)
Regional(n=337)
Metro(n=2607)
Dissatisfied (1-4)Neutral (5-6)Satisfied (7-10)
Figure 22 Satisfaction expectation and ideal service by region - Consumer
Base Consumers(n=3297)
Base Consumers(n=3241)
Base Consumers(n=3172)
Base Consumers(n=3241)
-
-01
-
+04
+01
-
+06
-
Consumer
Legend Statistically significant increase in avg from 2018 (at 99 level of Confidence)No significant change in avg from 2018 (at 99 level of Confidence)Statistically significant decrease in avg from 2018 (at 99 level of Confidence)
24
Source Customer Service Commission Customer Satisfaction Measurement Survey 2019 Report developed in conjunction with the NSW Customer Service CommissionerPublic I1-A2
7765
727779
6975
81
never givenfeedback
I made acomplaint
I made asuggestionfor change
I gave acompliment
Satisfaction Expectation
7668 69 71
7971 74 75
never givenfeedback
I made acomplaint
I made asuggestion for
change
I gave acompliment
KEY FINDING 6 FeedbackOverall the proportion of consumers and businesses giving feedback remains low Consumers are more likely to give compliments and businesses are more likely to make a complaint
Consumer Business
bull Majority of consumers or businesses did not give any form of feedback
bull 39 of consumers who gave feedback gave a compliment
bull Whereas 42 of businesses who gave feedback made a complaint
bull Consumers and businesses who gave a compliment had a higher satisfaction score compared to those who complained or made a suggestion
Figure 23 Feedback typeQuestion ldquoWhen was the last time you provided feedback to a SA Government Agency or Department about their services processes or employeesrdquoQuestion ldquoWhat was the nature of the feedbackrdquo
Figure 24 Satisfaction and expectation of feedback type Consumer (n=858) Business (n=294)
3070
Consumer n=1998
3961
Business n=502
bull I gave a complimentbull I made a suggestion
for changebull I made a complaint
Business (n=194)
Consumer (n=519)
Given feedbackNever given feedback Donrsquot know
Given feedback
39
42 35
33
23
28
bull I gave a complimentbull I made a suggestion
for changebull I made a complaint
25
Source Customer Service Commission Customer Satisfaction Measurement Survey 2019 Report developed in conjunction with the NSW Customer Service CommissionerPublic I1-A2
Figure 25 Consumer Variation in ease of making a complaint across jurisdictions
KEY FINDING 6 FeedbackA higher proportion of both consumers and businesses found it easier to make complaints this year versus last year
Consumer Business
26
Customers were asked ldquoHow difficult or easy was it to make your complaintrdquo
40 28
26
21
34 51
5361
1
10
0
50
100
2018 2019
Easy (7-10) Neutral (5-6) Difficult (1-4) Average
Axis 2 Average scoreAxis
1
Perc
enta
ge o
f re
spon
sesConsumers
bull 51 of consumers found it easy (7-10 out of 10) to make a complaint versus 34 last year
bull There was a significant increase of 08 points in the average score for consumers (61 out of 10 vs 53 out of 10 last year)
Businessesbull 46 of businesses found it easy (7-10 out of 10)
to make a complaint An improvement of 9 points versus last year
bull The average score remained relatively stable at 55 out of 10
Figure 26 Business Variation in ease of making a complaint across jurisdictionsCustomers were asked ldquoHow difficult or easy was it to make your complaintrdquo
34 36
29 17
3746
57 55
1
10
0
50
100
2018 2019
Easy (7-10) Neutral (5-6) Difficult (1-4) Average
Axis 2 Average scoreAxis
1
Perc
enta
ge o
f re
spon
ses
+08
Source Customer Service Commission Customer Satisfaction Measurement Survey 2019 Report developed in conjunction with the NSW Customer Service CommissionerPublic I1-A2
KEY FINDING 6 FeedbackThere is an opportunity to streamline the complaints resolution process to ensure the experience is positive for consumers and businesses right from making a complaint all the way up to getting a resolution
Consumer Business
27
Customers were asked ldquoHow difficult or easy was it to make your complaintrdquoFigure 28 Variation in ease of making a complaint across jurisdictions
28 36
2117
51 46
6155
1
10
0
50
100
Consumer Business
Easy (7-10) Neutral (5-6) Difficult (1-4) Average
Axis 2 Average scoreAxis
1
Perc
enta
ge o
f re
spon
ses
Customers were asked ldquoHow well or poorly was your most recent complaint handledrdquo
Figure 29 Variation in complaints handling across jurisdictions
41 44
23 24
3632
52 49
1
10
0
50
100
Consumers Business
Handled poorly (1-4) Neutral (5-6) Handled well (7-10) Average
Axis
1
Perc
enta
ge o
f re
spon
ses
Axis 2 Average score
For both consumers and businesses ease of making a complaint does not always translate into a positive experience with the complaint handling process
bull While 51 of consumers found it easy (7-10 out of 10) to make a complaint only 36 of consumers said their complaint had been handled well (7-10 out of 10)
bull Similarly while 46 of businesses found it easy to make a complaint (7-10 out of 10) only 32 said their complaint had been handled well (7-10 out of 10)
Source Customer Service Commission Customer Satisfaction Measurement Survey 2019 Report developed in conjunction with the NSW Customer Service CommissionerPublic I1-A2
Consumersbull The overall satisfaction scores for consumers who had a
good complaint handling experience was higher than the average consumer satisfaction score (80 out of 10 vs 75 out of 10)
bull Consumers who had a good complaint handling experience had higher overall satisfaction (80 out of 10) compared to consumers who had a poor experience (53 out of 10)
Businessesbull Businesses who had a good complaint handling
experience had a higher satisfaction score compared to the average satisfaction score (81 out of 10 vs 73 out of 10)
bull As with consumers businesses who had a positive experience had higher overall satisfaction (81 out of 10) compared to those who had a poor experience (63 out of 10)
Consumer Business
28
80 81
60
71
53
63
75 73
Consumers Business
Handled Well (7-10) Neutral (5-6) Handled Poorly (1-4) Average Satisfaction
Figure 27 Overall satisfaction with government services by ease of making complaints
Aver
age
Satis
fact
ion
Scor
e
KEY FINDING 6 FeedbackGood complaint handling is associated with a higher than average satisfaction with SA Government Services for consumers and businesses
Please note that customers may have rated different services on Satisfaction and Ease of Complaint and the correlation is to be treated as indicative only
Public ndash I1-A2
SOUTH AUSTRALIAN CUSTOMER SATISFACTION MEASUREMENT SURVEY 2019
iii DETAILED FINDINGS
Public ndash I1-A2
SOUTH AUSTRALIAN CUSTOMER SATISFACTION MEASUREMENT SURVEY 2019
1 OVERALL MEASURES TOPLINE ANALYSIS
Source Customer Service Commission Customer Satisfaction Measurement Survey 2019 Report developed in conjunction with the NSW Customer Service CommissionerPublic I1-A2
Outcome Measures Avg responses
ExpectationHow would you rate your expectation of the overall quality of service
SatisfactionThinking about your experiences in the last 12 months how satisfied would you say you are with each of the following services in SA
Ideal servicehellipPlease imagine an ideal service How well do you think each service in SA compares to that ideal service
CONSUMER OVERALL PERFORMANCEConsumer satisfaction with SA Government services has remained stable in 2019
Note Results are subject to rounding
Consumer expectations have remained stable versus last year with an average rating of 79 out of 10
Consumer satisfaction with SA Government services has remained stable at 75 out of 10
Comparison to ideal service has seen no significant change in 2019 and sits at 72 out of 10
Figure 11 2016 2017 2018 and 2019 overall performance - Consumers
Consumer
77
78
77
78
2016
2017
2018
2019
74
76
75
75
2016
2017
2018
2019
70
71
71
72
2016
2017
2018
2019
9
7
7
7
14
14
15
14
77
79
78
79
2016(n=3462)
2017(n=3433)
2018(n=3245)
2019(n=3241)
Low (1-4) Med (5-6) High (7-10)
10
9
10
10
17
16
17
16
73
75
74
75
2016(n=3507)
2017(n=3482)
2018(n=3307)
2019(n=3297)
Dissatisfied (1-4) Neutral (5-6) Satisfied (7-10)
14
13
12
13
20
20
20
18
66
66
68
69
2016(n=3398)
2017(n=3375)
2018(n=3154)
2019(n=3172)
Not close to ideal (1-4) Neutral (5-6) Close to ideal (7-10)
-01
-01
+01
+01
-
+02
+01
-
+01
Legend Statistically significant increase in avg from 2018 (at 99 level of Confidence)No statistical significant change in avg from 2018 (at 99 level of Confidence)Statistically significant decrease in avg from 2018 (at 99 level of Confidence)
31
Source Customer Service Commission Customer Satisfaction Measurement Survey 2019 Report developed in conjunction with the NSW Customer Service CommissionerPublic I1-A2
For businesses expectations have seen no significant change with an average rating of 76 out of 10
Satisfaction amongst businesses has also remained stable at 73 out of 10
Comparison to the ideal service has seen a statistically significant increase of 04 points to 72 out of 10 This is a result of a 6 point increase in the proportion of businesses rating SA Government services close to ideal (7-10)
The proportion of businesses rating services in the lowest bracket (1-4) continues to decline year on year across all performance indicators
Figure 12 2016 2017 2018 and 2019 overall performance - Businesses
Note Results are subject to rounding
Business
Outcome Measures Avg responses
ExpectationHow would you rate your expectation of the overall quality of service
SatisfactionThinking about your experiences in the last 12 months how satisfied would you say you are with each of the following services in SA
Ideal servicehellipPlease imagine an ideal service How well do you think each service in SA compares to that ideal service
13
9
8
7
15
19
16
18
72
73
75
75
2016(n=817)
2017(n=753)
2018(n=801)
2019(n=758)
Low (1-4) Med (5-6) High (7-10)
16
11
10
8
18
21
20
20
67
69
70
72
2016(n=825)
2017(n=769)
2018(n=814)
2019(n=762)
Dissatisfied (1-4) Neutral (5-6) Satisfied (7-10)
19
16
14
12
19
20
23
18
62
63
63
69
2016(n=797)
2017(n=742)
2018(n=795)
2019(n=732)
Not close to ideal (1-4) Neutral (5-6) Close to ideal (7-10)
73
74
75
76
2016
2017
2018
2019
+01
+01
+01
70
71
72
73
2016
2017
2018
2019
+02
+01
+01
67
69
68
72
2016
2017
2018
2019
+02
-01
+04
Legend Statistically significant increase in avg from 2018 (at 99 level of Confidence)No statistical significant change in avg from 2018 (at 99 level of Confidence)Statistically significant decrease in avg from 2018 (at 99 level of Confidence)
BUSINESS OVERALL PERFORMANCEBusiness satisfaction with SA Government services has remained stable in 2019
32
Source Customer Service Commission Customer Satisfaction Measurement Survey 2019 Report developed in conjunction with the NSW Customer Service CommissionerPublic I1-A2
Consumersbull 75 of consumers indicate that they are
satisfied with the SA Government services they have had direct dealings in the last 12 months
bull 79 of consumers indicate that they have high expectations of SA Government services
Businessesbull 72 say they are satisfied - this is a 2
points increase in comparison to last year (70 in 2018) This increase has come from a 2 point decrease in dissatisfied businesses (1-4 out of 10)
bull 75 of businesses indicate that they have high expectations of SA Government services
The above satisfaction scores across consumer and business suggest positive perceptions of recent experiences with SA Government services
The above expectation scores across consumer and business suggest they may have had positive previous experiences (prior to the last 12 months)
bull What Overall expectation is a measure of the quality of services customers expect to receive from a service
bull How Customers were asked ldquoThinking about the following service in SA how would you rate your expectation of the overall quality of servicerdquo
Expectation
78 10
76 10
respondents Avg
7
7
18
14
75
79
Business(n=758)
Consumer(n=3241)
Low (1-4)Med (5-6)High (7-10)
Responses were recorded according to a scale from 1 (very low) to 10 (very high)
+01
+01
bull What Overall satisfaction is a measure of the perceived performance of a service as stated by customers
bull How Customers were asked ldquoThinking about your experiences in the last 12 months how satisfied would you say you are with the following service in SArdquo
Satisfaction
respondents Avg
Responses were recorded according to a scale from 1 (very dissatisfied) to 10 (very satisfied)
8
10
20
16
72
75
Business(n=762)
Consumer(n=3297)
Dissatisfied (1-4)
Neutral (5-6)
Satisfied (7-10)
75 10
73 10
-
+01
Sig Sig
Figure 13 Figure 14
Comparison of current SA performance to expectations
Consumer Business
Legend Statistically significant increase in avg from 2018 (at 99 level of Confidence)No statistical significant change in avg from 2018 (at 99 level of Confidence)Statistically significant decrease in avg from 2018 (at 99 level of Confidence)
PERFORMANCE OF SERVICES COMPARED TO EXPECTATIONSResults against the measures of satisfaction and expectation indicate positive perceptions of SA Government services
33
Source Customer Service Commission Customer Satisfaction Measurement Survey 2019 Report developed in conjunction with the NSW Customer Service CommissionerPublic I1-A2
Consumersbull 69 of consumers rated SA
Government services as performing close to their ideal service (7-10 out of 10)
bull The average score has remained stable versus last year
Businessesbull 69 of businesses rated SA
Government services as performing close to their ideal service (7-10 out of 10)
bull There has been a significant increase of 04 in the average score for lsquoideal servicersquo (72 out of 10) versus last year
bull What Comparison to an ideal service is a measure of how much the customers feel that the service is close to the best it can be
bull How Customers were asked ldquoNow forgetting for a moment the specific service please imagine an ideal service How well do you think the service in SA compares with that ideal servicerdquo
12
13
18
18
69
69
Business(n=732)
Consumer(n=3172)
Not close to ideal (1-4)Neutral (5-6)Close to ideal (7-10)
Comparison to ideal
7210
7210
respondents Avg
Responses were recorded according to a scale from 1 (not very close to ideal) to 10 (very close to ideal)
Sig
+01
+04
Comparison of current SA performance to perceptions of an ideal service
Figure 15 Figure 16
bull What Overall satisfaction is a measure of the perceived performance of a service as stated by customers
bull How Customers were asked ldquoThinking about your experiences in the last 12 months how satisfied would you say you are with the following service in SArdquo
Satisfaction
respondents Avg
Responses were recorded according to a scale from 1 (very dissatisfied) to 10 (very satisfied)
8
10
20
16
72
75
Business(n=762)
Consumer(n=3297)
Dissatisfied (1-4)
Neutral (5-6)
Satisfied (7-10)
75 10
73 10
-
+01
Sig
Consumer Business
Legend Statistically significant increase in avg from 2018 (at 99 level of Confidence)No statistical significant change in avg from 2018 (at 99 level of Confidence)Statistically significant decrease in avg from 2018 (at 99 level of Confidence)
PERFORMANCE OF SERVICES COMPARED TO IDEAL69 of both consumers and businesses rate SA Government services as performing close to their ideal service
34
Source Customer Service Commission Customer Satisfaction Measurement Survey 2019 Report developed in conjunction with the NSW Customer Service CommissionerPublic I1-A2
Note Average satisfaction expectation comparison to ideal service and expectation gap scores are subject to rounding
bull Compared to 2018 satisfaction and expectations have remained stable across jurisdictions with the exceptions of NSW and UK
bull Compared to 2018 SA has improved its ranking by 1 spot when it comes to expectation but has retained its rankings for satisfaction and ideal service
bull NSW has seen a statistically significant increase of 02 points in its satisfaction scores to 78 However the expectation score has also increased statistically significantly to 81 ndashkeeping the gap between expectation and satisfaction unchanged
bull UK has seen a statistically significant decrease of 02 points in expectations to 78
Figure 17 Satisfaction expectation and ideal service across jurisdictions - Consumer
Consumer
Outcomemeasures Avg respondents
ExpectationHow would you rate your expectation of the overall quality of service
SatisfactionThinking about your experiences in the last 12 months how satisfied would you say you are with each of the following services in SA
Ideal service
hellipPlease imagine an idealservice How well do you think each service in SA compares to that ideal service
7
7
7
7
7
6
14
14
13
13
12
11
79
79
80
80
81
84
UK
SA
NZ
QLD
VIC
NSW
Low (1-4)
Medium (5-6)
High (7-10)
78
79
79
79
81
78
10
9
9
9
8
7
16
16
14
15
14
14
75
76
77
76
77
79
SA
UK
VIC
QLD
NZ
NSW
Dissatisfied (1-4)
Neutral (5-6)
Satisfied (7-10)76
76
77
77
78
75
73
73
74
74
75
72
+02
+02
+02
-01
-
+02
-
-
-
+01
-
+01
NA
-01
-01
-02
NA
NA
13
12
12
11
11
10
18
17
17
15
16
15
69
71
71
74
74
75
SA
UK
NZ
QLD
NSW
VIC
Not close toideal (1-4)Neutral (5-6)
Close to ideal(7-10)
Legend Statistically significant increase in avg from 2018 (at 99 level of Confidence)No statistical significant change in avg from 2018 (at 99 level of Confidence)Statistically significant decrease in avg from 2018 (at 99 level of Confidence)
COMPARISON OF SA CONSUMERSrsquo PERCEPTIONS TO OTHER JURISDICTIONSRatings for SA Government services have remained stable versus last year NSW has seen a significant increase and UK has seena significant decrease in satisfaction
35
Source Customer Service Commission Customer Satisfaction Measurement Survey 2019 Report developed in conjunction with the NSW Customer Service CommissionerPublic I1-A2
Note Average satisfaction expectation comparison to ideal service and expectation gap scores are subject to rounding
bull Compared to 2018 all jurisdictions with the exception of QLD and VIC have remained stable in regards to expectations and satisfaction
bull Satisfaction and Expectation scores for SA Government services have remained stable Whereas the ideal service score for SA has seen a significant increase of 04 points to 72
bull After statistically significant declines last year QLD has bounced back showing statistically significant gains across all three performance indicators with satisfaction showing a 05 points increase This has pushed QLD up in the rankings for all three performance indicators
bull VIC has seen decreases across all three performance indicators pushing their ranking down compared to last year
Figure 18 Satisfaction expectation and ideal across jurisdictions - Business
Business
Legend Statistically significant increase in avg from 2018 (at 99 level of Confidence)No statistical significant change in avg from 2018 (at 99 level of Confidence)Statistically significant decrease in avg from 2018 (at 99 level of Confidence)
Outcomemeasures Avg respondents
ExpectationHow would you rate your expectation of the overall quality of service
Satisfaction
Thinking about your experiences in the last 12 months how satisfied would you say you are with each of the following services in SA
Ideal service
hellipPlease imagine an idealservice How well do you think each service in SA compares to that ideal service
7
7
7
7
8
7
17
18
13
15
12
15
77
75
80
78
80
78
VIC
SA
QLD
UK
NZ
NSW
Low (1-4)
Medium (5-6)
High (7-10)
76
77
77
78
78
76
11
8
9
8
6
10
20
20
20
20
19
14
69
72
71
72
75
76
VIC
SA
UK
NSW
NZ
QLD
Dissatisfied (1-4)
Neutral (5-6)
Satisfied (7-10)
71
74
74
75
75
73
16
12
12
10
9
9
15
20
18
22
20
18
70
68
69
69
70
73
VIC
NSW
SA
UK
NZ
QLD
Not close toideal (1-4)
Neutral (5-6)
Close to ideal(7-10)
70
71
73
73
74
72
+06
+01
+01
+01
NA
-01
-
+01
NA
-04
+04
+05
-02
+04
+01
-03
+01
NA
COMPARISON OF SA BUSINESSESrsquo PERCEPTIONS TO OTHER JURISDICTIONSRatings for SA have remained stable across all measures QLD has see significant increases and VIC has seen significant declinesin satisfaction
36
Source Customer Service Commission Customer Satisfaction Measurement Survey 2019 Report developed in conjunction with the NSW Customer Service CommissionerPublic I1-A2
-037
-023
-028
-021
-032
-030
-027
-026
-022
-019
-017
-04 -02 00
VIC
SA
NSW
QLD
UK
NZ
2019 2018
Figure 110 2018 and 2019 expectation gap -Businesses
Note ndash Percentages do not add up to 100 due to exclusion of Donrsquot Know from the analysis
Consumersbull In SA the gap to expectation
remained relatively stable showing a small increase of 004 points versus last year
bull UK has seen an decrease in gap of 013 points
bull VIC has seen a decrease in gap of 007 points
Businessesbull Except QLD all jurisdictions show
an increase in the gap between satisfaction and expectation
bull The gap to expectation in SA has remained relatively stable versus last year increasing only by 003 points
Figure 19 2018 and 2019 expectation gap -Consumers
Consumer Business
-038
-029
-028
-031
-031
-047
-039
-036
-034
-026
-015
-06 -04 -02 00
VIC
NSW
UK
SA
NZ
QLD
2019 2018
NA
NA
Legend Statistically significant increase in avg from 2018 (at 99 level of Confidence)No statistical significant change in avg from 2018 (at 99 level of Confidence)Statistically significant decrease in avg from 2018 (at 99 level of Confidence)
GAP BETWEEN SATISFACTION AND EXPECTATION FOR CONSUMERS AND BUSINESSESIn SA the gap to expectation for both consumers and businesses has seen a slight increase this year
37
Source Customer Service Commission Customer Satisfaction Measurement Survey 2019 Report developed in conjunction with the NSW Customer Service CommissionerPublic I1-A2
-1 -05 0 05Avg
gap
bet
wee
n sa
tisfa
ctio
n an
d ex
pect
atio
n
-15 -1 -05 0 05 1
00
-13
-07
-07
Avg
gap
bet
wee
n sa
tisfa
ctio
n an
d ex
pect
atio
n01
-15
-13
-05
Services with the highest expectation gap
Services with the lowest expectation gap
Note Very small number of responses (nlt=30)All service comparisons will be shown in greater detail in the detailed chapters of this report For further service comparisons see Chapter 9
State Emergency Services (n=45)
Ambulance Services (n=24)
Figure 111 Satisfaction expectation gap - Consumer
Figure 112 Satisfaction expectation gap - Business
Child Welfare Services(n=51)
Courts(n=89)
Prisons(n=21)
Disability Services(n=33)Agricultural
Advice and Funding Services(n=10)
Public Housing (n=16)
Consumersbull There are no services that have a positive
expectation gap State Emergency Services have a zero point gap
bull Prisons have the highest negative expectation gap of -13 points followed by Courts and Child Welfare Services and Major Roads at -07 points
Businessesbull Of those with statistically reliable sample sizes
Disability Services have the highest negative expectation of -05 points
Consumer Business
GAP BETWEEN SATISFACTION AND EXPECTATION BY SERVICEAcross most services both consumers and businesses have a negative gap to expectation (expectation is higher than satisfaction)
-07Major Roads(n=81)
38
Source Customer Service Commission Customer Satisfaction Measurement Survey 2019 Report developed in conjunction with the NSW Customer Service CommissionerPublic I1-A2
Consumer Business
Service(n= for consumers n= for business)
Reach1 Average satisfaction (out of 10)
Average expectation score (out of 10) Gap to expectation
Consumer Business Consumer Business Consumer Business Consumer BusinessFire Brigades (n=24 n=15) 1 2 91 91 93 91 -02 00
State Emergency Serv (n=47 n=13) 3 3 90 87 91 87 00 00
Ambulance Serv (n=208 n=24) 17 7 87 91 90 90 -03 01
Art Galleries and Museums (n=121 n=13) 13 3 87 82 88 84 -02 -02Vehicle Licensing and Registration (n=580 n=135) 56 43 80 71 82 75 -01 -04
Public Schools (n=228 n=51) 19 14 76 66 79 70 -03 -05
Water Supply (n=240 n=67) 24 23 76 74 78 77 -02 -03
Police (n=217 n=35) 21 9 75 80 78 81 -03 -01
Public Hospitals (n=412 n=76) 41 18 74 69 77 72 -03 -03
Public Transport (n=390 n=47) 38 13 74 72 76 76 -02 -03
Consumer Affairs (n=38 n=27) 4 8 73 75 77 77 -04 -02
Documentation Serv (n=42 n=17) 4 5 73 80 76 83 -03 -03Environment and Wildlife Protection (n=38 n=19) 3 4 73 74 75 78 -03 -04
Business Advisory Serv (n=17 n=35) 1 11 73 72 73 75 -01 -03
Serv for Older People (n=114 n=28) 9 7 73 71 77 75 -04 -04
TAFE Serv (n=126 n=36) 11 9 70 67 72 68 -03 -01Agricultural Advice and Funding Serv (n=13 n=10) 1 2 68 61 70 74 -02 -13
Disability Serv (n=100 n=34) 9 10 66 74 70 79 -03 -05
Major Roads (n=86 n=11) 8 3 65 74 71 75 -07 -01
Public Housing (n=87 n=16) 9 5 63 55 67 70 -04 -15
Courts (n=94 n=19) 6 4 63 74 70 79 -07 -05
Prison (n=23 n=14) 2 2 54 79 67 83 -13 -03
Child Welfare Serv (n=52 n=20) 3 3 45 70 52 75 -07 -05
Figure 113 Summary of variation in key performance measures across services
Interpret with caution Very small number of responses (nlt=30) 1 of customers who have interacted with this service in the last 12 months | Top bottom six in each category compared to other services
SUMMARY OF SERVICE PERFORMANCE BY SATISFACTION AND EXPECTATIONIn terms of average satisfaction score Fire Brigades State Emergency Services Ambulance Services and Art Galleries and Museums are the top rating services
39
Public ndash I1-A2
SOUTH AUSTRALIAN CUSTOMER SATISFACTION MEASUREMENT SURVEY 2019
2 PERFORMANCE AGAINST CUSTOMER SATISFACTION ATTRIBUTES
Source Customer Service Commission Customer Satisfaction Measurement Survey 2019 Report developed in conjunction with the NSW Customer Service CommissionerPublic I1-A2
Satisfaction Drivers Average score across respondents (out of 10 according to a scale from 1 strongly disagree to 10 strongly agree)
Employees for SA1) Honesty and integrity of
employees2) Efficiency and effectiveness of
employees3) Communication
Average across attributes
Employees across jurisdictions1) Honesty and integrity of
employees2) Efficiency and effectiveness of
employees3) Communication
Average across attributes
77 76 7675 74 74 74 74 73
7070 69
78 7877
76 76 76 76 7575
72
7172
65
70
75
80
Are
hone
st
Del
iver
hig
h sa
fety
sta
ndar
ds
Prov
ide
serv
ices
with
out b
ias
Expl
ain
inte
nded
act
ions
cle
arly
Enge
nder
con
fiden
ce in
thei
r kno
wle
dge
Com
mun
icat
e w
ell
Prov
ide
good
val
ue s
ervi
ces
Are
relia
ble
Are
cons
iste
nt
Are
held
acc
ount
able
See
thin
gs fr
om m
y pe
rspe
ctiv
e
Get
thin
gs d
one
as q
uick
ly a
s po
ssib
le
NZ (n=2815) UK (n=2897) SA (n=2727) VIC (n=2991) QLD (n=2844) NSW (n=5686)
Average 7410
7510
QLD
7510
NZ
7510
VIC
7510
NSW
7410
UK
Figure 21 Consumer perceptions of employee related attributes
Top 3 performing attributes include
bull lsquoAre honestrsquo (77 out of 10)bull lsquoDeliver high safety standardsrsquo (76 out
of 10) bull lsquoProvide services without biasrsquo (76 out if
10)
Bottom 3 lowest performing attributes include
bull lsquoGet things done as quickly as possiblersquo (69 out of 10)
bull lsquoSee things from my perspectiversquo (70 out of 10)
bull lsquoAre held accountablersquo (70 out of 10)
When compared with other jurisdictions
bull SA along with the UK was the lowest performing jurisdiction (74 out of 10) on average However the gap between highest and lowest performing jurisdictions is very small
Base(n)=2704
77 76 76 75 74 74 74 74 7370 70 69
556065707580
Are
hone
st
Del
iver
hig
hsa
fety
sta
ndar
ds
Prov
ide
serv
ices
with
out b
ias
Expl
ain
inte
nded
actio
ns c
lear
ly
Enge
nder
conf
iden
ce in
thei
r kno
wle
dge
Com
mun
icat
ew
ell
Prov
ide
good
valu
e se
rvic
es
Are
relia
ble
Are
cons
iste
nt
Are
held
acco
unta
ble
See
thin
gs fr
omm
y pe
rspe
ctiv
e
Get
thin
gs d
one
as q
uick
ly a
spo
ssib
le
Consumer
+01 +01 - - - - - - --
+01 -01
CONSUMER PERCEPTION OF EMPLOYEESThere were no statistically significant changes in perceptions of employees versus 2018
Legend Statistically significant increase in avg from 2018 (at 99 level of Confidence)No significant change in avg from 2018(at 99 level of Confidence)Statistically significant decrease in avg from 2018 (at 99 level of Confidence)
41
Source Customer Service Commission Customer Satisfaction Measurement Survey 2019 Report developed in conjunction with the NSW Customer Service CommissionerPublic I1-A2
Satisfaction Drivers Average score across respondents (according to a scale from 1 strongly disagree to 10 strongly agree)
Process for SA1) Simplicity and efficiency of
processes2) Employee autonomy
Average across attributes
Process across jurisdictions1) Simplicity and efficiency of
processes2) Employee autonomy
Average across attributes
7068
65 6563
55
65
75
Processes areeasy to
understand
Employees areempowered tomake decisions
I can get to theright person the
first time
Service feelsseamless even if I
have to usemultiple contact
methods
Are designed toreduce wait timesAverage 66
10
70
68
65 65
63
72
70
6868
67
60
65
70
75
Processes areeasy to understand
Employees areempowered tomake decisions
I can get to theright person the
first time
Service feelsseamless even if I
have to usemultiple contact
methods
Are designed toreduce wait times
NZ (n=2677) UK (n=2735) SA (n=2617) VIC (n=2924) QLD (n=2851) NSW (n=5638)
6910
QLD
6810
NZ
6910
VIC
6910
NSW
6710
UK
bull lsquoProcesses are easy to understandrsquo is the best performing attribute with a score of 7 out of 10 However as with previous years execution of these processes (empowered employees getting to the right person the first time seamless service and wait times) continue to have lower scores ranging from 68 to 63 out of 10 This pattern is observed across all jurisdictions
bull SA is behind other jurisdictions for all process attributes
bull Across all jurisdictions process attributes have the lowest average scores of all attribute categories (Values Goals and Employees) ndashsimplifying and bringing efficiencies to processes remains a challenge for all jurisdictions
Figure 22 Consumer perceptions of process related attributes
Base(n)=2668
Consumer
+01+01
-01 - -
CONSUMER PERCEPTION OF PROCESSESThere have been no statistically significant changes to any of the process attribute scores in comparison to last year
Legend Statistically significant increase in avg from 2018 (at 99 level of Confidence)No significant change in avg from 2018(at 99 level of Confidence)Statistically significant decrease in avg from 2018 (at 99 level of Confidence)
42
Source Customer Service Commission Customer Satisfaction Measurement Survey 2019 Report developed in conjunction with the NSW Customer Service CommissionerPublic I1-A2
Satisfaction Drivers Average score across respondents (according to a scale from 1 strongly disagree to 10 strongly agree)
Goals for SA1) Privacy2) Transparency3) Access
Average across attributes
Goals across jurisdictions1) Privacy2) Transparency3) Access
Average across attributes
7570 68 67
61
55
65
75
Safeguard privacyand confidentiality
Is making it easierto access
information abouttheir services
Is making best useof online services
to improveconvenience and
efficiency forcustomers
Demonstrateopenness andtransparency indecision-making
Encourage publicparticipation in
decision-makingAverage 68
10
75
70
6867
61
76
72
7170
65
60
65
70
75
80
Safeguard privacyand confidentiality
Is making it easierto access
information abouttheir services
Is making best useof online services
to improveconvenience and
efficiency forcustomers
Demonstrateopenness andtransparency indecision-making
Encourage publicparticipation in
decision-making
NZ (n=2681) UK (n=2785) SA (n=2582) VIC (n=2803) QLD (n=2732) NSW (n=5486)
7010
NZ
7010
QLD
7110
VIC
7110
NSW
6910
UK
bull lsquoSafeguard privacy and confidentialityrsquo is the highest rated goal attribute
bull In comparison to other jurisdictions SA continues to lag on all goal attributes
bull lsquoEncourage public participation in decision makingrsquo is the attribute that sees the lowest scores across all jurisdictions It is also the attribute with the widest gap between the top performing and lowest performing jurisdictions (VIC and SA) with a gap of 04 points
Figure 23 Consumer perceptions of goals related attributes
Base(n)=2561
Consumer
CONSUMER PERCEPTION OF GOALSConsumer perceptions of SA Government services against goal related attributes have remained statistically stable versus last year
+01
+01- - -01
Legend Statistically significant increase in avg from 2018 (at 99 level of Confidence)No significant change in avg from 2018(at 99 level of Confidence)Statistically significant decrease in avg from 2018 (at 99 level of Confidence)
43
Source Customer Service Commission Customer Satisfaction Measurement Survey 2019 Report developed in conjunction with the NSW Customer Service CommissionerPublic I1-A2
Satisfaction Drivers Average score across respondents (according to a scale from 1 strongly disagree to 10 strongly agree)
Values for SA1) Service Quality2) Accountability
Average across attributes
Values across jurisdictions1) Service Quality2) Accountability
Average across attributes
Average 7210
73 72 72 70
55
65
75
Operates with integrity Provides good service Is a body I can trust Is accountable for itsservices
7372 72
70
7575
74
73
65
70
75
80
Operates with integrity Provides good service Is a body I can trust Is accountable for itsservices
NZ (n=3108) UK (n=3068) SA (n=2936) VIC (n=3166) QLD (n=3059) NSW (n=6113)
7410
UK
7310
NZ
7410
VIC
7410
NSW
7310
QLD
bull Consumers rate SA Governmentservices high (above 7 out of 10)across all value attributes
bull At an overall level SA is behind all other jurisdictions with the lowest average score across all value attributes
Figure 24 Consumer perceptions of values related attributes
Base(n)=2916
Consumer
- - --
CONSUMER PERCEPTION OF VALUESThere have been no statistically significant changes to the ratings of value attributes versus last year
Legend Statistically significant increase in avg from 2018 (at 99 level of Confidence)No significant change in avg from 2018(at 99 level of Confidence)Statistically significant decrease in avg from 2018 (at 99 level of Confidence)
44
Source Customer Service Commission Customer Satisfaction Measurement Survey 2019 Report developed in conjunction with the NSW Customer Service CommissionerPublic I1-A2
Satisfaction Drivers Average score across respondents (according to a scale from 1 strongly disagree to 10 strongly agree)
Employees for SA1) Honesty and integrity of
employees2) Efficiency and effectiveness of
employees3) CommunicationAverage across attributes
Employees across jurisdictions1) Honesty and integrity of
employees2) Efficiency and effectiveness of
employees3) Communication
75 75 73 72 72 72 71 71 71 69 68 68
55
65
75
85
Are
hone
st
Del
iver
hig
hsa
fety
sta
ndar
ds
Prov
ide
serv
ices
with
out b
ias
Expl
ain
inte
nded
actio
ns c
lear
ly
Enge
nder
conf
iden
ce in
thei
r kno
wle
dge
Com
mun
icat
ew
ell
Are
cons
iste
nt
Prov
ide
good
valu
e se
rvic
es
Are
relia
ble
Are
held
acco
unta
ble
Get
thin
gs d
one
as q
uick
ly a
spo
ssib
le
See
thin
gs fr
omm
y pe
rspe
ctiv
e
7372 73
7271
7170
72 72
68 6968
77 7775
7574
75 75 74 74
7170 71
65
70
75
80
Are
hone
st
Del
iver
hig
h sa
fety
sta
ndar
ds
Prov
ide
serv
ices
with
out b
ias
Expl
ain
inte
nded
act
ions
cle
arly
Enge
nder
con
fiden
ce in
thei
rkn
owle
dge
Com
mun
icat
e w
ell
Are
cons
iste
nt
Prov
ide
good
val
ue s
ervi
ces
Are
relia
ble
Are
held
acc
ount
able
Get
thin
gs d
one
as q
uick
ly a
s po
ssib
le
See
thin
gs fr
om m
y pe
rspe
ctiv
e
NZ (n=757) UK (n=1327) SA (n=657) VIC (n=714) QLD (n=748) NSW (n=1586)
Average 7110
7210
UK
7210
NSW
7310
NZ
7410
QLD
7110
VIC
bull The attribute lsquoAre honestrsquo is the top ranking attribute this year
bull Other top attributes are lsquodeliver high safety standardsrsquo and lsquoprovide services without biasrsquo
Bottom 3 lowest performing attributes are
bull lsquoSee things from my perspectiversquo (68 out of 10)
bull lsquoGet things done as quickly as possiblersquo (69 out of 10)
bull lsquoAre held accountablersquo (68 out of 10)
Across jurisdictions VIC has the lowest average ratings for employee perceptions
QLD has the highest average rating in 2019 after being in the last spot in 2018
Figure 25 Business perceptions of employee related attributes
Base(n)=724
Business
BUSINESS PERCEPTION OF EMPLOYEESThere have been no statistically significant changes to the ratings of employee attributes versus last year
+02 +01 +02 +01 +01 +01 +01 +01 - +02
+01 +01
Legend Statistically significant increase in avg from 2018 (at 99 level of Confidence)No significant change in avg from 2018(at 99 level of Confidence)Statistically significant decrease in avg from 2018 (at 99 level of Confidence)
45
Source Customer Service Commission Customer Satisfaction Measurement Survey 2019 Report developed in conjunction with the NSW Customer Service CommissionerPublic I1-A2
Satisfaction Drivers Average score across respondents (according to a scale from 1 strongly disagree to 10 strongly agree)
Process for SA1) Simplicity and efficiency of
processes2) Employee autonomy
Average across attributes
Process across jurisdictions1) Simplicity and efficiency of
processes2) Employee autonomy
Average across attributes
68 66 65 6561
55
65
75
Processes areeasy to understand
Employees areempowered tomake decisions
Service feelsseamless even if I
have to usemultiple contact
methods
I can get to theright person the
first time
Are designed toreduce wait times
Average 6510
6710
UK
6510
NSW
6710
NZ
6810
QLD
6510
VIC
68
66 65
6561
71
68 6767 67
60
65
70
75
Processes areeasy to understand
Employees areempowered tomake decisions
Service feelsseamless even if I
have to usemultiple contact
methods
I can get to theright person the
first time
Are designed toreduce wait times
NZ (n=731) UK (N=1324) SA (n=661) VIC (n=711) QLD (n=745) NSW (n=1614)
bull Average rating for process attributes are the lowest in comparison to other attributes (employees ndash 71 goals ndash 68 values ndash 71)
bull Among all jurisdictions QLD has the highest average rating of 68 out of 10
bull SA ranks lowest among all jurisdictions for the statement lsquoAredesigned to reduce wait timesrsquo
Figure 26 Business perceptions of process related attributes
Base(n)= 712
Business
BUSINESS PERCEPTION OF PROCESSESAll the processes related attributes have remained stable from 2018 to 2019
+01+01
+01+01-01
Legend Statistically significant increase in avg from 2018 (at 99 level of Confidence)No significant change in avg from 2018(at 99 level of Confidence)Statistically significant decrease in avg from 2018 (at 99 level of Confidence)
46
Source Customer Service Commission Customer Satisfaction Measurement Survey 2019 Report developed in conjunction with the NSW Customer Service CommissionerPublic I1-A2
Satisfaction Drivers Average score across respondents (out of 10 on scale of according to a scale from 1 strongly disagree to 10 strongly agree)
Goals for SA1) Privacy2) Transparency3) Access
Average across attributes
Goals across jurisdictions1) Privacy2) Transparency3) Access
Average across attributes
7469 68 67
63
55
65
75
85
Safeguard privacyand confidentiality
Is making it easierto access
information abouttheir services
Is making best useof online services
to improveconvenience and
efficiency forcustomers
Demonstrateopenness andtransparency indecision-making
Encourage publicparticipation in
decision-makingAverage 68
10
6910
UK
6810
NSW
6910
NZ
6910
QLD
6710
VIC
77
71
69 67
62
71
6866 66
6260
65
70
75
80
Safeguard privacyand confidentiality
Is making it easierto access
information abouttheir services
Is making best useof online services
to improveconvenience and
efficiency forcustomers
Demonstrateopenness andtransparency indecision-making
Encourage publicparticipation in
decision-making
NZ (n=732) UK (n=1295) SA (n=641) VIC (n=681) QLD (n=708) NSW (n=1554)
bull Compared to 2018 lsquoEncourage public participation in decision makingrsquo has seen a statisticallysignificant increase of 04 points to 61 out of 10 However this continues to be the lowest rated goal related attribute
bull Across jurisdictions QLD has the highest average rating of 69
bull The largest gap between jurisdictions is seen for lsquoSafeguard privacy and confidentialityrsquo with NZ having the highest rating of 77 out of 10 and VIC having the lowest rating of 71 out of 10
Figure 27 Business perceptions of goals related attributes
Base(n)= 695
Business
04
Legend Statistically significant increase in avg from 2018 (at 99 level of Confidence)No significant change in avg from 2018(at 99 level of Confidence)Statistically significant decrease in avg from 2018 (at 99 level of Confidence)
BUSINESS PERCEPTION OF GOALSMost goal related attributes with the exception of lsquoEncourage public participation in decision-makingrsquo have remained stable versus last year
+03 -03 +03 +02
47
Source Customer Service Commission Customer Satisfaction Measurement Survey 2019 Report developed in conjunction with the NSW Customer Service CommissionerPublic I1-A2
Satisfaction Drivers Average score across respondents (out of 10 on scale of according to a scale from 1 strongly disagree to 10 strongly agree)
Values for SA1) Service Quality2) Accountability
Average across attributes
Values across jurisdictions1) Service Quality2) Accountability
Average across attributes
Average 7110
74 74 74
71
71 71 71
69
65
70
75
80
Operates with integrity Provides good service Is a body I can trust Is accountable for itsservices
NZ (n=803) UK (n=1367) SA (n=702) VIC (n=748) QLD (n=789) NSW (n=1676)
7210
UK
7110
NSW
7210
QLD
7310
NZ
7010
VIC
72 71 71 70
55
65
75
Operates with integrity Provides good service Is a body I can trust Is accountable for itsservices
bull lsquoIntegrityrsquo is the top rated value attribute with a rating of 72 out of 10
bull While lsquoaccountabilityrsquo is the least rated attribute there has been a 02 point increase (statistically insignificant) versus 2018
bull Across jurisdictions VIC has slipped to the lowest ranking after being the top performing Australian jurisdiction last year and NZ has the highest average rating of 73 out of 10 making it the top performingjurisdiction in 2019
bull The gap between the top performing jurisdiction and lowest performer have narrowed in comparison to last year indicating an improvement in performance across jurisdictions
Figure 28 Business perceptions of values related attributes
Base(n)= 758
Business
BUSINESS PERCEPTION OF VALUESValue related attributes continue to be statistically stable in 2019
+01 +01 +01 +02
Legend Statistically significant increase in avg from 2018 (at 99 level of Confidence)No significant change in avg from 2018(at 99 level of Confidence)Statistically significant decrease in avg from 2018 (at 99 level of Confidence)
48
Source Customer Service Commission Customer Satisfaction Measurement Survey 2019 Report developed in conjunction with the NSW Customer Service CommissionerPublic I1-A2
Employee attributes Goals Processes Values
1Note Groupings of drivers of satisfaction are based on analyses of NSW Government services however it is assumed that drivers of satisfaction are relatively consistent across jurisdictions and generally across service industries broadly
bull Safeguard privacy and confidentiality
Goa
ls
bull Provide good value servicesbull Are honestbull Are reliablebull Deliver high safety standards
Empl
oyee
s
bull Are consistentbull Explain intended actions clearlybull Communicate wellbull Engender confidence in their
knowledge
Communication of employees
bull Are held accountablebull Get things done as quickly as
possible
Efficiency and Effectiveness of employeesHonesty and integrity of employees
Employee autonomySimplicity and efficiency of processes
bull Processes are easy to understandbull Service feels seamless across channelsbull Processes are designed to reduce wait timesbull I can get to the right person the first time
bull Employees are empowered to make decisions
Accountability and Service Quality
bull Is a body that I can trustbull Operates with integritybull Provides good value servicesbull Is accountable for its services
Proc
esse
sVa
lues
Access to Information and Online services PrivacyTransparency
bull Demonstrate openness and transparency in decision making
bull Encourage public participation in decision making
bull Is making it easier to access information about their service
bull Is making best use of online services to improve efficiency for customers
bull See things from my perspective
bull Provide services without bias
Fairness and Empathy of employees
Consumer
GROUPINGS OF DRIVERS OF CUSTOMER SATIFACTION1
The groupings of drivers have changed from 2018 - lsquoFairness and Empathyrsquo is now a key standalone driver of consumer satisfaction differentiated from Communication which continues to be a key driver of consumer satisfaction
49
Source Customer Service Commission Customer Satisfaction Measurement Survey 2019 Report developed in conjunction with the NSW Customer Service CommissionerPublic I1-A2
KEY
When looking at the relative importance of satisfaction drivers in NSW Employee related attributes are seen to have the highest relative importance as drivers of satisfaction with lsquoHonesty and Integrityrsquo being the most important driverRelating this to the areas of improvement for the SA Governmentbull Honesty and Integrity is a strength that the SA
Government services can build on to improve consumer satisfaction
bull Access to information and online services as well as efficiency and effectiveness of employees are primary opportunities to drive higher consumer satisfaction
Note Groupings of drivers of satisfaction are based on analyses of NSW Government services however it is assumed that drivers of satisfaction are relatively consistent across jurisdictions and generally across service industries broadly
LOW
HIGH
Average score across attributes (SA)(out of 10)
LOW
HIGH
Rel
ativ
e im
port
ance
(NSW
)
Median across all attributes
1Note Analysis displayed is based on NSW customer data however similar results are observed for businesses Calculation is based on the relativity of parameters in the statistical analysis of drivers against satisfaction
Strengths to lsquobuild onrsquo
Median across drivers
Primary opportunities
Secondary opportunities
Fairness and Empathy
Simplicity and efficiency of processes
Transparency
Access to information and online services
Privacy
Employee autonomy
Employee attributes Goals Processes
Figure 211 Importance (NSW) versus performance (SA) against each of the drivers of satisfaction
Monitor
Communication
Consumer
Efficiency and effectiveness
Honesty and integrity
PRIORITISATION OF DRIVERS OF SATISFACTION1
Build on the honesty and integrity of employees and focus on improving their efficiency and effectiveness to drive higher satisfaction In addition focus on improving access to information and online services
50
Public ndash I1-A2
SOUTH AUSTRALIAN CUSTOMER SATISFACTION MEASUREMENT SURVEY 2019
3 SATISFACTION BY CONTACT METHOD AND DIGITAL INSIGHTS
Source Customer Service Commission Customer Satisfaction Measurement Survey 2019 Report developed in conjunction with the NSW Customer Service CommissionerPublic I1-A2
51
4135
29
128
47
40
29 27
15
6
Inperson
Phone Online Email Mail fax Thirdparties
2018 Business (n=814) 2019 Business (n=762)
c
usto
mer
s w
ho h
ave
had
dire
ct
deal
ings
via
this
cha
nnel
Figure 33 2018 and 2019 channel usage - Business
Figure 34 2018 and 2019 most preferred channel ndash Business
2922 22 22
2 4
3224 23
16
3 2
In person Email Phone Online Mailfax Thirdparties
2018 Business(n=795) 2019 Business(n=743)
Note ndash Percentages do not add up to 100 due to exclusion of Donrsquot Know from the analysis
Businessesbull While lsquoin personrsquo remains the most
used channel for contact there is a continued decline in usage since 2017 (52 in 2017 51 in 2018 47 in 2019) though not statistically significant
bull Despite the year on year declines lsquoin personrsquo continues to be the most preferred channel and there has been a year on year growth in preference since 2017 (27 in 2017 29 in 2018 32 in 2019)
57
3325
139 6
58
3426
1610
5
Inperson
Phone Online Email Mail fax Thirdparties
2018 Consumer (n=3307) 2019 Consumer (n=3297)
34
22 2112
4 2
3324 21
16
4 2
Inperson
Phone Online Email Mailfax Thirdparties
2018 Consumer (n=3307) 2019 Consumer (n=3170)
cus
tom
ers
who
hav
e ha
d di
rect
de
alin
gs v
ia th
is c
hann
el
Figure 31 2018 and 2019 channel usage - Consumer
Figure 32 2018 and 2019 most preferred channel - Consumer
Consumersbull lsquoIn personrsquo continues to be the most used
channel for contact as well as the most preferred channel Usage has remained consistent versus last year
bull Phone usage by consumers continues to see a year on year uptick though statistically insignificant (31 in 2017 33 in 2018 and 34 in 2019)
bull Relative preferences for the channels have remained unchanged versus last year
Consumer Business
CONTACT METHODS USED AND PREFERREDlsquoIn-personrsquo continues to be the most used and preferred method of contact for both consumers and businesses
52
Source Customer Service Commission Customer Satisfaction Measurement Survey 2019 Report developed in conjunction with the NSW Customer Service CommissionerPublic I1-A2
47
41
3130
12
5
4442
2529
96
56
40
24
31
96
4650
25
40
16
4
51
41
24
37
13
3
47
40
29 27
15
6
In person face toface
Telephone Online Email Mail posted letterfax
Third parties
NSW (n=1801) VIC (n=790) QLD (n=832)
UK (n=1420) NZ (n=868) SA (n=762)
Customers were asked ldquoWhich of the following contact methods have you used to carry out your direct dealings with the following services in [Jurisdiction] in the last 12 monthsrdquo
Figure 35 Contact method used to interact with government services across jurisdictions
59
31 31
16
84
54
33
2320
10
6
59
31
24
17
10
5
53
36
23 2116
2
57
31
24
19
13
2
58
34
26
16
105
In person face toface
Telephone Online Email Mail posted letterfax
Third parties
NSW (n=6771) VIC (n=3458) QLD (n=3346)UK (n=3310) NZ (n=3550) SA (n=3297)
Consumer
Business
Consumersbull Face to face is the most used channel
by consumers to access government services in all jurisdictions
bull NSW leads the way when it comes to the use of online channels
Businessesbull Face to face is the most used channel by
businesses to access government services in all jurisdictions
bull NSW leads in the adoption of online as a contact method followed by SA
bull Business usage of telephones and emails as a contact method is higher than that for consumers across all jurisdictions
Consumer Business
CONTACT METHODS USED AND PREFERREDlsquoIn-personrsquo is the most used contact method across all jurisdictions for both consumers and businesses SA is second to NSW in the usage of online as the method of contact for both consumers and businesses
53
Source Customer Service Commission Customer Satisfaction Measurement Survey 2019 Report developed in conjunction with the NSW Customer Service CommissionerPublic I1-A2
28
24 24
18
42
26
22
28
20
2 2
29
25
22
18
3 2
25
2826
16
5
0
29
26
23
18
31
32
24 23
16
32
In person face toface
Email Telephone Online Mail posted letterfax
Third parties
NSW (n=1759) VIC (n=774) QLD (n=809)UK (n=1401) NZ (n=850) SA (n=743)
35
18
24
18
32
33
23
19 19
52
34
21 20 20
42
31
2219
22
6
1
34
21 21 20
41
33
2421
16
42
In person face toface
Telephone Online Email Mail posted letterfax
Third parties
NSW (n=6491) VIC (n=3336) QLD (n=3246)UK (n=3177) NZ (n=3399) SA (n=3170)
CONTACT METHODS PREFERRED ACROSS JURISDICTIONSlsquoIn-personrsquo continues to be the most preferred channel across all jurisdictions for both consumers and businesses
Customers were asked ldquoGenerally which contact method do you most prefer when dealing directly with each of the following services inhelliprdquo
Figure 36 Contact method preferred to interact with government services across jurisdictions
Consumer
Business
Consumersbull Face to face is the preferred method of
contact for consumers to access government services in all jurisdictions
bull The pattern of preference is consistent with that of reported channel usage
Businessesbull Businesses prefer a variety of contact
methods to access government servicesbull Of all jurisdictions SA businesses have
the highest preference for face to face interactions
Consumer Business
54
Source Customer Service Commission Customer Satisfaction Measurement Survey 2019 Report developed in conjunction with the NSW Customer Service CommissionerPublic I1-A2
75
70 71 71 69 68
73 73 72 72 7167
50
60
70
80
In person Online Mailfax Phone Email Third parties2018 Business(n=814) 2019 Business(n=762)
Aver
age
satis
fact
ion
scor
e (1
-10)
76 7573 72 72
70
77 75 74 73 71 70
50
60
70
80
Online In person Third parties Phone Mailfax Email2018 Consumer (n=3307) 2019 Consumer (n=3297)
Aver
age
satis
fact
ion
scor
e (1
-10)
VARIATION IN CUSTOMER SATISFACTION BY CONTACT METHODWhile lsquoin-personrsquo is the most used and most preferred method of contact satisfaction of consumers with SA Government services is higher for those who use Online channels For businesses satisfaction is high for both in-person and online channel users
Customers were asked ldquoWhich of the following contact methods have you used to carry out your direct dealings with the following servicesrdquo
Figure 37 Variation in overall satisfaction by contact method
+01+01
+03
- -
+02+01
+01
+01
-01
Consumersbull Satisfaction ratings are high (7+ out
of 10) across all contact channelsbull Consumers who have used online
channels to contact have the highest satisfaction rating and this has remained relatively stable from last year
Businessesbull Satisfaction amongst businesses
using different channels have remained relatively stable compared to last year
bull Businesses who have used face to face or online methods of contact have the highest satisfaction rating
+01
Consumer Business
Legend Statistically significant increase in avg from 2018 (at 99 level of Confidence)No significant change in avg from 2018 (at 99 level of Confidence)Statistically significant decrease in avg from 2018 (at 99 level of Confidence)
-02
55
Source Customer Service Commission Customer Satisfaction Measurement Survey 2019 Report developed in conjunction with the NSW Customer Service CommissionerPublic I1-A2
7978
74
7675
74
76 77
7374
7273
7877
75 75 75
71
76 7675 75
71 71
77 76
7475
73
77
75
74 73
7170
Online In person face to face Third parties such asAustralia Post
Telephone Mail posted letter fax Email
NSW (n=6771) VIC (n=3458) QLD (n=3346) UK (n=3310) NZ (n=3550) SA (n=3297)
7575
71
7271 71
73 73 73
69
67
73
77
73
7776
71
68
75
72
68
74
71
70
74
79
76
71
73
77
73 7372 72 71
67
In person face toface
Online Mail posted letter fax Telephone Email Third parties such asAustralia Post
NSW (n=1801) VIC (n=790) QLD (n=832) UK (n=1420) NZ (n=868) SA (n=762)
Figure 38 Overall satisfaction with government services by contact method(s) used across jurisdictions
Aver
age
scor
e (1
-10)
Aver
age
scor
e (1
-10)
Consumer
Business
Consumersbull Across jurisdictions
consumers who use online channels have the highest satisfaction with their respective government services
bull Consumers in NZ using online channels show the highest satisfaction of all jurisdictions
Businessesbull In all jurisdictions except
NZ businesses that use face to face have the highest satisfaction with their respective government services In NZ online users have the highest satisfaction
bull SA businesses who use third party channels show the lowest satisfaction in comparison to businesses that use other channels
Consumer Business
VARIATION IN CUSTOMER SATISFACTION BY CONTACT METHOD ACROSS JURISDICTIONSConsumers who use online and businesses who use face to face have higher satisfaction with government services across jurisdiction
81
56
Source Customer Service Commission Customer Satisfaction Measurement Survey 2019 Report developed in conjunction with the NSW Customer Service CommissionerPublic I1-A2
7069
65 66
62
6765
63 6360
6866
63 6261
6461
59 59 58
70
67 66 6564
69 6865 65
62
Processes are easy tounderstand
Employees are empoweredto make decisions
Service feels seamlesseven if I have to
communicate acrossdifferent channels (ieonline phone email)
I can get to the right personthe first time
Are designed to reducewait times
In person face to face (n=1418) Mail posted letter fax (n=229)
Telephone (landline mobile calls text message) (n=883) Email (n=419)
Online (n=591) Third parties such as Australia Post (n=117)
6865 66 66
61
66 66 66 66
55
6462 62 62
57
65 6562 61
57
6865 63 63
60
74
69 6972
65
Processes are easy tounderstand
Service feels seamlesseven if I have to
communicate acrossdifferent channels
Employees are empoweredto make decisions
I can get to the right personthe first time
Are designed to reducewait times
In person face to face (n=300) Mail posted letter fax (n=87)
Telephone (landline mobile calls text message) (n=280) Email (n=207)
Online (n=178) Third parties such as Australia Post (n=31)
Figure 310 Perceptions of processes by channel(s) used - Business
Figure 39 Perceptions of processes by channel(s) used - Consumers
Aver
age
scor
e (1
-10)
Aver
age
scor
e (1
-10)
Consumersbull Consumers who have used in-person channels give
the highest scores for lsquoprocesses are easy to understandrsquo lsquoemployees are empowered to make decisionsrsquo and lsquoI can get to the right person the first timersquo
bull Consumers who have used online channels gave the highest ratings to lsquoService feels seamlessrsquo and lsquoare designed to reduce wait timesrsquo
bull Consumers who have used email rate the SA Government service lowest across all process attributes
Businessesbull Businesses who have used third party channels have
given the highest ratings for all process attributesbull Businesses that used mail posted letter or fax as
their method of contact rated the SA Government lowest on processes lsquoare designed to reduce wait timesrsquo attribute
bull Businesses that used telephone gave the lowest ratings to the attributes of lsquoprocesses are easy to understandrsquo lsquoservice feels seamlessrsquo and lsquoemployees are empowered to make decisionsrsquo
bull Business that used email gave the lowest rating to lsquoI can get to the right person the first timersquo
Consumer Business
PERCEPTIONS OF PROCESSES BY CONTACT METHODConsumers and businesses have different perceptions of processes based on the channels they have used
57
Source Customer Service Commission Customer Satisfaction Measurement Survey 2019 Report developed in conjunction with the NSW Customer Service CommissionerPublic I1-A2
79 79 78 78 78 78 78 75
102030405060708090100
0102030405060708090
100
I trust myinformation was
handledsecurely
through thewebsiteapp
I achieved theoutcome by
using servicesavailable online
The contentwas current
and accurate
The format ofcontent met my
accessrequirements
I was satisfiedwith the overallexperience of
using thewebsiteapp tocomplete the
task
Thewebsiteapp
was useful andallowed me todo everything Ineeded to do
Content andsupport
provided onlinewas sufficientto answer my
questions
I found thewebsite appsimple and itwas easy to
find what I waslooking for
Disagree (1-4) Neutral (5-6) Agree (7-10) Average
Customers were asked ldquoThinking about your experiences interacting with SA services online in the last 12 months to what extent do you agree or disagree with each of the following statementsrdquo
Figure 311 Satisfaction with attributes of online services
82 81 81 80 79 79 79 78
102030405060708090100
0102030405060708090
100
The contentwas current
and accurate
I achieved theoutcome by
using servicesavailable online
I trust myinformation
was handledsecurely
through thewebsiteapp
The format ofcontent met my
accessrequirements
I was satisfiedwith the overallexperience of
using thewebsiteapp tocomplete the
task
Thewebsiteapp
was useful andallowed me todo everything Ineeded to do
Content andsupport
provided onlinewas sufficientto answer my
questions
I found thewebsite appsimple and itwas easy to
find what I waslooking for
Disagree (1-4) Neutral (5-6) Agree (7-10) Average
Axis 2 Average Score
Consumer (n=798)
Business (n=210)
Axis
1
Perc
enta
ge o
f re
spon
ses
Axis 2 Average ScoreAxis
1
Perc
enta
ge o
f re
spon
ses
Consumersbull Consumers had an average rating of 79
out of 10 when asked about their satisfaction with the overall experience of using the website app to complete the task This rating has stayed stable since 2017
bull Consumers showed the highest levels of agreement with statements pertaining to accuracy of content achieving desired outcomes by using online services and trusting that their information was handled securely
Businessesbull There has been a significant increase in
the average rating across all attributes of online service except content accuracy ndash this has remained stable
bull The rating on satisfaction with the overall experience has gone up significantly by 08 points to 78
+01 +01 +01 +02+01 +01 +02
+05 NA +04 +09 +08 +06 +06
Consumer Business
Legend Statistically significant increase in avg from 2018 (at 99 level of Confidence)No significant change in avg from 2018 (at 99 level of Confidence)Statistically significant decrease in avg from 2018 (at 99 level of Confidence)
NA
+09
SATISFACTION WITH ONLINE SERVICES OVERALLConsumer satisfaction with overall experience of using online services has remained stable while business satisfaction has increased significantly from 2018 to 2019
58
Source Customer Service Commission Customer Satisfaction Measurement Survey 2019 Report developed in conjunction with the NSW Customer Service CommissionerPublic I1-A2
Businessesbull Businesses had similar motivations as
consumers for not using online as a channel to access services ndash lack of availability of services online as well as inability to find what they were looking for
Customers were asked ldquoYou mentioned that you did not go online to access the service in the last 12 months Please select all statements that apply in relation to these service(s) in SA I did not complete this interaction online becausehelliprdquo
Figure 312 Reasons for not going online I did not go online hellip
Consumer (n=2401)
Business (n=762)
37 16 12 7 7 6 5 5 3
The servicewasnt
possible to beundertaken
online
The servicewas notavailable
online
I was not ableto find what Iwas looking
for
There was noonline supportto answer any
questions Imay havesuch aswebchat
I didnt haveaccess to acomputer or
an onlinedevice
The format ofcontent on the
website didnot meet my
accessrequirements
I was not sureif my
informationwould remainconfidential
No incentivewas provided
such as adiscount
The contentwas not
current andoraccurate
Consumersbull The main reason for consumers not using
online channels to access services was that the services were not available or couldnrsquot be undertaken online
bull The other big factor was that consumers were unable to find what they were looking for
bull Uncertainty around confidentiality of information was not seen as a big deterrent in accessing services online
Consumer Business
37 17 11 8 8 7 7 6 3
The servicewasnt
possible to beundertaken
online
The servicewas notavailable
online
I was not ableto find what Iwas looking
for
There was noonline supportto answer any
questions Imay havesuch aswebchat
I didnt haveaccess to acomputer or
an onlinedevice
The format ofcontent on the
website didnot meet my
accessrequirement
I was not sureif my
informationwould remainconfidential
No incentivewas provided
such as adiscount
The contentwas not
current andoraccurate
ADOPTING ONLINE METHODS TO INTERACT WITH SA GOVERNMENT SERVICESA main reason for consumers and businesses not using online channels to access services is a lack of online service availability
re
spon
dent
s
resp
onde
nts
59
Source Customer Service Commission Customer Satisfaction Measurement Survey 2019 Report developed in conjunction with the NSW Customer Service CommissionerPublic I1-A2
77
15 8
I chose to go online I was directed to or was prompted to go online There was no other option available
10
10
10
Avg
10
10
10
Avg
Customers were asked ldquoDid you choose to go online or were you directed to go onlinerdquo
Figure 313 Choice to go online
18
11
5
16
19
11
65
70
84
70
73
81
There wasno otheroption
available
I wasdirected to
or wasprompted
to goonline
I chose togo online
Strong disagree (1-4) Neutral (5-6) Strongly agree (7-10)
respondents
15
14
2
19
16
49
66
83
62
75
80
There wasno otheroption
available
I wasdirected or
promoted togo online
I chose togo online
respondents
Consumer Business
74
224
Figure 314 Satisfaction with using websiteapp by choice to go onlineCustomers were asked ldquoHow satisfied were you with the overall experience of using the websiteapp to complete the taskrdquo
n=843 n=220
Consumer (n=822) Business (n=218)
uarr1 darr2
24
Consumersbull 77 of consumers who used online methods chose to
go online themselves while 8 said there was no other option available to them
bull Consumers who chose to go online were more satisfied with the overall experience of using the websiteapp to complete the task (81 out of 10 ndash an increase of 03 points versus 2018)
bull There was an increase in satisfaction across all 3 types of online users ndash voluntary (78 in 2018) prompted to (72 in 2018) didnrsquot have any other option (68 in 2018)
Businessesbull Businesses saw a 7 points increase in those choosing
to go online This was due to a 5 point decrease in those saying they had no other choice and 2 point decrease in those saying they were directed to or were prompted to go online
bull Businesses who chose to go online saw a 09 point increase in satisfaction versus last year (8 out of 10 in 2019 vs 71 out of 10 In 2018)
bull Even those who said they had no other option showed higher satisfaction of 62 out of 10 (+07 points vs 2018)
uarr7
Consumer Business
darr1
darr5
CUSTOMER CHOICE TO USE ONLINE SERVICES77 of consumers and 74 of businesses chose to go online to access government services and they have the highest satisfaction
60
Source Customer Service Commission Customer Satisfaction Measurement Survey 2019 Report developed in conjunction with the NSW Customer Service CommissionerPublic I1-A2
50 4640
17
31
52 53
10
Smartphone Laptop computer Desktop computer TabletiPad
Consumer (n=843)Business (n=220)
Customers were asked ldquoWhat devices did you use to access the online content Please select all contact methods that applyrdquo
Figure 315 Devices used when dealing with SA Government services online
Figure 316 Satisfaction with online services by device used Customers were asked ldquoHow satisfied were you with the overall experience of using the websiteapp to complete the taskrdquo
re
spon
dent
s
77
79 798080
74
80
76
Smartphone Laptop computer Desktop computer TabletiPad
Consumer (n=822)Business (n=218)
Aver
age
satis
fact
ion
(out
of 1
0)
Consumer Business
Consumersbull While most consumers (50) used smartphones
to access online content their satisfaction levels with their experience was lower (77 out of 10) compared to those who used desktops or laptops to access online content (79 out of 10)
bull Few consumers are using tabletsiPad (17) but those that do have high levels of satisfaction (8 out of 10)
Businessesbull Most businesses used laptops (52) or desktops
(53) to access online content Desktop users had a higher overall satisfaction (8 out of 10) compared to laptop users (74 out of 10)
bull In contrast to consumers only 31 of businessesused smartphones to access content online however they had higher levels of satisfaction with the overall experience (8 out of 10)
DEVICE USED BY CUSTOMERS FOR ONLINE SERVICESMost consumers used smartphones but the satisfaction levels of those who used smartphones was lower than users of other channels Fewer businesses used smartphones but those that did showed higher levels of satisfaction
61
Public ndash I1-A2
SOUTH AUSTRALIAN CUSTOMER SATISFACTION MEASUREMENT SURVEY 2019
4 PUBLIC SERVICE OVERALL
Source Customer Service Commission Customer Satisfaction Measurement Survey 2019 Report developed in conjunction with the NSW Customer Service CommissionerPublic I1-A2
Customers were asked ldquoThinking about all your experiences with each of the following Australian industries and public services over the previous 12 months how satisfied would you say you are with them rdquo
Figure 41 Satisfaction with SA Public Service overall compared to industries
bull Average satisfaction with the SA Public Service lsquobrandrsquo is 66 for both consumers and businesses ndashrelatively stable versus last year
bull Both consumers and businesses continue to rate SA Public Service lsquobrandrsquo higher than most other industries and public services except airlines
bull Satisfaction with SA Government services continues to be higher than satisfaction with the lsquobrandrsquo for both consumers and businesses This suggests a continued disconnect between service delivery and lsquobrandrsquo perceptions that are influenced by a range of factors such as media and reputation
+02
31
27
22
23
21
14
8
30
34
30
30
28
30
28
39
40
47
47
51
56
64
56
57
61
61
62
66
70
Energy Retailers(n=485)
FederalGovernment
(n=465)
My local council(n=477)
Banks (n=486)
Telephone ServProviders(n=477)
SA PublicService overall
(n=484)
Airlines (n=457)
Dissatisfied (1-4) Neutral (5-6) Satisfied (7-10)
respondents Avg
Business (n=457) respondents Avg
Consumer (n=1649)
7375 00 +01
+03
+01
+01
+02
+03
+02
+02
+02
+10
+04
+05
+05
+0636
35
27
25
24
15
9
26
28
26
27
26
27
24
38
37
47
49
49
59
67
53
54
59
60
61
66
71
FederalGovernment
(n=1835)
EnergyRetailers(n=1924)
Banks(n=1934)
My local council(n=1876)
Telephone ServProviders(n=1930)
SA PublicService overall
(n=1915)
Airlines(n=1649)
Dissatisfied (1-4) Neutral (5-6) Satisfied (7-10)
SA Government Services
Average satisfaction
Consumer Business
Legend Statistically significant increase in avg from 2018 (at 99 level of Confidence)No significant change in avg from 2018 (at 99 level of Confidence)Statistically significant decrease in avg from 2018 (at 99 level of Confidence)
Consumer Business
Note scores are subject to rounding and may not sum to 100
PERCEPTIONS OF THE SA PUBLIC SERVICE lsquoBRANDrsquoBoth consumers and businesses rate the SA Public Services lsquobrandrsquo higher than all other industries and public services with the exception of airlines
63
Source Customer Service Commission Customer Satisfaction Measurement Survey 2019 Report developed in conjunction with the NSW Customer Service CommissionerPublic I1-A2
bull NSW Public Service lsquobrandrsquo has the most positive perception amongst consumers Whereas the Public Service lsquobrandsrsquo in SA is second only to Airlines as with QLD and VIC
bull Businesses also have similar perceptions of the Public Service lsquobrandrsquo across all jurisdictions In Australia the average satisfaction ratings are second to airlines Whereas in UK and NZ airlines and banks have higher average satisfaction ratings
Lowest
Highest
Avg
sat
isfa
ctio
n (b
usin
esse
s)
NZ
NZ Govt Service 68
Banks 69
Energy 66
Local council 58
Airlines 74
Telcorsquos 65
NSW
Airlines 71
NSW Public Service 69
Banks 60
Energy 57
Telcorsquos 60
Local council 61
Fed Govt 60
QLD
Airlines 71
QLD Public Service 67
Telcorsquos 61
Local council 61
Banks 57
Energy 57
Fed Govt 58
VIC
Airlines 71
VIC Public Service 65
Banks 58
Energy 57
Local council 59
Fed Govt 57
Telcorsquos 60
SA
Airlines 70
Telcorsquos 62
SA Public Service 66
Banks 61
Energy 56
Local council 61
Fed Govt 57
UK
Airlines 70
Telcorsquos 66
Energy 63
UK Public Service 68
Local Council 61
Banks 68
Business
Figure 42 Comparison of Public service brand perceptions across jurisdictionsCustomers were asked ldquoThinking about all your experiences with each of the following [jurisdiction] industries and public services over the previous 12 months how satisfied would you say you are with them rdquoConsumer
NZ
NZ Govt Service 69
Banks 69
Airlines 74
Telcorsquos 66
Energy 66
Local council 59
NSW NSW
Public Service 71
Airline 71
Telcorsquos 62
Energy 59
Local council 62
Banks 61
Fed Govt 57
QLD
Airlines 70
QLD Public Service 69
VIC SA
Airlines 71
Telcorsquos 61
SA Public Service 66
Local council 60
Banks 59
Energy 54
Fed Govt 53
UK
Airlines 71
UK Public Service 69
Banks 69
Energy 64
Telcorsquos 69
Local council 61
Consumer Business
Lowest
Highest
Avg
sat
isfa
ctio
n (c
onsu
mer
s)
Airlines 71
Telcorsquos 63
VIC Public Service 70
Banks 63
Local council 62
Energy 60
Fed Govt 59
Telcorsquos 62
Local council 62
Banks 60
Energy 59
Fed Govt 58
PUBLIC SERVICE lsquoBRANDrsquo COMPARISON BY JURISDICTIONAustralian jurisdictions perform better than NZ and UK in perceptions of their public service lsquobrandsrsquo for both consumers andbusinesses relative to other industries
64
Source Customer Service Commission Customer Satisfaction Measurement Survey 2019 Report developed in conjunction with the NSW Customer Service CommissionerPublic I1-A2
Respondents were asked to select from a list of positive and negative descriptors of SA Public Service bull The top five descriptors of the SA Public Service
overall were all positive and consistent with 2018
bull The most commonly selected negative brand descriptors are lsquoinefficientrsquo lsquoimpersonalrsquo lsquoinflexiblersquo and lsquodifficultrsquo This pattern is similar to 2018
0
10
20
30
40Innovative
Motivated
Modern
Flexible
Accountable
Caring
EfficientHonest
Respectful
Knowledgeable
Capable
Friendly
Helpful
Figure 43 Positive Descriptors of the SA Public Service overall - Consumer
Customers were asked ldquoThinking now about the SA Public Service overall and all of the services and agencies which fall under it which of the following words would you use to describe the SA Public Service rdquo
0
10
20
30
40Lazy
Controlling
Patronising
Outdated in digitalservices
Complacent
Wasteful
Inflexible
Difficult
Impersonal
Inefficient
2018 Consumer (n=1999) 2019 Consumer (n=1998)
Figure 44 Negative Descriptors of the SA Public Service overall -Consumer
Top 5 descriptors
Consumer
CONSUMER DESCRIPTIONS OF THE SA PUBLIC SERVICE lsquoBRANDrsquoThe top 5 descriptors used by consumers to describe SA Public Service are lsquohelpfulrsquo lsquofriendlyrsquo lsquocapablersquo lsquoknowledgeablersquo and lsquorespectfulrsquo
65
Source Customer Service Commission Customer Satisfaction Measurement Survey 2019 Report developed in conjunction with the NSW Customer Service CommissionerPublic I1-A2
0
10
20
30
40
Outdated in digitalservices
Patronising
Lazy
Controlling
Complacent
Difficult
Inflexible
Impersonal
Wasteful
Inefficient
2018 Business (n=551) 2019 Business (n=502)
bull In contrast to last year businesses have described SA Public services more positively this year
bull All positive attributes have seen an increase in proportion of responses with the exception of lsquoinnovativersquo (-2 points vs last year) and lsquoaccountablersquo (-2 points vs last year)
bull The top 5 descriptors are lsquohelpfulrsquo (+6 points vs last year) lsquofriendlyrsquo (+4 points vs last year) lsquocapablersquo (+9 points vs last year) lsquoknowledgeablersquo (+3 points vs last year) and lsquorespectfulrsquo (+3 points vs last year)
bull Conversely all negative attributes have seen a decrease in proportion of responses compared to last year
0
10
20
30
40Innovative
Motivated
Modern
Flexible
Caring
Accountable
EfficientHonest
Respectful
Knowledgeable
Capable
Friendly
Helpful
Figure 45 Positive descriptors of the SA Public Service overall - business
Businesses were asked ldquoThinking now about the SA Public Service overall and all of the services and agencies which fall under it which of the following words would you use to describe the SA Public Service rdquo
Figure 46 Negative descriptors of the SA Public Service overall - business
Top 5 descriptors
Business
BUSINESS DESCRIPTIONS OF THE SA PUBLIC SERVICE lsquoBRANDrsquoThe top 5 descriptors used by businesses to describe SA Public Service are lsquohelpfulrsquo lsquofriendlyrsquo lsquocapablersquo lsquoknowledgeablersquo andlsquorespectfulrsquo
66
Public ndash I1-A2
SOUTH AUSTRALIAN CUSTOMER SATISFACTION MEASUREMENT SURVEY 2019
5 FEEDBACK
Source Customer Service Commission Customer Satisfaction Measurement Survey 2019 Report developed in conjunction with the NSW Customer Service CommissionerPublic I1-A2
NATURE OF FEEDBACK AND FEEDBACK CHANNELSProcesses are the most common source of complaints while employees are a more common source of compliments
68
Consumersbull Processes are the most common source of
complaints Consumers also complain about outcomes of their interactions
bull Compliments mainly relate to interactions with employees
bull Both complaints and compliments are mainly made in person whereas consumers take to emails to make suggestions for change
Businessesbull Complaints and suggestions are mainly made
about processes and outcomes of interactions
bull Compliments most often relate to the information available to businesses
bull As with consumers businesses complain or compliment mostly in-person
bull Businesses also use email to give compliments and emails are the preferred method to make suggestions
11
44
28
16
2
42
14
23
18
3
32
17
28
12
11
Theprocesses
Theemployees
youinteracted
with
Theoutcomes of
yourinteraction
Informationavailable to
you
Other
I gave a compliment I made a suggestion for change I made a complaint
22
22 26
30
0
47
17
14
22
0
36
18
33
13
0
Theprocesses
Theemployees
youinteracted
with
Theoutcomes of
yourinteraction
Informationavailable to
you
Other
Figure 51 Nature of feedback by feedback typeQuestion ldquoWhat did your feedback primarily relate to rdquo
Consumer (n = 519) Business (n = 192)
2242
30
5233
38
17 1416
4 6 105 4 5
I gave acompliment
I made asuggestion for
change
I made acomplaint
37 41 37
37 29 45
5 19921 11 5
04
I gave acompliment
I made asuggestion for
change
I made acomplaint
bull Other
bull Via postal letter
bull Via servicersquos website
bull In person face to face or via the phone
bull Via email
Figure 52 Nature of feedback and feedback channelsQuestion ldquoHow did you provide your feedbackrdquo
Consumer (n=519) Business (n=194)
Consumer Business
Source Customer Service Commission Customer Satisfaction Measurement Survey 2019 Report developed in conjunction with the NSW Customer Service CommissionerPublic I1-A2
37
44
3538
45
4041
3633
4036
42
21 20
31
2219 18
NSW (n=529) VIC (n=186) QLD (n=184) UK (n=456) SA (n=194) NZ (n=215)
Complaint Suggestion for change Compliment
28 28 29
33 33
2829
37
27 28 28
33
43
35
44
39 39 39
NSW (n=1203) VIC (n=569) QLD (n=528) UK (n=619) SA (n=519) NZ (n=520)
Complaint Suggestion for change Compliment
Figure 53 Overall satisfaction with Government services by contact method(s) used across jurisdictions
o
ffee
dbac
k ev
er re
ceiv
ed
of f
eedb
ack
ever
rece
ived
Consumer (Base Consumers in each jurisdiction who ever provided feedback)
Business (Base Businesses in each jurisdiction who ever provided feedback)
Consumer Business
JURISDICTIONAL COMPARISON OF NATURE OF FEEDBACKOf all jurisdictions SA received the highest proportion of complaints from both consumers and businesses
Consumersbull Compliments form the highest
proportion of all feedback received across all jurisdictions except VIC
bull Across jurisdictions SA and UK received the highest proportion of complaints
bull QLD was the jurisdiction to receive the highest proportion of compliments closely followed by NSW
Businessesbull Unlike consumers complaints and
suggestions form most of the feedback received from businesses
bull SA received the highest proportion of complaints Closely followed by VIC
bull QLD was the jurisdiction where businesses gave the highest proportion of compliments
69
Source Customer Service Commission Customer Satisfaction Measurement Survey 2019 Report developed in conjunction with the NSW Customer Service CommissionerPublic I1-A2
41
23
36
handled poorly (1-4)2neutral (5-6)Handled well (7-10)
Consumersbull Most consumers who gave feedback
(39) gave a compliment
bull Complaints make up 33 of all feedback This is consistent with last year
bull Of consumers who complained 41 said their complaint was handled poorly However this is an improvement from last year where 54 had said their feedback was handled poorly
Businessesbull In contrast the proportion of feedback
from businesses that were complaints went up to 42 from 27 last year
bull Of this 44 said their feedback was handled poorly ndash up from 38 in the last year
23
35
42
39
28
33
bull I gave a compliment
bull I made a suggestion for change
bull I made a complaint
Consumer (n=519)
Business (n=194)
Figure 5455 Complaint handling of consumers and businessesQuestion ldquoHow well or poorly was your most recent complaint handledFigure 56 Proportion of feedback types for consumers and businessesQuestion ldquoWhat was the nature of your feedbackrdquo
Base n=169 consumers who made a complaint
Base n=83 businesses who made a complaint
Base n=519 consumers and n=194 businesses who ever
provided feedback
Figure 56 Figure 55Figure 54
Consumer Business
44
24
32
handled poorly (1-4)2neutral (5-6)Handled well (7-10)
COMPLAINT HANDLING EXPERIENCE41 of consumers and 44 of businesses said their complaints had been handled poorly
70
Source Customer Service Commission Customer Satisfaction Measurement Survey 2019 Report developed in conjunction with the NSW Customer Service CommissionerPublic I1-A2
Customers were asked ldquoHow well or poorly was your most recent complaint handledrdquo
Figure 57 Variation in complaints handling across jurisdictions
Consumer
Business
Consumersbull VIC had the highest proportion of positive
ratings from consumers in relation to complaints handling (44 rated 7-10 out of 10) SA was second with 36 of complaints being handled well
bull The average rating was neutral (52 out of 10) ndash an improvement of 08 points compared to last year (44 out of 10) This was second highest behind VIC
Businessesbull The average rating was just below neutral at
49 out of 10 However this is an improvement of 02 points compared to last year (47 out of 10)
bull Of the Australian jurisdictions SA has the lowest proportion of poorly handled complaints and the highest average rating
bull UK has the lowest proportion of poorly handled complaints and the highest average rating of 53 out of 10 of all jurisdictions
39 41 41 46 50 55
17 2325
23 23 17
44 36 34 30 28 28
5652
50
48 45 43
1
10
0
50
100
VIC(n=154)
SA(n=169)
UK(n=196)
NZ(n=138)
QLD(n=140)
NSW(n=314)
Handled poorly (1-4) Neutral (5-6) Handled well (7-10) Average
Axis
1
Perc
enta
ge o
f re
spon
ses
Axis 2 Average score
35 44 49 45 50 52
24 2415
3418 22
41 32 3621
32 26
53 49
49
48 46 45
1
10
0
50
100
UK(n=174)
SA(n=83)
QLD(n=72)
VIC(n=69)
NSW(n=184)
NZ(n=76)
Handled well (7-10) Neutral (5-6) Handled poorly (1-4) Average
Axis
1
Perc
enta
ge o
f re
spon
ses
Axis 2 Average score
Responses were provided according to a scale from 1 (handled very poorly) to 10 (handled very well)
Consumer Business
COMPARISON OF PERFORMANCE IN COMPLAINTS MANAGEMENT ACROSS JURISDICTIONSFor consumers SA had the second highest proportion of complaints being handled well behind VIC For businesses SA had the lowest proportion of poorly handled complaints compared to all jurisdictions
71
Source Customer Service Commission Customer Satisfaction Measurement Survey 2019 Report developed in conjunction with the NSW Customer Service CommissionerPublic I1-A2
Customers were asked ldquoHow well or poorly was your most recent complaint handledrdquo
Figure 58 Variation in complaints handling by region
Consumer
Business
bull In metro areas over 40 of both consumers and businesses rated their complaints as being handled poorly (1-4 out of 10)
bull Sample sizes for both consumers and businesses in rural and regional SA are too small to be statistically representative and cannot be evaluated meaningfully
4626 22
17 41
44
37 32 34
50 56
58
1
10
0
50
100
Metro(n=139)
Regional(n=14)
Rural(n=16)
Handled poorly (1-4) Neutral (5-6) Handled well (7-10) Average
Axis
1
Perc
enta
ge o
f re
spon
ses
Axis 2 Average score
45
100
29
28
57
47
11
66
1
10
0
50
100
Metro(n=67)
Regional(n=4)
Rural(n=12)
Handled well (7-10) Neutral (5-6) Handled poorly (1-4) Average
Axis
1
Perc
enta
ge o
f re
spon
ses
Axis 2 Average score
Responses were provided according to a scale from 1 (handled very poorly) to 10 (handled very well)Note interpret with caution when sample size is lower than n =30
Consumer Business
COMPARISON OF PERFORMANCE IN COMPLAINTS MANAGEMENT BY REGION46 of consumers and 45 of businesses in Metro areas say their complaints were handled poorly
72
Source Customer Service Commission Customer Satisfaction Measurement Survey 2019 Report developed in conjunction with the NSW Customer Service CommissionerPublic I1-A2
Customers were asked ldquoHow difficult or easy was it to make your complaintrdquoFigure 59 Variation in ease of making a complaint across jurisdictions
Consumer
Business
Consumersbull 51 of consumers who made a complaint said it was
easy to do so (7-10 out of 10) This is an improvement from 34 in 2018
bull The average rating was neutral (61 out of 10) This is an improvement of 08 points compared to last year (53 out of 10 in 2018)
bull VIC had the highest proportion of consumers saying it was easy to make a complaint (56) Whereas NSW was the jurisdiction with the lowest proportion of consumers saying so (47)
Businessesbull 46 of businesses in SA who made a complaint said it
was easy to do so (7-10 out of 10) This is an improvement from 37 in 2018
bull 36 rated it as difficult (1-4 out of 10) ndash this is 2 points higher than last year (34) and makes SA the jurisdiction with the second highest proportion of lsquodifficultrsquo ratings behind QLD
bull Improvement in the proportion of businesses rating the process as lsquoeasyrsquo has pushed the average rating to 55 out of 10 (vs 47 out of 10 last year) However SA continues to be the jurisdiction with the lowest rating as other jurisdictions have also seen an improvement in their average rating
26 28 29 31 31 33
18 21 18 19 23 26
5651 54 50
47 4065 61 61 59 58 56
1
10
0
50
100
VIC(n=159)
SA(n=174)
NZ(n=148)
UK(n=199)
NSW(n=333)
QLD(n=150)
Easy (7-10) Neutral (5-6) Difficult (1-4) Average
21 28 25 31 37 36
30 19 29 24 31 17
4953 46 45 33
4662 61 59 58 55 55
1
10
0
50
100
NZ(n=78)
UK(n=176)
VIC(n=70)
NSW(n=188)
QLD(n=74)
SA(n=83)
Easy (7-10) Neutral (5-6) Difficult (1-4) Average
Responses were provided according to a scale from 1 (very difficult) to 10 (very easy)
Axis 2 Average scoreAxis 2 Average score
Axis
1
Perc
enta
ge o
f re
spon
ses
Axis
1
Perc
enta
ge o
f re
spon
ses
Consumer Business
COMPARISON OF PERFORMANCE IN EASE OF MAKING A COMPLAINT ACROSS JURISDICTIONSIn SA 51 of consumers said it was easy to make a complaint 46 of businesses echoed the sentiment ndash an improvement from 37 last year
73
Source Customer Service Commission Customer Satisfaction Measurement Survey 2019 Report developed in conjunction with the NSW Customer Service CommissionerPublic I1-A2
10
1
1
1
1
1
1
1
2
2
2
3
3
3
3
4
5
5
5
6
8
8
12
13
Other (n=57)
State Emergency Services (n=4)
Agricultural Advice and Fundinghellip
Environment and Wildlifehellip
Business Advisory Services (n=2)
Prisons (n=4)
Fire Brigades (n=4)
Child Welfare Services (n=9)
Courts (n=10)
Art Galleries and Museumshellip
Documentation Services (n=9)
Consumer Affairs (Fair Trading)hellip
Ambulance Services (n=17)
TAFE Services (n=23)
Services for Older People (n=20)
Major Roads (n=26)
Public Housing (n=25)
Disability Services (n=29)
Police (n=27)
Public Schools (n=33)
Water Supply (n=45)
Vehicle Licensing andhellip
Public Transport (n=63)
Public Hospitals (n=81)
13
1
1
1
1
1
2
2
2
2
3
3
5
5
5
5
6
6
7
7
9
15
Other (n=26)
Art Galleries (n=1)
Prisons (n=2)
Business Adv Serv (n=2)
Environ Protectn (n=5)
Ambulance Services (n=3)
Agri Advice and Funding (n=2)
Courts (n=4)
Vehicle Licensing amp Reg (n=8)
Child Welfare Services (n=5)
Documentation Services (n=3)
Disability Services (n=10)
Police (n=14)
TAFE Services (n=14)
Serv for Older (n=7)
Major Roads (n=11)
Public Transport (n=16)
Public Housing (n=8)
Public Hospitals (n=16)
Public Schools (n=8)
Consumer Affairs (n=12)
Water Supply (n=25)
Consumersbull Similar to last year Public Hospitals Public
Transport and Vehicle Licensing and Registration accounted for 30 of the most recent complaints received
bull Public Hospitals saw an increase of 1 points and Public Transport saw an increase of 2 points versus last year
bull Complaints to Vehicle Licensing declined by 2 points
Businessesbull Water Supply continued to receive the most
complaints and showed an increase of 3 points versus last year
Note that sample sizes are low for these services and while results may not be statistically representative they indicate potential trends to be investigated more robustly
Figure 512 Volume of complaints across servicesCustomers that had made a complaint in the past were asked ldquoWhich SA Government Department or Agency did you most recently complain tordquo
respondents respondentsConsumer Business
Note interpret with caution when sample size is lower than n =30 All businesses results have been provided for indicative purposes only as the sample size for all services is lt30
Data unavailable as nlt10
Consumer Business
VARIATION IN COMPLAINTS ACROSS SA GOVERNMENT SERVICESPublic Hospitals receive the highest proportion of complaints from consumers and Water Supply receive the highest proportion ofcomplaints from businesses
74
Public ndash I1-A2
SOUTH AUSTRALIAN CUSTOMER SATISFACTION MEASUREMENT SURVEY 2019
The data in this chapter compares the perceptions of SA government services Where sample sizes for segments are low (lt30) data is provided for indicative purposes only
APPENDIX 1ANALYSIS BY SERVICE
Source Customer Service Commission Customer Satisfaction Measurement Survey 2019 Report developed in conjunction with the NSW Customer Service CommissionerPublic I1-A2
Consumer
91 9087 87
8076 76 75 74 74 73 73 73 73 73
70 68 66 65 63 63
54
45
10
20
30
40
50
60
70
80
90
100
0
25
50
75
100
Fire
Brig
ades
(n=2
4)
Stat
e Em
erge
ncy
Serv
ices
(n=4
7)
Ambu
lanc
e Se
rvic
es (n
=208
)
Art G
alle
ries
and
Mus
eum
s (n
=121
)
Vehi
cle
Lice
nsin
g an
d R
egis
tratio
n (n
=580
)
Publ
ic S
choo
ls (n
=228
)
Wat
er S
uppl
y (n
=240
)
Polic
e (n
=217
)
Publ
ic H
ospi
tals
(n=4
12)
Publ
ic T
rans
port
(n=3
90)
Con
sum
er A
ffairs
(n=3
8)
Doc
umen
tatio
n Se
rvic
es (n
=42)
Envi
ronm
ent a
nd W
ildlif
e Pr
otec
tion
(n=3
8)
Busi
ness
Adv
isor
y Se
rvic
es (n
=17
)
Serv
ices
for O
lder
Peo
ple
(n=1
14)
TAFE
Ser
vice
s (n
=126
)
Agric
ultu
ral A
dvic
e an
d Fu
ndin
g Se
rvic
es (n
=13
)
Dis
abilit
y Se
rvic
es (n
=100
)
Maj
or R
oads
(n=8
6)
Publ
ic H
ousi
ng (n
=87)
Cou
rts (n
=94)
Pris
ons
(n=2
3)
Chi
ld W
elfa
re S
ervi
ces
(n=5
2)
Dissatisfied (1-4) Neutral (5-6) Satisfied (7-10) Average
Axis
1
Perc
enta
ge o
f res
pons
es
Axis 2 Average Score
Figure 1 Variation in consumersrsquo satisfaction across SA Government Services
Customers were asked ldquoThinking about your experiences in the last 12 months how satisfied would you say you are with each of the following services in SArdquo
VARIATION IN CONSUMERSrsquo SATISFACTION ACROSS SERVICESAcross SA Government services consumersrsquo satisfaction is highest for Fire Brigades State Emergency Services Ambulance Services and Art Galleries and Museums
Average SA consumer satisfaction ndash 75 (n=3297)
Note Interpret with caution Very small number of responses (nlt=30) 76
Source Customer Service Commission Customer Satisfaction Measurement Survey 2019 Report developed in conjunction with the NSW Customer Service CommissionerPublic I1-A2
Consumer
Figure 2 Variation in customersrsquo expectation across SA Government Services
Customers were asked ldquoThinking about each of the following services in SA how would you rate your expectation of overall quality of servicerdquo
VARIATION IN CONSUMERSrsquo EXPECTATION ACROSS SERVICESConsumers have higher expectations of overall service quality from Fire Brigade State Emergency Services Ambulance Services and Art Galleries amp Museums This is consistent with the high satisfaction ratings these services have
93 91 90 88
8279 78 78 77 77 77 76 76 75 73 72 71 70 70 70 67 67
52
1
2
3
4
5
6
7
8
9
10
0
25
50
75
100
Fire
Brig
ades
(n=2
4)
Stat
e Em
erge
ncy
Serv
ices
(n=4
5)
Ambu
lanc
e Se
rvic
es (n
=205
)
Art G
alle
ries
and
Mus
eum
s (n
=121
)
Vehi
cle
Lice
nsin
g an
d R
egis
tratio
n (n
=574
)
Publ
ic S
choo
ls (n
=223
)
Polic
e (n
=216
)
Wat
er S
uppl
y (n
=234
)
Con
sum
er A
ffairs
(n=3
7)
Publ
ic H
ospi
tals
(n=4
08)
Serv
ices
for O
lder
Peo
ple
(n=1
13)
Doc
umen
tatio
n Se
rvic
es (n
=42)
Publ
ic T
rans
port
(n=3
83)
Envi
ronm
ent a
nd W
ildlif
e Pr
otec
tion
(n=3
7)
Busi
ness
Adv
isor
y Se
rvic
es (n
=17
)
TAFE
Ser
vice
s (n
=125
)
Maj
or R
oads
(n=8
1)
Cou
rts (n
=89)
Agric
ultu
ral A
dvic
e an
d Fu
ndin
g Se
rvic
es (n
=13
)
Dis
abilit
y Se
rvic
es (n
=96)
Pris
ons
(n=2
1)
Publ
ic H
ousi
ng (n
=86)
Chi
ld W
elfa
re S
ervi
ces
(n=5
1)
Low (1-4) Medium (5-6) High (7-10) Average
Axis
1
Perc
enta
ge o
f res
pons
es
Axis 2 Average Score
Average SA consumer expectation ndash 78 (n=3241)
Note Interpret with caution Very small number of responses (nlt=30) 77
Source Customer Service Commission Customer Satisfaction Measurement Survey 2019 Report developed in conjunction with the NSW Customer Service CommissionerPublic I1-A2
VARIATION IN CONSUMERSrsquo COMPARISON TO AN IDEAL SERVICE ACROSS SERVICESConsumers perceive State Emergency Services Fire Brigades Ambulance Services and Art Galleries and Museums to be performing closest to an ideal service This is consistent with findings relating to satisfaction and expectation
Figure 3 Consumersrsquo comparison to an ideal service across services
Customers are asked ldquoNow forgetting for a moment these specific services please imagine an ideal service How well do you think each service in SA compares with that ideal servicerdquo
9086 85 83
77 76 75 74 73 73 71 69 69 69 67 67 66 6459 59 57
54
44
1
2
3
4
5
6
7
8
9
10
0
25
50
75
100
Stat
e Em
erge
ncy
Serv
ices
(n=4
6)
Fire
Brig
ades
(n=2
3)
Ambu
lanc
e Se
rvic
es (n
=205
)
Art G
alle
ries
and
Mus
eum
s (n
=119
)
Vehi
cle
Lice
nsin
g an
d R
egis
tratio
n (n
=560
)
Busi
ness
Adv
isor
y Se
rvic
es (n
=17
)
Polic
e (n
=207
)
Doc
umen
tatio
n Se
rvic
es (n
=42)
Publ
ic S
choo
ls (n
=216
)
Agric
ultu
ral A
dvic
e an
d Fu
ndin
g Se
rvic
es (n
=12
)
Wat
er S
uppl
y (n
=226
)
Publ
ic T
rans
port
(n=3
80)
Publ
ic H
ospi
tals
(n=3
97)
TAFE
Ser
vice
s (n
=122
)
Con
sum
er A
ffairs
(n=3
6)
Serv
ices
for O
lder
Peo
ple
(n=1
09)
Envi
ronm
ent a
nd W
ildlif
e Pr
otec
tion
(n=3
7)
Dis
abilit
y Se
rvic
es (n
=96)
Cou
rts (n
=89)
Publ
ic H
ousi
ng (n
=82)
Maj
or R
oads
(n=8
1)
Pris
ons
(n=1
9)
Chi
ld W
elfa
re S
ervi
ces
(n=5
1)
Not close to ideal (1-4) Neutral (5-6) Very close to ideal (7-10) Average
Axis
1
Perc
enta
ge o
f res
pons
es
Axis 2 Average Score
Average SA consumer ideal ndash 72 (n=3172)
Consumer
Note Interpret with caution Very small number of responses (nlt=30) 78
Source Customer Service Commission Customer Satisfaction Measurement Survey 2019 Report developed in conjunction with the NSW Customer Service CommissionerPublic I1-A2
VARIATION IN CONSUMERSrsquo ldquoEXPECTATION GAPrdquo ACROSS SERVICESAcross all services consumers have a negative ldquoexpectation gaprdquo
-13
-07
-07
-07
-04
-04
-04
-03
-03
-03
-03
-03
-03
-03
-03
-02
-02
-02
-02
-02
-01
-01
00
-15 -1 -05 0 05 1 15
Prisons (n=21)
Courts (n=89)
Child Welfare Services (n=51)
Major Roads (n=81)
Services for Older People (n=113)
Consumer Affairs (n=37)
Public Housing (n=86)
Police (n=216)
Documentation Services (n=42)
Public Schools (n=223)
Ambulance Services (n=205)
Disability Services (n=96)
Public Hospitals (n=408)
Environment and Wildlife Protection (n=37)
TAFE Services (n=125)
Agricultural Advice and Funding Services (n=13)
Fire Brigades (n=24)
Water Supply (n=234)
Art Galleries and Museums (n=121)
Public Transport (n=383)
Vehicle Licensing and Registration (n=574)
Business Advisory Services (n=17)
State Emergency Services (n=45)
Figure 4 Consumer gap to expectation by servicesThe gap between satisfaction and expectation provides an understanding of how customers perceive their recent experience compares to expectationsThe gap to expectation is calculated individually for each customers as Gap = satisfaction score ndash expectation score
Consumer
Note Interpret with caution Very small number of responses (nlt=30)
79
Source Customer Service Commission Customer Satisfaction Measurement Survey 2019 Report developed in conjunction with the NSW Customer Service CommissionerPublic I1-A2
91 9187
82 80 80 7975 74 74 74 74 74 72 72 71 71 70 69 67 66
6155
1
2
3
4
5
6
7
8
9
10
0
25
50
75
100
Fire
Brig
ades
(n=1
5)
Ambu
lanc
e Se
rvic
es (n
=24
)
Stat
e Em
erge
ncy
Serv
ices
(n=1
3)
Art G
alle
ries
and
Mus
eum
s (n
=13
)
Doc
umen
tatio
n Se
rvic
es (n
=17
)
Polic
e (n
=35)
Pris
ons
(n=1
4)
Con
sum
er A
ffairs
(n=2
7)
Envi
ronm
ent a
nd W
ildlif
e Pr
otec
tion
(n=1
9)
Maj
or R
oads
(n=1
1)
Dis
abilit
y Se
rvic
es (n
=34)
Wat
er S
uppl
y (n
=67)
Cou
rts (n
=19
)
Publ
ic T
rans
port
(n=4
7)
Busi
ness
Adv
isor
y Se
rvic
es (n
=35)
Vehi
cle
Lice
nsin
g an
d R
egis
tratio
n (n
=135
)
Serv
ices
for O
lder
Peo
ple
(n=2
8)
Chi
ld W
elfa
re S
ervi
ces
(n=2
0)
Publ
ic H
ospi
tals
(n=7
6)
TAFE
Ser
vice
s (n
=36)
Publ
ic S
choo
ls (n
=51)
Agric
ultu
ral A
dvic
e an
d Fu
ndin
g Se
rvic
es (n
=10
)
Publ
ic H
ousi
ng (n
=16
)
Dissatisfied (1-4) Neutral (5-6) Satisfied (7-10) Average
Axis
1
Perc
enta
ge o
f res
pons
es
Axis 2 Average Score
Figure 5 Variation in businessesrsquo satisfaction across SA Government Services
Customers were asked ldquoThinking about your experiences in the last 12 months how satisfied would you say you are with each of the following services in SArdquo
Average SA business satisfaction ndash 73 (n=762)
VARIATION IN BUSINESSESrsquo SATISFACTION ACROSS SERVICES
Business
Note Interpret with caution Very small number of responses (nlt=30)
Of the services with sufficient sample size (ngt30) Police Disability Services and Water Supply have above average satisfaction scores
80
Source Customer Service Commission Customer Satisfaction Measurement Survey 2019 Report developed in conjunction with the NSW Customer Service CommissionerPublic I1-A2
Figure 6 Variation in businessesrsquo expectation across SA Government Services
Customers were asked ldquoThinking about each of the following services in SA how would you rate your expectation of overall quality of servicerdquo
VARIATION IN BUSINESSESrsquo EXPECTATION ACROSS SERVICESOf the services with sufficient (ngt30) sample sizes Police Disability Services Water Supply and Public Transport have above average expectation scores
91 90 8784 83 83 81 79 79 78 77 77 76 75 75 75 75 75 74 72 70 70 68
1
2
3
4
5
6
7
8
9
10
0
25
50
75
100
Fire
Brig
ades
(n=1
5)
Ambu
lanc
e Se
rvic
es (n
=24
)
Stat
e Em
erge
ncy
Serv
ices
(n=1
3)
Art G
alle
ries
and
Mus
eum
s (n
=13
)
Doc
umen
tatio
n Se
rvic
es (n
=17
)
Pris
ons
(n=1
3)
Polic
e (n
=35)
Dis
abilit
y Se
rvic
es (n
=33)
Cou
rts (n
=19
)
Envi
ronm
ent a
nd W
ildlif
e Pr
otec
tion
(n=1
9)
Con
sum
er A
ffairs
(n=2
7)
Wat
er S
uppl
y (n
=67)
Publ
ic T
rans
port
(n=4
7)
Vehi
cle
Lice
nsin
g an
d R
egis
tratio
n (n
=134
)
Serv
ices
for O
lder
Peo
ple
(n=2
8)
Busi
ness
Adv
isor
y Se
rvic
es (n
=35)
Maj
or R
oads
(n=1
1)
Chi
ld W
elfa
re S
ervi
ces
(n=2
0)
Agric
ultu
ral A
dvic
e an
d Fu
ndin
g Se
rvic
es (n
=10
)
Publ
ic H
ospi
tals
(n=7
5)
Publ
ic S
choo
ls (n
=51)
Publ
ic H
ousi
ng (n
=16
)
TAFE
Ser
vice
s (n
=36)
High (7-10) Medium (5-6) Low (1-4) Average
Axis
1
Perc
enta
ge o
f res
pons
esAxis 2 Average Score
Average SA business expectation ndash76 (n=758)
Business
Note Interpret with caution Very small number of responses (nlt=30)
81
Source Customer Service Commission Customer Satisfaction Measurement Survey 2019 Report developed in conjunction with the NSW Customer Service CommissionerPublic I1-A2
95
87 8580 80 78 78
75 73 73 73 71 71 70 70 70 69 69 6966 66 65
59
1
2
3
4
5
6
7
8
9
10
0
25
50
75
100
Fire
Brig
ades
(n=1
5)
Ambu
lanc
e Se
rvic
es (n
=23
)
Stat
e Em
erge
ncy
Serv
ices
(n=1
2)
Art G
alle
ries
and
Mus
eum
s (n
=13
)
Polic
e (n
=33)
Envi
ronm
ent a
nd W
ildlif
e Pr
otec
tion
(n=1
7)
Doc
umen
tatio
n Se
rvic
es (n
=17
)
Cou
rts (n
=18
)
Publ
ic T
rans
port
(n=4
5)
Pris
ons
(n=1
4)
Vehi
cle
Lice
nsin
g an
d R
egis
tratio
n (n
=132
)
Agric
ultu
ral A
dvic
e an
d Fu
ndin
g Se
rvic
es (n
=10
)
Busi
ness
Adv
isor
y Se
rvic
es (n
=34)
Wat
er S
uppl
y (n
=63)
TAFE
Ser
vice
s (n
=33)
Serv
ices
for O
lder
Peo
ple
(n=2
8)
Maj
or R
oads
(n=1
1)
Con
sum
er A
ffairs
(n=2
5)
Dis
abilit
y Se
rvic
es (n
=32)
Chi
ld W
elfa
re S
ervi
ces
(n=2
0)
Publ
ic H
ospi
tals
(n=7
3)
Publ
ic S
choo
ls (n
=48)
Publ
ic H
ousi
ng (n
=16
)
Not close to ideal (1-4) Neutral (5-6) Very close to ideal (7-10) Average
Figure 7 Businessesrsquo comparison to an ideal service across services
Customers are asked ldquoNow forgetting for a moment these specific services please imagine an ideal service How well do you think each service in SA compares with that ideal servicerdquo
VARIATION IN BUSINESSESrsquo COMPARISON TO AN IDEAL SERVICE ACROSS SERVICESOf the services with sufficient (ngt30) sample sizes Police Public Transport and Vehicle Licensing and Registration have above average scores of comparison to ideal service
Axis
1
Perc
enta
ge o
f res
pons
esAxis 2 Average Score
Average SA business ideal ndash 72 (n=732)
Business
Note Interpret with caution Very small number of responses (nlt=30)
82
Source Customer Service Commission Customer Satisfaction Measurement Survey 2019 Report developed in conjunction with the NSW Customer Service CommissionerPublic I1-A2
Figure 8 Business gap to expectation by servicesThe gap between satisfaction and expectation provides an understanding of how customers perceive their recent experience compares to expectations The gap to expectation is calculated individually for each customers as Gap = satisfaction score ndash expectation score
VARIATION IN BUSINESSESrsquo ldquoEXPECTATION GAPrdquo ACROSS SERVICES
-13-05
-05-05-05
-04-04-04
-03-03-03-03-03-03
-02-02
-01-01-01
0000
01
-15 -1 -05 0 05 1 15
Public Housing (n=16)Agricultural Advice and Funding Services (n=10)
Disability Services (n=33)Courts (n=19)
Child Welfare Services (n=20)Public Schools (n=51)
Services for Older People (n=28)Vehicle Licensing and Registration (n=134)
Environment and Wildlife Protection (n=19)Documentation Services (n=17)
Public Transport (n=47)Business Advisory Services (n=35)
Public Hospitals (n=75)Prisons (n=13)
Water Supply (n=67)Consumer Affairs (n=27)
Art Galleries and Museums (n=13)TAFE Services (n=36)
Major Roads (n=11)Police (n=35)
Fire Brigades (n=15)State Emergency Services (n=13)
Ambulance Services (n=24)
Business
Note Interpret with caution Very small number of responses (nlt=30)
Majority of services have a negative lsquoexpectation gaprsquo from businesses However the sample sizes are low and observations are only indicative
83
Source Customer Service Commission Customer Satisfaction Measurement Survey 2019 Report developed in conjunction with the NSW Customer Service CommissionerPublic I1-A2
Average score higherlower compared to overall SA average
VARIATION IN CONSUMERSrsquo VIEWS OF EMPLOYEE PERFROMANCE ACROSS SERVICES
Customers are asked ldquoThinking now about its employees to what extent do you agree or disagree that each of the following statements describes [a particular government service] in SArdquo
Figure 9 Performance of SA Government Services against each of the employee attributes
Responses were provided according to a scale from 1 (strongly disagree) to 10 (strongly agree) The average score against each attribute by service is tabulated Note this analysis represents consumer data only
Base Consumers (n=2727)
Note Very small number of responses (nlt=30)
Services
Honesty and Integrity of Employees Efficiency and Effectiveness Communication of Employees Fairness and Empathy of employees
Are honest
Deliver high safety standards
Provide good value
services
Are reliable
Get things done as quickly as
possible
Held Accountable
Explain intended
actions clearlyAre consistent
Engender confidence in
their knowledge
Communicate well
Provide services
without bias
See things from my perspective
Agricultural Advice and Funding Services 80 71 80 74 74 82 74 79 74 81 68 68
Ambulance Services 92 92 88 89 90 87 90 89 90 90 92 84Art Galleries and Museums 87 87 87 85 79 81 83 84 84 85 84 81Business Advisory Services 73 72 69 76 70 70 74 73 73 75 69 66Child Welfare Services 53 55 50 47 43 50 53 45 51 55 52 50Consumer Affairs 74 71 71 71 64 67 74 74 73 72 73 66Courts 71 72 64 67 59 60 73 64 72 74 71 60Disability Services 71 67 63 63 56 58 64 61 65 65 68 63Documentation Services 78 77 69 72 62 69 70 71 73 71 76 67Environment and Wildlife Protection 70 71 69 70 65 66 65 76 68 73 69 66Fire Brigades 93 96 95 94 93 90 88 89 93 92 91 85Major Roads 69 64 61 61 52 55 63 67 60 63 70 58Police 75 77 74 74 68 71 74 71 73 73 71 68Prisons 56 78 66 68 59 56 69 65 60 64 64 64Public Hospitals 79 78 78 75 70 73 77 74 77 75 78 71Public Housing 65 64 63 60 57 55 65 62 62 61 62 55Public Schools 76 75 73 72 69 70 73 70 72 73 70 69Public Transport 73 73 72 69 68 68 71 70 70 70 75 67Services for Older People 76 73 74 72 66 68 74 72 72 74 77 72State Emergency Services 92 94 92 93 90 91 90 92 90 90 92 87TAFE Services 73 73 72 68 64 71 69 69 71 70 74 67Vehicle Licensing and Registration 80 78 74 78 73 73 78 77 76 76 79 72Water Supply 74 74 69 71 65 67 71 73 73 72 76 69Overall average 77 76 74 74 69 70 75 73 74 74 76 70
Consumer
Note Interpret with caution Very small number of responses (nlt=30)
Ambulance Services Art Galleries and Museums State Emergency Services and Fire Brigades perform well against employee attributes
84
Source Customer Service Commission Customer Satisfaction Measurement Survey 2019 Report developed in conjunction with the NSW Customer Service CommissionerPublic I1-A2
Customers are asked ldquoThinking about the values that they uphold to what extent would you agree with each of the following statements when thinking about [a particular government service] in SArdquo
Figure 10 Performance of SA Government Services against values
Responses were provided according to a scale from 1 (strongly disagree) to 10 (strongly agree) The average score against each attribute by service is tabulated Note this analysis represents consumer data only
Services
Accountability and Service quality
Is a body I can trust Operates with integrity Is accountable for its services Provides good values services
Agricultural Advice and Funding Services 77 78 75 76
Ambulance Services 91 90 90 89
Art Galleries and Museums 85 85 84 86
Business Advisory Services 72 74 71 74
Child Welfare Services 41 48 46 45
Consumer Affairs 67 68 64 70
Courts 64 66 59 64
Disability Services 61 63 61 59
Documentation Services 71 72 69 70
Environment and Wildlife Protection 65 64 61 64
Fire Brigades 92 92 91 94
Major Roads 58 59 58 58
Police 73 73 70 73
Prisons 55 62 62 61
Public Hospitals 74 75 71 73
Public Housing 58 57 57 58
Public Schools 73 74 72 74
Public Transport 67 69 67 70
Services for Older People 68 71 66 69
State Emergency Services 92 92 90 92
TAFE Services 69 69 68 70
Vehicle Licensing and Registration 75 75 73 74
Water Supply 67 68 64 68
Overall average 72 73 70 72
Average score higherlower compared to overall SA average
Base Consumers (n=2936)
VARIATION IN CONSUMERSrsquo VIEWS OF PERFORMANCE AGAINST VALUES ACROSS SERVICESConsumer
Note Interpret with caution Very small number of responses (nlt=30)
Services that have high scores across headline measures (satisfaction expectation and ideal service) also perform well against values related attributes These services are Ambulance Services Art Galleries and Museums State Emergency Services and Fire Brigades
85
Source Customer Service Commission Customer Satisfaction Measurement Survey 2019 Report developed in conjunction with the NSW Customer Service CommissionerPublic I1-A2
Average score higherlower compared to overall SA average
Base Consumers (n=2617)Customers are asked ldquoThinking now about its processes) to what extent do you agree or disagree the followingstatements describes [a particular Government Service] in SArdquo
Figure 11 Performance of SA Government Services against process attributes
Responses were provided according to a scale from 1 (strongly disagree) to 10 (strongly agree) The average score against each attribute by service is tabulated Note this analysis represents consumer data only
Services
Simplicity and Efficiency of Processes Employee autonomy
Processes are easy to understand
Processes are designed to reduce wait times
I can get to the right person the first time
Services feel seamless across channels
Employees are empowered to make decisions
Agricultural Advice and Funding Services 61 73 73 67 68
Ambulance Services 86 81 84 83 87
Art Galleries and Museums 79 74 78 76 73
Business Advisory Services 70 67 71 64 72
Child Welfare Services 49 45 43 42 48
Consumer Affairs 71 59 60 62 63
Courts 61 50 58 55 62
Disability Services 55 53 52 52 56
Documentation Services 67 66 68 64 68
Environment and Wildlife Protection 61 60 58 56 60
Fire Brigades 86 87 86 88 83
Major Roads 55 50 50 49 51
Police 70 65 65 65 73
Prisons 53 50 57 57 57
Public Hospitals 67 56 60 63 68
Public Housing 62 50 56 56 54
Public Schools 69 64 66 66 67
Public Transport 70 65 66 66 66
Services for Older People 65 59 61 62 63
State Emergency Services 86 87 85 84 83
TAFE Services 66 62 63 65 66
Vehicle Licensing and Registration 74 65 69 68 69
Water Supply 67 61 63 64 64
Overall Average 70 63 65 65 68
VARIATION IN CONSUMERSrsquo VIEWS OF PERFORMANCE AGAINST PROCESS ATTRIBUTES ACROSS SERVICES
Consumer
Note Interpret with caution Very small number of responses (nlt=30)
Services that have high scores across headline measures (satisfaction expectation and ideal service) also perform well against process attributes These services are Ambulance Services Art Galleries and Museums State Emergency Services and Fire Brigades
86
Source Customer Service Commission Customer Satisfaction Measurement Survey 2019 Report developed in conjunction with the NSW Customer Service CommissionerPublic I1-A2
Average score higherlower compared to overall SA average
Customers are asked ldquoThinking about the services they provide overall how would rate [a particular government service] in SA on the followingrdquoFigure 12 Performance of SA Government Services against goals
Base Consumers (n=2582)
Responses were provided according to a scale from 1 (strongly disagree) to 10 (strongly agree) The average score against each attribute by service is tabulated Note this analysis represents consumer data only
Services
Transparency Access to information Privacy
Demonstrate openness and transparency in decision
making
Encourage public participation in decision
making
Is making it easier to access information about their
services
Is making best use of online services to improve efficiency
for customers
Safeguard privacy and confidentiality
Agricultural Advice and Funding Services 74 71 73 75 78
Ambulance Services 83 77 84 80 89
Art Galleries and Museums 78 76 80 79 80
Business Advisory Services 71 68 70 65 72
Child Welfare Services 44 37 49 43 58
Consumer Affairs 64 56 66 67 74
Courts 61 49 64 57 70
Disability Services 56 54 57 59 69
Documentation Services 71 62 70 69 78
Environment and Wildlife Protection 60 56 69 60 71
Fire Brigades 82 80 85 82 90
Major Roads 56 53 56 58 68
Police 65 58 68 63 76
Prisons 54 49 56 49 64
Public Housing 69 61 68 63 76
Public Hospitals 54 50 54 52 69
Public Schools 67 66 71 68 73
Public Transport 64 61 71 71 71
Services for Older People 65 60 66 65 77
State Emergency Services 86 81 85 78 88
TAFE Services 67 64 69 69 74
Vehicle Licensing and Registration 69 58 73 74 78
Water Supply 64 57 69 67 71
Overall Average 67 61 70 68 75
VARIATION IN CONSUMERSrsquo VIEWS OF PERFORMANCE AGAINST GOALS ACROSS SERVICES
Consumer
Note Interpret with caution Very small number of responses (nlt=30)
Services that have high scores across headline measures (satisfaction expectation and ideal service) also perform well against goals attributes These services are Ambulance Services Art Galleries and Museums State Emergency Services and Fire Brigades
87
Source Customer Service Commission Customer Satisfaction Measurement Survey 2019 Report developed in conjunction with the NSW Customer Service CommissionerPublic I1-A2
Average score higherlower compared to overall SA average
VARIATION IN BUSINESSESrsquo VIEWS OF EMPLOYEE PERFROMANCE ACROSS SERVICES
Customers are asked ldquoThinking now about its employees to what extent do you agree or disagree that each of the following statements describes [a particular government service] in SArdquo
Figure 9 Performance of SA Government Services against each of the employee attributes
Responses were provided according to a scale from 1 (strongly disagree) to 10 (strongly agree) The average score against each attribute by service is tabulated Note this analysis represents consumer data only
Base Businesses (n=657)
Services
Honesty and Integrity of Employees Efficiency and Effectiveness Empathy and Communication of Employees Fairness
Are honest
Deliver high
safety standards
Provide good value
services
Are reliable
Communicate well
Are consistent
Engender confidence in
their knowledge
Explain intended actions clearly
Get things done as quickly as
possible
Held Accountable
See things from my perspective
Provide services
without bias
Agricultural Advice and Funding Services 59 52 53 56 52 53 54 53 45 53 46 50Ambulance Services 91 92 92 93 90 91 92 93 94 91 87 92Art Galleries and Museums 83 74 88 85 86 78 83 85 69 83 79 79Business Advisory Services 71 73 71 70 70 71 69 71 66 62 66 70Child Welfare Services 71 71 62 54 59 50 62 70 55 56 55 76Consumer Affairs 72 73 65 71 73 66 71 70 61 66 65 71Courts 76 68 63 68 70 74 66 75 63 53 61 73Disability Services 80 77 76 73 73 74 75 70 69 74 66 75Documentation Services 90 80 79 72 79 81 80 79 67 74 75 80Environment and Wildlife Protection 80 77 78 76 77 76 78 78 78 70 68 71Fire Brigades 85 99 89 85 85 99 93 83 96 96 88 99Major Roads 79 79 70 70 70 64 69 55 74 60 73 78Police 78 83 76 76 76 79 80 77 68 77 71 81Prisons 74 76 72 74 77 75 74 74 75 91 73 77Public Hospitals 70 69 68 68 67 67 65 69 64 61 64 70Public Housing 85 78 81 68 82 86 84 79 68 84 76 79Public Schools 70 71 65 65 65 62 66 66 58 66 64 64Public Transport 76 70 70 65 70 71 67 69 76 62 71 68Services for Older People 76 75 73 72 74 69 73 69 70 72 68 72State Emergency Services 83 86 85 83 81 80 80 82 79 82 86 89TAFE Services 69 64 67 66 63 66 59 64 61 64 61 63Vehicle Licensing and Registration 75 75 69 72 72 71 72 74 69 66 67 74Water Supply 66 75 67 69 70 70 74 71 62 66 61 74Overall Average 75 75 71 71 72 71 72 72 68 69 68 73
Note Interpret with caution Very small number of responses (nlt=30)
Business
Due to low sample sizes for most of the services data is to be viewed as indicative only
88
Source Customer Service Commission Customer Satisfaction Measurement Survey 2019 Report developed in conjunction with the NSW Customer Service CommissionerPublic I1-A2
Customers are asked ldquoThinking about the values that they uphold to what extent would you agree with each of the following statements when thinking about [a particular government service] in SArdquo
Figure 10 Performance of SA Government Services against values
Responses were provided according to a scale from 1 (strongly disagree) to 10 (strongly agree) The average score against each attribute by service is tabulated Note this analysis represents consumer data only
Services
Accountability and Service quality
Is a body I can trust Operates with integrity Is accountable for its services Provides good values services
Agricultural Advice and Funding Services 46 47 54 57
Ambulance Services 96 91 92 93
Art Galleries and Museums 89 89 93 91
Business Advisory Services 67 71 60 63
Child Welfare Services 65 71 66 59
Consumer Affairs 69 68 65 64
Courts 72 78 63 71
Disability Services 70 72 70 70
Documentation Services 80 80 76 82
Environment and Wildlife Protection 73 75 73 71
Fire Brigades 94 94 94 94
Major Roads 69 64 78 68
Police 80 79 78 82
Prisons 69 69 72 71
Public Hospitals 64 65 65 68
Public Housing 66 73 70 70
Public Schools 66 64 68 61
Public Transport 69 70 71 67
Services for Older People 74 76 73 76
State Emergency Services 87 89 86 85
TAFE Services 61 65 60 67
Vehicle Licensing and Registration 72 73 68 71
Water Supply 62 65 61 66
Overall Average 71 72 70 71
Average score higherlower compared to overall SA average
Base Businesses (n=702)
VARIATION IN BUSINESSESrsquo VIEWS OF PERFORMANCE AGAINST VALUES ACROSS SERVICES
Note Interpret with caution Very small number of responses (nlt=30)
Business
Due to low sample sizes for most of the services data is to be viewed as indicative only
89
Source Customer Service Commission Customer Satisfaction Measurement Survey 2019 Report developed in conjunction with the NSW Customer Service CommissionerPublic I1-A2
Average score higherlower compared to overall SA average
Base Businesses (n=661)Customers are asked ldquoThinking now about its processes to what extent do you agree or disagree the following statements describes [a particular GovernmentService] in SArdquo
Figure 11 Performance of SA Government Services against process attributes
Responses were provided according to a scale from 1 (strongly disagree) to 10 (strongly agree) The average score against each attribute by service is tabulated Note this analysis represents consumer data only
Services
Simplicity and Efficiency of Processes Responsiveness
Processes are easy to understand
Processes are designed to reduce wait times
I can get to the right person the first time
Services feel seamless across channels
Employees are empowered to make
decisions
Agricultural Advice and Funding Services 42 40 46 41 61
Ambulance Services 88 86 88 84 89
Art Galleries and Museums 86 84 77 74 70
Business Advisory Services 64 56 59 60 63
Child Welfare Services 66 51 51 51 45
Consumer Affairs 68 60 67 62 64
Courts 58 46 55 54 74
Disability Services 62 50 66 66 65
Documentation Services 72 69 63 80 75
Environment and Wildlife Protection 68 66 64 68 62
Fire Brigades 93 85 84 93 98
Major Roads 59 69 73 64 78
Police 69 64 69 63 76
Prisons 72 70 72 62 71
Public Hospitals 65 52 58 58 59
Public Housing 71 62 71 64 48
Public Schools 64 66 68 69 64
Public Transport 66 66 63 64 66
Services for Older People 67 59 68 67 68
State Emergency Services 84 82 72 80 84
TAFE Services 64 55 60 65 56
Vehicle Licensing and Registration 70 62 65 65 64
Water Supply 65 60 62 63 62
Overall Average 68 61 65 65 66
VARIATION IN BUSINESSESrsquo VIEWS OF PERFORMANCE AGAINST PROCESS ATTRIBUTES ACROSS SERVICES
Note Interpret with caution Very small number of responses (nlt=30)
Business
Due to low sample sizes for most of the services data is to be viewed as indicative only
90
Source Customer Service Commission Customer Satisfaction Measurement Survey 2019 Report developed in conjunction with the NSW Customer Service CommissionerPublic I1-A2
Average score higherlower compared to overall SA average
Customers are asked ldquoThinking about the services they provide overall how would rate [a particular government service] in SA on the followingrdquoFigure 12 Performance of SA Government Services against goals
Base Businesses (n=641)
Responses were provided according to a scale from 1 (strongly disagree) to 10 (strongly agree) The average score against each attribute by service is tabulated Note this analysis represents consumer data only
Services
Transparency Access to information Privacy
Demonstrate openness and transparency in decision
making
Encourage public participation in decision
making
Is making it easier to access information about their
services
Is making best use of online services to improve efficiency
for customers
Safeguard privacy and confidentiality
Agricultural Advice and Funding Services 48 51 43 51 59
Ambulance Services 92 78 89 69 94
Art Galleries and Museums 81 77 75 83 84
Business Advisory Services 64 61 66 69 71
Child Welfare Services 65 52 61 50 81
Consumer Affairs 65 54 67 69 69
Courts 59 44 69 63 83
Disability Services 69 69 62 73 81
Documentation Services 79 69 85 87 87
Environment and Wildlife Protection 69 71 77 74 67
Fire Brigades 98 95 78 54 97
Major Roads 59 69 74 78 74
Police 66 70 77 70 81
Prisons 71 55 54 55 74
Public Hospitals 64 59 61 61 71
Public Housing 75 66 76 73 72
Public Schools 65 70 64 67 69
Public Transport 70 66 71 69 67
Services for Older People 67 73 74 75 73
State Emergency Services 84 82 85 82 84
TAFE Services 58 61 65 60 62
Vehicle Licensing and Registration 66 58 70 71 75
Water Supply 62 55 65 66 70
Overall Average 67 63 69 68 74
VARIATION IN BUSINESSESrsquo VIEWS OF PERFORMANCE AGAINST GOALS ACROSS SERVICES
Note Interpret with caution Very small number of responses (nlt=30)
Business
Due to low sample sizes for most of the services data is to be viewed as indicative only
91
Public ndash I1-A2
SOUTH AUSTRALIAN CUSTOMER SATISFACTION MEASUREMENT SURVEY 2019
The data in this chapter is for informative purposes to compare the perceptions of SA government services Where sample sizes for segments are low (lt30) data is provided for indicative purposes only
APPENDIX 2CONTACT METHOD PREFERENCE BY SERVICE
Source Customer Service Commission Customer Satisfaction Measurement Survey 2019 Report developed in conjunction with the NSW Customer Service CommissionerPublic I1-A2
CONTACT METHODS PREFERRED TO INTERACT WITH SA GOVERNMENT SERVICESConsumers have different contact preferences for different types of services Agricultural Advice and Funding Services Vehicle Licensing andRegistration Documentation Services Major Roads and Public Transport and Water Supply are the top 6 services where online is the preferredcontact method Agricultural Advice and Funding Services Major Roads and Consumer Affairs have see the biggest growth in online preferenceversus last year
Consumer
Figure 13 Breakdown of most preferred contact methods across services
Note Each respondent could select any number of contact methodsBase 2019 Consumers (n=3170) 2018 Consumers (n=3152)
Note Interpret with caution Very small number of responses (nlt=30) Legend top 5 services for each contact method
2018 2019 2018 2019 2018 2019Agricultural Advice and Funding Services 37 46 14 17 0 0Vehicle Licensing and Registration 47 43 27 27 7 8Documentation Services 40 38 26 17 14 10Major Roads 21 29 29 19 20 19Public Transport 31 27 42 35 12 17Water Supply 20 27 9 4 46 37Consumer Affairs 15 26 7 13 44 26Business Advisory Services 21 22 27 21 31 15Environment and Wildlife Protection 37 21 8 27 19 19TAFE Services 18 20 29 21 16 17Art Galleries and Museums 17 18 44 60 12 6Child Welfare Services 13 14 37 19 28 43Ambulance Services 10 13 25 23 53 45Prisons 6 11 37 40 54 27Courts 8 11 52 44 19 23Services for Older People 13 11 33 28 40 46Police 6 10 53 47 25 30Public Schools 8 9 47 42 18 20Disability Services 5 9 39 32 37 37Fire Brigades 8 8 73 44 19 29Public Housing 11 7 27 39 44 39State Emergency Services 23 6 16 31 34 39Public Hospitals 5 6 58 53 23 29
ServicesOnline
In person face-to-face
Telephone (landline or mobile phone calls text message)
93
+9 pts
+8 pts
+11 pts
Source Customer Service Commission Customer Satisfaction Measurement Survey 2019 Report developed in conjunction with the NSW Customer Service CommissionerPublic I1-A2
Note Each respondent could select one preferred contact method
CONTACT METHODS PREFERRED TO USE TO INTERACT WITH SA GOVERNMENT SERVICES
Figure 14 Breakdown of most commonly preferred contact methods across services
Base 2019 Business (n=743) 2018 Business (n=795)
Preference for online has decreased for those who interacted with Vehicle Licensing and Registration with an increase inpreference for face to face Public Transport has also seen a decline in preference for online with preference moving to face toface as well as telephone
Business
Note Interpret with caution Very small number of responses (nlt=30)
2018 2019 2018 2019 2018 2019Documentation Services 41 52 0 23 7 0Major Roads 18 49 36 48 1 1Vehicle Licensing and Registration 52 33 20 36 4 9Consumer Affairs 13 30 13 6 46 23Public Transport 54 24 23 29 9 18Agricultural Advice and Funding Services 19 21 47 1 0 30Water Supply 22 20 14 3 37 27Services for Older People 10 20 23 24 30 34Business Advisory Services 29 19 15 19 23 26Disability Services 20 13 12 28 38 34Environment and Wildlife Protection 12 12 11 13 11 9Ambulance Services 14 12 41 13 44 50Police 6 7 50 56 34 29TAFE Services 4 6 31 23 41 18Public Schools 0 4 49 45 22 26Public Hospitals 5 3 53 54 11 21Fire Brigades 0 0 2 2 23 78Art Galleries and Museums 29 0 29 17 0 41State Emergency Services 0 0 0 58 79 14Child Welfare Services 12 0 33 24 33 38Courts 10 0 40 61 10 9Public Housing 18 0 34 83 14 15Prisons 0 0 27 34 46 34
ServicesOnline In person face-to-face Telephone (landline or mobile phone calls
text message)
Legend top 5 services for each contact method
94
-30 pts