Embed Size (px)
Citation preview

Behavioral Portfolio TheoryAuthor(s): Hersh Shefrin and Meir StatmanSource: The Journal of Financial and Quantitative Analysis, Vol. 35, No. 2 (Jun., 2000), pp. 127-151Published by: University of Washington School of Business AdministrationStable URL: http://www.jstor.org/stable/2676187Accessed: 31/03/2010 21:05
Your use of the JSTOR archive indicates your acceptance of JSTOR's Terms and Conditions of Use, available athttp://www.jstor.org/page/info/about/policies/terms.jsp. JSTOR's Terms and Conditions of Use provides, in part, that unlessyou have obtained prior permission, you may not download an entire issue of a journal or multiple copies of articles, and youmay use content in the JSTOR archive only for your personal, non-commercial use.
Please contact the publisher regarding any further use of this work. Publisher contact information may be obtained athttp://www.jstor.org/action/showPublisher?publisherCode=uwash.
Each copy of any part of a JSTOR transmission must contain the same copyright notice that appears on the screen or printedpage of such transmission.
JSTOR is a not-for-profit service that helps scholars, researchers, and students discover, use, and build upon a wide range ofcontent in a trusted digital archive. We use information technology and tools to increase productivity and facilitate new formsof scholarship. For more information about JSTOR, please contact [email protected].
University of Washington School of Business Administration is collaborating with JSTOR to digitize, preserveand extend access to The Journal of Financial and Quantitative Analysis.
http://www.jstor.org

JOURNAL OF FINANCIAL AND QUANTITATIVE ANALYSIS VOL 35, NO. 2, JUNE 2000 COPYRIGHT 2000, SCHOOL OF BUSINESS ADMINISTRATION, UNIVERSITY OF WASHINGTON, SEATTLE, WA 98195
Behavioral Portfolio Theory
Hersh Shefrin and Meir Statman*
Abstract
We develop a positive behavioral portfolio theory (BPT) and explore its implications for
portfolio construction and security design. The optimal portfolios of BPT investors re- semble combinations of bonds and lottery tickets, consistent with Friedman and Savage's (1948) observation. We compare the BPT efficient frontier with the mean-variance effi- cient frontier and show that, in general, the two frontiers do not coincide. Optimal BPT
portfolios are also different from optimal CAPM portfolios. In particular, the CAPM two- fund separation does not hold in BPT. We present BPT in a single mental account version (BPT-SA) and a multiple mental account version (BPT-MA). BPT-SA investors integrate their portfolios into a single mental account, while BPT-MA investors segregate their port? folios into several mental accounts. BPT-MA portfolios resemble layered pyramids, where
layers are associated with aspirations. We explore a two-layer portfolio where the low as-
piration layer is designed to avoid poverty while the high aspiration layer is designed for a shot at riches.
I. Introduction
We develop behavioral portfolio theory (BPT) as a positive portfolio theory on the foundation of SP/A theory (Lopes (1987)) and prospect theory (Kahneman and Tversky (1979)), two theories of choice under uncertainty. Both SP/A theory and prospect theory emerged from the literature addressing Friedman and Sav?
age's (1948) puzzle, the observation that people who buy insurance policies often
buy lottery tickets as well.
Markowitz's (1952a) mean-variance portfolio theory is one of three portfolio theories introduced in 1952 and the only one inconsistent with the Friedman-
Savage puzzle. The two other portfolio theories, Markowitz's (1952b) customary wealth theory and Roy's (1952) safety-first theory, are consistent with the puzzle. Indeed, Markowitz (1952b) introduced customary wealth theory to deal with some
unrealistic implications of the Friedman-Savage framework.
Embedded within BPT is an efficient frontier. We compare the BPT efficient
frontier with the mean-variance efficient frontier and show that, in general, the two
* Both authors, Department of Finance, Leavey School of Business, Santa Clara University, Santa Clara, CA 95053. We thank Enrique Arzac, Peter Bernstein, the late Fischer Black, Werner De Bondt, Daniel Kahneman, Lola Lopes, Harry Markowitz, and Drazen Prelec for comments. We also thank Stephen Brown (the editor) and William Goetzmann (associate editor and referee) for constructive advice on how to shape the paper. This work was supported by the National Science Foundation, grant NSF SES-8709237, and the Dean Witter Foundation.
127
128 Journal of Financial and Quantitative Analysis
frontiers do not coincide; portfolios on the BPT efficient frontier are generally not on the mean-variance efficient frontier. Mean-variance investors choose portfolios by considering mean and variance. In contrast, BPT investors choose portfolios by considering expected wealth, desire for security and potential, aspiration levels, and probabilities of achieving aspiration levels.
The optimal portfolios of BPT investors are different from those of CAPM
investors as well. The optimal portfolios of CAPM investors combine the market
portfolio and the risk-free security. In contrast, the optimal portfolios of BPT investors resemble combinations of bonds and lottery tickets.
We present BPT in two versions: a single mental account BPT version (BPT- SA) and a multiple mental account version (BPT-MA). BPT-SA investors, like
mean-variance investors, integrate their portfolios into a single mental account;
they do so by considering covariance. In contrast, BPT-MA investors segregate their portfolios into mental accounts and overlook covariance among mental ac?
counts. Note that BPT-MA differs from both Markowitz's mean-variance theory (1952a) and Markowitz's customary wealth theory (1952b). For example, BPT- MA investors might place foreign stocks in one mental account and domestic
stocks in another. They might consider foreign stocks highly risky because they overlook the effect that the covariance between foreign and domestic stocks exerts
on the risk of the portfolio, viewed as an integrated single account.
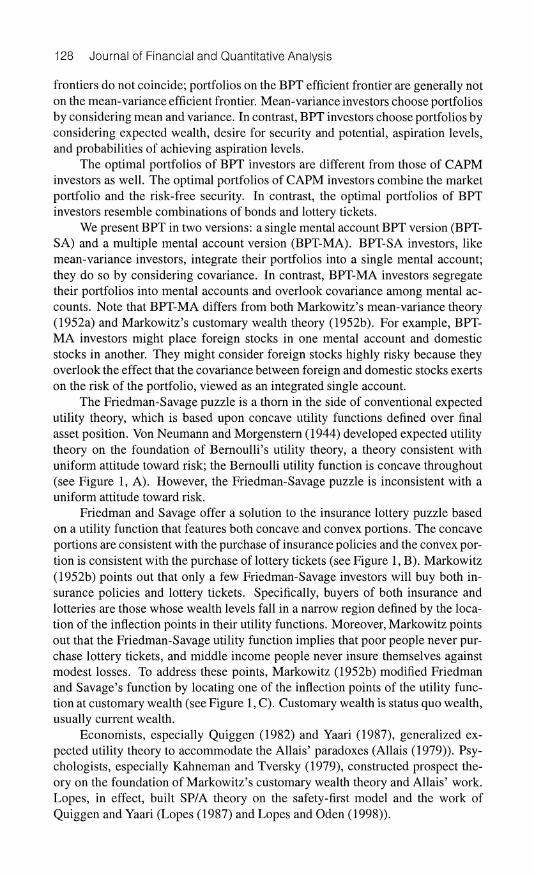
The Friedman-Savage puzzle is a thorn in the side of conventional expected
utility theory, which is based upon concave utility functions defined over final
asset position. Von Neumann and Morgenstern (1944) developed expected utility
theory on the foundation of Bernoulli's utility theory, a theory consistent with
uniform attitude toward risk; the Bernoulli utility function is concave throughout (see Figure 1, A). However, the Friedman-Savage puzzle is inconsistent with a
uniform attitude toward risk.
Friedman and Savage offer a solution to the insurance lottery puzzle based
on a utility function that features both concave and convex portions. The concave
portions are consistent with the purchase of insurance policies and the convex por? tion is consistent with the purchase of lottery tickets (see Figure 1, B). Markowitz
(1952b) points out that only a few Friedman-Savage investors will buy both in?
surance policies and lottery tickets. Specifically, buyers of both insurance and
lotteries are those whose wealth levels fail in a narrow region defined by the loca?
tion of the inflection points in their utility functions. Moreover, Markowitz points out that the Friedman-Savage utility function implies that poor people never pur? chase lottery tickets, and middle income people never insure themselves against modest losses. To address these points, Markowitz (1952b) modified Friedman
and Savage's function by locating one of the inflection points of the utility func?
tion at customary wealth (see Figure 1, C). Customary wealth is status quo wealth,
usually current wealth.
Economists, especially Quiggen (1982) and Yaari (1987), generalized ex?
pected utility theory to accommodate the Allais' paradoxes (Allais (1979)). Psy-
chologists, especially Kahneman and Tversky (1979), constructed prospect the?
ory on the foundation of Markowitz's customary wealth theory and Allais' work.
Lopes, in effect, built SP/A theory on the safety-first model and the work of
Quiggen and Yaari (Lopes (1987) and Lopes and Oden (1998)).
Shefrin and Statman 129
1A. Bernoulli's Utility Function
FIGURE 1
1B. Friedman-Savage's Utility Function
Dollars Dollars
1C. Markowitz's Customary-Wealth Utility Theory
1D. Kahneman and Tversky's Prospect Theory Utility Function
Customary Wealth X
Dollars
Source: Lopes (1987)
The paper is organized as follows: in Section II, we review the safety-first
portfolio framework from Roy to Kataoka, Telser, and Arzac and Bawa. In Sec?
tion III, we present Lopes' SP/A theory. SP/A theory focuses on the twin desires
for security (S) and potential (P) and on the aspiration levels associated with se?
curity and potential. Section IV develops BPT. We characterize the BPT-SA
efficient frontier and show that, in general, BPT-SA efficient portfolios are not
mean-variance efficient. Section V describes the return distributions of efficient
BPT-SA portfolios. In Section VI, we address the misconception that Tcheby- shev's inequality implies that optimal safety-first portfolios always lie on the
mean-variance efficient frontier. In Section VII, we describe BPT-SA portfolios when returns are normally distributed and show that constraints on short sales
can lead these portfolios to lie off the mean-variance efficient frontier. Section
VIII develops BPT-MA for the case where investors segregate portfolios into two
mental accounts, one designed for safety and the other designed for potential. In
Section IX, we discuss several structural issues concerning BPT portfolios. In par? ticular, we show that BPT-MA portfolios are neither BPT-SA efficient in general, nor mean-variance efficient. Section X discusses the evolutionary implications of

130 Journal of Financial and Quantitative Analysis
BPT. We show that BPT-SA efficient portfolios are fitter than some, but not all, mean-variance efficient portfolios. In Section XI, we compare real life portfolios to BPT portfolios, and in Section XII, we offer conclusions and directions for
future research.
II. Safety-First Portfolio Theory
Investors in Roy's (1952) safety-first portfolio theory aim to minimize
Pr{W < s}, the probability of ruin. An investor is ruined when his terminal
wealth W falls short of a subsistence level s.
Let P be an arbitrary portfolio with corresponding return mean pp and return
standard deviation ap. Roy focuses on the case when there is no risk-free secu?
rity (ap > 0 for all P) and the subsistence level s is low (s < pp for all P). In
the special case when all portfolio return distributions are constrained to be nor?
mal, minimizing the probability of ruin is equivalent to minimizing the number of
standard deviations in which s lies below pp. That is, in Roy's safety-first model, with normally distributed returns, an investor chooses a portfolio P to minimize
the objective function {s ? pp)jop.
Suppose returns are not constrained to be normally distributed. Roy uses
Tchebyshev's inequality to argue that the same objective function applies. His
argument seems to imply that all optimal safety-first portfolios lie on the mean-
variance frontier. However, we argue that this is not the case. In general, optimal
safety-first portfolios are not mean-variance efficient.
Elton and Gruber (1995) discuss two generalizations of safety-first, one by Kataoka (see Elton and Gruber (1995), p. 237) and two others by Telser (1955). Kataoka dispenses with Roy's notion of a predetermined subsistence level, s. The
objective of Kataoka's safety-first investors is to maximize the subsistence level
subject to the constraint that the probability that wealth (W) falls below the sub?
sistence level (s) does not exceed a predetermined a.1
Telser (1955) developed a model that features both a fixed subsistence level
s and a ruin probability a. In Telser's model, a portfolio is considered safe if the
probability of ruin does not exceed a. Telser suggested that an investor choose a
portfolio to maximize expected wealth E(W) subject to Prob{ W < s} < a.
Arzac (1974) analyzes the nature and existence of an optimal solution in
Telser's safety-first model. Arzac and Bawa (1977) extend Telser's model by
allowing a, the probability of ruin, to vary. Arzac-Bawa safety-first investors
maximize an objective function V defined over expected wealth, E(W), and the
probability of ruin, a. In particular, choice over (E( W), a) pairs is accommodated
within an expected utility framework, when the utility function u is defined by
(1) u(W) = W if Prob{W < s} < a,
u(W) = W-c if Prob{W < s} > a,
for c > 0. In this case, expected utility takes the form E(W) -cProb{W < s}. Indeed, Markowitz (1959) established that this is the only functional form consis-
lpThat is, the objective is to choose a portfolio featuring the maximum wealth Wa defining the lower 100a percentile.

Shefrin and Statman 131
tent with the principles of expected utility and Telser's version of the safety-first problem.2
There is now a large literature demonstrating that people systematically vi-
olate the axioms of expected utility (Kahneman and Tversky (1979)). In the re-
mainder of the paper, we focus on choice theories where the axioms of expected
utility are violated.
III. SP/A Theory
Lopes (1987) developed SP/A theory, a psychological theory of choice un?
der uncertainty. SP/A theory is a general choice framework rather than a theory of portfolio choice. However, SP/A theory can be regarded as an extension of
Arzac's version of the safety-first portfolio model.
In SP/A theory, the S stands for security, P for potential, and A for aspi- ration. Lopes' notion of security is analogous to safety in safety-first, a general concern about avoiding low levels of wealth. Her notion of aspiration relates to
a goal, and generalizes the safety-first concept of reaching a specific target value, such as s. There is no counterpart to potential in the safety-first framework. Po?
tential relates to a general desire to reach high levels of wealth.
In the Arzac-Bawa and Telser models, danger means the possibility that
wealth might fall below a particular minimum level s. They measure the prob?
ability of safety as Prob{ W > s}. This probability is a decumulative probability,
meaning that it has the form D(x) = Prob{W > x} : D is called a decumulative
distribution function. In Lopes' framework, two emotions operate on the willingness to take risk:
fear and hope. Both emotions function by altering the relative weights attached to
decumulative probabilities. As in Arzac-Bawa and Telser's formulation, Lopes' choice model focuses on an expected wealth function.
Lopes uses a discrete-state formulation, similar to that in Arzac (1974). In
this regard, consider a two-date framework, where the dates are labeled zero and
one. Let there be n states associated with date one, where pt = Prob{ Wj, i =
1,2,..., n, and wealth levels are ranked W\ < W2 < ... < Wn.
Lopes notes that expected wealth, E(W) ? EpiWi, can be expressed as
EDi (Wt - W,-_i), where the summation is from i = 1 to n and Wo is zero. In this
expression for E(W)9 the individual receives W\ with certainty (note that D\ = 1), receives the increment W2 ? W\ (that is, an amount over W\) with probability D2, receives the further increment W3 ? W2 with probability D3, and so on.
Lopes contends that fear operates through an overweighting of the probabil? ities attached to the worst outcomes relative to the best outcomes. She postulates that fear leads individuals to act as if they computed E(W) using a value for p\ that
is excessively high, and a value forpn that is excessively low. In other words, they act as if they were unduly pessimistic when computing E(W). Lopes also pos? tulates that hope leads individuals to act as if they were unduly optimistic when
computing E(W), using a value for p\ that is excessively low, and a value for/?rt that is excessively high.
2This utility function can be considered a limiting case of the utility function developed in Markowitz (1952b). We thank Harry Markowitz for this point.

132 Journal of Financial and Quantitative Analysis
In Lopes' framework, fear underlies the concern for security, and hope un- derlies the concern for potential. Formally, fear affects attitude toward a risky outcome through a reweighting of the decumulative probabilities. Specifically, Lopes computes E(W) using the decumulative function hs(D) = Dls+q where the
subscript s stands for security. For qs > 0, this function attaches disproportionate
weight to higher values of D. As a result, D stochastically dominates hs(D), since it effectively shifts probability weight from the right of the distribution's support to the left.
Hope operates like fear, but it induces higher weighting of lower values of
D, the ones that attach to higher outcomes. Lopes' counterpart to hs(D) is hp(D), where the/? stands for potential: hp(D) has the form 1 ?
(1 ? D)l+qp.
Lopes argues that the emotions of fear and hope reside within all individuals, and that each emotion serves to modify the decumulative weighting function. She
suggests that the final shape of the decumulative transformation function is a con?
vex combination of hs and hp, reflecting the relative strength of each. Specifically, the transformation function h(D) has the form,
(2) h(D) = 5hs(D) + (1 -
5)hp(D).
In SP/A theory, the investor substitutes E(W) with Eh(W), replacing the
probability /?/ attached to the ith event with the difference rt = h{Di+\) -
/*(?>/). SP/A departs from the expected utility framework by using a rank dependent for?
mulation, replacing D with h(D). Note that the rank ordering of states is typically the inverse of the rank associated with the price per unit probability ratio, v///?/, this being the pricing kernel. Note also that consistency requires that the ranking of states by v//r/ be the same as the original ranking by v///?/.
Lopes postulates that risky outcomes are evaluated in terms of two variables.
The first variable is Eh(W), the expected value of W under the transformed de?
cumulative function h(D). The second variable is D(A), the probability that the
payoff will be A or higher. Note that these two variables are virtual analogues of
the arguments used in the safety-first model, E(W) and ProbjVK < s}. In fact, the
criterion function used to evaluate alternative risky outcomes is a monotone in?
creasing function U(Eh(W),D(A)). Note also that this conforms to the structure
suggested by Arzac-Bawa (1977), wherein individuals do not maximize E(W)
subject to a probability constraint, but instead maximize a function V(E(W),a).
Formally, the mechanics underlying the optimization in SP/A theory can be
viewed as an adaptation of the Arzac-Bawa (1977) characterization of safety- first theory, where the major difference is in the interpretation of the variables.
Specifically, the subsistence level s is replaced by a more general aspiration level
A. The probability a is a cumulative probability, but can be east in decumulative
form 1 ? a. Finally, E(W) is replaced by Eh(W). In the special case where
qs = qp = 0, Lopes' model collapses to Arzac-Bawa's model.
Note that Eh(W) will be lower than E(W) for individuals who are strongly driven by fear. The greater the fear, the lower the value ofEh(W). Similarly, hope
operates by increasing Eh(W) relative to E(W).

Shefrin and Statman 133
IV. Portfolio Selection in BPT
We develop behavioral portfolio theory (BPT) by combining Lopes' SP/A
theory with the mental accounting structure from Kahneman-Tversky's prospect theory. We begin with a single account version of BPT (BPT-SA), building on SP/A. Later in the paper, we move to a multiple account version of BPT (BPT-
MA), by adding the mental accounting structure of prospect theory. Both BPT-SA and mean-variance investors consider the portfolio as a whole,
namely as a single mental account. They do so by considering covariances, as
Markowitz (1952a) prescribed. Portfolio selection in a BPT-SA framework is
similar to portfolio selection in a mean-variance framework, up to a point. The cornerstone of mean-variance theory is the mean-variance efficient fron?
tier in (/J,,a)-space. The BPT-SA counterpart is in (Eh(W),Pr{W < A})-space. In both cases, investors prefer higher fi and higher ?/j(W), but lower a and lower
Pr{W < A}. Hence, the mean-variance frontier is obtained by maximizing \x for fixed a, and the BPT-SA frontier is obtained by maximizing Eh(W) for fixed
Pr{W < A}. In this section, we present three results. The first characterizes
the BPT-SA efficient frontier, the second characterizes the mean-variance fron?
tier, and the third establishes that, typically, a BPT-SA efficient portfolio is not
mean-variance efficient.
Consider a market in contingent claims at date zero, where a state-/ contin?
gent claim pays one unit of consumption at date one if state i occurs at date one, and zero otherwise. Let the price of a state-/ claim be v/, and imagine that the
states are ordered so that state prices per unit probability, v///?/, are monotoni-
cally decreasing in i. Suppose an investor has wealth Wo at date zero, and seeks
to maximize date one expected wealth ?/z(W), subject to a safety-first constraint,
by purchasing a bundle of date one contingent claims, W\,..., Wn, whose value
EviWi does not exceed Wo.
Theorem 1. Any solution W\,..., Wn to
max : Eh{W) = ErtWh subject to : Prob(W < A) < a,
has the following form. There is a subset T of states, including the nth state sn such that
(3) Wi = 0, for i <? T,
Wi = A, for ieT\{sn},
Wn = (Wo - EviWi)/vn which exceeds A when W0 > vnA,
where the summation in the previous equation is from one to n ? 1. Moreover,
Probjr} > a, but no proper subset V of T features Probjr7} > a. If all states
are equiprobable, then there is a critical state ic such that the optimal portfolio has
the form,
(4) Wt = 0, for i < ic,
Wi = A, for ic < i < n,
Wn = (Wo ?
EviWi)/vn which exceeds A when Wo > vrtA,
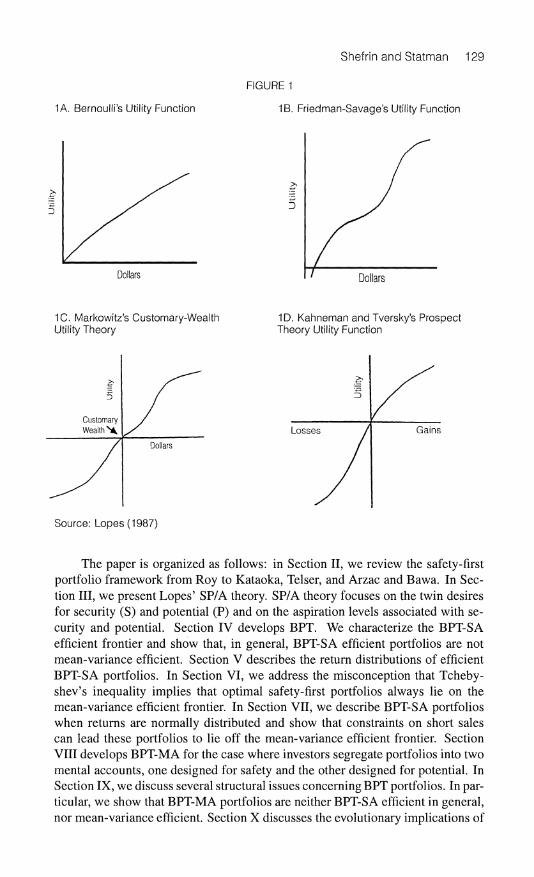
134 Journal of Financial and Quantitative Analysis
where the summation in the previous equation is from one to n - 1, and ic is the lowest integer for which iw>/c/?/ > a.
Proof. Note that Eh(W) is a sum of probability wealth products riW[. Consider the unconstrained maximization of Eh(W). To maximize the sum of probability wealth products, focus on the state that features the lowest price, per unit prob?
ability, for purchasing contingent wealth. By construction, this will be state n.
That is, vn/rn = min/{v//r/}. An unconstrained optimum for the Eh(W) maxi?
mization is the corner solution Wn = Wo/vn with W/ = 0 for all other i. In the
special case when/?n > a, the unconstrained maximum will also be a constrained
maximum. But this is not generally so. To modify the unconstrained maximum, consider the least expensive way of satisfying the constraint. To this end, con?
sider all sets {T"} that include sn and have the property that ProbjT1"} > a, but
no proper subset T' of T" features ProbjT7} > a. To each such set, associate the
sum va(T") = AEi^T" v/. From the finite collection of sets T" so defined, choose
one, 7", that features a minimum value va{T"). Now modify the unconstrained
optimum by reallocating va(T) in value from claims that only pay in state sn to
claims that pay exactly A units of consumption for the states in T^j^}.
In the case of equiprobable states, p-x ? p for all /, the minimum number of states
required to achieve the probability constraint is the first integer na larger than a/p. Since the ratio v//r/ declines with i by construction, the cheapest reallocation from
the unconstrained optimum involves holding positive claims in the top na states, and zero claims in the bottom n - na states. As before, claims to exactly A units
of wealth are held in the top na states, with the exception of state sn. ?
Theorem 1 characterizes an efficient BPT-SA solution. We note that, for suf-
ficiently high values of either A or a, it will be impossible to satisfy the probability constraint and, therefore, no optimal solution will exist.
What is the role of equiprobabilities? If unequal, consider a three-state case
wherep\ = 0.6, p2 ?pz = 0.2, and a = 0.55. In this case, it is impossible to satisfy the probability constraint without featuring positive consumption in state s\. But
this means that it is not necessary to have positive consumption in state S2.3 In the next two theorems, we demonstrate that the BPT-SA efficient portfo?
lios described in Theorem 1 are typically not mean-variance efficient.
Theorem 2. In the discrete-state case, a mean-variance efficient portfolio has the
form,
(5) Wi = l/bll-HUvj-bWoyUvj/p^Vi/pi],
where b is a positive constant.
Proof. The mean-variance efficient portfolios can be obtained by maximizing
expected quadratic utility,
EPi{Wi-{b/2)W}),
3The equiprobable framework provides the basis for moving from discrete states to continuous states in the limit. Hence, we focus on the special case (4) rather than the more general (3).

Shefrin and Statman 135
subject to the constraint Ev{Wi < Wo. To establish the theorem, use the La-
grangean technique to solve for the constrained maximum. This yields the first
order condition,
Wi = l/b[l-\Vi/Pi],
where A is the Lagrange multiplier. Solving for A from the budget constraint
EviWi < W0, yields
A = [Evj -
bW0]/Ev]/pj.
Substitution of A into the first order condition completes the proof. ?
A non-negativity condition has not been imposed in Theorem 2. Note that, for sufficiently low values of the parameter b, the solution (5) will turn negative.
Imposing a non-non-negativity constraint on date one wealth leads to a situation
where W; is zero at some of the highest-priced states, and the summations in
Theorem 2 are over states that feature positive consumption.
Non-negativity also interferes with two-fund separation. Note that, when ex?
pressed in vector form [Wi], (5) implies the two-fund separation property. How?
ever, when a non-negativity constraint is imposed on Wi, and (5) is replaced by a
constrained version, the separation property becomes local. The separation prop?
erty holds only for portfolios that feature positive claims in the exact same states.
Theorem 3. If there are at least three states that feature positive consumption in a
BPT-SA efficient portfolio, with distinct values for v///?/, then that portfolio is not
mean-variance efficient.
Proof. As noted in Theorem 2, a mean-variance solution has the form,
Wi = l/b[l-{[Evj-bWo}/Evj/pj)vi/Pl],
which is a strictly concave function of Vj/pj, the probability normalized price. But
the optimal BPT-SA portfolio is strictly increasing in i and features exactly three
payoff levels, of which one is zero. ?
V. The Character of Optimal BPT-SA Portfolios
BPT-SA investors choose optimal portfolios by maximizing U(Eh(W), D(A))
along the BPT-SA efficient frontier. Theorem 1 describes the return distribution
of efficient BPT-SA portfolios. Consider a numerical example. Table 1 contains the data for a simple eight-
state equiprobable case. Figure 2 depicts the efficient BPT-SA frontier in
[Eh{W), D(A)]-space, for the case A = $2. Figure 2 displays the return distribu?
tion for a particular efficient portfolio, a $1 investment at date zero, as a function
of the realized state at date one. Note that returns have three possible values in
this figure: zero, A, and a value Wn higher than A.
This payoff pattern can be described as the combination of payoffs from a
portfolio consisting of a bond and a lottery ticket that pays off only in state 8. The
zero payoffs in states 1 and 2 indicate that the bond is risky. However, another
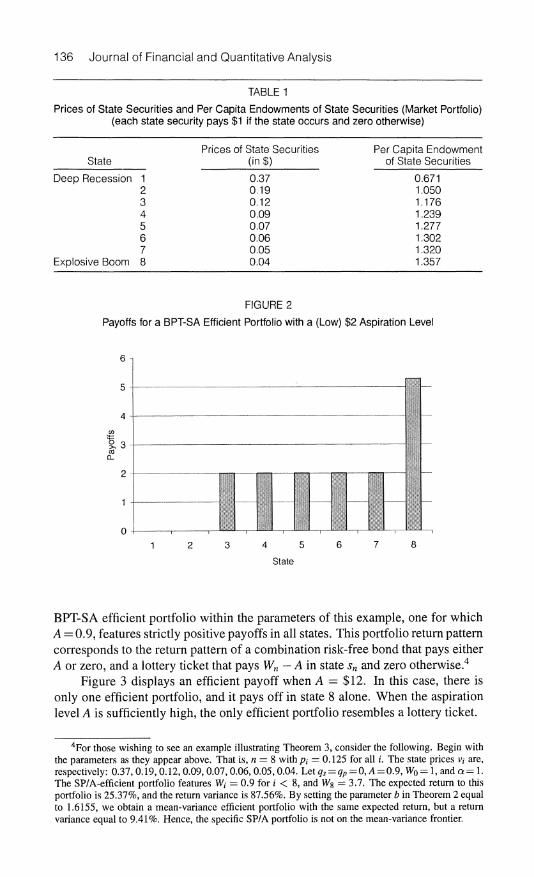
136 Journal of Financial and Quantitative Analysis
TABLE 1
Prices of State Securities and Per Capita Endowments of State Securities (Market Portfolio) (each state security pays $1 if the state occurs and zero otherwise)
FIGURE 2
Payoffs for a BPT-SA Efficient Portfolio with a (Low) $2 Aspiration Level
6i
4 5
State
BPT-SA efficient portfolio within the parameters of this example, one for which
A = 0.9, features strictly positive payoffs in all states. This portfolio return pattern
corresponds to the return pattern of a combination risk-free bond that pays either
A or zero, and a lottery ticket that pays Wn - A in state sn and zero otherwise.4
Figure 3 displays an efficient payoff when A = $12. In this case, there is
only one efficient portfolio, and it pays off in state 8 alone. When the aspiration level A is sufficiently high, the only efficient portfolio resembles a lottery ticket.
4For those wishing to see an example illustrating Theorem 3, consider the following. Begin with the parameters as they appear above. That is, n = 8 with/?,- = 0.125 for all i. The state prices vt are, respectively: 0.37,0.19,0.12,0.09,0.07,0.06,0.05,0.04. Let qs = qP =0, A = 0.9, W0 = 1, and a = 1. The SP/A-efficient portfolio features W/ = 0.9 for i < 8, and W8 = 3.7. The expected return to this portfolio is 25.37%, and the return variance is 87.56%. By setting the parameter b in Theorem 2 equal to 1.6155, we obtain a mean-variance efficient portfolio with the same expected return, but a return variance equal to 9.41%. Hence, the specific SP/A portfolio is not on the mean-variance frontier.

Shefrin and Statman 137
FIGURE 3
Payoffs for a BPT-SA Portfolio with a (High) $12 Aspiration Level
30
25
20
15
10
State
Lopes (1987) illustrates the intuition underlying choice in the SP/A frame?
work through the choice of crops by farmers. She notes that subsistence farmers
often choose between two types of crops, food crops and cash crops. The prices of food crops are low but generally stable. In contrast, the prices of cash crops are volatile, but they offer the potential for higher wealth. Lopes notes that these
farmers tend to plant food crops to the point where their subsistence needs are
met. Farmers allocate the remainder of their land to cash crops. She suggests that
farmers gamble on cash crops because they aspire to escape poverty. Note that there are two implicit aspiration levels in the agricultural analogue.
One is subsistence, and the other is some level above subsistence. In Lopes'
framework, the fear of falling below subsistence motivates the allocation to food
crops. This is the safety-first approach. The aspiration of escaping poverty moti?
vates the allocation ofthe remainder to cash crops. The farmer's problem has as its analogue Friedman and Savage's observation
that people simultaneously purchase insurance and lottery tickets. As we have
argued, such simultaneity is the hallmark of efficient BPT-SA portfolios. A mean-variance investor's preferences can be expressed by the function
p ? a2 jd where d is the degree of risk tolerance. This is because attitude toward
risk in a mean-variance framework is measured by a single parameter, d. In SP/A
theory, risk is multidimensional, and is described with five parameters:
i) qs measures the strength of fear (need for security);
ii) qp measures the strength of hope (need for potential); iii) A is the aspiration level;
iv) S determines the strength of fear relative to hope; and
v) 7, discussed below, determines the strength of the desire to reach the
aspiration level relative to fear and hope.

138 Journal of Financial and Quantitative Analysis
Just as increasing the parameter d alters a mean-variance investor's optimal mean-variance efficient portfolio, so altering any of the above parameters alters the BPT-SA investor's choice of portfolio. We discuss the impact of these param? eters on the character of the selected portfolio later in the paper.
VI. What Tchebyshev's Inequality Does and Does Not Imply
Roy (1952) used Tchebyshev's inequality to extend his analysis from the case where portfolio returns are normally distributed. Elton and Gruber ((1995),
p. 240) indicate that, as long as the probability distribution of returns is "suf-
ficiently well behaved that the Tchebyshev inequality holds," Roy's argument implies that optimal safety-first portfolios lie along the mean-variance efficient
frontier.
Tchebyshev's inequality is a general result, holding for all distributions with a finite second moment. Of course, there is no mean-variance frontier for dis?
tributions lacking a second moment. Theorem 3 makes the case that an optimal
safety-first portfolio typically lies off the mean-variance frontier. If the argument in Elton-Gruber (1991) were correct, Theorem 3 would be false.
Theorem 3 is true, which leads to the next question: where is the flaw in the
Elton-Gruber argument? In this paper's notation, Tchebyshev's inequality implies that Prob{(W
- pP)/crP < -K} < \/K2. Elton-Gruber suggest that a safety-
first optimum can be identified by setting K = (pp ? s)/ap, and then choosing a
portfolio P that maximizes K. There are several difficulties with this argument. First, the l/K2 bound in Tchebyshev's inequality is a two-sided bound, and the
safety-first probability constraint Prob{W < s} is one-sided. Second, l/K2 is an
inequality bound. It need not hold with equality, and certainly cannot hold with
equality when K < 1.
Moreover, it may even be undesirable that the bound hold with equality. There are cases where it is possible to find a portfolio such that Prob{ W < s} = 0,
yet maximizing K leads to inefficiency because it reduces expected wealth. This
can be seen in the numerical example presented earlier, for A ? s ? 0.9. In this
case, fiP ? 1.25, aP = 0.94, and Prob{ W < s} ? 0. For the efficient portfolio, the
corresponding value of K is 0.377, and the upper bound, l/K2, on Prob{W < s} is seven, not only well above zero, but well above unity. Consider what happens when we alter the portfolio by changing the state 1 payoff to 1.0614, and the state
8 payoff to 2.03. We note that this change leaves the value of Prob{W < s} at
zero, and causes the standard deviation to fall to 0.37. More importantly, the mean
payoff also declines to 1.0614, yet the value of K increases to 0.4364. Hence,
increasing K, the variable that Elton-Gruber suggest be maximized, has made the
investor worse, not better, off.
VII. BPT-SA when Returns are Normally Distributed
It is not difficult to build a discrete-state model in which an investor can
choose a portfolio whose return distribution is approximately normal. Neverthe-
less, Theorem 1 establishes that BPT-SA investors reject such opportunities, in
favor of portfolios formed from a combination of a (possibly risky) bond and a

Shefrin and Statman 139
lottery ticket. If we restrict all portfolio return distributions to be normal, this pre- ferred return pattern is unavailable. Yet, there is still something interesting to say about the difference between the mean-variance frontier and the BPT-SA frontier.
Consider a world with two securities, X and Y, both of which feature nor?
mally distributed returns. X has an expected return of 16% with a standard devia? tion of 20%, while Y has an expected return of 10% with a standard deviation of
15%. The correlation between the returns of X and Y is zero.
Imagine an investor with $1 of current wealth who chooses $1 as A, his
aspiration level. A portfolio consisting entirely of Y offers an expected wealth of
$1.10 along with a 25.2% probability of missing the aspiration level. Portfolio Y is not on the BPT-SA efficient frontier since it is dominated by portfolio Z.
Portfolio Z, combining $0.50 of X with $0.50 of Y, has a lower probability of
missing the aspiration level, 14.9%, along with higher expected wealth, $1.13.
Figure 4, A shows the BPT-SA efficient frontier extending from Z to X?call this the frontier for the low aspiration investor.
Now consider an investor with a high aspiration level, such as the Dubins and Savage (1976) investor, who is in a casino with $1,000 and desperately needs
$10,000 by morning; anything less is worth nothing?call this the high aspiration investor.
Dubins and Savage concluded that the optimal portfolio for this high aspira? tion investor is concentrated in a single bet, a bet that offers a chance for a $10,000
payoff. The optimality of a single bet portfolio for a high aspiration investor can
also be illustrated in our two-security example.
Imagine a high aspiration investor with $ 1 of current wealth who defines the
aspiration level A as $1.20, a high aspiration level relative to the expected 10%
return of security Y and the expected 16% return of security X. The efficient BPT-
SA frontier for this investor contains only one portfolio, consisting of a single bet
on security X (Figure 4, B). When returns are normally distributed and no short sales are allowed, some
optimal BPT-SA portfolios are on the mean-variance frontier. For example, mean-
variance investors with little aversion to variance, like investors with high aspira? tion levels, choose X as their portfolio. However, not all portfolios on the BPT-SA
efficient frontier are identical to portfolios on the mean-variance efficient frontier.
The distinction is evident most when high aspiration investors and mean-variance
investors consider casino-type securities, securities with low expected returns and
high variance.
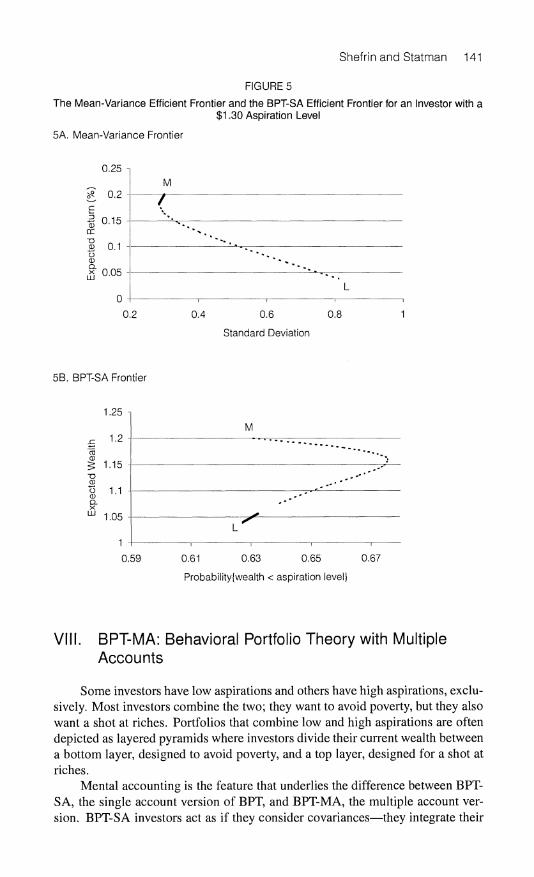
Consider securities L and M. Security L has an expected return of 2% and
a standard deviation of 90%, while security M has an expected return of 20%
and a standard deviation of 30%. Security L is a casino-type security since its
expected return is lower than M's while its variance is higher.5 A portfolio com-
posed entirely of L is not on the mean-variance efficient frontier; it is dominated
by other portfolios, including the one composed entirely of M. Given the pro- hibition against short sales, a portfolio composed entirely of L is on the efficient
frontier for a high aspiration investor with an aspiration level of $1.30, since it pro? vides the highest probability of reaching the aspiration level (see Figure 5). High
5The argument would change little if the expected return of L were actually negative, as is common in casinos.

140 Journal of Financial and Quantitative Analysis
FIGURE 4
4A. The BPT-SA Efficient Frontier for an Investor with a (Low) $1 Aspiration Level (the frontier extends from Z to X)
1.16
1.15
"8 1.13
1.12
1.11
1.1
1.09 0.2 0.4 0.6 0.8
Probfwealth < aspiration level}
4B. The BPT-SA Efficient Frontier for an Investor with a (High) $1.20 Aspiration Level (the frontier consists only of X)
1.17
1.16
S 1-15
? 1.14
11.12 X w 1.11
1.1
1.09 Y
0.2 0.4 0.6 0.1
Probjwealth < aspiration level}
aspiration investors, like Dubms-Savage investors, are not risk seeking. They choose the high risk L because it provides the highest probability of reaching the
aspiration level, not because they like risk.
The SP/A framework is similar to the value-at-risk (VaR) framework. In
both, optimization involves tradeoffs between expected wealth and probabilities of falling short of an aspiration level. The usual aspiration level in VaR analyses is a poverty level; the goal is to combine a low probability of falling below a
poverty level with the highest possible expected wealth. But we can think of
a VaR framework that corresponds to the high aspiration framework, where the
aspiration level pertains to riches, not poverty.
Shefrin and Statman 141
FIGURE 5
The Mean-Variance Efficient Frontier and the BPT-SA Efficient Frontier for an Investor with a $1.30 Aspiration Level
5A. Mean-Variance Frontier
0.25 -
0.2
0.15
I 0.1
,x 0.05
0.2
M
0.4 0.6 0.8
Standard Deviation
5B. BPT-SA Frontier
1.25
1.2
1.15
1.1
1.05
M
L
0.59 0.61 0.63 0.65 0.67
Probabilityfwealth < aspiration level}
VIII. BPT-MA: Behavioral Portfolio Theory with Multiple
Accounts
Some investors have low aspirations and others have high aspirations, exclu-
sively. Most investors combine the two; they want to avoid poverty, but they also
want a shot at riches. Portfolios that combine low and high aspirations are often
depicted as layered pyramids where investors divide their current wealth between
a bottom layer, designed to avoid poverty, and a top layer, designed for a shot at
riches.
Mental accounting is the feature that underlies the difference between BPT-
SA, the single account version of BPT, and BPT-MA, the multiple account ver?
sion. BPT-SA investors act as if they consider covariances?they integrate their

142 Journal of Financial and Quantitative Analysis
portfolios into a whole. BPT-MA investors act as if they overlook covariances?
they segregate their portfolios into distinct mental accounts. This feature is cap- tured in the adage "people keep their money in separate pockets."
Mental accounting is a feature of prospect theory, a framework Kahneman and Tversky (1979) developed to model the tendency to make decisions based on
gains and losses relative to a reference point. Shefrin and Statman (1985) suggest that original purchase price serves as a reference point in investment decisions, and use prospect theory to explain why investors sell winners too early and hold losers too long (the disposition effect). Although the disposition effect can be
formally captured in this paper by setting A=WD, our focus here is on the structure of portfolios rather than the timing of buy/sell decisions for individual securities.
Tversky and Kahneman (1986) present evidence of the difficulty that co?
variance and other properties of joint probability distributions impose on mental
processes. People simplify choices by dividing joint probability distributions into
mental accounts and in the layered pyramid structure of portfolios. There is considerable evidence, from experiments and practice, that investors
overlook covariances. Kroll, Levy, and Rapoport (1988) conducted experiments where three groups of subjects were given expected returns and the variance-
covariance matrix of three securities, A, B, and C, and asked to form portfolios. The correlations between A and B and A and C were set at zero for all three
groups, but the correlation between B and C was set at zero for the first group, at 0.8 for the second group, and at -0.8 for the third group. The differences be?
tween the covariances set for the three groups are such that if the subjects in the
three groups considered covariances, the average proportion allocated to each of
the stocks would have been different across the three groups. Yet Kroll, Levy, and Rapoport find no significant differences between the portfolios of the three
groups. In essence, subjects ignored covariances as they constructed their portfo? lios.
Jorion (1994) presents similar evidence from the practice of institutional in?
vestors, who invest globally, to often put securities into one layer of the pyramid and currencies into another. They separate the management of securities from the
management of currencies and assign the latter to "overlay" managers. As Jorion
notes, the overlay structure is inherently suboptimal because it ignores covari?
ances between securities and currencies. He calculates the annual efficiency loss
that results from overlooking covariances as the equivalent of 40 basis points. We present BPT-MA for the case of two mental accounts. To understand the
mental accounting structure of portfolios in BPT-MA, imagine an investor who
contains three entities, a principal we call the "planner" and two agents we call
"doers." This follows the self-control framework developed by Thaler and Shefrin
(1981) and applied by Shefrin and Statman (1984) in the context of dividends.
The first doer has a low aspiration level, and the second doer has a high aspiration level. Each doer is associated with one mental account, and the planner balances
the two doers to maximize overall utility as he divides current wealth Wo between
the two.
Shefrin and Statman 143
As we develop the BPT-MA model, we use the two-security example, X and
Y, from the previous section to illustrate some of the key concepts. Imagine that
utility of the low aspiration doer possesses a Cobb-Douglas function,
Us = P]^Eh{Ws)\
where Ps is the probability of falling short of the low aspiration level As ($0.20),
Ws is the terminal wealth of the low aspiration doer, and 7 is a non-negative
weighting parameter (0.1). Similarly, the utility of the high aspiration doer is
Ur = P\-$Eh{Wrf,
where P, is the probability of falling short of the high aspiration level Ap ($1.20),
Wr is the terminal wealth of the high aspiration doer, and /3 is 0.1.
The utility function of the planner combines the utilities of the low and high
aspiration doers, Us and Ur, where the weight attached to the high aspiration doer
is Kr ? 10,000, much higher than the weight attached to the low aspiration doer,
Ks = 1. We assume that the planner's utility takes the form,
(6) U = [\+Kdr(P).-f3Eh(WrY)}KcL<[P]-<Eh{wy}.
The planner divides initial wealth W0 into two portions, WV)o for the low as?
piration account and Wr>0 for the high aspiration account. Note that the planner's
utility function (6) has a safety-first bent. The utility of the planner is zero when
the utility of the low aspiration doer is zero, but it is not necessarily zero when
the utility of the high aspiration doer is zero. This implies that the first dollar
of wealth Wo will be allocated to the low aspiration account. In other words,
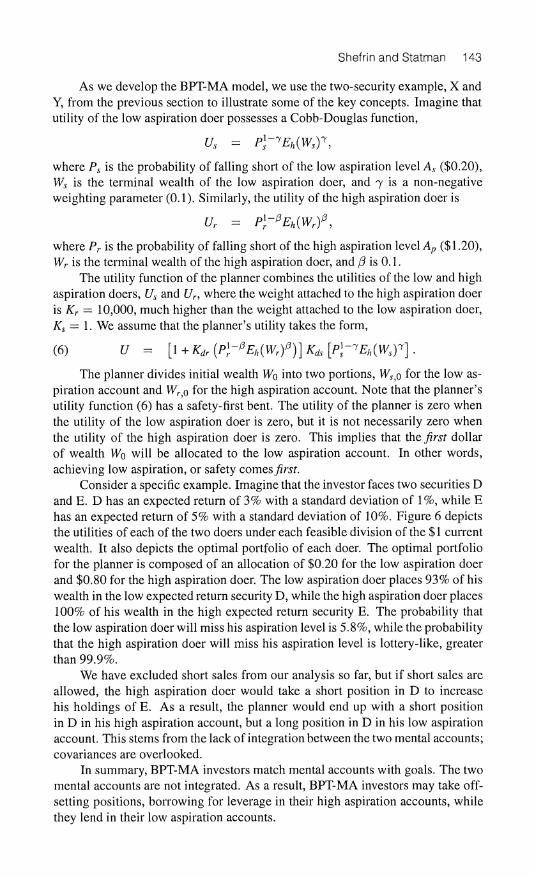
achieving low aspiration, or safety comes first. Consider a specific example. Imagine that the investor faces two securities D
and E. D has an expected return of 3% with a standard deviation of 1%, while E
has an expected return of 5% with a standard deviation of 10%. Figure 6 depicts the utilities of each of the two doers under each feasible division of the $1 current
wealth. It also depicts the optimal portfolio of each doer. The optimal portfolio for the planner is composed of an allocation of $0.20 for the low aspiration doer
and $0.80 for the high aspiration doer. The low aspiration doer places 93% of his
wealth in the low expected return security D, while the high aspiration doer places 100% of his wealth in the high expected return security E. The probability that
the low aspiration doer will miss his aspiration level is 5.8%, while the probability that the high aspiration doer will miss his aspiration level is lottery-like, greater than 99.9%.
We have excluded short sales from our analysis so far, but if short sales are
allowed, the high aspiration doer would take a short position in D to increase
his holdings of E. As a result, the planner would end up with a short position in D in his high aspiration account, but a long position in D in his low aspiration account. This stems from the lack of integration between the two mental accounts; covariances are overlooked.
In summary, BPT-MA investors match mental accounts with goals. The two
mental accounts are not integrated. As a result, BPT-MA investors may take off-
setting positions, borrowing for leverage in their high aspiration accounts, while
they lend in their low aspiration accounts.

144 Journal of Financial and Quantitative Analysis
FIGURE 6
The Choice Set of BPT-MA Portfolios Available to a Planner with Two Doers and the Optimal Portfolio of a Planner
-5 Q
ptimal portfolio
0.2 0.4 0.6 O.i
Utility of the Low Aspiration Doer
IX. Structural Issues
Theorem 1 implies that both the low aspiration doer and the high aspiration doer will choose portfolios formed by combining (possibly risky) bonds and a lot?
tery ticket. But the mental accounting maximum solution will push the accounts
in the layers to the extremes. That is, the low aspiration account will look more
like risk-free bond than the high aspiration account, which, in turn, looks more
like a lottery ticket.
To see why, consider the nature of the Engel curve that describes the impact of a marginal dollar of wealth on the investor's demand for contingent claims.
For the sake of exposition, focus on the equiprobable case. Consider how the low
aspiration doer allocates successive increments of his allocation Ws$. According to the argument used to establish Theorem 1, the low aspiration doer allocates the
first dollar to claims in state sn. Indeed, the low aspiration doer's initial allocation
WSlo would have to be at least As(vn + v?_i) before it would be worthwhile for
him to choose positive claims in two states. Choosing positive claims in two
states would lower Eh(Ws) without raising Ps. For W^o < Asvn, Us = 0 because
Ps = 0. For Asvn < WSyo < As(vn + vn_i), Us is a concave function, USyn =
pl~1E}l(Ws)1, featuring diminishing marginal utility. A low aspiration doer with
a higher allocation WSy0 will find it worthwhile to hold positive claims that pay off
in states sn-\ and sn. In this case, utility is ?/Vjrt_i = (2p)l~1Eh(Ws)1. Continuing this way, recursively define USin-j equal to ((/ + l)p)1_7Zs/j(Wv)7.
Because the low aspiration doer selects his optimal allocation by making a
choice about the number of states in which to hold positive claims, the optimal value of Us will be equal to max{[/Vi?_7j, forj = 0 to n ? 1. This implies that

Shefrin and Statman 145
the indirect utility function ?/v(WV)o) associated with optimal allocations will be not be concave everywhere. At crossover points where positive claims to new states are brought in, marginal utility increases. This is because the reallocation
of wealth from state sn to a lower state both raises Ps and lowers Eh(Ws). If state prices are low at the upper end of the state range and the aspiration
point As is low, then increasing WV)o leads to "rapid" crossovers, since increasing the probability of reaching As by shifting the allocation from state sn to a lower
state comes at a low cost in terms of foregone ?/,(Wv). This means that the low
aspiration doer responds to increased allocation by shifting into less risky bonds.
However, further increases in WVjo lead the low aspiration doer to consider states with higher state prices. As this happens, the cost of increasing Ps in terms of
foregone Eh{Ws) mounts. Now larger absolute increments in WVjo than before are
necessary to induce crossovers.
The Engel structure of the high aspiration subproblem is the same as above,
except that Ar > As. Qualitatively, the higher aspiration point leads to a lower
sensitivity of the crossover points with respect to Wr>o than with respect to WV)o- The difference between Engel curves shows up in the character of the portfo?
lios selected for the two layers. The low aspiration doer will tend to use additional
allocations WVjo to form a less risky bond, thereby moving the lottery component to zero. On the other hand, the high aspiration doer will tend to use additional
allocations Wr>o for the lottery component, focusing on the maximization of the
expected payoff Eh(Wr). Moderate levels of wealth will lead to the Friedman-
Savage insurance/lottery property when the aspiration level for the low aspiration doer is low, and the aspiration level for the high aspiration doer is high. Such
investors choose riskless bonds in the low aspiration layer of their portfolios and
a lottery ticket for their high aspiration layer. Just as the risk tolerance parameter d affects the choice of mean-variance
investors among portfolios on the mean-variance frontier, the BPT parameters de-
termine the portfolios of BPT investors. Recall from Section V that in BPT-SA, risk tolerance is captured by a combination of parameters. Tolerance for risk in
BPT, both the single account and multiple account versions, is determined by the
degree of fear (which is increasing in qs), the degree of hope (which is increasing in qp), and the strength of fear relative to hope (which is increasing in S). In?
creased fear accentuates the tendency of BPT investors to make the bond portion of their low aspiration mental accounts risk free. Increased hope accentuates the
tendency of BPT investors to increase the maximum possible payoffs in their high
aspiration mental accounts.
Lopes discusses a special case of her model she calls "cautious optimism." Here, fear is the predominant emotion throughout most of the domain, except for the upper end of the range. A cautiously optimistic individual overweights the probabilities attached to both the worst and best outcomes. That is, cautious
optimism gives rise to a weighting scheme with thicker tails than the underlying distribution. A cautious optimist is inclined to extremes in the two layers of his
portfolio, a risk-free bond for his low aspiration account and a high expected
payoff for his high aspiration account.

146 Journal of Financial and Quantitative Analysis
Will the planner's portfolio, obtained by combining the low and high aspira? tion subportfolios, be mean-variance efficient? The following theorem provides the answer.
Theorem 4. If there are at least five states that feature positive consumption in
a BPT-MA portfolio Pm, and distinct values for v///?/, then Pm is neither mean-
variance efficient nor BPT-SA efficient.
Proof. The proof is similar to the argument establishing Theorem 3. There can
be at most four distinct positive consumption values in an SP/A portfolio: AS9
Ari As + Ar, and an additional value for Wn in excess of Ar. Now any mono-
tone increasing mean-variance portfolio with positive consumption in five or more
states will feature at least five distinct values of consumption. Therefore, Pm is
mean-variance inefficient. Similarly, Theorem 1 implies that Pm is BPT-SA inef-
ficient.6 ?
X. Evolutionary Implications
As noted earlier, BPT optimal portfolios are typically off the mean-variance
efficient frontier. Does this result have evolutionary implications? In particular, do BPT investors lose wealth to mean-variance investors over the long term? Do
they vanish?
Blume and Easley (1992) develop a general framework for analyzing the
evolutionary questions about trading. Their model implies that BPT investors
can, but need not, lose wealth to mean-variance investors over the long run. To be
sure, mean-variance portfolios are not the most "fit" from the perspective of long- term survival. This distinction belongs to log-utility portfolios, and a log-utility
portfolio does not typically lie on the mean-variance frontier.
Consider a multiperiod model in which, at each date, state i occurs with
probability /?,-. A portfolio that is unfit loses wealth in the long run. Blume-
Easley establish that the fitness of a portfolio with payoff return (W\,..., Wn) is determined by its budget share profile (v\W\/Wo,..., vnWn/Wo). The fittest
portfolio is one whose budget share profile coincides with the probability vector
P=(Pi)- Consider the budget share per unit probability (v/Wi/p/Wb). Blume-Easley
show that portfolios can be ranked by fitness using the non-negative entropy func?
tion,
EpilnfaWo/viWi).
Given two portfolios, the fitter portfolio is the one with the lower entropy. Note
that minimum entropy is achieved when budget share per unit probability equals
unity across all states.
6Note that a BPT-MA portfolio is not BPT-SA inefficient just because the former has two as? piration levels while the former has one. It is straightforward to define a version of BPT-SA with two aspiration levels. The major source of the inefficiency is the lack of integration between the two accounts. In an efficient BPT-SA portfolio, the associated payoff values are as follows: zero, the as? piration levels, and possibly an additional amount associated with the sn. This is not what a BPT-MA investor chooses.
Shefrin and Statman 147
Consider the budget share of the BPT-SA efficient portfolio (4) and mean-
variance efficient portfolio (5). The budget share per unit probability for the BPT- SA portfolio is
(7) oo, for i < icj
(pi/vi)(W0/A), for ic <i<n,
PnWo/(W0 - EViWi).
Note that the probability to budget share ratio is infinite for the lowest states, and
that it is an increasing function for ic < i < n. Clearly, this ratio will not be the
unity function, The budget share per unit probability for a mean-variance efficient portfolio
has the form,
(8) {(vi/bpiWo) [l -
([Evj -
bW0)/Ev2/pj) Vi/Pi]}~1 .
For a non-negative solution, it is straightforward to establish that this function
is monotone increasing in v,-//?,-. If the non-negative constraint is active, then the
probability to budget share ratio will be infinite in the states with the highest prices
per unit probability, and be monotone increasing in states that feature positive
consumption. Both BPT-SA efficient portfolios and mean-variance efficient portfolios fea?
ture similar patterns in their budget share per unit probability profiles. In particu?
lar, a zero budget share in a state with positive probability leads to infinite entropy, in which case, long-term wealth falls to zero with probability one. Clearly, this
can occur with both efficient BPT-SA and mean-variance portfolios. We note that a given BPT-SA portfolio can have a higher entropy than some
portfolios along the mean-variance frontier, and a lower entropy than others.7 The
mean-variance frontier is effectively traced out through variation in parameter b.
The case b = 0 corresponds to risk neutrality. Higher values of b correspond to
higher risk aversion. Both very low and very high risk aversion lead to portfolios that are low in fltness. High levels of risk aversion lead to low expected returns, while levels of risk aversion close to zero (risk neutrality) lead to low long-run wealth because wealth declines precipitously during disasters.
Consider a multiperiod framework where one-period state prices v are con?
stant over time, and all investors' portfolio budget shares likewise remain con?
stant. In this case, the portfolio with the lower entropy value will dominate in the
long run. If budget shares vary with time, the entropy condition becomes more
complex, but the same general idea applies. If the aspiration value A is constant over time, but wealth varies, then the
budget shares for a BPT-SA efficient portfolio also vary. This follows from (4) and
the property of the Engel function discussed earlier. Indeed, if wealth becomes
low enough, the budget share for some state will fall to zero, thereby leading to
infinite entropy.
7This can be seen in the eight-state numerical example discussed earlier. Consider the case when A = 0.9. When the mean-variance parameter b ? 1.9, the mean-variance portfolio features higher entropy. When b = 1.8, the SP/A portfolio features higher entropy.

148 Journal of Financial and Quantitative Analysis
Finally, consider what happens when the aspiration level A is tied to wealth, and the wealth ratio A/ W remains constant. In this case, the budget shares of BPT- SA investors do remain constant over time. Hence, the Blume-Easley entropy function serves to rank order BPT-SA efficient portfolios and mean-variance effi? cient portfolios by fitness. In general, BPT-SA portfolios are more fit than some mean-variance efficient portfolios, but less fit than others.
XI. Real World Portfolios and Securities
The optimal portfolios and securities we described were constructed to fit
optimally the preferences of specific investors. Such optimal securities will be constructed in a cost-free world. As Allen and Gale (1987) noted, however, the
construction costs of real world securities influence their design and limit their
number. Shefrin and Statman (1993) describe real world securities as a design that meets the general preferences of many investors rather than the specific pref? erences of one.
Swedish lottery bonds come close to the optimal security for a low aspiration mental account (Green and Rydqvist (1999)). Holders of lottery bonds receive
lottery tickets in place of interest coupons. All bondholders receive the bonds'
face value at maturity, but lottery winners receive much more than a usual coupon
payment while losers receive a zero coupon payment.
Lottery bonds with one coupon to maturity resemble the optimal security for
a low aspiration account where the aspiration level is equal to the face value of
the bond. Bondholders receive neither coupons nor face value in some low states
where the Swedish government goes bankrupt. Beyond these are states where
bondholders lose the lottery and receive only the face value of their bonds. Last, there is a high state where the face value of the bond is augmented by a lottery
payoff. Swedish lottery bonds are not the only lottery bonds. Britain's premium
bonds are lottery bonds as well. Still, most bonds are regular bonds, offering inter?
est coupons rather than lottery tickets. Investors do not necessarily need the gov? ernment to design lottery bonds; many investors design lottery bonds on their own.
Some of these investors buy both bonds and lottery tickets, as in the Friedman-
Savage puzzle. Others are investors who combine money market funds with call
options. McConnell and Schwartz (1993) describe the insight of Lee Cole, Mer-
rill Lynch options marketing manager, who discovered that many investors who
held money market funds used the interest payments to buy call options. Call options are different from lotteries that offer single size prizes. Call
options offer many prizes, low prizes when they are slightly in-the-money at ex-
piration and high prizes when they are deep in-the-money. We can think of call
options as securities designed to appeal to many investors with different aspira? tion levels. Call options do not match the precise aspiration level of any particular investor, but match approximately the aspiration levels of many investors.
Cole's observation led to the construction of LYONs, securities that combine
the security of bonds with the potential of call options. The same observation led
many brokerage firms and insurance companies to offer equity participation notes,

Shefrin and Statman 149
securities that combine a secure floor, usually equal to the amount of the initial
investment, with some potential linked to an index such as the S&P 500.
Treasury bills are right for investors with very low aspiration levels, while
equity participation notes are right for investors with higher aspiration levels. In?
vestors with even higher aspiration levels choose stocks and those with yet higher
aspiration levels choose out-of-the-money call options and lottery tickets. Stocks, call options, and lottery tickets feature many states with zero pay offs, but they also features states with payoffs that meet high, even exceedingly high, aspiration levels.
Cash, bonds, and stocks are the most common elements of portfolios and
they are the elements of the portfolio puzzle discussed by Canner, Mankiw, and
Weil (CMW (1997)). CMW note that investment advisors recommend that in?
vestors increase the ratio of stocks to bonds if they want to increase the aggres- siveness of their portfolios. This recommendation is puzzling within the CAPM
since it violates two-fund separation. Two-fund separation states that all CAPM
efficient portfolios share a common ratio of stocks to bonds and that attitudes
toward risk are reflected only in the proportion allocated to the risk-free asset.
The portfolio advice of mutual fund companies illustrates the CMW puzzle. As Fisher and Statman (1997) note, mutual fund companies often recommend
that investors construct portfolios as pyramids of assets: cash in the bottom layer, bonds in the middle layer, and stocks in the top layer. Investors increase the
aggressiveness of their portfolios by increasing the proportion allocated to stocks
without necessarily increasing the proportion allocated to bonds.
Pyramid portfolios that are puzzling within CAPM are consistent with BPT, where two-fund separation fails. Consider a BPT-MA framework with three men?
tal accounts in the hands of three "doers" whose aspiration levels range from low
to medium and to high. BPT-MA investors do not follow two-fund separation. Greater aggressiveness might manifest itself by an increased portfolio allocation
to the high aspiration doer and by a corresponding increase in the allocation to
stocks in the portfolio.
XII. Conclusion
We develop a positive behavioral portfolio theory (BPT) and explore its im?
plications for portfolio construction and security design. We present our model
in two versions, BPT-SA, where the portfolio is integrated into a single men?
tal account and BPT-MA, where the portfolio is segregated into multiple mental
accounts, such that covariances among mental accounts are overlooked. BPT in?
vestors, like the investors in the Friedman-Savage puzzle, are simultaneously risk
averse and risk seeking; they buy both bonds and lottery tickets.
Portfolios within BPT-MA resemble layered pyramids where each layer (i.e., mental account) is associated with a particular aspiration level. We explore a
simple two-layer model with a low aspiration layer designed to avoid poverty and
a high aspiration layer designed for a shot at riches. Since BPT-MA investors
overlook covariance between layers, they might combine a short position in a
security in one layer with a long position in the same security in another layer.

150 Journal of Financial and Quantitative Analysis
We explore the links between BPT portfolios and mean-variance, CAPM and VaR
portfolios.
Optimal securities for BPT investors resemble combinations of bonds and
lottery tickets. The bonds for the low aspiration mental account resemble risk-free
or investment grade bonds, while the bonds for the high aspiration mental account
resemble speculative (junk) bonds. We explore the similarities between optimal BPT securities and real world securities such as bonds, stocks, and options.
We plan to extend BPT in several ways. One extension involves the design of securities by corporations, especially in connection with capital structure and
dividend policy. Capital structure and dividend policy are usually approached from the supply side; dividends are regarded as information signals and capital structure is regarded as a solution to agency problems. We think that capital structure and dividend policy also need to be approached from the demand side; some corporate securities fit better than others into the layered pyramid structure
of BPT portfolios. Analysis of dividend policy requires a multi-period model.
A multi-period BPT model is also useful for analyzing risk and its relation?
ship to time diversification. Proponents of time diversification argue that the risk
of stocks declines as the time horizon increases, while opponents argue that it
does not (see Kritzman (1994)). A multi-period BPT model would link time to
perceptions of risk and show, for example, how investors revise portfolios when
their original aspirations are reached.
Lastly, the road from BPT will lead to an equilibrium asset pricing model,
extending Shefrin and Statman (1994), just as the road from mean-variance port? folio theory led to the CAPM.
References
Allais, M. "The Foundations of a Positive Theory of Choice Involving Risk and a Criticism of the Postulates and Axioms of the American School." In Expected Utility Hypotheses and the Allais Paradox, M. Allais and O. Hagen, eds. Dordrecht, Netherlands: Reidel (1979) (original work published 1952).
Allen, E, and D. Gale. "Optimal Security Design." Review of Financial Studies, 1 (Autumn 1988), 229-263.
Arzac, E. "Utility Analysis of Chance-Constrained Portfolio Selection." Journal of Financial and Quantitative Analysis, 8 (1974), 993-1007.
Arzac, E., and V. Bawa. "Portfolio Choice and Equilibrium in Capital Markets with Safety-first In? vestors." Journal of Financial Economics, 4 (1977), 277-288.
Blume, L., and D. Easley. "Evolution and Market Behavior." Journal of Economic Theoiy, 58 (1992), 9-40.
Canner, N.; N. G. Mankiw; and D. Weil. "An Asset Allocation Puzzle." American Economic Review, 87(1997), 181-191.
Dubins, L. E., and L. J. Savage. "Inequalities for Stochastic Processes: How to Gamble if You Must." 2nd ed. New York, NY: Dover (1976).
Elton, E., and M. Gruber. Modern Portfolio Theory and Investment Analysis. New York, NY: John Wiley&Sons, Inc. (1995).
Fisher, K., and M. Statman. "Investment Advice from Mutual Fund Companies." Journal of Portfolio Management, 24 (Fail 1997), 9-25.
Friedman, M., and L. J. Savage. "The Utility Analysis of Choices Involving Risk." Journal of Political Economy, 56 (1948), 279-304.
Green, R? and K. Rydqvist. "Ex-day Behavior with Dividend Preference and Limitations to Short- term Arbitrage: the Case of Swedish Lottery Bonds." Journal of Financial Economics, 53 (1999), 145-187.
Kahneman, D., and A. Tversky, "Prospect Theory: An Analysis of Decision Making under Risk." Econometrica, 47 (1979), 263-291.

Shefrin and Statman 151
Kritzman, M. "What Practitioners Need to Know ... about Time Diversification." Financial Analysts Journal, 50 (Jan./Feb. 1994), 14-18.
Kroll, Y; H. Levy; and A. Rapoport. "Experimental Tests ofthe Separation Theorem and the Capital Asset Pricing Model." American Economic Review, 78 (1988), 500-518.
Jorion, P. "Mean-Variance Analysis of Currency Overlays." Financial Analysts Journal, 50 (May/June 1994), 48-56.
Lopes, L. "Between Hope and Fear: The Psychology of Risk." Advances in Experimental Social Psychology. 20 (1987), 255-295.
Lopes, L. L., and G. C. Oden. "The Role of Aspiration Level in Risk Choice: A Comparison of Cumulative Prospect Theory and SP/A Theory." Journal of Mathematical Psychology, 43 (1999), 286-313.
Markowitz, H. "Portfolio Selection." Journal ofFinance, 6 (1952a), 77-91. _"The Utility of Wealth." Journal of Political Economy, 60 (1952b), 151-158. _Portfolio Selection: Efficient Diversification of Investments. New York, NY:
John Wiley & Sons (1959). "The Early History of Portfolio Theory: 1600-1960." Financial Analysts
Journal, 55 (July/Aug. 1999), 5-16. McConnell, J., and E. Schwartz. "The Origin of LYONs: A Case Study in Financial Innovation."
Journal of Applied Corporate Finance, 4 (Summer 1992), 40-47. Parzen, E. Modern Probability Theory and Its Applications. New York, NY: Wiley (1960). Quiggen, J. "A Theory of Anticipated Utility." Journal of Economic and Behavioral Organization, 3
(1982), 323-343. Roy, A. D. "Safety-First and the Holding of Assets." Econometrica, 20, (1952), 431-449. Shefrin, H., and M. Statman. "Explaining Investor Preference for Cash Dividends." Journal of Finan?
cial Economics, 13 (1984), 253-282. _"The Disposition to Sell Winners Too Early and Ride Losers Too Long: The?
ory and Evidence." Journal ofFinance, 40 (1985), 777-790. "Behavioral Aspects on the Design and Marketing of Financial Products."
Financial Management, 22 (1993), 123-134. "Behavioral Capital Asset Pricing Theory." Journal of Financial and Quanti?
tative Analysis, 29 (1994), 323-349. Telser, L. "Safety First and Hedging." Review of Economic Studies, 23 (1955), 1-16. Thaler, R., and H. Shefrin. "The Economic Theory of Self-Control." Journal of Political Economy, 89
(1981), 392-406. Tversky, A., and D. Kahneman. "Rational Choice and the Framing of Decisions." Journal of Business,
59(1986), S251-S278. Von Neumann, J., and O. Morgenstern. Theory of Games and Economic Behavior. Princeton, NJ:
Princeton Univ. Press (1944). Yaari, M. "The Dual Theory of Choice under Risk." Econometrica, 55 (1987), 95-115.


![Coming up Short: Managing Underfunded Portfolios …2 Behavioral portfolio theory, developed in Shefrin and Statman [2000], describes goal-driven investors, seeking to maximize expected](https://img.dokumen.tips/doc/110x75/5eb514bc28651b667471d6c4/coming-up-short-managing-underfunded-portfolios-2-behavioral-portfolio-theory.jpg)