Embed Size (px)
Citation preview
Some Macroeconomic Puzzles: Conjectural Refutations
The Carry Trade: pennies from heaven?
Professor Jagjit S. Chadha
Mercers’ School Memorial Professor of Commerce
© Gresham Lecture Series 2015-6
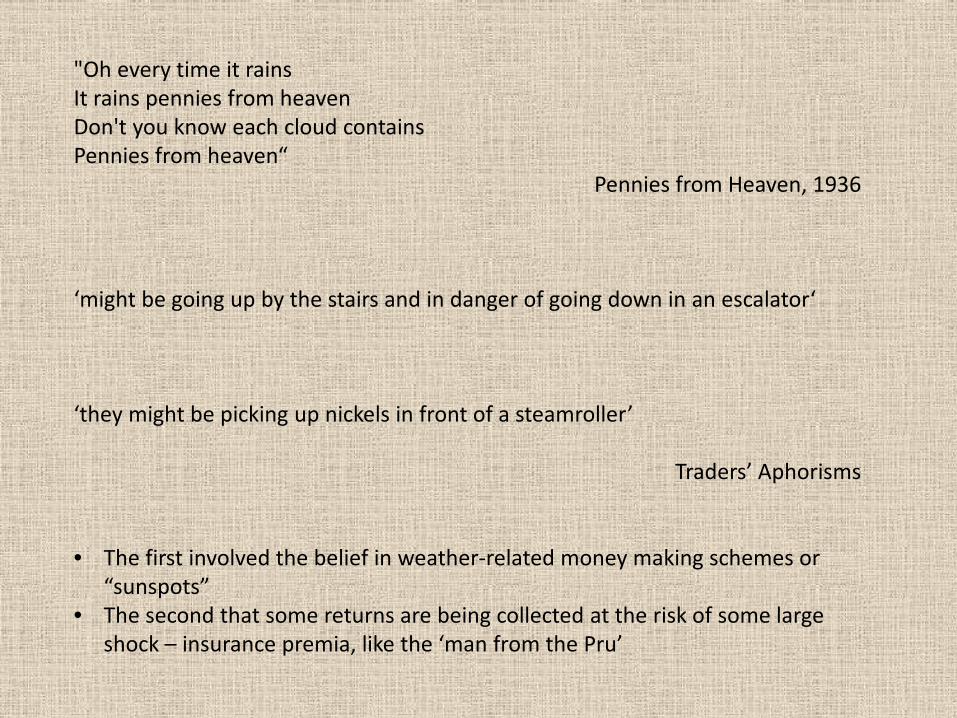
"Oh every time it rains It rains pennies from heaven Don't you know each cloud contains Pennies from heaven“
Pennies from Heaven, 1936
‘might be going up by the stairs and in danger of going down in an escalator‘ ‘they might be picking up nickels in front of a steamroller’
Traders’ Aphorisms • The first involved the belief in weather-related money making schemes or
“sunspots” • The second that some returns are being collected at the risk of some large
shock – insurance premia, like the ‘man from the Pru’
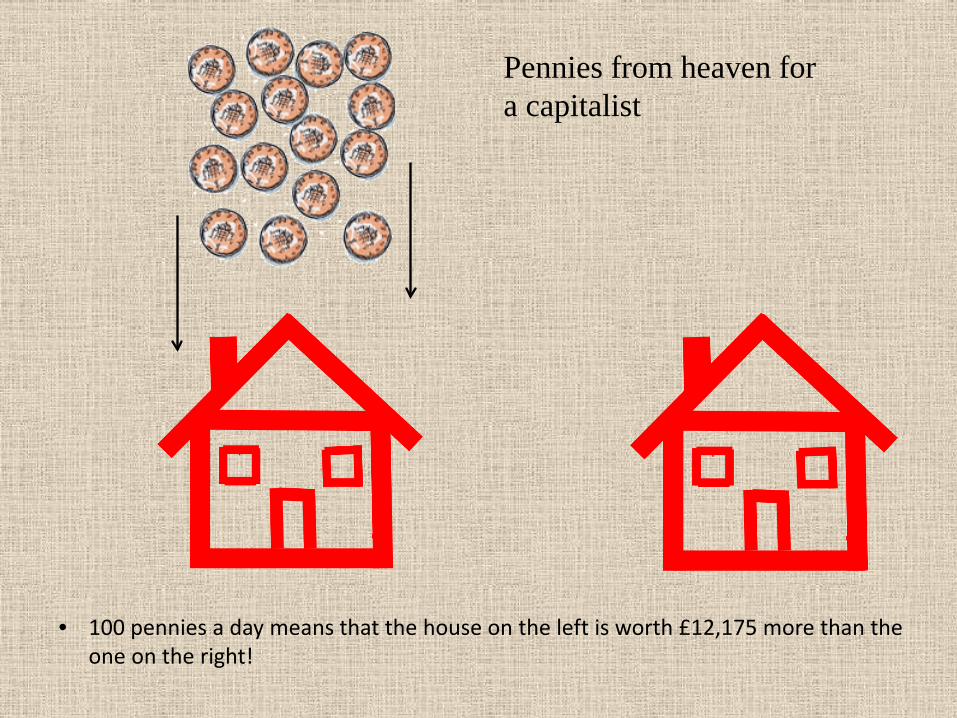
• 100 pennies a day means that the house on the left is worth £12,175 more than the one on the right!
Pennies from heaven for a capitalist
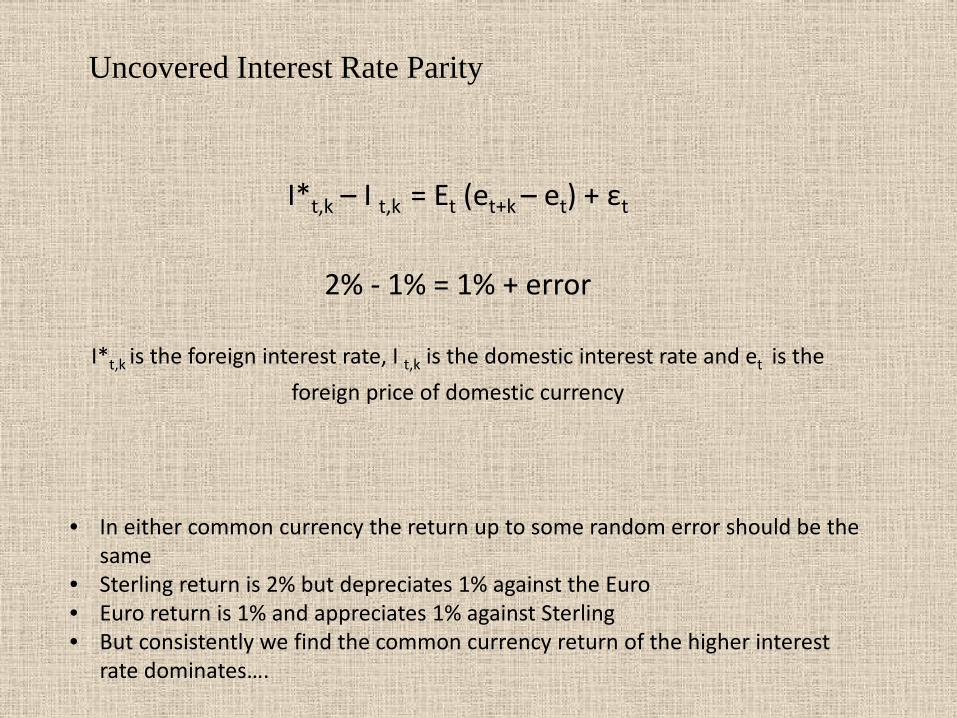
Uncovered Interest Rate Parity
I*t,k – I t,k = Et (et+k – et) + εt
2% - 1% = 1% + error
I*t,k is the foreign interest rate, I t,k is the domestic interest rate and et is the foreign price of domestic currency
• In either common currency the return up to some random error should be the same
• Sterling return is 2% but depreciates 1% against the Euro • Euro return is 1% and appreciates 1% against Sterling • But consistently we find the common currency return of the higher interest
rate dominates….
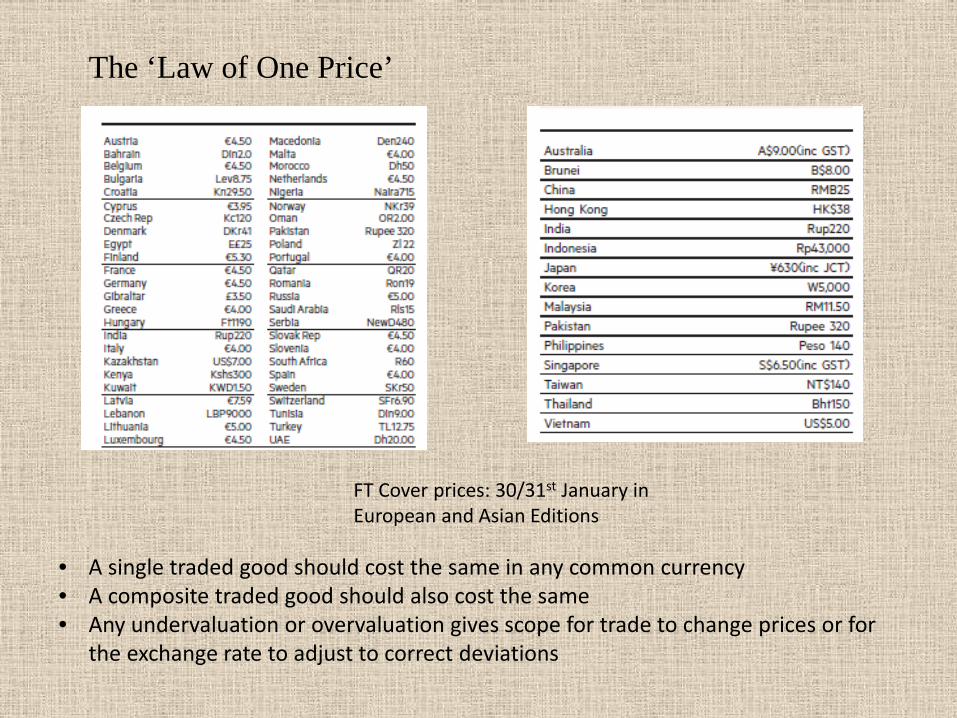
The ‘Law of One Price’
• A single traded good should cost the same in any common currency • A composite traded good should also cost the same • Any undervaluation or overvaluation gives scope for trade to change prices or for
the exchange rate to adjust to correct deviations
FT Cover prices: 30/31st January in European and Asian Editions

0.1
1
10
100
1000
10000
0.1 1 10 100 1000 10000 1
10
100
1000
10000
100000
1 10 100 1000 10000
• Compare the posted FT exchange rate versus the 1st February close • Euro Data not so far • …but Asian Data suggest some revaluations coming….e.g. Korea or
Indonesia
The FT and the ‘Law of One Price’
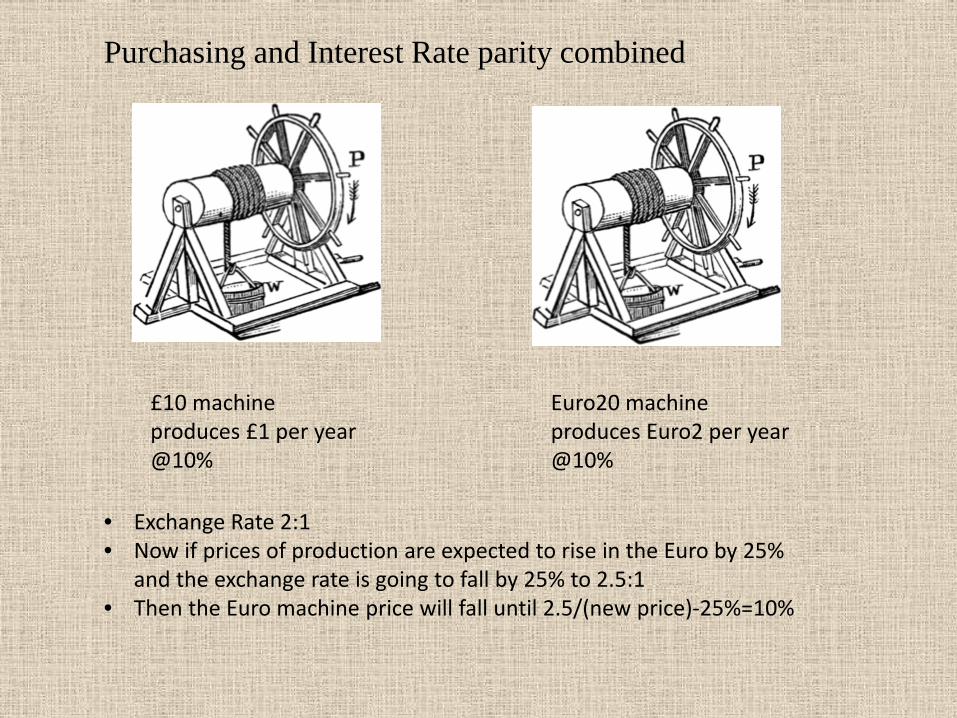
£10 machine produces £1 per year @10%
Euro20 machine produces Euro2 per year @10%
• Exchange Rate 2:1 • Now if prices of production are expected to rise in the Euro by 25%
and the exchange rate is going to fall by 25% to 2.5:1 • Then the Euro machine price will fall until 2.5/(new price)-25%=10%
Purchasing and Interest Rate parity combined
0
0.2
0.4
0.6
0.8
1
1.2
1975
1977
1979
1981
1983
1985
1987
1989
1991
1993
1995
1997
1999
2001
2003
2005
2007
2009
2011
2013
2015
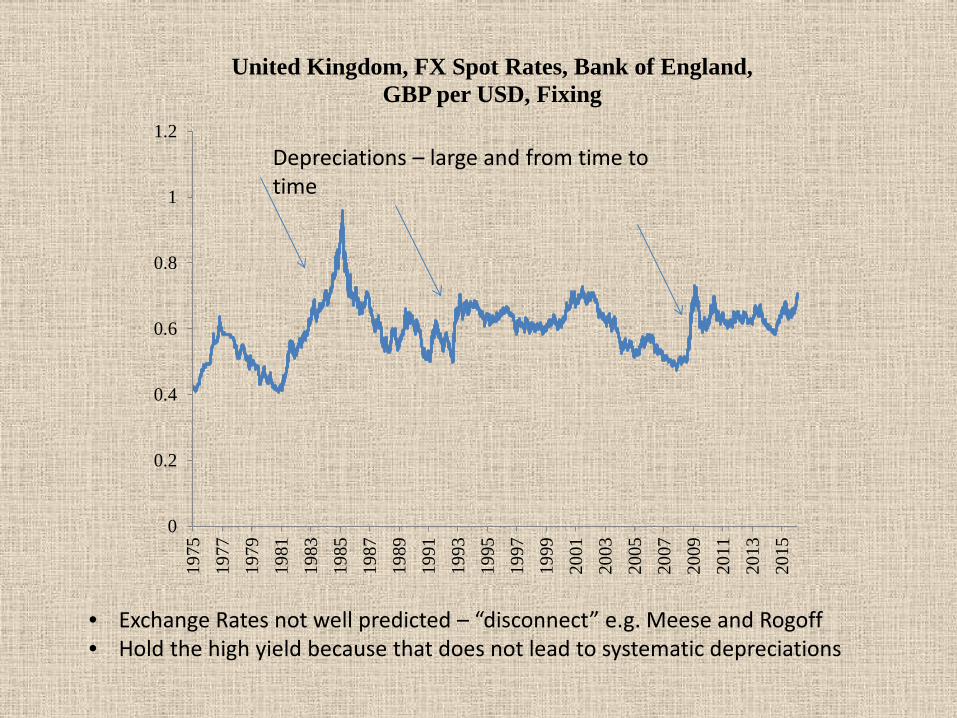
United Kingdom, FX Spot Rates, Bank of England, GBP per USD, Fixing
Depreciations – large and from time to time
• Exchange Rates not well predicted – “disconnect” e.g. Meese and Rogoff • Hold the high yield because that does not lead to systematic depreciations
Empirics of Carry Trade • Burnside et al. (2008) is typical and they find that over a period of
mostly floating rates and capital account liberalisation, 1976--2007, a monthly carry trade portfolio, up to 20 currencies, earned an average annual excess return of about 5%.
• This significant return is smaller than the average excess return on
the stock market over this same period of around 7% and we examined the equity risk premium in the previous lecture
• But the carry trade returns seemed to be much less variable than
equity returns, with an annualized standard deviation of about 5% compared to 15% for equities.
• The way to compare returns across different portfolios is to divide
the excess return over the risk-free interest by the standard deviation portfolio returns, which gives us the return per unit of risk and is called the Sharpe ratio. We can see that the Sharpe ratio of the carry trade is double that for equities and hence very attractive.
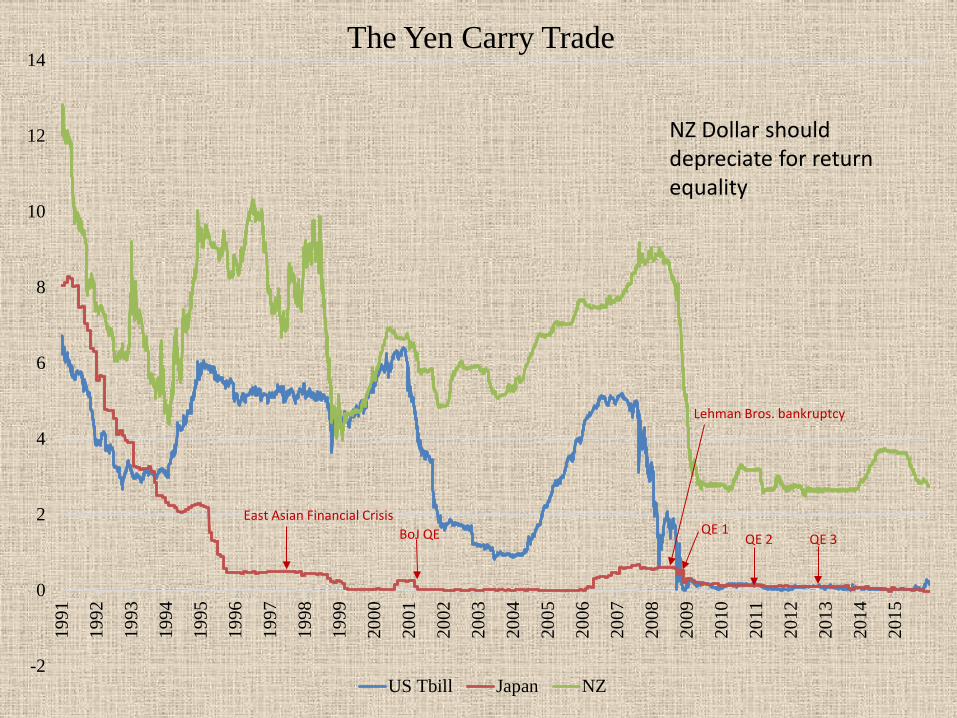
-2
0
2
4
6
8
10
12
1419
91
1992
1993
1994
1995
1996
1997
1998
1999
2000
2001
2002
2003
2004
2005
2006
2007
2008
2009
2010
2011
2012
2013
2014
2015
The Yen Carry Trade
US Tbill Japan NZ
BoJ QE East Asian Financial Crisis
Lehman Bros. bankruptcy
QE 1 QE 2 QE 3
NZ Dollar should depreciate for return equality

0
1
2
3
4
5
6
7
8
9
2007 2008 2009 2010 2011 2012 2013 2014 2015
The QE Carry Trade
UK US Aus
Aussie Dollar should depreciate for return equality
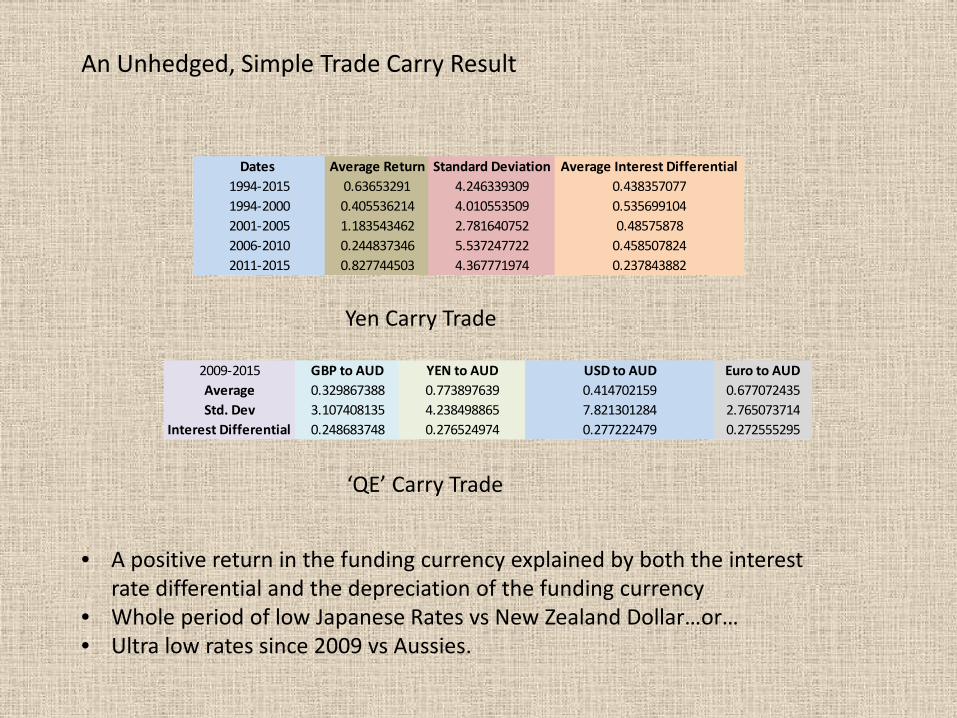
Dates Average Return Standard Deviation Average Interest Differential1994-2015 0.63653291 4.246339309 0.4383570771994-2000 0.405536214 4.010553509 0.5356991042001-2005 1.183543462 2.781640752 0.485758782006-2010 0.244837346 5.537247722 0.4585078242011-2015 0.827744503 4.367771974 0.237843882
2009-2015 GBP to AUD YEN to AUD USD to AUD Euro to AUDAverage 0.329867388 0.773897639 0.414702159 0.677072435Std. Dev 3.107408135 4.238498865 7.821301284 2.765073714
Interest Differential 0.248683748 0.276524974 0.277222479 0.272555295
An Unhedged, Simple Trade Carry Result
• A positive return in the funding currency explained by both the interest rate differential and the depreciation of the funding currency
• Whole period of low Japanese Rates vs New Zealand Dollar…or… • Ultra low rates since 2009 vs Aussies.
Yen Carry Trade
‘QE’ Carry Trade
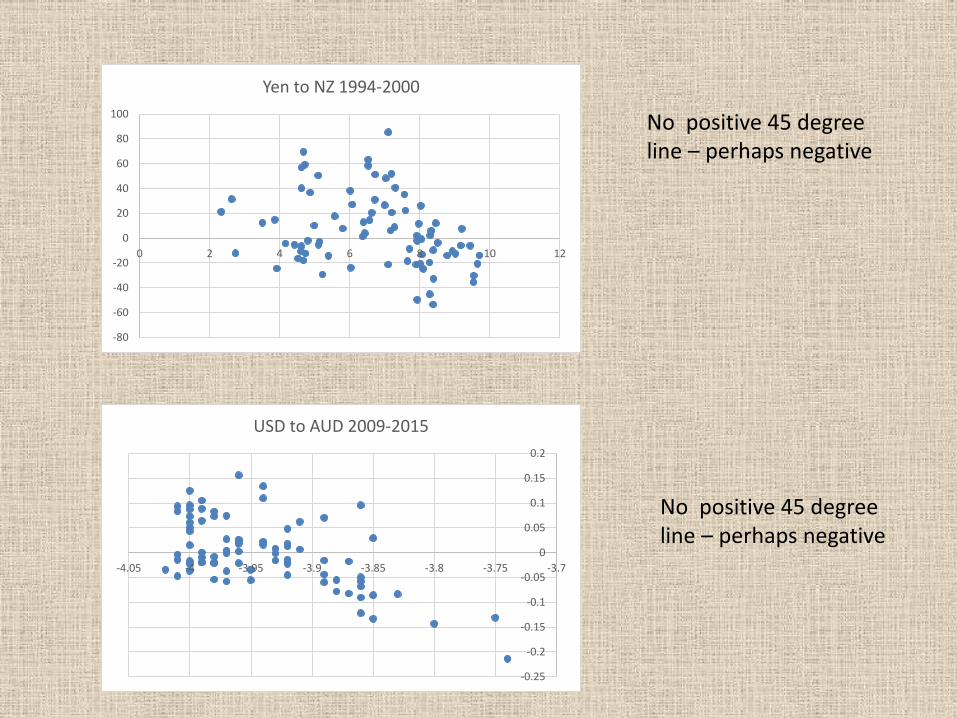
-0.25
-0.2
-0.15
-0.1
-0.05
0
0.05
0.1
0.15
0.2
-4.05 -4 -3.95 -3.9 -3.85 -3.8 -3.75 -3.7
USD to AUD 2009-2015
-80
-60
-40
-20
0
20
40
60
80
100
0 2 4 6 8 10 12
Yen to NZ 1994-2000
No positive 45 degree line – perhaps negative
No positive 45 degree line – perhaps negative

Explanations…Excuses…Reasons • Excess Returns related to measureable risk
• Reward for bearing disaster risk
• Peso Problems
• Financial Frictions e.g. liquidity
• Impact of uncertainty on continuing profits
• Intermediation by firms
• Monetary policy

Symmetric
Asymmetric
• Higher returns required for skewed distribution of returns
Disaster Risk or Peso Problems
What if risks are not normally distributed?

Rt
Domestic Investment
Overseas Lenders
IUIP I*
R*t
UIP deviations with frictions
• Liquidity or informational constraints may keep premium alive
Rt Domestic Currency Borrowers
UIP holds
Money and Monetary Policy I • Money has a rate of return that is negative in inflation and yet it is held
• Currencies that are expected to appreciate but don’t are also held
• Lack of safe assets in the world – faux safe havens
• Allows the interest rate on funding currencies to be too low given subsequent returns
II • Asymmetric monetary policy rule in high yielder
• Expected depreciation when interest rates are high
• But then systematically prevents by changing interest rates or operating forex policies
• Helps explain excess returns in high yielding economy
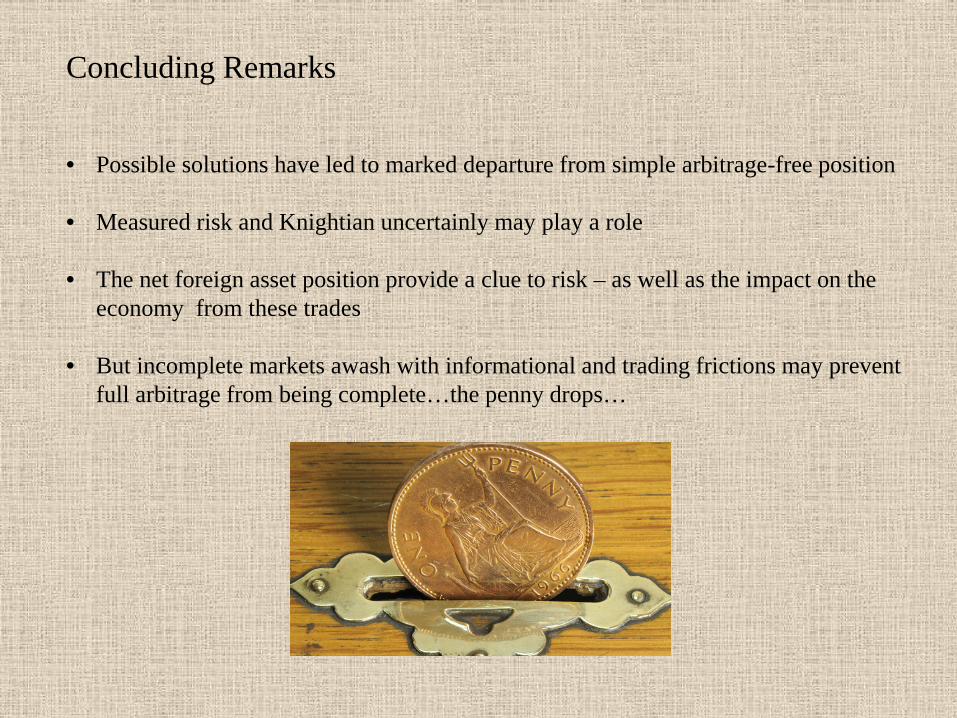
Concluding Remarks • Possible solutions have led to marked departure from simple arbitrage-free position
• Measured risk and Knightian uncertainly may play a role
• The net foreign asset position provide a clue to risk – as well as the impact on the
economy from these trades
• But incomplete markets awash with informational and trading frictions may prevent full arbitrage from being complete…the penny drops…


![Logical Refutations & Establishment of the Knower [Self ]](https://img.dokumen.tips/doc/110x75/577cd7f61a28ab9e78a017b7/logical-refutations-establishment-of-the-knower-self-.jpg)


