Embed Size (px)
Citation preview
Solar SpectralSolar Spectral
Irradiance VariabilityIrradiance Variability
By: Thomas ZimmermannBy: Thomas Zimmermann
Mentors: Tom and JerryMentors: Tom and Jerry
Woods Harder Woods Harder
What will be discussed?What will be discussed?
Why is SSI Variability important?Why is SSI Variability important?
What are the goals for my project?What are the goals for my project?
Where does all this data come from?Where does all this data come from?
What are normal variations?What are normal variations?
How to find the days of interest?How to find the days of interest?
Spoiler Alert!Spoiler Alert!
The Data!The Data!
What we can learn from the data, and what is next?What we can learn from the data, and what is next?
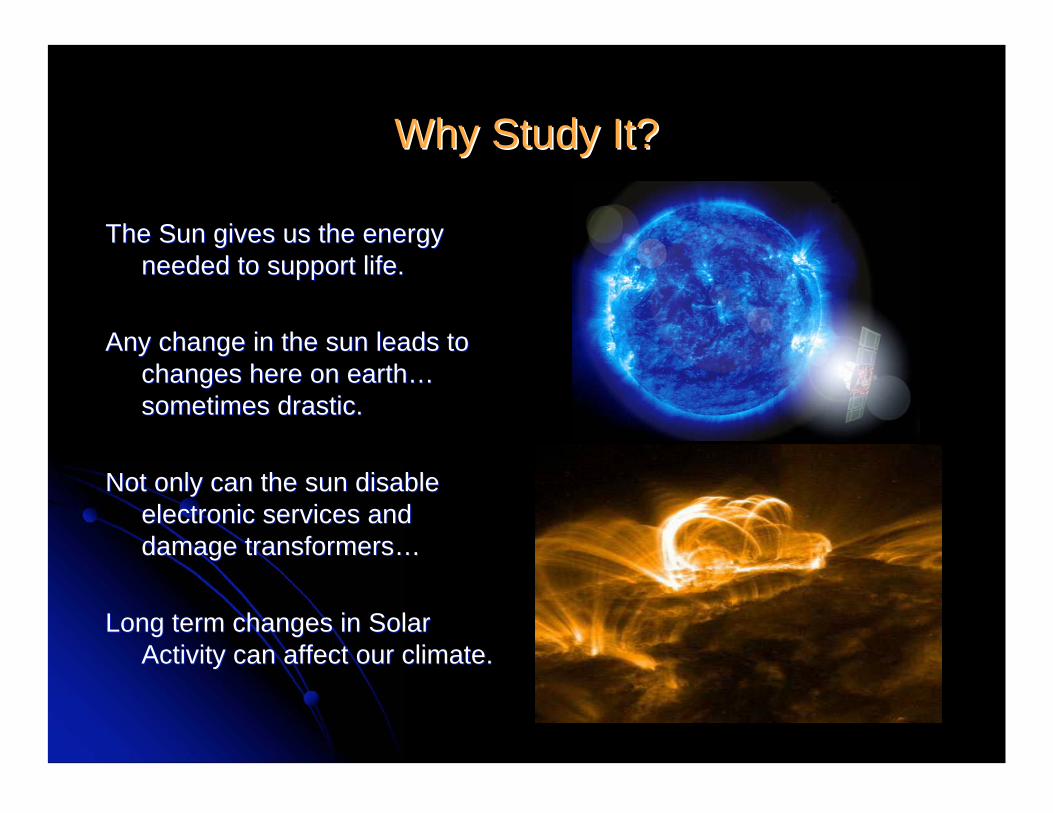
Why Study It?Why Study It?
The Sun gives us the energyThe Sun gives us the energy
needed to support life.needed to support life.
Any change in the sun leads toAny change in the sun leads to
changes here on earthchanges here on earth……
sometimes drastic.sometimes drastic.
Not only can the sun disableNot only can the sun disable
electronic services andelectronic services and
damage transformersdamage transformers……
Long term changes in SolarLong term changes in Solar
Activity can affect our climate.Activity can affect our climate.
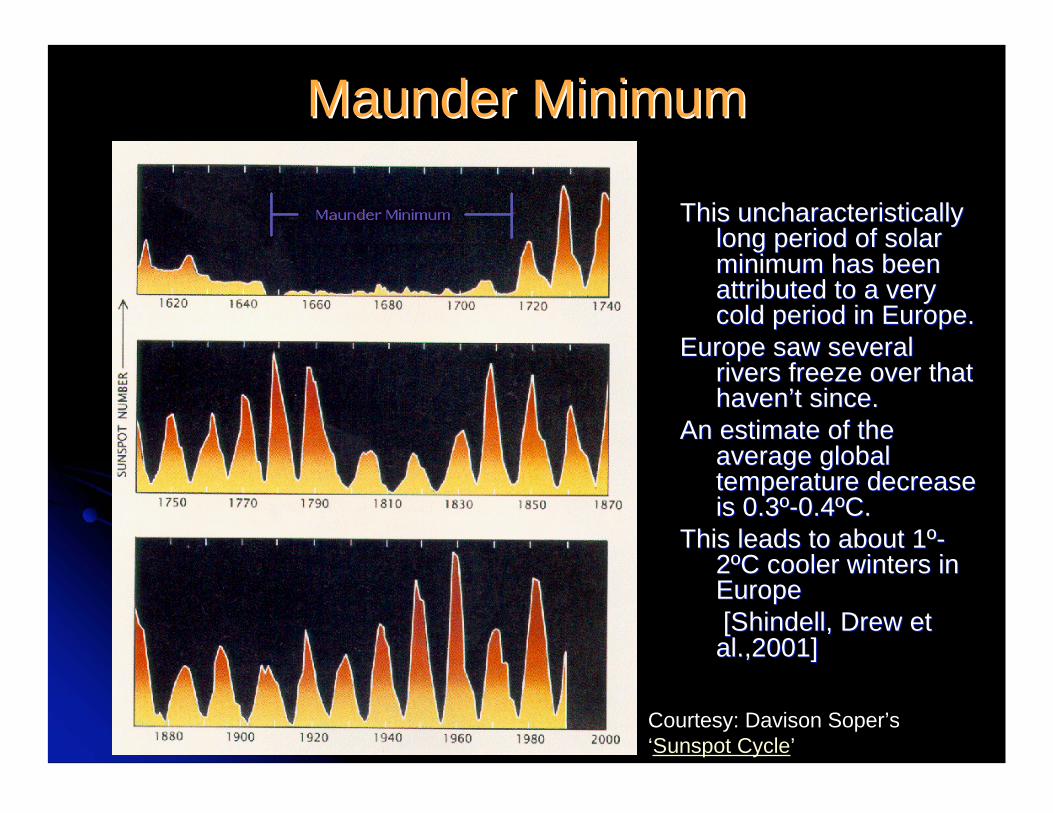
Maunder MinimumMaunder Minimum
This uncharacteristicallyThis uncharacteristicallylong period of solarlong period of solarminimum has beenminimum has beenattributed to a veryattributed to a verycold period in Europe.cold period in Europe.
Europe saw severalEurope saw severalrivers freeze over thatrivers freeze over thathavenhaven’’t since.t since.
An estimate of theAn estimate of theaverage globalaverage globaltemperature decreasetemperature decreaseis 0.3º-0.4ºC.is 0.3º-0.4ºC.
This leads to about 1º-This leads to about 1º-2ºC cooler winters in2ºC cooler winters inEuropeEurope
[ [ShindellShindell, Drew et, Drew etal.,2001]al.,2001]
Courtesy: Davison Soper’s
‘Sunspot Cycle’
The Temperature Relation to TSIThe Temperature Relation to TSI(Total Solar Irradiance)(Total Solar Irradiance)
According to an estimate from George ReidAccording to an estimate from George Reid’’s papers paper‘‘Solar variability and its implications for the humanSolar variability and its implications for the humanenvironmentenvironment’’, the average global temperature relation to, the average global temperature relation toirradiance change is about 0.6°C per 1% irradianceirradiance change is about 0.6°C per 1% irradiancevariation. However, the temperature adjustment can bevariation. However, the temperature adjustment can bedelayed due to the oceandelayed due to the ocean’’s thermal inertia.s thermal inertia.
That means the change in average global temperature ofThat means the change in average global temperature of0.3°C, as approximated for the Maunder Minimum,0.3°C, as approximated for the Maunder Minimum,would be equivalent to a 0.5% drop in TSI.would be equivalent to a 0.5% drop in TSI.
It is important to note that the 1% variation does notIt is important to note that the 1% variation does nothave to be constant over the entire spectrum, and that ithave to be constant over the entire spectrum, and that itmay even be over only a small section of the spectrum.may even be over only a small section of the spectrum.
(Assuming the section makes up at least 1% of the TSI)(Assuming the section makes up at least 1% of the TSI)
Goals for this ProjectGoals for this Project
In studying the SSI variability, we hope to have a betterIn studying the SSI variability, we hope to have a betterunderstanding of how much the SSI affects the TSI.understanding of how much the SSI affects the TSI.
With an understanding of how SSI relates to TSI inWith an understanding of how SSI relates to TSI inFacular Brightening (to be described next slide) cases,Facular Brightening (to be described next slide) cases,we can determine how the SSI would vary if itwe can determine how the SSI would vary if itdisappeared. From that, it might be possible to describeddisappeared. From that, it might be possible to describedwhat happened during the Maunder Minimum.what happened during the Maunder Minimum.
It is preferred to use SSI over TSI for this estimateIt is preferred to use SSI over TSI for this estimatebecause the sun doesnbecause the sun doesn’’t vary consistently over allt vary consistently over allwavelengths. Instead it is likely limited spectral rangeswavelengths. Instead it is likely limited spectral rangesthat vary more.that vary more.
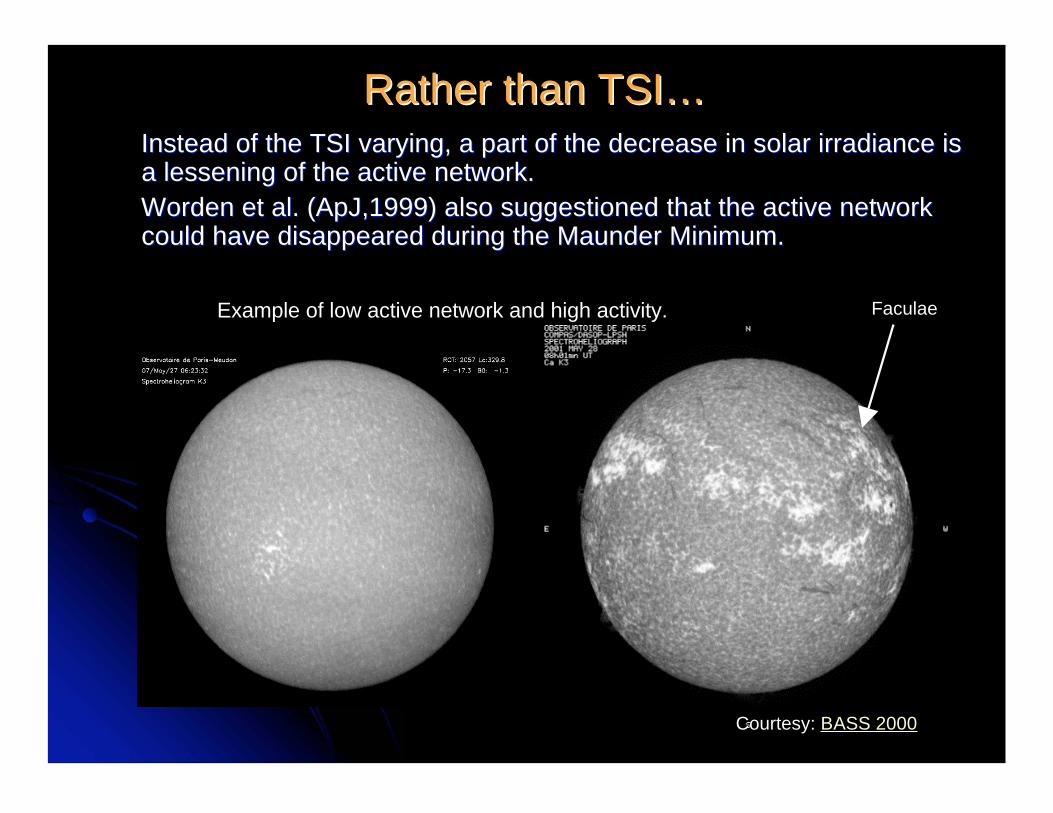
Rather than TSIRather than TSI……Instead of the TSI varying, a part of the decrease in solar irradiance isInstead of the TSI varying, a part of the decrease in solar irradiance isa lessening of the active network.a lessening of the active network.
Worden et al. (ApJ,1999) also Worden et al. (ApJ,1999) also suggestionedsuggestioned that the active network that the active networkcould have disappeared during the Maunder Minimum.could have disappeared during the Maunder Minimum.
Example of low active network and high activity.
Courtesy: BASS 2000
Faculae
Where the Data comes fromWhere the Data comes from
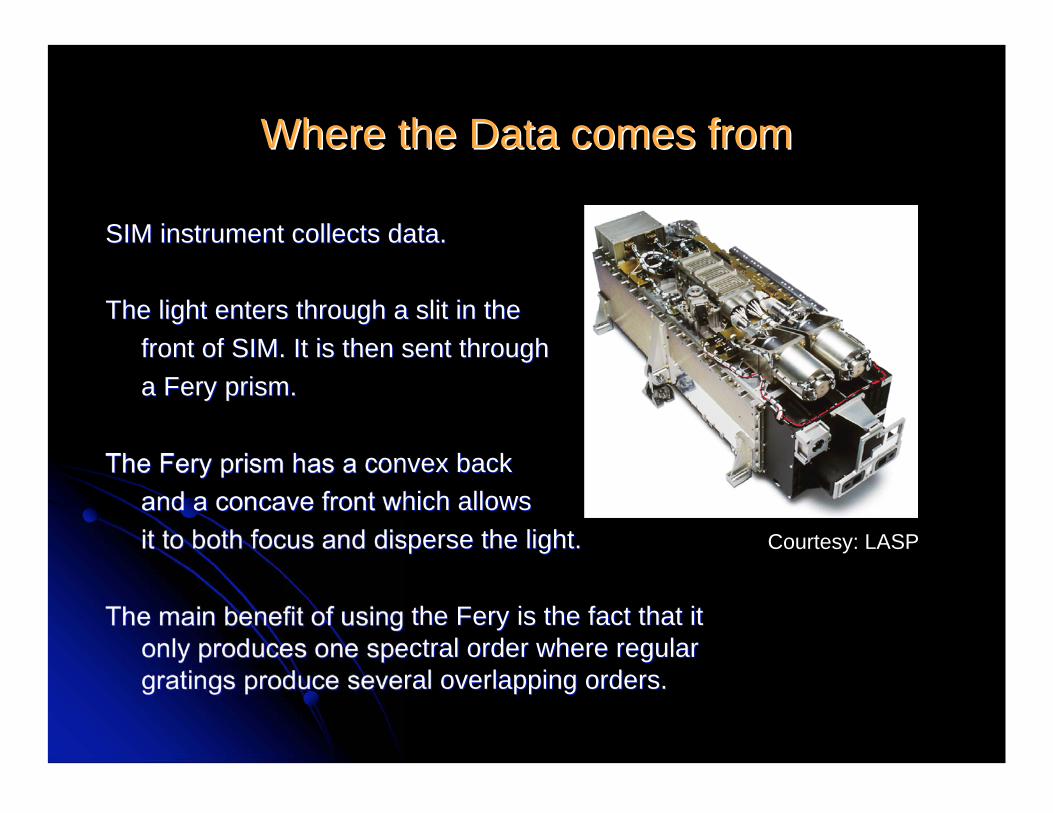
SIM instrument collects data.SIM instrument collects data.
The light enters through a slit in theThe light enters through a slit in the
front of SIM. It is then sent throughfront of SIM. It is then sent through
a a FeryFery prism. prism.
The The FeryFery prism has a convex back prism has a convex back
and a concave front which allowsand a concave front which allows
it to both focus and disperse the light.it to both focus and disperse the light.
The main benefit of using the The main benefit of using the FeryFery is the fact that it is the fact that it
only produces one spectral order where regularonly produces one spectral order where regular
gratings produce several overlapping orders.gratings produce several overlapping orders.
Courtesy: LASP
Normal VariationNormal Variation
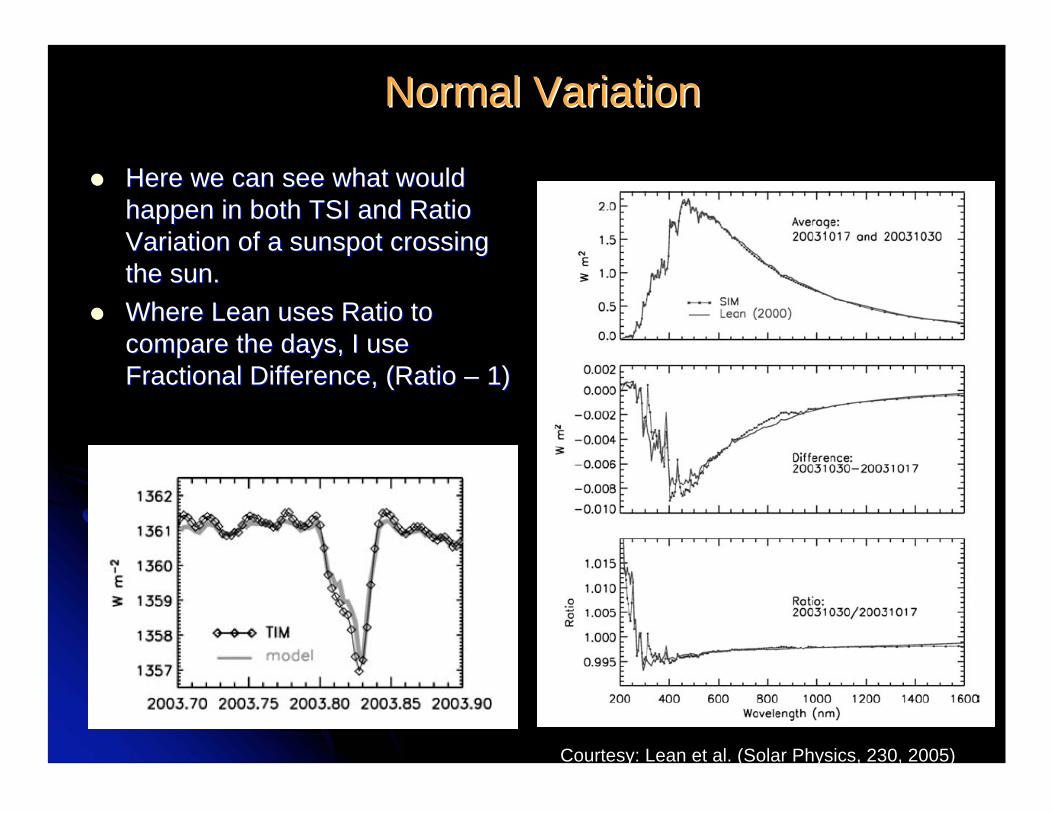
Here we can see what wouldHere we can see what would
happen in both TSI and Ratiohappen in both TSI and Ratio
Variation of a sunspot crossingVariation of a sunspot crossing
the sun.the sun.
Where Lean uses Ratio toWhere Lean uses Ratio to
compare the days, I usecompare the days, I use
Fractional Difference, (Ratio Fractional Difference, (Ratio –– 1) 1)
Courtesy: Lean et al. (Solar Physics, 230, 2005)
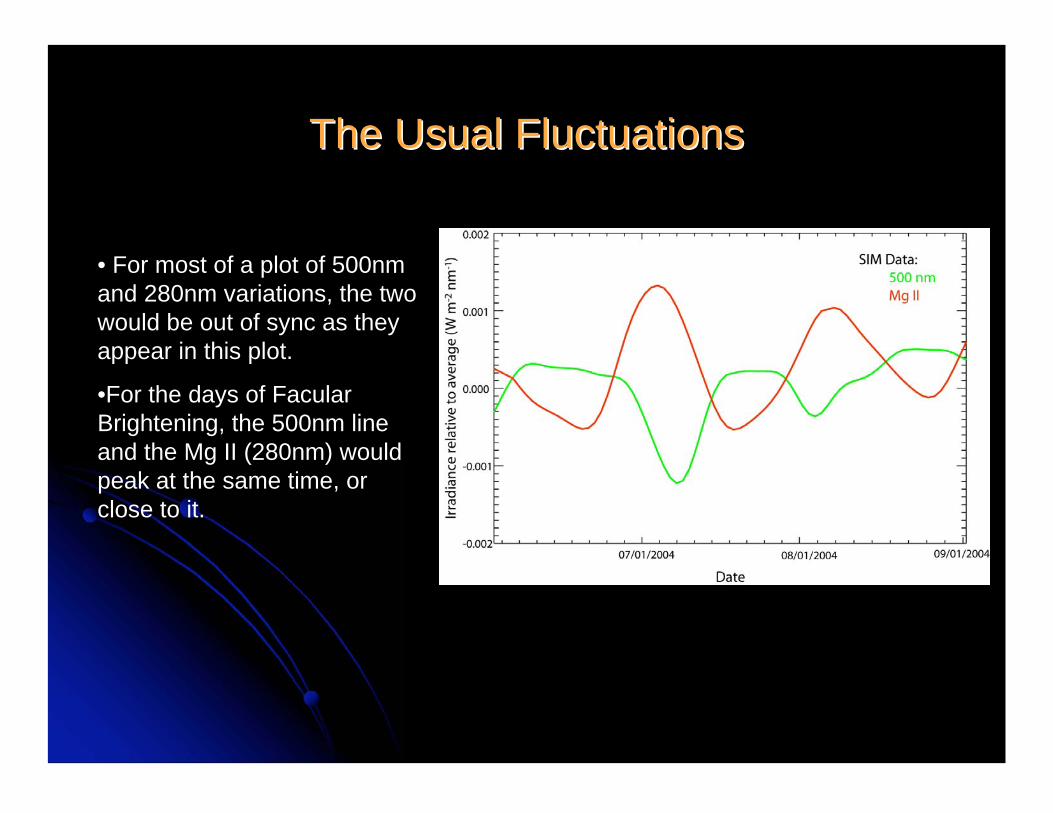
The Usual FluctuationsThe Usual Fluctuations
• For most of a plot of 500nm
and 280nm variations, the two
would be out of sync as they
appear in this plot.
•For the days of Facular
Brightening, the 500nm line
and the Mg II (280nm) would
peak at the same time, or
close to it.
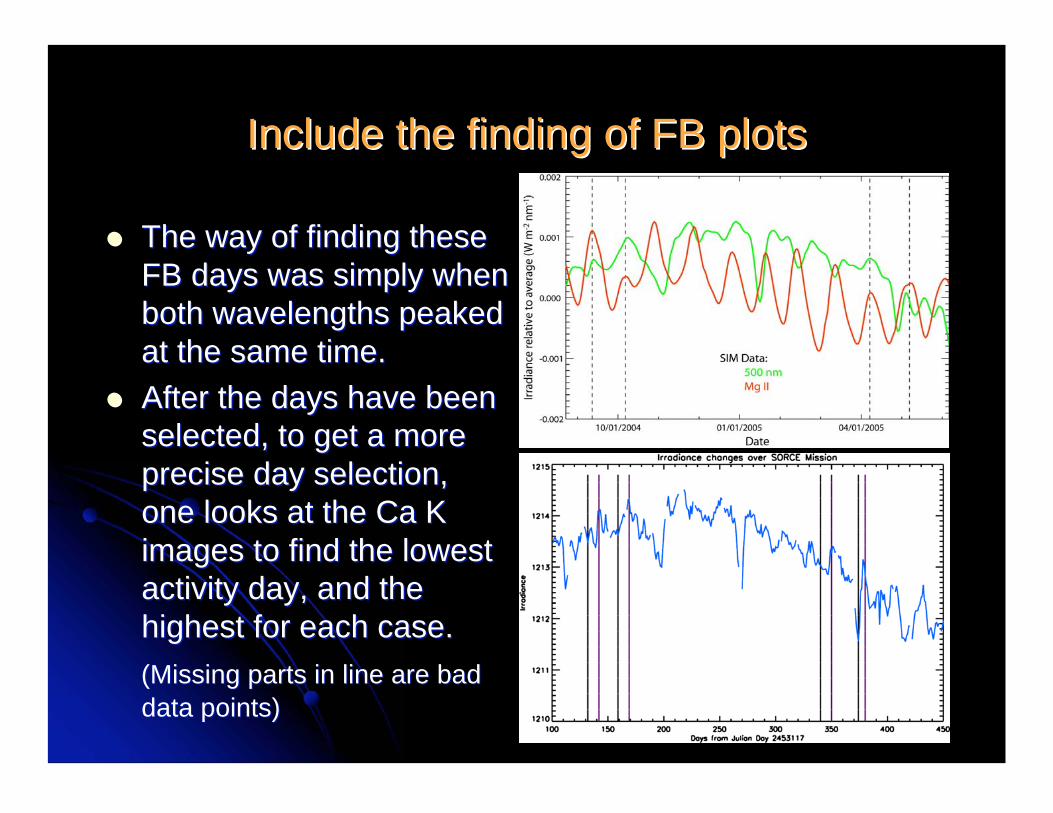
Include the finding of FB plotsInclude the finding of FB plots
The way of finding theseThe way of finding these
FB days was simply whenFB days was simply when
both wavelengths peakedboth wavelengths peaked
at the same time.at the same time.
After the days have beenAfter the days have been
selected, to get a moreselected, to get a more
precise day selection,precise day selection,
one looks at the Ca Kone looks at the Ca K
images to find the lowestimages to find the lowest
activity day, and theactivity day, and the
highest for each case.highest for each case.
(Missing parts in line are bad(Missing parts in line are bad
data points)data points)
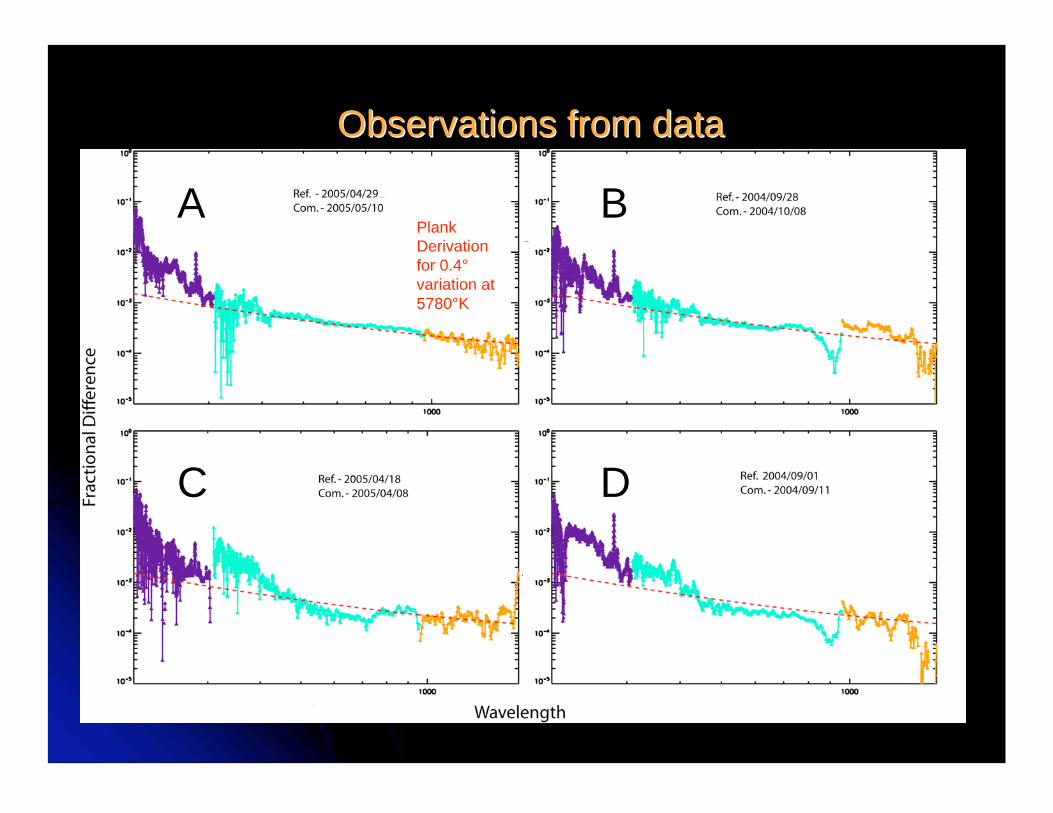
Observations from dataObservations from data
A B
DC
Plank
Derivation
for 0.4°
variation at
5780°K
Interpretation of the DataInterpretation of the Data
There is obviously an overwhelming amount ofThere is obviously an overwhelming amount of
information in the plots, but we can easily see someinformation in the plots, but we can easily see some
common and important features.common and important features.
You must also be careful of misidentifying a system orYou must also be careful of misidentifying a system or
hardware feature as actual results.hardware feature as actual results.
We are ideally looking for days without sunspots. To doWe are ideally looking for days without sunspots. To do
so one must examine the solar images to find which ofso one must examine the solar images to find which of
these plots has the data we are looking for.these plots has the data we are looking for.
Though from the plots we see that, the Though from the plots we see that, the thethe visible and visible and
infrared, A fits the 0.4°K Plank derivation best.infrared, A fits the 0.4°K Plank derivation best.
Should also note that UV light shows marked increase inShould also note that UV light shows marked increase in
all of the plots.all of the plots.
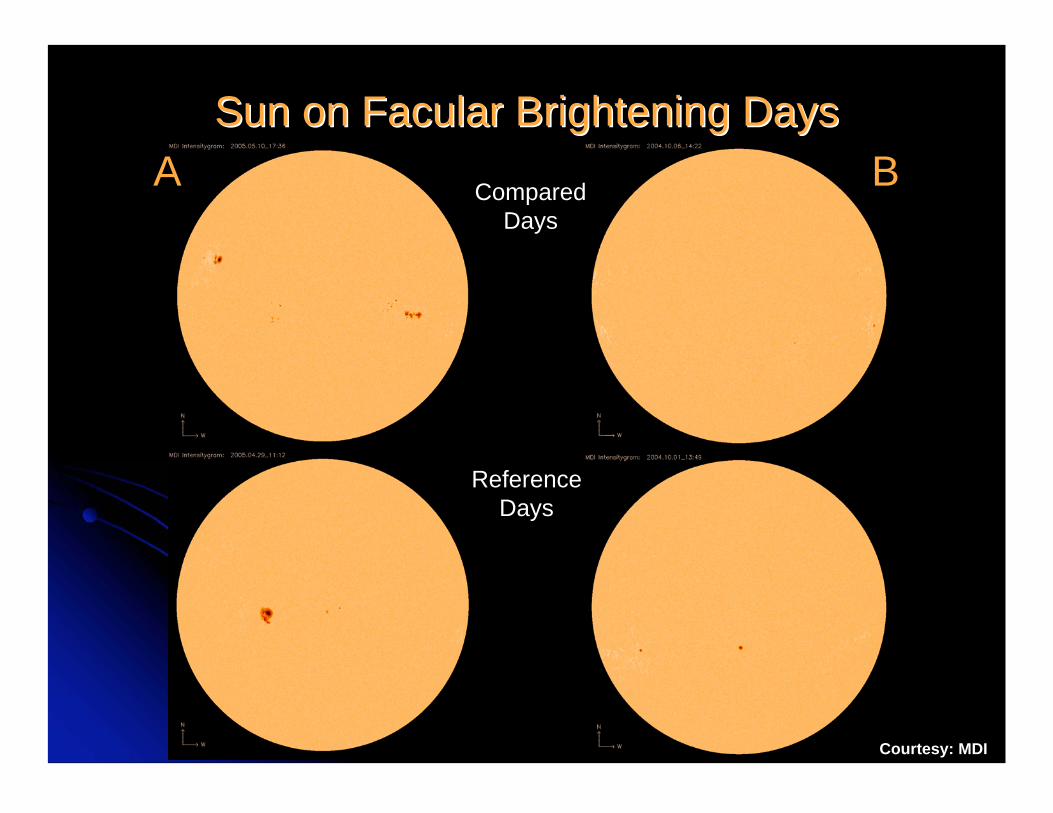
Sun on Facular Brightening DaysSun on Facular Brightening Days
Reference
Days
Compared
Days
A B
Courtesy: MDI
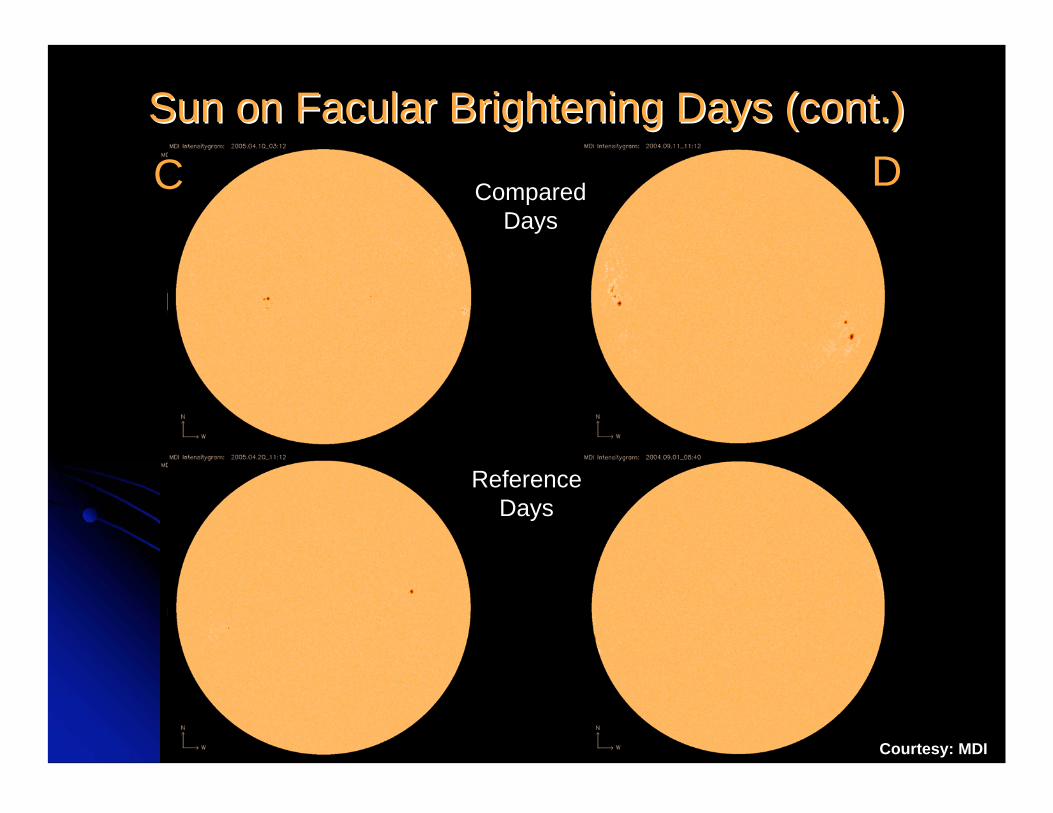
Sun on Facular Brightening Days (cont.)Sun on Facular Brightening Days (cont.)
Compared
Days
Reference
Days
DC
Courtesy: MDI
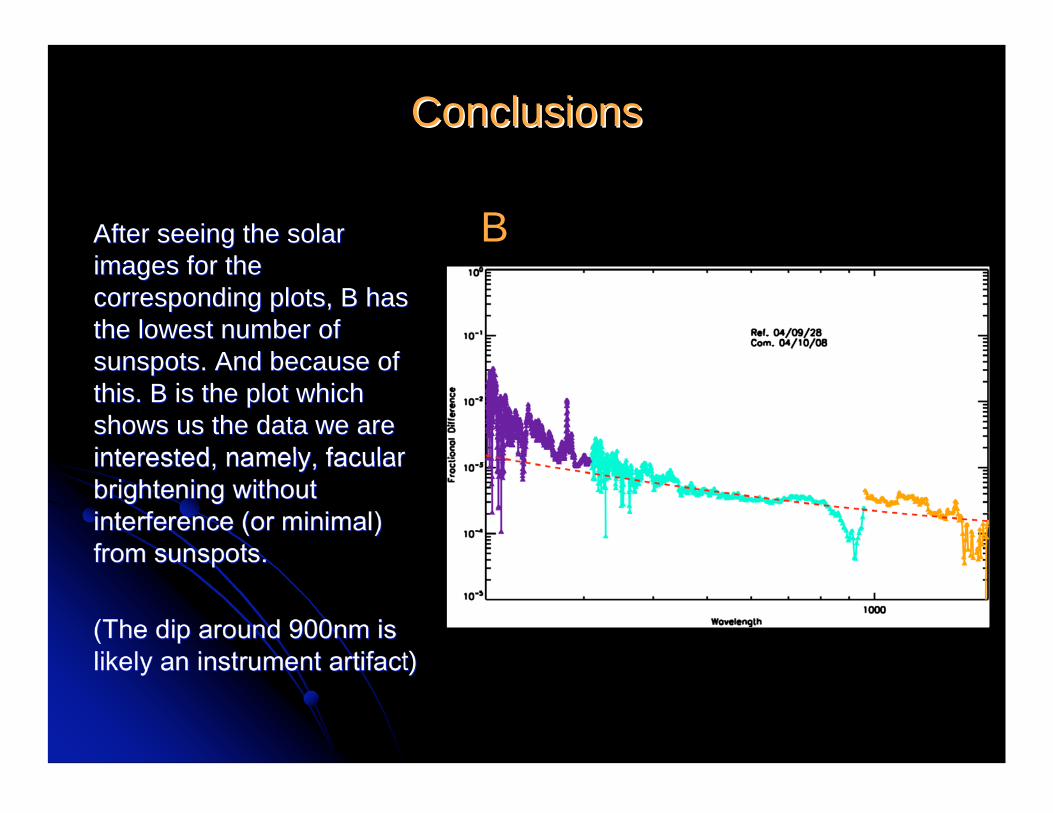
ConclusionsConclusions
After seeing the solarAfter seeing the solar
images for theimages for the
corresponding plots, B hascorresponding plots, B has
the lowest number ofthe lowest number of
sunspots. And because ofsunspots. And because of
this. B is the plot whichthis. B is the plot which
shows us the data we areshows us the data we are
interested, namely, facularinterested, namely, facular
brightening withoutbrightening without
interference (or minimal)interference (or minimal)
from sunspots.from sunspots.
(The dip around 900nm is(The dip around 900nm is
likely an instrument artifact)likely an instrument artifact)
B
Where does all this lead?Where does all this lead?
Now that there are some good relations drawn betweenNow that there are some good relations drawn between
the SSI and TSI, and their effect on temperatures here,the SSI and TSI, and their effect on temperatures here,
we can begin to look at other periods of time and makewe can begin to look at other periods of time and make
estimates of what the sun may have been acting likeestimates of what the sun may have been acting like
during those time periods.during those time periods.
With the SSI variation data, climate modelers could useWith the SSI variation data, climate modelers could use
the irradiance variation derived to estimate temperaturethe irradiance variation derived to estimate temperature
changes on Earth.changes on Earth.
ReferencesReferences
BASS2000: Solar Survey Archive. (2007, July 30). BASS2000: Solar Survey Archive. (2007, July 30). MeudonMeudon SpectroheliographSpectroheliograph. . Retrieved July 18, 2007 from Retrieved July 18, 2007 from http://bass2000.obspm.fr/home.phphttp://bass2000.obspm.fr/home.php
Lean et al. (Solar Physics, 230, 2005) Lean et al. (Solar Physics, 230, 2005) SORCE Contributions to NewSORCE Contributions to NewUnderstanding of Global Change and Solar Variability.Understanding of Global Change and Solar Variability.
Dordrecht, Netherlands: Springer. 38 p.Dordrecht, Netherlands: Springer. 38 p.
Michelson Doppler Imager. (2007, May 25). Michelson Doppler Imager. (2007, May 25). MDI MDI IntensitygramIntensitygram..Retrieved July 19, 2007 from Retrieved July 19, 2007 from
http://soi.stanford.edu/production/int_gifs.htmlhttp://soi.stanford.edu/production/int_gifs.html
Reid, George. (Journal of Atmospheric and Solar-Terrestrial Reid, George. (Journal of Atmospheric and Solar-Terrestrial Physics, 61, 1999). Physics, 61, 1999). Solar variability and its implications for theSolar variability and its implications for the
human environmenthuman environment. 3-14 pp.. 3-14 pp.
ShindellShindell, Drew et al., (Science, 294, 2001). , Drew et al., (Science, 294, 2001). Solar Forcing of Solar Forcing of Regional Climate Change During the Maunder Minimum. Regional Climate Change During the Maunder Minimum. 2149-2149-
2152 pp.2152 pp.
SoperSoper, Davison. , Davison. Sunspot Cycle.Sunspot Cycle. Retrieved July 24, 2007 from Retrieved July 24, 2007 fromhttp://zebu.uoregon.edu/~soper/Sun/cycle.htmlhttp://zebu.uoregon.edu/~soper/Sun/cycle.html
Worden, John et al. (Worden, John et al. (ApJApJ, 501, 1999). , 501, 1999). Evolution of Evolution of ChromosphericChromosphericStructures: How Structures: How ChromosphericChromospheric Structures Contribute to the Structures Contribute to theSolar He II 30.4 Nanometer Irradiance and Variability.Solar He II 30.4 Nanometer Irradiance and Variability.965-975 pp.965-975 pp.