Embed Size (px)
Citation preview

From Solar to Batteries & E-Mobility an industry perspective
Jake McKee
Senior Director, Design and Engineering
Distributed Generation
SunEdison
Intersolar San Francisco, CA
July 12th, 2015

In 2005 a Caltech professor spoke on building out solar and eventually using car batteries to mitigate the intermittent resource..

Through some challenging years.. with ups and downs.. this vision is getting closer..
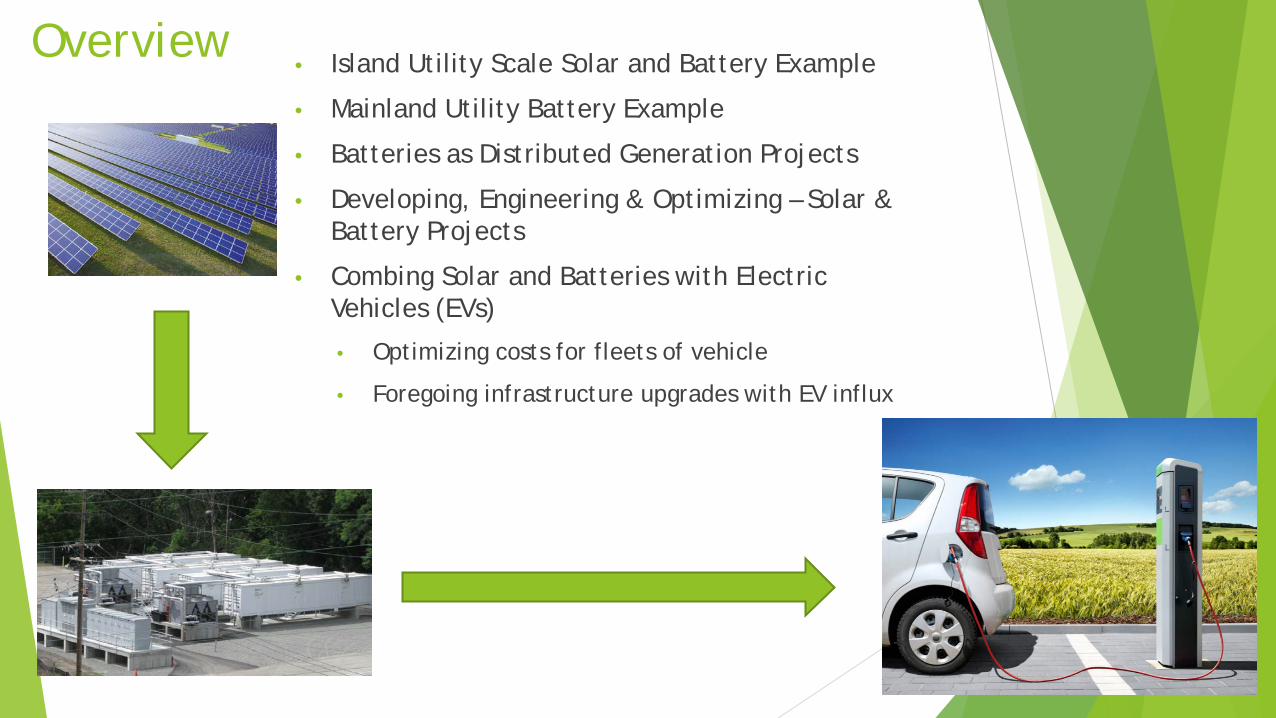
Overview
• Island Utility Scale Solar and Battery Example
• Mainland Utility Battery Example
• Batteries as Distributed Generation Projects
• Developing, Engineering & Optimizing – Solar & Battery Projects
• Combing Solar and Batteries with Electric Vehicles (EVs)
• Optimizing costs for fleets of vehicle
• Foregoing infrastructure upgrades with EV influx
Island Utility 2011: PREPA
• Ramp Rate + Frequency Control
• What if these happen at the same time?
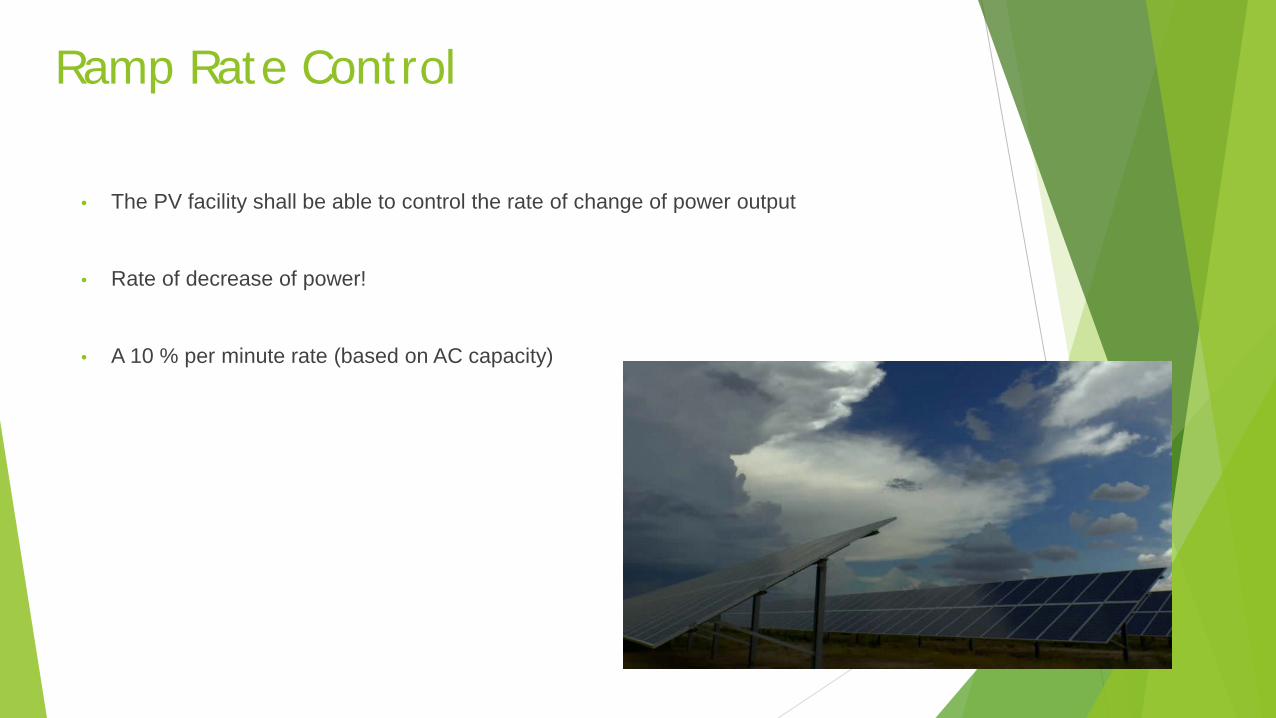
Ramp Rate Control
• The PV facility shall be able to control the rate of change of power output
• Rate of decrease of power!
• A 10 % per minute rate (based on AC capacity)
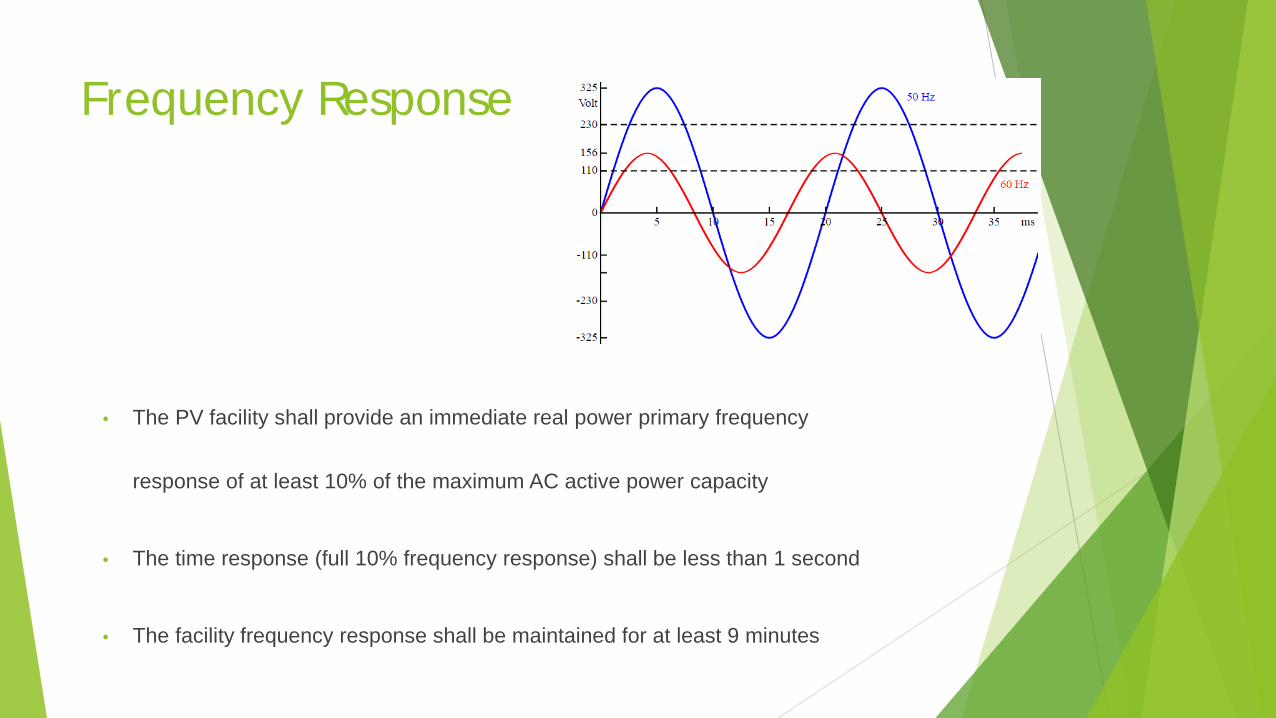
Frequency Response
• The PV facility shall provide an immediate real power primary frequency
response of at least 10% of the maximum AC active power capacity
• The time response (full 10% frequency response) shall be less than 1 second
• The facility frequency response shall be maintained for at least 9 minutes
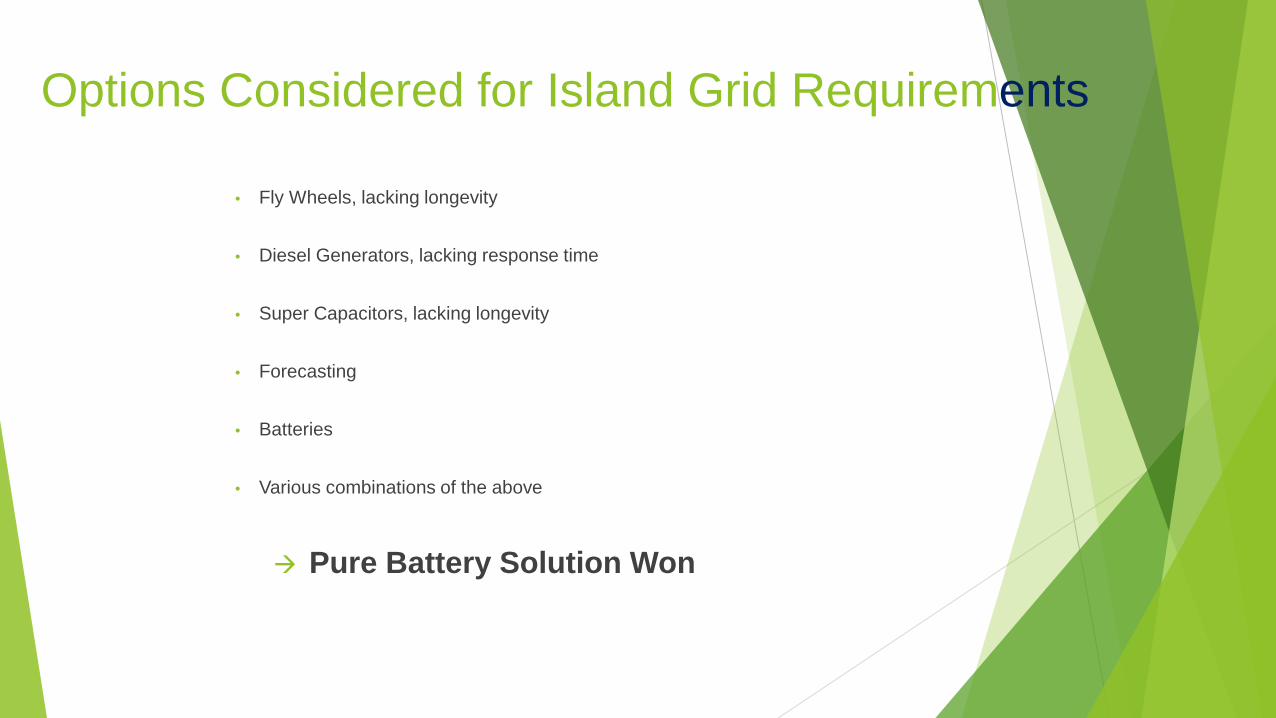
Options Considered for Island Grid Requirements
• Fly Wheels, lacking longevity
• Diesel Generators, lacking response time
• Super Capacitors, lacking longevity
• Forecasting
• Batteries
• Various combinations of the above
Pure Battery Solution Won

Mainland Utility 2015: Tucson Electric Power
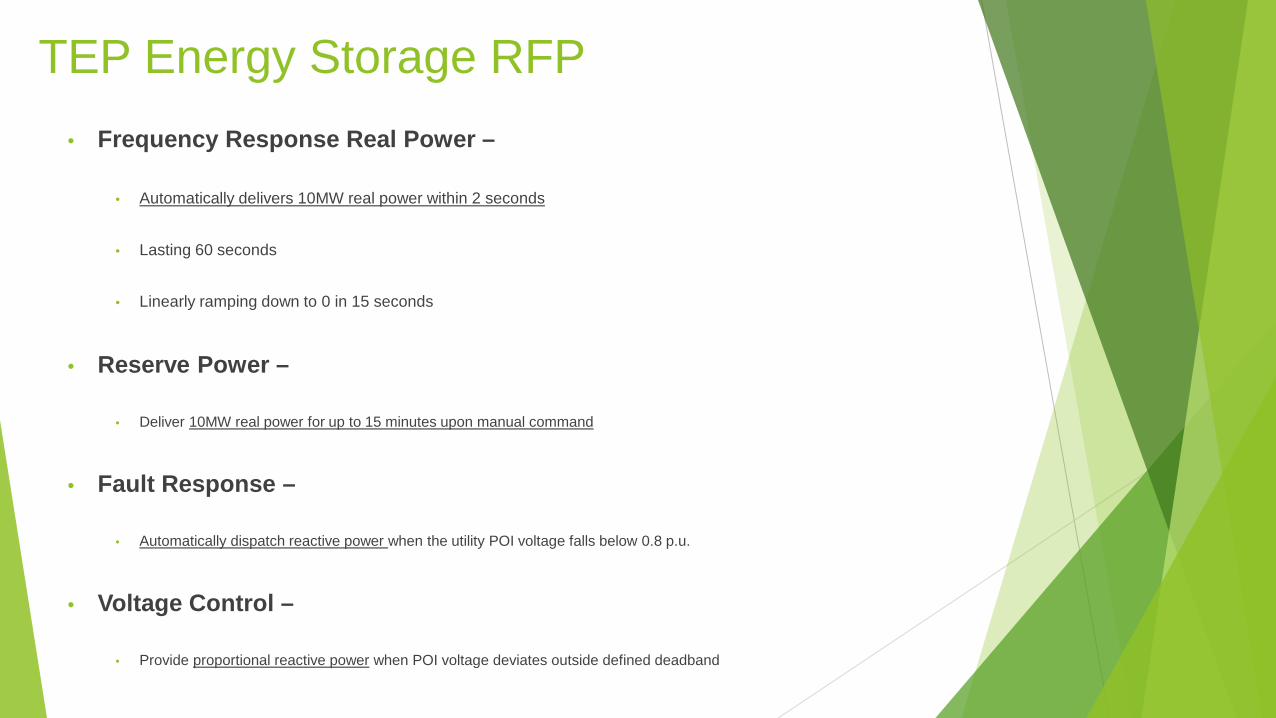
TEP Energy Storage RFP
• Frequency Response Real Power –
• Automatically delivers 10MW real power within 2 seconds
• Lasting 60 seconds
• Linearly ramping down to 0 in 15 seconds
• Reserve Power –
• Deliver 10MW real power for up to 15 minutes upon manual command
• Fault Response –
• Automatically dispatch reactive power when the utility POI voltage falls below 0.8 p.u.
• Voltage Control –
• Provide proportional reactive power when POI voltage deviates outside defined deadband
Distributed Batteries – 2015-2016: Globally >> CA >> SCE
• Behind the meter batteries and solar
• Helps demand charges
• For peaks at commercial & industrials – e.g. Walmart
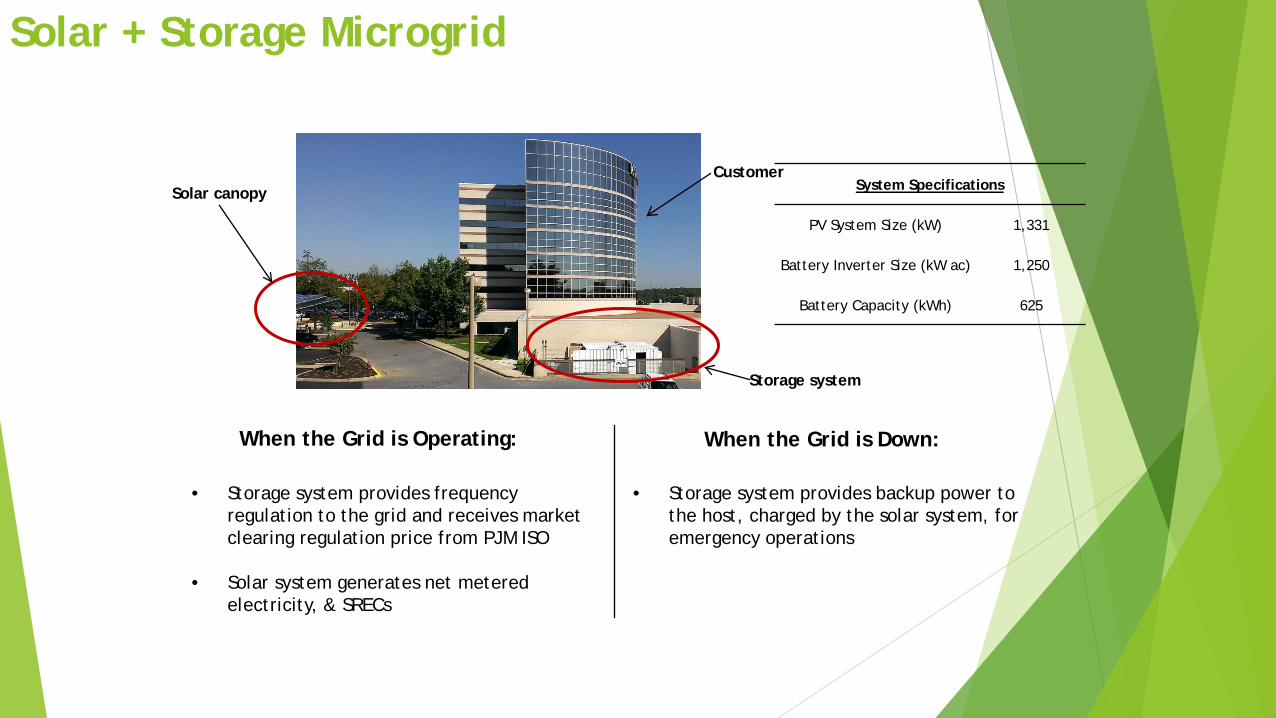
Solar + Storage Microgrid
Solar canopy Customer
Storage system
When the Grid is Operating: When the Grid is Down:
• Storage system provides frequency regulation to the grid and receives market clearing regulation price from PJM ISO
• Solar system generates net metered
electricity, & SRECs
• Storage system provides backup power to the host, charged by the solar system, for emergency operations
System Specifications
PV System Size (kW) 1,331
Battery Inverter Size (kW ac) 1,250
Battery Capacity (kWh) 625

Govt. Policies in CA Helping Greatly
• CA retiring 9 GW of generation, causing local capacity challenges in high density areas
• AB2514 mandated 1.325GW storage procurement through 2020
• Storage awarded in 2013 SCE Local Capacity Requirement RFP
• Storage is one piece of solution – ability to be placed in sites that cannot accommodate anything else
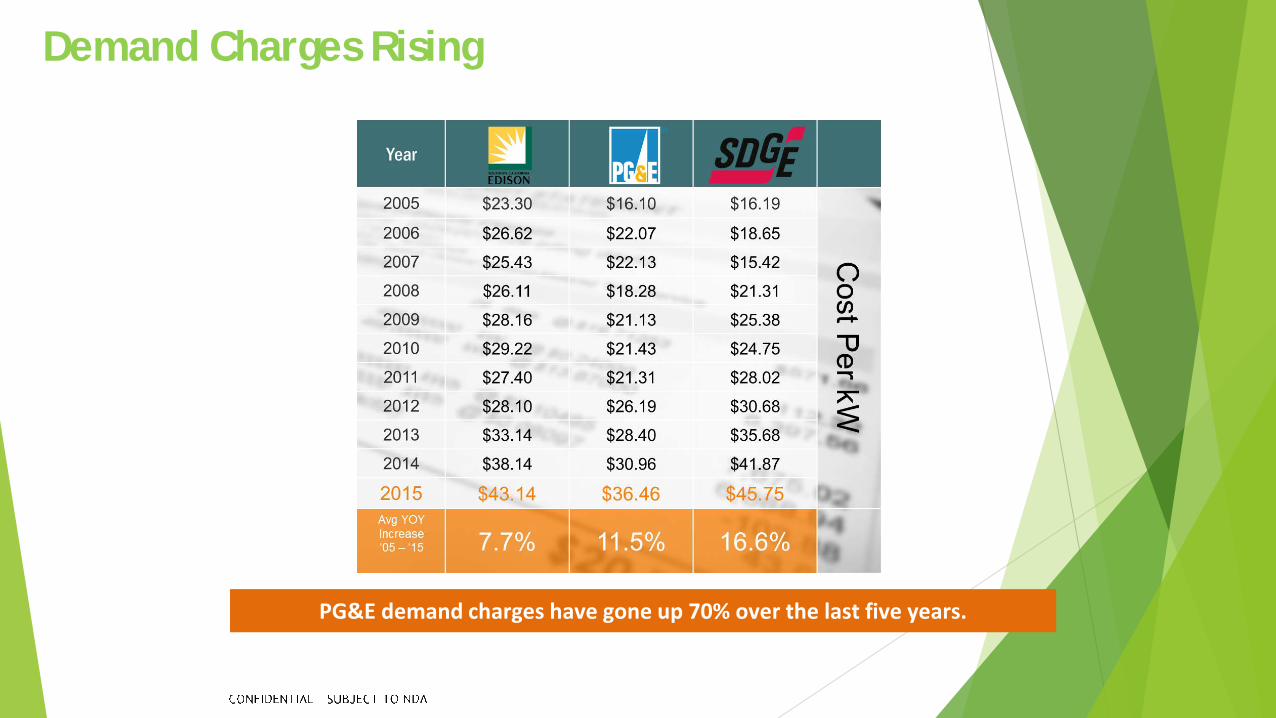
Demand Charges Rising
PG&E demand charges have gone up 70% over the last five years.

Developing, Engineering & Optimizing – Solar and ES Projects
Design Considerations
Battery Technologies
Contracting
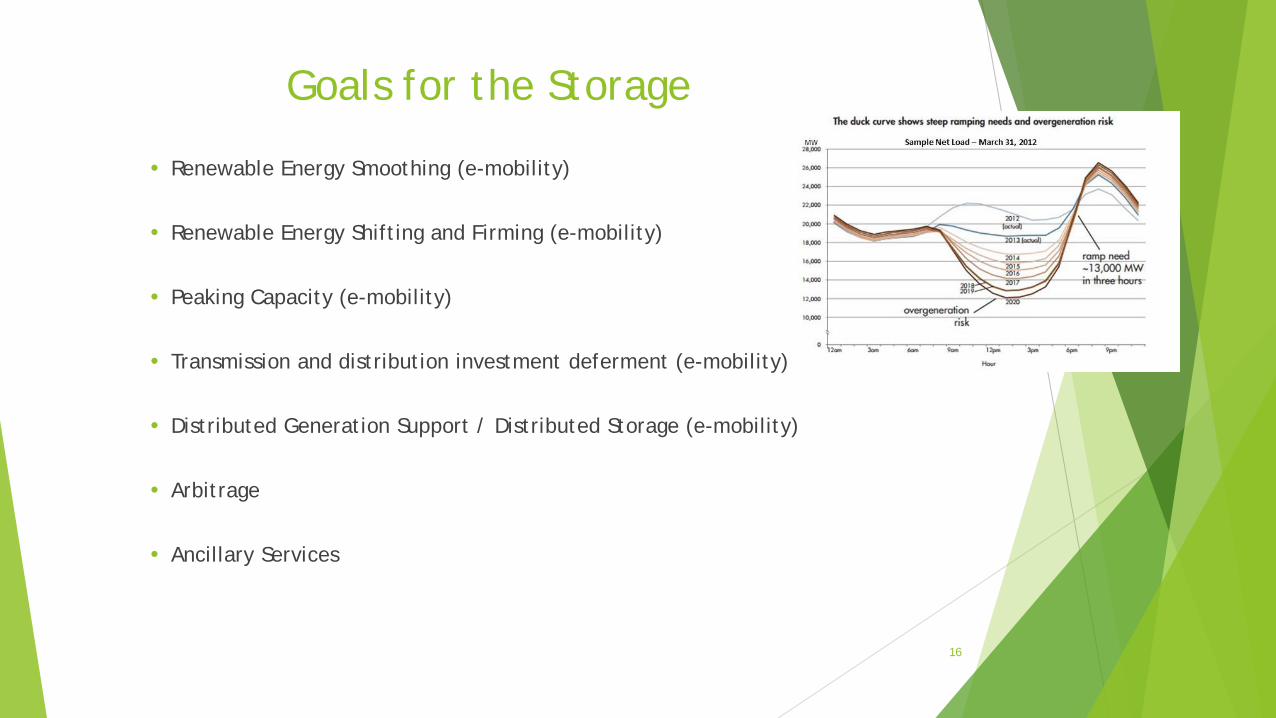
Goals for the Storage
Renewable Energy Smoothing (e-mobility)
Renewable Energy Shifting and Firming (e-mobility)
Peaking Capacity (e-mobility)
Transmission and distribution investment deferment (e-mobility)
Distributed Generation Support / Distributed Storage (e-mobility)
Arbitrage
Ancillary Services
16
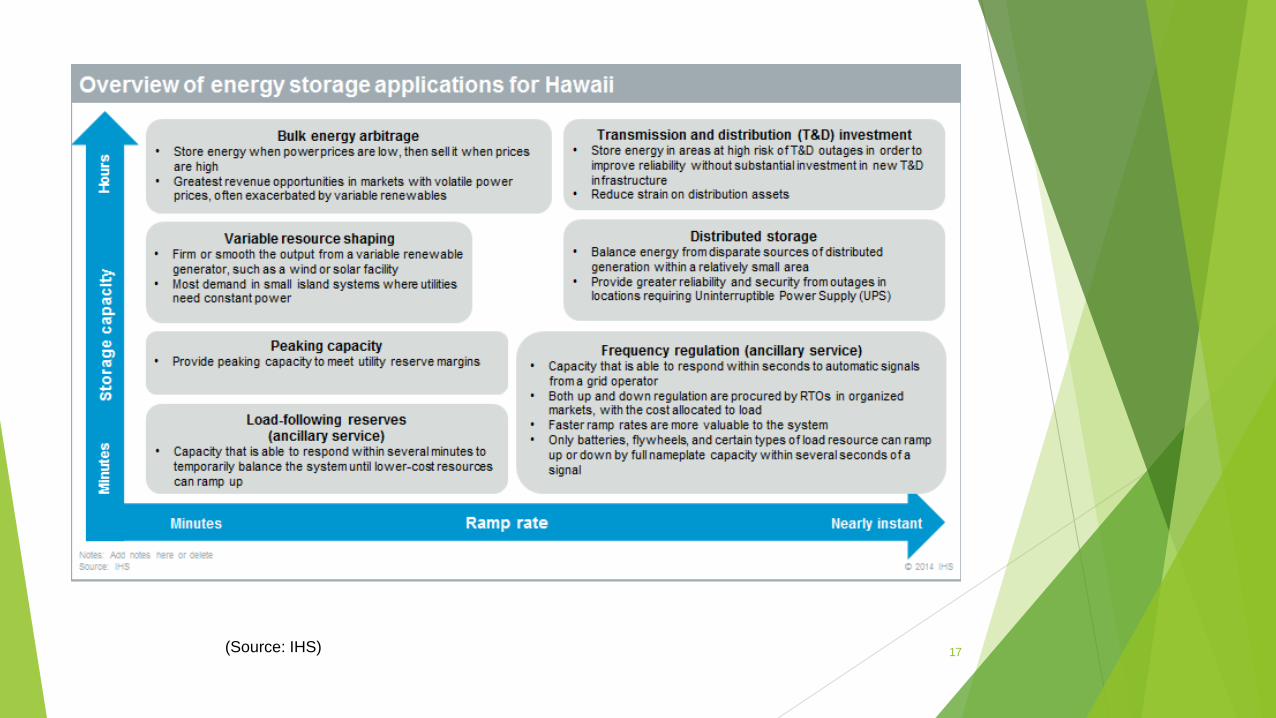
17 (Source: IHS)
Contracting the BESS
• Wrap as much as possible
• Integrator, battery supplier, installer, O&M
• Large balance sheet
• Battery replacement plan
• Most likely tied to a longer contract
• A not to exceed replacement price
19
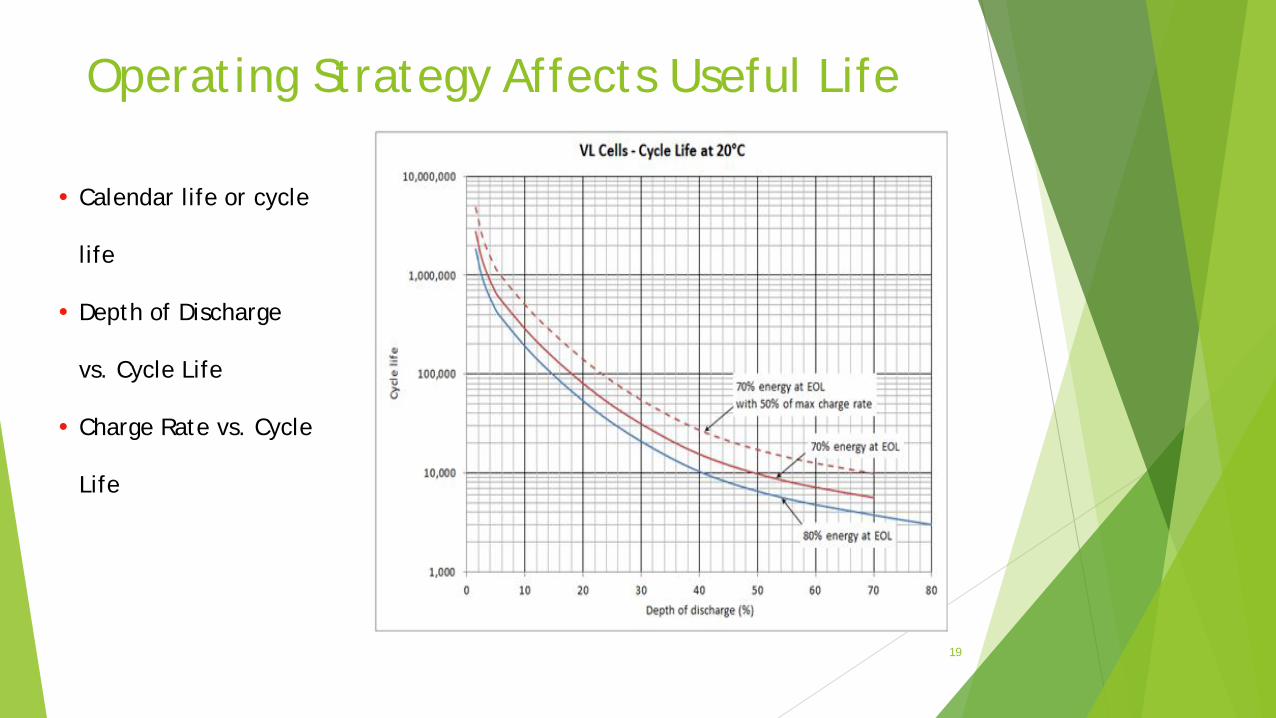
Calendar life or cycle
life
Depth of Discharge
vs. Cycle Life
Charge Rate vs. Cycle
Life
Operating Strategy Affects Useful Life
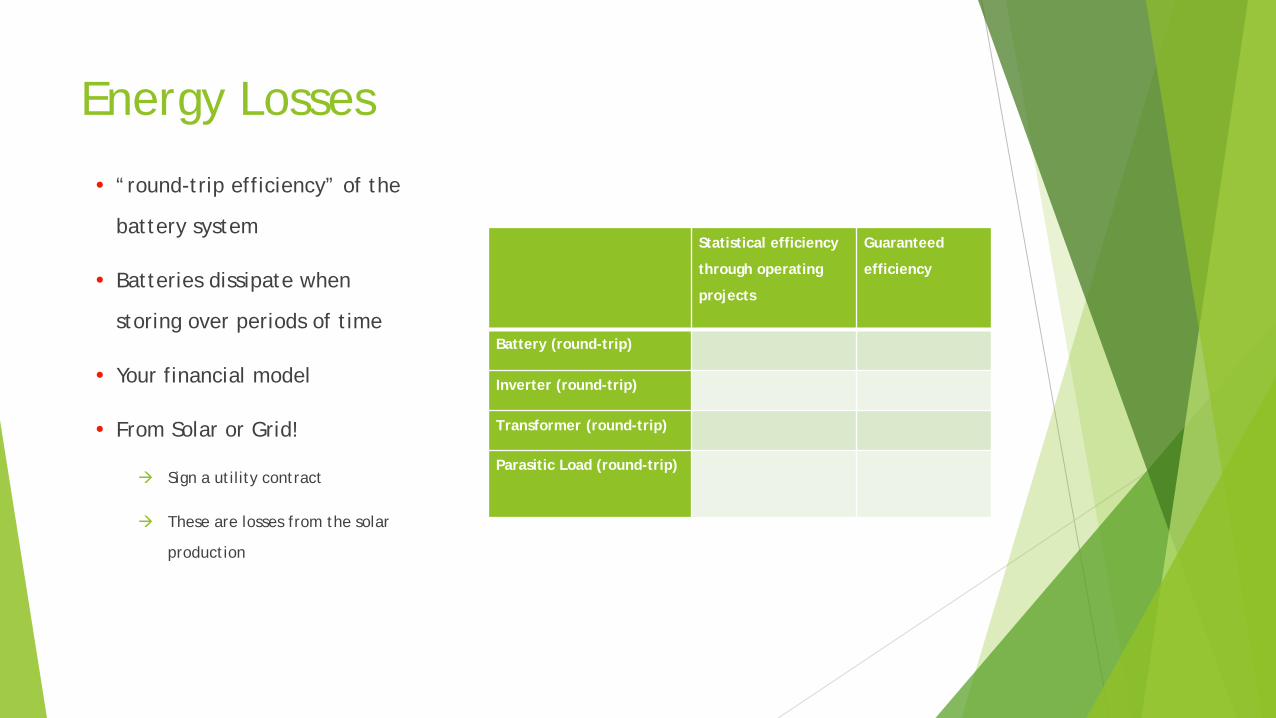
Energy Losses
“round-trip efficiency” of the
battery system
Batteries dissipate when
storing over periods of time
Your financial model
From Solar or Grid!
Sign a utility contract
These are losses from the solar
production
Statistical efficiency
through operating
projects
Guaranteed
efficiency
Battery (round-trip)
Inverter (round-trip)
Transformer (round-trip)
Parasitic Load (round-trip)

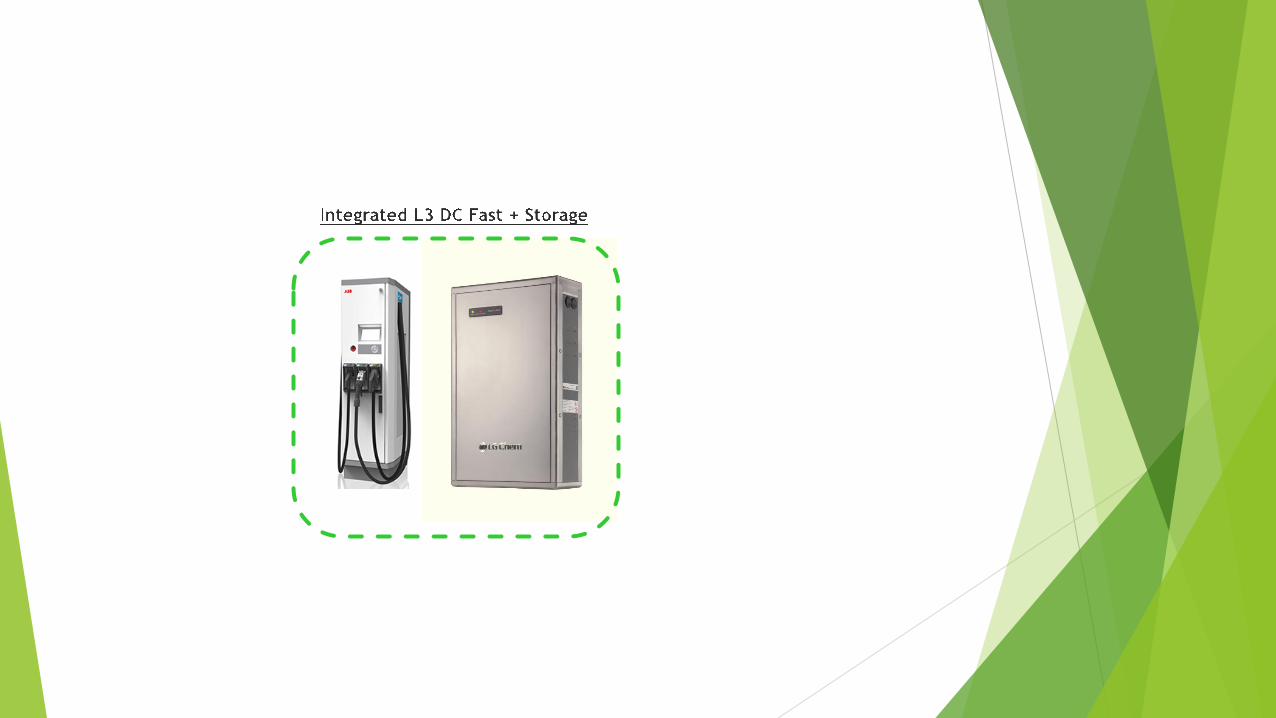
E-mobility Solar, Batteries and EVs
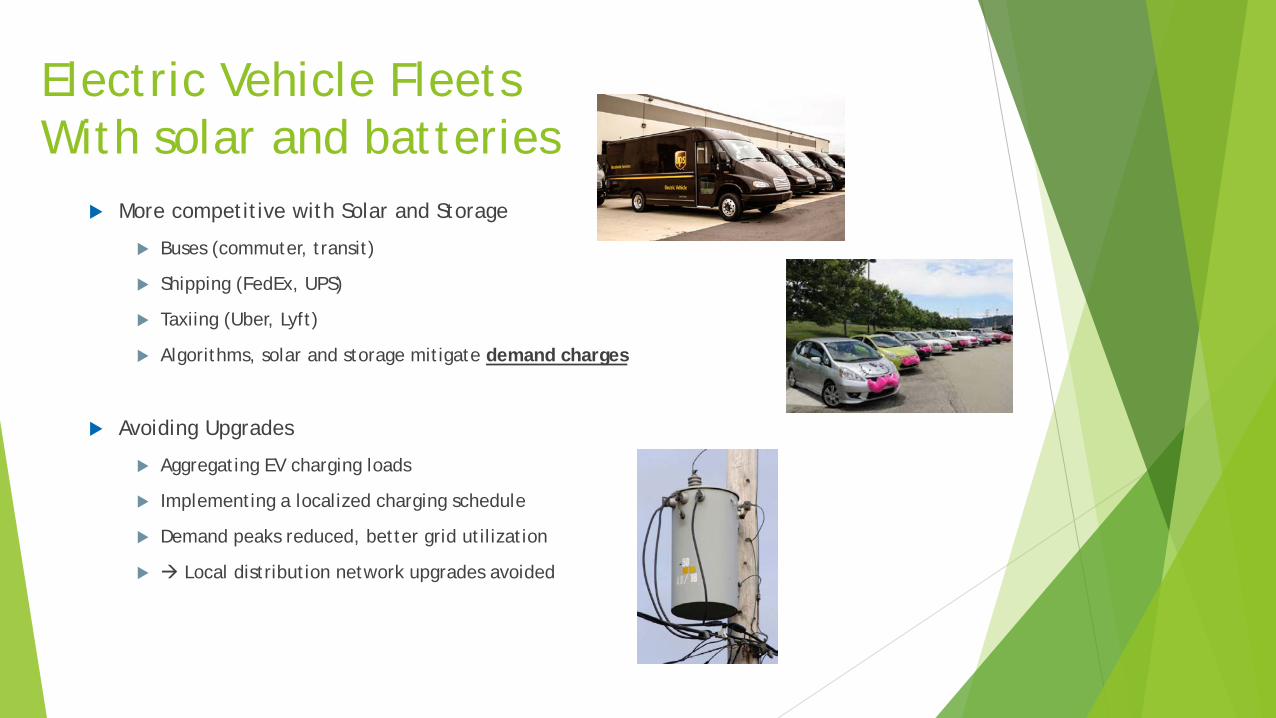
Electric Vehicle Fleets With solar and batteries
More competitive with Solar and Storage
Buses (commuter, transit)
Shipping (FedEx, UPS)
Taxiing (Uber, Lyft)
Algorithms, solar and storage mitigate demand charges
Avoiding Upgrades
Aggregating EV charging loads
Implementing a localized charging schedule
Demand peaks reduced, better grid utilization
Local distribution network upgrades avoided
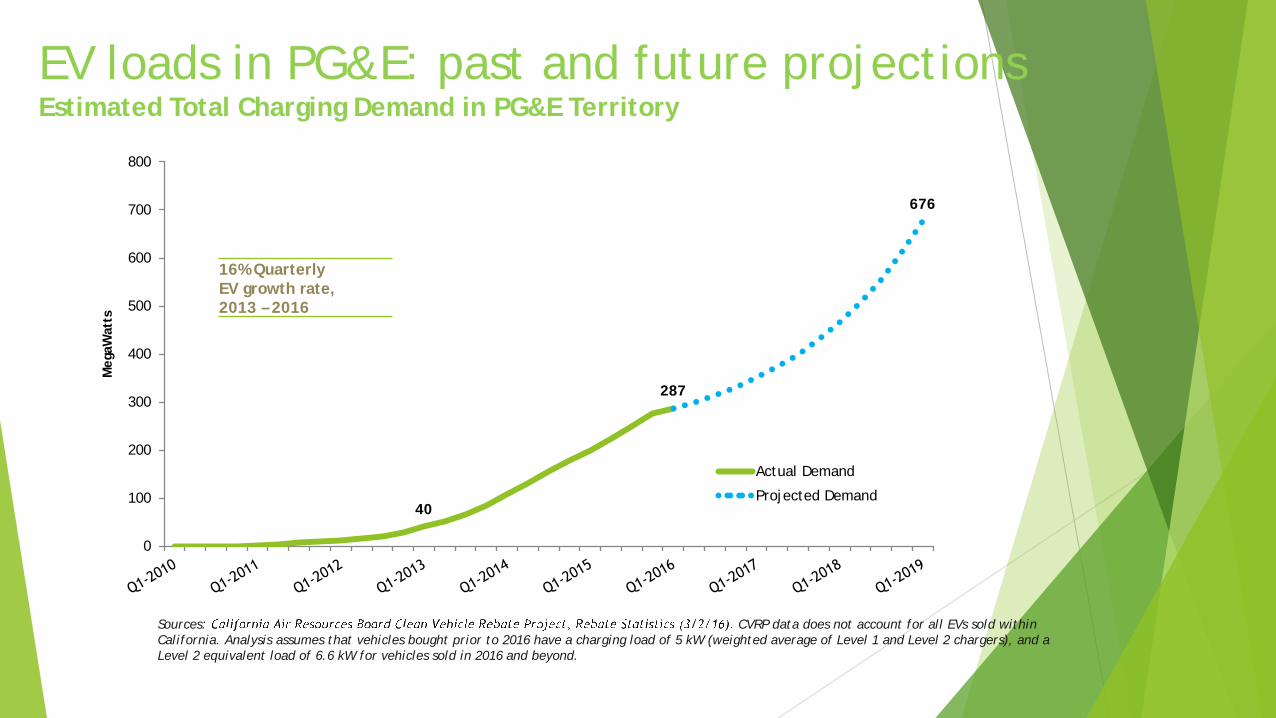
EV loads in PG&E: past and future projections Estimated Total Charging Demand in PG&E Territory
Sources: CVRP data does not account for all EVs sold within California. Analysis assumes that vehicles bought prior to 2016 have a charging load of 5 kW (weighted average of Level 1 and Level 2 chargers), and a Level 2 equivalent load of 6.6 kW for vehicles sold in 2016 and beyond.
40
287
676
0
100
200
300
400
500
600
700
800
Meg
aWat
ts
Actual Demand
Projected Demand
16% Quarterly EV growth rate, 2013 – 2016

Improved EV Fleet Charge Management
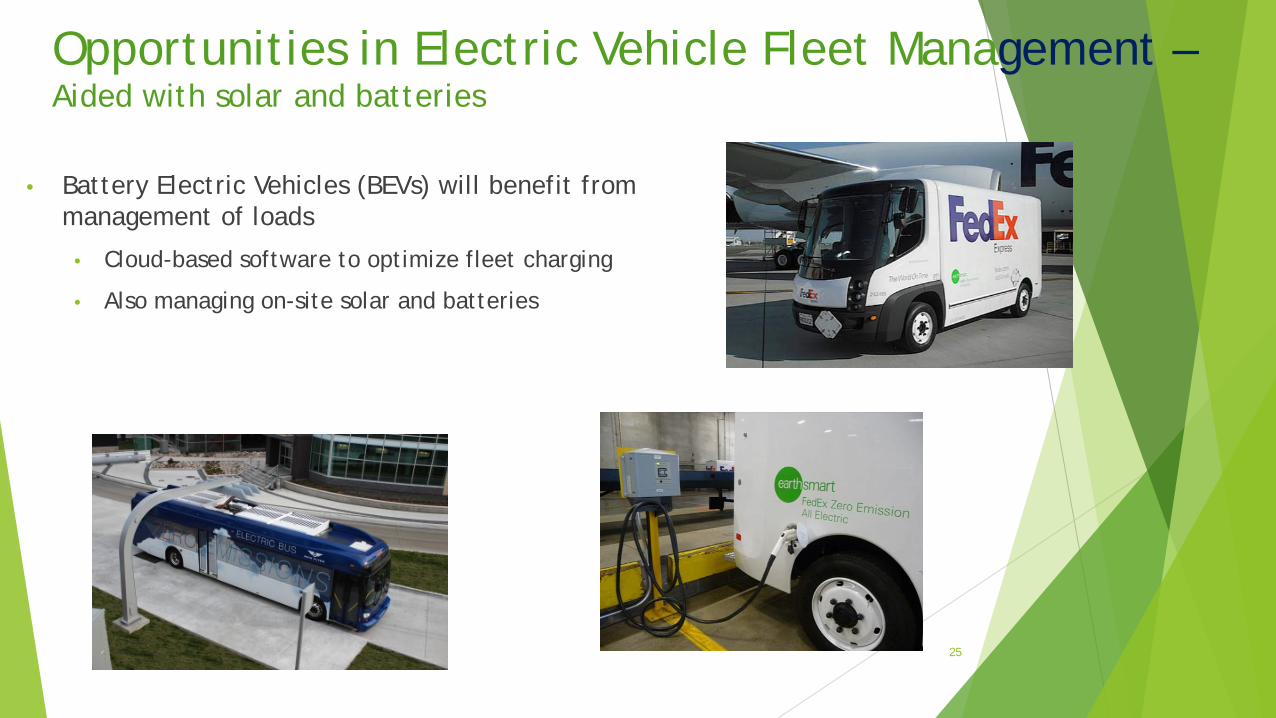
Opportunities in Electric Vehicle Fleet Management – Aided with solar and batteries
• Battery Electric Vehicles (BEVs) will benefit from management of loads
• Cloud-based software to optimize fleet charging
• Also managing on-site solar and batteries
25
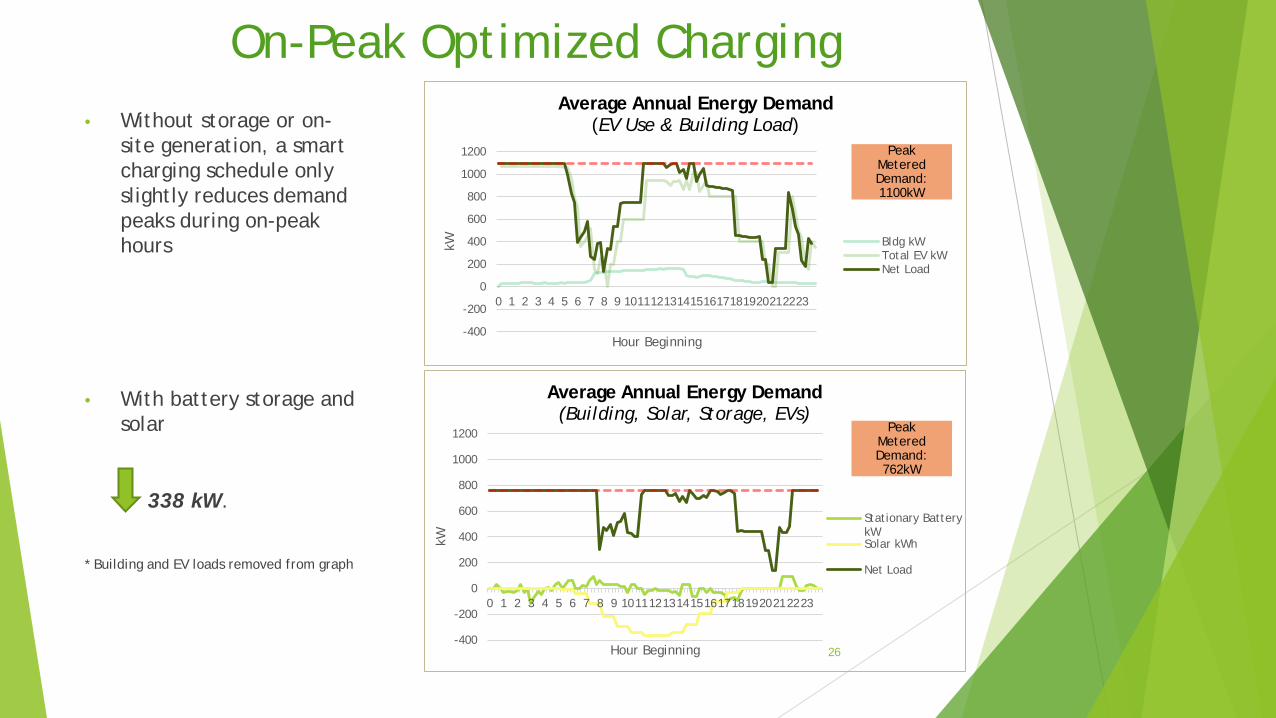
On-Peak Optimized Charging • Without storage or on-
site generation, a smart charging schedule only slightly reduces demand peaks during on-peak hours
• With battery storage and solar
338 kW.
* Building and EV loads removed from graph
26
Peak Metered Demand: 1100kW
Peak Metered Demand: 762kW
-400
-200
0
200
400
600
800
1000
1200
0 1 2 3 4 5 6 7 8 9 1011121314151617181920212223
kW
Hour Beginning
Average Annual Energy Demand (Building, Solar, Storage, EVs)
Stationary BatterykWSolar kWh
Net Load
-400
-200
0
200
400
600
800
1000
1200
0 1 2 3 4 5 6 7 8 9 1011121314151617181920212223
kW
Hour Beginning
Average Annual Energy Demand (EV Use & Building Load)
Bldg kWTotal EV kWNet Load
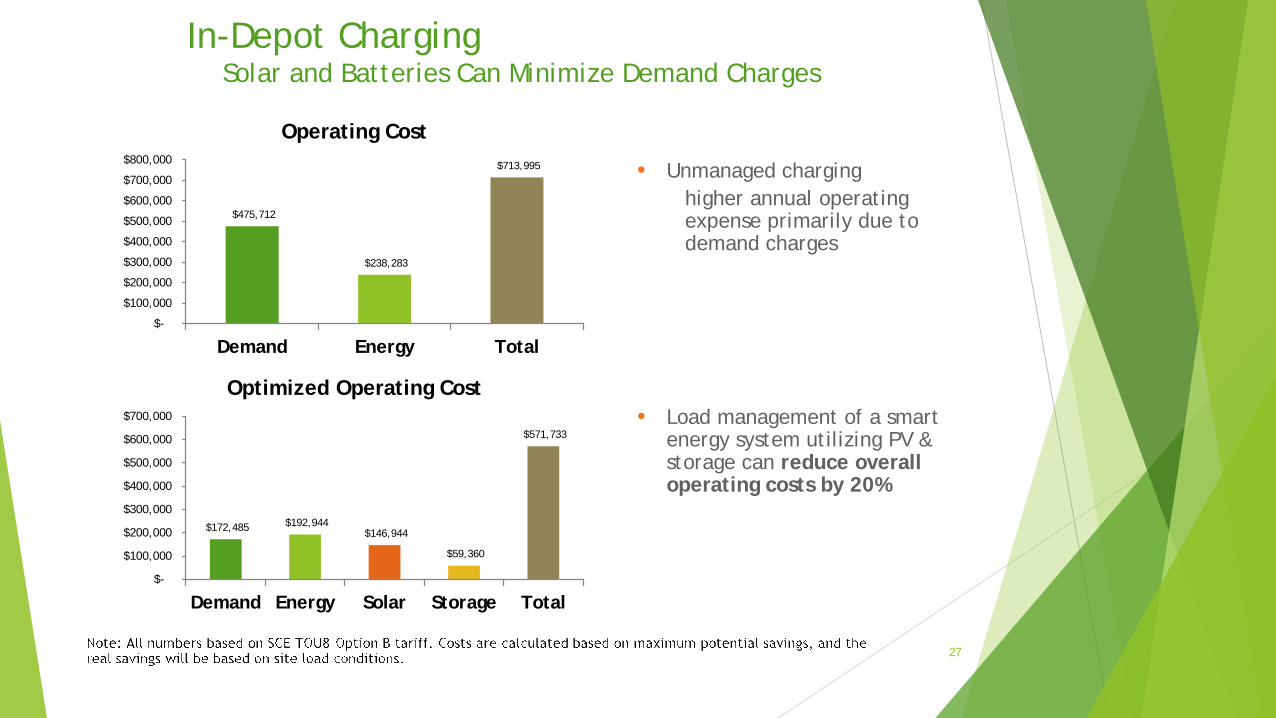
In-Depot Charging Solar and Batteries Can Minimize Demand Charges
27
• Unmanaged charging higher annual operating expense primarily due to demand charges
• Load management of a smart energy system utilizing PV & storage can reduce overall operating costs by 20%
$475,712
$238,283
$713,995
$-
$100,000
$200,000
$300,000
$400,000
$500,000
$600,000
$700,000
$800,000
Demand Energy Total
Operating Cost
$172,485 $192,944 $146,944
$59,360
$571,733
$-
$100,000
$200,000
$300,000
$400,000
$500,000
$600,000
$700,000
Demand Energy Solar Storage Total
Optimized Operating Cost
$0.00
$0.10
$0.20
$0.30
$0.40
$0.50
$0.60
$0.70
$0.80
$0.90
$1.00
Optimized Net Cost ($/mile)
Solar PV Opex
Battery Storage System OpEx
Charger Opex
Bus O&M
Meter Service Charge
Total Energy Charges(Includes LCFS Credits)Total Demand Charges
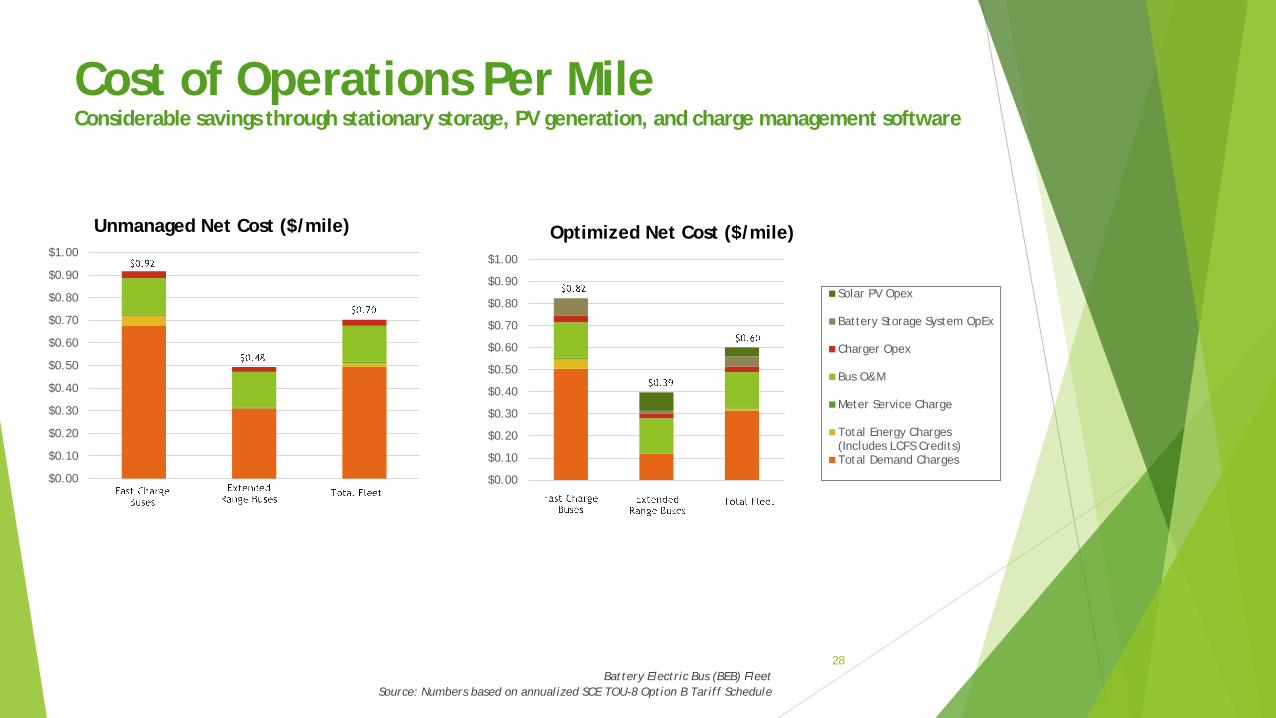
Cost of Operations Per Mile Considerable savings through stationary storage, PV generation, and charge management software
$0.00
$0.10
$0.20
$0.30
$0.40
$0.50
$0.60
$0.70
$0.80
$0.90
$1.00
Unmanaged Net Cost ($/mile)
Battery Electric Bus (BEB) Fleet Source: Numbers based on annualized SCE TOU-8 Option B Tariff Schedule
28
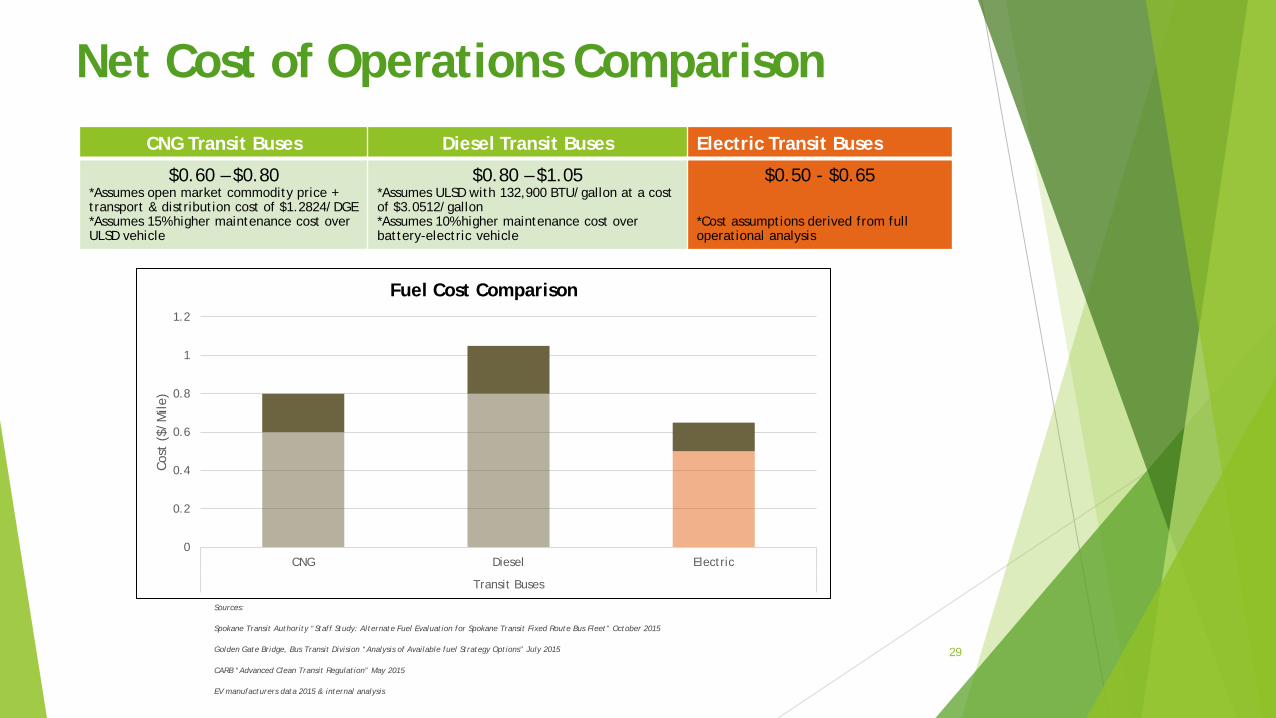
Net Cost of Operations Comparison
CNG Transit Buses Diesel Transit Buses Electric Transit Buses
$0.60 – $0.80 *Assumes open market commodity price + transport & distribution cost of $1.2824/DGE *Assumes 15% higher maintenance cost over ULSD vehicle
$0.80 – $1.05 *Assumes ULSD with 132,900 BTU/gallon at a cost of $3.0512/gallon *Assumes 10% higher maintenance cost over battery-electric vehicle
$0.50 - $0.65 *Cost assumptions derived from full operational analysis
Sources:
Spokane Transit Authority “Staff Study: Alternate Fuel Evaluation for Spokane Transit Fixed Route Bus Fleet” October 2015
Golden Gate Bridge, Bus Transit Division “Analysis of Available fuel Strategy Options” July 2015
CARB “Advanced Clean Transit Regulation” May 2015
EV manufacturers data 2015 & internal analysis
29
0
0.2
0.4
0.6
0.8
1
1.2
CNG Diesel Electric
Transit Buses
Cost
($/
Mile
)
Fuel Cost Comparison

Upgrade Deferral
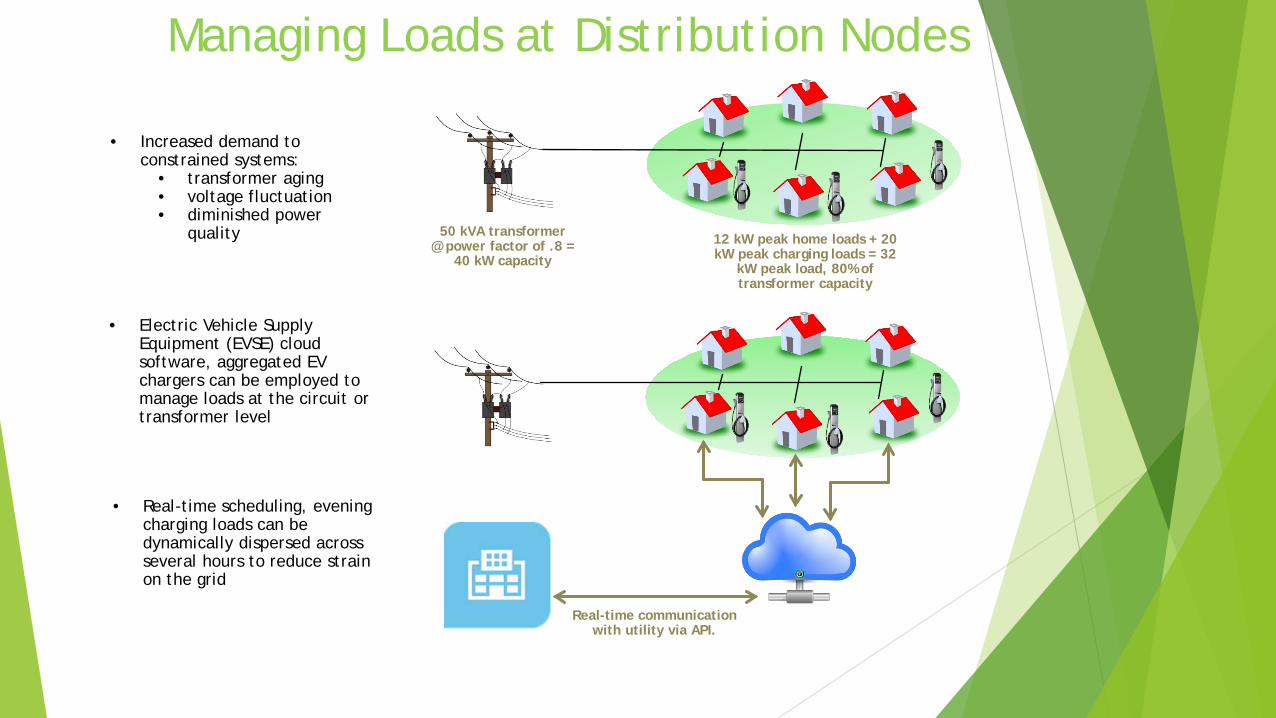
Managing Loads at Distribution Nodes
• Increased demand to constrained systems:
• transformer aging • voltage fluctuation • diminished power
quality
• Electric Vehicle Supply Equipment (EVSE) cloud software, aggregated EV chargers can be employed to manage loads at the circuit or transformer level
• Real-time scheduling, evening charging loads can be dynamically dispersed across several hours to reduce strain on the grid
50 kVA transformer @ power factor of .8 =
40 kW capacity
12 kW peak home loads + 20 kW peak charging loads = 32
kW peak load, 80% of transformer capacity
Real-time communication with utility via API.
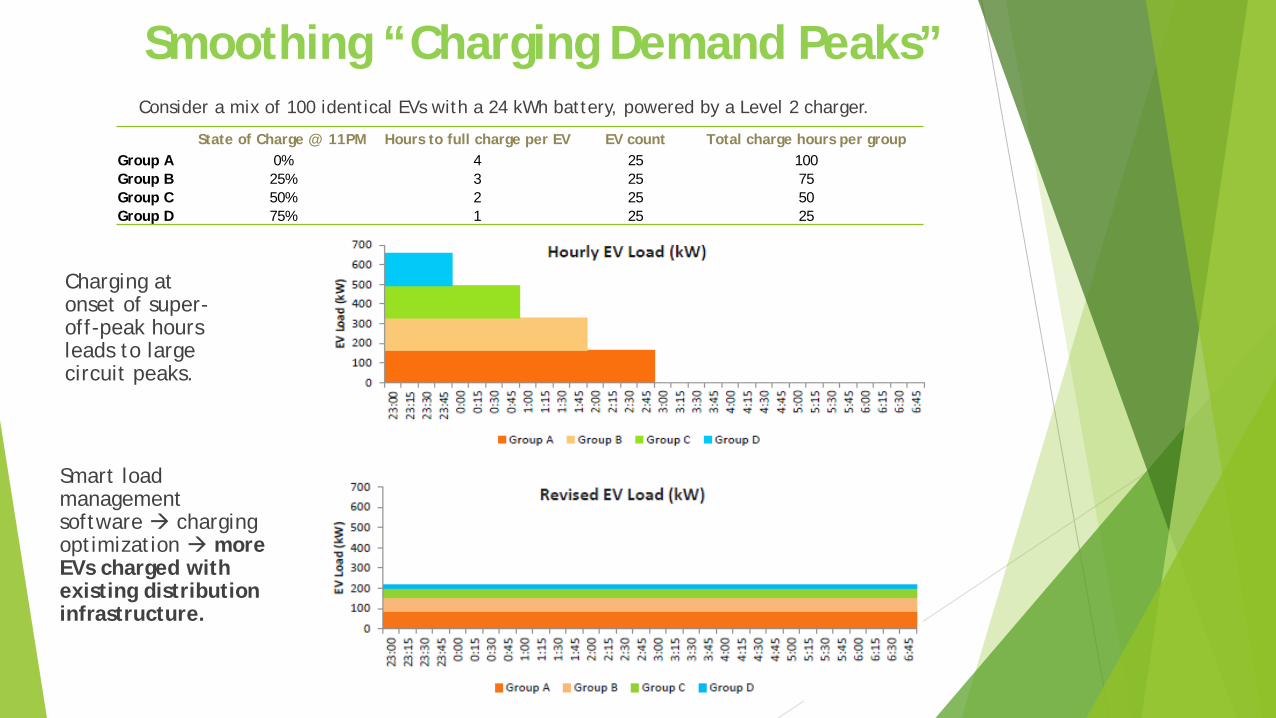
Consider a mix of 100 identical EVs with a 24 kWh battery, powered by a Level 2 charger.
Smoothing “Charging Demand Peaks”
State of Charge @ 11PM Hours to full charge per EV EV count Total charge hours per group Group A 0% 4 25 100 Group B 25% 3 25 75 Group C 50% 2 25 50 Group D 75% 1 25 25
Charging at onset of super-off-peak hours leads to large circuit peaks.
Smart load management software charging optimization more EVs charged with existing distribution infrastructure.
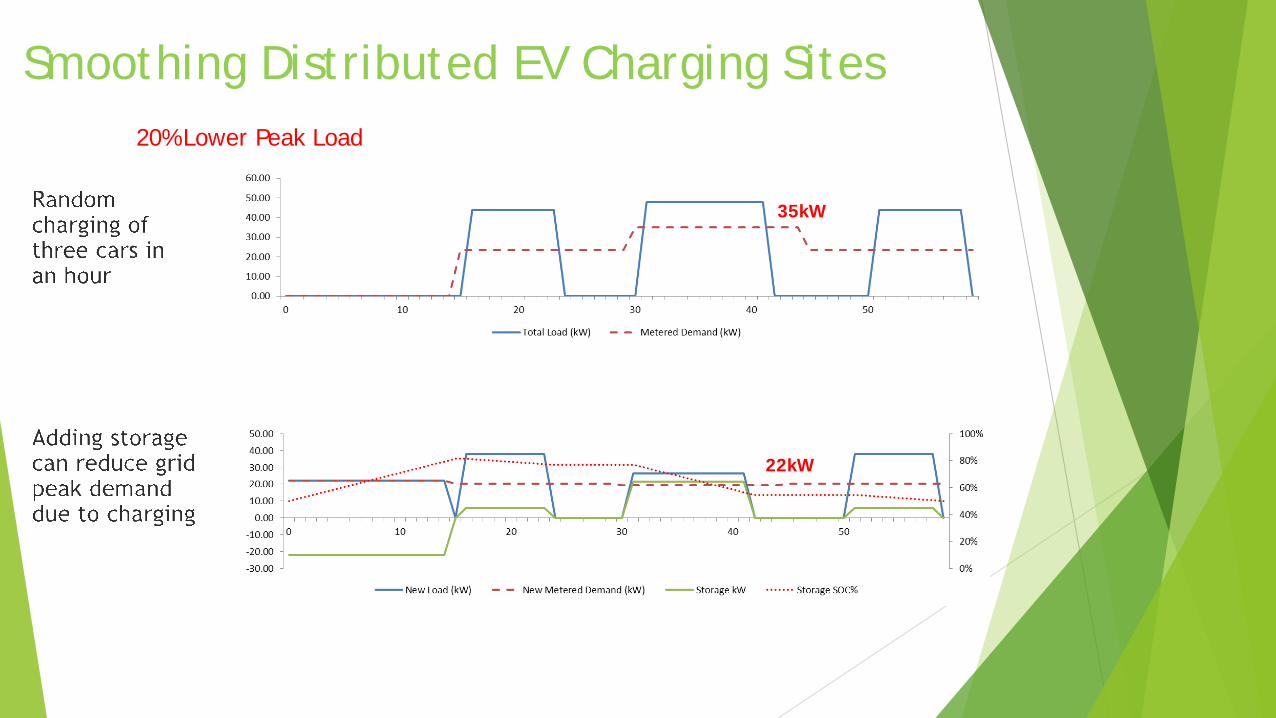
Smoothing Distributed EV Charging Sites
35kW
22kW
20% Lower Peak Load
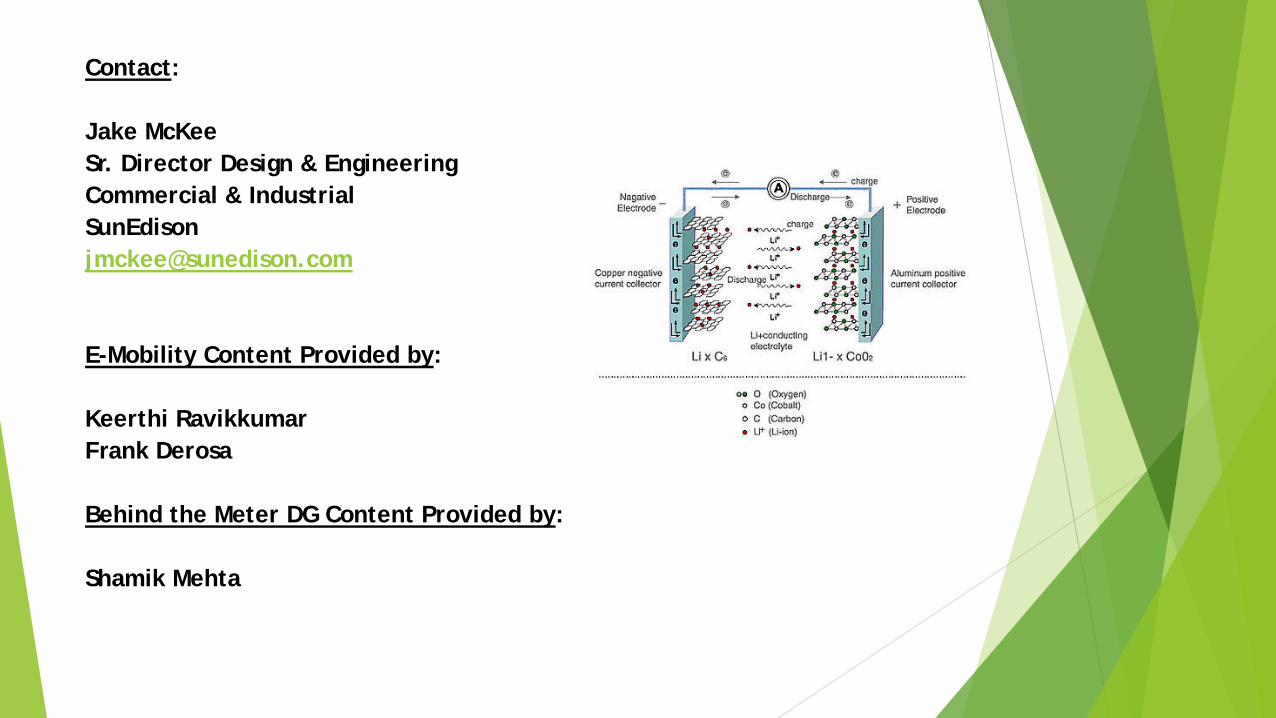
Contact: Jake McKee Sr. Director Design & Engineering Commercial & Industrial SunEdison [email protected] E-Mobility Content Provided by: Keerthi Ravikkumar Frank Derosa Behind the Meter DG Content Provided by: Shamik Mehta