Embed Size (px)
Citation preview

Soil Science Curriculum
South DakotaNatural Resources Conservation Service South Dakota FFA
January 2018
Table of Contents
Title # of Pages per Lesson
Lesson 1 Soil Components-Physical Properties 10Lesson 2 Soil Organic Matter 10Lesson 3 Using Textural Triangle 5Lesson 4 Soil Moisture by Feel and Appearance 9Lesson 5 Soil Quality Measurement 14Lesson 6 Soil Bulk Density 13Lesson 7 Soil Respiration 14Lesson 8 Soil Electrical Conductivity 12Lesson 9 Web Soil Survey 10Lesson 10 Soil pH: What Affects it, What it Affects, Managing it and Testing it 13Lesson 11 Soil Nitrogen 22Lesson 12 Soil Phosphorus 8Lesson 13 Soil Infiltration 10Lesson 14 Scientific Method 5Lesson 15 Soil Science Capstone Activity 4Lesson 16 Rainfall Simulator 9Lesson 17 Soil Microbiology – “Tighty Whities” Test 1Appendix A1-5Sponsors S1

Soil Science CurriculumContent and lab derived from the USDA-NRCS Guides for Educators. Go to www.nrcs.usda.gov/soils for the Guides and additional pictures and diagrams. This lesson plan was adapted for South Dakota from the University of Nebraska Institute of Agriculture and Natural Resources, CROPWATCH.
South DakotaNatural Resources Conservation Service South Dakota FFA
January 2018
Approximately 90 minutes
ObjectivesBy the end of the lesson, students will know or be able to:
• Define aggregate, the four components of soil (mineral matter, organic matter, air and water), and bulk density
• Describe the basic characteristics of the three soil textures – sand, silt and clay• Create models of seven soil structures – granular, platy, wedge, blocky sub-angular, blocky
angular, prismatic, and columnar• Explain factors that affect aggregate stability• List and explain factors that affect soil structure• Differentiate between soil structure and aggregate stability• Explain what causes soil color
Materials• Legos (10-15 per group of 4 students)• Canning jar or 24 oz. pop bottle (cleaned with label removed)• Soil sample• About 2 cups of water• 1 teaspoon of Borax• Blank paper to spread out soil sample• Permanent Marker• “Separating the Components of Soil” Lab Sheet – 1 per student• Guided Notes sheet – 1 per student• 3 jars• Handful of marbles • Handful of small beads• Approximately ½ cup of sugar• Clay or Play-doh• Pictures of various soils from around the world
Preparatory Work• Make necessary copies• Obtain necessary supplies• Review “Separating the Components of Soil” Lab
Components and Physical Properties of Soil
Components and Physical Properties of Soil
2
Provide the Experience – Definition and Description of Soil Characteristics and Components (Approximately 15 minute set up, 24 hour wait time, and 10 minute data collection and review)
Using the “Separating the Components of Soil Lab”, verbally discuss the steps of the lab. Have students prepare their soil sample and fill their jar. When they finish shaking the jars, place them in an area where they won’t be disturbed for at least 24 hours.
After 24 hours, have students carefully observe their samples, record data, and complete the discussion questions.
Note: This lab can be done in small groups rather than individually. Also, it is important that the jars are not disturbed during settling and observing.
Label the Information (Approximately 2 minutes)Instruct students to record the four components of soil and the basic characteristics of soil texture in their guided notes.
Sand: > 2mm Silt: .05-2.0mm Clay: <.05mm
The four components of soil include: mineral matter 45 percent, organic matter 5 percent, air 25 percent, and water 25 percent. Therefore, soil is 50 percent solid and 50 percent pore space.
Demonstrate the Relevance (Approximately 5 minutes)Pass around three jars: one containing marbles, another containing small beads, and the third sugar. Use this visual to facilitate discussion on particle size and pore space. Consider using the following discussion points:
• The larger the particle sizes of a soil, the larger the pore space. • The ration to soil and water will change with the dampness of soil. • Most soils are a mixture of many different sized particles. • What impacts particle size during soil formation?
Enroll the Participants (Approximately 7 minutes)Students will build a house with Legos. Divide the class into groups of four students and give each group a bag of 10-15 different Legos. Instruct the class to work with their group to build a house with their Legos in two minutes. After two minutes, guide the class through a discussion about similarities and differences in the houses. Relate these similarities and differences to soils components and properties.
Although each group made a house, they all are made up of different sizes, colors, design and shapes. Explain to your class that soil is just like these houses, it varies in shape, size, design, and color. In this lesson, students will gain and demonstrate an understanding of soils components and physical properties. Note: You could substitute children’s blocks, office supplies, or any variety of materials for the Legos in this activity.
Components and Physical Properties of Soil
3
Provide the Experience – Create Model of Seven Soil Structures, Explain Factors that Affect Aggregate Stability and Soil Structure, and Define Bulk Density(Approximately 10 minutes)
Show students a picture with the seven soil structures and provide each student with clay. Encourage students to select one type of soil structure and build a model, tell them not to discuss their model during construction. After a few minutes, as students complete their model, guide the class through a gallery walk of the different models. As students identify each other’s model, have them discuss each type of aggregate. Keep models intact to use throughout the class today.
Label the Information (Approximately 5 minutes)Encourage students to draw a diagram of each structure on their Guided Notes sheet.
Share with students the definition for soil structure, aggregates, and bulk density. Refer back to the clay models as appropriate.
• Soil structure is the way in which the individual particles (sand, silt, and clay) are arranged into larger distinct aggregates.
• Soil aggregates are groups of soil particles, often called peds, which bind together more strongly than to neighboring particles and can usually be separated easily.
• Bulk density is the weight of dry soil per unit volume (usually measured as grams/cubic centimeter)
Demonstrate the Relevance (Approximately 10 minutes)Discuss factors that affect soil structure and aggregate stability. Students should capture this in their Guided Notes.
Aggregate stability • Amount of clay • Chemical elements • Organic matter • Biological activity
Guide a discussion differentiating between soil structure and aggregate stability. Students should highlight this discussion in their notes using the Venn diagram. Consider using the following information to help facilitate discussion.
• All soil-forming factors, especially climate, influence the type of structure that develops within soil.
• Consider the definition of soil structure and aggregates.• How are aggregates and soil structure related?• Use models to demonstrate aggregate stability and soil structure.
Explain that there are many other differences in soil, including color.
Soil structure • Organic matter • Soil organisms • Tillage • Freezing and thawing • Water movement

Components and Physical Properties of Soil
4
Provide the Experience – Explain the Causes and Indications of Soil Color (Approximately 5 minutes)
Gather pictures of a variety of soils in several colors from around the world.
Examples: red desert sand in Arizona, gray desert sand in Nevada, white sand of New Mexico, black soil of the midwest, redbed soil in Oklahoma, yellow soil of the Yellow River beds in China, or green sand of Hawaii.
Show the students each picture and have them guess where each soil can be found.
With a partner, have the students discuss “What causes color differences in soil?” Have a few students share highlights from their discussion.
Thank students for their thoughts and participation.
Label the Information (Approximately 5 minutes)Instruct the students to write the two main causes of color in soil, humus content and iron compounds in their Guided Notes.
Also discuss and record the basic soil color indications:
• Indicator of different soil types• Indicator of certain physical and chemical characteristics• Due to humus content and chemical nature of the iron in the soil
Demonstrate the Relevance (Approximately 5 minutes)Show students the “Soil Organic Matter Color Chart” and explain its use for measuring soil organic matter. Preview the “Measuring the Organic Matter Lab” in the next lesson. Pass the chart around and encourage students to predict the amount of organic matter in area soils.
Review the Content (Approximately 10 minutes)Instruct the students to create a “Top 10 List of Components and Physical Properties of Soil”. Students should revisit their Guided Notes sheet to help them review information. You might consider having students work with partners or in small groups to encourage discussion. Have students share one item from each list.
Celebrate Student Success (Approximately 2 minutes)Thank students for their contributions to the class and describe how they can make more informed choices about soil management. If your students will participate in a Land Evaluation Competition, explain to them that their knowledge of components and physical properties of soil will help them differentiate soil horizons and determine soil texture and permeability.

Components and Physical Properties of Soil
5
Components and Physical Properties of Soil
6
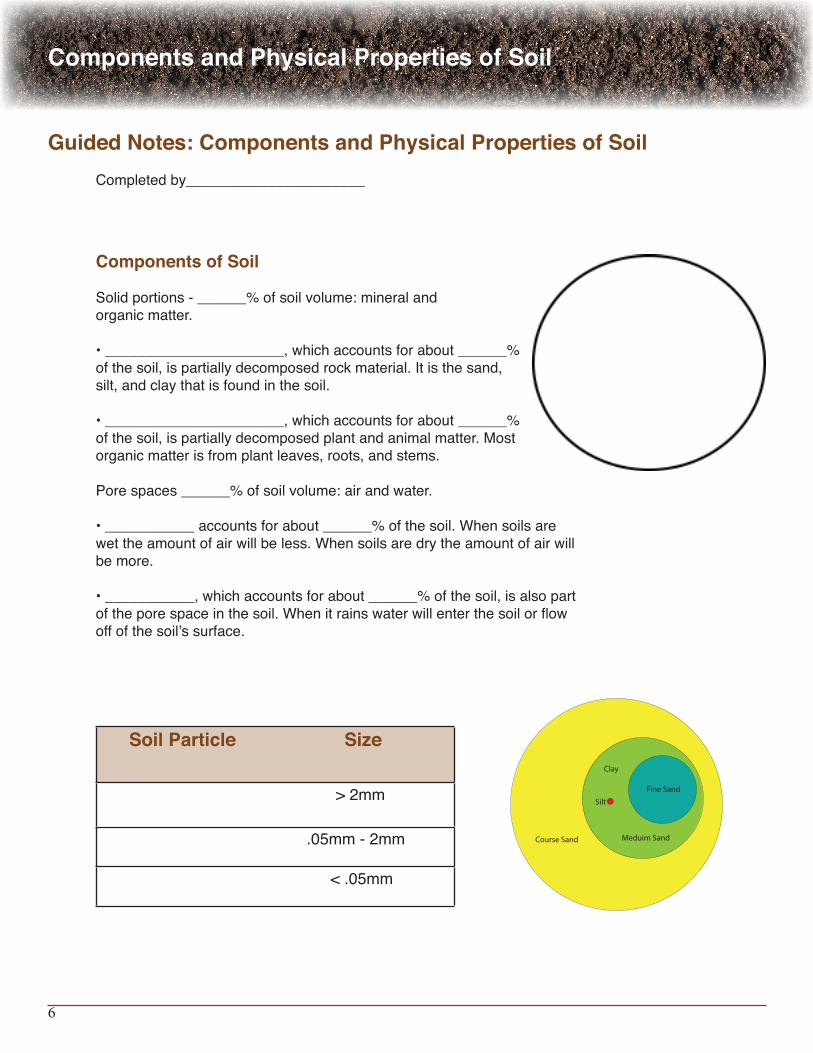
Soil Particle Size
> 2mm
.05mm - 2mm
< .05mm
Guided Notes: Components and Physical Properties of SoilCompleted by______________________
Components of Soil
Solid portions - ______% of soil volume: mineral and organic matter.
• ______________________, which accounts for about ______% of the soil, is partially decomposed rock material. It is the sand, silt, and clay that is found in the soil.
• ______________________, which accounts for about ______% of the soil, is partially decomposed plant and animal matter. Most organic matter is from plant leaves, roots, and stems.
Pore spaces ______% of soil volume: air and water.
• ___________ accounts for about ______% of the soil. When soils are wet the amount of air will be less. When soils are dry the amount of air will be more.
• ___________, which accounts for about ______% of the soil, is also part of the pore space in the soil. When it rains water will enter the soil or flow off of the soil’s surface.
Clay
Silt
Fine Sand
Meduim SandCourse Sand

Components and Physical Properties of Soil
7
Draw the Soil Structure:
Granular Platy Wedge
Blocky Sub-Angular Blocky Angular Prismatic
Columnar
Soil Structure
Soil Aggregates
Bulk Density

Components and Physical Properties of Soil
8
Causes of Soil Color
• __________________________ • __________________________
Soil Color Indications
• __________________________ • __________________________ • __________________________ • __________________________
Components and Physical Properties of Soil
9
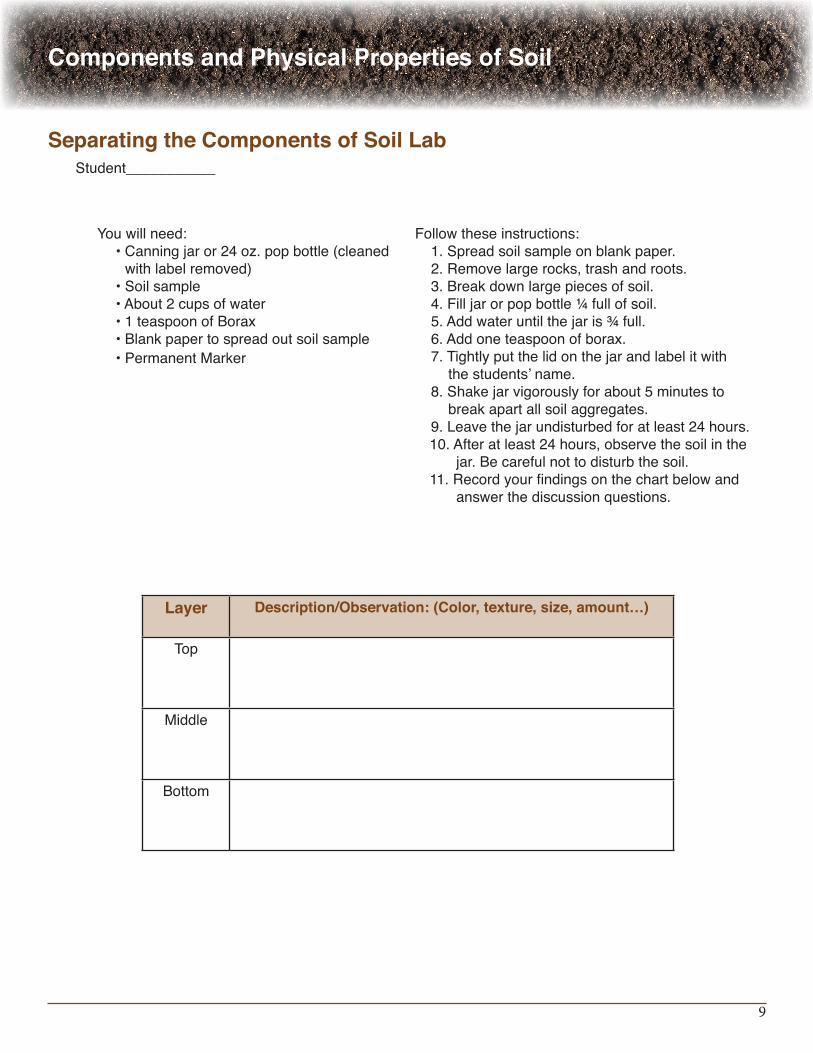
Separating the Components of Soil LabStudent___________
You will need: • Canning jar or 24 oz. pop bottle (cleaned
with label removed)• Soil sample• About 2 cups of water• 1 teaspoon of Borax• Blank paper to spread out soil sample• Permanent Marker
Follow these instructions:1. Spread soil sample on blank paper. 2. Remove large rocks, trash and roots.3. Break down large pieces of soil. 4. Fill jar or pop bottle ¼ full of soil.5. Add water until the jar is ¾ full.6. Add one teaspoon of borax.7. Tightly put the lid on the jar and label it with
the students’ name.8. Shake jar vigorously for about 5 minutes to
break apart all soil aggregates.9. Leave the jar undisturbed for at least 24 hours. 10. After at least 24 hours, observe the soil in the
jar. Be careful not to disturb the soil. 11. Record your findings on the chart below and
answer the discussion questions.
Layer Description/Observation: (Color, texture, size, amount…)
Top
Middle
Bottom
Components and Physical Properties of Soil
10
1. Describe the differences of all three layers.
2. Describe similarities of all three layers.
3. Compare your sample to other samples in the class.
4. Using what you know, what do you think is the makeup of each layer? Why? Top Layer:
Middle Layer:
Bottom Layer:
5. Why might some samples have more or less than three layers?
Using your observations answer the following discussion questions:

Soil Science CurriculumContent and lab derived from the USDA-NRCS Guides for Educators. Go to www.nrcs.usda.gov/soils for the Guides and additional pictures and diagrams. This lesson plan was adapted for South Dakota from the University of Nebraska Institute of Agriculture and Natural Resources, CROPWATCH.
South DakotaNatural Resources Conservation Service South Dakota FFA
January 2018
Approximately 90 minutes
ObjectivesBy the end of the lesson, students will know or be able to:
• Define soil organic matter• Explain the role of inherent factors affecting soil organic matter• Explain the five soil organic matter management practices• Explain how soil organic matter relates to soil function• Estimate organic material needed to increase soil organic matter• Measure soil organic matter
Materials• Dry erase markers• Soil samples high in organic matter• Clay or Play-Doh• Guided notes sheet – one per student• Soil Glue Lab sheet from NRCS – one per student• 2 wide mouthed jars• 2 pieces of ½-inch wire mesh • 2 clods of soil, each about the size of an egg from two different sites• Water• Poster making supplies• Measuring Soil Organic Matter lab – one per student• Soil Color Chart• Plastic bucket• Squirt bottle with water• 5 sheets of poster paper or flip charts• Markers
Preparatory Work• Make necessary copies• Obtain necessary supplies• Prepare five flip charts
Soil Organic Matter

Soil Organic Matter
2
Provide the Experience – Define Soil Organic Matter and Explain Roles of Inherent Factors Affecting Soil Organic Matter (Approximately 15 minutes)
Divide students into small groups and provide each group with a soil sample high in organic matter. Within their group, have the students collect observations for look, feel, and smell of the soil.
Note: Consider finding a soil sample with established vegetation that may have organic matter in various stages and visible living organisms.
After a few minutes, encourage students to share their observations with the class.
State that, in this lesson, the class will continue to explore soil organic matter.
Label the Information (Approximately 3 minutes)Instruct students to capture the definition of soil organic matter in their guided notes.
Soil organic matter is the organic component of soil, consisting of three parts:
• Plant residues and small living soil organisms • Actively decomposing matter • Humus, a stable organic matter
Also, guide students through factors affecting organic matter. Encourage students to capture this information in their guided notes page.
Demonstrate the Relevance (Approximately 5 minutes)Pass around three jars: one containing marbles, another containing small beads, and the third sugar. Use this visual to facilitate discussion on particle size and pore space. Consider using the following discussion points:
• The larger the particle sizes of a soil, the larger the pore space. • The larger the pore space, the more water will infiltrate and move through soil. • Most soils are a mixture of many different sized particles. • What impacts particle size during soil formation?
Enroll the Participants (Approximately 3 minutes)Write “Soil Organic Matter” on the board. As students walk into the classroom, greet them at the door with a dry erase marker. Instruct each student to write something they know about the phrase or a question they have on the board.
After all students have written on the board, review several of the responses with the class. Explain to the class that this lesson will investigate soil organic matter.

Soil Organic Matter
3
Provide the Experience – Create Model of Seven Soil Structures, Explain Factors that Affect Aggregate Stability and Soil Structure, and Definition of Bulk Density(Approximately 10 minutes)
Show students a picture with the seven soil structures and provide each student with clay or Play-Doh. Encourage students to select one type of soil structure and build a model, tell them not to discuss their model during construction. After a few minutes, as students complete their model, guide the class through a gallery walk of the different models. As students identify each other’s model, have them discuss each type of aggregate. Keep models intact to use throughout the class today.
Label the Information (Approximately 5 minutes)Encourage students to draw a diagram of each structure on their Guided Notes sheet.
Share with students the definition for soil structure, aggregates, and bulk density. Refer back to the clay models as appropriate.
• Soil structure is the naturally occuring arrangement of soil particles (sand, silt, and clay) into larger distinct units called peds through pedogenic processes.
• Soil aggregates are groups of soil particles, which bind together more strongly than to neighboring particles and can usually be separated easily along planes of weakness.
• Bulk density is the ratio of oven-dried soil (mass) to its bulk volume, which includes the volume of particles and the pore space between the particles.
Demonstrate the Relevance (Approximately 10 minutes)Discuss factors that affect soil structure and aggregate stability. Students should capture this in their Guided Notes.
Aggregate stability • Amount of clay • Chemical elements • Organic matter • Biological activity • Tillage
Guide a discussion differentiating between soil structure and aggregate stability. Students should highlight this discussion in their notes using the Venn diagram. Consider using the following information to help facilitate discussion.
• All soil-forming factors, especially climate, influence the type of structure that develops within soil.
• Consider the definition of soil structure and aggregates.• How are aggregates and soil structure related?• Use models to demonstrate aggregate stability and soil structure.
Explain that there are many other differences in soil, including color.
Soil structure • Organic matter • Water movement • Soil organisms • Chemical elements • Tillage • Freezing and thawing, wetting and drying

Soil Organic Matter
4
Provide the Experience – Explain the Causes and Indications of Soil Color (Approximately 5 minutes)
Gather pictures of a variety of soils in several colors from around the world.
Examples: red desert sands in Arizona, gray desert sands in Nevada, white sands of New Mexico, black soils of the mid-west, redbed soils in South Dakota, yellow soils of the Yellow River beds in China, or green sands of Hawaii.
Show the students each picture and have them guess where each soil can be found.
With a partner have the students discuss, “What causes color differences in soil?” Have a few students share highlights from their discussion.
Thank students for their thoughts and participation.
Factors affecting organic matter in soil:• Climate
- Organic matter decomposes more quickly in warm and humid climates than cool dry climates• Soil Texture
- Soil aeration: more oxygen in the soil speeds up the decomposition process • Vegetation
- Prairie soils have more organic material added to the soil than forest soils because of vegetation
Guide students through a short discussion on organic matter and its formation. Encourage students to describe the organic matter in the soil in your area. Use the following questions to guide your conversation:
• What type of vegetation creates organic matter in our area?• Compared to the rest of the country, does organic matter decompose more quickly or
slowly? Why?• How do animals impact organic matter in our area?• How is organic matter different in different soils, even in our town?
Conclude this conversation by having a discussion about why they believe organic matter is important to soils.
Demonstrate the Relevance (Approximately 5 minutes)
Demonstrate soil organic matter’s role in surface soil stability using the “Soil Glue” demonstration and have students complete the “Soil Glue – Student Exercise” with their thoughts and observations.
Provide the Experience - Management Practices and Organic Matter Related to Soil Function (Approximately 20 minutes)
Soil Organic Matter
5
While discussing management practices of soil organic matter, have students capture the following information in their Guided Notes.
• Use of conservation cropping systems- Diverse crop rotations, solid manure, high residue crops, grasses, or perennial plants
properly grazed or hayed help improve organic matter• Reducing or eliminating tillage
- Tillage exposes the organic matter to the air and can result in the lowering of stable organic matter
• Reduce erosion - When soil erodes organic matter goes with it
• Soil-test and fertilize properly- Proper fertilization encourages root growth for more organic matter in the soil
• Use of perennial forages- Provides for annual die back and regrowth of plants
Instruct students to list the benefits of organic matter as it relates to soil function:
• Nutrient Supply- As organisms decompose, nutrients are released in a plant usable form
• Water-Holding Capacity- Organic matter has the ability to hold up to 90 percent of its weight in water
• Soil Aggregation- Improved soil aggregation improves soil structure
• Erosion Prevention- Erosion is reduced because water infiltration and soil stability are increased
Explain how each benefit impacts soil function. Consider using the information above to help guide your instruction.
Label the Information (Approximately 5 minutes)
Demonstrate the Relevance (Approximately 20 minutes)Students will create an advertisement for soil organic matter. Explain to students that they have been hired by the National Soils Corporation to create a TV, radio, or magazine advertisement for the sale of organic matter. They have 10 minutes to use the materials provided to create their advertisement that will be shared with that class. Explain to students that they must include a definition or description of organic matter and at least three benefits organic matter has to soil. Divide the class in to groups of 3-4 students.
Note: Provide a variety of props for TV commercials and poster supplies for the magazine advertisement.
Allow students to present their advertisements to the class. After all groups have presented, thank the students for their engagement and willingness to share.

Soil Organic Matter
6
Demonstrate the Relevance (Approximately 5 minutes)Instruct students to complete the questions in the “Measuring Soil Organic Matter – Lab Sheet.” After a few minutes, briefly discuss these questions as a class.
Review the Content (Approximately 10 minutes)Prior to class place five posters/flip charts around the room labeled with: What is Organic Matter?, Factors that Affect Organic Matter, Management of Organic Matter, Benefits of Organic Matter, and Measuring Organic Matter.
Divide the class into five groups and assign one group to each flip chart. Give them one minute to write down as much as they can about that topic on their flip chart and then have them rotate and repeat at each flip chart. When they return to their original flip chart, instruct them to summarize all of the information on the chart and review the information to the class. Allow each group two minutes to summarize their information and 30 seconds to present to the class.
Thank each group as they finish presenting for their summarization.
Celebrate Student Success (Approximately 2 minutes)Thank students for their contributions and congratulate them for demonstrating their understanding of soil organic matter. Take a minute to preview the next lesson.
Provide the Experience – Measure Soil Organic Matter (time varies with number and location of samples)
Measuring Soil Organic Matter
Gather necessary materials and inform students you will be giving important instructions for measuring soil organic matter. Ask students to follow along in their “Measuring Soil Organic Matter – Lab Sheet”
At the conclusion of the laboratory exercise, instruct students to clean up and return materials to designated areas.
Note: Consider reviewing the NRCS Soils Video “Soil Organic Matter” to aid in this laboratory experience.
Label the Information (Approximately 3 minutes)Students will briefly describe the process of measuring soil organic matter using a soil color chart in their Guided Notes.

Soil Organic Matter
7

Soil Organic Matter
8
Guided Notes: Soil Organic Matter
Soil Organic Matter:
Factors Affecting Soil Organic Matter•
•
•
Soil Organic Matter Management•
•
•
•
•
Benefits of Soil Organic Matter•
•
•
The _________ __________ chart provides an estimate of the amount of organic matter in the soil.
Steps to measure soil organic matter:
1.
2.
3.
4.
Notes completed by _______________________

Soil Organic Matter
9
Measuring Soil Organic Matter – Laboratory (USDA-NRCS)
Completed by __________________
Materials Needed to Measure SoilOrganic Matter
____ Soil color chart for estimating organic matter
____ Plastic bucket and probe for gathering and mixing soil samples
____ Squirt bottle with water (to moisten soil if dry)
____ Pen, field notebook, sharpie, and zip lock bags (for labeling soil samples taken back to the classroom)
Considerations – Soil organic matter typically is measured in a lab. The University of Illinois soil color chart provides an estimate of the amount of soil organic matter in mineral soils formed under grass, as many soils are in the Midwest and other natural grassland regions around the world. It can be used for other soils, but is not as accurate. Please read color chart instructions for details and other considerations. Other accepted methods to estimate organic matter such as color charts for other types of soils, lab testing, or tools can be used.
In-field Estimate for Soil Organic Matter(refer to color chart for more guidance)
1. Soil Sampling: Soil organic matter is highly variable. At least 10 small samples are gathered randomly from an area that represents the soil type and management history from the surface 0-6 inch depth and placed in the small plastic bucket and mixed. You may also estimate organic matter at each sample site and average organic matter readings for the area you are assessing. Repeat for each sampling area.
2. Use moist soil. If the sample is dry moisten it.
3. Match the soil with the color that it most closely matches (Figure 3) organic matter color chart (or other method of estimating organic matter content). Record associated organic matter content in Table 3 and complete calculations in interpretations section of this document (suggest averaging several samples).
Figure 3. Soil color chart (Munsell.com).

Soil Organic Matter
10
1. What is organic matter?
2. What visible types of organic matter did you observe in your samples?
3. How does color help determine soil organic matter?
4. What predictions do you have for the future organic matter of the soil in your sampled area? Why?
5. Why is organic matter important to the soil you sampled?

Soil Science CurriculumContent and lab derived from the USDA-NRCS Guides for Educators. Go to www.nrcs.usda.gov/soils for the Guides and additional pictures and diagrams. This lesson plan was adapted for South Dakota from the University of Nebraska Institute of Agriculture and Natural Resources, CROPWATCH.
South DakotaNatural Resources Conservation Service South Dakota FFA
January 2018
Approximately 45 minutes
ObjectiveBy the end of the lesson, students will know or be able to:
• Use the soil textural triangle to distinguish between different types of soil
Materials• Soil Textural Triangle• Guided Notes Page – one per student• Guided Practice Page – one per student• Answer key for teachers• Three rulers or straight edges
Preparatory Work• Make necessary copies• Review soil textural triangle use
Using Soil Textural Triangle
Enroll the Participants - Use the Soil Textural Triangle to Distinguish between Different Types of Soil (Approximately 3 minutes)
Show a large picture of a Soil Textural Triangle to the class or give each student their own copy of the triangle. Ask if anyone has seen this before or how they believe it’s used. Accept all answers until someone can identify it as a textural triangle used for determining soil texture.
Definition of Soil TextureThe weight proportion of the soil seperates less than 2.0 mm in size (sand, silt and clay). Or, more commonly, the relative proportions of sand, silt and clay:Sand = 2.0 to 0.05 mmSilt = 0.05 to 0.002 mmClay = <0.002 mmSand, silt and clay in various proportions make up 12 soil texture classes

Using Soil Textural Triangle
2
Provide the Experience (Approximately 5 minutes)Write the sample problem below on the board. Encourage students to work in small groups to determine the appropriate soil textural class. Allow groups to work together to solve the problem, wait until each group has determined the correct soil textural class.
Sample Problem: 75% Sand 15% Silt 10% Clay
Answer: Sandy Loam
Congratulate students for their success in using the soil textural triangle.
Label the Information (Approximately 10 minutes)After each group has successfully identified the soil textural class, explain to students that they will be writing a “How-to Guide” for this tool. In small groups, encourage students to write step by step instructions for using the soil textural triangle to accurately determine soil textural classes. After about five minutes, invite one group to share their “Soil Textural Triangle How-to Guide” with the class.Encourage each student to capture these instructions in their own words on their Guided Notes page.
Demonstrate the Relevance (Time varies with students)Encourage students to work through the practice problems on the Guided Practice sheet. While students are practicing, move through the room offering support and encouragement to students that may find some challenges.
Review the Content (Time varies with each group)When the majority of the class is finished, go through the problems as a group and check for understanding. Consider having each student provide an answer to ensure all students have grasped the material.
Celebrate Student Success (Approximately 2 minutes)Thank students for their hard work and focus while demonstrating the use of a soil textural triangle. Congratulate students on their ability to determine appropriate soil textural classes as this is important in crop production, landscaping, and even construction. Explain that they will use this information as they determine soil texture and permeability in the land judging competition.

Using Soil Textural Triangle
3
Guided Notes: Soil Textural TriangleNotes completed by _______________________
Soil Textural Triangle How-To Guide:

Using Soil Textural Triangle
4
Guided Practice: Soil Textural TriangleCompleted by ______________
Determine the appropriate soil textural class using the soil textural triangle for each problem below:
1. 40% Sand 50% Silt 10% Clay
2. 70% Sand 15% Silt 15% Clay
3. 35% Sand 15% Silt 50% Clay
4. 20% Sand 60% Silt 20% Clay
5. 30% Sand 40% Silt 30% Clay
6. Complete the chart using the soil textural triangle.
7. Which soil textural class do you believe is best for growing plants? Why?
% Sand % Silt % Clay Texture
5 50
27 35
31 33
22 23
10 7
7 23
Using Soil Textural Triangle
5
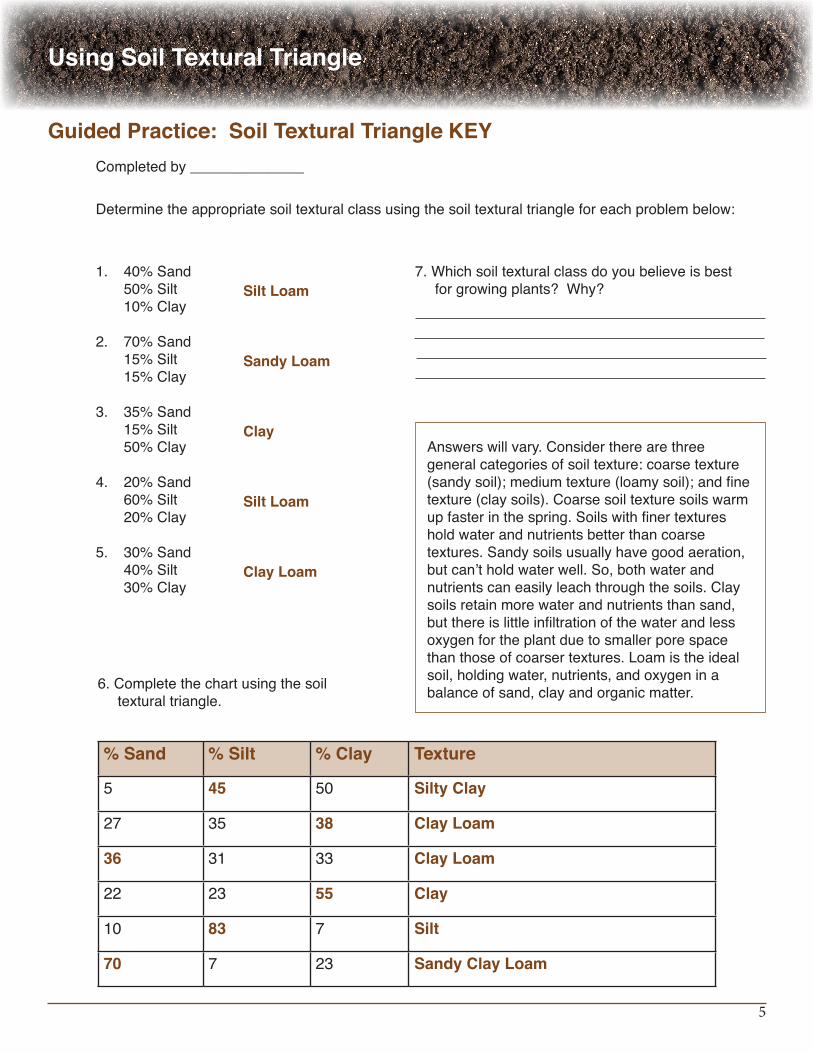
Guided Practice: Soil Textural Triangle KEYCompleted by ______________
Determine the appropriate soil textural class using the soil textural triangle for each problem below:
1. 40% Sand 50% Silt 10% Clay
2. 70% Sand 15% Silt 15% Clay
3. 35% Sand 15% Silt 50% Clay
4. 20% Sand 60% Silt 20% Clay
5. 30% Sand 40% Silt 30% Clay
% Sand % Silt % Clay Texture
5 45 50 Silty Clay
27 35 38 Clay Loam
36 31 33 Clay Loam
22 23 55 Clay
10 83 7 Silt
70 7 23 Sandy Clay Loam
6. Complete the chart using the soil textural triangle.
Silt Loam
Sandy Loam
Clay
Silt Loam
Clay Loam
7. Which soil textural class do you believe is best for growing plants? Why?
Answers will vary. Consider there are three general categories of soil texture: coarse texture (sandy soil); medium texture (loamy soil); and fine texture (clay soils). Coarse soil texture soils warm up faster in the spring. Soils with finer textures hold water and nutrients better than coarse textures. Sandy soils usually have good aeration, but can’t hold water well. So, both water and nutrients can easily leach through the soils. Clay soils retain more water and nutrients than sand, but there is little infiltration of the water and less oxygen for the plant due to smaller pore space than those of coarser textures. Loam is the ideal soil, holding water, nutrients, and oxygen in a balance of sand, clay and organic matter.
Soil Science CurriculumContent and lab derived from the USDA-NRCS Guides for Educators. Go to www.nrcs.usda.gov/soils for the Guides and additional pictures and diagrams. This lesson plan was adapted for South Dakota from the University of Nebraska Institute of Agriculture and Natural Resources, CROPWATCH.
South DakotaNatural Resources Conservation Service South Dakota FFA
January 2018
Approximately 90 minutes
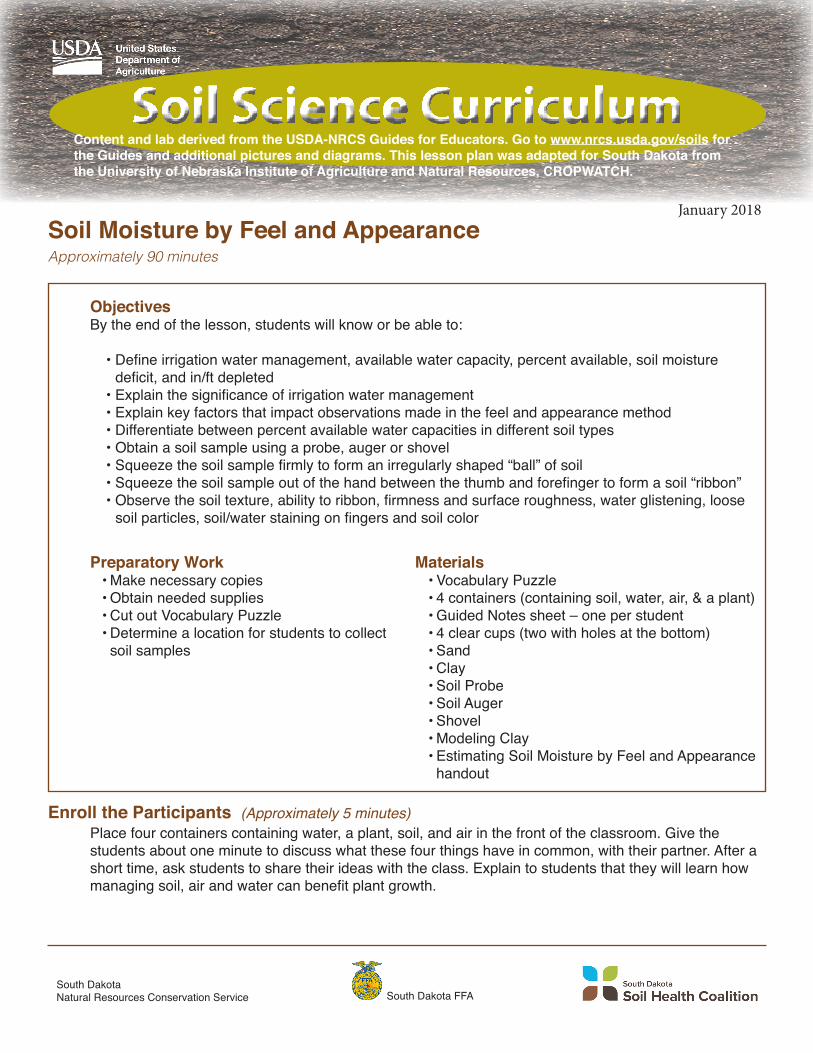
ObjectivesBy the end of the lesson, students will know or be able to:
• Define irrigation water management, available water capacity, percent available, soil moisture deficit, and in/ft depleted
• Explain the significance of irrigation water management• Explain key factors that impact observations made in the feel and appearance method• Differentiate between percent available water capacities in different soil types• Obtain a soil sample using a probe, auger or shovel• Squeeze the soil sample firmly to form an irregularly shaped “ball” of soil• Squeeze the soil sample out of the hand between the thumb and forefinger to form a soil “ribbon”• Observe the soil texture, ability to ribbon, firmness and surface roughness, water glistening, loose
soil particles, soil/water staining on fingers and soil color
Materials• Vocabulary Puzzle• 4 containers (containing soil, water, air, & a plant)• Guided Notes sheet – one per student• 4 clear cups (two with holes at the bottom)• Sand• Clay• Soil Probe• Soil Auger• Shovel• Modeling Clay• Estimating Soil Moisture by Feel and Appearance handout
Preparatory Work• Make necessary copies• Obtain needed supplies• Cut out Vocabulary Puzzle• Determine a location for students to collect soil samples
Enroll the Participants (Approximately 5 minutes)Place four containers containing water, a plant, soil, and air in the front of the classroom. Give the students about one minute to discuss what these four things have in common, with their partner. After a short time, ask students to share their ideas with the class. Explain to students that they will learn how managing soil, air and water can benefit plant growth.
Soil Moisture by Feel and Appearance

Soil Moisture by Feel and Appearance
2
Demonstrate the Relevance (Approximately 2 minutes)Explain to students that these terms will be key throughout this lesson so it is important to have a basic understanding to be built upon later.
Provide the Experience – Explain the Significance of Irrigation Water Management (Approximately 5 minutes)
Lead a brief discussion on irrigation and water usage. Consider discussing management of the High Plains Aquifer, the recent drought, or local irrigation water issues.
Pose the question to students, “Why is it important to manage irrigation water?” Look for answers such as water conservation, cost of water, sustainability, benefits to crops, use by other agronomic inputs, etc.
Label the Information (Approximately 5 minutes)Encourage students to record the significance of irrigation water management in their guided notes. Guide them through a brief conversation about each of these points as they are review the information.
Determine: • How much water is available for plant use • When irrigation should be used • How much irrigation water needs to be applied • How to conserve irrigation water
Provide the Experience – Define Irrigation Water Management, Available Water Capacity, Percent Available, Soil Moisture Deficit, and in/ft Depleted (Approximately 35minutes)
Vocabulary Puzzle: Cut the vocabulary puzzles into enough pieces so each student has once piece.
Randomly hand out a puzzle piece to each student. Instruct students to find the other students with pieces to their puzzle and assemble their key word. Once each puzzle is assembled, instruct students to become familiar with the definition on their puzzle. Have each group share their vocabulary term and its definition with the class.
Label the Information (Approximately 3 minutes)Instruct students to capture the definitions of each of the following terms in their Guided Notes sheet.
• Irrigation water management: applying water according to crop needs in an amount that can be stored in the plant root zone of the soil
• Available water capacity: the amount of water that a soil can store that is available for use by plants• Percent available: currently available soil moisture as a percent of available water capacity• Soil moisture deficit: the amount of water in a soil that can be readily absorbed by plant roots of most crops
• in/ft depleted: inches of water currently needed to refill a foot of soil to field capacity

Soil Moisture by Feel and Appearance
3
Demonstrate the Relevance (Time varies)Guide the students through a class discussion on irrigation water management. Elicit personal experiences about irrigation water management from the students. These could be related to production agriculture, a flower or vegetable garden, or even turf grass in their yard.
Provide the Experience – Differentiate between Percent Available Water Capacities in Different Soil Types (Approximately 5 minutes)
Poke several small holes in the bottom of two clear cups. Fill one cup about half way with sandy soil and the other with clayey soil. Place each cup over another cup or container to catch draining water. Add equal amounts of water to each cup of soil and observe. Encourage students to watch the water as it percolates, or filters through the soil. After a few minutes, measure the amount of water in the bottom containers.
Note: This could also be demonstrated with several different sponges with a variety of pore sizes. Determine how much water each sponge can hold and compare the results.
Label the InformationInstruct students to record their observations in their Guided Notes sheet.
Soil Texture
PercolationSpeed
Water incup
Water on top of the sample
Notes
Sandy Soil
Clayey Soil
Demonstrate the Relevance (Approximately 5 minutes)Encourage students to complete the review questions for this demonstration in their Guided Notes with a partner. After a few minutes, guide the class through a discussion of their answers.
• What are the differences in filtration of sand and clay? • Why do these differences exist (consider pore space)? • How does this demonstration relate to available water capacity?
Provide the Experience – Obtain a Soil Sample (Approximately 2 minutes)Show students a soil probe, auger, and a shovel. Ask students what these tools are used for. Look for the answer “collecting soil samples.”

Soil Moisture by Feel and Appearance
4
Label the Information (Approximately 5 minutes)Introduce students to each of these tools and briefly explain how each tool is used. Encourage students to draw a picture of the tool and a description in their Guided Notes. Consider demonstrating proper use of each tool.
Demonstrate the Relevance (Time varies)Allow students to collect soil samples that will be used later in the lesson using a shovel, auger, and soil probe. Encourage students to use each tool and collect samples at various locations and at various depths. Instruct students to place their sample in a bucket or bag and label with the location of the sample.
Give each student a small portion of modeling clay or play-doh and have them follow along as you demonstrate the process of estimating soil moisture and texture by feel and appearance.
1. Squeeze the sample firmly in your hand several times to form an irregular shaped “ball”.2. Squeeze the soil sample out or your hand between thumb and forefinger to form a ribbon.3. Observe texture, ability to ribbon, firmness and surface roughness of ball, water glistening, loose
soil particles, soil/water staining on fingers, and soil color.
Allow students to practice this process with the clay several times. Observe individual students and offer guidance through this process.
Provide the Experience – Estimate Soil Moisture and Texture by Feel and Appearance and Explain Key Factors that Impact Observations (Approximately 10 minutes)
Label the Information (Approximately 5 minutes)Instruct students to write the step by step instructions for estimating soil moisture and texture by feel and appearance in their Guided Notes.
Also discuss and encourage students to record key factors that impact observations made in the feel and appearance method:
• Rock fragments• Organic matter• Bulk density
Demonstrate the Relevance (Time Varies)Using the collected soil samples, instruct students to test various soils for soil texture and soil moisture.
Guide students through the “Texture by Feel Procedure” graphic to determine soil texture. Encourage students to work with a partner using the same soil to determine soil texture.
Using the “Estimating Soil Moisture by Feel and Appearance” guide, encourage students to work with a partner and several soil samples to determine the available water capacity.
Soil Moisture by Feel and Appearance
5
Review the Content (Approximately 5 minutes)Instruct students to complete the “Learned what? So what? Now what?” chart in their Guided Notes. After a few minutes allow students to work in small groups to add to their chart. As students are working, listen to their conversations and select a few a key concepts being discussed and ask those students to share their information aloud with the group.
Celebrate Student Success (Approximately 2 minutes)Thank students for their participation and willingness to get dirty to discover more about soil. Congratulate students on their ability to collect soil samples, and determine soil texture and soil moisture by feel and appearance. Explain that this skill will be important in the land evaluation competition to identify soil texture and permeability.
Take a few minutes to preview the next lesson.

Soil Moisture by Feel and Appearance
6
1. Irrigation water management:
Available water capacity:
Percent available:
Soil moisture deficit:
in/ft depleted:
2. Why is irrigation water management important?
Guided Notes: Soil Moisture by Feel and Appearance?Notes Completed by:____________________________
Soil Texture
PercolationSpeed
Water incup
Water on top of soil sample
Notes
Sand
Clay
3. Percent Available Water Capacity
Soil Moisture by Feel and Appearance
7
4. Collecting a Soil Sample:
What are the differences in filtration of sand and clay?
Why do these differences exist (consider pore space)?
How does this demonstration relate to available water capacity?
Soil Probe
Soil Auger
Shovel
5. Feel and Texture Method:
1.
2.
3.

Soil Moisture by Feel and Appearance
8
Factors that Impact Observations in Feel and Texture Method:
Soil Texture by Feel Procedure
Place approximately 25 g soil in palm. Add water dropwise and kneed the soil to break down all aggregates. Soil is at the proper
consistency when plastic and moldable, like most putty.
Start
Add dry soil to soak up water
Does soil remain in a ball when squeezed? Is soil too dry? Is soil too wet? Sand
yes yes
no no no
Place ball of soil between thumb and forefinger, gently pushing the soil with the thumb, sqeezing it upward into a ribbon. Form a ribbon of uniform thickness and width. Allow the ribbon to emerge and
extend over the forefinger, breaking from its own weight.
LoamySand
Does soil form ribbon?
yes
Does soil make a weakribbon less than 2.5 cmlong before breaking?
Does soil make a mediumribbon 2.5-5 cm long
before breaking?
Does soil make a strongribbon 5 cm or longer
before breaking?
yes
no no
no
yes yes
Excessively wet a small pinch of soil in palm and rub with forefinger.
Does soil feelvery gritty
Does soil feelvery gritty
Does soil feelvery gritty
Does soil feelvery smooth
Does soil feelvery smooth
Does soil feelvery smooth
Neithergrittiness norsmoothness
predominates
Neithergrittiness norsmoothness
predominates
Neithergrittiness norsmoothness
predominates
SandyLoam
SandyClayLoam
SandyClay
SiltLoam
SiltyClayLoam
SiltyClay
Loam ClayLoam Clay
yes
yes
yes
yes
yes yes
yes
yesyes
no
no
no
nono
no
yes

Soil Moisture by Feel and Appearance
9
Vocabulary Puzzle: Cut out each box. Then, cut each box into pieces so there are enough pieces for each student to have one piece. Example if there are 25 students in class cut each box into five pieces for a total of 25 puzzle pieces.
Irrigation water management: is applying water according to crop needs in an amount that can be stored
in the plant root zone of the soil.
Available water capacity: is the amount of water that a soil can store that is available for use by plants
Percent available: currently available soil moisture as a percent of available water capacity
Soil moisture deficit: is the amount of water in a soil that can be readily absorbed by plant roots of most crops
in/ft depleted: inches of water currently needed to refill a foot of soil to field capacity

Soil Science CurriculumContent and lab derived from the USDA-NRCS Guides for Educators. Go to www.nrcs.usda.gov/soils for the Guides and additional pictures and diagrams. This lesson plan was adapted for South Dakota from the University of Nebraska Institute of Agriculture and Natural Resources, CROPWATCH.
South DakotaNatural Resources Conservation Service South Dakota FFA
January 2018
Approximately 180 minutes
ObjectivesBy the end of the lesson, students will know or be able to:
• Define soil health, soil series, and erosion• Describe two methods to assess soil health• Create a model that represents signs of erosion• List and describe causes of erosion• Explain the role of soil management in
determining soil health• Determine percent slope of a specific land area• Explain how climate impacts soil• Explain how longitude and latitude impact soil• Identify environmentally sensitive areas• Determine when to properly sample soil• Determine where to sample soil• Explain the guidelines for selecting
sampling sites• Explain the need for collecting multiple samples• Use the South Dakota Soil Health Card
Materials• 4 Soil Samples• Guided Notes Page – one per student• 2 Balls• Several marking flags• Shovel• Soil probe• Plastic bags• Markers• South Dakota Soil Health Card – one per student
Preparatory Work• Make necessary copies• Obtain necessary supplies• Review South Dakota Soil Health Card• Determine where Building a Soil Erosion Model Activity will be completed to plan accordingly with time and supplies
• Determine where soil samples will be taken, where soil health will be measured, and the location of slope measuring
Enroll the Participants (Approximately 5 minutes)Present four very different soil samples to the class. Have them individually rank the samples best to worse. Discuss students’ rankings of the soil samples.
• Why did you rank 1 before 2, 2 over 3, and 3 over 4? • Why is student A’s ranking so different from student B? • Are some soils really better than others?
Soil Health Measurement

Soil Health Measurement
2
Demonstrate the Relevance (Approximately 5 minutes)Lead students through a discussion about soil health. Consider using the following questions to help guide the discussion:
• Why is soil health important?• Who monitors soil health?• What factors affect soil health?• How is soil health assessed?
Provide the Experience – Describe the Role of Soil Management, how Climate, Longitude and Latitude Impact Soil, and Identify Environmentally Sensitive Areas (Approximately 5 minutes)
When going to the doctor, before a diagnosis can be made patients must provide doctors with important information. Ask students what this information is called. Answer: medical history. Lead the class in a brief discussion on medical history.
• What is included in a medical history? • Why is this important to doctors?
Just as doctors need a medical history for diagnosing people, soil scientists need information about a site before recommendations can be made.
Provide the Experience – Soil Health and Health Assessment (Approximately 5 minutes)Instruct students to work as a class to brainstorm a list of characteristics of “good soil”. Allow the class a few minutes and discuss their list. After a short discussion inform students that this lesson will allow them to identify and measure soil health.
Label the Information (Approximately 2 minutes)Instruct students to capture the definition of soil health and two methods of assessment.
Soil health integrates the physical, chemical, and biological components of soil and their interactions.
There are two fundamental ways to assess soil health:
• Take measurements periodically over time to monitor changes or trends in soil health • Compare measured values to a standard or reference soil condition

Soil Health Measurement
3
Label the Information (Approximately 10 minutes)Instruct students to complete the graphic organizer about field or site characterization using the following information:
Field or site characterization is important information for evaluating soil health.
Soil series is the name of soil found in the county soil survey.
Signs of erosion include gullies, rills, development of pedestals, exposed areas of subsoil, wind damage or plants.
Management history includes a description of past and present land and crop management; kind, amount and method of fertilization; prior tillage; and land leveling.
Slope and topography includes percent slope at sampling sites and note any hills, knolls, ridges, potholes, depressions, etc.
Location of field includes a record of longitude and latitude.
Climatic information includes the precipitation and high and low average temperatures for each month.
Location of environmentally sensitive areas includes location of ponds, creeks, wetlands, or other environmentally fragile sites.
Demonstrate the Relevance (Approximately 10 minutes)As students complete their graphic organizers, instruct students to complete “Why is this important?” bubbles on their graphic organizer. Invite students to share their responses to each of these questions with the class. Guide students through a brief discussion of site characteristics using the graphic organizers as a guide.
Provide the Experience – Create a Model and Describe the Causes of Erosion(Approximately 5 minutes)
Ask the class to define erosion in a picture; give them a few minutes to draw their definition. After a short time, ask a few students to show their pictures.
Inform students that this lesson will also allow them to take a closer look at erosion and how it affects soil health.

Soil Health Measurement
4
Label the Information (Approximately 10 minutes)Instruct students to record the definition, causes, and characteristics of erosion. Soil erosion involves the breakdown, detachment, transport, and redistribution of soil particles by forces of water, wind, or gravity.
Demonstrate the Relevance (Time varies)Provide students with the “Demonstrating Erosion” activity guide and review the activity and rubric. Set a due date for the activity and any parameters that are specific to your students’ needs and your classroom. Determine whether the activity will be completed in the classroom or as homework to be completed outside of the classroom and plan accordingly. Upon completion of the project encourage students to present their erosion model to the class.
Provide the Experience - Determine Slope (Approximately 5 minutes)Set a ball on a flat surface another on an incline. Watch the ball on the incline roll down and the one on a flat surface stay put. Ask students why this happened. Look for a student to answer “slope”. Guide a discussion about the importance of slope in soil health. Look for ideas such as the steepness and length of the slope influence the speed with which water runs off a field and the amount of soil carried away in the runoff water. The steepness of the slope also affects the ease of cultivation, use of farm machinery, and suitability of the site for septic tank disposal fields, homesites, playgrounds, paths, trails, golf courses, streets, and roads.
Type of Erosion Causes Picture or Example
Water Erosion • Lack of protection against raindrop impact,• Decreased aggregate stability,• Long and steep slopes,• Intense rainfall or irrigation events when plant or residue cover is at a minimum,• Decreased infiltration by compaction or other means.
Mechanical Erosion • Removal by harvest of root crops,• Tillage and cultivation practices that move soil downslope.
Wind Erosion • Exposed surface soil during critical periods of the year,
• Occurrence of wind velocities that are sufficient to lift individual soil particles,
• Long, unsheltered, smooth soil surfaces.

Soil Health Measurement
5
Label the Information (Approximately 15 minutes)Instruct students to capture the slope information in their Guided Notes.
Slope is the steepness of the land usually measure in a percentage.
Draw a diagram to represent slope.
Instruct students to complete the practice slope calculations in their Guided Notes. Review the correct answers with students to gauge their understanding.
Demonstrate the Relevance (Approximately 4 minutes)Select an area for students to practice slope measurements. Create several sites by placing two marking flags 100 feet apart at each site. Encourage students to estimate the slope difference between the two flags.
A
B
C
D
E100 ft
Ground Level
Flags are 100 feet apart (A and B). From the approximate center of the 100 feet(C), step about 15 steps toward the low side of the slope (D). With a straight edge or using your arm extended at the ground level of (A), swing your body keeping straight edge or your arm level, locating point (E) directly above flag (B). The measurement of (E) to the ground is percent, or foot of fall, in elevation from (A) to (B).
Note: There are several “tricks” to measuring slope. Consider asking an experienced land judging coach or agricultural instructor for advice and other strategies. Also, GPS devices can be helpful to accurately determine the slope of an area.

Soil Health Measurement
6
Demonstrate the Relevance (Time varies with site location)Allow students to make a soil sampling plan for an area and collect samples in small groups. Show students the field that they will be using for sampling and measuring soil health. Allow students to determine when to sample, where to sample, and how many samples to take, using the guidelines from their notes. Instruct students to visit the site and record their plan for collecting soil samples. After each group has recorded their soil sampling plan, instruct the group to justify their plan to another group. Then, allow them to collect samples. Remind students to label each sample in a plastic bag.
Instruct students to work in a group of three to create a recipe for sampling soil and it is important to include materials needed and specific instructions. After a few minutes, invite a few groups to share their recipes.
Provide the Experience – Determine When and Where to Sample and Discuss Soil Sampling Guidelines (Approximately 5 minutes)
Label the Information (Approximately 10 minutes)Encourage students to capture the soil sampling guidelines in their Guided Notes. Discuss soil samples as students record the information.
When to sample?• Annual sampling of a field is recommended • Sample when the climate is most stable and there have been no recent disturbances such as
after harvest or the end of the growing season
Where to sample?• Consider rows, soil type, management, plant growth, salt affected areas, erosion, slope, and drainage• Select sample sites that are representative of the field• For trouble spot assessment, select areas that are representative to trouble spots• When comparing management systems, make sure sites selected for comparison have the
same soil type• When making changes to soil, make sure samples are taken after each change
How many samples? • Sample number will depend on the variability of the field • Take a minimum of three samples on any one soil type
Label the Information (Time varies)Instruct students to record their observations on the soil health card during evaluation.

Soil Health Measurement
7
Review the Content (Approximately 10 minutes)What am I? Instruct students to create two riddles from the information in this lesson. They must present their riddle to two different partners with the partners trying to solve the riddle. Consider using the example below to help guide students.
I am caused by one of the most important life sustaining substances on earth but destroy soil. What am I? Answer: Water erosion.
Celebrate Student Success (Approximately 3 minutes)Thank students for their engagement and participation. Congratulate them on their ability to evaluate soil health. Explain that this skill will be useful throughout their lives, if they plant a field or garden or build a house, fence, or even a swing set. Congratulate them on their ability to successfully measure slope and erosion and begin determining soil class in the land evaluation contest. Preview information in the next lesson.
Demonstrate the Relevance (Approximately 5 minutes)When the class finishes collecting data and completing the card, lead a discussion on soil health. Consider using the following questions to guide the discussion:
• Who might use the soil health card?• Why is it important for South Dakota to have its own soil health card?• What are the benefits of using the soil health card?• Do you think using this card will provide soil managers with enough information to make
informed soil management decisions?• What other data might soil managers need to know about a site?

Soil Health Measurement
8
Guided Notes: Mearuring Soil HealthNotes completed by ___________________________
Characteristics of “good soil”:
Soil Health:
Assessing soil health:

Soil Health Measurement
9
• Management History
• Soil Series
• Signs of Erosion
• Slope and Topography
• Location of Field
• Climate
• Environmental Sensitivity

Soil Health Measurement
10
Erosion is?
Type of Erosion Causes Picture or Example

Soil Health Measurement
11
What is slope?
Diagram slope:
Soil Health Measurement
12
Determine the slope percentage in each of the following problems:
A. Flag 1 – elevation 30 feet Flag 2 – elevation 0 feet Distance – 100 feet
B. Flag 1 – elevation 5 feet Flag 2 – elevation 0 feet Distance – 100 feet
C. Flag 1 – elevation 20 feet Flag 2 – elevation 0 feet Distance – 50 feet
D. Flag 1 – elevation 3 feet Flag 2 – elevation 0 feet Distance – 50 feet
E. Flag 1 – elevation 5 feet Flag 2 – elevation 0 feet Distance – 50 feet
F. Flag 1 – elevation 12 feet Flag 2 – elevation 0 feet Distance – 100 feet
Soil Sampling Guidelines:
When to sample?
Where to sample?
How to sample?

Soil Health Measurement
13
Building A Structure : Erosion ModelStudent Name: ___________________________________ Activity Due Date: __________________
Using products found around your home, construct a soil erosion model that includes all three types of soil erosion (wind, water, and mechanical). Use products that accurately represent the characteristics of each soil erosion type as discussed in class and found in the resources provided to you as well as any research you conduct on the internet or in other printed resources.
Your soil profile may be a 2-D or 3-D display, edible, have movement, be stationary, or have any other creative characteristic you can imagine. The goal is that you will be able to describe each type of erosion accurately because of creating this model.
The rubric below will be used for scoring this activity.
CATEGORY 4 3 2 1Scientific Knowledge
Explanations indicate a clear and accurate understanding of scientific principles underlying the construction and modifications.
Explanations indicate a relatively accurate understanding of scientific principles underlying the construction and modifications.
Explanations indicate relatively accurate understanding of scientific principles underlying the construction and modifications.
Explanations do not illustrate much understanding of scientific principles underlying the construction and modifications.
Plan Plan is neat with clear measurements and labeling for all components.
Plan is neat with clear measurements and labeling for most components.
Plan provides clear measurements and labeling for most components.
Plan does not show measurements clearly or is otherwise inadequately labeled.
Construction -Materials
Appropriate materials were selected and creatively modified in ways that made them even better.
Appropriate materials were selected and there was an attempt at creative modification to make them even better.
Appropriate materials were selected.
Inappropriate materials were selected and contributed to a product that performed poorly.
Construction - Care Taken
Great care taken in construction process so that the structure is neat, attractive and follows plans accurately.
Construction was careful and accurate for the most part, but 1-2 details could have been refined for a more attractive product.
Construction accurately followed the plans, but 3-4 details could have been refined for a more attractive product.
Construction appears careless or haphazard. Many details need refinement for a strong or attractive product.

Soil Health Measurement
14
Determine the Slope KEY
A. 30%
B. 5%
C. 40%
D. 6%
E. 10%
F. 12%

Soil Science CurriculumContent and lab derived from the USDA-NRCS Guides for Educators. Go to www.nrcs.usda.gov/soils for the Guides and additional pictures and diagrams. This lesson plan was adapted for South Dakota from the University of Nebraska Institute of Agriculture and Natural Resources, CROPWATCH.
South DakotaNatural Resources Conservation Service South Dakota FFA
January 2018
Approximately 135 minutes
ObjectivesBy the end of the lesson, students will know or be able to:
•Defineammonification,availablewaterholdingcapacity,nitrification,bulkdensity,denitrification,respiration,soilporosity,soilwaterfilledporespace,soilwatercontent,gravimetric,andvolumetricwatercontent
•Listandexplainfactorsthataffectsoilbulkdensity
•Listanddescribesoilbulkdensitymanagementprocesses
•Measuresoilbulkdensityandinterpretdata
Materials•Sponge•Pumicestone• Penny• Balloon• Fishing sinker• Marble •Termsanddefinitions•Laboratorysupplies(seeGuidedNotesLab)
Preparatory Work•Secureseverallocationswithdifferentlandusesandsoiltypestodriveasoilsample.Examples:garden,grassland,crops
Enroll the Participants (Approximately 4 minutes)Showstudentsthefollowingitemsincomparisonandaskstudentswhichitemismostdensewithineachpair.
Samevolumebutdifferingweights -HalfacupofwaterandhalfacupofoilSameweightbutdifferingvolumes -Apoundoffeathersandapoundoflead
Facilitateadiscussionwithstudentstoaskthemwhatismeantby“dense”andtodefine“density.”
Previewwithstudentsthatthedensityofsoilhelpsusindicatethesoil’scompactionandhealth.
Soil Bulk Density
Provide the Experience – Soil Bulk Density Key Terms (Approximately 5 minutes)Provide10studentseachwithakeytermand10otherstudentseachwithadefinitionassociatedwithakeyterm.Instructstudentstolocatetheirmatchingpartner.

Soil Bulk Density
2
Demonstrate the Relevance (Approximately 7 minutes)Instructstudentstotalktogetherandformulateideasabouthowsoilbulkdensityaffectssoilhealth.Elicitresponses,fillinginthefollowinginformation.
•Bulkdensityaffectsthefollowing:- Abilityofwatertoinfiltrateandmovethroughsoil- Rootingdepthofplants- Availablewatercapacity- Soilporosity- Plantnutrientavailability- Soilmicroorganismactivity
•Bulkdensityisameasurementoftheweightofdrysoilperunitvolume-50percentsolids(soilparticlesandorganicmatter)-50percentporespace(filledwithairorwater)
Label the Information (Approximately 10 minutes)Instructstudentstosharetheirtermsanddefinitionswiththeclass.
Ammonification:Occursinthenitrogencyclewhensoilorganismsdecomposeorganic-nitrogen(C-NH2)convertingittoammonia(NH4+).
AvailableWaterHoldingCapacity:Soilmoistureavailableforcropgrowth;alsodefinedasthedifferencebetweenfieldcapacityandwiltingpoint,typicallyshownininches/feet.
Nitrification:Occursinthenitrogencyclewhensoilorganismsconvertammonia(NH3)andammonium(NH4+)intonitrite(NO2-)andnexttonitrate(NO3-)-nitrogenwhichisavailabletoplants.
Bulk Density:Weightofdrysoilperunitofvolume,morecompactedsoilwithlessporespacewillhaveahigherbulkdensity.
Denitrification:Conversionandlossofnitrate(NO3-)-nitrogenasnitrogengases(N2,N2O,NO)whensoilbecomessaturatedwithwater.
Respiration:Carbondioxidereleasefromsoilcomesfromseveralsources(decompositionoforganicmatterbysoilmicrobesandrespirationfromroots)
Soil Porosity:Percentoftotalsoilvolumemadeupofporespace.
SoilWaterFilledPoreSpace:Percentofporespacefilledwithwater.
SoilWaterContent,Gravimetric:Weightofsoilwaterperunitofdrysoilweight.
VolumetricWaterContent: Amount(weightorvolume)ofwaterinsoilcorebyvolume.
Soil Bulk Density
3
Provide the Experience – Factors Affecting Bulk Density (Approximately 5 minutes)Reiteratethatsoilbulkdensityistheweightofdrysoilandthattheweightiscomprisedof50percentsolidsand50percentporespace.
Instructhalfoftheclasstodiscussanddevelopalistoffactorsthatmightaffectthesolids(soilparticlesandorganicmatter)foundinsoil.Instructtheotherhalfoftheclasstodiscussanddevelopalistoffactorsthatmightaffecttheporespace(spaceforwaterorair)foundinsoil.
Label the Information (Approximately 5 minutes)Thefollowingfactorsaffectsoilbulkdensity:
• Soilorganicmatter• Soil texture• Densityofsoilmineral• Packingarrangementofaggregates
Hereareadditionalkeypointsaboutbulkdensity:• Presenceandamountofrockfragment,soildepthandsoiltextureaffectthewatercapacity of soil• Loose,well-aggregated,porous,highorganicmattersoilshavealowerbulkdensity• Sandysoilshaveahigherbulkdensitybecauseoflessporespace
Demonstrate the Relevance (Approximately 5 minutes)Ask students the following questions:
Q.Basedonwhatyouknow,whathappenstosoilbulkdensityassoildepthincreases?
A.Bulkdensityincreaseswithsoildepthbecausesubsurfacelayersaremorecompacted.
Q.Whathappenstobulkdensitywhenfieldsorgardensaretilled?
A.Surfacebulkdensitytemporarilydecreasesbecauseofthesoilparticlesbeingbrokenup,butthelayersbelowthesurfacebecomemorecompact,increasingbulkdensity.
Q.Howdoesahigherbulkdensityimpacttheabilityofrootstosupporttheplant?
A.Thehigherthebulkdensity,themorecompactthesoilisandthelessporespaceexists.Higherbulkdensitymakesitdifficultforrootstoobtainthewaterandnutrientstheyneed,aswellastogrowdeepenoughtoanchortheplant.
Provide the Experience – Soil Bulk Density (Approximately 3 minutes)Askstudentshowtheybelievebulkdensitycouldpossiblybelowered.
Soil Bulk Density
4
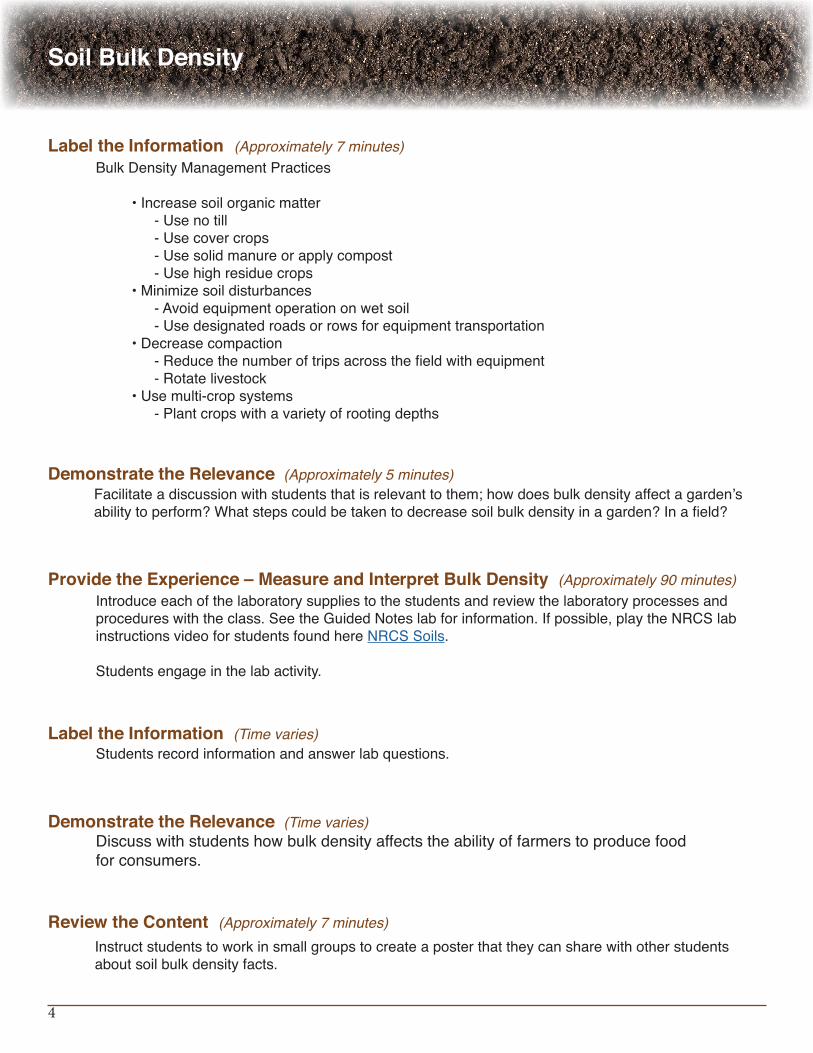
Label the Information (Approximately 7 minutes)BulkDensityManagementPractices
•Increasesoilorganicmatter- Use no till-Usecovercrops-Usesolidmanureorapplycompost-Usehighresiduecrops
•Minimizesoildisturbances-Avoidequipmentoperationonwetsoil-Usedesignatedroadsorrowsforequipmenttransportation
•Decreasecompaction-Reducethenumberoftripsacrossthefieldwithequipment-Rotatelivestock
•Usemulti-cropsystems-Plantcropswithavarietyofrootingdepths
Demonstrate the Relevance (Approximately 5 minutes)Facilitateadiscussionwithstudentsthatisrelevanttothem;howdoesbulkdensityaffectagarden’sabilitytoperform?Whatstepscouldbetakentodecreasesoilbulkdensityinagarden?Inafield?
Provide the Experience – Measure and Interpret Bulk Density (Approximately 90 minutes)Introduceeachofthelaboratorysuppliestothestudentsandreviewthelaboratoryprocessesandprocedureswiththeclass.SeetheGuidedNoteslabforinformation.Ifpossible,playtheNRCSlabinstructionsvideoforstudentsfoundhereNRCSSoils.
Studentsengageinthelabactivity.
Label the Information (Time varies)Studentsrecordinformationandanswerlabquestions.
Demonstrate the Relevance (Time varies)Discusswithstudentshowbulkdensityaffectstheabilityoffarmerstoproducefoodforconsumers.
Review the Content (Approximately 7 minutes)Instructstudentstoworkinsmallgroupstocreateaposterthattheycansharewithotherstudentsaboutsoilbulkdensityfacts.

Soil Bulk Density
5
Guided Notes: Soil Respiration
Ammonification:
AvailableWaterHoldingCapacity:
Nitrification:
Bulk Density:
Denitrification:
Respiration:
Soil Porosity:
Soil Bulk Density
6
SoilWaterFilledPoreSpace:
SoilWaterContent,Gravimetric:
VolumetricWaterContent:
FactorsthatAffectSoilBulkDensity
Howdobulkdensity,moistureandaerationrelate?
Howdowemanagebulkdensity?

Soil Bulk Density
7
Guided Notes: Soil Bulk Density LaboratorySoil Bulk Density Scenario
CatherineandRaywanttoplantagardenintheirnewyard,butthebestlocationforthegardendoesn’tevengrowgrasscurrently.Thegroundisveryhard,andtheythinkthebulkdensityofthesoilmightbetoohighforgoodrootpenetration.Theyarehopefulthattheycanimprovethebulkdensitybyplantingavarietyofplantsoverthenextseveralyears.DiscussmethodsandpracticesCatherineandRaycouldusetoimprovetheirgarden’scompaction/bulkdensityproblem.
Laboratory Supplies
•3-inchdiameteraluminumring •Woodblockorplasticinsertioncap •Rubbermalletorweight • Folding trowel • Flat-bladed knife •Sealablebagsandmarkerpen •Scale(1gramprecision) •1/8cup(29.5mL)measuringscoop •Ceramiccoffeecup •18-inchmetalrod,probeorspace(tocheckforcompactionzone) •Accesstoamicrowaveoven
Laboratory Steps
Bulkdensitycanbemeasuredatthesoilsurfaceand/orcompactedtillagezone.Bulkdensitysamplesshouldbetakeninthesamelocationasinfiltrationandrespirationtests.Itmaybepossibletousetheinfiltrationtestsample.Forstickyclaysoils,alittlepenetratingoilappliedtotheringmakesiteasiertoremovethesoil.
Secureseveralsiteswithdifferentsoiltypesand/orlanduses.Forexample:garden,grassland,crop,lawn,etc.Askstudentstoformahypothesisonwhichsiteswillhavehighestandlowestbukdensities.Testtheirhypothesiswithlabexerciseresults.

Soil Bulk Density
8
Step-by-Step Procedure
1.Carefullyclearallresidueandthendrivetheringtoadepthofthreeincheswithasmallmalletorweightandablockofwoodorplasticcap.
2.Removetheringbycuttingaroundtheoutsideedgewithasmall4-inchserratedbutterknifeandusingthesmallfoldingtrowelunderneathofit.
3.Carefullylifttheringout,preventinglossofsoilbyholdingthetrowelunderit.4.Removeexcesssoilfromthebottomofthecylinderwithserratedbutterknife.5.Placethesampleinaplasticsealablebagandlabelit.6.WeighthesampleinthebagandrecorditsweightinTable1.7.Weighanidenticalclean,emptyplasticbagandrecorditsweightinTable1.8.Weighanemptymicrowavablecuptobeusedinstep9andrecorditsweightinTable1.9.Eitherextractasubsampleordryandweightheentiresampletodeterminewatercontentand
dry soil weight:a.Mixthesamplethoroughlyinthebagbykneadingitwithyourfingers.b.Takea1/8cuplevelscoopofloosesoil(notpackeddown)fromtheplasticbagandplace
itinthecupweightedinstep8.Usemorethanonescooptoincreaseaccuracyofthemeasurement.
10.WeighthemoistsubsampleinthecupbeforedryingitandrecordtheweightinTable1.11.Placethecupcontainingthesubsampleinamicrowaveanddrythesamplefortwoormore
4-minutecyclesatmediumpower.12.Todetermineifsoilisdry,weighthesubsampleinacupaftereach4-minutecycle.Whenthe
weightnolongerchangesafteradryingcycle,itisdry.13.RecorditsweightinTable1.
Interpretations
CompleteTable1forbulkdensityandsoilwatercontentdeterminationandcomparetheresultstothesamesoiltexturelistedinTable2todeterminerelativerestrictionstorootgrowthorcompactionconcerns.CompleteTables3, 4 and 5 forsoilwaterandporositydetermination.
Figure11.Exampleofsoilcoredimensions,volumeandweightbycomponent.

Soil Bulk Density
9
Table 1.Bulkdensityandsoilwatercontent(coremethod).Refertocalculationsbelowfordetails.Sample Site
(a)Weight of field moist soil + sample bag (grams)
(b)Weight of sample bag (grams)
(c) Weight of cup (grams)
(d) Weight of cup + moist soil (grams)
(e) Weight of moist soil (grams)(d-c)
(f)Weight of dry soil + cup (grams)
(g) Dry weight of soil (grams)(f-c)
(h) Soil water content (grams/gram) (d-e)/(g)
(i) Soil bulk density (g/cm3)
Volume of Soil Core (cm3) (refer to Figure 11) Example 1 (refer to Figure 11)
πr2xheight 3.14x(3.66cm)2x(7.62cm)=321cm3
Soil Water Content Using a Subsample (g/g) Example 1 (e-g)/(g)
(weightofmoistsoil-weightofovendrysoil) (34g–27g)=0.259gofwater/gofsoil Weightofovendrysoil 27g
Calculating the Dry Weight of the Bulk Sample Based on Soil Water Content of Subsample (grams)
Drywtofsoilbulksample=[Wtoffieldmoistsoil+bag(grams)-Wtofbag(grams)] [1+SoilWatercontent(g/g)]
Example 1:drywtofbulksample=[(a-b)/(1+h)]=(490g-5g)=385g (1+.259)

Soil Bulk Density
10
Bulk Density Calculation (g/cm3)
BulkDensity=Drywtofbulksample÷volumeofsoilcoreExample 1:bulkdensity=385g÷321cm3=1.20 g/cm3
Soil Texture Ideal bulk densities for plant growth
(grams/cm3)
Bulk densities that affect root growth
(grams/cm3)
Bulk densities that restrict root growth
(grams/cm3)
Sands,loamysands <1.60 1.69 >1.80
Sandyloams,loams <1.40 1.63 >1.80
Sandyclayloams,clayloams
<1.40 1.60 >1.75
Silts,siltloams <1.40 1.60 >1.75
Siltloams,siltyclayloams
<1.40 1.55 >1.65
Sandyclays,siltyclays,clayloams
<1.10 1.49 >1.58
Clays(>45%clay) <1.10 1.39 >1.47
Sample Site Soil Water Content (by Wt) (g/g) (from h in
Examplke 1)
Bulk density (g/cm3) from Example 1
* Volumetric water content
(g/cm3)
** Inches of water/ft. of soil
depth
Example1 0.259 1.2g/cm3 0.3108g/cm3 3.7in/ft
Soil Water Content and Porosity Calculations
Table 3.Soilwatercontent
Table 2.Generalrelationshipofsoilbulkdensitytorootgrowthbasedonsoiltexture
Soil Bulk Density
11
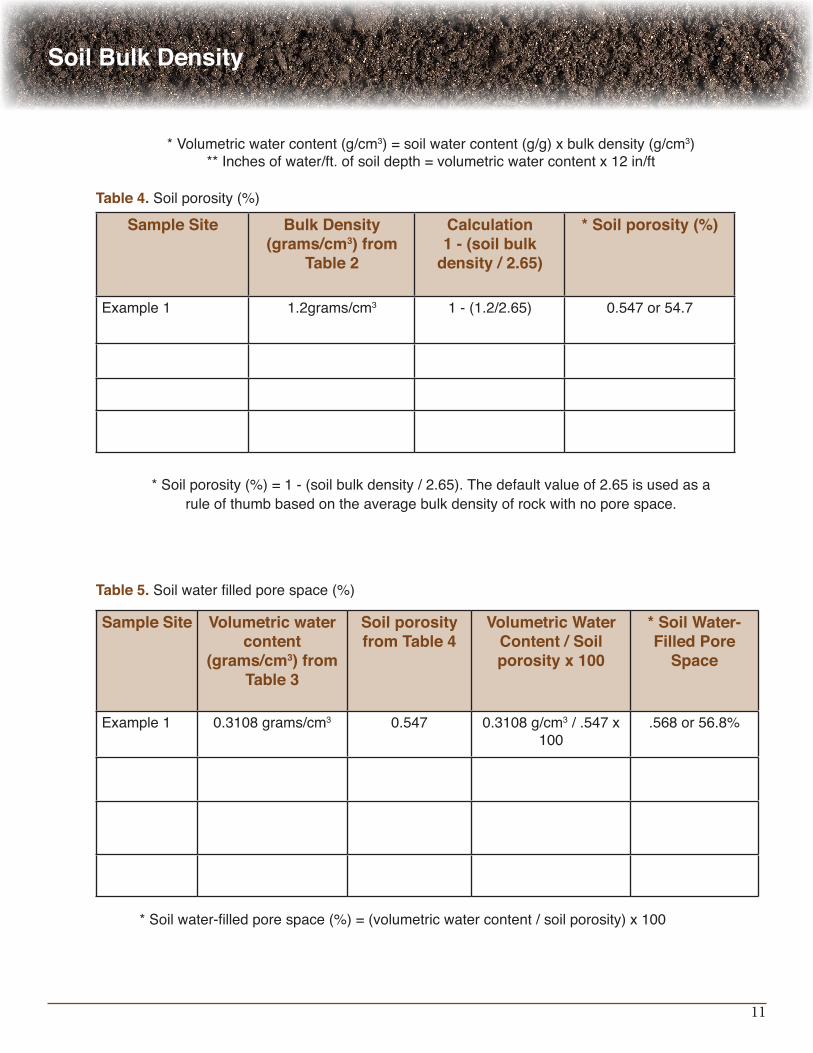
*Volumetricwatercontent(g/cm3)=soilwatercontent(g/g)xbulkdensity(g/cm3)**Inchesofwater/ft.ofsoildepth=volumetricwatercontentx12in/ft
Table 4.Soilporosity(%)
Sample Site Bulk Density (grams/cm3) from
Table 2
Calculation1 - (soil bulk
density / 2.65)
* Soil porosity (%)
Example1 1.2grams/cm3 1-(1.2/2.65) 0.547or54.7
Sample Site Volumetric water content
(grams/cm3) from Table 3
Soil porosityfrom Table 4
Volumetric Water Content / Soil porosity x 100
* Soil Water-Filled Pore
Space
Example1 0.3108grams/cm3 0.547 0.3108g/cm3/.547x100
.568or56.8%
*Soilporosity(%)=1-(soilbulkdensity/2.65).Thedefaultvalueof2.65isusedasaruleofthumbbasedontheaveragebulkdensityofrockwithnoporespace.
Table 5. Soilwaterfilledporespace(%)
*Soilwater-filledporespace(%)=(volumetricwatercontent/soilporosity)x100

Soil Bulk Density
12
Howdidthesoilbulkdensityresultsdifferfromwhatyouexpected?
ComparethebulkdensityresultstothevaluesfoundinTable2forthesamesoiltextureofyoursample.Arebulkdensitylevelsidealbasedonthesoiltexture?Whyorwhynot?

Soil Bulk Density
13
AmmonificationOccursinthenitrogencyclewhensoilorganismsdecomposeorganic-nitrogenconvertingittoammonia.
Available Water Holding Capacity Soilmoistureavailableforcropgrowth;alsodefinedasthedifferencebetweenfieldcapacityandwiltingpoint,typicallyshownininches/foot.
NitrificationOccursinthenitrogencyclewhensoilorganismsconvertammoniaandammoniumintonitriteandnexttonitrate-nitrogenwhichisavailabletoplants.
Bulk Density Weightofdrysoilperunitofvolume,morecompactedsoilwithlessporespacewillhaveahigherbulkdensity.
DenitrificationConversionandlossofnitrate-nitrogenasnitrogengaseswhensoilbecomessaturatedwithwater.
Respiration Carbondioxidereleasefromsoilcomesfromseveralsources(decompositionoforganicmatterbysoilmicrobesandrespirationfromroots)
Soil Porosity Percentoftotalsoilvolumemadeupofporespace.
Soil Water Filled Pore Space Percentofporespacefilledwithwater.
Soil Water Content, Gravimetric Weightofsoilwaterperunitofdrysoilweight.
Volumetric Water Content Amount(weightorvolume)ofwaterinsoilcorebyvolume.

Soil Science CurriculumContent and lab derived from the USDA-NRCS Guides for Educators. Go to www.nrcs.usda.gov/soils for the Guides and additional pictures and diagrams. This lesson plan was adapted for South Dakota from the University of Nebraska Institute of Agriculture and Natural Resources, CROPWATCH.
South DakotaNatural Resources Conservation Service South Dakota FFA
January 2018
Approximately 180 minutes
ObjectivesBy the end of the lesson, students will know or be able to:
•Definesoilrespirationandsoilmicrobes•Explaintheroleofsoilrespirationindeterminingsoilhealth
•Diagramtheroleofsoilrespirationinthecycleoflifeonearth
•Listandexplaininherentfactorsthataffectsoilrespiration
•Listanddescribesoilrespirationmanagementprocesses
• Interpretmanagementimpactsonsoilrespirationandsoilorganicmatter
•Measuresoilrespirationandinterpretdata
Materials•Labmaterials(seeLabGuidedNotes)•Baggiethatseals•Plantcutting
Preparatory Work•Placeaplantcuttinginaplasticbaggieseveralhourspriortoteachingthislessonsothatrespirationisvisible
Soil Biology Respiration
Soilbiologyrespirationreferstotheproductionofcarbondioxidewhensoilorganismsrespire.Thisincludesrespirationofplantroots,therhizosphere,microbesandfauna.
SoilbiologyrespirationisakeyecosystemprocessthatreleasescarbonfromthesoilintheformofCO2.CO2isacquiredfromtheatmosphereandconvertedintoorganiccompoundsintheprocessofphotosynthesis.Plantsusetheseorganiccompoundstobuildstructuralcomponentsorrespirethemtoreleaseenergy.Whenplantrespirationoccursbelow-groundintheroots,itaddstosoilrespiration.Overtime,plantstructuralcomponentsareconsumedbythebiotainthesoilwhichthenreleasesCO2.WhenthisCO2 isreleasedbybelow-groundorganisms,itisconsideredassoilrespiration.
Theamountofsoilrespirationthatoccursinanecosystemiscontrolledbyseveralfactors.Thetemperature,moisture,nutrientcontentandlevelofoxygeninthesoilcanproduceextremelydisparateratesofrespiration.Theseratesofrespirationcanbemeasuredinavarietyofmethods.
Soilbiologyrespirationratescanbelargelyaffectedbyhumanactivity.Thisisbecausehumanshavetheabilitytoandhavebeenchangingthevariouscontrollingfactorsofsoilrespirationfornumerousyears.Tillageandfertilizationbyhumansalsohasthepotentialtoaffectrespirationrates.

Soil Biology Respiration
2
Label the Information (Approximately 4 minutes)DirectstudentstotheirGuidedNotesandencouragethemtocapturethefollowinginformation.
•Soilrespirationisameasureofthecarbondioxidereleasedfromthesoilbymicrobesdecomposingsoilorganicmatterandfromtherespirationofplantroots.
•Soilrespirationindicatessoilhealth(soilorganicmattercontent,soilorganicmatterdecompositionandthelevelofmicrobialactivity).
• SoilMicrobes:Soilorganismsthatareresponsibleforsoilrespirationandmanyimportantsoilprocessessuchasnutrientcycling.
• Respiration:Releaseofcarbondioxidefromseveralsources(decompositionofsoilorganicmatterbysoilmicrobes,andrespirationfromplantroots).
• Mineralization:Organicmatterdecompositionreleasingnutrientsinaplantavailableformthatoccursduringrespiration.
• Ammonification:Productionofammoniumfromsoilorganicmatterdecomposition.• Denitrification:Anaerobicconversionandlossofnitrate-nitrogentonitriteandnitrogenvarieties ofgases.• Nitrification:Anaerobicmicrobialprocessconvertingsoilammoniumnitrogentoplant availablenitrate.
Provide the Experience – Key Terms and Soil Health (Approximately 5 minutes)Separatestudentsintosmallgroupsofthreeorfour.
Provideeachsmallgroupwithasoilsample.(Itwillbehelpfulifsomeofthesampleshavebugs,worms,cropresidueorotherlivingorganismsinthem.)
Instructsmallgroupstoinvestigatetheirsoilanddeterminewhatinthesoilaffectstherespirationthatoccursinthesoil.Elicitstudentresponses.
Enroll the Participants (Approximately 4 minutes)Showorpassaroundthesealedbaggiewiththeplantcuttinginsideofit.Inquiretostudentsastowhattheyknowaboutwhythewaterdropletsformedinsideofthebaggieeventhoughyouplacedonlyaplantcuttinginsideofthebaggie.
Holdupthesecond(empty)plasticbaggieandbreatheintoittodemonstratetheformationofwaterdropletsbecauseofyourbreath.Again,inquireaboutwhatstudentsknow.
Contenttoshare:
•Livingorganismsconducttheprocessofrespiration.•It’seasytoseesignsthatahumanisbreathing (arisingchestorabdomen,soundofbreathing,feelofbreath,etc.)•Wecanseethatplantsarebreathingthroughthecuttinginthebaggie

Soil Biology Respiration
3
Demonstrate the Relevance (Approximately 7 minutes)Instructstudentstotalktogetherandformulateideasabouthowsoilorganicmatterandrespirationaffectsoilhealth.
Elicitresponses,fillinginthefollowinginformation.
•Respirationratecanbebasedontheamountofsoilorganicmatterpresent.- Soilorganicmatterisafoodsourceformicrobesandwhenmicrobesarepresentandworking,respirationishigher.
- Whensoilorganicmatterisabsentorlow,thereislessdecomposingactivity.- Soilmicrobesareresponsibleforsoilrespirationandmayimportantsoilprocesses(suchasbacteria,fungi,protozoa,algae).
- Oneheapingtablespoonofsoilcancontainoverninebillionmicrobes,morethanallthepeopleonearth.
Sharethefollowingdiagram.Encouragestudentstocompletethediagramintheirguidednotes.
Provide the Experience – Factors Affecting Soil Respiration (Approximately 5 minutes)Instructstudentstoworkinsmallgroups.Provideeachsmallgroupwithoneofthefollowingfactorsthataffectsoilrespiration.Instructstudentstodiscusshowtheirgroup’sfactormightaffectsoilrespiration.
Factors: Climate/Weather Biologicalactivity Soilmoisture Amountandhealthofsoilorganicmatter Soil texture
Plants
Food+OxygenSunWater+CarbonDioxoide
Soil

Soil Biology Respiration
4
Label the Information (Approximately 7 minutes)SoilRespirationManagementPractices
1.Leavecropresiduesonthesoilsurface.a.ResidueswithlowC:NratiosdecomposefasterthanthosewithhighC:Nratiosb.Highresiduecrops+addedNitrogen=higherdecompositionratesandaccrualoforganicmatter
2.Useno-tillpractices.a.Tillingdecreasessoilbiologywhichthenslowsdecompositionoforganicmatterb.Minimizeequipmentuseinfieldsc.Minimizefarmequipmentuseingeneralwhensoilsarewetd.Usedesignatedlocationsforequipmenttraffic
3.Usecovercrops.a.Rootsproviderespiration
4.Addorganicmatter.a.Nourishesmicrobes
5.Plantlongseasoncrops.a.Providesalivingrootfortheentiregrowingseasontomaximizesoilbiology
Demonstrate the Relevance (Approximately 5 minutes)Facilitateadiscussionwithyourstudentsaboutthelargereconomiceffectsofpoorsoilrespiration.Dependingonthedemographicsofyourstudents,usereferencesthatmakesensetothem–farmingorfromthestandpointofaconsumer.Considerusingthefollowingquestionsasaguide:
Howcanpoorsoilrespirationaffectafarmerwhoseincomedependsonthecropgrowninthatsoil?Howcanpoorsoilrespirationaffectthepricesweseeforourfoodinthegrocerystore?
Provide the Experience – Soil Respiration Management (Approximately 3 minutes)Continuethefacilitateddiscussionbyaskingthefollowingquestion:
Whatdoyouthinkwecandoasproducersandconsumerstoensureaproductivesoilrespirationrate?
Label the Information (Approximately 10 minutes)•Climate/Weather
-Cannotbechanged-Affectstemperature,moistureandindirectlyaffectsbiologicalactivity
•Biologicalactivity-Varieswiththeseasonsandtimesofday
•Soilmoisture-Asmoistureincreases,respirationratesincreaseuntiltheporesareoverlysaturated,resultinginloweroxygencontentandlowersoilorganismrespiration-Sixtypercentporespacesaturation(fieldcapacity)isidealforrespiration-Drysoilshavelowrespirationratesbecauseoflesssupportforbiologicalactivities
•Amountandhealthofsoilorganicmatter-Affectsmicrobeactivity
• Soil texture-Clay–soilorganicmatteris“protected”fromdecomposition-Sand–toolittleorganicmatter-Mediumtexture(siltandloam)–favorableforsoilrespiration
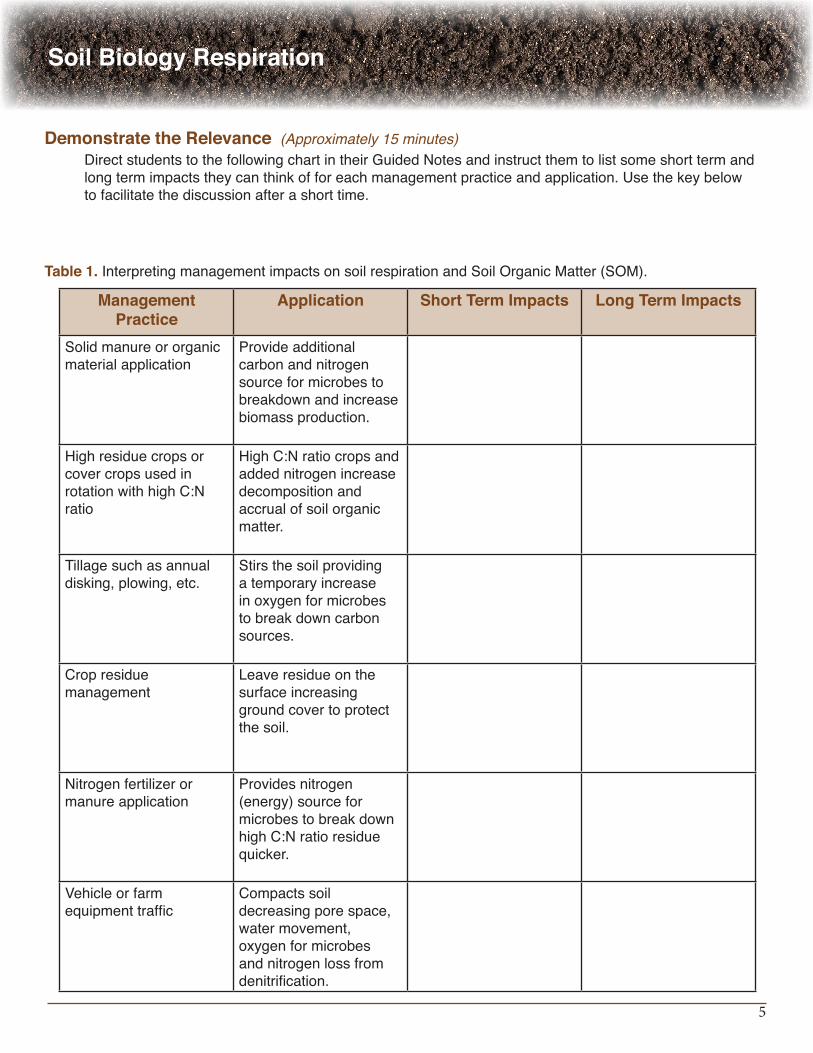
Soil Biology Respiration
5
Demonstrate the Relevance (Approximately 15 minutes)DirectstudentstothefollowingchartintheirGuidedNotesandinstructthemtolistsomeshorttermandlongtermimpactstheycanthinkofforeachmanagementpracticeandapplication.Usethekeybelowtofacilitatethediscussionafterashorttime.
Management Practice
Application Short Term Impacts Long Term Impacts
Solidmanureororganicmaterialapplication
Provide additional carbonandnitrogensourceformicrobestobreakdownandincreasebiomassproduction.
HighresiduecropsorcovercropsusedinrotationwithhighC:Nratio
HighC:Nratiocropsandaddednitrogenincreasedecompositionandaccrualofsoilorganicmatter.
Tillagesuchasannualdisking,plowing,etc.
Stirsthesoilprovidingatemporaryincreaseinoxygenformicrobestobreakdowncarbonsources.
Cropresiduemanagement
Leave residue on the surfaceincreasinggroundcovertoprotectthesoil.
Nitrogenfertilizerormanureapplication
Providesnitrogen(energy)sourceformicrobestobreakdownhighC:Nratioresiduequicker.
Vehicleorfarmequipmenttraffic
Compactssoildecreasingporespace,watermovement,oxygenformicrobesandnitrogenlossfromdenitrification.
Table 1.InterpretingmanagementimpactsonsoilrespirationandSoilOrganicMatter(SOM).

Soil Biology Respiration
6
Management Practice Application Short Term Impacts Long Term Impacts
Solidmanureororganicmaterialapplication
Provideadditionalcarbonandnitrogensourceformicrobestobreakdownandincreasebiomassproduction.
Increasedrespirationwhenmanurebeginstobreakdownandincreasedbiomassproduction.
Positiveimpactonsoilstructure,fertilityandsoilorganicmattercontent.
HighresiduecropsorcovercropsusedinrotationwithhighC:Nratio
HighC:Nratiocropsandaddednitrogenincreasedecompositionandaccrualofsoilorganicmatter.
HighC:Nratiocropresiduetieupnitrogentemporarilyinordertobreak down residue, increasedsoilmoisture,decreasederosion.
Positiveimpactonlongtermsoilhealth,fertilityandsoilorganicmattercontent.
Tillagesuchasannualdisking,plowing,etc.
Stirsthesoilprovidingatemporaryincreaseinoxygenformicrobestobreakdowncarbonsources.
Providesaflushofnitrogen,othernutrientsandcarbondioxidereleaseimmediatelyaftertillage.Increaseserosionrates,decompositionrate of residue, and other carbonsources.
Declinesinsoilorganicmatter,soilhealth,soilfertility.
Cropresiduemanagement
Leave residue on the surfaceincreasinggroundcovertoprotectthesoil.
Increasedcropresiduecovercantieupnitrogentemporarilyinordertobreak down residue, increasedsoilmoisture,decreasederosionandcoolersoiltemperatures.
Positiveimpactonlongtermsoilhealth,fertilityandsoilorganicmattercontent.
Nitrogenfertilizerormanureapplication
Providesnitrogen(energy)sourceformicrobestobreakdownhighC:Nratioresiduequicker.
Temporaryincreaseinrespirationduetoincreasedrateofbreakdownoforganicmaterials.
Whenmanagedcorrectly,hasanoverallpositiveimpactonsoilorganicmatterandsoilhealthbyincreasingproductionlevels and residue amounts.
Vehicleorfarmequipmenttraffic
Compactssoildecreasingporespace,watermovement,oxygenformicrobesandnitrogenlossfromdenitrification.
Decreasesrespiration,yields,waterinfiltrationandincreasesrunoff.
Productiondeclines,increasedsoilerosionandrunoff,decreasedsoilhealth,compactedsoilsandreducedmicrobialactivity.

Soil Biology Respiration
7
Provide the Experience – Measure and Interpret Soils Respiration(Approximately 90 minutes)
Introduceeachofthelaboratorysuppliestothestudentsandreviewthelaboratoryprocessesandprocedureswiththeclass.SeetheGuidedNoteslabforinformation.
Studentsengageinthelabactivity.
Label the Information (Time varies)Studentsrecordinformationandanswerlabquestions.
Demonstrate the Relevance (Time varies)Discusswithstudentshowtheiractivitiesaffectsoilrespirationrates.
Review the Content (Approximately 7 minutes)Instructstudentstoworkinsmallgroupstocreateajinglethatincludesaminimumofthreefactstheylearnedduringthesoilrespirationlessonandlaboratoryactivity.Studentssharetheirjinglewiththeclass.
Celebrate Student Success (Approximately 3 minutes)Thankstudentsfortheirengagementandparticipation.

Soil Biology Respiration
8
Guided Notes: Soil RespirationNotescompletedby___________________________
SoilMicrobes:
Respiration:
Mineralization:
Ammonification:
Dentrification:
Nitrification:
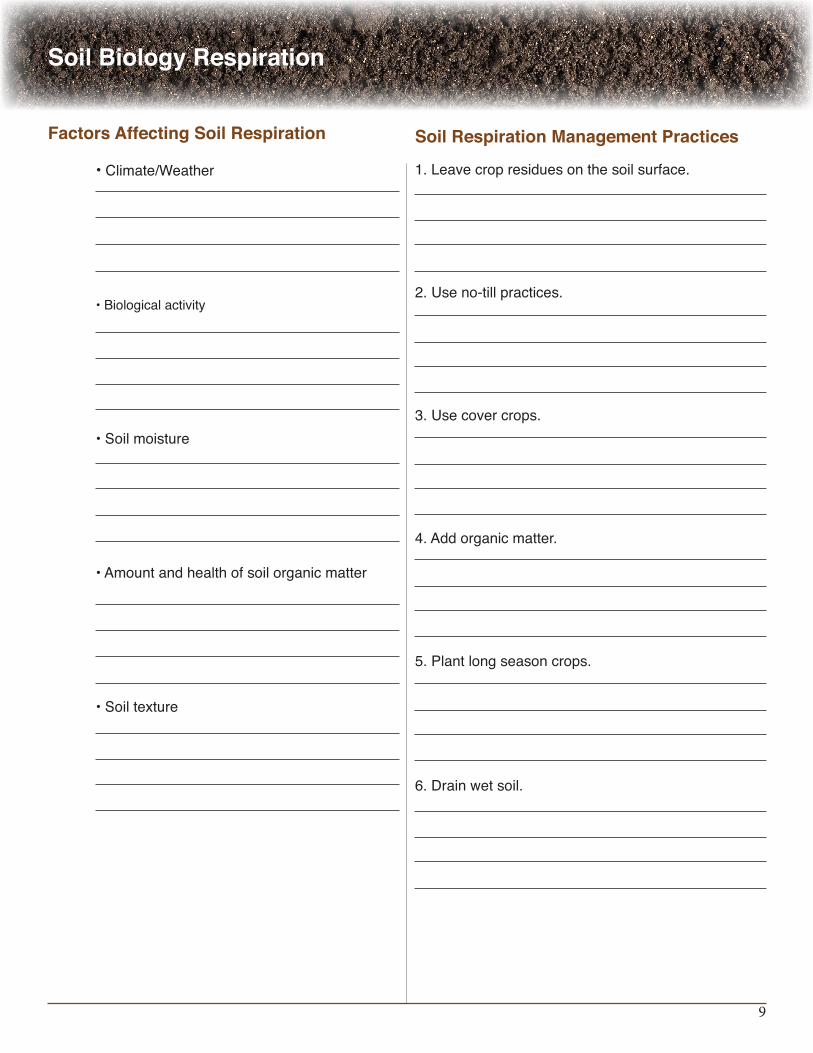
Soil Biology Respiration
9
•Climate/Weather
•Biologicalactivity
•Soilmoisture
•Amountandhealthofsoilorganicmatter
• Soil texture
Factors Affecting Soil Respiration Soil Respiration Management Practices
1.Leavecropresiduesonthesoilsurface.
2.Useno-tillpractices.
3.Usecovercrops.
4.Addorganicmatter.
5.Plantlongseasoncrops.
6.Drainwetsoil.

Soil Biology Respiration
10
Table 1.InterpretingmanagementimpactsonsoilrespirationandSoilOrganicMatter(SOM).
Management Practice
Application Short Term Impacts Long Term Impacts
Solidmanureororganicmaterialapplication
Provide additional carbonandnitrogensourceformicrobestobreakdownandincreasebiomassproduction.
HighresiduecropsorcovercropsusedinrotationwithhighC:Nratio
HighC:Nratiocropsandaddednitrogenincreasedecompositionandaccrualofsoilorganicmatter.
Tillagesuchasannualdisking,plowing,etc.
Stirsthesoilprovidingatemporaryincreaseinoxygenformicrobestobreakdowncarbonsources.
Cropresiduemanagement
Leave residue on the surfaceincreasinggroundcovertoprotectthesoil.
Nitrogenfertilizerormanureapplication
Providesnitrogen(energy)sourceformicrobestobreakdownhighC:Nratioresiduequicker.
Vehicleorfarmequipmenttraffic
Compactssoildecreasingporespace,watermovement,oxygenformicrobesandnitrogenlossfromdenitrification.

Soil Biology Respiration
11
Guided Notes: Soil Respiration LaboratorySoil Respiration Scenario
TomandMollyaretroubledabouttheperformanceafieldtheyrecentlypurchasedandplantedtocorn.Thefieldwashighlytilledwithlittlecropresidue.Theequipmentusedonthefieldbythepriorownerhadverynarrowtires,andthereisnoconsistentpathusedfortravelingtotheirrigationpad.Theyarecuriousaboutwhatmightbetheproblemandplantotestthesoilrespirationratetoday.
Laboratory Supplies
•Solvita®samplejarforcorrectvolumeofsoilora3-inchdiameteraluminumcylinderandlid•Foil-packcontainingaspecialgelpaddle•Solvita®keyforreadingresults•Solvita®interpretationguidetoestimatedifferencesinsoilhealth,respirationandpotentialnitrogenrelease
•Aluminumfoilorcapwhenaluminumcylinderisused•Solvita®soilliferespirationtest(paddles)•Soilthermometerorcontrolledroomtemperature•Smallplasticbucketforeachgroupofstudents•Baggieswithazipperclosure
Laboratory Steps
Whensoilsaremixed,respirationtemporarilyincreasesbecauseoftheaerationcausedbymixing.Thisissimilartothetemporaryincreaseinrespirationcausedbytillage.Asoxygenavailabilityincreases,organicmatterbreaksdownquicker.
Considerusinganintactsoilcoreinthe3-inchdiameteraluminumcylinderratherthanmixingsoil.Anintactcorebetterreflectsrespirationforno-tillapplications,whileamixedsamplewillbetterreflectrespirationeitherimmediatelyaftertillageorposttillage(atleastonedayaftermixing).Togetanaccuratecomparisonofdifferentmanagementsystems,severalsoilsamplesrepresentingdifferentmanagementsystemscanbecompared.
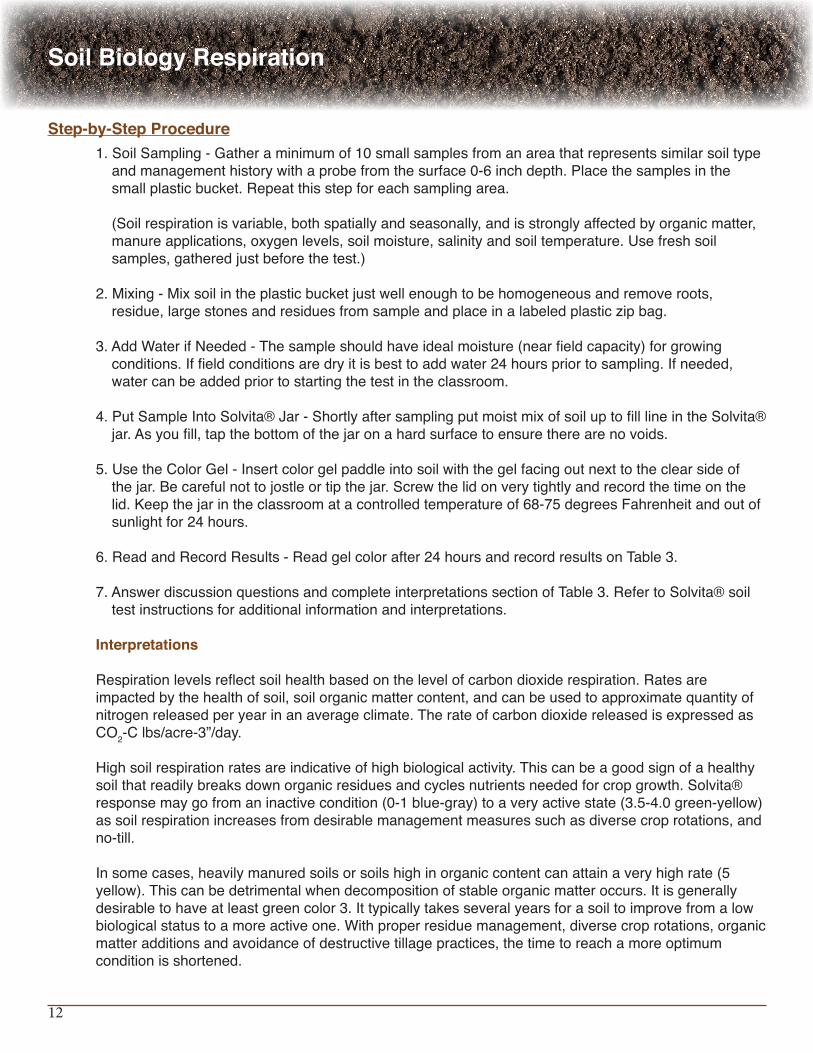
Soil Biology Respiration
12
Step-by-Step Procedure 1.SoilSampling-Gatheraminimumof10smallsamplesfromanareathatrepresentssimilarsoiltypeandmanagementhistorywithaprobefromthesurface0-6inchdepth.Placethesamplesinthesmallplasticbucket.Repeatthisstepforeachsamplingarea.
(Soilrespirationisvariable,bothspatiallyandseasonally,andisstronglyaffectedbyorganicmatter,manureapplications,oxygenlevels,soilmoisture,salinityandsoiltemperature.Usefreshsoilsamples,gatheredjustbeforethetest.)
2.Mixing-Mixsoilintheplasticbucketjustwellenoughtobehomogeneousandremoveroots,residue,largestonesandresiduesfromsampleandplaceinalabeledplasticzipbag.
3.AddWaterifNeeded-Thesampleshouldhaveidealmoisture(nearfieldcapacity)forgrowingconditions.Iffieldconditionsaredryitisbesttoaddwater24hourspriortosampling.Ifneeded,watercanbeaddedpriortostartingthetestintheclassroom.
4.PutSampleIntoSolvita®Jar-ShortlyaftersamplingputmoistmixofsoiluptofilllineintheSolvita®jar.Asyoufill,tapthebottomofthejaronahardsurfacetoensuretherearenovoids.
5.UsetheColorGel-Insertcolorgelpaddleintosoilwiththegelfacingoutnexttotheclearsideofthejar.Becarefulnottojostleortipthejar.Screwthelidonverytightlyandrecordthetimeonthelid.Keepthejarintheclassroomatacontrolledtemperatureof68-75degreesFahrenheitandoutofsunlightfor24hours.
6.ReadandRecordResults-Readgelcolorafter24hoursandrecordresultsonTable3. 7.AnswerdiscussionquestionsandcompleteinterpretationssectionofTable3.RefertoSolvita®soiltestinstructionsforadditionalinformationandinterpretations.
Interpretations
Respirationlevelsreflectsoilhealthbasedonthelevelofcarbondioxiderespiration.Ratesareimpactedbythehealthofsoil,soilorganicmattercontent,andcanbeusedtoapproximatequantityofnitrogenreleasedperyearinanaverageclimate.TherateofcarbondioxidereleasedisexpressedasCO2-Clbs/acre-3”/day.
Highsoilrespirationratesareindicativeofhighbiologicalactivity.Thiscanbeagoodsignofahealthysoilthatreadilybreaksdownorganicresiduesandcyclesnutrientsneededforcropgrowth.Solvita®responsemaygofromaninactivecondition(0-1blue-gray)toaveryactivestate(3.5-4.0green-yellow)assoilrespirationincreasesfromdesirablemanagementmeasuressuchasdiversecroprotations,andno-till.
Insomecases,heavilymanuredsoilsorsoilshighinorganiccontentcanattainaveryhighrate(5yellow).Thiscanbedetrimentalwhendecompositionofstableorganicmatteroccurs.Itisgenerallydesirabletohaveatleastgreencolor3.Ittypicallytakesseveralyearsforasoiltoimprovefromalowbiologicalstatustoamoreactiveone.Withproperresiduemanagement,diversecroprotations,organicmatteradditionsandavoidanceofdestructivetillagepractices,thetimetoreachamoreoptimumconditionisshortened.

Soil Biology Respiration
13
Table 2.Basicsoilbiologicalhealth
Solvita Test - Color/Colorimetric Number
0-1Blue-Gray
1.0-2.5Gray-Green
2.5-3.5Green
3.5-4.0Green-Yellow
4-5Yellow
Soil Respiration Activity
VeryLowSoilActivity
Moderately Low Soil Activity
MediumSoilActivity IdealSoilActivity UnusuallyHighSoilActivity
Associatedwithdrysandy soils, and littleornoorganic
matter
Soilismarginalintermsofbiologicalactivityandorganic
matter
Soil is in a moderately
balancedconditionand has been
receivingorganicmatteradditions
Soiliswellsuppliedwithorganicmatterandhasanactivepopulationof
microorganisms
High/Excessiveorganicmatter
additions
*Approximate Level of CO2 - Respiration
<300mgCO2/kgsoil/wk
300-500mgCO2/kgsoil/wk
500-1000mgCO2/kgsoil/wk
1000-2000mgCO2/kgsoil/wk
>2000mgCO2/kgsoil/wk
<9.5lbsCO2-C/acre-3”d
9.5-16lbsCO2-C/acre-3”d
16-32lbsCO2-C/acre-3”d
32-64lbsCO2-C/acre-3”d
>64 lbsCO2-C/acre-3”d
Approximate Quantity of Nitrogen (N) Release Per Year (Average Climate)
<10lbs/acre 10-20lbs/acre 20-40lbs/acre 40-80lbs/acre 80->160lbs/acre
*Source:Doran,J.(2001)USDA-ARSSoilHealthInstitutecorrelationofSolvita®andfieldsoilrespiration.Calculationsbasedona3-inchsoilcore(7.6cm).

Soil Biology Respiration
14
Table 3. Soilrespirationlevelsandinterpretations.
Sample Site
Median 24-hr Soil or Room
Temp.
Time-frame
Start Time
End Time
Gel Color & Colorimetric
Number
Soil Activity Rating
(Table 1)
Avg. Respiration
Level lbs CO2-C/acre-
3”/d
Quantity of N
Released lbs/ac/yr
Whatdidyouexpectintermsofthesoilrespirationlevels?
Whatsurprisedyouaboutthesoilrespirationlevels?
Whatdoyouexpecttohappentothesoilorganicmatterbasedonthesoilrespirationrates?(improve,decline,remainthesame)Why?

Soil Science CurriculumContent and lab derived from the USDA-NRCS Guides for Educators. Go to www.nrcs.usda.gov/soils for the Guides and additional pictures and diagrams. This lesson plan was adapted for South Dakota from the University of Nebraska Institute of Agriculture and Natural Resources, CROPWATCH.
South DakotaNatural Resources Conservation Service South Dakota FFA
January 2018
Approximately 180 minutes
ObjectivesBy the end of the lesson, students will know or be able to:
• Define electrical conductivity, cation-exchange-capacity, dS/m, ECe method, EC1:1 method, saline soil, sodic soil, anion, cation, nitrification, and denitrification
• Explain the role of electrical conductivity in soil health
• List and describe inherent factors that affect soil electrical conductivity
• Describe the necessity and factors of salinity management
• List and describe problems related to electrical conductivity
• Describe how electrical conductivity affects soil function
• Measure soil electrical conductivity and interpret results
Materials• Guided notes (one per student)• Small sample of salt• 8-½ x 11” paper stating “Climate”• 8-½ x 11” paper stating “Soil Texture”• 8-½ x 11” paper stating “Soil Minerals”• Land to take soil samples• All laboratory supplies (see Lab Guided Notes)
Preparatory Work• Print all necessary copies• Secure permission to collect soil samples from the land owner
Soil Electrical Conductivity
Enroll the Participants (Approximately 4 minutes)
Show students a container of table salt.
Facilitate a discussion with the students using the following questions as a guide.
Where do we typically see and use salt? How might salt affect plant and soils?
Preview that during this lesson the class will explore how salts affect a soil’s ability to grow productive plants.

Soil Electrical Conductivity
2
Provide the Experience – Defining Key Terms and Explaining the Role of Electrical Conductivity (EC) in Soil Health (Approximately 5 minutes)
Direct students to their guided notes and instruct them to work in pairs to define the terms they may know from another science class.
After a short time, elicit definitions from students and fill in with additional information where needed.
Label the Information (Approximately 10 minutes)Review the terms and definitions using the information found here:
Anion: A negatively charged ion.
Cation: A positively charged ion.
Cation-Exchange Capacity (CEC): Capacity of soil to exchange cations. Soils with high clay or organic matter content have a higher CEC than those soils low in clay and organic matter.
Denitrification: Conversion and loss of nitrate-nitrogen to atmosphere in various gas forms, due to lack of oxygen when soil becomes saturated with water.
dS/m: Unit of measurement for electrical conductivity of soil in deciSiemens per meter.
ECe Method: Standard accepted laboratory method for soil EC testing using a saturated paste extract.
EC1:1 Method: Soil EC testing method using a 1:1 soil-water mixture that must be adjusted forsoil texture.
Nitrification: Conversion of ammonium compounds in organic material, or fertilizer into nitrites and nitrates by soil bacteria, making nitrogen available to plants.
Nitrogen Oxides: Family of nitrogen gases that can be generated by human activities and released to the atmosphere.
Saline Soil: Soil with a high content of soluble salts which negatively affect soil processes, productivity and overall soil health.
Sodic Soil: Soil with a high content of sodium salts and poor structure. Water infiltration and drainageis prevented.
Soil Electrical Conductivity: A measure of the amount of soluble salts in soil.

Soil Electrical Conductivity
3
Demonstrate the Relevance (Approximately 4 minutes))Instruct students to add the following points to their notes:
1. Soil electrical conductivity affects yields, crop suitability, plant nutrient availability and soil microorganism activity such as emission of greenhouse gases and respiration.
2. Excess salts hinder plant growth by affecting the soil-water balance.3. Arid and semi-arid climates naturally have a higher salt content.4. It is possible to have saline soils, sodic soils and saline/sodic soils.5. Salinity and Sodicity are influenced by humans through cropping, irrigation and land
management practices.
Provide the Experience – Inherent Factors Affecting Soil EC (Approximately 5 minutes)Divide the class into three small groups. Provide each group one of the 8 ½ x 11 papers with one of the following words on it:
ClimateMineral Content/Parent MaterialSoil Texture
Instruct the small groups to write on the papers how they believe each of the factors affect soil electrical conductivity.
After a short amount of time, ask groups to rotate to a new factor and add their thoughts to that paper.
Rotate a second time so all groups discuss all three factors.
Ask the groups that started at each factor to review for the class all of the ideas that were added tothe paper.
Label the Information (Approximately 7 minutes)Inform students that there three inherent factors that affect soil electrical conductivity; these factors cannot be changed.
Direct students to their guided notes and add the following information about each inherent factor:
• Climate- Salts are more easily flushed through soil located in areas of high rainfall- Salts are flushed below the root zone into groundwater or streams- Salts accumulate in soils found in dry areas
• Mineral Content/Parent Material- Salts come from the weathering of minerals and rocks found in soil
• Soil Texture- Clay with high cation-exchange capacities have high electrical conductivity- Clay with lower cation-exchange capacities have low electrical conductivity- Salts can’t leach through restrictive layers and therefore accumulate do to high clay content or compaction

Soil Electrical Conductivity
4
Demonstrate the Relevance (Approximately 4 minutes))Ask students to make some predictions about the electrical conductivity (salinity) of the soil in your area based on the climate and soil texture of the area.
Encourage curiosity and inform students that they will be testing salinity soon.
Provide the Experience – Managing Soil Electrical Conductivity (Approximately 1 minutes)Write the following categories down on the white board or a location that is visible to all students:
Cropping Irrigation Land Use Application of Fertilizer/Compost/Manure
Ask students to share their initial thoughts about how these items might relate to management of soil electrical conductivity.
Share the following information with the students and encourage them to add it to their guided notes:
• Cropping- Leave crop residue to add organic matter and to limit evaporation- Low organic matter + poor infiltration + poor drainage + saturated soil + compaction =
increased EC and a decrease in the soil’s ability to buffer• Irrigation
- The salinity of water affects the salinity of soil - Extra water can help flush salts from the soil
• Land Use- Ensuring that the least amount of compaction and erosion occur improves soil EC
• Application of Fertilizer/Manure/Compost- Monitoring of municipal waste is necessary- Nitrogen increases salinity
Label the Information (Approximately 12 minutes)
Demonstrate the Relevance (Approximately 3 minutes))Share the following affects with students:
As EC increases, soil microorganism activity decreases, affecting respiration, residue decomposition, nitrification and denitrification.
Sodic soils have poor soil structure and poor infiltration or drainage as well as increased toxicity.
EC indirectly indicates the amount of water and water-soluble nutrients available for plant uptake.

Soil Electrical Conductivity
5
Provide the Experience – Measuring and Interpreting Soil Electrical Conductivity (Approximately 4 minutes)
Review the laboratory scenario with students. Students can find the scenario in their guided notes.
Riley, an area agronomist was recently contacted by a farmer concerned about the performance of last fall’s crop. Despite efforts made by the farmer, the crop yield decreased consistently over the past couple of years. Since the farmer has never tested the field’s soil electrical conductivity and several surrounding farms have had problems with sodic soils, Riley recommends that the tests be run.
Review and identify each of the supplies from the soil testing kit that will be used during the lab activity.
• Soil probe for gathering soil samples• Plastic bucket for mixing soil samples• 1/8-cup (29.5-mL) measuring scoop• Calibrated 120-mL shaking vial with lid• Squirt bottle• Distilled water or rainwater• Calibrated 120-mL shaking vial with lid• EC probe (blue with black cap)• Probe holder with field calibration resistor (470 ohm)• 1.41-dS/m calibration solution• Pen, field notebook, sharpie and zip-lock bags
Review the steps of the laboratory activity and provide any instructions specific to your classroom expectations and time.
Label the Information (Approximately 15 minutes)
Demonstrate the Relevance (Approximately 120 minutes))See the attached laboratory guided notes for the steps to complete the laboratory. Review the results and analysis steps of the lab.
Celebrate Student Success (Approximately 2 minutes)Congratulate students on their discovery of EC level results for their tested soil. Encourage students to continue being curious.
Review the Content (Approximately 4 minutes)Instruct students to verbally review the steps used to complete the laboratory experience and to discuss the results observed in their particular group.

Soil Electrical Conductivity
6
Guided Notes: Soil Electrical Conductivity Anion:
Cation:
Cation-Exchange Capacity (CEC):
Denitrification:
dS/m:
ECe Method:
EC1:1 Method:
Nitrification:
Nitrogen Oxides:
Saline Soil:
Sodic Soil:
Soil Electrical Conductivity:

Soil Electrical Conductivity
7
Notes about Soil Electrical Conductivity:
Climate Soil Texture Mineral Content
Cropping
Irrigation
Land Use
Application of Fertilizer/Compost/Manure
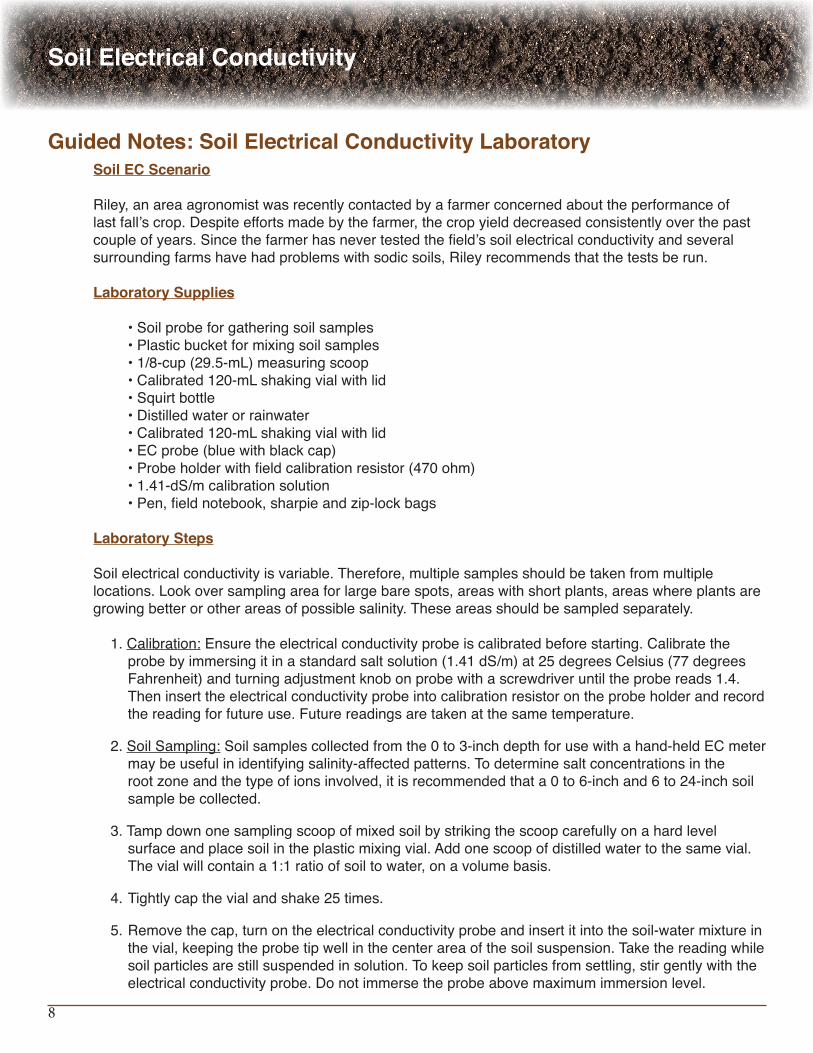
Soil Electrical Conductivity
8
Soil EC Scenario
Riley, an area agronomist was recently contacted by a farmer concerned about the performance of last fall’s crop. Despite efforts made by the farmer, the crop yield decreased consistently over the past couple of years. Since the farmer has never tested the field’s soil electrical conductivity and several surrounding farms have had problems with sodic soils, Riley recommends that the tests be run.
Laboratory Supplies
• Soil probe for gathering soil samples• Plastic bucket for mixing soil samples• 1/8-cup (29.5-mL) measuring scoop• Calibrated 120-mL shaking vial with lid• Squirt bottle• Distilled water or rainwater• Calibrated 120-mL shaking vial with lid• EC probe (blue with black cap)• Probe holder with field calibration resistor (470 ohm)• 1.41-dS/m calibration solution• Pen, field notebook, sharpie and zip-lock bags
Laboratory Steps
Soil electrical conductivity is variable. Therefore, multiple samples should be taken from multiple locations. Look over sampling area for large bare spots, areas with short plants, areas where plants are growing better or other areas of possible salinity. These areas should be sampled separately.
1. Calibration: Ensure the electrical conductivity probe is calibrated before starting. Calibrate the probe by immersing it in a standard salt solution (1.41 dS/m) at 25 degrees Celsius (77 degrees Fahrenheit) and turning adjustment knob on probe with a screwdriver until the probe reads 1.4. Then insert the electrical conductivity probe into calibration resistor on the probe holder and record the reading for future use. Future readings are taken at the same temperature.
2. Soil Sampling: Soil samples collected from the 0 to 3-inch depth for use with a hand-held EC meter may be useful in identifying salinity-affected patterns. To determine salt concentrations in the root zone and the type of ions involved, it is recommended that a 0 to 6-inch and 6 to 24-inch soil sample be collected.
3. Tamp down one sampling scoop of mixed soil by striking the scoop carefully on a hard level surface and place soil in the plastic mixing vial. Add one scoop of distilled water to the same vial. The vial will contain a 1:1 ratio of soil to water, on a volume basis.
4. Tightly cap the vial and shake 25 times.
5. Remove the cap, turn on the electrical conductivity probe and insert it into the soil-water mixture in the vial, keeping the probe tip well in the center area of the soil suspension. Take the reading while soil particles are still suspended in solution. To keep soil particles from settling, stir gently with the electrical conductivity probe. Do not immerse the probe above maximum immersion level.
Guided Notes: Soil Electrical Conductivity Laboratory

Soil Electrical Conductivity
9
6. After the reading stabilizes for about 10 seconds, record EC1:1 in dS/m.
7. Save the soil-water mixture for measurement of pH, nitrate, nitrite and phosphorus if applicable.
8. Turn off and thoroughly rinse the electrical conductivity probe with distilled water and replace the cap.
9. Record the soil EC1:1 reading(s) and complete the rest of Table 4 by comparing readings to values in Tables 1, 2 and 3.
10. Answer discussion questions.
Process EC1:1 Range (dS/m)
Relative Decrease/Increase (%) Threshold EC1:1
Respiration 0.7 to 2.8 -17 to -47 0.7
Decomposition 0.7 to 2.9 -2 to -25 0.7
Nitrification 0.7 to 2.9 -10 to -37 0.7
Denitrification 1.0 to 1.8 +32 to +88 1.0
Anaerobic N2O gas production (high nitrate)
0.02 to 2.8 +1500 to +31,500 1.0-1.5
Anaerobic N2O gas production (low nitrate)
0.5 to 2.0 +200 to +90,000 0.7-1.0
Table 1. Soil EC influence on microbial processes and gaseous nitrogen production in soils amended with sodium chloride or nitrogen fertilizers (after Smith and Doran, 1996 (Tables 10-5 & 10-6) and Adviento-Borbe et al., 2006).

Soil Electrical Conductivity
10
Texture Degree of Salinity (Salinity Classes)
Non- Saline
Slightly Saline Moderately Saline
Strongly Saline
Very Saline
Ratio of EC1:1 to
ECeEC1:1 Method (dS/m)
Coarse to loamy sand
0-1.1 1.2-2.4 2.5-4.4 4.5-8.9 9.0+ 0.56
Loamy fine sand to loam
0-1.2 1.3-2.4 2.5-4.7 4.8-9.4 9.5+ 0.59
Silt loam to clay loam
0-1.3 1.4-2.5 2.6-5.0 5.1-10.00 10.1+ 0.63
Silty clay loam to clay
0-1.4 1.5-2.8 2.9-5.7 5.8-11.4 11.5+ 0.71
ECe Method (dS/m)All textures 0-0.2 2.1-.04 4.1-8.0 8.1-16.0 16.1+ N/A
Table 2. Salinity classes and relationship between EC1:1 to ECe values (Smith and Doran, 1996 adapted from Dahnke & Whitney, 1988).
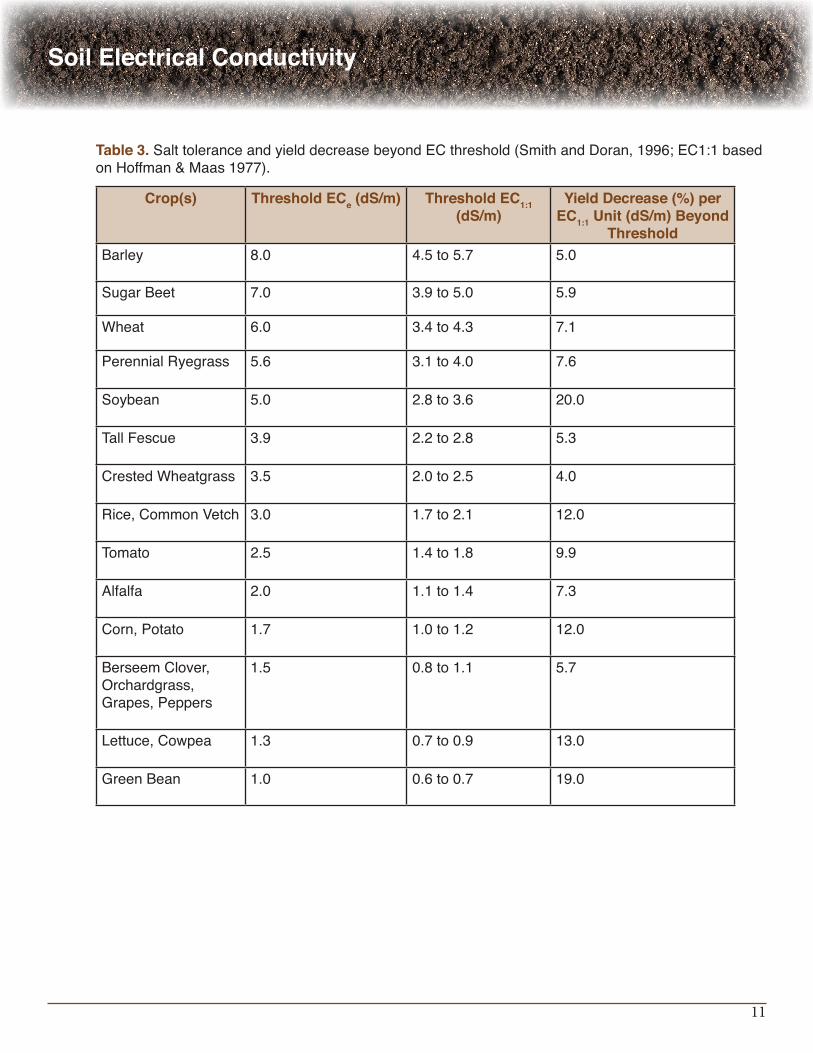
Soil Electrical Conductivity
11
Table 3. Salt tolerance and yield decrease beyond EC threshold (Smith and Doran, 1996; EC1:1 based on Hoffman & Maas 1977).
Crop(s) Threshold ECe (dS/m) Threshold EC1:1 (dS/m)
Yield Decrease (%) per EC1:1 Unit (dS/m) Beyond
ThresholdBarley 8.0 4.5 to 5.7 5.0
Sugar Beet 7.0 3.9 to 5.0 5.9
Wheat 6.0 3.4 to 4.3 7.1
Perennial Ryegrass 5.6 3.1 to 4.0 7.6
Soybean 5.0 2.8 to 3.6 20.0
Tall Fescue 3.9 2.2 to 2.8 5.3
Crested Wheatgrass 3.5 2.0 to 2.5 4.0
Rice, Common Vetch 3.0 1.7 to 2.1 12.0
Tomato 2.5 1.4 to 1.8 9.9
Alfalfa 2.0 1.1 to 1.4 7.3
Corn, Potato 1.7 1.0 to 1.2 12.0
Berseem Clover, Orchardgrass, Grapes, Peppers
1.5 0.8 to 1.1 5.7
Lettuce, Cowpea 1.3 0.7 to 0.9 13.0
Green Bean 1.0 0.6 to 0.7 19.0

Soil Electrical Conductivity
12
Site Soil EC1:1 (dS/m)
Texture Degree of Salinity
pH Nitrate Estimate
(ppm)
Microbial Processes Impacted
Crops Impacted
Table 4. Soil EC (salinity) in surface soil and interpretations.
What about the soil EC test results differed from your expectations? How?
Compare soil EC results to values in Tables 1, 2 and 3. Are EC levels ideal for crops or forages grown and soil microbial processes? Why or why not?

Soil Science CurriculumContent and lab derived from the USDA-NRCS Guides for Educators. Go to www.nrcs.usda.gov/soils for the Guides and additional pictures and diagrams. This lesson plan was adapted for South Dakota from the University of Nebraska Institute of Agriculture and Natural Resources, CROPWATCH.
South DakotaNatural Resources Conservation Service South Dakota FFA
January 2018
Approximately 180 minutes
ObjectivesBy the end of the lesson, students will know or be able to:
• Explain the purpose of Web Soil Survey
• Use Web Soil Survey
Materials• Soil Survey Manuals• Web Soil Survey Webquest – one per student• My Home Soil Map – one per student•You’retheDeveloperRubric–oneperstudent•Computerswithinternetaccess•Notecards–oneperstudent•Suppliesfor“You’retheDeveloper”
Preparatory Work•Makenecessarycopies•ReviewWebSoilSurvey•Reviewanddeterminewhereandwhen“You’retheDeveloper”projectwillbecompleted
Web Soil Survey
Enroll the Participants (Approximately 5 minutes)Showstudentsasoilsurveymanualsandaskthemtopredictwhatinformationmightbefoundwithinit.Askstudentstogiveinstructionsonhowtousethesoilsurveymanual.Leadabriefdiscussiononsoilsurvey.Explainthatthesemanualsareusedtodeterminesoiltypeandcharacteristicsbutcanbetimeconsumingtouse.SharewiththeclassthattheUnitedStatesDepartmentofAgriculture,NaturalResourcesConservationService(USDA-NRCS)hascreatedasitetomakecollectingthisinformationeasier.ExplainthatthislessonwillallowstudentstoexploreWeb Soil Survey.

Web Soil Survey
2
Provide the Experience – Explain the Purpose and Use of Web Soil Survey (Approximately 45 minutes)
ProvideeachstudentwithacopyoftheWebSoilSurveyWebquestandaccesstoacomputerwithinternet. They will need to visit https://www.nrcs.usda.gov/wps/portal/nrcs/main/soils/survey/ and follow instructionsontheWebquest.Considerallowingstudentstoworkwithapartnerastheynavigatethroughthissite.
Note: Consider reviewing a power point created by the USDA-NRCS to familiarize yourself with the Web Soil Survey: http://websoilsurvey.sc.egov.usda.gov/App/Help/WSS_HomePage_HowTo_3_0.pdf
Label the Information (Approximately 45 minutes)
Provideeachstudentwithacopyof“MyHomeSoilMap”andaccesstoacomputerwithinternet.Theywill need to visit https://www.nrcs.usda.gov/wps/portal/nrcs/main/soils/survey/andfollowinstructionsonthe handout.
Demonstrate the Relevance (Times vary)You’retheDeveloper.Assignstudentstosmallgroupsandgivethemthe“You’retheDeveloperRubric.”Explaintotheclassthattheyhavebeenhiredbyadevelopingcompanytodevelopa10-acreareainyourcounty.Astheinstructor,youcanassignthema10-acreplotorallowthemtoselecttheirownplot.Theymustworkasateamtoresearchtheirlandanddetermineaplanfordevelopment.Theymustcreateamapoftheirplanandawrittenstatementjustifyingtheirdevelopmentdecisions.Uponcompletionoftheprojectalloweachteamtopresenttheirdevelopmentproposaltotheclass.
Celebrate Student Success (Approximately 3 minutes)Thankstudentsfortheirengagement,creativity,andparticipation.CongratulatethemontheirabilitytoproperlyuseWebSoilSurvey.Explainthatthisskillwillbeusefulthroughouttheirlivesastheyliveandworkontheland.Congratulatestudentsonhavingastrongerunderstandingofsoilmanagementwhichwillallowthemtosuccessfullyparticipateinthelandevaluationcompetition.
Review the Content (Approximately 10 minutes)Provideeachstudentwithapostcard.Instructtheclasstosendapostcardtoastudentthatmissedthislesson.EncouragestudentstodrawapostcardpicturerelatedtotheWebSoilSurveylessononthefrontofthecardandwriteanotesummarizingthelessontothemissingstudentontheback.Consideraskingafewstudentstosharetheirpostcardwiththeclass.

Web Soil Survey
3
Web Soil Survey WebquestName:______________
FollowtheinstructionsbelowtobecomefamiliarwithWebSoilSurvey.Openaninternetwindowandgotohttps://www.nrcs.usda.gov/wps/portal/nrcs/main/soils/survey/ . Answer the questions with eachsteptohelpyouunderstandtheWebSoilSurvey.
1.Readthroughtheintroductiononthehomepage.Continuereadingthrough“FourBasicSteps.
What does WSS stand for?
WhatdoesAOIstandfor?
WhatpercentofthecountryiscoveredbytheWSS?
What will the soil map show you?
Whatisthecosttodownloadafinishedmap?
2.Clickgreen“StartWSS”button.AnewwindowshouldopenwithWebSoilSurvey.
3.Findyourhometownusingthequicknavigationbar.
Whatoptionsdoyouhaveforfindingaspecificareainthenavigationsection?

Web Soil Survey
4
4.DefineyourhometownasyourAOIusingthebuttonsatthetopofthemap.
Listfourbuttonsatthetopofthemapanddescribehowtheyareused.
5.UnderAOIInformation,giveyourmapaname.
WhatisthesizeofyourAOI?
WhenwasthedatacollectedforyourAOI?
6.Continuebyclickingonthe“SoilMap”baratthetopofyourscreen.
WhichsoiltypesarethemostcommoninyourAOI?
7.Clickthe“SoilDataExplorer”baratthetopofyourscreen.
8.Usethe“SuitabilityandLimitations”sectiontoanswerthefollowingquestions:
Identifythe10categoriesofdataincludedinthissection.

Web Soil Survey
5
Usingthespecificcategories,“ViewRating”button,andthe“Legend”identifyfivesuitabilitiesandfivelimitationsofyourAOI.
Soil in this AOI is suitable for... Limitations for this soil include...
9.Usingthe“SoilPropertiesandQualities”button,completethechartforyourAOImap.Identifytwocommonsoiltypesinyourareaandrecordthedefinitionandratingforeachlistedsoilhealthproperty.
10.“Finally,clickonthe“ShoppingCart”baratthetopofyourscreen.
11.Click“CheckOut”and“getnow”togenerateyourpersonalizedreport.
pH Erosion(T Factor)
Organic Matter Rating
Water Holding Capacity
Definitionoftheproperty
Soil Type
Soil Type

Web Soil Survey
6
Identifyspecificinformationfromyourreportanddescribehowtheinformationcanbeused.
12.ReadthroughyourCustomSoilResourceReport.
Specific information from report Page number
How can this information be used?

Web Soil Survey
7
Web Soil Survey – My Home Soil Map Name:_________________
FollowthestepsfromtheWebSoilSurveyWebquesttohelpyounavigatethroughthisproject.
1.Findyourhome,neighborhood,orlandimportanttoyourfamilyanddescribehowyounavigatedtothisAOI.Includetheaddressofthisland.
2.AccordingtoyourAOI,howmanyacresareincludedonyourmap?
3.Describethesoilsfoundwithinyourarea:
Map Unit Symbol Map Unit Name Acres in AOI Percent AOI

Web Soil Survey
8
4.CompletethechartbelowusingeachofthesoilsfoundinyourAOI.Includetheratingforeachofthesoil qualities listed.
Soil Type pH Erosion(T Factor)
OrganicMatterRating
WaterHoldingCapacity
ParentMaterialName
FloodingClass
PondingClass
5.Completethechartbelowusingeachofyoursoilstodeterminethesuitabilityandlimitationsofyour soils.
Soil Type Dwellings with Basements
Lawns and Landscapes
Roads and Streets
Farmland Classification
Range Production
(normal year)

Web Soil Survey
9
6.DrawamapoftheAOIlabelingcurrentstructuresandusesandincludesoiltypes(symbols).
7.Howmightthisinformationbebeneficialtoyouasalandmanager?

Web Soil Survey
10
You’re the Developer
Student Name:____________________ActivityDueDate:__________________
Youhavebeenhiredtodevelopa10-acreplotoflandinyourcounty.Youwillcreateamapofyourde-velopmentproposalandawrittenjustificationofyourplan.UseWebSoilSurveytodeterminethebestusesofyourland.Considertheneedsofyourcountyandthefeaturesofyourland.
Therubricbelowwillbeusedforscoringthisactivity.CATEGORY 4 3 2 1Title
MapLegend/Key
Neatness of Color and Lines
Scale
EvidenceandExamples
Accuracy
Title tells the purpose/contentofthemap,isclearlydistinguishableasthetitle(e.g.largerletters,underlined,etc),and is printed at the top of the map.
Legendiseasy-to-findandcontainsacompletesetofsymbols,includingacompassrose.
Allstraightlinesareruler-drawn,allerrorshave been neatly correctedandallfeaturesarecoloredcompletely.
All features on map are drawntoscaleandthescaleusedisclearlyindicatedonthemap.
Alloftheevidenceand examples are specific,relevantandexplanationsaregiventhatshowhoweachpieceofevidencesupportstheauthor’sposition.
Allsupportivefactsandstatisticsarereportedaccurately.
Title tells the purpose/contentofthemapandis printed at the top of the map.
Legendcontainsacompletesetofsymbols,includingacompassrose.
Allstraightlinesareruler-drawn,mosterrors have been neatly correctedandmostfeaturesarecoloredcompletely.
Most features on map aredrawntoscaleandthescaleusedisclearlyindicatedonthemap.
Mostoftheevidenceand examples are specific,relevantandexplanationsaregiventhatshowhoweachpieceofevidencesupportstheauthor’sposition.
Almost all supportive factsandstatisticsarereportedaccurately.
Title tells the purpose/contentofthe map, but is not locatedatthetopofthe map.
Legendcontainsanalmostcompletesetofsymbols,includingacompassrose.
Moststraightlinesareruler-drawn,mosterrors have been neatlycorrectedandmost features are coloredcompletely.
Many features of the mapareNOTdrawntoscaleeventhoughascaleisclearlyindicatedonthemap.
At least one of the piecesofevidenceand examples is relevant and has an explanation that showshowthatpieceofevidencesupportstheauthor’sposition.
Mostsupportivefactsandstatisticsarereportedaccurately.
Purpose/contentofthemapisnotclearfrom the title.
Legendisabsentorlacksseveralsymbols.
Many lines, correctionsoferrors,and/or features are not neatly done.
Many features of themapareNOTdrawntoscaleAND/ORthereisnoscalemarker on the map. EvidenceandexamplesareNOTrelevantAND/ORarenot explained.
Mostsupportivefactsandstatisticswereinaccuratelyreported.

Soil Science CurriculumContent and lab derived from the USDA-NRCS Guides for Educators. Go to www.nrcs.usda.gov/soils for the Guides and additional pictures and diagrams. This lesson plan was adapted for South Dakota from the University of Nebraska Institute of Agriculture and Natural Resources, CROPWATCH.
South DakotaNatural Resources Conservation Service South Dakota FFA
January 2018
Approximately 135 minutes
ObjectivesBy the end of the lesson, students will know or be able to:
• Define acidity, alkalinity, buffering capacity, and soil pH• List and describe inherent factors that affect soil pH• Describe how to manage soil pH• Describe how soil pH affects soil function• Measure and interpret soil pH
Materials• Guided notes (one per student)• 8-½ x 11 paper that says “Climate”• 8-½ x 11 paper that says “Mineral Content”• 8-½ x 11 paper that says “Soil Texture”• Land to take soil samples• All laboratory supplies (See Lab Guided Notes)• Post-it notes
Preparatory Work•Print all necessary copies•Secure permission to collect soil samples from the landowner
Enroll the Participants (Approximately 4 minutes)Show students the supplies that will be used during the lab portion of this lesson: soil probe, plastic bucket, pH test strips, measuring scoop, shaking vial, squirt bottle, distilled water, and notebook.
Ask students which of the tools they can identify and facilitate a brief class discussion about the tools.
Share with students that this multi-day lesson focuses on soil pH and that after learning about key definitions and management practices, the class will apply the information in a laboratory experience to test soil pH.
Soil pH: What Affects it, What it Affects, Managing it and Testing it

Soil pH: What Affects it, What it Affects, Managing and Testing it
2
Demonstrate the Relevance (Approximately 4 minutes)Instruct students to construct one sentence that includes and demonstrates the definitions of each of the four terms addressed in this lesson. Students may share the sentences with the class or with other students.
Instruct students to add the following points to their notes:
1. Soil pH is an indicator of soil health.2. Soil pH affects crop yields, crop suitability, plant nutrient availability and soil microorganism.3. Soil pH can be managed by applying nitrogen and lime, and by using cropping practices that
increase soil organic matter and overall soil health.
Provide the Experience – Inherent Factors Affecting Soil pH (Approximately 5 minutes)Divide the class into three small groups. Provide each group one of the 8-½ x 11 papers with one of the following words on it:
Climate Mineral Content Soil Texture
Instruct the small groups to write on the papers how they believe each of the factors affect soil pH. After a short amount of time, ask groups to rotate to a new factor and add their thoughts to that paper.
Rotate a second time so all groups discuss all three factors.
Ask the groups that started at each factor to review for the class all of the ideas that were added to the paper.
Provide the Experience – Defining Key Terms (Approximately 3 minutes)Direct students to their guided notes and instruct them to match each of the terms with one of the provided definitions.
Label the Information (Approximately 4 minutes)Review the terms and definitions using the information found here:
Acidity: having a pH of less than 7 Alkalinity: having a pH of greater than 7 Buffering Capacity: a soil’s ability to maintain its pH when changes are being made to the soil
Soil pH: a measure of the soil’s acidity or alkalinity. The soils for pH values range from 1 to 14 starting with 1 for extremely acidic and 14 as extremely alkaline. Typical soil pH values range from 5.0 to 8.5.

Soil pH: What Affects it, What it Affects, Managing and Testing it
3
Label the Information (Approximately 7 minutes)Inform students that the three factors they discussed are known as “inherent factors” that affect soil pH; these are factors that cannot be changed.
Direct students to their Guided Notes and add the following information about each inherent factor:
• Climate- Increased temperature and rainfall cause increased leaching rates and increased soil
mineral erosion rates- Increased leaching yields lower pH- Decreased leaching and rain cause pH to either increase or remain steady
• Mineral Content - The soil parent material can be high in carbonates (limestone) which will maintain a long term higher pH throughout the soil profile - High organic matter content yields a higher buffering capacity - Organic matter amount can be changed through management practices • Soil Texture
- High clay content yields a higher buffering capacity due to slower leaching rates - Clay content amount cannot be changed - High sand content yields a lower buffering capacity due to large pore spaces and fast leaching rates - High sand content means the organic matter content is low, which means the buffering capacity is low, percolation rate is high and the pH is low
Demonstrate the Relevance (Approximately 5 minutes)Facilitate a discussion with students about the soil in your area. Here are a few guiding questions to use during the discussion:
• What are the pH characteristics of the soil in our area? • How does that affect our farms, yards and gardens? • How does the pH correction affect our environment and maintenance costs?
Provide the Experience – Managing Soil pH (Approximately 3 minutes)Show students pictures of a forest, grassland and crop field.
Instruct students to use what they know about soil pH and inherent factors to determine how the pH might vary between each of the three types of lands.
Elicit student responses.

Soil pH: What Affects it, What it Affects, Managing and Testing it
4
Label the Information (Approximately 12 minutes)Share the following information with the students and encourage them to add it to their Guided Notes:
• Soil pH is affected by land use, management and vegetation- Forests have a medium level of organic matter- Grasslands have a high level of organic matter- Croplands have the lowest level of organic matter of these three types of land
• As land moves from forest to grassland and from grassland to cropland:- Organic matter can be lost- Soil minerals are removed (during harvest)- Erosion may increase- Nitrogen and sulfur are added to the soil- pH may increase or decrease with management
• Acidification can be limited or corrected by:- Adding lime yields an increased pH- Applying nitrogen and sulfur in the correct amounts and at the times when plants are using them- Diversifying crop rotations- Applying organic matter - Using no-till practices and cover crops
Demonstrate the Relevance (Approximately 3 minutes)Direct students to the chart in their Guided Notes. Fill in the following pH preference data for the crops listed in the chart.
Corn: 6.8 Wheat: 6.8 Soybeans: 6.8 Oats: 7.5 Barley: 7.5 Alfalfa: 6.8-7.5 Timothy: 6.8 Carrots: 6.0 Tomatoes: 7.5 Cucumbers: 7.5
Provide the Experience – Soil Functionality and pH (Approximately 3 minutes)Inform students that a soil’s pH indicates its suitability for plant growth.
Direct students to discuss with a partner how pH might affect key needs of plants in their growth process.
Soil pH: What Affects it, What it Affects, Managing and Testing it
5
Label the Information (Approximately 7 minutes)Encourage students to capture the following information in their Guided Notes:
• A pH level that is too low or too high can cause:- Nutrient deficiencies because of leaching- A decline in microbial activity because of improper environment for the microbes- A decrease in crop yields- A deterioration of overall soil health- An inhibition of the nitrogen cycle (low pH)- Limited effectiveness of herbicide and insecticide degradation- Limited solubility of heavy metals- A lack of effectiveness and carry-over of herbicides
Demonstrate the Relevance (Approximately 4 minutes)Instruct students to form pairs and discuss what current practices they think affect soil pH and how each of these soil problems affects farms and gardens.
Review the laboratory scenario with students. Students can find the scenario in their guided notes.
Marge and Jim are planning to have a garden during the next spring and summer growing season. They recently moved to a new home in a new town and do not know much about the soil in the area. Marge and Jim taken their gardening seriously, both for consumption of the food as well as for entering their crops competitively at county and state fairs. It’s really important that the garden is successful. To help guarantee success, Marge and Jim plan to conduct tests to measure their soil’s pH levels.
Provide the Experience – Measuring and Interpreting Soil pH (Approximately 3 minutes)
Label the Information (Approximately 15 minutes)Review and identify each of the supplies from the soil testing kit that will be used during the lab activity.
• Soil probe for gathering soil samples• Plastic bucket for mixing soil samples• Roll of pH test strips• 1/8-cup (29.5-mL) measuring scoop• Calibrated 120-mL shaking vial with lid• Squirt bottle• Distilled water or rainwater• Pen, field notebook, sharpie and zip-lock bags
Review the steps of the laboratory activity and provide any instructions specific to your classroom expectations and time.

Soil pH: What Affects it, What it Affects, Managing and Testing it
6
Demonstrate the Relevance (Approximately 125 minutes)See the attached laboratory Guided Notes for the steps to complete the exercise. Review the results and analysis steps of the lab.
Review the Content (Approximately 4 minutes)Provide each student with two Post-it notes. Instruct students to write down what they know about soil pH on one note and on the other write down what they wonder or are curious about in regards to soil pH. Ensure student names are on the Post-it notes and collect them to continue the class discussion and guide students in their capstone project.
Celebrate Student Success (Approximately 2 minutes)Congratulate students on their discovery of pH level results for their tested soil. Encourage students to continue being curious during each of the laboratory activities of the soil science unit.

Soil pH: What Affects it, What it Affects, Managing and Testing it
7
Vocabulary MatchingSoil pH: Soil pH is less than 7Alkalinity: A measure of soil acidy or alkalinityAcidity: Soil’s ability to resist pH changeBuffering Capacity: Soil pH is greater than 7
1. Soil pH is an indicator of _______________ _______________________.
2. Soil pH affects ______________________, ____________________________, ___________________________________________ and ________________________.
3. Soil pH can be managed by applying __________________ and _____________, and by using _____________________ ____________________ that increase soil ___________________ __________________ and overall soil health.
Management of Acidity Notes
Plant Ideal pH
Corn, Wheat, Soybeans, Timothy 6.8
Oats, Barley, Tomatoes, Cucumbers 7.5
Alfalfa 6.8-7.5
Carrots 6
Guided Notes: Soil pH

Soil pH: What Affects it, What it Affects, Managing and Testing it
8
Guided Notes: Soil pH LaboratorySoil pH ScenarioMarge and Jim are planning to have a garden during the next spring and summer growing season. They recently moved to a new home in a new town and do not know much about the soil in the area. Marge and Jim taken their gardening seriously, both for consumption of the food as well as for entering their crops competitively at county and state fairs. It’s really important that the garden is successful. To help guarantee success, Marge and Jim plan to conduct tests to measure their soil’s pH levels.
Laboratory Supplies • Soil probe for gathering soil samples • Plastic bucket for mixing soil samples • Roll of pH test strips • 1/8-cup (29.5-mL) measuring scoop • Calibrated 120-mL shaking vial with lid • Squirt bottle • Distilled water or rainwater • Pen, field notebook, sharpie and zip-lock bags
Laboratory StepsSoil pH level is highly variable, depending on field location and time of year, as well as what is growing. It is affected by fertilizer placement in rows or between rows, soil texture, organic matter content and applications of manure or fertilizer.
In-Field Quick Hand Test1. Using a soil probe, gather at least 10 small samples randomly from the area that represents the soil type
and management history to be tested. Ensure that each sample is taken at a depth of six inches.2. Place each sample into the plastic bucket provided. 3. Remove large stones and plant residue from the sample. 4. Mix the soil together.5. Rub wet soil across your palms to neutralize your hands. Discard this soil.6. Place a scoop of mixed soil in your palm and saturate the soil with distilled water or rainwater.7. Squeeze the wet soil gently until the water runs out of the cup of the hand and onto the side of the soil
sample.8. Touch the end of a 1-inch-long piece of pH test strip directly to the water so that the tip is barely wet and
the solution can be drawn up the strip at least 1/4-inch to 1/2-inch beyond the area masked by soil. 9. Compare the color of the pH test strip approximately one-third of the way up the colored portion of the
strip to the color chart on the dispenser of the test strips. 10. Record the soil pH and interpretations in Table 1. Use Figures 1 and 2 to complete the chart.
1:1 Soil-Water Soil pH Test in Classroom1. Complete Step 1 from the In-Field Quick Hand Test.2. Tamp down one sampling scoop (29.5 mL) of mixed soil by striking the scoop carefully on a hard, level
surface. Place the sample in the plastic mixing vial. 3. Add one scoop (29.5 mL) of water to the same vial. The vial will contain a 1:1 ratio of soil to water, on a
volume basis.4. Place the cap on the vial tightly and shake the vial 25 times.

Soil pH: What Affects it, What it Affects, Managing and Testing it
9
5. Let the sample settle for one minute. 6. Remove the vial cap and gently pour 1/16-inch of soil-water solution carefully into the lid.7. Let the sample sit in the lid for two or three minutes. 8. Take the end of a 1-inch-long piece of pH paper and immerse it 1/16 inch into the solution until the liquid
is drawn up at least 1/4-inch to 1/2-inch beyond area covered by soil. 9. Compare the color approximately one-third of the way up the colored portion of the strip to the color
chart on the dispenser. 10. Record the soil pH and interpretations in Table 1. Use Figures 1 and 2 to complete the chart.
Table 1. Soil pH and Interpretations
Site Soil pH Soil pH Category (i.e.
very acid)
Nutrients Impacted by
Soil pH
Crops Impacted by Soil pH Level
Notes

Soil pH: What Affects it, What it Affects, Managing and Testing it
10
Figure 1. Soil pH Category
Figure 2. Plant pH Preferences
Plant Ideal pH
Corn, Wheat, Soybeans, Timothy 6.8
Oats, Barley, Tomatoes, Cucumbers 7.5
Alfalfa 6.8-7.5
Carrots 6
Notes completed by ___________________________

Climate

SoilTexture

MineralContent

Soil Science CurriculumContent and lab derived from the USDA-NRCS Guides for Educators. Go to www.nrcs.usda.gov/soils for the Guides and additional pictures and diagrams. This lesson plan was adapted for South Dakota from the University of Nebraska Institute of Agriculture and Natural Resources, CROPWATCH.
South DakotaNatural Resources Conservation Service South Dakota FFA
January 2018
Approximately 85 minutes
ObjectivesBy the end of the lesson, students will know or be able to:
• Define ammonification, ammonium, bulk density, denitrification, immobilization, leaching, mineralization, nitrate-nitrogen, nitrification, soil nitrogen fixation, and volatilization
• List and describe inherent factors that affect soil nitrogen• Describe factors of nitrogen management• Identify plants with nitrogen deficiency• Diagram the nitrogen cycle• Measure soil nitrate/nitrite and interpret results• Calculate subsample soil water content, dry weight of soil, volume of water, adjusted ppm soil
nitrate-nitrogen, estimated bulk density, pounds of nitrate-nitrogen/acre/depth sampled, and water nitrate content
Materials• Terms and Definitions• Clear plastic cup with gravel in it• Clear plastic cup with play-doh or clay pressed into it• Rice• Water• Management areas• Land to take soil samples• All laboratory supplies (See Lab Guided Notes)
Preparatory Work• Print all necessary copies• Secure permission to collect soil samples from the land owner
• Cut apart terms/definitions• Cut apart individual management points
Enroll the Participants (Approximately 5 minutes)Instruct students to inhale a deep breath. Ask students what is in the air they inhaled. Elicit responses.
Share the following information:
• The air we breathe in is 78 percent nitrogen, 21 percent oxygen and contains trace amounts of carbon dioxide, argon, helium and other elements.
• Nitrogen is the most abundant atmospheric element, and most limiting crop nutrient.• The nitrogen processes
o Turn nitrogen into useable forms for plantso Lead to nitrogen losseso Add nitrogen through nitrogen fixation, atmospheric deposition and fertilizers
Soil Nitrogen
Soil Nitrogen
2
Demonstrate the Relevance (Approximately 4 minutes)Instruct students to identify what they already know about each of the terms from other courses they may have taken.
Provide the Experience – Inherent Factors Affecting Soil Nitrogen (Approximately 5 minutes)Post the following factors in a location that is visible to all students:
Soil drainage Soil texture Slope steepness Rainfall Temperature
Site conditions (moisture, soil aeration, salt content)
Facilitate a discussion with the class about how these factors might affect soil nitrogen.
Provide the Experience – Defining Key Terms: Soil Nitrogen (Approximately 5 minutes)Divide the class of students into 10 small groups. Provide each group with one of the following terms and its definition. Instruct the small groups to develop a creative way to share the definition with the rest of the class. They might draw a picture, act out the definition, develop a creative way to write the term that depicts the definition, etc.
Ammonification Ammonium Denitrification Immobilization Leaching Mineralization Nitrate-Nitrogen Nitrification Soil Nitrogen Fixation Volatilization
Label the Information (Approximately 15 minutes)Instruct students to capture the definition of each term on their Guided Notes page as the small groups share the information with the class.

Soil Nitrogen
3
Label the Information (Approximately 7 minutes)Share the following information with students:
• Soil drainage, soil texture and slope steepness all impact nitrogen transportation and transformation processes that limit the availability of nitrogen to crops or lead to loss.
• Rainfall, temperature and site conditions all impact the rate of nitrogen mineralization from organic matter decomposition, nitrogen cycling and nitrogen losses through leaching, runoff or denitrification. Organic matter decomposition releases nitrogen quickly in warm, humid and aerated soils; it releases slowly in cool, dry, less aerated soils.
• Nitrogen in the nitrate-nitrogen form can leach out of the root zone. • Leaching rate is affected by soil texture and soil water content.
o Large pore spaces = quick leachingo Small pore spaces = water pools = loss of nitrogen as a gas
Demonstrate the Relevance (Approximately 4 minutes)Show students the clear plastic cup with the gravel in it. Pour a small amount of rice on top of the gravel and pour water over the rice. Point out how the rice moves from the top of the gravel down into the large pour spaces. Compare the rice to nitrogen.
Show students the clear plastic cup with play-doh or clay pressed into it. Pour a small amount of rice on top of the play-doh or clay and pour water over the rice. Point out that the rice and water both collect on top of the play-doh or clay. Compare the rice to nitrogen and point out how it might be lost into the atmosphere.
Provide the Experience – Soil Nitrogen Management (Approximately 10 minutes)Post the following 8-½ x 11 inch signs around the classroom or in an open area.
Sandy Soil Time Source Placement Irrigation Scheduling Management Strategies
Provide the class with the stack of nitrogen management points. Instruct students to attach their points to the correct management topic.
After all points have been posted, review each management topic and help the students move incorrectly assigned points to the correct location.

Soil Nitrogen
4
Label the Information (Approximately 12 minutes)Share the following information with the students and encourage them to add it to their Guided Notes:
• Sandy Soil- Leaching is a concern because of pore size- Nitrogen rate selection is the first concern- Rate is determined by assessing the amount of nitrogen needed to optimize yield based on the
agronomic, economic and environmental considerations- Increase the soil organic matter- Avoid compaction
• Time- Apply adequate amounts when the plants are growing and will use the nitrogen quickly- Apply nitrogen after the plants emerge (side dressing)- Apply a portion of nitrogen prior to emergence and a portion following emergence- Avoid applying urea materials during warm/humid conditions
• Source- Anhydrous Ammonia (least expensive nitrogen source)- Urea loss from ammonia volatilization can be reached by incorporation or by using stabilizers.- Organic amendments or manure, must be applied uniformly
• Placement - Side dressing: applications after plants emerge- Knifed applications: placing a band of fertilizer below the soil surface- Broadcast applications: uniformly distribute nitrogen- Sprinkler irrigation applications: applying fertilizer through the water distribution of an irrigation
system• Irrigation Scheduling
- Goal: to supply enough water to optimize yield while avoiding excess water, which can increase costs and cause nitrogen to leach below the root zone
Demonstrate the Relevance (Approximately 3 minutes)Share the following general management strategies with students:
• Management Strategieso Select an ammonium containing fertilizer which provides greater nitrogen recovery by cropso Inject nitrogen if possible to avoid ammonia or volatilization losseso Use nitrogen inhibitors when nitrogen is applied outside of the growing seasono Monitor crop nitrogen needs by scouting o Conduct regular soil testing for nitrate and soil salt contento Monitor for the common signs of nitrogen deficiency in plants
• Yellow “V”-shaped pattern • Progresses from the leaf tip to the leaf collar and from lower to upper leaves
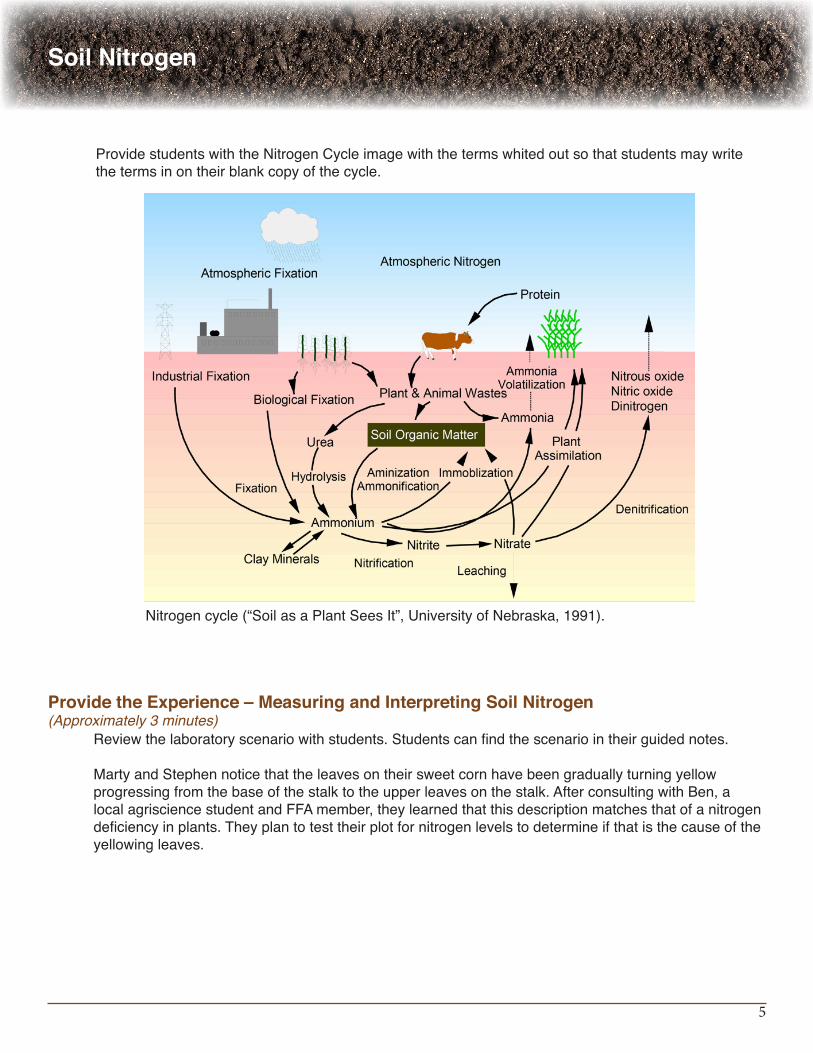
Soil Nitrogen
5
Provide the Experience – Measuring and Interpreting Soil Nitrogen(Approximately 3 minutes)
Review the laboratory scenario with students. Students can find the scenario in their guided notes.
Marty and Stephen notice that the leaves on their sweet corn have been gradually turning yellow progressing from the base of the stalk to the upper leaves on the stalk. After consulting with Ben, a local agriscience student and FFA member, they learned that this description matches that of a nitrogen deficiency in plants. They plan to test their plot for nitrogen levels to determine if that is the cause of the yellowing leaves.
Provide students with the Nitrogen Cycle image with the terms whited out so that students may write the terms in on their blank copy of the cycle.
Nitrogen cycle (“Soil as a Plant Sees It”, University of Nebraska, 1991).

Soil Nitrogen
6
Review the Content (Approximately 4 minutes)Facilitate students in making applications of the nitrate-nitrogen information to lives of consumers in the community. Consider discussing blue baby syndrome and the negative effects of heavy nitrates in water for the elderly.
Celebrate Student Success (Approximately 2 minutes)Congratulate students on their discovery of nitrate levels and encourage them to share the information with their parents.
Label the Information (Approximately 15 minutes)Review and identify each of the supplies from the soil testing kit that will be used during the lab activity.
• Soil probe for gathering soil samples• Plastic bucket for mixing soil samples• Nitrate-nitrite test strips• 1/8-cup (29.5-mL) measuring scoop• Calibrated 120-mL shaking vial with lid• Squirt bottle• Distilled water or rainwater• Pen, field notebook, sharpie and zip-lock bags
Review the steps of the laboratory activity and provide any instructions specific to your classroom expectations and time.
Demonstrate the Relevance (Approximately 70 minutes)See the attached laboratory guided notes for the steps to complete the laboratory. Review the results and analysis steps of the lab.
Ammonification: Production of ammonium (NH4) from soil organic matter decomposition and other sources
Ammonium: Form of nitrogen expressed as NH4, which is a plant-available form of nitrogen that occurs as part of the nitrogen cycle in soil; occurs from soil organic matter decomposition and other sources.
Denitrification: Conversion and loss of nitrate-nitrogen to various nitrogen gases when soil becomes saturated with water.
Definitions

Soil Nitrogen
7
Immobilization: The temporary “tying up” of inorganic nitrogen by soil microorganisms decomposing plant residues is not strictly a loss process. Immobilized nitrogen will be unavailable to plants for a time, but will eventually become available again as residue decomposition proceeds.
Leaching: Loss of nitrogen in the form of nitrate-nitrogen which is a water soluble, mobile form, with excess water that moves below the root-zone, or to drainage tile.
Mineralization: Organic matter decomposition which releases nutrients in a plant available form.
Nitrate Nitrogen: Form of nitrogen expressed as NO3, which is a plant-available form of nitrogen that occurs as part of the nitrogen cycle in soil. Nitrate is the form of nitrogen most susceptible toleaching loss.
Nitrification: Part of the nitrogen cycle where soil organisms convert ammonia and ammonium to nitrite and next to nitrate-nitrogen which is available to plants.
Soil Nitrogen Fixation: Conversion of nitrogen in the air to organic nitrogen forms, which occurs either by soil organisms or in association with legumes.
Volatilization: Ammonia nitrogen loss from nitrogen fertilizers and other sources. Loss can be especially high when nitrogen fertilizers containing urea are surface-applied directly on moist residue.

Sandy Soil

Time

Source
Placementof
Nitrogen Fertilizer

Irrigation Schedule

AdditionalManagement
Strategies

Soil Nitrogen
14
Nitrogen cycle (“Soil as a Plant Sees It”, University of Nebraska, 1991).

Soil Nitrogen
15
Guided Notes: Soil NitrogenAmmonification:
Ammonium:
Denitrification:
Immobilization:
Leaching:
Mineralization:
Nitrate-Nitrogen:
Nitrification:
Soil Nitrogen Fixation:
Volatilization:
Notes about Factors affecting Soil Nitrogen
Soil drainage Soil texture Slope steepness
Rainfall Temperature Site conditions

Soil Nitrogen
16
Guided Notes: Soil Nitrogen Laboratory
Nitrogen Management
Sandy Soil Time Source
Placement Irrigation Scheduling Management Strategies
Soil Nitrogen Scenario
Marty and Stephen notice that the leaves on their sweet corn have been gradually turning yellow progressing from the base of the stalk to the upper leaves on the stalk. After consulting with Ben, a local agriscience student and FFA member, they learned that this description matches that of a nitrogen deficiency in plants. They plan to test their plot for nitrogen levels to determine if that is the cause of the yellowing leaves.
Laboratory Supplies
• Soil probe for gathering soil samples• Plastic bucket for mixing soil samples• Nitrate-nitrite test strips• 1/8-cup (29.5-mL) measuring scoop• Calibrated 120-mL shaking vial with lid• Squirt bottle• Distilled water or rainwater• Pen, field notebook, sharpie and zip-lock bags
Laboratory Steps
Electrical conductivity measurements should always be measured first, before measuring nitrate or nitrite on the same sample. Soil phosphate and soil pH can also be measured using the following steps.
Soil nitrate-nitrogen levels are highly variable, depending on management history, field location and time of year. For example, erosion rates, soil texture, organic matter content and applications of manure or fertilizer.

Soil Nitrogen
17
In-Field Quick Hand Test
1. Use the soil probe to gather a minimum of 10 small soil samples randomly from an area that represents the soil type and management history you desire to test. Samples should be taken from a depth of eight inches for the surface test and a depth of three feet for subsurface testing. Place the samples in the small bucket and exclude large stones and residue from the sample. Repeat this step for each sampling area.
2. Neutralize your hands by rubbing moist soil across your palms and discard the soil.
3. Place a scoop of mixed soil in the palm of your hand and saturate it with clean distilled or rain water.
4. Squeeze the soil gently until a water slurry runs out into the cup of your hand on the side.
5. Touch the nitrate test strip tip directly to soil water slurry so that the tip is barely wet so solution is drawn up at least 1/8-inch to 3/16-inch.
6. After one to two minutes, measure nitrate by comparing color of wetted test strips to color picture scale on container test strips were stored. The color that most closely matches the test strip is the amount of nitrate in water saturated soil.
7. To test nitrite levels, the procedure is repeated after nitrate test pad on the end of the strip is cut off to expose the nitrite test strip to the soil slurry.
1:1 Soil-Water Soil Nitrate-Nitrite Test in Classroom
1. Use the soil probe to gather a minimum of 10 small soil samples randomly from an area that represents the soil type and management history you desire to test. Samples should be taken from a depth of eight inches for the surface test and a depth of three feet for subsurface testing. Place the samples in the small bucket and exclude large stones and residue from the sample. Repeat this step for each sampling area.
2. Add one sampling scoop (29.5 ml) of mixed soil that has been tamped down during filling by striking carefully on a hard level surface. Then add one scoop (29.5 ml) of water to the same vial resulting in a 1:1 ratio of soil to water, on a volume basis.
3. Tightly cap the vial and shake 25 times. Let the mixture settle for one minute. Remove cap and gently pour 1/16-inch of the soil water 1:1 mixture carefully into the lid.
4. After setting for two to three minutes in the lid, immerse the end of the nitrate test strip 1/16-inch into 1:1 soil water mixture until the liquid is drawn up at least 1/8-inch to 3/16-inch beyond the area masked by soil.
5. After one to two minutes, measure nitrate by comparing the color of the wetted test strips to color picture scale on container test strips were stored. The color that most closely matches the test strip is the amount of nitrate in water saturated soil.
6. To test nitrite levels, the procedure is repeated after the nitrate test pad on the end of the strip is cut off to expose the nitrite test strip to the soil slurry.

Soil Nitrogen
18
Class (texture, organic matter) Average Bulk Density (g/cm3)
Organic Matter 0.22
Sand 1.56
Loamy Sand 1.54
Sandy Loam 1.50
Loam 1.45
Silt Loam 1.20
Sandy Clay Loam 1.63
Silty Clay 1.55
Clay Loam 1.45
Silty Clay Loam 1.40
Interpretations
Soil nitrate-nitrogen is an excellent indicator of nitrogen-cycling in soils, whether carryover nitrogen was used by the previous crop and whether additional nitrogen is needed. High nitrate-nitrogen levels also signal potential for excessive nitrogen applied in the past, high rates of organic nitrogen mineralization and potential for losses from denitrification, leaching or volatilization.
Typically, an early season measurement of 20 parts per million nitrate-nitrogen in topsoil (30 cm) is sufficient to produce a good corn yield and most other high nitrogen-use crops, whereas a value of only 14 parts per million is sufficient where animal manure is applied or where corn or other high nitrogen use crop follows a legume crop. A very high soil nitrate-nitrogen value above 40 parts per million in topsoil will turn off the ability of bacteria and legumes to fix nitrogen. Therefore, nitrogen applications should be managed to keep nitrate-nitrogen levels below this value. Nitrate-nitrogen levels must be adjusted for soil bulk density and moisture content of the soil as shown in Table 1.
Table 1. Average bulk density for soil minerals (texture) and organic matter (Rawls 1983).

Soil Nitrogen
19
Soil Nitrate Nitrogen Calculations – Use to Complete Table 2
Ex. 1 Data: Silty Clay Loam texture, 8-inch sample depth; 2 percent organic matter estimate from soil color chart; no bulk density (BD) measurement (BD based estimated values from Table 1).
Sampling depth conversion: Sampling depth in centimeters (cm) = inches (sampling depth) x (2.54cm/in)
Ex. 1: 8 inch (sampling depth) x 2.54 = 20 cm sampling depth
Subsample Soil water content (g/g) = (weight of moist soil – weight of oven dry soil) (Weight of oven dry soil)
Ex. 1: (41.0g – 32.5g) = 0.262 g of water/g of soil 32.5 g
Dry weight of soil = (weight of soil in scoop) / (1+ soil water content(decimal))
Ex. 1: (41.0gr / (1 + .262g/g)) = 32.5g
Volume (weight) of water = water added to soil in grams + (dry weight of soil x soil water content g/g)
(1ml water = 1g)
Ex. 1: 29.5g + (32.5g x .262g/g) = 38 g
Adjusted ppm soil Nitrate-N = (ppm NO3-N of 1:1 mix) x (volume of water content in extract & soil) dry weight of soil extracted
Ex. 1: (20ppm x 38.0g) / 32.5g = 23.4 ppm (adjusted)
Estimated Bulk Density (refer to bulk density educator guide to calculating actual bulk density or use estimate from Table 1 as shown below)
Est. Bulk Density (Table 2) = 100 (% organic matter/organic Matter BD) + ((100 - % organic matter)/avg soil BD)
Ex. 1: 100 = 1.26 g/cm3 (estimated bulk density (BD)) (2.0/0.22 g/cm3) + ((100 – 2)/1.40 g/cm3)
Lbs of nitrate-N/ acre/depth sampled = (adjusted ppm NO3-N) x (cm depth soil sampled/10 ) x estimated soil bulk density x 0.89 (conversion factor)
Ex. 1: 23.4 ppm NO3-N X (20 cm/10) x 1.26 g/cm3 (estimated BD) x 0.89 = 52.5 lbs/Nitrate Nitrogen/20cm sampling depth

Soil Nitrogen
20
Table 2. Soil nitrate-nitrogen (based on sampling depth).
Site *Sample Depth
(inches or cm)
Nitrate-Nitrogen
(ppm) From test
strip
*Adjusted Nitrate-
Nitrogen (ppm)
*Bulk Density (g/cm3)
*Lbs of nitrate-
Nitrogen/ acre/depth
sampled
**Nitrite-Nitrogen
(ppm) from test
strip
Notes:
Ex1 8” or 20cm 20ppm 23.4 ppm 1.26 52.5 lbs NA Spring Nitrogen-test just prior to planting
* Follow soil nitrate calculation steps based on sampling depth (Ex. 1 is based on 8-inch sample depth).** When nitrate-nitrogen exceeds 40 ppm, or EC exceeds 0.6 ds/m nitrite should also be measured.

Soil Nitrogen
21
Water Nitrate or Nitrite Content
Water nitrate and nitrite levels can be estimated for drinking water, irrigation water and other water sources. Cloudy samples, such as runoff or water from ponds, will need to be filtered first before testing. Drinking water treatment should be considered if nitrate levels exceed 10 mg/l nitrate-nitrogen. This is considered the maximum contaminate level by the Environmental Protection Agency.
Consult your local health officials and be aware that nitrate levels in groundwater may vary seasonally. If your water tests high or borderline high, retest your water every three to six months. Nitrates in irrigation water can be credited for nitrogen supplied to crops using the formula footnoted in Table 3.
1. Collect water sample in a small plastic container.2. Filter the water sample if it is cloudy.3. Place one or two drops of water on the nitrate-nitrite test strip.4. After 30 seconds, compare the color to the nitrite scale on the bottle and record the nitrite levels.5. After 60 seconds, compare the color to the nitrate scale on the bottle and record the nitrate in ppm
on Table 3.
Site Nitrate-Nitrogen (ppm) from test
strip
Nitrite-Nitrogen(ppm) from test
strip
Irrigation Water Applied (inches/
ac pumped)
Irrigation Water
Nitrogen Credit lbs of
Nitrogen/acreEX 1 20ppm NA 12” 54 lbs
N/ac
Table 3. Water nitrate and nitrite-nitrogen.

Soil Nitrogen
22
Are the soil nitrate levels adequate for crops being grown?
Does the total amount of nitrate-nitrogen in the soil appear too high or too low based on nitrogen application rates, methods and timing of application?
Do you expect nitrate-nitrogen to be lost to leaching, volatilization, denitrification or other losses? Why or why not?
If you tested drinking water for nitrate-nitrogen, do levels exceed 10 mg/l nitrate-nitrogen ppm? If so, what steps should you take?
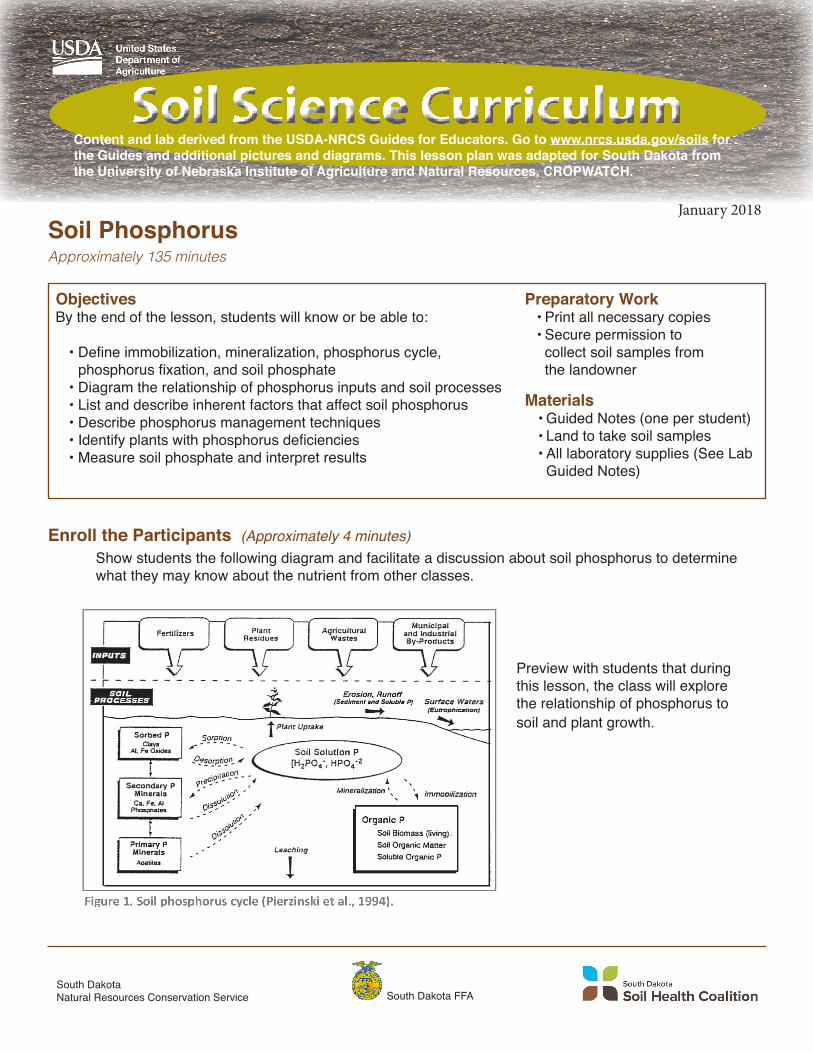
Soil Science CurriculumContent and lab derived from the USDA-NRCS Guides for Educators. Go to www.nrcs.usda.gov/soils for the Guides and additional pictures and diagrams. This lesson plan was adapted for South Dakota from the University of Nebraska Institute of Agriculture and Natural Resources, CROPWATCH.
South DakotaNatural Resources Conservation Service South Dakota FFA
January 2018
Approximately 135 minutes
ObjectivesBy the end of the lesson, students will know or be able to:
• Define immobilization, mineralization, phosphorus cycle, phosphorus fixation, and soil phosphate
• Diagram the relationship of phosphorus inputs and soil processes• List and describe inherent factors that affect soil phosphorus• Describe phosphorus management techniques• Identify plants with phosphorus deficiencies• Measure soil phosphate and interpret results
Materials• Guided Notes (one per student)• Land to take soil samples• All laboratory supplies (See Lab Guided Notes)
Preparatory Work• Print all necessary copies• Secure permission to collect soil samples from the landowner
Enroll the Participants (Approximately 4 minutes)Show students the following diagram and facilitate a discussion about soil phosphorus to determine what they may know about the nutrient from other classes.
Soil Phosphorus
Preview with students that during this lesson, the class will explore the relationship of phosphorus to soil and plant growth.
Soil Phosphorus
2
Demonstrate the Relevance (Approximately 4 minutes)Discuss the following key points with the class:
1. Phosphorus is the second most limiting factor in terms of plant growth, next only to nitrogen.
2. Phosphorus plays a key role in plant growth and reproduction – promotes root growth, hardiness, quicker maturity, efficient water use, increased yields and promotes above ground shoot growth.
Provide the Experience – Inherent Factors Affecting Soil Phosphorus(Approximately 5 minutes)
List the following factors that are affected by soil properties and climate for the class:
Soil aeration Rainfall Temperature Moisture Salinity
Elicit thoughts from the students as to how each of those factors might affect soil phosphorus.
Provide the Experience – Defining Key Terms (Approximately 3 minutes)List off the five key terms and ask students to share with the class what they currently know about the terms.
Label the Information (Approximately 5 minutes)Review the terms and definitions using the information found here.
Immobilization: temporarily “tying up” of water soluble phosphorus by soil microorganisms decomposing plant residues. Immobilized phosphorus will be unavailable to plants for a time, but will eventually become available again as decomposition proceeds.
Mineralization: nutrients contained in soil organic matter are converted to inorganic forms that are available to crops during respiration.
Phosphorus Cycle: phosphorus cycles between many different forms in soil. Some forms are available to plants and other forms are not. Unavailable forms are generally fixed to iron, aluminum and calcium minerals.
Phosphorus Fixation: phosphate fixates to iron, aluminum and calcium minerals and attached to clay minerals. pH levels affect fixation and availability of phosphorus.
Soil Phosphate: a form of phosphate available to plants and is expressed as PO4.

Soil Phosphorus
3
Label the Information (Approximately 7 minutes)Share the following points with the class.
Direct students to their Guided Notes and add the following information about each inherent factor:
• Inherent factors affect the rate of phosphorus mineralization from the decomposition of organic matter• Phosphorus releases quickly in warm, humid areas with well-aerated soil• Phosphorus releases slowly in cool, dry areas with saturated soil• Phosphorus is most available in soil with a pH range of 6-7.5• pH levels of <5.5 or between 7.5 and 8.5 limit phosphorus availability• Phosphorus is most frequently lost through erosion and runoff
Demonstrate the Relevance (Approximately 3 minutes)Provide the following scenario and question to students and elicit student thoughts.
In a well-aerated soil found in an area that is warm and humid, what would you anticipate the phosphorus levels to be, given a pH of 5.0?
Even though the soil has the right climate and aeration conditions, the pH has a greater influence and will cause the phosphorus availability to be low.
Provide the Experience – Symptoms of Deficiency and Management of Soil Phosphorus (Approximately 3 minutes)
Show students pictures of phosphorus-deficient plants. Ask students to identify the characteristics of the plants that they see with the deficiency.
Label the Information (Approximately 5 minutes)Share the following information with the students and encourage them to add it to their Guided Notes:
• Symptoms of a phosphorus deficiency include:- Purple leaf tissue- Purple coloring moves from the leaf tips to the leaf margins- Symptoms appear on lower leaves; leaves may eventually die
• Emerging leaves may be green because plants move phosphorus to youngest leaves• Cool and wet growing conditions increase symptom occurrence• Plants with small or poor root systems are very vulnerable• When root growth is prohibited by these factors, the problem is enhanced:
- Cool temperatures- Too wet or dry- Compacted soil- Damage from herbicides- Damage from insects- High salinity- Damage to roots

Soil Phosphorus
4
Demonstrate the Relevance (Approximately 7 minutes)Direct students to their Guided Notes to capture the following information.
• Phosphorus deficiency reduces the yield of plants:- Delays maturity- Stunts growth- Restricts energy utilization by the plant
• Soil pH, organic matter amount and placement of fertilizer affect the availability of phosphorus• Adding lime to acidic soils can help correct pH to 6.5-7.0• Place phosphorus two inches below the planted seed• Make several small applications of fertilizer rather than one big application• Place the phosphorus near the crop row where the roots have immediate contact with it
Provide the Experience – Measuring and Interpreting Soil Phosphate (Approximately 3 minutes)
Review the laboratory scenario with students. Students can find the scenario in their Guided Notes.
After walking through several cornfields, Tom and Rik noticed that several plants have purple leaves. Tom recalled from his agronomy class last fall that purple leaves can indicate a shortage of phosphate. Together, they determine that they need to test each of their fields for inadequate phosphate levels.
Label the Information (Approximately 15 minutes)Review and identify each of the supplies from the soil testing kit that will be used during the lab activity.
• Soil probe for gathering soil samples• Plastic bucket for mixing soil samples• Phosphate test strips• 1/8-cup (29.5-mL) measuring scoop• Calibrated 120-mL shaking vial with lid• Squirt bottle• Distilled water or rainwater
Demonstrate the Relevance (Approximately 125 minutes)See the attached laboratory Guided Notes for the steps to complete the laboratory. Review the results and analysis steps of the lab.
Review the Content (Approximately 4 minutes)Instruct students to find a partner and to “interview” one another about key points learned during the soil phosphorus lesson.
Celebrate Student Success (Approximately 2 minutes)Congratulate students on their discovery of phosphorus level results for their tested soil. Encourage students to continue being curious during each of the laboratory activities of the soil science unit.

Soil Phosphorus
5
Guided Notes: Soil Phosphorus
Immobilization:
Mineralization:
Phosphorus Cycle:
Phosphorus Fixation:
Soil Phosphate:

Soil Phosphorus
6
The Factors that Affect Soil Phosphorus:
Phosphorus Deficiency:

Soil Phosphorus
7
Guided Notes: Soil pH Laboratory
Soil pH Scenario
After walking through several cornfields, Tom and Rik noticed that several plants have purple leaves. Tom recalled from his agronomy class last fall that purple leaves can indicate a shortage of phosphate. Together, they determine that they need to test each of their fields for inadequate phosphate levels.
Laboratory Supplies
• Soil probe for gathering soil samples• Plastic bucket for mixing soil samples• Phosphate test strips• 1/8-cup (29.5-mL) measuring scoop• Calibrated 120-mL shaking vial with lid• Squirt bottle• Distilled water or rainwater• Pen, field notebook, sharpie and zip-lock bags
Laboratory Steps
Electrical conductivity measurements should always be completed first, before measuring phosphate on the same sample. Soil nitrate-nitrite and soil pH can also be assessed on the same sample using the following steps.
Phosphate levels are variable, depending on field location, past management and time of year. Phosphorus fertilizer placement, soil texture, organic matter content and applications of manure or fertilizer affect the phosphate levels.
In-Field Quick Hand Test
1. Using a soil probe, gather at least 10 small samples randomly from the area that represents the soil type and management history to be tested. Ensure that each sample is taken at a depth of eight inches.
2. Place each sample into the plastic bucket provided. 3. Remove large stones and plant residue from the sample. 4. Mix the soil together.5. Rub wet soil across your palms to neutralize your hands. Discard this soil.6. Place a scoop of mixed soil in your palm and saturate the soil with distilled water or rainwater.7. Squeeze the wet soil gently until the water runs out of the cup of the hand and onto the side of
the soil sample.8. Touch the phosphate test strip into soil water slurry so that the tip is barely wet until the liquid is
drawn up at least 1/8-inch to 3/16-inch beyond the area masked by soil. 9. After one to two minutes, measure the phosphate by comparing the color of the wetted test strips
to the color scale on the test strip container. The color that most closely matches that of the test strip is the amount of phosphate in water saturated soil. Record the value in Table 1.

Soil Phosphorus
8
Guided Notes: Soil pH Laboratory1:1 Soil-Water Soil Phosphate Test in Classroom
1. Complete Step 1 from the In-Field Quick Hand Test.2. Tamp down one sampling scoop (29.5 mL) of mixed soil by striking the scoop carefully on a
hard, level surface. Place the sample in the plastic mixing vial. 3. Add one scoop (29.5 mL) of water to the same vial. The vial will contain a 1:1 ratio of soil to
water, on a volume basis.4. Place the cap on the vial tightly and shake the vial 25 times.5. Let the sample settle for one minute. 6. Remove the vial cap and gently pour 1/16-inch of soil-water solution carefully into the lid.7. Let the sample sit in the lid for two or three minutes. 8. Immerse the end of the phosphate test strip 1/16-inch into the 1:1 soil water mixture until liquid
is drawn up at least 1/8-inch to 3/16-inch beyond the area masked by soil. 9. After one or two minutes, measure phosphate by comparing the color of the wetted test strips to
the color picture scale on the bottle in which test strips were stored. The color that most closely matches the test strip is the index value of phosphate in water saturated soil.
10. Record the soil phosphate value in Table 1.
Table 1. Phosphorus test results and recommendations for corn in South Dakota soils based on standard extractable phosphorus tests and water soluble PO4 test for a 1:1 soil:water mixture.
Site Water Soluble PO4 Test Reading for 1:1 Soil:Water Mixture
Soil P Test Values (ppm) by P-test Method
PO4 (ppm)
Relative PO4 Level Water Soluble PO4

Soil Science CurriculumContent and lab derived from the USDA-NRCS Guides for Educators. Go to www.nrcs.usda.gov/soils for the Guides and additional pictures and diagrams. This lesson plan was adapted for South Dakota from the University of Nebraska Institute of Agriculture and Natural Resources, CROPWATCH.
South DakotaNatural Resources Conservation Service South Dakota FFA
January 2018
Approximately 90 minutes
ObjectivesBy the end of the lesson, students will know or be able to:
• Define infiltration rate, restrictive layers, soil aggregates, soil porosity, and steady-state infiltration• List and describe inherent factors that affect soil infiltration• Describe soil infiltration management practices• Explain soil infiltration problems and how they affect soil function• Measure soil infiltration and interpret results
Materials• Guided notes (one per student)• Clear plastic cup filled with marbles• Clear plastic cup filled with Play-Doh • Water• 8-½ x 11 paper that• Laboratory supplies (see Guided Notes Lab)• Notecards with terms
Preparatory Work• Print all necessary copies• Secure permission to collect soil
samples from the land owner• Create note cards with key terms• Create note cards with definitions• Hide note cards in the classroom
Enroll the Participants (Approximately 4 minutes)Set up the clear plastic cups – one filled with marbles, the other with Play-Doh – in an area where they are visible to all students.
Ask students to hypothesize which cup will provide the quickest flow rate of the water.
Pour an equal amount of water into each of the cups and encourage students to monitor the two rates.
Use the following questions to facilitate a conversation with the students:
What caused one rate to be faster than the other?
How might this demonstration be comparable to how water and soil interact together?
Inform students that during this lesson, the class will explore soil infiltration rates, what affects it, problems that exist and management of it.
Soil Infiltration: Factors that Affect It; Existing Problems; Management

Soil Infiltration: Factors that Affect It; Existing Problems; Management
2
Demonstrate the Relevance (Approximately 3 minutes)Instruct students to discuss with someone near them how each of the terms might affect plant growth in soils.
Provide the Experience – Inherent Factors Affecting Soil Infiltration(Approximately 2 minutes)
Refer back to the cup of marbles and cup of clay. Ask the students the following questions:
Which material as larger pore space?How does pore space affect infiltration rate?
Label the Information (Approximately 2 minutes)Share the following information with the students:
Soils with a sandy texture has large pores and water moves through it quickly, like the marbles.
Soils with a clayey texture has small pores and water moves through it slowly, like the Play-Doh.
Soil texture, as discovered in the previous labs, is an inherent factor, meaning it cannot be changed.
Provide the Experience – Defining Key Terms: Soil Infiltration (Approximately 3 minutes)Direct students to search the room for note cards with key terms and definitions on them for this lesson.
Instruct students to work together to match the terms and definitions.
Label the Information (Approximately 5 minutes)Review the terms and definitions using the information found here:
Infiltration Rate: A measure of how fast water enters the soil, typically expressed in inches per hour but recorded in minutes for each inch of water applied to the soil surface.
Restrictive Layers: Compacted layers and layers of dense clay, bedrock or other restrictive features than limit infiltration below the surface of the soil.
Soil Aggregates: Soil particles held together by organic matter and related substances. Well aggregated soils have higher infiltration rates and are less prone to erosion.
Soil Porosity: Amount of pore space in the soil. Soils with higher porosity have more pore space and higher infiltration rates than those with lower porosity.
Steady-State Infiltration: The infiltration rate is steady and does not increase or decrease as morewater is added. It typically occurs when the soil is nearly saturated.

Soil Infiltration: Factors that Affect It; Existing Problems; Management
3
Demonstrate the Relevance (Approximately 4 minutes)Ask students to predict what type of soil they believe exists around the school, in their yard, in theirfields, etc. Elicit responses.
Provide the Experience – Managing Soil Infiltration (Approximately 4 minutes)Share with students that management practices affect the following:
Surface crusting Compaction Soil Organic Matter
Ask students to discuss how surface crusting, compaction and soil organic matter might affectinfiltration rates.
Label the Information (Approximately 5 minutes)Share the following information with the students and encourage them to add it to theirGuided Notes:
• Soil Crusting- Soils dry out, causing pore space to increase as cracks form- Water fills the cracks quickly, wetting the soil- As soil becomes wetter, the infiltration rate slows because of restrictive layers
• Compaction- Results from equipment and tillage practices- Minimizes pore space- Slows water movement through the soil profile
• Soil Organic Matter- Bare soil is more drastically affected by erosion by rain drops- Dislodged soil particles fill in and block surface pores- Organic matter binds soil particles together, forming aggregates; aggregates increase
porosity and infiltration rates- Organic matter encourages a living environment for organisms such as earthworms;
organisms move about in the soil and increase pore space• Improve Infiltration Rates by
- Avoiding soil disturbance and equipment operation when soils are wet- Using designated field roads or rows for equipment traffic- Reducing the number of trips across the space- Sub-soiling to break up existing compacted layers- Using continuous no-till- Adding solid manure or other organic materials- Using rotations with high-residue crops, such as corn and small grain, and perennial crops,
such as grass or alfalfa- Planting cover crops and green manure crops- Farming on the contour- Establishing terraces to minimize run-off and erosion

Soil Infiltration: Factors that Affect It; Existing Problems; Management
4
Demonstrate the Relevance (Approximately 3 minutes)Instruct students to identify something their family does (in their fields, garden or yard) or something another individual in the community does to minimize soil compaction. Also consider challenging students to identify something they could do.
Provide the Experience – Soil Infiltration Problems (Approximately 5 minutes)Divide students into five small groups and provide each group with one of the following soil infiltration problems. Instruct each groups to discuss and be prepared to present what the problem could cause and potential solutions.
Rainfall rate exceeds the soil’s infiltration capacityRunoff moves downslope or causes pondingRunoff removes nutrients, chemicals and soilAeration of soil is poor because of slow infiltration and ponding
Label the Information (Approximately 7 minutes)Instruct small groups to share their thoughts on the results of the problem and their possible solutions.
Fill in with the following information:
• Rainfall rate exceeds the soil’s infiltration capacity- Water ponds, causing drowning of plants
• Runoff moves downslope or causes ponding- Erosion results, plants drown
• Runoff removes nutrients, chemicals and soil- Decreases soil productivity, off-site sedimentation of water bodies occurs, water health diminishes
•Aeration of soil is poor because of slow infiltration and ponding- Poor root function- Poor plant growth- Reduced availability of nutrient to plants- Reduced cycling of nutrients by soil organisms
Demonstrate the Relevance (Approximately 4 minutes)Discuss with students how a farmer is economically affected by poor soil infiltration and howconsumers are economically affected as well.

Soil Infiltration: Factors that Affect It; Existing Problems; Management
5
Provide the Experience – Measuring and Interpreting Soil Infiltration (Approximately 3 minutes)
Review the laboratory scenario with students. Students can find the scenario in their guided notes.
A local farmer recently purchased some recreational ground and plans to turn the space into farmground. One concern the farmer has is regarding the amount of vehicular traffic that has occurredon the former recreational ground. The worry is that the transportation has negatively affected theground’s ability to infiltrate water.
Label the Information (Approximately 15 minutes)Review and identify each of the supplies from the soil testing kit that will be used during the lab activity.
• 3-inch diameter ring• Plastic driver (mallet)• Small block of wood• Plastic wrap• Plastic bottle marked at 107 mL (for one inch of water) or graduated cylinder• Distilled water or rainwater• Stopwatch or timer
Review the steps of the laboratory activity and provide any instructions specific to your classroomexpectations and time.
Demonstrate the Relevance (Approximately 25 minutes)See the attached laboratory Guided Notes for the steps to complete the laboratory. Review the results and analysis steps of the lab.
Review the Content (Approximately 4 minutes)Review the process students used to test the soil infiltration rates. Discuss how soil infiltration relates to each of the other lab topics covered during the unit.
Celebrate Student Success (Approximately 2 minutes)Congratulate students on their discovery of infiltration rates and their understanding of how infiltration rates relate to other lab topics.

Soil Infiltration: Factors that Affect It; Existing Problems; Management
6
Guided Notes: Soil Infiltration
Vocabulary Matching
Infiltration Rate
Restrictive Layers
Soil Aggregates
Soil Porosity
Steady-State Infiltration
Inherent Factors Affecting Soil
Infiltration
Soil Infiltration Management Practices
Soil Crusting
Compaction
Soil Organic Matter

Soil Infiltration: Factors that Affect It; Existing Problems; Management
7
Improve Infiltration Rates by:
Problems associated with soil infiltration
Rainfall rate exceeds the soil’s infiltration capacity
Runoff moves downslope or causes ponding
Runoff removes nutrients, chemicals and soil
Aeration of soil is poor because of slow infiltration and ponding

Soil Infiltration: Factors that Affect It; Existing Problems; Management
8
Guided Notes: Soil Infiltration LaboratorySoil Infiltration Scenario
A local farmer recently purchased some recreational ground and plans to turn the space into farm ground. One concern the farmer has is regarding the amount of vehicular traffic that has occurred on the former recreational ground. The worry is that the transportation has negatively affected the ground’s ability to infiltrate water.
Laboratory Supplies
• 3-inch diameter ring• Plastic driver (mallet)• Small block of wood• Plastic wrap• Plastic bottle marked at 107 mL (for one inch of water) or graduated cylinder• Distilled water or rainwater• Stopwatch or timer
Laboratory Steps
Select a test site that provides at least two areas that are under different management. (As an example, in a row crop field, the two areas would be a wheel traffic row and a row without wheel traffic.) If possible, measure the bulk density of each location prior to doing this lab.
Plan to conduct multiple ring measurements since a single ring measurement is only an estimate.
Conduct the test during a time when the surface soil is not unusually dry. Add water to the surface ifnecessary and allow enough time for the water to soak in prior to conducting the test or conduct thetest after rain or irrigation.
Infiltration Test
1. Clear all residue from the soil surface.2. Drive the ring to a depth of three inches using a small sledge and plastic impact driver or block
of wood.3. Gently firm the soil around the inside of the ring to avoid any gaps.4. Line the ring with plastic wrap so that it covers the inside of the ring and drapes over the side.5. Pour 107 mL of distilled water or rainwater into the plastic-lined ring.6. Gently pull plastic wrap away.7. Record the time it takes for water to infiltrate soil. Stop time is when the soil is “glistening” from
the water.8. Repeat steps 2, 3 and 4 with another inch of water to estimate steady-state infiltration.9. Record results in Table 1.10. The ring can be removed with soil intact for use indoors in the respiration test and/or bulk
density test. Consult with your teacher.
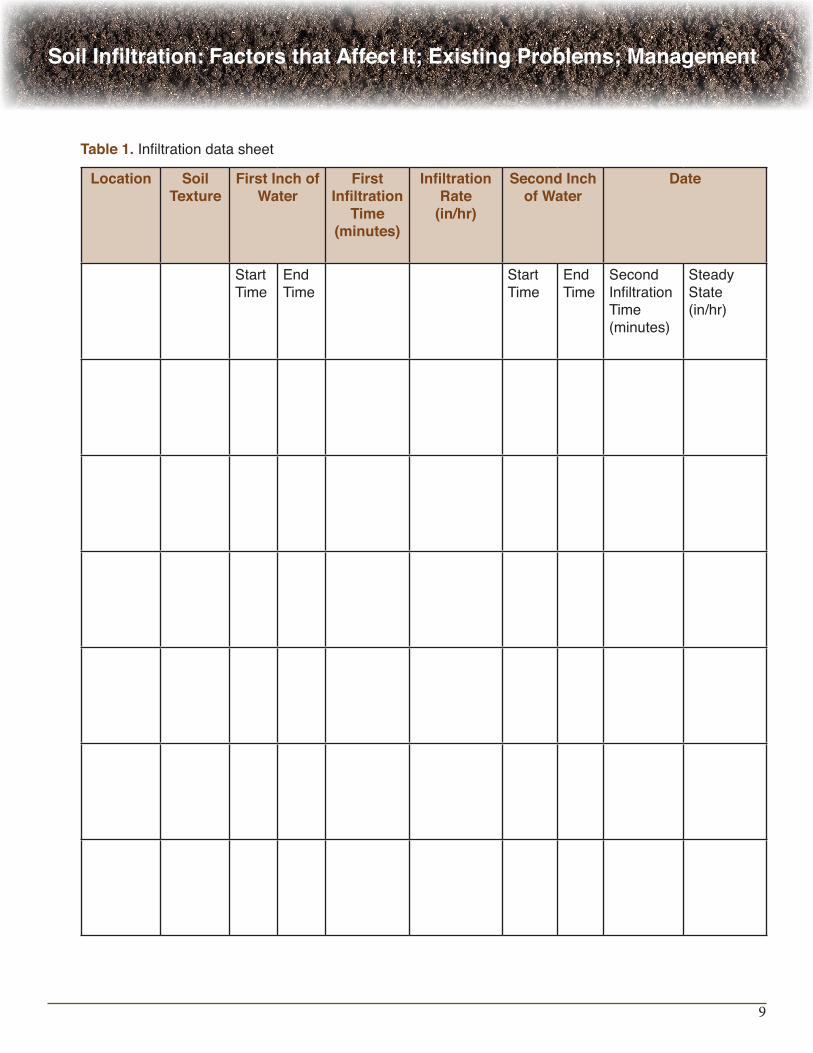
Soil Infiltration: Factors that Affect It; Existing Problems; Management
9
Table 1. Infiltration data sheet
Location Soil Texture
First Inch of Water
First Infiltration
Time(minutes)
Infiltration Rate
(in/hr)
Second Inch of Water
Date
StartTime
EndTime
StartTime
EndTime
SecondInfiltrationTime(minutes)
SteadyState(in/hr)

Soil Infiltration: Factors that Affect It; Existing Problems; Management
10
Did the rate change from the first to the second inch? Why or why not?
Was a steady-state infiltration rate achieved? How do you know? Do you need to add a third inch of water?

Soil Science CurriculumContent and lab derived from the USDA-NRCS Guides for Educators. Go to www.nrcs.usda.gov/soils for the Guides and additional pictures and diagrams. This lesson plan was adapted for South Dakota from the University of Nebraska Institute of Agriculture and Natural Resources, CROPWATCH.
South DakotaNatural Resources Conservation Service South Dakota FFA
January 2018
Approximately 60 minutes
ObjectivesBy the end of the lesson, students will know or be able to:
• List and describe the steps and details of the scientific method
• Build an experiment using the scientific procedure
• Conduct an experiment using the scientific procedure
Materials• One Guided Notes packet for each student• Projector• One computer with internet access per student
Preparatory Work• Review the www.sciencebuddies.org web site to review the process students will go through to identify an experiment
Enroll the Participants (Approximately 3 minutes)
Post the following task so that it is visible to all students as they enter the classroom:
Consider your career goals. Identify which of the following six pathways best fits your ideal career.
Animal SystemsEnvironmental Services/Natural Resources SystemsFood Products and Processing SystemsPlant SystemsPower, Structural and Technical SystemsSocial Systems
Write down your career goal, which pathway best relates to it, and a question you have about the career.
Upon student completion of the task, discuss the following information with the class:
The pathways listed are the six pathways available through the Agriculture, Food and NaturalResources Career Cluster.
The Scientific Method

The Scientific Method
2
Provide the Experience – List and Describe the Steps and Details of the Scientific Method (Approximately 30 minutes)
Provide students with their Guided Notes packet and direct them to the web sitewww.sciencebuddies.org to complete their Guided Notes and to identify an experiment. Explore the web site prior to sending students to the web site so that you may provide guidance specificallyaround the topic selection.
Label the Information (Times varies)Students complete their Guided Notes to learn the key parts of the scientific method.
Demonstrate the Relevance (Time varies)Students identify their experiment topic and seek approval from the teacher. Following topicapproval, students use their guided notes to design their experiment, and after approval is received from the teacher, begin conducting their experiment.
Review the Content (Time varies)At the conclusion of the experiments, direct students to report their results to the class or to anotherpertinent group.
Celebrate Student Success (Time varies)Take time throughout the duration of the experiment design and implementation to commend students for their efforts and independent work. After students share their results with their classmates, consider presenting each student with their own “Super Scientist” award.
The pathways are also the six categories for the FFA Agriscience Fair (if time permits, you could play the promotional video found under the Agriscience Fair tab at www.ffa.org.)
Because we are in a constant state of new information being generated in our world, students’careers will look much differently than careers in the past have looked – we will constantly be askingquestions and seeking answers.
Often times we may be asked to research a topic or contribute to a larger project usingresearched data.
During this lesson, we will explore the scientific method and create and conduct our own experiment.

The Scientific Method
3
Guided NotesCongratulations on learning all that you have about soil science thus far in the unit. As you approachthe end of the unit, you will have the chance to engage in many different experiments, depending on the time available for your class. During this lesson, we will explore the scientific method and you will design and conduct your very own short experiment in preparation for more soil science experiments. Follow these simple steps to begin:
1. Log on to www.sciencebuddies.org.2. Click on the orange “Project Guide” tab at the top of the page.3. Click on the “Scientific Method” link.
Use the information found on the web site to complete the following tasks and questions:
1. What type of relationships are explored by scientists during experiments and research?
2. List the six steps of the scientific method:
3. What words might start our questions about observations we make in the world around us?
4. When we identify the question we want to ask at the start of an experiment, what characteristics must we ensure the question has?
5. What six guiding questions can we use during our background research?

The Scientific Method
4
6. What is a model for writing a hypothesis?
7. A hypothesis must be _______________, must answer the ___________________________ and we must identify the variables. What are variables and how many variables should change at one time?
8. How do we ensure that we conduct a fair experiment?
9. If our hypothesis is proven incorrect, what is our next step?
10. If our hypothesis is proven correct once, what might we do next to ensure that the hypothesis is indeed correct?
11. List three ways we can communicate the results of an experiment.
Now that we know some basic information about the scientific method, start the process ofconstructing your experiment.
1. Click on the “Your Question” link under the section labeled “Ask a Question.”2. Click on “The Topic Selection Wizard” link.”3. Begin and complete the process of identifying your experiment topic by filling in the Wizard form and
answering the questions that follow.4. Identify your topic from the list provided (or come up with your own, using that list as a guide) and
write it here:
5. Get your topic approved by your teacher.6. Use the following form to construct your experiment.7. Seek approval from your teacher of your experiment plans.8. Begin your experiment using the scientific method.

The Scientific Method
5
Scientific Method Step
What is the question?
What sources are you using for the background research?
Attach your research to this document.
What is your hypothesis?
How will you test your hypothesis? Whatsupplies will you need? How much time will the experiment take? Who will be involved? What expenses might exist? Where will you conduct the experiment? How will you ensure safety during the process? Why did you choose this experiment? What are the variables? What type of environment is needed? Attach the larger plan to this document if needed.
What data will/did you gather during theexperiment? How will you organize the data?What conclusion(s) can you draw from thedata?
What are the results of your experiment?
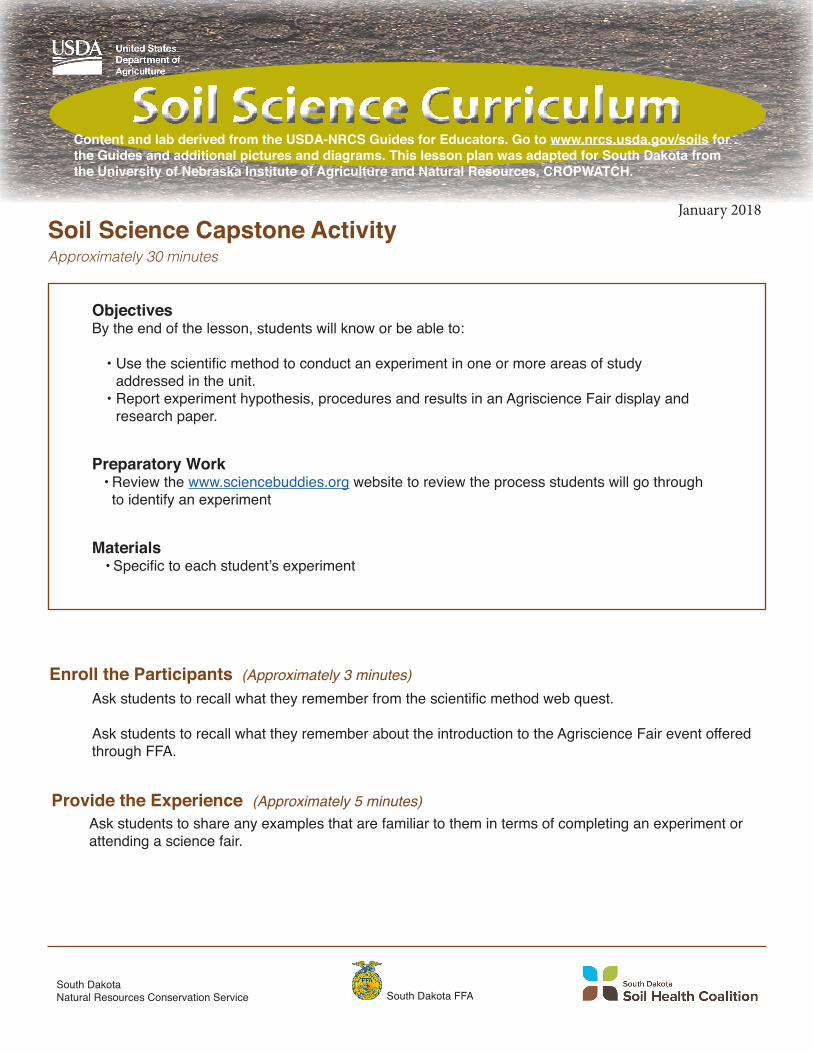
Soil Science CurriculumContent and lab derived from the USDA-NRCS Guides for Educators. Go to www.nrcs.usda.gov/soils for the Guides and additional pictures and diagrams. This lesson plan was adapted for South Dakota from the University of Nebraska Institute of Agriculture and Natural Resources, CROPWATCH.
South DakotaNatural Resources Conservation Service South Dakota FFA
January 2018
Approximately 30 minutes
ObjectivesBy the end of the lesson, students will know or be able to:
•Usethescientificmethodtoconductanexperimentinoneormoreareasofstudyaddressed in the unit.
•Reportexperimenthypothesis,proceduresandresultsinanAgriscienceFairdisplayandresearchpaper.
Materials•Specifictoeachstudent’sexperiment
Preparatory Work• Review the www.sciencebuddies.orgwebsitetoreviewtheprocessstudentswillgothroughtoidentifyanexperiment
Soil Science Capstone Activity
Enroll the Participants (Approximately 3 minutes)Askstudentstorecallwhattheyrememberfromthescientificmethodwebquest.
AskstudentstorecallwhattheyrememberabouttheintroductiontotheAgriscienceFaireventofferedthroughFFA.
Provide the Experience (Approximately 5 minutes)Askstudentstoshareanyexamplesthatarefamiliartothemintermsofcompletinganexperimentorattendingasciencefair.

Soil Science Capstone Activity
2
Label the Information (Approximately 13 minutes)Informstudentsthatduringthenextseveraldaysandweeks,theywillconductasoilscienceexperiment,usingoneoftheunittopicsasastartingpointfortheirexperimentcreation.
SoilOrganicMatterBulk DensitySoilHealthMeasurementSoilRespirationSoil Electrical ConductivitySoilpHSoilNitrogenSoilPhosphorusSoilInfiltration
Demonstrate the Relevance (Time varies)Instructstudentstousethescientificmethodtoconstructtheirexperiment,providingguidanceandapprovalateachphase.Usetheattachedresourcetohelpyoucompletetheassessmentofeachcheckpoint.
Providestudentswiththeparametersspecifictoyourclassroomintermsofthefollowingitems:
Howmuchclasstimewillbeprovidedforstudentstoconducttheirexperiment?Howmuchmustbecompletedoutsideoftheclassroom?
HowmuchtimewillbeprovidedforstudentstoworkontheirAgriscienceFairdisplay?
Whenistheduedateontheexperiment?
Whatresourceswillbeprovidedbytheschool/classroom?(Makesureyoumakegooduseoftheresourcesprovidedthroughthesoilsciencegrant!)
Willtheexperimentsbeconductedindividuallyorasaclass?
Willthestudentspresenttheirprojecttosomeoneotherthantheclass?Ifso,who?
Howmuchwilltheentireactivitybeworthintermsofpoints?Howmuchwilleachstepbeworth?
Review the Content (Time varies)Attheconclusionoftheexperiments,directstudentstoreporttheirresultstotheclassortoanotherpertinentgroup.

Soil Science Capstone Activity
3
Celebrate Student Success (Time varies)Taketimethroughoutthedurationoftheexperimentdesignandimplementationtocommendstudentsfortheireffortsandindependentwork.Afterstudentssharetheirresultswiththeirclassmates,considerpresentingeachstudentwiththeirown“SuperScientist”award.
Soil Science Capstone ActivityScientificMethodStep
Whatisthequestion?
Whatsourcesareyouusingforthebackgroundresearch?Attachyourresearchtothisdocument.
Whatisyourhypothesis?
Howwillyoutestyourhypothesis?Whatsupplieswillyouneed?Howmuchtimewilltheexperimenttake?Whowillbeinvolved?Whatexpensesmightexist?Wherewillyouconducttheexperiment?Howwillyouensuresafetyduringtheprocess?Whydidyouchoosethisexperiment?Whatarethevariables?Whattypeofenvironmentisneeded?
Attachthelargerplantothisdocumentifneeded.

Soil Science Capstone Activity
4
Whatdatawill/didyougatherduringtheexperiment?Howwillyouorganizethedata?Whatconclusion(s)canyoudrawfromthedata?
Whataretheresultsofyourexperiment?

Soil Science Curriculum
South DakotaNatural Resources Conservation Service South Dakota FFA
January 2018
Approximately 270 minutes
Desired Impact/GoalEducational commitment and application of learning (Head). Students will understand how soil health, as affected by environmental conditions and human activity, influences the capacity of natural ecosystems to sustain plants, animals, and humans.
Materials• Introductory PowerPoint presentation• Computer and projector• Bench-top rainfall simulator and associated materials (see Directions for using the desktop expo rainfall simulator)
• Access to sites for soil sampling, including land use history information (school grounds, gardens, parks, farms)
• Copies of student Rainfall simulator demonstration and scenario worksheet
Time Needed• Three hours prep time• One 60-90 minute class period for lesso
Rainfall Simulator
“We know more about the movement of celestial bodies than about the soil underfoot.” - Leonardo Da Vinci, circa 1500’s
“Essentially, all life depends upon the soil ... There can be no life without soil and no soil without life; they have evolved together.”
- Charles E. Kellogg, USDA Yearbook of Agriculture, 1938
Life Skills• Teamwork• Record Keeping• Critical Thinking• Problem Solving• Communication
Skill LevelAdvanced; ages 15-19/grades 9-12

Rainfall Simulator
2
Soil Health1. Soil health is defined as the continued capacity of soil to function as a vital living ecosystem that
sustains plants, animals, and humans.
2. A healthy soil sustains plant, animal and human life by providing a firm foundation for plant roots and human structures, regulating water, cycling nutrients, filtering, buffering and degrading pollutants.
3. Soil health considers the integrated physical, chemical and biological components of soil ecosystems, whereas traditional soil fertility views soil as a non-living system.
4. Both environmental conditions (parent material, climate, topography) and human activities (soil disturbance, cropping, fertilization) can influence soil health.
5. In highlighting the link between functioning soil ecosystems and the productivity or resiliency of human systems, soil health represents a paradigm shift in conservation management.
Key Concepts:
Soil Minerals and Texture1. Soil consists of four major components: mineral material (~45%), organic matter (~5%), water
(~25%) and air (~25%).
2. The mineral component of soil is the remnants of weathered rocks and can be classified into three categories by particle size: sand (2.0-0.05 mm), silt (0.05-0.002 mm) and clay (<0.002mm).
3. Clay is the only chemically active texture class with the ability to adsorb plant nutrients
4. The proportion of different mineral particle sizes in a soil determines its texture, within twelve recognized classes.
5. Soil texture is important to soil health as a determinant of surface area and pore space available in a soil for holding nutrients, air and water.
6. Soil texture is primarily determined by geology and climate, and cannot be easily changed by human activity. That is except in the case of disturbed (i.e. urban) soil where large amounts of soil are imported into or removed from an area.
Next Generation Science Standards• Human Impacts on Earth Systems (HS-ESS3-1): Construct an explanation based on evidence for how the availability of natural resources, occurrence of natural hazards, and changes in climate have influenced human activity.
• Human Sustainability (HS-ESS3-4): Evaluate or refine a technological solution that reduces impacts of human activities on natural systems.
Rainfall Simulator
3
Soil Biology and Organic Matter1. Soil ecosystems support a great diversity of organisms, rivaling the above-ground diversity in tropical
rainforests or coral reefs.
2. Soil biota range from microscopic bacteria to vertebrates that coexist in complex food webs.a. Bacteria and yeast
i. Microscopic colonies grow on root and organic matter surfacesii. 100 million to 1 billion per teaspoon of soiliii. Biomass = 2 cows per acreiv. Decomposers, nutrient cyclers, pathogens
b. Fungi and actinomycetesi. Grow through soil as mycelium consisting of a few hyphal cells to thousands of acres in areaii. Decomposers, mutualists and pathogensiii. Specialize in penetrating organic matter and translocating nutrientsiv. Assist plant roots in accessing immobile nutrients like phosphorus
c. Micro and mesofauna: Protozoans, nematodes, rotifers, tardigrades, springtails and mitesi. Microbivores, omnivores, predators and parasitesii. 500 to 1 million per square meteriii. Help to regulate microbe populations through feeding
d. Macrofauna: Earthworms, millipedes, isopods, mollusks and insectsi. Size and incorporate organic matter, and also living plants as pestsii. Mix and aggregate soil iii. Create macropore spaces by burrowing, improve infiltration and create root channels
e. Megafauna: large invertebrates, vertebrates (amphibians to mammals)i. Herbivores, omnivores, predatorsii. High level consumers
3. The organic matter component of soil is the remnants of plant and animal tissue in various states of decomposition by soil organisms, a valuable source of nutrients for all members of the soil food web, plants and megafauna, as well as a reservoir for water storage in soils.
4. Soil life is often concentrated in areas with more organic matter including near plant roots (rhizosphere exudates), close to surface litter and in sites with incorporated organic matter like crop residue, cover crops, or manure.

Rainfall Simulator
4
Soil Aggregation and Aggregate Stability1. The four components of soil often stick together in units called aggregates that include both solid
(mineral and organic) materials and pore space (air and water) held together by physical and chemical forces.
2. Several natural processes contribute to soil aggregation through the physical movement and adhesion of soil particles including:
a. wetting and dryingb. freezing and thawingc. microbial activity that aids in the decay of organic matter (glomalin produced by fungi)d. activity of roots and soil animals (root sugar exudates)e. soil chemical charges (adsorbed cations)
3. Aggregates vary in their size, shape and stability. Patterns of soil aggregation determine soil structure within nine categories (i.e. crumb, blocky, single grain), that along with texture, is used to describe a particular soil type.
4. Soil aggregation is important to soil health as a determinant of pore space available in a soil for holding air, water and nutrients, as well as the growth of soil biology. Aggregates include micropore spaces within their structure, but also form macropores between aggregate units.
5. Soil aggregation is sensitive to environmental conditions and human activities. The impact of raindrops, tillage and wheel traffic destroy aggregates. Aggregation is encouraged by practices such as reduced tillage, and organic matter additions from crop residue, cover crops or manure.
Soil Bulk Density1. To maximize plant root growth, a soil should ideally consist of 50% solid (mineral and
organic) materials and 50% pore space (air and water).
2. Soil bulk density is a measure of soil porosity/compaction expressed as soil weight per unit volume (g/cm3).
3. In general, low bulk density (< 1.50 g/cm3) is associated with a loose, porous soil with plenty of room for air, water and biology, while a higher bulk density (>1.50 g/cm3) can limit movement of air and water through soil and restrict root growth.
4. Practices that destroy soil aggregates, like tillage and wheel traffic, increase bulk density over time. This is somewhat counterintuitive since tillage is designed to temporarily loosen soil for planting and crop establishment. However, fractured aggregates settle and compact over time. Practices that increase aggregation, such as reduced tillage, controlled wheel traffic and organic matter additions from crop residue, cover crops or manure tend to decrease soil bulk density.

Rainfall Simulator
5
• TeamworkTeams of students will share responsibility for observations before and during the rainfall simulator demonstration, development and testing of hypotheses and communication of results.
• Keeping RecordsStudents will accurately record observations relevant to soil properties, land use/management, and their effect on the movement of water over and through soils during the demonstration.
• Critical ThinkingStudents will reflect on their observations to hypothesize about the inherent soil properties and land use/management differences that may have contributed to their findings.
• Problem SolvingTeams of students will develop a plan to change land use/management on the site(s ) of interest in an effort to reduce runoff/erosion and improve infiltration.
• CommunicationTeams of students will present their proposed changes in land use/management to the class and test their hypotheses against those of another team using the rainfall simulator, observe and record the outcome.
Instructional Plan:1. Background
a. Through an introductory PowerPoint or video presented by the instructor:i. Students will be introduced to the concept of soil health, its integrative definition and
importance to agriculture.
ii. Four major components of soil and their relative abundance.
iii. Understand that the organic matter component of soil is the remnants of plant and animal tissue in various states of decomposition by soil microorganisms, and the mineral component of soil is the remnants of weathered rocks.
iv. Learn that the mineral component of soil can be classified into three categories by particle size, which determines soil texture.
v. Realize that the four components of soil tend to stick together in units called aggregates that include both solid (mineral and organic) materials and pore space (air and water) held together by physical and chemical forces.
vi. Discover that to maximize plant growth, a soil should ideally consist of 50% solid (mineral and organic) materials and 50% pore space (air and water), and become familiar with soil bulk density as a measure of soil porosity/compaction expressed as soil weight per unit volume (g/cm3).
Life Skill Objectives:

Rainfall Simulator
6
2. Experience – Getting Starteda. The instructor will assign teams of students a geographic area of interest (AOI) for the lesson,
from which soil samples will be collected for analysis, plus a site description with background information on site location and land use and blank space for field observations.
b. The instructor will introduce soil survey resources and teams of students will use Web Soil Survey or soil survey books to identify different soil types present in a given area of interest and select areas of different types/textures for sampling (or observe area where samples were collected by instructor beforehand), making predictions about soil characteristics on-site.
c. The instructor and students will travel to a field site and use FarmLogs to locate their desired sampling area, make general site and management observations to add to their site scenario (plant cover, color, structure, moisture, slope, land use, disturbance), conduct an in-field earthworm count and collect soil samples for lab analysis of soil texture, aggregate stability, bulk density, respiration and soil (optional additional 90-minute class period).
3. Experience – Going Furthera. In the lab, teams of students will use the hand test to estimate a soil’s proportion of different
mineral particle sizes by feel and identify soil texture within twelve recognized classes, indicating this on a soil texture triangle located on a lab worksheet.
b. Teams will conduct a slake test on their unique soil as a qualitative measure of aggregate stability and record their results on a lab worksheet.
c. Teams will measure the bulk density of their unique soil sample collected using the core method and record their results on a lab worksheet.
4. Think and Discussa. Teams will research and orally report on ways that parent geology, climate, topography, biology
and time may have influenced the soil types/textures found at their AOI.
b. Students will inspect and manipulate several aggregates collected by other teams to see how they vary in their size, shape, stability and density based on texture and field histories (i.e. tilled vs. no-till).
c. The instructor will lead the entire class in a comparison of their bulk density results by constructing a graph(s)and discussing how tillage and compaction can degrade soil aggregation and increase bulk density.
d. Students will build on their knowledge of soil components, texture and field history to develop a brief essay/video/oral presentation theorizing about the natural and human processes that contribute to or degrade soil aggregation and bulk density including:
• soil texture• wetting and drying• freezing and thawing• microbial activity that aids in the decay of organic matter (glomalin produced by fungi)• activity of roots and soil animals (root sugar exudates)• soil chemical charges (adsorbed cations)• mechanical disturbance (tillage)• mechanical compaction

Rainfall Simulator
7
Measurable Indicators:

Rainfall Simulator
8
Benchtop Rainfall Simulator DemonstrationStudent Worksheet
Before the demonstration begins…
1. What do you know about the soil samples that will be used in the rainfall simulator demonstration? Describe each one including information about use/management of the site(s) they were collected from and any known chemical, physical, or biological properties.
2. How do expect the physical properties of each soil sample (texture, aggregation, structure, pore space) to affect how water runs-off or infiltrates through the soil? Do you think that use/management of the site(s) each sample was collected from has affected the soil’s physical condition? In what ways?
3. How do expect the biological properties of each soil sample (organic matter, cover type, biota) to affect how water runs-off or infiltrates through the soil? Do you think that use/management of the site(s) each sample was collected from has affected the soil’s biological condition? In what ways?
Rainfall Simulator
9
During the demonstration…
4. Observe how water runs-off and/or infiltrates through the soil sample(s). Which sample(s) had the greatest volume of water run-off the soil surface? What color was the water in the run-off catch pan(s)? What does the color of the run-off water tell you about the movement of soil and nutrients with rain water?
5. Which sample(s) had the greatest volume of water infiltrate through the soil? How quickly did infiltration water accumulate in the lower catch pans compared to run-off water? Why might greater infiltration be desirable for water quality/quantity, crop production, etc.
After the demonstration…
6. Did the demonstration support your hypotheses about how water would run-off vs. infiltrate through each soil sample? If so, which physical and biological soil properties or site use/management factors seemed to have the greatest effect on the movement of water? If not, what do think led to the unexpected result?
7. Considering the sample with the greatest volume of run-off water caught in the front pan, how could use/management of the site be changed to decrease run-off and increase infiltration? Be sure to discuss use/management changes that could affect chemical, physical and biological soil properties.

Soil Science Curriculum
South DakotaNatural Resources Conservation Service South Dakota FFA
January 2018
Approximately 135 minutes
ObjectivesThe “Tighty Whities” Test is a comparative test that shows the presence or absence of soil microbiology under different management techniques. This introduction information is compatible with the Soil Respiration lesson plan. For microbes to use energy and respire carbon dioxide (Soil Respiration lesson plan), they must uptake food. Food for these microorganisms is organic matter that comes from dead plant material. Since the cotton “tighty whities” are made from organic material (not including elastic), the soil microbiology will feed on them if microbes are present. The less “tighty whitie” material left, the more soil microbiological activity. The example on the bottom shows that high rotational diversity, no-till cropping systems have more material consumed than low diversity, tilled cropping system.
*Notes*• Works best during active growing season May through June and not as well in July through August.
• Can also compare different grassland management systems.
“Tighty Whities” Test• Chooselocations,fieldorgarden,withdifferentmanagement techniques that you want to compare(ex. Long term no-till vs. conventional till).• Bury“tightywhitie”ineachfield2-inchesdeep,markthe location where you planted the whities.
• Dig out remains 6-8 weeks later.• Visually compare remaining material.• Compare weights of the “tighty whities.”
Soil Microbiology - “Tighty Whities” Test
Example:
Brief Condition(Figure 1. order, left to right
Average Brief Weight(grams/bief) 5 replications
Control -non-buried 58.5 aNo-till soil with cover crops 28.4 c
Mulch (reduced) till soybeans 48.3 b
Conventional tilled corn 50.8 bStats:F 0.001CV 7.7LSD (.05) 4.9
*Brief averages with different lower case letters are significantly different.
“TightyWhitie”demonstrationdataset,2016SoilHealthSchool,Aberdeen,SD
2017 SH school, tighty whities were buried for three weeks (during August) in a cover crop field that had been no till for seven years.

January 2018
AppendixSouth Dakota NRCSField Offices
Aberdeen Service Center524 Enterprise Street SAberdeen, SD 57401605-226-3360
Armour Service Center606 1st StreetAmour, SD 57313605-724-2846
Belle Fourche Service Center1835 5th Ave SBelle Fourche, SD 57717605-892-3368
Bison Service Center604 ColemanBison, SD 57620-0189605-244-5222
Britton Service Center505 VanderhorckBritton, SD 57430604-448-5921
Brookings Service Center205 6th
Brookings, SD 57006-1406605-692-8003
Buffalo Service Center107 US Hwy 85Buffalo, SD 57720605-375-3218
Burke Service Center845 MainBurke, SD 57523605-775-9122
Canton Service Center801 E. 5th StreetCanton, SD 57013-1920605-987-4332
Chamberlain Service Center200 Paul Gust RDChamberlain, SD 57325-1000605-734-5413
Clark Service Center101 Warren RDClark, SD 57225605-532-3686
Clear Lake Service Center222 4th Ave SClear Lake, SD 57226605-874-8225
De Smet Service Center202 Joliet Ave SEDe Smet, SD 57231-2425605-854-9123
Dupree Service Center8th Ave & MainDupree, SD 57623605-365-5179
Elk Point Service Center1101 E Main StreetElk Point, SD 57025605-356-3308
Faith Service Center409 1st Street WFaith, SD 57626605-967-2561
Faulkton Service Center110 8th Ave NFaulkton, SD 57438605-598-6237
Flandreau Service Center105 S Crescent StreetFlandreau, SD 57028-1716605-997-2949
Gettysburg Service Center507 E Garfield AveGettysburg, SD 57442605-765-2575
Hayti Service Center301 Marsh StreetHayti, SD 57241605-783-3642
Highmore Service Center218 Iowa SHighmore, SD 57345605-745-5716
Hot Springs Service Center339 S Chicago StreetHot Springs, SD 57747-2323605-745-5716
Howard Service Center601 W Farmer AveHoward, SD 57349605-262-5642
Huron Service Center1386 Lincoln Ave SWHuron, SD 57350-3080605-352-2998
Ipswich Service Center22 Main StreetIpswich, SD 57451605-426-6951
Kadoka Service Center805 Main StreetKadoka, SD 57543605-837-2166
Kennebec Service Center110 S Main AveKennebec, SD 57544605-869-2216
A-1

Lake Andes Service Center276 Main StreetLake Andes, SD 57356-2032605-487-7501
Leola Service Center709 Moulton StreetLeola, SD 57456605-439-3336
Madison Service Center123 SW 2nd StreetMadison, SD 57042-2874605-256-6674
Martin Service Center706 W Bennett AveMartin, SD 57551605-685-1239
McIntosh Service Center175 Main StreetMcIntosh, SD 57641605-273-4506
Milbank Service Center1102 S Dakota StreetMilbank, SD 57252-2707605-432-6570
Miller Service Center118 E 2nd StreetMiller, SD 57362-1407605-853-2410
Mitchell Service Center1802 N Kimball StreetMitchell, SD 573010-1114605-996-1564
Mound City Service Center210 Main Street NMound City, SD 57646-2104605-955-3306
Murdo Service Center806 5th StreetMurdo, SD 57559605-669-2404
Onida Service Center707 East Birch AveOnida, SD 57564605-258-2613
Parker Service Center655 E 4th StreetParker, SD 57053605-297-5564
Parkston Service Center701 W Plum StreetParkston, SD 57366-2029605-928-7925
Philip Service Center409 N Wray AvePhilip, SD 57567605-859-2186
Pierre Service Center1717 N Lincoln AvePierre, SD 57501-2398605-224-8870
Plankton Service Center209 N MainPlankton, SD 57368605-942-7719
Rapid City Service Center414 E Stumer RDRapid City, SD 57701605-342-0301
Redfield Service Center25 ½ W 6th AveRedfield, SD 57469-1117605-472-0102
Salem Service Center340 N Nebraska StreetSalem, SD 57058-8949605-425-2483
Selby Service Center4307 4th AveSelby, SD 57472605-649-7020
Sioux Falls Service Center2408 E Benson RDSioux Falls, SD 57104-7018605-330-4515
Sisseton Service Center2018 E Hwy 10Sisseton, SD 57262605-698-7639
Sturgis Service Center2202 Main StreetSturgis, SD 57785-1338605-347-4952
Timber Lake Service Center711 Main StreetTimber Lake, SD 57656605-865-3552
Tyndall Service Center109 West 16th AveTyndall, SD 57066605-589-3383
Vermillion Service Center121 W Kidder StreetVermillion, SD 57069-3033605-624-7060
Wall Service Center24 Creighton RDWall, SD 57790-0308605-279-2451
Watertown Service Center1720 4th Street NEWatertown, SD 57201605-886-8202
Webster Service Center600 E Hwy 12Webster, SD 57274-1135605-345-4661
Wessington Springs Service Center510 Dakota Ave NWessington Springs, SD57382-2044605-539-9232
White River Service Center123 East 6th StreetWhite River, SD 57579605-259-3252
Winner Service Center113 S Madison StreetWinner, SD 57580-1313605-842-0603
A-2

Woonsocket Service Center203 W 7th StreetWoonsocket, SD 57385605-796-4476
Yankton Service Center2914 N Broadway AveYankton, SD 57078-4836605-665-2662
South Dakota Soil & Water Conservation Districts
American Creek Conservation DistrictPO Box 156Kennebec, SD 57544605-869-2238, ext. 3
Aurora County Conservation DistrictPO Box 277Plankinton SD 57368-0277605-942-7719, ext. 3
Badlands Conservation District706 US Hwy 18 Ste 2Martin, SD 57551-5935605-685-1243, ext. 3
Beadle Conservation District1386 Lincoln Ave SWHuron, SD 57350605-352-2998, ext 3
Bennett County Conservation District706 US Hwy 18, Suite 2Martin, SD 57551-5935605-685-1243, ext. 3
BonHomme Conservation District PO Box 45Tyndall, SD 57066-0045605-589-3232, ext #3
Brookings Conservation District205 Sixth StreetBrookings, SD 57006-1406 605-692-8003
Brown-Marshall Conservation District PO Box 73Hecla, SD 57446605-994-7016
Brule-Buffalo Conservation District 200 South Paul Gust RDChamberlain, SD 57325605-734-5953, ext. 3
Campbell County Conservation DistrictPO Box 153Mound City, SD 57656-0153605-955-3514, ext. 3
Charles Mix Conservation District276 Main StreetPO Box 249Lake Andes, SD 57356-0249605-487-7577
Clark County Conservation District101 Warren RDClark, SD 57225-5922605-532-3797, ext. 3
Clay County Conservation District121 W Kidder Ave, Suite 103Vermillion, SD 57069-3033605-624-7060, ext. 3
Clearfield-Keyapaha Conservation District113 S Madison, Suite 100Winner, SD 57580-1313605-842-0603, ext. 3
Codington Conservation District1720 4th Street NE, Suite 3Watertown, SD 57201605-882-4989
Corson County Conservation DistrictPO Box 37McIntosh SD 57641-0037605-273-4506, ext. 3
Custer County Conservation District447 Crook Street, Suite 1Custer, SD 57730605-673-4971
Davison County Conservation District1820 N Kimball, Suite BMitchell, SD 57301605-996-1564, ext. 3
Day Conservation District600 E Hwy 12 Suite 1Webster, SD 57274605-345-4661, ext. 3
Deuel Conservation District222 4th Avenue SouthPO Box 348Clear Lake, SD 57226-0348605-874-8225, ext. 3
Dewey County Conservation DistrictPO Box 133Timber Lake, SD 57676-0133605-865-3552, ext. 3
Douglas County Conservation DistrictPO Box 28Armour, SD 57313-0028605-724-2846
East Pennington Conservation District24 Creighton RD,PO Box 308,Wall, SD 57790605-279-2451, ext. 3605-279-2519
Edmunds County Conservation District22 Main Street PO Box 25Ipswich SD 57451
Fall River Conservation District341 S Chicago StreetHot Springs, SD 57747-2323605-745-5716, ext. 121
A-3

Faulk County Conservation DistrictPO Box 489Faulkton, SD 57438-0489605-598-6549, ext. 3
Grant Conservation District1102 S Dakota StreetMilbank, SD 57252605-432-6570, ext. 3
Gregory County Conservation DistrictPO Box 339Burke, SD 57523-0399605-775-2770, ext. 3
Haakon Conservation DistrictPO Box 130Philip, SD 57567-0130605-859-2186, ext. 3
Hamill Conservation District113 S Madison, Suite 100Winner, SD 57580-1313605-842-0603, ext. 3
Hamlin Conservation DistrictP.O. Box 165Hayti, SD 57241-0165605-783-3642, ext. 4
Hand County Conservation District118 E Second StreetMiller, SD 57362-1407605-853-2410, ext. 3
Hanson County Conservation DistrictPO Box 176Alexandria, SD 5731-0176605-239-4635
Harding County Conservation DistrictPO Box 265Buffalo, SD 57720-2065605-375-3216, ext. 3
Hughes County Conservation District1717 N Lincoln Ave, Suite 103Pierre, SD 57501-7800605-224-1694, ext. 3
Hutchinson Conservation District415 N Access RoadMenno, SD 57045-2117605-387-5539
Hyde County Conservation DistrictPO Box 484Highmore, SD 57345-0484605-852-2221, ext. 3
Jackson County Conservation DistrictPO Box 457Kadoka, SD 57543-0457605-837-2242, ext. 3
Jerauld County Conservation District510 Dakota Ave NWessungton Springs, SD 57382606-539-1391
Jones County Conservation DistrictPO Box 298Murdo, SD 57559-0298605-669-2404, ext. 3
Kingsbury Conservation DistrictPO Box 85DeSmet, SD 57231-0085605-854-3183
Lake County Conservation District123 SW Second StreetMadison, SD 57042605-256-2571, ext. 3
Lawrence Conservation District1230 North Ave, Suite 8Spearfish SD 57783-1572605-642-3590
Lincoln Conservation District801 E 5th Street, Suite 2 Canton, SD 57013605-987-2624
Marshall Conservation DistrictPO Box 8505 Vander Horck AveBritton, SD 57430-0008605-448-2442, ext. 3
McCook County Conservation DistrictPO Box 121Salem, SD 57058-0121605-425-2483, ext. 3
McPherson County Conservation DistrictPO Box 60Leola, SD 57456-0060605-439-3336, ext. 3
Miner Conservation District601 West Farmer Ave, Suite A, Howard, SD 57349-8734605-772-5642, ext. 3
Minnehaha Conservation District2408 E Benson RDSioux Falls, SD 57104605-370-3480
Moody Conservation District202 East 3rd AveFlandreau, SD 57028605-997-2949 ext. 3
Pennington Conservation District414 E Stumer RD, Suite 300Rapid City, SD 57701605-342-0301, ext. 3
Perkins County Conservation DistrictPO Box 189Bison, SD 57620-0189605-244-7160, ext. 3
Potter Conservation District507 E Garfield AveGettysburg, SD 57442-1233605-765-2575, ext. 107
A-4

Roberts Conservation District2018 SD Hwy 10Sisseton, SD 57262 605-698-3923
Sanborn Conservation District203 W Seventh Street, Suite 200Woonsocket, SD 57385-2195605-796-4476, ext. 3
South Brown Conservation District524 S. Enterprise Street, Suite 300Aberdeen, SD 57401605-226-3360, ext. 3
Spink Conservation DistrictPO Box 14625 1/2 Sixth Ave WestRedfield, SD 57469605-472-1437, ext. 3
Stanley County Conservation District1717 N Lincoln Ave, Suite 103Pierre, SD 57501605-224-1694, ext. 3
Sully County Conservation DistrictPO Box 203Onida, SD 57564-0203605-258-2571
Todd County Conservation DistrictPO Box 268Mission, SD 57555-0268605-856-4440
Tri-County Conservation DistrictPO Box 399Faith, SD 57626-0399605-967-2561, ext. 3
Turner County Conservation DistrictPO Box 416Parker, SD 57053-0416605-297-5564, ext. 3
Union County Conservation DistrictPO Box 458Elk Point, SD 57025-0458605-356-3308, ext. 3
Walworth County Conservation DistrictPO Box 139Selby, SD 57472-0139605-649-7020, ext 3
Yankton County Conservation District2914 Broadway StreetYankton, SD 57078-1202605-665-6704, ext. 3
Ziebach County Conservation DistrictPO Box 246Dupree, SD 57623-0246605-365-5185, ext. 3
Additional sources of information and assistance in soil health
A-5
Winner Regional CenterJimmy Doyle, Natural Resource Management Field Specialist Sean Kelly, Range Management Field Specialist325 S. Monroe StreetP.O. Box 270,Winner, SD 57580605-842-1267
South Dakota Soil Health CoalitionA collective effort to increase sustainable ag production through diversification and improved soil health. With our vision, we have a united and experienced coalition of farmers and ranchers that depend on generations of knowledge to make that vision happen.www.sdsoilhealthcoalition.org/
South Dakota Grassland CoalitationThe SD Grassland Coalition was created to serve as a voice for grassland managers. We are aunified voice for managing grasslands.www.sdgrass.org/
South Dakota EnvirothonKim SmeenkCoordinator12771 Orman RoadNewell, SD 57760605-892-5699SD Envirothon Website: www.sdenvirothon.orgNCF Envirothon Website: www.envirothon.org
South Dakota Land JudgingSouth Dakota Range JudgingLance Howe, Soil ScientistRedfield Soil Survey OfficePO BOX 146Redfield, SD 57469605-472-0102, ext. 4
USDA-NRCS Soil Health https://www.nrcs.usda.gov/wps/portal/nrcs/main/national/soils/health/
Soil Science Society of Americahttp://www.soils4teachers.org/lessons-and-activities
Discovery Educationhttps://school.discoveryeducation.com/schooladventures/soil/
National Agriculture in the Classroomhttps://agclassroom.org/
Iowa Agriculture Literacy Foundationhttp://www.iowaagliteracy.org/

Supporters
S-1
Platinum Level Gold Level Silver Level$10,000 and above $9999 to $4000 $3999 to $1000
Farm Credit Services of America
Pierre Branch Jeff Hauck
First Dakota National Bank
Nate Franzen President, Agri Business Division Yankton Branch
Ducks Unlimited, Inc.
Steve Donovan, Manager Conservation Programs
Bronze Level$999 and below
Dacotah Bank Aberdeen Branch Trevor Samson
With the generous donations from our supporters this project is possible! Thank you!
ContributorsTechnical
Jeff Hemenway Nathan Jones Tate Nafziger Stan Boltz Kent Cooley Eric Barsness Dan Melhahf Heidi Rients Jason Gilb Matti Kuykendall Andy Oxford Jason Miller Craig Veldkamp Stacy Turgeon Kent Vlieger Katrina Wilke Anthony Bly David Trefz Carrie WerkmeisterMarcia Deneke