Embed Size (px)
Citation preview

J. SYSTEMS SOFTWARE 255 1990; 12: 255-261
Software Metrics in the Process Maturity Framework
Shari Lawrence Pfleeger and Clement McGowan
The Contel Technology Center’s Software Engineering Laboratory (SEL) has as one of its goals the improve- ment of software productivity and quality throughout Contel Corporation. The SEL’s Process and Metrics Project ad- dresses that goal in part by recommending metrics to be collected on each software development project through- out the corporation. This article suggests a set of metrics for which data are to be collected and analyzed, based on a process maturity framework developed at the Software Engineering institute. Metrics are to be implemented step by step in five levels, corresponding to the maturity level of the development process. Level 1 metrics provide a base- line for comparison as improvements are sought. Level 2 metrics focus on project management. At the third level, metrics measure the products produced during develop- ment, while level 4 metrics capture characteristics of the development process itself to allow control of the process. Finally, the feedback loops of level 5’s process metrics permit the metrics to be used to change and improve the development process.
1, INTRODUCTION
Dozens, if not hundreds, of software metrics are de- scribed in the software engineering literature [ 11. The metrics chosen for a particular project play a major role in the degree to which the project can be controlled, but deciding which metrics to use is difficult. We can evaluate the purpose and utility of each metric only in light of the needs and desires of the development or- ganization. Thus, we should collect data and analyze software metrics in the broad context of the software de- velopment process and with an eye toward understand- ing and improvement. It is for this reason that we at the Contel Technology Center’s Software Engineering Laboratory have chosen a process maturity framework in which to place software metrics. Originating at the Software Engineering Institute, process maturity [2] de- scribes a set of maturity levels at which an organiza- tion’s development process takes place. Only when the
Address correspondence to Shari Lawrence pfeeger, Contel Tech- nology Center, 15000 Conference Center Drive, l?O. Box 10814, Chantilly, VA 22021-3808.
development process possesses sufficient stNc~re and procedures does it make sense to collect certain kinds of metrics.
Thus, rather than recommend a large (and proba- bly unwiedly) set of metrics to collect for each project throughout an organization, we recommend that metrics be divided into five levels, where each level is based on the amount of information made available by the devel- opment process. As the development process matures and improves, additional metrics can be collected and analyzed. In turn, the new information derived from the metrics allows the process to be controlled and en- hanced. Thus, metrics collection begins at maturity level 1, moving on to the other levels only when dictated by a process that can support it.
This article explores the idea of process maturity and explains how process maturity levels are integrated nat- urally with metrics collection, We give examples of met- rics at level, and we describe how the process and met- rics program is working at Contel to improve the quality of our software.
2. PROCESS ~ATURI~ LEVELS
The concept of process maturity is based on the notion that some development processes provide more struc- ture or control than others. In effect, as certain charac- teristic process problems are solved by process methods and tools (e.g., configuration m~agement), the process matures and can focus on other problems. Thus, matu- rity provides a framework in which to depict the several types of processes and to evaluate what kinds of metrics are best suited for collection in each type. The met- rics, in concert with a variety of tools, techniques, and methods, are used to improve the process, increase the maturity level, and aliow additional metrics coliection to take place.
Figure 1 depicts the five levels of process and their characteristics. Assessing or determining the level of process maturity is the first step in deciding what metrics to collect.
@ Elsevier Science Publishing Co., Inc. 655 Avenue of the Americas. New York, NY 10010 0161-1212/90/$3.50

S. L. Pfleeger and C. McGowan 256 J. SYSTEMS SOFTWARE 1990; 12:255-261
aractensucs
Figure 1. Process maturity levels related to Process defined, institutionalized metrics.
Process dependent on individuals
2.1 Level 1 : Initial Process
The first level of process is termed initial and is char-
acterized by an ad hoc approach to the software devel- opment process. That is, the inputs to the process are
ill-defined, the outputs are expected, but the transition from inputs to outputs is undefined and uncontrolled.
Similar projects may vary widely in their productivity
and quality characteristics, because of lack of adequate
structure and control. For this level of process maturity, the collection of metrics is difficult. Preliminary “base- line” project metrics should be gathered at this level to
form a basis for comparison as improvements are made
and maturity increases. The degree of improvement can
be demonstrated in part by comparing new project mea- surements with the baseline ones. For example, initial
measurements can be made of product size and staff ef- fort, to determine a baseline rate of productivity; this
rate can be compared with similar rates on subsequent
projects. However, rather than concentrate on metrics
and their meanings, the developers using a level 1 pro- cess should focus on imposing more structure and con-
trol on the process itself.
2.2 Level 2: Repeatable Process
The second process level, called repeatable, identifies
inputs, outputs and, constraints. The requirements act as input, the code is output, and typical constraints are budget and schedule limits. The process is repeatable in the same way that a subroutine is repeatable: Proper
inputs produce proper outputs, but we have no visibil- ity into how the outputs are produced. Figure 2 depicts a repeatable process as an SADT diagram, where the incoming arrow on the left shows the input, the outgo-
ing arrow on the right the output, and the arrow from
the top the control or constraints. For example, the re- quirements may be the input to the process, with the
software system as output. The control arrow represents constraints, such as schedule, budget, tools, standards,
and other management control directives.
Only project-related metrics make sense at this level, since the activities within the actual transition from in-
put to output are not available to be measured. Fig- ure 3 illustrates the types of measures that make sense by associating measurable characteristics with each ar-
row. Notice that an additional arrow has been placed
below the box to represent the personnel working on the project. Thus, for a repeatable process, we can mea-
sure the amount of effort needed to develop a system, the duration of the project, the size and volatility of the requirements, and the overall project cost, for example.
The output can be measured in terms of its physical or functional size, and the resources used to produce
that output can be viewed relative to size to compute productivity.
At Contel, we recommend that development organiza-
tions at the repeatable level include the following types
of measures (the italicized metrics are examples of mea-
sures at this level; the metrics are defined and explained
Figure 2. SADT diagram of repeatable process.
Control
1 _I Construct the
Input System
t+
output
I I

Process Maturity Framework I. SYSTEMS SOFTWARE 257 1990; 12: 255-261
Control Budget
Figure 3. Measures for a repeatable process.
in detail in a technical report [3]):
Size
Volatilir)
Input Construct the
Svstem output Size Time
Software Size Noncommented source lines of code Function points Object and method count Personnel Effort Actual person-months of effort Reported person-months of effort Requirements Volatility Requirements changes
Several additional metrics may be desirable, depending
on the characteristics of the project and the needs of project management. Many studies of project cost in-
dicate that relevant technical experience and employee
turnover can have a significant impact on overall project cost. Thus, the following items can be added to the level 2 metrics set at the discretion of management.
Experience
With domainlapplication With development architecture With toolslmethods Overall years of experience Employee turnover
2.3 Level 3: Defined Process
The third process maturity level is called defined, be-
Personnel
cause the activities of the process are clearly defined
with entry and exit conditions, as depicted in Figure 4.
This additional structure means that we can examine
the input to and output from each well-defined functional
activity performed during development. That is, the in-
termediate products of development are well-defined and visible. This characteristic of the process allows us to
measure characteristics of the intermediate products.
Thus, the box of Figure 2 can be decomposed to view the activities necessary to construct the final system. Figure 4 describes three typical activities: design, build
parts, and assemble. However, different processes may
be partitioned into more distinct functions or activities.
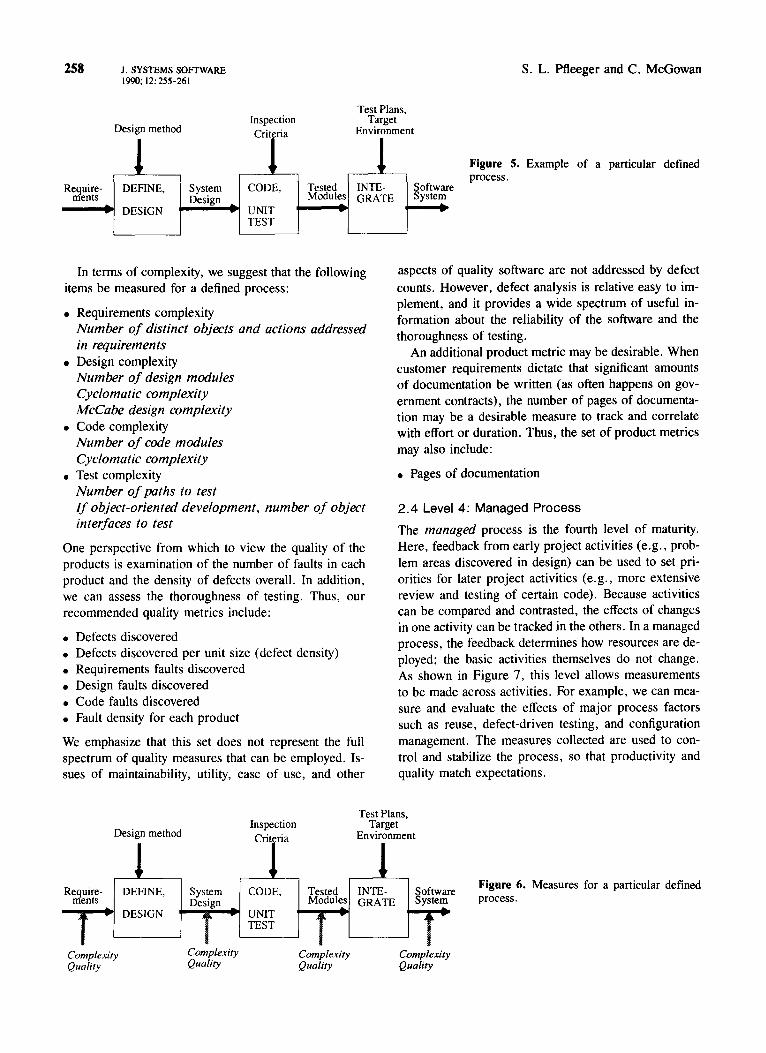
Figure 5 is an example of a simplified diagram suggest- ing the details of input, output, and control for each
activity in a defined process. Because the activities are delineated and distinguished
from one another, the products from each activity can be measured and assessed, as shown in Figure 6. In particular, project managers can look at the complexity
of each product. That is, we can examine the complexity of the requirements, design, code, and test plans, and assess the quality of the requirements, design, code, and testing.
,,I” ,,’
” ,,.,I’
,,,I” ,,,,,’
,,,-*“ “,__,_,,_
I” 1
Figure 4. SADT diagram of defined process.
- Design & Build Parts
b Assemble ,+
258 1. SYSTEMS SOFTWARE 1990; 12: 255-261
S. L. Pfleeger and C. McGowan
Design method
1 r
Inspection Criteria
Test Plans, Target
Environment
Figure 5. process.
Example of a particular defined
In terms of complexity, we suggest that the following items be measured for a defined process:
Requirements complexity Number of distinct objects and actions addressed in requirements Design complexity Number of design modules Cyclomatic complexity McCabe design complexity Code complexity Number of code modules Cyclomatic complexity Test complexity Number of paths to test If object-oriented development, number of object interfaces to test
One perspective from which to view the quality of the products is examination of the number of faults in each product and the density of defects overall. In addition, we can assess the thoroughness of testing. Thus, our recommended quality metrics include:
. Defects discovered
. Defects discovered per unit size (defect density)
. Requirements faults discovered
. Design faults discovered
. Code faults discovered
. Fault density for each product
We emphasize that this set does not represent the full spectrum of quality measures that can be employed. Is- sues of maintainability, utility, ease of use, and other
aspects of quality software are not addressed by defect counts. However, defect analysis is relative easy to im- plement, and it provides a wide spectrum of useful in- formation about the reliability of the software and the thoroughness of testing.
An additional product metric may be desirable. When customer requirements dictate that significant amounts of documentation be written (as often happens on gov- ernment contracts), the number of pages of documenta- tion may be a desirable measure to track and correlate with effort or duration. Thus, the set of product metrics may also include:
. Pages of documentation
2.4 Level 4: Managed Process
The managed process is the fourth level of maturity. Here, feedback from early project activities (e.g., prob- lem areas discovered in design) can be used to set pri- orities for later project activities (e.g., more extensive review and testing of certain code). Because activities can be compared and contrasted, the effects of changes in one activity can be tracked in the others. In a managed process, the feedback determines how resources are de- ployed; the basic activities themselves do not change. As shown in Figure 7, this level allows measurements to be made across activities. For example, we can mea- sure and evaluate the effects of major process factors such as reuse, defect-driven testing, and configuration management. The measures collected are used to con- trol and stabilize the process, so that productivity and quality match expectations.
Test Plans,
Design method Inspection Target Criteria Environment
1, A--
Complexity Complexity
Quality Quality Complexity Qualiiy
Complexity Quality
Figure 6. Measures for a particular defined process.

Process Maturity Framework
Figure 7. SADT diagram of managed process.
Figure 8 illustrates how a particular managed process might took. Metrics are used in feedback loops to report
on the number of design defects and on the number and
types of problems encountered with specific versions of the system. Then, project management uses the metrics information to make decisions about course corrections.
If the maturity of the process has reached the managed
level, then process-wide metrics can be collected and an- alyzed. These metrics reflect characteristics of the over-
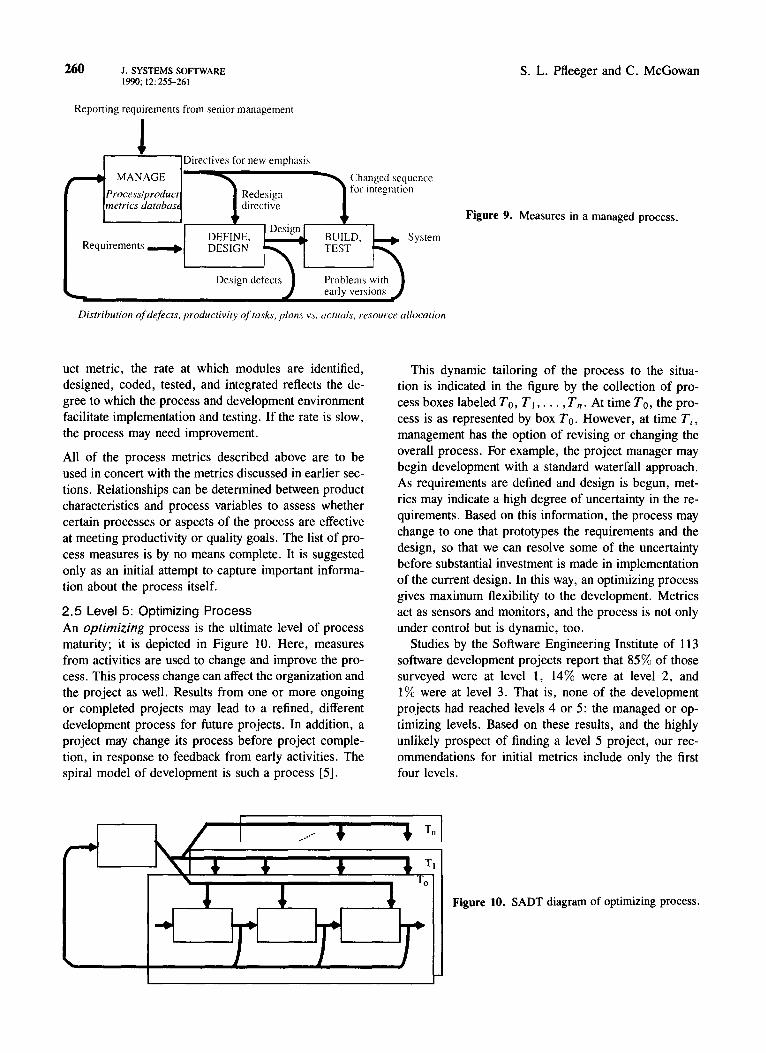
all process and of the interaction among major activities in the process, as shown in Figure 9. A distinguishing
characteristic of a managed process is that the software development can be carefully controlled. Thus, a major characteristic of the recommended metrics is that they help management control the development process.
We recommend that the following types of data be collected for a managed process. In some cases, the actual metrics must be defined and analyzed to suit the
development organization.
Process type. What process model is used in de-
velopment? For example, the waterfall, prototype, and transformational development paradigms are very differ- ent. In concert with other product and process charac-
teristics, the type of process may correlate highly with
certain positive or negative consequences.
Amount of producer reuse. How much is designed for reuse? This measure includes reuse of requirements, design modules, and test plans as well as code. By de-
1. SYSTEMS SOFTWARE 259 1990; 12: 255-261
signing components for reuse, one project group may
benefit from the effort of another group. Effort in under-
standing, creating, and testing code can be minimized, thus making the project easier to control. Furthermore, future projects can benefit from the reuse of components
produced here.
Amount of consumer reuse. How much does the project reuse components from other projects? This
measure includes reuse of requirements, design mod-
ules, and test plans as well as code. By using tested, proven components, effort can be minimized and qual-
ity can be improved.
Defect identification. How and when are defects dis-
covered? Knowing whether defects are discovered dur-
ing requirements reviews, design reviews, code walk-
throughs, and reviews, integration testing or acceptance
testing will tell us whether those process activities are
effective.
Use of defect density model for testing. To what
extent does the number of defects determine when test- ing is complete? Many organizations have no overall defect goals for testing the product. Thus, there is no
way to judge the quality either of the testing or of the
code. The use of defect density models has been shown to control and focus testing, as well as to increase the
quality of the final product.
Use of configuration management. Is a configura-
tion management scheme imposed on the development
process? Configuration management and change control work to afford management a great deal of control over
the development process. Traceability links can be used to assess the impact of alterations in some or all devel- opment activities or products.
Module completion over time. At what rates are modules being completed? Although ostensibly a prod-
Reporting requirements from senior management
1
Figure 8. Example of a managed process.
Directives for new emphasis
MANAGE Changed sequence for integration
Requirements -
260 J. SYSTEMS SOFTWARE 1990; 12: 255-261
S. L. Pfleeger and C. McGowan
Reporting requirements from senior management
1 Directives for new emphasis
Changed sequence
Redesign for integration
metrics databus directive Figure 9. Measures in a managed process.
Requirements -
Problems with
Distribution of defects, productivity of tasks, plnns vs. actuuls. resource docation
uct metric, the rate at which modules are identified,
designed, coded, tested, and integrated reflects the de- gree to which the process and development environment facilitate implementation and testing. If the rate is slow,
the process may need improvement.
All of the process metrics described above are to be used in concert with the metrics discussed in earlier sec-
tions. Relationships can be determined between product characteristics and process variables to assess whether
certain processes or aspects of the process are effective at meeting productivity or quality goals. The list of pro-
cess measures is by no means complete. It is suggested only as an initial attempt to capture important informa-
tion about the process itself.
2.5 Level 5: Optimizing Process An optimizing process is the ultimate level of process
maturity; it is depicted in Figure 10. Here, measures from activities are used to change and improve the pro- cess. This process change can affect the organization and
the project as well. Results from one or more ongoing
or completed projects may lead to a refined, different development process for future projects. In addition, a
project may change its process before project comple- tion, in response to feedback from early activities. The spiral model of development is such a process [5].
This dynamic tailoring of the process to the situa- tion is indicated in the figure by the collection of pro-
cess boxes labeled To, T 1, . . . , T, . At time To, the pro-
cess is as represented by box To. However, at time Ti , management has the option of revising or changing the
overall process. For example, the project manager may begin development with a standard waterfall approach. As requirements are defined and design is begun, met-
rics may indicate a high degree of uncertainty in the re-
quirements. Based on this information, the process may change to one that prototypes the requirements and the
design, so that we can resolve some of the uncertainty before substantial investment is made in implementation
of the current design. In this way, an optimizing process gives maximum flexibility to the development. Metrics act as sensors and monitors, and the process is not only under control but is dynamic, too.
Studies by the Software Engineering Institute of 113
software development projects report that 85% of those surveyed were at level 1, 14% were at level 2, and 1% were at level 3. That is, none of the development
projects had reached levels 4 or 5: the managed or op- timizing levels. Based on these results, and the highly
unlikkly prospect of finding a level 5 project, our rec-
ommendations for initial metrics include only the first four levels.
*
Figure 10. SADT diagram of optimizing process.

Process Maturity Framework
3. STEPS TO TAKE IN USING METRICS Metrics are most useful only when implemented in a
careful sequence of process-related activities. These ac-
tivities lay the groundwork for effective project man- agement by evaluating the needs and characteristics of development before identifying the appropriate metrics
to collect. The typical development organization should take the following steps:
Assess the process. Working with a set of guidelines
or with a process and metrics team, determine the level of process maturity desired (for a proposed project) or
implemented (for an ongoing one).
Determine the appropriate metrics to collect..
Once the process maturity level is known, decide which metrics to collect. For example, if level 2 is indicated
by the process level, but the ongoing project currently collects no metrics data at all, then level 1 metrics may be suggested as a starting point, with level 2 metrics to be added at a later time.
Recommend metrics, tools, techniques. When the types of metrics are determined, identify tools and tech-
niques to be used on the project. Choose these tools and
techniques with the overall goals of the project in mind.
Whenever possible, implement automated support for metrics collection and analysis as part of the project de-
velopment environment. It is essential that metrics col- lection and analysis not impede the primary development
activities; thus, metrics collection and analysis should be
as unobtrusive as possible.
Estimate project cost and schedule. Having deter-
mined the process level and selected the development en- vironment, estimate the cost and schedule of the project.
By using measures implemented at levels 1 or 2, con- tinue to monitor the actual cost and schedule during de- velopment .
Collect appropriate level of metrics. Oversee the collection of metrics.
Construct project data base. Design, develop and
populate a project data base of metrics data. This data
base can be used for analysis, where appropriate. Track the value of metrics over time, as recommended by
Schultz [4] and others, to determine trends and to under- stand how project and product characteristics change.
Cost and schedule evaluation. When the project is complete, evaluate the initial estimates of cost and schedule for accuracy. Determine which of the factors may account for discrepancies between predicted and actual values.
Evaluate productivity and quality. Make an overall
J SYSTEMS SOFTWARE 261 1990; 12: 255-261
assessment of project productivity and product quality,
based on the metrics available.
Form a basis for future estimates. Finally, incorpo- rate the project metrics in a corporate or organizational
metrics data base. This larger data base can provide historical information as a basis for estimation on fu-
ture projects. In addition, the data base can be used to
suggest the most appropriate tools and techniques for
proposed projects.
We are following these steps today at Contel. As a re-
sult of our process and metrics program, a large Ada
development project is collecting complexity informa-
tion using automated tools. A tool development project
using Objective C is counting objects and methods to track the size of the project; defects and their sever-
ity levels are also being monitored to assess the level
of product quality. Likewise, satellite and telephone op-
erations development groups are looking at a process maturity-based metrics approach to aid decisions about
productivity and quality. Eventually, our corporate met-
rics data base will allow project managers to make deci-
sions based on evidence from previous, similar projects.
4. EXPECTED BENEFITS
The increased understanding of the process and the con- trol of the project offered by a process maturity approach
outweigh the effort needed to capture, store, and ana- lyze the information required. Objective evaluation of
any new technique, tool, or method is impossible with-
out quantitative data describing its effect. Thus, the use of metrics in a process maturity framework should result in
. enhanced understanding of the process.
. increased control of the process.
. a clear migration path to more mature process levels.
. more accurate estimates of project cost and schedule.
. more objective evaluations of changes in technique,
tool, or method.
. more accurate estimates of the effects of changes on project cost and schedule.
REFERENCES
1.
2.
3.
4.
5.
S. D. Conte. H. E. Dunsmore, and V. Y. Shen, Software Engineering Metrics and Models, Benjamin-Cummings,
Menlo Park, California, 1986. Watts Humphrey, Managing the Software Process, Addison-Wesley, Reading, Massachusetts, 1989.
Shari Lawrence Pfleeger, Recommendations for an Ini- titrl Set of Metrics, Contel Technology Center Technical Report CTC-TR-89-017, Chantilly, Virginia. 1989. Herman P. Schultz, Software Management Metrics, Mitre Technical Report M88-1-ESD-TR-88-001, Bedford, Massachusetts, 1988. B W. Boehm, A Spiral Model of Software Development and Enhancement,” IEEE Computer, May 1988.