Embed Size (px)
Citation preview
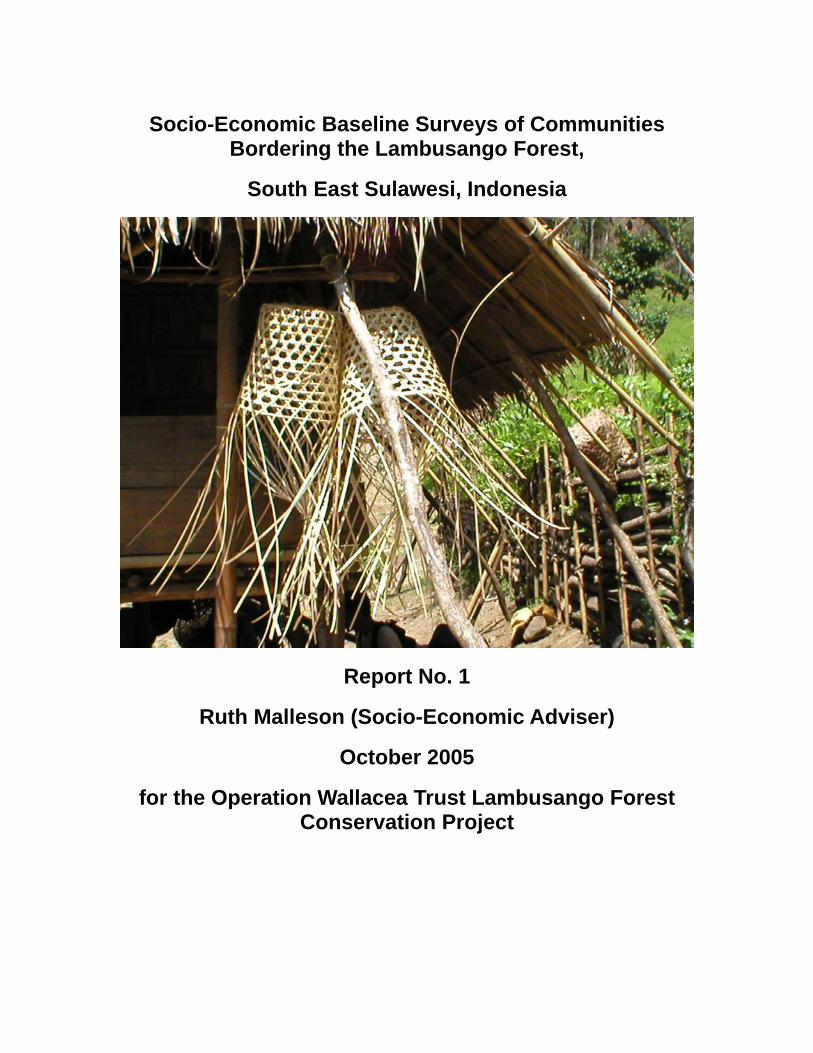
Socio-Economic Baseline Surveys of Communities Bordering the Lambusango Forest,
South East Sulawesi, Indonesia
Report No. 1
Ruth Malleson (Socio-Economic Adviser)
October 2005
for the Operation Wallacea Trust Lambusango Forest Conservation Project

1
Table of Contents Acknowledgements............................................................................................................. 3 Executive Summary ............................................................................................................ 4 1. Introduction............................................................................................................... 11 2. Methodology............................................................................................................. 12
2.1. Sampling ........................................................................................................... 12 2.2. Survey Instruments ........................................................................................... 13 2.3. Limitations ........................................................................................................ 13
3. Household Income Survey........................................................................................ 15 3.1. Introduction....................................................................................................... 15 3.2. Household Income Survey Results ................................................................... 15 3.3. Harapan Jaya Village (SP7) .............................................................................. 20 3.4. Kabongka Dusun............................................................................................... 21
Asphalt Mining ......................................................................................................... 22 Farming ..................................................................................................................... 22 Forest-related Activities............................................................................................ 23
3.5. Lawele Dusun ................................................................................................... 24 Farming ..................................................................................................................... 24 Forest-related Activities............................................................................................ 24
3.6. Watambo Dusun................................................................................................ 25 Farming ..................................................................................................................... 25 Forest-related Activities............................................................................................ 26 Marine-related Activities .......................................................................................... 26
4. Environmental Awareness Surveys .......................................................................... 27 4.1. Introduction....................................................................................................... 27 4.2. Environmental Awareness Survey Results ....................................................... 28
Village Environmental Awareness Surveys.............................................................. 28 Bau-Bau Environmental Awareness Survey............................................................. 38
5. Conclusions and Development Implications ............................................................ 39 5.1. Socio-economic Surveys................................................................................... 39
Forest-related Activities............................................................................................ 39 Farm-related Activities ............................................................................................. 40 Asphalt Mining ......................................................................................................... 41 Environmental Awareness Surveys .......................................................................... 41
5.2. General Development Implications .................................................................. 42 References......................................................................................................................... 42 Appendix A Socio-Economic Survey Questionnaire Manual for Enumerators and Supervisors........................................................................................................................ 44 Objectives ......................................................................................................................... 44 Introducing Yourself......................................................................................................... 45
Before Starting Work in Each Village .......................................................................... 45 Discussions with the Kepala Desa ................................................................................ 46
Background and historical context of rural livelihoods or the “vulnerability context”................................................................................................................................... 46
Mapping the settlement................................................................................................. 47 Choosing the sample ..................................................................................................... 48

2
Interview Locations for General Public Awareness about Lambusango Forest Reserve, August 2005...................................................................................................................... 49
Household Census and Income Form Instructions ................................................... 58 Environmental Awareness Form and Instructions.................................................... 64 Environmental Awareness Village Survey ............................................................... 64 Bau Bau Environmental Awareness Survey ............................................................. 70
Appendix B Estimated Mean & Annual Range of Household Cash Income Sources in Rupiah by Settlement 2005............................................................................................... 73

3
Acknowledgements This work has been funded by the Global Environmental Facility through the Operation Wallacea Trust. The fieldwork in Indonesia was assisted by Operation Wallacea Limited. Many people participated in data collection for this study. They include researchers, enumerators and students from Indonesian and British universities. Researchers, enumerators and students were accompanied by local guides in all of the villages surveyed. I would like to thank all involved for their invaluable help, enthusiasm and diligence. Thank-you also to all the Operation Wallacea and GEF teams whose help made this report and the surveys on which it is based possible. Above-all I would like to thank all the people in the villages where we worked and in Bau-Bau who answered the many questions with kindness, patience and courtesy. Researchers/University students involved in data collection for this study: Amy Armstong Evans Bustan Dwi Joko Budiharto Nani Cahyani Yul Haidir Maumi Claire Lumley Holmes Lukman Ruth Malleson La Ode Mukmini (Yamin) Nurmala Rudi James Saxby Upiadi Itras Liana Vetch Atiek Widayati

4
Executive Summary This report summarises the main preliminary findings of the socio-economic surveys carried out in July and August 2005 in settlements around the Lambusango Forest, central Buton, South East Sulawesi. The field visit consisted of a series of surveys in four settlements surrounding the Lambusango Forest Reserve: Lawele Dusun, Lawele Desa, Lasalimu District Kabungka Dusun, Wining Desa. Pasar Wajo District Watambo Dusun, Lambusango Desa, Kapontori District Harapan Jaya village (Satuan Pemukiman 7 - SP7), Lasalimu Selatan District
The aims of the survey were to describe the sources of income for the selected villages and to compare the level of awareness and support for the existing forest regulations and the levels of knowledge about the biological importance of the forest in the studied villages as well as in the nearby city of Bau-Bau. Similar socio-economic surveys will be repeated in 2006 and 2007 in order to provide comparative data which will be used to produce a final report in 2007. Household Incomes in Study Settlements A total of 183 households were interviewed for the household income survey. Preliminary analysis of the Household Income survey data reveal broad differences in the size of economies and significance of different income sources between settlements. Watambo appears to be the wealthiest of the four settlements, with an estimated mean annual household income of 15,518,843 Rupiah, almost double that of Lawele (the second wealthiest settlement) with an estimated mean annual income of 8,307,166 Rupiah. Household characteristics also varied between settlements. The proportion of households with electricity is relatively high in the more accessible and wealthy settlement of Watambo, where 60% of households sampled have electricity, compared to 44% of households in Lawele, and approximately a third of households in the relatively remote and less wealthy settlements of Harapan Jaya and Kabungka. It is suggested that remoteness is associated with lower household incomes. Watambo, being relatively accessible to Bau-Bau is relatively wealthy compared to Kabungka and Harapan Jaya. The estimated mean annual household incomes of the latter two settlements are 4,680,545 Rupiah and 4,995,141 Rupiah respectively. Results of the Household Income survey also reveal considerable differences in the importance of forest-related income sources between settlements and the proportion of households engaged in forest-related activities. Over a third (34%) of total village income is estimated to come from forest-related activities in Kabongka. Furthermore,

5
over a third of households sampled are engaged in Non Timber Forest Product (NTFP) –related activities, mainly rattan collection. The proportion of income obtained from forest-related activities descends to 12% for Watambo, to 5% for Harapan Jaya and to 4% for Lawele. However, these figures should be read with caution as timber and rattan-related activities are likely to be under-reported and it is likely that this has lead to an under-estimation of the extent of timber and NTFP enterprise activities and to some distortion of the responses given on income. In addition, the importance of certain NTFP activities (specifically rattan harvesting) can vary considerably from year depending on whether rattan companies are operating in the area. Remoteness may also be associated with higher reliance on farming. Farming-related activities contribute significantly to total village income of Harapan Jaya, the proportion of total income obtained from agriculture is estimated at 45%. Agricultural production also makes important contributions to the total village incomes of less-remote Lawele (24%) and to the least-remote village of Watambo (20%). The proportion of income obtained from agriculture descends to 13% in Kabongka, largely because a significant proportion of the population are (or were up until fairly recently) employed by companies involved in asphalt mining. A higher proportion of households in the relatively more accessible settlements receive income from salaries compared to the more remote settlements. Over 20% of households in Watambo enjoy a salary, whilst only 10% of households in Harapan Jaya enjoy one. In the past (up to 1970s) the asphalt mines near Kabongka were producing relatively large amounts of asphalt. However, since the late 1990s, asphalt production has declined dramatically, from c.115,000 tons in 1997 to c.12,000 tons in 2003 (Badan Pusat Statistik 2003). Three companies are currently involved in asphalt mining: Pt Yuman Jaya Tama, PT Buton Asphalt Indonesia and PT Saran Eka Karya and PT Timah. Employment (both as unskilled labourers and semi-skilled workers) makes a significant contribution to the economy of Kabungka. About a third of the households sampled were engaged in unskilled labouring and/or wage employment. A significant proportion of village income is generated through employees working either full-time or occasionally at the asphalt mines or the asphalt processing plants operating near Kabungka. Eight percent (14 out of 186) of the adults sampled were employed directly by asphalt companies (11 people were employed full-time and a further three were employed occasionally). But, as noted earlier, asphalt activities played a much more significant role in the economy in the past and many of those who were employed by asphalt companies in the past are now jobless. Of the adults sampled, 16% (29 out of 186) said they were jobseekers. Over 80% of households interviewed in Watambo are involved in marine-related activities. Just over a third (36%) of Watambo’s total village income comes from these enterprises (mainly oyster and seaweed production) and fishing.

6
Environmental Awareness Surveys Results of the Environmental Awareness Surveys indicate that people generally have relatively limited knowledge about the rules and regulations relating to the Lambusango Forest Reserve. Respondents’ knowledge relating to timber was relatively better than their knowledge of hunting and rattan collection regulations. Knowledge about the location of forest boundaries and the different zones within the forest appears to be limited in most settlements. When asked to report their feelings about the control of the Lambusango Forest Reserve the majority (87%) of respondents said they were happy with the fact that the State controlled the Forest Reserve. Reasons why respondents were happy with State control included the fact that it meant that the Forest Reserve would be conserved for future generations because the illegal exploitation of timber would be reduced. Responses did, however, vary between villages. Twenty-one percent of respondents from Watambo said they were unhappy with State control. The reasons most commonly offered for unhappiness included the fact that people were short of farm land and that the Government took the land away from the people to create the Reserve, leaving them with no choice in the matter. Land shortage appears to be particularly acute problem in Watambo, in an area with relatively high population density compared to the other settlements. When asked who should control the forest, nearly half (48%) of respondents said that the forest should be controlled by both the State and the communities. This finding indicates that the many respondents are supportive of the idea of community forestry, which in turn bodes well for the development of the community forest management. The majority of respondents interviewed in both the selected villages had not heard of Operation Wallacea or the Lambusango Forest Reserve. However there were considerable variations between villages. As would be expected, given the presence of Operation Wallacea staff and students as well as the Forest Rangers’ office, a higher proportion of respondents from Labundo Bundo had heard of Operation Wallacea compared to other settlements. In general, respondents appeared to have a sound knowledge of the importance of forest in providing water, preventing soil erosion and moderating temperatures and were supportive of the need to conserve forests. Ninety percent of respondents reported that damage to crops by the endemic pig, rats and monkeys was their greatest problem in connection to living next to the Lambusango Forest Reserve. Results of the Environmental Awareness Survey indicate that, overall, the majority of those interviewed currently express positive attitudes towards the Lambusango Forest Reserve and forest conservation. Eight-eight percent of those interviewed expressed positive or very positive attitudes. These results, however, should be treated with some caution. The positive attitudes expressed by the majority of respondents may simply reflect respondents’ reluctance to report their true feelings.

7
The Bau-Bau Environmental Awareness Survey results indicate that the majority of respondents interviewed had not heard of Operation Wallacea or the Lambusango Forest Reserve. Conclusions and Implications for Development Forest-related Activities Possible repercussions of tightening of forest regulations and denying access to forest resources may result in increased forest clearance and the planting of perennial crops (such as cocoa, coffee, coconut, and teak) which farmers perceive they have more claim to. It is important to be conscious of the fact that tightening of forest regulations may also affect a wide range of different households, including some of the ‘poorest of the poor’ (such as elderly people involved in making rattan baskets and single mothers with young children who earn money transporting planks). For such households, these forest-related activities may provide one of their only sources of income. It is therefore essential that the Project ensures that such people are not forgotten, particularly because their opinions may not be heard at village meetings. Rattan harvesting, particularly around Kabongka, appears to be quite intensive and circumstantial evidence indicates that harvesting levels may be unsustainable. Efforts should be made to develop sustainable harvesting guidelines as soon as possible. Milsom (2004) suggests some harvesting guidelines. There may also be potential to develop a sustainable rattan certification scheme (rattan ecolabelling). The viability of cultivating rattan at this point in time is questionable and needs thorough examination before any initiatives are implemented. Forest honey is a source of income for a few men in the villages surveyed. There may be potential to develop Fair-trade forest honey. There are NGOs who work with honey producers in developing countries on how to improve honey production and develop fair trade honey. There may also be potential to make better use of waste timber and generate income at the same time by developing wood working enterprises to make bowls and other wooden items for tourists. Farm-related Activities Results of the household income data indicate that agricultural activities form one of the mainstays of the economies of the majority of the settlements studied. This has considerable implications for conservation. Milsom (2004) ranks forest clearance as the second most important conservation issue for the Lambusango Forests after the hunting of anoa. He also suggests that forest clearance may be reduced by increasing the productivity of existing farms. Informants, particularly from Watambo, Lawele and Kabongka said that shortage of agricultural land is also a problem people are currently experiencing, partly because of their proximity of the Lambusango Forest Reserve.

8
Agroforestry may be an appropriate way to intensify agricultural production, increase incomes, diversify farming and reduce risks while, at the same time, reducing forest clearance, particularly where soil fertility is a problem. Intercropping (combining different farm crops in the same plot of land) could also be used to improve agricultural production. It is important not to overlook the significance of developing slow maturing crops (such as vanilla and teak) for improving income-earning potential. Whitten (2002) notes that mature coconut palms allow considerable amount of light in. He suggests that multi-storey intercropping is possible with coffee, cocoa, clove, bananas, sapota, pineapple, ginger beans, maize or rice. The combination of cloves and coconut as well as ginger and coconut being particularly lucrative and beneficial as mixed cropping protects farmer against market fluctuations and pest and disease outbreaks (Whitten 2002) When questioned whether living next to the Lambusango Forest Reserve causes problems, the majority of (89%) of respondents cited damage to crops caused by endemic pigs, monkeys and rats as their main problem. The endemic pig (Sus celebensis) appears to be one of the most serious problems for farmers because they destroy newly planted perennial crops (including cocoa, coffee, coconut, cashew seedlings) as well as food crops. Many farmers appear to use stone wall and live fences constructed with gamal (Gliricidia sepium) to stop pigs from entering farms, as well as traps. It may be worth looking at existing practices to control pigs and how these can be improved. This could be a possible student dissertation topic for 2006? Rats were cited as a major farm pest in all settlements. Whitten (2002) writes about a method used in oil palm plantations where the barn owl (Tyto alba) is encouraged to establish in palms. Whitten (2002) points out that the barn owl is not found in Sulawesi but the grass owl (T. Capensis) occurs in South East Sulawesi and so does Rosenberg’s barn owl (T. rosenbergi). He suggests that these owls could be encouraged if nest boxes were erected. This might also be a suitable study for Operation Wallacea volunteer students. Environmental Awareness Surveys Results of the environmental awareness surveys indicate that people generally have relatively limited knowledge about the rules and regulations relating to the Lambusango Forest Reserve. Respondents’ knowledge relating to timber was relatively less limited compared to their knowledge of hunting and rattan collection regulations. Knowledge about the location of forest boundaries and the different zones within the forest appears to be limited in most settlements. When asked to report their feelings about the control of the Lambusango Forest Reserve the majority (87%) of respondents said they were happy with the fact that the State controlled the Forest Reserve. Reasons why respondents were happy with State control included the fact that it meant that the Forest Reserve would be conserved for future generations because the illegal exploitation of timber would be reduced. Responses did,

9
however, vary between villages. Twenty-one percent of respondents from Watambo said they were unhappy with State control. The reasons most commonly offered for unhappiness included the fact that people were short of farm land and that the Government took the land away from the people to create the Reserve, leaving them with no choice in the matter. Land shortage appears to be particularly acute problem in Watambo, in an area with relatively high population density compared to the other settlements. When asked who should control the forest, nearly half (48%) of respondents said that the forest should be controlled by both the State and the communities. This finding indicates that the many respondents are supportive of the idea of community forestry, which in turn bodes well for the development of community forest management for the Lambusango Forest Reserve. The majority of respondents interviewed in both the selected villages had not heard of Operation Wallacea or the Lambusango Forest Reserve. However there were considerable variations between villages. As would be expected, given the presence of Operation Wallacea staff and students as well as the Forest Rangers, a higher proportion of respondents from Labundo Bundo had heard of Operation Wallacea compared to other settlements. In general, respondents appeared to have a sound knowledge of the importance of forest in providing water, preventing soil erosion and moderating temperatures and were supportive of the need to conserve forests. Results of the Environmental Awareness survey indicate that, overall, the majority of those interviewed currently express positive attitudes towards the Lambusango Forest Reserve and forest conservation. Eight-eight percent of those interviewed expressed positive or very positive attitudes. These results, however, should be treated with some caution. The positive attitudes expressed by the majority of respondents may simply reflect respondents’ reluctance to report their true feelings. The Bau-Bau Environmental Awareness survey results indicate that the majority of respondents interviewed had not heard of Operation Wallacea or the Lambusango Forest Reserve. General Development Implications Transmigration, timber concession and mining policies implemented by the Government can set off new patterns of behaviour at the local level. The large scale effects that such schemes and activities have on forest ecosystems, such as the Lambusango Forests, and on the livelihoods of those living in forest villages can potentially dwarf the effects of the activities of local people have on forest resources. It is important that the Project looks closely at the Government’s future development plans, particularly those relating to transmigration, timber concessions and mining. As these may potentially have enormous implications for forest conservation.

10
This is a preliminary report, subsequent reports will attempt to look at how changes in socio-demographic variables (such as respondents’ gender, livelihood strategies, level of education and wealth) influence both the socio-economies of households in the study settlements and attitudes towards the Forest Reserve and conservation in general.

11
1. Introduction This report is based on the results of fieldwork carried out in the southern part of Buton Island from July 8th to August 24th 2005, for the Lambusango Forest Conservation Project. The Project aims to conserve approximately 65,000 ha. of lowland evergreen rainforest in central Buton Island, South East Sulawesi. The field visit consisted of a series of surveys in four settlements surrounding the Lambusango Forest Reserve (see Figure 1): Lawele Dusun, Lawele Desa, Lasalimu District Kabungka Dusun, Wining Desa. Pasar Wajo District Watambo Dusun, Lambusango Desa, Kapontori District Harapan Jaya village (Satuan Pemukiman 7 - SP7), Lasalimu Selatan District
The terms of reference for the consultancy were:
• To describe the sources of income for the study villages, the size of the economies of each of the study villages and the percentage contributed by each of the sources to the overall economy.
• To quantify the levels of awareness and support for the existing forest regulations and the levels of knowledge about the biological importance of the forest in the four study villages and in the nearby city of Bau Bau.
• To estimate the levels of illegal hunting or logging activity from each of the studied villages from interviews, direct observations in the surrounding forests and interviews with members of the Wildlife Conservation Unit being formed under the Global Environmental Fund (GEF) programme.
Similar socio-economic surveys will be repeated in 2006 and 2007 in order to provide comparative data which will be used to produce a final report (in 2007) on the following:
• To compare the sources of income for the studied villages, the size of the
economies of each of these villages and the percentage contributed by each of the sources to this overall economy between 2005, 2006 and 2007.
• To identify and quantify the effects of the GEF contract system with consequent investment on the economies of the studied villages.
• To compare the level of awareness and support for the existing forest regulations and the levels of knowledge about the biological importance of the forest in the studied villages.
• To quantify the effects that the GEF awareness training programme. • To compare the levels of illegal hunting or logging activity from each of the
studied villages from interviews, direct observations in the surrounding forests and interviews with members of the Wildlife Conservation Unit being formed under the GEF programme with the data gathered in 2005.
• To quantify the impacts of the Wildlife Conservation Unit on the levels of illegal activity in the forest.

12
The report is divided into five sections. Section two provides a brief overview of the survey methods used. Section three presents the main survey findings for the Household Income survey, whilst Section four summarises the findings of the Environmental Awareness surveys. Finally, Section five provides some conclusions and discusses the implications of the survey findings. The surveys undertaken fall into two main groups:
• Household Income Surveys in selected settlements to provide data on household income.
• Environmental Awareness Surveys to assess the level of awareness and support for existing forest regulations and the levels of knowledge about the biological importance of the forest in a) the five selected settlements villages and b) the city of Bau-Bau.
No formal data was collected on levels of hunting and timber extraction during 2005. The Wildlife Crime Unit was still in the process of being formed. It is hoped that more information on these subjects will be collected in 2006 and 2007.
2. Methodology
2.1. Sampling Four dusun (hamlets or sub-villages) surrounding the Lambusango Forest Reserve were selected for the Household Income and Environmental Awareness Surveys: Lawele Dusun, Lawele Desa, Lasalimu District Kabungka Dusun, Wining Desa. Pasar Wajo District Watambo Dusun, Lambusango Desa, Kapontori District Harapan Jaya village (SP7), Lasalimu Selatan District Kakenauwe, Lasalimu District (Environmental Awareness survey only)
The above settlements have been chosen because they are all sub-villages which are part of the villages that have been selected by the Lambusango Forest Conservation Project as pilot settlements for the implementation of the Project’s Village Business Development interventions. The other pilot desa, not included in the survey, is Lasembangi. The Project used the following criteria to select pilot desa: Close proximity to relatively intact forest Reasonable potential to develop business enterprises Relatively good accessibility
It would have been ideal to include a village that was not involved in the Lambusango Forest Conservation Project activities as a “control” village, however there was insufficient time to allow this.

13
Within each dusun, the household was our basic unit of research. We aimed to sample at least 20% of households in each dusun for the Household Income Survey and at least 10% of households for the Environmental Awareness Survey. However the exact proportion of houses sampled varied due to time constraints. In order that the sample households are spread evenly through the sample frame we selected a quasi-random sample of households for interview, taking every “nth” house after a randomly chosen starting unit of less than “n” (see Appendix A for further details).
2.2. Survey Instruments Socio-economic studies at each of the four study villages involved:
a) Mapping exercise using GPS techniques. b) Discussions with the villages focused on finding out about changes over the
preceding decade in the following areas: income sources; the emergence of new activities; importance income generating activities; access to natural resources; the role of village institutions in natural resource management; and ways in which life was perceived to have improved or worsened over the past ten years.
c) Two questionnaire surveys: • Household Income Survey which was designed to obtain data on income
generating activities (see Appendix A) • Environmental Awareness Survey which was designed to obtain data on
the level of awareness and support for the existing forest regulations and the levels of knowledge about the biological importance of the forest in the studied villages (see Appendix A).
• The above questionnaires were designed to obtain indicators that might theoretically be influenced in the short or medium term by the impact of the Lambusango Forest Conservation Project (see Table 2.1 below).
Details of the methodology for the above surveys are and the questionnaire manual for enumerators is presented in Appendix A.
2.3. Limitations Ideally it would have been better if both surveys had covered 100% of all households in each village as well as at least one “control” village, where no project interventions take place. However, the fieldwork was constrained by limited time and the limited number of enumerators/translators that were available. The three senior translators/enumerators Nani Cahyani, Yul Haidir, La Ode Mukmini worked extremely efficiently and well but they also had to spend considerable amount of time working with British undergraduate students on their dissertation projects, due to the shortage of available translators.

14
Table 2-1 Indicators that might be influenced by the impact of the Lambusango Forest Conservation Project
Development Questionnaire Items Will the Project lead to new migration and development in the village?
Village census Mapping of the village using GPS techniques
Changes in household composition Household census: Number of small (0-5 years), big children (6-15) and adult men and women
Changes in employment and income Primary occupation Sources of income Estimated annual household income from different sources
Education Presence/absence of children in primary, secondary, technical school and university Absence of 6-15 year olds in formal education
Changes in housing Simple indicators of roof and walls of the housing
Health related actions and access Presence and quality of latrines Changes in revenue structure Presence of regular sources of revenue
(salary, pension or outside help) Participation in local savings groups
Despite reassurances, when interviewers introduced themselves, that the data collected would be treated confidentially, some people will have feared that the data would be used to identify those illegally obtaining products from the forest. Timber and rattan-related activities as well as hunting are likely to be under-reported and it is likely that this has lead to an under-estimation of the extent of timber and NTFP enterprise activities and to some distortion of the responses given on income. It was not possible to interview some of the households because they were staying in their farm huts, rather than their permanent residences in the villages. Some of the income-generating activities carried out by household members (including children) are likely to have been overlooked, since the household head was usually interviewed in the absence of other household members. Finally, respondents were asked to recall the amount of income they gained from different activities over the last year. Some inaccuracies are likely to have occurred when questioning entrepreneurs about details from activities that happened months ago.
15
3. Household Income Survey
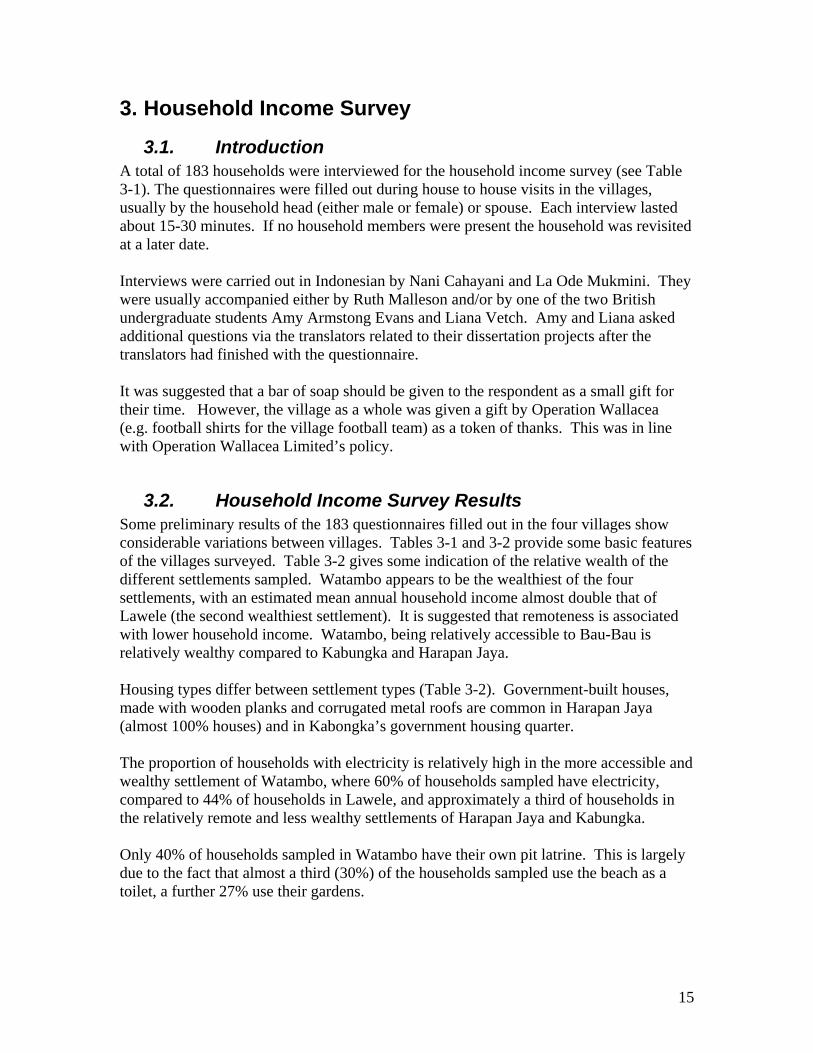
3.1. Introduction A total of 183 households were interviewed for the household income survey (see Table 3-1). The questionnaires were filled out during house to house visits in the villages, usually by the household head (either male or female) or spouse. Each interview lasted about 15-30 minutes. If no household members were present the household was revisited at a later date. Interviews were carried out in Indonesian by Nani Cahayani and La Ode Mukmini. They were usually accompanied either by Ruth Malleson and/or by one of the two British undergraduate students Amy Armstong Evans and Liana Vetch. Amy and Liana asked additional questions via the translators related to their dissertation projects after the translators had finished with the questionnaire. It was suggested that a bar of soap should be given to the respondent as a small gift for their time. However, the village as a whole was given a gift by Operation Wallacea (e.g. football shirts for the village football team) as a token of thanks. This was in line with Operation Wallacea Limited’s policy.
3.2. Household Income Survey Results Some preliminary results of the 183 questionnaires filled out in the four villages show considerable variations between villages. Tables 3-1 and 3-2 provide some basic features of the villages surveyed. Table 3-2 gives some indication of the relative wealth of the different settlements sampled. Watambo appears to be the wealthiest of the four settlements, with an estimated mean annual household income almost double that of Lawele (the second wealthiest settlement). It is suggested that remoteness is associated with lower household income. Watambo, being relatively accessible to Bau-Bau is relatively wealthy compared to Kabungka and Harapan Jaya. Housing types differ between settlement types (Table 3-2). Government-built houses, made with wooden planks and corrugated metal roofs are common in Harapan Jaya (almost 100% houses) and in Kabongka’s government housing quarter. The proportion of households with electricity is relatively high in the more accessible and wealthy settlement of Watambo, where 60% of households sampled have electricity, compared to 44% of households in Lawele, and approximately a third of households in the relatively remote and less wealthy settlements of Harapan Jaya and Kabungka. Only 40% of households sampled in Watambo have their own pit latrine. This is largely due to the fact that almost a third (30%) of the households sampled use the beach as a toilet, a further 27% use their gardens.

16
Table 3-1 Basic Population Figures of Sample Households by Dusun
Settlement Name
Total # House-holds Sampled
Total No. of People Sampled No. of People in Household
Mean House-hold Size
Total No. of House-holds
Estimated Total Population
1 2 3 4 5 6 >6 Harapan Jaya (SP7) 41 208 0 3 4 9 10 10 5 5.1 204 1035 Kabungka 49 357 2 3 16 18 10 4 18 7.3 122 889 Lawele 63 293 1 2 10 12 13 16 6 4.7 156 725 Watambo 30 188 2 1 3 3 8 9 9 6.3 85 533 Total 183 1046 567 3182
Source: Fieldwork 2005 Table 3-2 Household Characteristics of Household Sampled, By Dusun
Household characteristics by village (mean values for sample)
Harapan Jaya (SP7)
N=41 Kabungka
N=49 Lawele N=63
Watambo N=30
Annual Household Income (Rps.)
4,995,141
4,680,545
8,307,166
15,518,843
Per capita income
984,619
642,427
1,729,478
2,889,146 Households with
Electricity (%)
32
34
44
60
Brick or concrete houses (%)
-
37
29
3
Plank houses (%)
100
59
52
63
Metal sheet roofs (%)
100
90
43
67
Pit latrines
68
52
62
42
Own homes (%)
100
86
95
98
Own farmland (%)
100
93
89
97 Source: Fieldwork 2005

17
Figures 3-1 to 3-4 summarise the ethnic make-up of households included in the household income survey. It is clear that the majority of households in all settlements, apart from Harapan Jaya, are Butonese. As would be expected, Harapan Jaya has a high proportion of Ambonese refugees. Figure 3-1 Ethnic Make-Up of Sample Individuals Harapan Jaya
Ethnic Make-Up of Sample Individuals Harapan Jaya N=206
84%
15% 1%
AmboneseButoneseOther
Source: Fieldwork 2005 Figure 3-2 Ethnic Make-Up of Sample Individuals, Kabungka
Ethnic Make-Up of Sample Individuals Kabungka N=241
1%
92%
1%
3%
3%
AmboneseButoneseMalukuneseMunaneseOther
Source: Fieldwork 2005

18
Figure 3-3 Ethnic Make-Up of Sample Individuals, Lawele
Ethnic Make-Up of Sample Individuals, Lawele N=310
3%
88%
3%
1%
5%
BugisneseButoneseMalukuneseMunaneseOther
Source: Fieldwork 2005 Figure 3-4 Ethnic Make-Up of Sample Individuals, Watambo
Ethnic Make-Up of Sample Individuals Watambo N=187
8%
88%
1%
1%
2%
AmboneseButoneseMalukuneseMunaneseOther
Source: Fieldwork 2005 The proportion of households engaged in different activities gives an indication of the relative importance of different livelihoods in different settlements. Figure 3-5 provides an indication of the percentage of households sampled, engaged in different income-earning activities. Timber-related activities include income from carpentry as well as carrying planks.

19
Income Earning Activites: % of Households Engaged by Settlement and Income Category
0%
10%
20%
30%
40%
50%
60%
70%
80%
90%
100%
Harapan Jaya(SP7) Kabungka Lawele Watambo
CashewCocoaCoconutCoffeeFishing and Marine-based enterprisesLivestockNon-farm businessNTFPOther cropsRiceTimber-relatedUnskilled labourWage employment
Figure 3-5 Percentage of Households Engaged in Different Income Earning Activities

Agriculture is the major occupation in all villages, apart from Kabungka. Major cash crops include cocoa, cashew and rice. Over 20% of households in Watambo enjoy a salary, but only 10% of households in Harapan Jaya enjoy a salary. For more detailed income figures see Appendix B. A significant proportion of households in Kabongka and Watambo are engaged in non-timber forest product (NTFP) related activities, whilst in the other dusun these types of activities appear to be less important.
3.3. Harapan Jaya Village (SP7) Harapan Jaya is located inland on the eastern side of Buton Island, in Lasalimu Selatan Sub-District. About two and half hours drive from Labundo Bundo. The majority of the inhabitants are Ambonese refugees from Makaku who moved there in 1999 because of social unrest in Ambon. The ancestors of most of these refugees left Buton for Ambon over 50 years ago. Buton District government established new settlements in Lasalimu Seletan Sub-District in response to the Ambon Crisis. There are currently three settlements: Mulia Jaya (Satuan Pemukiman (resettlement unit -SP6), Harapan Jaya (SP7) and Sangia Arano (SP 8). These settlements are located in areas of degraded forest which were logged over during the mid 1990s. The logging companies involved received government permits to cut forests for cocoa plantation, however these companies only exploited first class timber species but did not plant a single cocoa seedling (Purwanto 2005). Many have very limited livelihood opportunities. Shortage of suitable farmland is a problem here. As Ellis (2000) points out, income portfolios are useful for describing the relative overall importance of different income sources for a settlement as a whole, rather than for differentiating between the livelihood strategies of sub-groups within larger populations. For Harapan Jaya, it is clear from Figure 3-6 that cocoa and non-farm business activities contribute significantly to total village income. Cocoa and other crops make up about 45% of total mean household income. Apart from cocoa, other crops make relatively low contributions to total village income. Cashew has been planted by farmers but most of the trees are yet to fruit (Purwanto 2005). Common non-farm businesses include the small scale trade of food items, particularly fish, and household goods. Wage employment, unskilled labour and transfers (mainly in the form of remittances) also make relatively high contributions to total village income. Carpentry and timber related activities make relatively little contributions to village incomes.

21
Figure 3-6 Mean Household Income Portfolio Harapan Jaya
Mean Household Income Portfolio Harapan Jaya (SP7) N= 41
1%
37%
3%
1%21%1%
2%
1%
8%
10%
11%
4%CashewCocoaFishingLivestockNon-farm businessOther cropsRiceTimber relatedTransfersUnskilled labourWage employmentCarpentry
Source Fieldwork 2005
3.4. Kabongka Dusun Kabongka is located inland, on the eastern side of Buton Island, about one and a half hour’s drive from Bau-Bau. It is one of four hamlets that make up the settlement of Wining. The other hamlets are Rampea, Montowu and Montowu Jaya. Wining was established in 1995 following the partitioning of Kancinaa Village (Purwanto 2005). Kabongka’s population largely consists of Butonese households. There are some households whose members originate from other parts of Buton Island who have moved into the relatively new quarter of the dusun where the Government has built approximately 50 purpose-built wooden plank houses with corrugated metal roofs in 2001. Approximately 18 of these purpose-built houses are currently empty. We were told that they could be purchased from the Government for two million Rupiah each. Some of the Butonese households in the original part of the settlement are descendents of people who moved from Lambusango and Karpontori Districts in the 1920s. According to respondents, the Government asked people from other areas to move to the Wining area.

22
Asphalt Mining Kabongka is close to two asphalt mines. Asphalt, a black sticky combination of bitumen, tarry hydrocarbons and minerals, is used for tarring roads. The asphalt-impregnated limestone on Buton Island is the only source of natural asphalt in Southeast Asia (Whitten et al 2002). The geological map of Buton indicates that asphalt occurs in two lines running north – northeast across the Lambusango forest (Whitten et al 2002; Milsom 2004). However, geological observations indicate that asphalt deposits maybe more widely distributed (Milsom 2004). In the past (up to 1970s) the mines were producing relatively large amounts of asphalt. provided. However, since the late 1990s, asphalt production has declined dramatically, from c.115,000 tons in 1997 to c.12,000 tons in 2003 (Badan Pusat Statistik 2003). Milsom (2004) reports that the previous phase of mining came to an end following a policy decision by the Indonesian government to import bitumen from the Middle East. Three companies are currently involved in asphalt mining: Pt Yuman Jaya Tama, PT Buton Asphalt Indonesia and PT Saran Eka Karya and PT Timah. As Figure 3-7 makes clear, employment (both as unskilled labourers and semi-skilled workers) makes a significant contribution to the economy of Kabungka. About a third of the households sampled were engaged in unskilled labouring and/or wage employment. The majority of this income is generated through employees working either full-time or occasionally at the asphalt mines or the asphalt processing plants operating near Kabungka. Eight percent (14 out of 186) of the adults sampled were employed directly by asphalt companies (11 people were employed full-time and a further three were employed occasionally). But, as noted earlier, asphalt activities played a much more significant role in the economy in the past and many of those who were employed by asphalt companies in the past are not jobless. Of the adults sampled, 16% (29 out of 186) said they were jobseekers. Informants in Kabongka told us that many ex-employees of the asphalt companies are now engaged in farming activities. It is not clear whether asphalt mining will expand or contract in the future. Either way it is likely to have implications both for the socio-economy of Kabungka and the conservation of the Lambusango Forest. Figure 3-7 also indicates that transfers contribute significantly to Kabungka’s economy. Most of this is in the form of remittances from relatives. This source of income is particularly important for women whose husbands are working in Malaysia.
Farming Cashew, cocoa, coffee, upland rice and cassava are some of the main crops grown in this area. However, as Figure 3-7 indicates these crops provide a limited contribution to Kabungka’s economy. Farm-related activities including livestock production, rice and perennial cash crops (cocoa, coffee, cashew nut and coconut) contribute about 13% of total village income. Spices and nuts including cengkeh (cloves), merica (black pepper), pinang (Areca catechu) Areca nut and kemeri or candlenut (Aleurites moluccana) are also sources of income for some

23
households. One household in the new Government-built housing quarter had a nursery of over 100 black pepper seedlings outside their house. Many people complained that pigs were one of the main farming problems. They reportedly dug up newly plant cocoa, coffee and cashew seedlings. In addition many respondents complained that poor soil fertility was also a problem. Shortages of farmland, due to the extension of asphalt mining areas into Kabungka’s farmland (Purwanto 2005) is also a problem. As a result farmers are opening up new farms in once forested areas.
Forest-related Activities Figure 3-7 indicates that the forest plays a significant role in the economy of Kabungka village. Forest-related income sources (including timber related activities, NTFP-related activities and carpentry) together contribute over half of total village income. Timber extraction appears to be an important income generating activity in this area, providing income for chainsaw operators as well as for women who were employed by chainsaw operators to carry planks from the forest to roadsides. Two female respondents explained that the tightening of forest regulations had meant that less timber was being extracted and they no longer had the opportunity to earn money from carrying planks. Rattan harvesting is one of the most important NTFP income sources, with over a quarter of households sampled (11 out of the 41 households) citing this as a source of income. It is also currently an important source of income for about 30-50 men in Wining. A rattan harvesting company currently has a permit to extract rattan in the forest around the village. However, we were told that the number of people involved in rattan collection in Kabungka is decreasing because the price is currently low. There is also circumstantial evidence that rattan resources in the surrounding forests are declining as harvesters said the distance they must travel to harvest rattan is increasing. Figure 3-7 Mean Household Income Portfolio Kabungka
Mean Household Income Portfolio, Kabungka N= 49
5% 6%
9%
16%
1%
1%
4%
12%
17%
15%
14%
Perennial Cash CropsLivestockNon-farm businessNTFPOther cropsRiceTimber relatedTransfersUnskilled labourWage employmentCarpentry
Source Fieldwork 2005

24
Honey is also reportedly a source of income for approximately 30-60 people in the Desa of Wining.
3.5. Lawele Dusun The Dusun of Lawele is located about 20 minutes’ drive southeast of Kakenauwe (popularly known as Labundo-Bundo) on the coast of Lawele Gulf. Lawele Dusun is one of six hamlets which make up Lawele Desa. The other hamlets are Toruku, Lapuli, Bajo, Kalende and Kawuna-wuna. Lawele Desa has approximately 536 households and 2,656 people (Purwanto 2005). Lawele Dusun has approximately 196 households consisting mainly of Butonese people. The Dusun appears relatively wealthy and thriving. Farming, forest related activities, some fishing and sand collection from the river are some of the main livelihood activities.
Farming Farm-related activities contribute nearly a quarter (24%) of the total village income for Lawele (Figure 3-8). Paddy rice and perennial cash crops including cocoa, cashew nut and coconut are important sources of farm income. Very few people grow coffee for income. Principal crops cultivated in Lawele include wetland rice, coconut, cocoa and cashew. About 60% of the households interviewed gained income from cultivating paddy rice, whilst about a third of households earned some income from coconut production (see Figure 3-5). Teak (Tectona grandis), known locally as jati wood is also grown by some farmers. Crops are either sold locally at the village’s market (which operates on Sunday and Thursday mornings) or taken to Bau-Bau. Pigs were cited by respondents as one of the main farming problems as they dig up young cocoa, coffee, cashew and coconut plants. Rats are also a problem for rice farmers. Another major problem cited was shortage of farmland. According to one informant the village approached the Government in 2003 to provide a section of the Forest Reserve for farming. The request was granted and the land provided has now all been planted with perennial cash crops (including cocoa and coconut).
Forest-related Activities The contribution of timber-related and NTFP-related to total village income is relatively low (see Figure 3-8). Timber extraction, mainly for house construction, is currently one of the principal forest-related activities. Rattan collection was important in past years. Mascot, the rattan harvesting company, had a permit to collect rattan in the area, however there are no companies currently operating. Other forest-related activities include honey collection. Langsat fruits (Lansium domesticum) are also harvested for their edible fruits, but are generally used for subsistence use rather than sale. Non-farm related activities, including wage employment, non-farm business activities and fishing, contribute just less than three quarters of Lawele’s total village income. Wage earners are mainly civil servants and teachers. Most of the income generated from non-farm business activities comes from petty trading of foodstuffs and household goods in stores and at the market in Lawele. Fishing is also an important income generating activity for some in Lawele.

25
Figure 3-8 Mean Household Income Portfolio, Lawele
Mean Household Income Portfolio Lawele N=63
9%
12%
26%
2%15%3%
2%
29%
2%Perennial Cash CropsFishingNon-farm businessTimber-related and NTFPsRiceTransfersUnskilled labourWage employmentCarpentry
Source Fieldwork 2005
3.6. Watambo Dusun Watambo Dusun is located on the Kapontori Gulf of Buton Island, about 40 minutes drive from Labundo Bundo on the main road between Bau-Bau (48km away) and Kapontori. Watambo is one of three dusun that make up Lambusango Desa. The other two dusun are Wowoncusu and Pobaa. Watambo’s position, between the sea and the Lambusango forest, provides its inhabitants with a relatively diverse range of livelihood activities including farming, marine-based activities and forest-related activities. The population consists mainly of Butonese households. In the past the village was located further inland but they then moved to the coast. The population in this village has expanded over the last five years. The Kepala Desa estimated that there were about 60 households in Watambo in 2000 and there are over 80 households presently in 2005.
Farming Farm-related income sources, mainly cashew nut production make an important contribution to the economy. Income from farming activities contributes about 20% of the mean household income (Table 3-9). Over 80% of households interviewed gained some income from this source (Figure 3-5). Coconut, cocoa, banana, maize, upland rice (paddy lading) and cassava are also cultivated by Watambo farmers. Teak is also being grown by farmers in small plantations. Other tree crops include asam (Tamarindus indicus)1 the edible pulp around the seeds is collected for sale by relatively poor households and enau (arrack palms, Arenga pinnata) which are cultivated for sugar production. One lady (from Ambon) also has a small plantation of salak (Zalacca palm, Salacca zalacca), cultivated for their edible fruit. She showed us how she pollinates the 1 Edible pulp used to flavour fish dishes and chutneys.

26
flowers with a brush to increase fruit production. She said this was necessary because there were insufficient numbers of bees in Watambo. Is there potential here to develop apiculture alongside Salak plantations?
Forest-related Activities Timber extraction, mainly for house construction, appears to be a significant economic activity in this area. Wood is also used to make canoes for sale. NTFPs provide a more significant source of income compared to the other settlements studied. Honey from the forest is a source of income for some men in Watambo. Four out of the 30 households sampled cited honey as a source of income. Poles are cut from the forest to make rafts used for oyster production (see below). Some households are involved in carving canoes. Rattan harvesting is not currently a source of income for many as there are no rattan harvesting companies currently operating in the area. Jimi and Champion rattan companies both operated in the area but they stopped operating in the Watambo area in 2003. Furthermore we were told by informants that there is very little rattan currently in the production forest of the Lambusango Forest Reserve. Weaving baskets (kerangang) from rattan was an important source of income for relatively poor, elderly people. However, we were told that people are now reluctant to enter the forest to harvest rattan for basket production because of the tightening of forestry regulations.
Marine-related Activities One respondent told us that the tightening of forest regulations had meant that forest-related activities had become less important as a source of income and had led some Watambo people to diversify into marine-related activities such as agar agar (seaweed) production, oyster production and fishing. The village had applied for a grant for equipment (ropes and floats) for seaweed production in the late 1990s. The seaweed seedlings were obtained from a neighbouring village. The seaweed produced is sold in Bau Bau. Seaweed production is seasonal. It is cultivated between June to September. Figure 3-5 indicates that over 80% of households interviewed are involved in marine-related activities. Just over a third (36%) of Watambo’s total village income comes from these enterprises (mainly oyster and seaweed production) and fishing (see Figure 3-9). Juvenile oysters are grown and sold on to one company, PT Selat Buton, located at Palabusa Bay, 20 km from Buton (Purwanto 2005).

27
Figure 3-9 Mean Household Income Portfolio, Watambo
Mean Household Income Portfolio Watambo N=30
18%
1%
8%
1%
5%
5%
1%
1%
17%
36%
7% CashewOther Perennial Cash CropsFishingLivestock and Other CropsNon-farm businessNTFPsTransfersUnskilled labour Wage employmentMarine-related businessesCarpentry
Source Fieldwork 2005
4. Environmental Awareness Surveys
4.1. Introduction The Environmental Awareness surveys aim to examine the attitudes of communities towards the Lambusango Forest Reserve in order to provide a means of assessing the impact of the Lambusango Forest Conservation Project. Such surveys are useful where assessing behaviour changes is difficult, for example when examining illegal activities such as hunting and illegal timber extraction (Infield and Namara 2001). Surveys were carried out in Kakenauwe2, Harapan Jaya, Kabungka, Lawele and Watambo. A second, slightly different survey, was carried out in the city of Bau-Bau. Both surveys used formal questionnaires, along the lines of those designed by Infield (Infield and Namara 2001) made up of open and closed response questions (see Appendix A).
2 Kakenauwe was not included in the household socio-economic surveys because pre-testing of the questionnaire took place there.

28
4.2. Environmental Awareness Survey Results
Village Environmental Awareness Surveys Table 4-1 provides information on the number and gender of the respondents interviewed. The majority of interviews were carried out by Operation Wallacea undergraduate student James Saxby with Yul Haidir who translated the questions for James. Yul Haidir carried out the data collection in Harapan Jaya on his own. Table 4-1 No. of and % Households Sampled by Village
No. of Individuals Interviewed from Different Households
Harapan Jaya Kabongka
Labundo Bundo Lawele Watambo
Grand Total
Female 11 12 12 25 9 69 Male 10 14 9 15 15 63 Total No. of Individuals 21 26 21 40 24 132 Total No. of Households in Village 204 122 75 156 85 642 % of Households Sampled 10 21 28 26 28 21
Source: Fieldwork 2005 Respondents were asked the question “Do you know about the Lambusango Forest Reserve? Overall, nearly two thirds (65%) of respondents (see Table 4-2) said they did, whilst over a third said either no or “don’t know”. Surprisingly, results varied considerably from settlement to settlement, with over 90% of respondents in Harapan Jaya saying “yes” compared to just over half of respondents in Lawele. Respondents were asked whether they were knew where the boundaries of the Forest Reserve were (Table 4-3). Overall, the majority (55%) of respondents expressed some knowledge of the location of boundaries, although there was some variation between respondents from different settlements. Only four (19%) of those interviewed from Labundo Bundo who answered this question said they were aware of where the boundaries of the Lambusango Forest Reserve were.

29
Table 4-2 Number and % of Respondents Expressing Some Knowledge about the Lambusango Forest Reserve, by Village
Dusun Name Don't Know No Yes
Total No of Respondents
Harapan Jaya 0 2 19 21 0% 10% 90% 100% Kabongka 5 11 16 31% 0% 69% 100% Labundo Bundo 0 9 12 21 0% 43% 57% 100% Lawele 11 7 22 40 28% 18% 55% 100% Watambo 7 2 15 24 29% 8% 63% 100% Total 23 20 79 122 Total % 19% 16% 65% 100%
Source: Fieldwork 2005 Table 4-3 Number and % of Respondents with Knowledge of the Location of Forest Reserve Boundaries
Village Name Don’t Know Yes
No. of Response
Harapan Jaya 3 18 21 14% 86% 100% Kabongka 10 16 26 38% 62% 100% Labundo Bundo 17 4 21 81% 19% 100% Lawele 19 21 40 48% 53% 100% Watambo 11 13 24 46% 54% 100% Total 60 72 132 Total % 45% 55% 100%
Source: Fieldwork 2005

30
Knowledge about the different zones within the forest appears to be limited in most settlements (see Table 4-4). Many respondents were under the impression that perennial crops (such as cocoa and cashew) could be planted in production forest and that it was “legal to use”. Many respondents were also aware of “non-production” forest and were under the impression that this area was “infertilie” and “useless”. Table 4-4 provides a summary breakdown of responses to the question “Do you know about the different types of forest within the Reserve?” Table 4-4 Knowledge about different zones within the Lambusango Forest Reserve, by Village
Village Name Don't Know
Limited Knowledge
Total No. of Responses
Harapan Jaya 0 21 21 0 100% 100% Kabongka 5 21 26 19% 81% 100% Labundo Bundo 19 2 21 90% 10% 100% Lawele 13 23 36 36% 64% 100% Watambo 9 10 19 47% 53% 100% Totals 46 77 123 Totals % 37% 63% 100%
Source: Fieldwork 2005 The majority of respondents were aware that the Lambusango Forest Reserve was under the control of the State. When asked who controls the forest, over 80% respondents said that the Forestry Department or Forest Rangers control the forest. When asked to report their feelings about the control of the Lambusango Forest Reserve the majority (87%) of respondents said they were happy with the fact that the State controlled the Forest Reserve (Table 4-5). Reasons why respondents were happy with State control included the fact that it meant that the Forest Reserve would be conserved for future generations because the illegal exploitation of timber would be reduced. Responses did, however, vary between villages. Twenty-one percent of respondents from Watambo said they were unhappy with State control. The reasons most commonly offered for unhappiness included the fact that people were short of farm land and that the Government took the land away from the people to create the Reserve, leaving them with no choice in the matter. Land shortage appears to be particularly acute problem in Watambo, in an area with relatively high population density compared to the other settlements.

31
Table 4-5 Reported Feeling of Respondents Toward Government Controlling Lambusango Forest Reserve
Village Name Don't Know Happy Unhappy
Total No. of
Responses Harapan Jaya 21 21 0% 100% 0% 100% Kabongka 1 19 2 22 5% 86% 9% 100% Labundo Bundo 16 2 18 0% 89% 11% 100% Lawele 2 35 2 39 5% 90% 5% 100% Watambo 2 13 4 19 11% 68% 21% 100% Total 5 104 10 119 Total % 4% 87% 8% 100%
Source: Fieldwork 2005 When asked who should control the forest, nearly half (48%) of respondents said that the forest should be controlled by both the State and the communities. This finding indicates that the many respondents are supportive of the idea of community forestry, which in turn bodes well for the development of the community forest management. Respondents were asked whether they had heard of the Operation Wallacea and the Lambusango Forest Conservation Project. The majority of respondents had not (see Table 4-6). However there were variations in the responses between villages. As expected, because of the presence of Operation Wallacea staff and Forest Rangers, a relatively higher proportion of respondents in Labundo Bundo had heard of Operation Wallacea and the Lambusango Forest Conservation Project. Knowledge of Operation Wallacea was most limited in Watambo and Harapan Jaya (Table 4-6) where over 80% of respondents had not heard of Operation Wallacea or the Lambusango Forest Conservation Project. Nearly a third of respondents in Lawele said they had heard of Operation Wallacea, but that it had been involved in a teak reafforestation scheme. The majority of respondents who said they had heard of Operation Wallacea said that people from Operation Wallacea had visited their village for research purposes only and had provided no services to the village during their visits.

32
Table 4-6 Reported Knowledge of Operation Wallacea and the Lambusango Forest Conservation Project
Village Name No Yes
Yes, implemented re-afforestation scheme Total
Harapan Jaya 17 4 0 21 81% 19% 0% 100% Labundo Bundo 10 11 0 21 48% 52% 0% 100% Lawele 28 0 12 40 70% 0% 30% 100% Watambo 6 1 0 7 86% 14% 0% 100% Total 61 16 12 89 Total % 69% 18% 13% 100%
Source: Fieldwork 2005 Tables 4-7 to 4-9 summarise respondents’ reported knowledge of rules and regulations relating to timber, rattan collection and hunting. Overall some limited knowledge of timber rules and regulations is fairly common amongst respondents. Of the respondents that said they were aware that regulations on timber extraction exist, most mentioned the fact that you need permits and that those caught without permits would either be fined or imprisoned. Knowledge relating to timber regulations varied between settlements (Table 4-7). Over a third of respondents in Lawele and Watambo said they had no knowledge of timber regulations. Again, as would be expected, respondents from Labundo Bundo appeared to be most aware of existing timber regulations. Nearly three-quarters of those questioned said they were aware of existing timber regulations. In contrast, nearly three-quarters of those questioned in Harapan Jaya said they were aware that timber regulations existed but could not explain what they were. Overall, respondents reported knowledge of regulations relating to rattan collection and hunting was relatively more limited compared to their knowledge of timber regulations (see Table 4-8 and 4-9). Of those respondents who expressed some knowledge of regulations relating to rattan, many reported they were aware that a rattan permit was required to collect rattan, but knew little more detail. Reported knowledge about hunting regulations was relatively more limited compared to respondents’ awareness of timber and rattan regulations. With over 42% of all respondents reporting that they had no knowledge of hunting regulations (Table 4-9). Most respondents who said they were aware that hunting regulations exist went on to say that they knew it was illegal to hunt dwarf buffaloes (Bubalus spp), known locally as anoa. No other animal was mentioned in connection with hunting regulations.

33
Table 4-7 Reported Knowledge of Timber Regulations
Village Name No Knowledge
No Existing Regulations
Aware that Regulations Exist
Aware, but can't explain
Total No. of Respondents
Harapan Jaya 1 0 5 15 21 5% 0% 24% 71% 100% Kabongka 3 0 19 4 26 12% 0% 73% 15% 100% Labundo Bundo 2 0 18 1 21 10% 0% 86% 5% 100% Lawele 16 4 14 6 40 40% 10% 35% 15% 100% Watambo 9 0 13 2 24 38% 0% 54% 8% 100% Total 31 4 69 28 132 Total % 23% 3% 52% 21% 100% Source: Fieldwork 2005 Table 4-8 Reported Knowledge of Rattan Collection Regulations
Rattan collection regulations
Village Name No Knowledge
No Existing Regulations
Aware that Regulations Exist
Aware, but can’t explain
Total No. of Respondents
Harapan Jaya 3 0 3 15 21 14% 0% 14% 71% 100% Kabongka 8 0 13 5 26 31% 0% 50% 19% 100% Labundo Bundo 12 1 7 1 21 57% 5% 33% 5% 100% Lawele 18 4 12 6 40 45% 10% 30% 15% 100% Watambo 10 0 11 3 24 42% 0% 46% 13% 100% Total 51 5 46 30 132 Total % 39% 4% 35% 23% 100%
Source: Fieldwork 2005

34
Table 4-9 Reported Knowledge of Hunting Regulations
Hunting regulations
Village Name No Knowledge
No Existing Regulations
Aware that Regulations Exist
Aware, but can't explain
Total No. of Respondents
Harapan Jaya 4 0 3 14 21 19% 0% 14% 67% 100% Kabongka 15 0 6 5 26 58% 0% 23% 19% 100% Labundo Bundo 9 1 10 1 21 43% 5% 48% 5% 100% Lawele 16 4 15 5 40 40% 10% 38% 13% 100% Watambo 12 0 9 3 24 50% 0% 38% 13% 100% Total 56 5 43 28 132 Total % 42% 4% 33% 21% 100%
Source: Fieldwork 2005 Table 4-10 provides some indication of the relative importance of different information sources relating to forest regulations. The most common sources of information were village meetings (held by Forest Rangers and other Forestry Department staff) and information given by Forest Rangers to individuals. “Word of mouth” was another important way that information on forest regulations spread. Another source of information was “the Government”, but it is not clear actually how the information from the Government had been disseminated. Table 4-10 Reported Source of Information on Forest Regulations
Village Name
Forest Rangers
Village Meetings
Local People
Government TV
News-paper
Radio School
Harapan Jaya 1 11 6 6 0 0 0 1 Kabongka 1 14 7 4 1 1 1 Labundo Bundo 17 0 2 1 0
0
0
0
Lawele 6 3 4 7 7 4 0 1 Watambo 3 4 5 1 1 1 2 0 Total 28 32 24 19 9 5 3 3
Source: Fieldwork 2005

35
Respondents were then asked how they could learn more about forestry regulations. Village meetings, with Village Headman and Forest Rangers, as well as TV and radio programmes, were the most commonly suggested answers. A series of questions were then posed to assess peoples’ perceptions of the importance of forests. In general, respondents appeared to have a sound knowledge of the importance of forests in providing water, preventing soil erosion and moderating temperatures. When questioned about the importance of forests for water supplies, climate and soils, the majority (over 80%) of respondents indicated that forests played an essential and beneficial role in maintaining water supplies, moderating the climate and maintaining soil fertility and preventing soil erosion. Respondents were also generally supportive of the need to conserve forest because they exist. Over eighty percent of respondents agreed that forests should be conserved purely because they exist. When questioned whether living next to the Lambusango Forest Reserve causes problems, the majority (89%) of respondents cited damage to crops caused by the endemic pig (Sus celebensis), rats and monkeys as their main problem (Table 4-11). Shortage of farmland was cited as a problem by respondents from Watambo. Watambo dusun is located close to the boundaries of the Forest Reserve in a relatively densely populated area. Table 4-11 Reported Problems of Living Near the Lambusango Forest Reserve
Village Name Land shortage None
Wild animal damage Totals
Harapan Jaya 21 21 0% 0% 100% 100% Kabongka 26 26 0% 0% 100% 100% Labundo Bundo 2 19 21 0% 10% 90% 100% Lawele 1 38 39 0% 3% 97% 100% Watambo 11 1 11 23 48% 4% 47% 100% Total 11 4 115 130 Total 8% 3% 89% 100%
Source: Fieldwork 2005
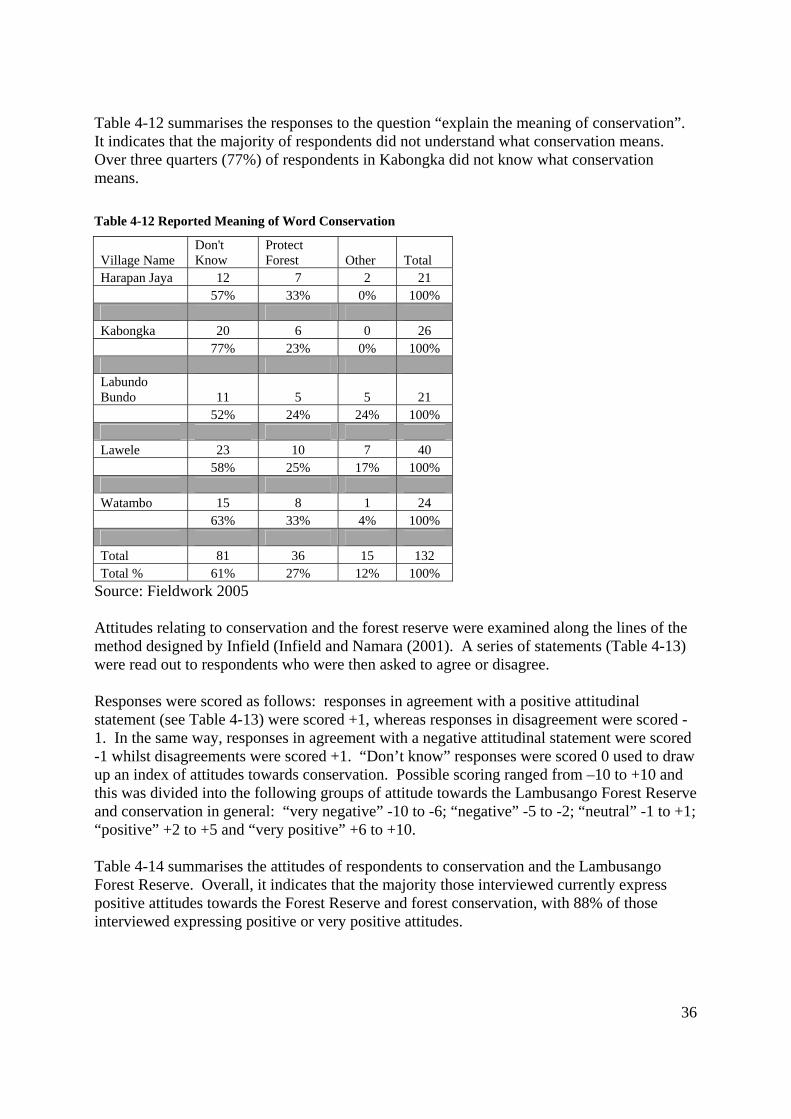
36
Table 4-12 summarises the responses to the question “explain the meaning of conservation”. It indicates that the majority of respondents did not understand what conservation means. Over three quarters (77%) of respondents in Kabongka did not know what conservation means. Table 4-12 Reported Meaning of Word Conservation
Village Name Don't Know
Protect Forest Other Total
Harapan Jaya 12 7 2 21 57% 33% 0% 100% Kabongka 20 6 0 26 77% 23% 0% 100% Labundo Bundo 11 5 5 21 52% 24% 24% 100% Lawele 23 10 7 40 58% 25% 17% 100% Watambo 15 8 1 24 63% 33% 4% 100% Total 81 36 15 132 Total % 61% 27% 12% 100%
Source: Fieldwork 2005 Attitudes relating to conservation and the forest reserve were examined along the lines of the method designed by Infield (Infield and Namara (2001). A series of statements (Table 4-13) were read out to respondents who were then asked to agree or disagree. Responses were scored as follows: responses in agreement with a positive attitudinal statement (see Table 4-13) were scored +1, whereas responses in disagreement were scored -1. In the same way, responses in agreement with a negative attitudinal statement were scored -1 whilst disagreements were scored +1. “Don’t know” responses were scored 0 used to draw up an index of attitudes towards conservation. Possible scoring ranged from –10 to +10 and this was divided into the following groups of attitude towards the Lambusango Forest Reserve and conservation in general: “very negative” -10 to -6; “negative” -5 to -2; “neutral” -1 to +1; “positive” +2 to +5 and “very positive” +6 to +10. Table 4-14 summarises the attitudes of respondents to conservation and the Lambusango Forest Reserve. Overall, it indicates that the majority those interviewed currently express positive attitudes towards the Forest Reserve and forest conservation, with 88% of those interviewed expressing positive or very positive attitudes.

37
Table 4-13 Attitudinal Statements used to Draw Up an Index of Attitudes Towards Conservation
Statements Negative/Positive Attitudinal Statement
What people need is more important than protecting the forests and the wild animals and plants within it.
Negative
It is important to protect animals and plants so that our children can see and use them in the future.
Positive
The tourists who come to the area are useful to the people. Positive The government made the forest reserve to take our land and keep us poor.
Negative
People should be allowed in the forest reserve so they can use it how they like.
Negative
It is important to set aside a place for plants and animals to live in.
Positive
The forest reserve is owned by the government and they must tell people how to use the forest
Positive
Logging, hunting and farming should be prevented in the forest reserve, or else all the animals will disappear
Positive
People should be allowed to eat game meat. Why keep animals we cannot eat?
Negative
Animals from the forest cause damage to crops and should be stopped
Negative
Comparison between settlements (Table 4-14) indicates that respondents in Harapan Jaya and Labundo Bundo expressing the most positive attitudes toward the Forest Reserve compared to other settlements. For Labundo Bundo, current positive attitudes towards conservation may stem largely from the benefits that the presence of Operation Wallacea had brought to many households in this village, which other settlements have so far benefited little from. This result suggests that the presence of Operation Wallacea activities can make people feel positive towards forest conservation. The results in Table 4-14 should, however, be treated with caution. The positive attitudes expressed by the majority of respondents may simply reflect respondents’ reluctance to report their true feelings. The positive attitudes currently expressed by respondents from Harapan Jaya may be due to the fact that this village currently has relatively little association with the forest. Few people rely on forest-related activities for their livelihoods and this, in turn, means that few people are currently affected by the presence of the Forest Reserve. Overall, slightly less positive attitudes were expressed by respondents from Watambo and Lawele. This may be due to the fact that some informants in these villages expressed concern that many of the inhabitants lack sufficient land to expand their farming activities, due to the proximity of the Forest Reserve.

38
Table 4-14 Attitudes to Conservation and the Lambusango Forest Reserve, by Settlement
Dusun Name Negative Neutral Positive Very positive Total
Harapan Jaya 0 0 8 13 21 0% 0% 38% 62% 100% Kabongka 0 1 19 6 26 0% 4% 73% 23% 100% Labundo Bundo 0 0 16 5 21 0% 0% 76% 24% 100% Lawele 2 5 28 5 40 5% 13% 70% 13% 100% Watambo 1 6 10 7 24 4% 25% 42% 29% 100% Total 3 12 81 36 132 Total % 2% 9% 61% 27% 100%
Source: Fieldwork 2005
Bau-Bau Environmental Awareness Survey As pointed out earlier, an environmental awareness survey was carried out in Bau-Bau to assess the level of awareness about the biological importance of the Lambusango Forest Reserve. A total of 97 people (41 females and 56 males) were interviewed in different locations in Bau-Bau (see Appendix C for details). Respondents were asked whether they had heard of Operation Wallacea, 60% said no, whilst 40% said yes. Respondents who answered yes were then asked to explain what Operation Wallacea did. The most frequently given answers included, that Operation Wallacea was a “Western Organisation”, that it was involved in bringing Western tourists to Buton and Hoga Island. Other respondents said they understood that Operation Wallacea was involved in research (including marine research on Hoga, bird studies and coral studies)3. Respondents were then asked whether they had heard of the Lambusango Forest Reserve. The majority of respondents (88%) said they had not heard of it. Of those nine respondents (12%) who said they had heard of the Lambusango Forest Reserve, three said that it was a forest containing wild animals such as anoa and monkeys. A further two respondents said that it was a forest important for conservation. The nine respondents who had heard of Lambusango Forest Reserve were then asked whether they felt that the forest was important for maintaining water supplies, for the local climate, and for soils. All nine respondents said that the Forest Reserve was important for these functions.
3 One respondent said Operation Wallacea was “the westerners travelling in the blue Land Cruiser”.

39
Attitudes relating to the Forest Reserve were examined along the lines of the method designed by Infield (Infield and Namara 2001). A series of statements (Table 4-13) were read out to respondents who were then asked to agree or disagree. An additional questions was also added, people were asked whether they agreed or disagreed with the statement “the forest reserve is a waste of land”4. Responses were scored and grouped into categories as explained for the village environmental awareness surveys above. Of the nine people who said that they had heard of the Lambusango Forest Reserve and who responded to the above statements. Six were grouped as having positive attitudes to the Lambusango Forest Reserve and three respondents were grouped as having neutral attitudes. Overall, then, for the very limited number of respondents who had heard of the Lambusango Forest Reserve, results indicate that the majority of those interviewed currently express positive attitudes towards the Forest Reserve and forest conservation in general.
5. Conclusions and Development Implications
5.1. Socio-economic Surveys The aims of the baseline surveys are to provide a pool of socio-economic and environmental awareness indicators that can be used to measure developments between two points in time. At this time, after the first visit, the questionnaires used seem to be able to make clear differentiations between the different villages. It is hoped that the future socio-economic surveys will be able to measure the changes that the Project development interventions make.
Forest-related Activities Possible repercussions of tightening of forest regulations and denying access to forest resources may result in increased forest clearance and the planting of perennial crops (such as cocoa, coffee, coconut, and teak) which farmers perceive they have more claim to. It is important to be conscious of the fact that tightening of forest regulations may affect a wide range of different households, including some of the ‘poorest of the poor’ (such as elderly people involved in making rattan baskets and single mothers with young children who earn money transporting planks). For such households, these forest-related activities may provide one of their only sources of income. It is therefore essential that the Project ensures that such people are not forgotten, particularly because their opinions may not be heard at village meetings. Rattan harvesting, particularly around Kabongka, appears to be quite intensive and circumstantial evidence indicates that harvesting levels may be unsustainable. Efforts should be made to develop sustainable harvesting guidelines as soon as possible. Milsom (2004) provides suggests some harvesting guidelines. There may also be potential to develop a sustainable rattan certification scheme (rattan ecolabelling). The viability of cultivating rattan at this point in time is questionable and needs thorough examination. Forest honey is a source of income for a few men in the villages surveyed. There may be potential to develop Fair-trade forest honey. There are NGOs who work with honey 4 This question was omitted from the village survey as some members of the survey team felt that it was a provocative statement

40
producers in developing countries on how to improve honey production and develop fair trade honey. There may also be potential to make better use of waste timber and generate income at the same time by developing wood working enterprises to make bowls and other wooden items for tourists.
Farm-related Activities Results of the household income data indicate that agricultural activities form one of the mainstays of the economies of the majority of the settlements studied. This has considerable implications for conservation. Milsom (2004) ranks forest clearance as the second most important conservation issue for the Lambusango Forests after the hunting of anoa. He also suggests that forest clearance may be reduced by increasing the productivity of existing farms. A variety of agroforestry practices were observed in the villages surveyed, these included: Cocoa grown under the shade of coconut/breadfruit and mango trees Cashew intercropped with coconut Coffee shaded with coconut Cocoa shaded with gamal (Gliricidia sepium) Cocoyams shaded with bananas Agroforestry may be an appropriate way to intensify agricultural production, increase incomes, diversify farming and reduce risks while, at the same time, reducing forest clearance, particularly where soil fertility is a problem. Intercropping (combining different farm crops in the same plot of land) could also be used to improve agricultural production. Possible combinations include intercropping maize with groundnuts and beans. ICRAF could possibly help in this area and again this could be a possible student dissertation topic for 2006. It is important not to overlook the significance of developing slow maturing crops (such as vanilla and teak) for improving income-earning potential. Whitten (2002) notes that mature coconut palms allow considerable amount of light in. He suggests that multi-storey intercropping is possible with coffee, cocoa, clove, bananas, sapota, pineapple, ginger beans, maize or rice. The combination of cloves and coconut as well as ginger and coconut being particularly lucrative and beneficial as mixed cropping protects farmer against market fluctuations and pest and disease outbreaks (Whitten 2002) When questioned whether living next to the Lambusango Forest Reserve causes problems, the majority of (89%) of respondents cited damage to crops caused by endemic pigs, monkeys and rats as their main problem. The endemic pig (Sus celebensis) appears to be one of the most serious problems for farmers because they destroy newly planted perennial crops (including cocoa, coffee, coconut, cashew seedlings) as well as food crops. Many farmers appear to use stone wall and live fences constructed with gamal (Gliricidia sepium) to stop pigs from entering farms, as well as traps. It may be worth looking at existing practices to control pigs and how these can be improved. This could be a possible student dissertation topic for 2006?

41
Rats were cited as a major farm pest in all settlements. Whitten (2002) writes about a method used in oil palm plantations where the barn owl (Tyto alba) is encouraged to establish in palms. Whitten (2002) points out that the barn owl is not found in Sulawesi but the grass owl (T. Capensis) occurs in South East Sulawesi and so does Rosenberg’s barn owl (T. rosenbergi). He suggests that these owls could be encouraged if nest boxes were erected. This might also be a suitable study for Operation Wallacea volunteer students.
Asphalt Mining Asphalt mining currently provides significant income to households in Kabongka. It is as yet unclear whether asphalt mining activities will expand or contract in the future, but developments either way are likely to have considerable implications for both the socio-economy of Kabongka and the conservation of Lambusango Forests.
Environmental Awareness Surveys Results of the environmental awareness surveys indicate that people generally have relatively limited knowledge about the rules and regulations relating to the Lambusango Forest Reserve. Respondents’ knowledge relating to timber was relatively better than their knowledge of hunting and rattan collection regulations. Knowledge about the location of forest boundaries and the different zones within the forest appears to be limited in most settlements. When asked to report their feelings about the control of the Lambusango Forest Reserve the majority (87%) of respondents said they were happy with the fact that the State controlled the Forest Reserve. Reasons why respondents were happy with State control included the fact that it meant that the Forest Reserve would be conserved for future generations because the illegal exploitation of timber would be reduced. Responses did, however, vary between villages. Twenty-one percent of respondents from Watambo said they were unhappy with State control. The reasons most commonly offered for unhappiness included the fact that people were short of farm land and that the Government took the land away from the people to create the Reserve, leaving them with no choice in the matter. Land shortage appears to be particularly acute problem in Watambo, in an area with relatively high population density compared to the other settlements. When asked who should control the forest, nearly half (48%) of respondents said that the forest should be controlled by both the State and the communities. This finding indicates that the many respondents are supportive of the idea of community forestry, which in turn bodes well for the development of community forest management for the Lambusango Forest Reserve. The majority of respondents interviewed in both the selected villages had not heard of Operation Wallacea or the Lambusango Forest Reserve. However there were considerable variations between villages. As would be expected, given the presence of Operation Wallacea staff and students as well as the Forest Rangers, a higher proportion of respondents from Labundo Bundo had heard of Operation Wallacea compared to other settlements. In general, respondents appeared to have a sound knowledge of the importance of forest in providing water, preventing soil erosion and moderating temperatures and were supportive of the need to conserve forests. Ninety percent of respondents reported that damage to crops by

42
the endemic pig, rats and monkeys was their greatest problem, when questioned whether living next to the Lambusango Forest Reserve causes problems. Results of the Environmental Awareness survey indicate that, overall, the majority of those interviewed currently express positive attitudes towards the Lambusango Forest Reserve and forest conservation. Eight-eight percent of those interviewed expressed positive or very positive attitudes. These results, however, should be treated with some caution. The positive attitudes expressed by the majority of respondents may simply reflect respondents’ reluctance to report their true feelings. The Bau-Bau Environmental Awareness survey results indicate that the majority of respondents interviewed had not heard of Operation Wallacea or the Lambusango Forest Reserve.
5.2. General Development Implications Transmigration, timber concession and mining policies implemented by the Government can set off new patterns of behaviour at the local level. The large scale effects that such schemes and activities have on forest ecosystems, such as the Lambusango Forests, and on the livelihoods of those living in forest villages can potentially dwarf the effects of the activities of local people have on forest resources. It is important that the Project looks closely at the Government’s future development plans, particularly those relating to transmigration, timber concessions and mining. As these may potentially have enormous implications for forest conservation. This is a preliminary report, subsequent reports will attempt to look at how changes in socio-demographic variables (such as respondents’ gender, livelihood strategies, level of education and wealth) influence both the socio-economies of households in the study settlements and attitudes towards the Forest Reserve and conservation in general.
References Badan Pusat Statistik 2003. Kabupaten Buton Dalam Angka (Buton Regency in Figures) 2003 Ellis, F. 2000. Rural Livelihoods and Diversity in Developing Countries Oxford: Oxford University Press. Infield, M. and A. Namara. 2001. Community attitudes and behaviour towards conservation: an assessment of a community conservation programme around Lake Mburo National Park, Uganda. Oryx Vol. 35 No.1 January 2001. Milsom, J. 2004 Update on the Threats to the Lambusango Forests September 2004. www.opwall.com Purwanto,E. 2005. Fourth Progress and Implementation Plan Report, Lambusango Forest Conservation Project, South East Sulawesi, Indonesia. Unpublished report for the Operation Wallacea Trust.

43
Whitten, T., G.S. Henderson, M. Mustafa. 2002. The Ecology of Sulawesi. The Ecology of Indonesia Series. Volume IV. Hong Kong: Periplus Editions

44
Appendix A Socio-Economic Survey Questionnaire Manual for Enumerators and Supervisors
Objectives Studies will be carried out in the following villages around the Lambusango Forest Reserve:
Lawele Dusun, Lawele Desa, Lasalimu District Kabungka Dusun, Wining Desa. Pasar Wajo District Watambo Dusun, Lambusango Desa, Kapontori District Harapan Jaya village (SP7), Lasalimu Selatan District
In addition an environmental awareness survey will be carried out in the city of Bau-Bau.
The studies comprise four main components:
a) Group discussions/interviews with the Kepala Desa to gather data on general information about the village and identify income streams.
b) Mapping exercises to draw up sampling frame.
c) Surveys that involve the administration of the following questionnaires: (a) Household census and income survey; (b) Attitudinal survey about rules and regulations relating to forest
conservation and environmental awareness; (c) Bau Bau survey on general public awareness about Lambusango forest and
its importance.
The mapping exercise is intended to provide a map locating: individual houses and the households within them; key social features (access roads and footpaths, schools, shops and meeting places etc.); as well as other geographical features (including rivers, village boundaries etc). The mapping exercise will also provide the sampling frame for the sample survey. Global positioning system readings were taken for every house in each of the settlements studied. The Household Census and Income survey will:
Provide quantitative and qualitative information on demography, education levels and other socio-economic characteristics of household members; privately owned natural assets (e.g. farmland) and personal/household physical assets (e.g. house quality and facilities etc.). These assets are often good indicators of relative wealth and will therefore provide useful information on which to differentiate relatively poor households from relatively wealthy households.
Quantitative income data which will allow us to compare how income sources differ
between villages and households and to capture how incomes change over a three year period.

45
The Household Census and Income data will hopefully allow us to differentiate households on the basis of wealth and other socio-economic characteristics, to compare different households and settlements for patterns of income sources and to assess the significance forest-based incomes in people’s livelihoods and the changes that are taking place over a three year period. The first and subsequent rounds of the Household Census and Income survey will be administered to a minimum of 10% of households in each of the settlements in 2006 and 2007. Information on the extent of logging and hunting will be collected by key informant interviews in the villages surveyed. In-depth discussions with key informants (including the Kepala Desa) should cover the topics listed in the checklist below. Such discussions will generate information on the broad context of rural livelihoods. This information will be used to complement and cross-check data collected through the formal sample surveys.
Introducing Yourself
Before Starting Work in Each Village • Remember to introduce yourself to the village head and other important village members.
Explain that you are working for a project called the Lambusango Forest Conservation Project that is based in Bau-Bau which aims to conserve the Lambusango Forest. Explain that the first thing you want to do is to gather some general information about the settlement and location of different households, other buildings, rivers etc. Ask the Kepala Desa whether it would be possible for him to select people who know the settlement well (preferably at least one woman). You want these people to work with you to draw a sketch map of the settlement and surrounding areas. Inform him you will then select a number of households where you would like to interview the head of the household or other adult household member.
• Ask the Kepala Desa if he could call a short village meeting to introduce you and so that
you can explain the purpose of collecting the information and the way it will be used. • You should try and keep your introduction to the Kepala Desa and village residents about
the survey short and to the point. Make sure the following basic details are covered. My name is ……. I am presently working for a project called the Lambusango Forest Conservation Project. This project has just started and is trying to look at ways to work with villages to look after the Lambusango Forests. As part of this work I am carrying out surveys to gather some basic information about the people who live in different households and find out how people in this area make a living. Stress that this settlement has not been singled out for special treatment. Point out that you will not have time to visit every household so you will select only some of them. Explain that you want to return after a year and again in two years to ask more questions in some households about the activities of household members. Don’t forget to explain that the personal information gathered about specific people and their livelihoods (i.e. their names etc.) will

46
remain confidential (i.e. it will not be given out to anyone else). It will not be passed on to government or other organisations. Inform them that the results of the survey will be used to inform organisations involved in forest conservation to understand the importance of the forest for rural livelihoods and to assess whether the activities of the project have been beneficial to people living around Lambusango forest. Stress that there are no promises about particular activities resulting from this work.
• Ask the people attending the meeting when would be the most convenient time of day to interview people. They may also be able to inform you of any households which it will not be possible to include. For example, there may be a family who has recently been bereaved who would not want to be disturbed.
Discussions with the Kepala Desa
Background and historical context of rural livelihoods or the “vulnerability context” People’s livelihoods may be strongly affected by external factors over which they have very limited or no control. It is therefore important to collect information that will give us an overall picture of the trends and changes that have affected people’s livelihoods over the last ten years or so in each settlement and the ways that households and individuals respond to these changes. Focus group discussion should be held in each village at the start of the research. Separate discussions should be held with men and women. Start by asking people how they think settlement life has changed over the past decade. Discussions should focus on collecting information on:
i) Changes in main income sources. ii) New income sources. iii) Problems associated with the main income-generating activities and marketing. iv) Ways in which life is perceived to have improved or worsened over the past ten years. External factors that may influence people’s livelihoods may include:
• Policy, institutions and processes • Demographic change: Has the population of this settlement increased, decreased or
remained the same over the past decade? If there has been a change in population, note reasons for this change (e.g. is it because of migration?)
• Changes in availability of natural resources: Such as changes in the availability of land for farming, forest resources, water, fish stocks.
• National/international economic trends: Such as changes in the world prices of cash crops (e.g. decline in cocoa prices) or currency devaluation.
• Political changes: such as changes in government or military. • Shocks: may include floods, droughts, or fires, human, crop or livestock pests and
diseases. • Seasonality: Seasonal factors, such as the onset of rains, the length of the dry and rainy
seasons, affect (amongst other things):

47
the production of crops, selective logging, non-timber forest products (NTFPs )etc.; the prices of foods and other goods; employment opportunities; the availability of labour; and the flow of household income.
For example, some household members may migrate during a particular season to supplement their income (e.g. to carry out specific economic activities, such as fishing or to find work as farm labourers at the beginning of the dry season). Summarise the information on trends and change collected through discussions with individuals and groups as lists of (amongst other things):
Events, New income sources: Ask people to draw up a list of incomes, focus only on incomes
where cash transactions are involved, such as wages, paid services, market products (especially products actually sold). Use prompts by asking people about marketed forest products (organised by category of use: food, construction material, medicine). Prompt people to remember minor forest products that might be important at specific times of the year or sporadically.
How people’s lives have improved/worsened over the last decade.
The next step is to discuss how households and individuals have responded to external changes. For example, how did a household’s livelihood strategy change when coconut wilt disease decimated their coconut plantation? Similarly, how have households responded to dwindling forest resources? Summarising the findings of such discussions and comparing findings between settlements should help you to build a broad-brush picture of the socio-economy of life in different settlements. Your findings from these discussions should be written up in your report.
Mapping the settlement Start at a strategic point in the village (e.g. road junction or the last house at one end of the village). Decide which direction you will move in. Move with the informants to the first house. Draw a square or rectangle to represent the house. Ask how many households are occupying the house. If necessary, draw lines to divide the house into the number of households found there. Give each individual household a unique number. Then record the names of each household head and the the GPS reading for each house on a separate piece of paper. Make sure the informants realise that these names should be the names of the people actually living in the house rather than the people who own it. Remember to include all outlying farmsteads that surround the settlement. The map of the settlement should also show:
• Geographical features, such as hills, rivers, streams and details on surrounding forest and farmland.
• Physical features, such as the size of the settlement, the location of houses. Each house should be marked on the map. You should also mark other types of public

48
and private buildings (e.g. meeting places, stores, mosques and schools). • Features which affect lifestyles and well-being, such as drinking water sources,
livestock and sanitation facilities. • Communication networks, such as main roads, navigable rivers and/or footpaths
leading out of settlement, bridges or crossing points on rivers. Walking/driving time from neighbouring villages and nearest market towns? How this varies with seasons.
• Social structure, location of all houses and households, Kepala desa’s house, meeting points, neighbourhood boundaries and other land boundaries (such as forest reserve boundaries).
• Manpower for development, location and number of development agents such as agricultural extension workers, teachers and health workers.
• Development features and resources, such as health posts.
Use coloured pencils to indicate various landmarks, land use areas and housing layout. You will need to copy this map. The original should be left with the inhabitants of the settlement. Take the copy with you. Keep it safe! This will be a useful reference when you return to carry out the other surveys.
Choosing the sample You will know the number of households in each settlement from the settlement maps. Add the total number of households in each settlement together. This will give you the total number of households in your sampling frame. For example, you may have mapped a settlement and found that it has 120 households. The total number of households in the sampling frame is 120. We have decided to sample at least a minimum of 10% of the households in each settlement (or a minimum of 30 households whatever is the greatest) for the Household Income Survey. In addition we will select a further (minimum of) 20 households for the administration of the Environmental Awareness Survey. In order that the sample households are spread evenly through the sample frame we will select a quasi-random sample of households to be interviewed. This method entails selecting every ‘Nth’ household at regular intervals from the sampling frame until you have reached the required sample size. To work out ‘N’ divide the total number of households in your sampling frame by 20 (for the household income survey). For example, if the total number of households in the settlement is 120 and you will need to sample every 6th house (120 divided by 20 is 6) until you reach the required sample size. One of the first six households is chosen randomly and every 6th household from then on is included in the sample. For the Environmental Awareness questionnaire in settlements around the Lambusango Forest Reserve, we have decided to a minimum of 20 households per settlement. To work out “N” divide the total number of households by 20. E.g. if there are 160 households in the settlement, you will need to select one of the first eight households and then sample every 8th house after that. Please note we need to ensure that DIFFERENT households are sampled for the household income and the environmental awareness survey to avoid interview fatigue! This was done by checking the lists of the selected household numbers for the different surveys. If the same household number appeared on both survey lists, we agreed that one team should survey the adjacent house instead.

49
The Bau-Bau Environmental Awareness survey was administered to randomly selected respondents in different locations in Bau-Bau. We aimed to sample a selection of men and women of different ages and backgrounds. A list of the locations where interviews took place is given below.
Interview Locations for General Public Awareness about Lambusango Forest Reserve, August 2005 1. Elementary School Three, Bone-Bone 2. Junior High School Four, Bau-Bau. 3. Senior High School Two, Bau-Bau. 4. Dayanu Ihsanuddin (Unidayan) University of Bau-Bau. 5. STAIN (Sekolah Tinggi Agama Islam Negeri (State University on Islamic Religion), Bau-
Bau 6. Forestry Department. 7. Mayor’s office. 8. Buton Regency Office 9. Agriculture Department. 10. Education Department 11. Police Department. 12. Raja Wali Hotel. 13. Rosichan Hotel. 14.Yana Hotel. 15. Karya Nugraha Market 16. Nirwana Beach.

50
Household Census Form Form ID: HC_ _ /_ _/_ _ _ Page 1
1.Interviewer’s name: __________________________ 2.Date____________ 3.Village name____________________ 4.House No._______ 5.Location_________________ 6.House open, vacant or closed? __________ 7.Name of interviewee?_________________ 8.Relationship to HH:____________ House data 9. House Type:_______________ 10. Walls made of :_________ 11. Roof made of :_____________ Household data I would like to know some things about the different people who live permanently in this house. Do not include people who are just visiting as guests. 12.How many people live in this household?____ 13. House owned by a household member? no/yes ___________ 14. Electricity generator? no/yes ___ 15.Where do you go to the toilet? __________ ( pit latrine; garden; other (specify) Please turn over

51
Household census form House No.:______Settlement_______________ Form ID: HC_ _ /_ _/_ _ _ Date:________ Page2 Household data 1 2 3 4 5 6 16. Name
17. Relationship to HH
HH
18. Sex
19. DOB
20. Education (SD,SMP, SMA university/technical)
21. Years of Education ALL THOSE OVER 16: 22. How long have you stayed in this place?(less than 1 year,no. of years, permanent resident)
23. Moved from where? (desa, kecamatan, kabupaten, propinsi)
24.Stay for how long? (DK, less than 1 year/ no. /years)
25. Main occupation
26.Is HH member employed by someone? (Y/N)
27. If yes, type of employment (farm labourer, mechanic, driver)
28.Name of employer 29. Timing of employment (full-time, seasonally, occasionally)
30. Ethnic group (eg Butonese)

52
Form ID: HC_ _ /_ _/_ _ _ Page Interviewer’s name: Date____________ Settlement name____________________ House No._______ Enterprise Data 31.Does any member of your household farm? no/yes______ If NO Q35. 32. If yes, what are the main crops grown by people in this house? ( Rice; coconut; cocoa; coffee; other (specify) Main Crop 1_____________________ Main Crop 2_____________________ Main Crop 3_____________________ 33. Who owns most of the land you farm? ___________ (Possible answers: household head, other household member, landlord, other) 34. Do any household members hire labour? no/yes_____ 35. Does any member of the household trade? no/yes ____

53
Household census form House No.:______Settlement_______________ Form ID: HC_ _ /_ _/_ _ _ Date:________ Page Enterprise data Now I want to ask you about how the people in this household have been making a living over the last year. 36.Sources of income for the whole household for the last year ?
37. How do you sell? Unit of measurement(eg kg/basket/bundle
38.Price per unit measurement Rp.
39. Quantity of product sold in last year
40. Total income
41. Total Costs (e.g. transport, farm labour, fertiliser)
42.Amount of profit earned from this source in last year (profit = income – costs)
e.g..Cashew
kg 7000 100kg
1.
2.
3.
4.
5.
6.
7.
8.
9.
THANK-YOU FOR YOUR ASSISTANCE

Household Income Form Indonesian version Formulir Sensus Rumah Tangga
No Formulir: HC/_ _/_ _/_ _ _
1.Nama Pewawancara: __________________________ 2.Tanggal____________ 3.Nama Desa____________________ 4. No Rumah._______ 5.Lokasi_________________ 6.Rumah terbuka, kosong, atau tertutup? __________ 7.Nama yang diwawancarai?_________________ 8.Hubungan Dengan Kepala Keluarga :____________ Data Rumah 9. Tipe Rumah:_______________ 10. Dinding terbuat dari :_________ 11. Atap terbuat dari :_____________ Data Rumah tangga, Saya ingin mengetahui beberapa hal tentang orang orang yang tinggal menetap dirumah ini. Tidak termasuk pendatang atau tamu yang berkunjung. 12.Berapa orang yang tinggal dirumah tangga ini?____ 13. Rumah milik anggota keluarga? ya/tidak ___________ 14. Listrik, generator? ya/tidak ___ 15.Buang air dimana? __________ ( WC; Kebun; yang lain (spesifikasi) Lihat halaman berikutnya

55
No, formulir sensus rumah tangga No. Rumah.:______Desa_______________ Form ID: SRT_ _ /_ _/_ _ _ Tanggal:________ Halaman2 Data Rumah tangga 1 2 3 4 5 6 16. Nama
17. Hubungan dengan kepala keluarga
KK
18. Jenis Kelamin
19. Tangga Lahir
20. Pendidikan (SD,SMP, SMA universitas/tehnik)
21. Lama Studi Untuk yang berumur diatas 16: 22. Sudah berapa lama tinggal di tempat ini?(Kurang dari 1 tahun,lama tinggal, penghuni tetap.
23. Pindah dari mana? (desa, kecamatan, kabupaten, propinsi)
24.Tinggal untuk berapa lama? (TT, Kurang dari 1 tahun/ Jumlah Tahun)
25. Pekerjaan utama
26.Apakah anggota keluarga di pekerjakan oleh orang lain ? (Y/T)
27. Jika Ya, Jenis pekerjaan (Buruh tani, mekanik, pengemudi)
28.Nama pemilik kerja 29. Waktu kerja (fulltime, Musiman, kadang kala)
30. Suku (Mis: Suku Buton)

56
Form ID: HC_ _ /_ _/_ _ _ Halaman Nama Pewawancara: Tanggal ____________ Nama desa____________________ No. Rumah_______ Data Usaha 31.Apakah ada anggota keluarga yang bertani? Tidak/ya______ Jika Tidak Pertanyaan 35. 32. Jika Ya, hasil panen apa yang paling banyak di rumah ini? ( Beras; Kelapa; kakao; kopi; yang lain (spesifikasi) Panen Utama1_____________________ Panen utama 2_____________________ Panen utama 3_____________________ 33. Siapa yang memiliki sebagian besar lahan pertanian/perkebunan anda? ___________ (kemungkinan jawaban: Kepala keluarga, anggota keluarga yang lain, tuan tanah, lainnya) 34. Apakah ada anggota keluarga yang menyewa pekerja? Tidak/ya_____ 35. Apakah ada anggota keluarga yang berdagang? Tidak/ya ____

57
Formulir sensus rumah tangga No Rumah.:______Desa_______________ Form ID: HC_ _ /_ _/_ _ _ Tanggal:________ Halaman: Data Usaha.Saya ingin menanyakan data pendapatan anda satu tahun terakhir 36.Sumber pendapatan seluruh anggota keluarga untuk satu tahun terakhir?
37Bagaimana dijual?Ukuran unit (Mis kg/keranjang/ikat
38.Harga perunit Rp.
39. Quantitas yang terjual tahun lalu
40. Jumlah pendapatan
41. Total pengeluaran (Mis: transportasi, Gaji pekerja, Pupuk)
42.Jumlah untung yang diperoleh (Umting= Pendapatan – biaya pengeluaran)
Mis. Jambu mente
kg 7000 100kg
1.
2.
3.
4.
5.
6.
7.
8.
9.

58
Household Census and Income Form Instructions Introduction The Household Census and Income questionnaire will be administered three times, the first survey will be carried out in July and August 2005, the second survey in July/August 2006 and the third survey will be carried out in July/August 2007. The purpose of the Household Census and Income questionnaire is to: a) Prepare a listing of all households to be included in the sample; b) To gather information on the socio-economic characteristics of all household
members so that we can group households into different socio-economic categories; c) To gather quantitative information on household income to assess the relative
importance different sources of cash income for the livelihoods of different household categories.
d) Assess yearly variations in the significance of different income sources for different categories of households.
e) Give some indication of the impact that project activities are having on the livelihoods of different categories of people.
f) The questionnaire will also provide you with an opportunity to get to know the people in the area and become known to them. Contacts developed during the survey can serve as friends and informants as the work progresses.
The notes that follow provide information about the questions on the Household Income form. Before starting each household interview, remember to introduce yourself to the household member(s) present and ask them if the head of the household is present in the house. Ask the household head, (or another adult who has primary responsibilities in the household, if the household head is not present) if you can ask them some questions. Briefly explain why you are here (see section entitled “Introducing Yourself” above). If possible, try and ensure that other adult household members are present while you are interviewing because the information provided by the main respondent can then be added to or amended by other household members. If you are unable to obtain all the information because certain key members of the household are absent, you could ask when they would be available to interview and return with the form to complete it. Before asking any questions, please remember to fill in the page number, form identification number, your name, date, household number (from the map) and settlement name at the top of the form. This needs to be done for every page of the form. It will enable you and others to identify which household this census form refers to. It will also ensure that if pages become separated they can easily be put together again. You need to fill in the Form Identification Number. The first two letters are the initials for the survey (e.g. HI stands for household income). The second two letters need to be filled with your initials and the last three spaces then need to be filled with number of questionnaire. So Form Identification no. LE RM 036
59
would indicate that the first two letters represent the village name (Lewele). The second two letters represent the interviewer’s initials (in this case mine, Ruth Malleson) and the last three numbers indicate that this is the 36th questionnaire I have carried out in Lewele. The numbers below correspond with the number of the question on the household census form. 1. Your name (interviewer’s name) 2. Today’s date (Date) 3. Village Name 4. House No.: please write the number of the house, as it is on the village map. 5. Location: If there is a name for the road or street in which this house is located, write
it down in the space provided. You can also use this space to record any details that will help you to remember the location of this house (e.g. house directly opposite school, house next to the ……. shop, house next to Mosque or house with large mango tree outside.
6. House open, vacant or closed? If there is someone at the house who can answer the
questionnaire, circle ‘open’ and go to the house data section of the form. If there is nobody at the house to answer the questions when you first visit it, mark its as ‘vacant’ with a circle. You should revisit the house at a time when people are likely to be there (ask the neighbours when this might be). If at the end of your work in the area there is still nobody there, then mark it as ‘closed’. Also mark as ‘closed’ any houses where the people refuse to answer the questions.
7. Interviewee name: Enter the name of the person you are interviewing (interviewee). 8. Relationship with household head? House data: The purpose of this section is to gather information that will give some indication of the wealth and well-being of the household. This information will help us to group households into relatively wealthy and resource-poor households. You will be able to answer some of the questions by observation rather than asking the respondent. Remember – don’t ask a question when the answer is obvious. 9. House Type: Enter the type of house (e.g. stilt or permanent cement block house) 10. Walls made of: main materials that the walls are made of. 11. Roof made of: Enter the main materials used to make the roof.

60
Household data The purpose of this section is to provide demographic and socio-economic information about all the people who are considered household members as well as those who may only be staying in the house for a short period of time. You should not include guests (friends and family) who may be visiting but it is important to include people who may be staying there because they are working as wage labourers for example. Start by explaining that you want to ask some questions about the people who stay in this house. 12. Number of people in the household: Put the total number of people in the household
of all ages in the space provided. This total should include all the people (children and adults) who usually stay in the household. Household members are usually considered to be all those who usually sleep in this house and who eat from the same ‘pot’. The number of people in the household should be same as the number of people listed in the household data table (questions 16 – 30). This question provides a check that the census has included everyone in the household.
13. House ownership: The purpose of this question is to find whether any household
member owns the building they are occupying, to give some indication of household wealth.
14. Electricity supply: Indicate whether this household has a generator for electricity. 15. Toilet: The purpose of this question is to find out where people go to the toilet and
what type of toilet (if any) they have in their house or compound. The household data table should list all those people who normally stay in the household including those who may be away travelling. Each individual staying in the house should be listed, with the household head (HH) first. Supplementary sheets of the household data table should be added if there are more than six people who stay in the house. Remember to fill in the page number, house no., settlement name and form identification number at the top of any supplementary sheets used. The table can be quickly checked for omissions since something must be written in every space. Spaces where information is missing should be filled with a DK (don’t know). If necessary, return to the house to fill in any gaps. 16. Names of all those present in the house. First ask the person being interviewed the
name of the person who he or she considers to be the household head (HH). The household head is usually the oldest male, who may have built the house or (if a tenant) is also responsible for paying the rent. In cases where the oldest male is not in charge, take the household members’ word as to who is the ‘head’. Stress that you want to know the names of all the people who are currently staying in this house including small children. Enter the person’s surname (family name) first and all the person’s other individual name(s) after the family name.
17. Relationship with household head. Start by saying you want to know about the

61
second person on the table. Indicate the relationship to the household head (HH). The person may be the wife, son, daughter, sister, brother, friend etc. One of the best ways to ask this question in English is ‘Through whom does …..(name of person) live here?’
18. Sex Indicate whether the household member is male or female. You may not need to
ask this question as the answer will be obvious from the name. 19. Age Ask the interviewer the age of the household member. Estimate the age if
necessary. 20. Education: There are two parts to this question. The first part of the question
establishes whether the person has had any formal education (i.e. been to school). If the person has never attended school, enter ‘none’. The second part of this question is trying to find out the highest level of education the person has attained. The second part of this question need only be asked if the person has had some form of education. Indicate the highest level of education that the person has achieved (possible answers maybe elementary school (6-12 years); junior school (12-15 years); senior school (15-18 years) or university (4 years) or teacher training. Also record the number of years they completed at that level. Please remember to keep a list of the acronyms you use.
21. Years of Education Questions 22–31 should only be filled in for adults who are staying in this house. For children (aged 16 or under), you should write NA (non-applicable) in all the remaining spaces in the column. You can save time by writing NA in the first row and drawing a vertical line down the rest of the column. 22. Length of time in this settlement ……. (name) Indicate the length of time (in days,
weeks, months or years) the person has stayed in this settlement. The purpose of this question is to determine whether the person has recently moved from elsewhere.
23. Where did the person move from? This is to find out if the person has moved into
this area from another part of the country, or has his or her origins here. If the person has stayed all his or her life in this village there is no need to ask this question, so write NA (non-applicable). If the person has not stayed in this settlement for the whole of his or her life, indicate the village, district and, if necessary country where the person has moved from. Answers to this question must include both the name of the place and the part of the country (district) because there may be several settlements with the same name in different parts of the country.
24. How long will the person stay here? Indicate how long (number of days, weeks,
years) the person intends to stay in this settlement. If the person intends to stay permanently, put ‘permanent’. If the person doesn’t know put DK.

62
25. Occupation: Ask the respondent to classify the person’s main occupation. This space can also be used for recording whether the person is unemployed or retired. Technically unemployment implies that a person is able and willing to work and actively seeking a job. But many people who are seeking wage employment earn money from various activities from time to time to support themselves. If this is the case you should record the type of work they currently do to support themselves.
26. Employed by someone? Indicate whether the person is employed by someone else.
(i.e. yes or no). 27. Type of employment. This question need only be asked if the answer to question 26
is ‘yes’. The purpose of this question is to find out the type of work the person is employed to do.
28. Name of employer: Record the name of the employer. Note whether he or she is an
apprentice. If the person is employed by many different people, as in the case of a farm labourer, put ‘multiple employers’.
29. Timing of employment. The purpose of this question is to find out whether the
person is employed most of the time (i.e. throughout most of the year), just in a particular season, or seasons, of the year, or only occasionally (i.e. for a few days a year). Try and be as specific as possible.
30. Ethnic group: Record the ethnic group to which the respondent considers the person
belongs (i.e. Butonese, Balinese, Ambonese etc.). If the person comes from another country, ask the ethnic group he or she belongs to in that country.
Enterprise Data 31. Does any person in this house farm? You may not need to ask this question as it
may have already been answered by the response to question 25. 32. Main crops grown on farms If yes, to question 31, record the main crops grown by
people in the household. 33. Who owns the land on which you farm? The purpose of this question is to find out
whether most people in the household own, rent most of the land they farm. 34. Farm labour The aim of this question is to get an indication of whether the
household has access to hired labour. This may help us to rank the wealth of the household. Record whether any person in the household normally (or at some point during the year) pays a person or people to work his or her farm. Answer yes or no.
35. Does any person in this house trade? Answer yes or no. The purpose of this
question is to find out whether any person in the house sells anything (trades) or operates a business.

63
Enterprise data This section of the form asks questions about household income. Remember that we are asking about the overall importance of different sources of income for the household as a whole, rather than for individual people in the household. Also remember that we are asking about the household’s income sources for the last year. The way that questions 36 – 42 in the table should be asked will depend on the activity. For example, a respondent may say that the household’s most important source of income, over the last year, is coconuts. Next, you need to ask him the standard measure he uses to sell his coconuts. For example the household may sell their coconuts in 50 kg bags. It is important that you clarify which size/weight of bag they are using to measure the coconuts. You should, at some point during you fieldwork, weigh the amount of product in each standard measure. For example, you need to weigh the amount of coconut that a particular size of bag contains. You will probably need to do a lot of prompting to get clear answers for questions 36 – 42. For question 42, ensure that you make it clear that you want the net ‘gain’ or profit that the households make from an income source. The profit is the gross amount of income that the household receives minus any costs. For example, a person may say the household made 20,000 Rupiah from the sale of rice over the last year. You may need to prompt them, and if necessary help them, to subtract transport costs. A cocoa farmer may say that s/he has sold his/her cocoa harvest. But what were his costs? Did he use any pesticides to control capsids or black pod? Did he pay anybody to help him/her to harvest the cocoa? Some households may have no cash income at all, for the recall period. For example, an elderly woman who lives alone may have been sick for the last four months. In cases like this, note the reason for no cash earnings on the enterprise data table. 36. Source of income for the whole households over the last year. The purpose of this question is to find out what were the income-generating activities for this household over the last year. 37. How do you sell? If necessary, record the standard units of measure (e.g. bundles, buckets etc.) and price for the product specified. 38. Price per unit measurement? 39. Quantity of product sold over the last year? 40. Total Income 41. Total Costs 42.Amount of profit (cash) earned from this source over the last year.

64
Environmental Awareness Form and Instructions Introduction The Environmental Awareness questionnaire will be administered to selected study settlements around the Lambusango Forest Reserve. A similar survey will also be administered to a sample of the population of Bau-Bau. Each of these surveys will be administered three times, the first surveys will be carried out in July and August 2005, the second surveys in July/August 2006 and the third surveys will be carried out in July/August 2007. The purpose of the Environmental Awareness survey is to:
a) To gather information on the knowledge of rules and regulations relating to the Lambusango Forest Reserve;
b) To gather information on people’s attitudes towards the Reserve and conservation in general.
c) Give some indication of the impact that project activities are having on the people’s knowledge of the rules and regulations relating to the Forest Reserve as well as their attitudes towards the conservation of it.
Environmental Awareness Village Survey Before starting each household interview, remember to introduce yourself to the household member(s) present and ask one of the people present if you can ask them some questions. Briefly explain why you are here (see section entitled “Before Starting Work in Each Village” above). Before asking any questions, please remember to fill in the page number, form identification number, your name, date, household number (from the map) and settlement name at the top of the form. This needs to be done for every page of the form. It will enable you and others to identify which household this census form refers to. It will also ensure that if pages become separated they can easily be put together again. The Environmental awareness surveys are given below with Indonesian translations in italics.

65
Awareness and Support for Existing Forest Regulations and Knowledge
about the Biological Importance of Forest Kesadaran dan dukungan akan keberadaan peraturan-peraturan hutan
dan pengetahuan tentang pentingnya hutan hayati Date: Village name: House Number: Foundation dasar( rumah panggung/ permanent) Roof: dinding (bamboo/ kayu) Interview Reference: Write village name and then a number (eg Labundo 1) Referensi wawancara :Tulis nama desa dan nomor ( Mis: Labundo 1 )
1. Name Nama 2. Ethnic Group Suku
3. Age Umur
4. Sex: Male/Female Jenis kelamin
5. Marital status Slatus
6. How many years have you stayed in this place? Sudah berapa lama anda tinggal
di desa ini?
7. From where did you move from? Anda berasal dari mana?
8. Do you plan to move from this place in the next five years? (yes/no) and if yes where to? Apakah anda berencana pindah ke tempat lain dalam lima tahun yang akan datang. Jika ya, anda pindah ke mana?
9. What is you main occupation/secondary occupation? Pekerjaan utama- menurut
informan . kira-kira pekerjaan apa ( tolong jelaskan ) Pekerjaan sampingan?
10. If farmer, who owns most of the land you farm? Apakah anda berkebun? Jika ya,siapa pemilik lahan kebun anda?
11. Are you employed by someone (yes/no) Apakah anda di pekerjakan seseorang?
12. If yes, type of employment Jika ya, pekerjaan seperti apa
13. Name of employer Nama pekerja

66
14. How many years formal education have you received? Tingkat pendidikan : biasanya berapa lama anda mengenyam pendidikan?
15. Are you involved in any association or group within this village? Apaka anda
tergabund dalam perkumpulan?
16. Do you know about the Lambusango Forest Reserve? If yes, explain what you know. Apa yang anda ketahui tentang hutan lambusango ?( untuk apa hutan itu )
17. Do you know where the Lambusango forest reserve boundaries are around this
village? Apakah anda tahu dimana batas kawasan hutan lindung tsb. 18. Do you know about the different types of forest area that the Lambusango forest
is made up of? If yes, explain. Apakah anda tahu beberapa tipe hutan Lambusango yang diadakan, jikaya, jelaskan.
19. In the past were there any rules and regulations relating to forest use? Di masa
lalu apakah ada peraraturan yang mengatur pengelolahan hutan? 20. Who controls the forest now? Siapa yang mengawasi hutan sekarang? 21. What are your feelings about the institutions/people who control the forest?
Babaimana perasaan anda tentang instansiyang mengawasi hutan. 22. Have regulations changed the way the forest is used by people in this village?
If yes, explain how Apakah peraturan pengelolahan hutan berubah yang di gunakan oleh masyarakat di desa ini ?
23. Who SHOULD control the forest now? Siapakah seharusnya mengawasi hutan
sekarang? 24. Have Forest Rangers ever visited your village? If yes, for what reasons did they
visit you village for? Apakah polisi kehutanan pernah megunjungi desa anda? Jika ya, untuk apa mereka mengunjungi desa anda?
25. Have Operation Wallacea staff ever visited your village? If yes, for what reasons
did they visit you village? Apakah staff Operation Wallacea pernah mengunjungi desa anda?
26. Are there any regulations related to timber extraction, rattan collection, and/or
hunting? If yes, to any of the above, explain what you know. If no, why do you think you do not know? Apakah ada peraturan yang berhybungan dengan penebangan kayu, pengumpul rotan atau perburuan jika ya jelaskan?

67
27. Where did you find out about these regulations? Di mana anda peroleh informasi tersebut
28. How do you think you could know more about these rules and regulations?
Babaimana menurut anda daput lebia mengetahui tentang peraturan?
29. Has your knowledge of forest rules and regulations changed over the last five years? If yes, has this changed the way you use the forest? Sepengetahuan anda apakah peraturan hutan dalam lima tahun terakhir beruba. Jika ya apakah ada perubahan cara mengelolahan hutan
30. Are you aware of any forest-related schemes? If yes, describe. Apakah anda menyadari berhubungan dengam penghijuan hutan? Jika ya jelaskan.
31. How long has it been running? Sudah perapa lama berjalan? 32. What advantages/disadvantages does it produce for the village, if any? Apaka
Meningkat/menurun yang di hasilkah dari desa ini
33. Do you think that the forest is important for you water supplies? If yes, in what way? Apakah menurut anda hutan itu penting bagi peryediaan air? Jika setuju dengan cara apa?
34. Do you think that the forest is important for your local climate? (eg to control
flooding) Apakah menurut anda hutan itu penting bagi iklim setempat? 35. Do you think that the forest is important for the world’s climate? (eg to control
flooding) Apakah menurut anda hutan itu penting bagi iklim dunia? ( untuk mengontrol banjir
36. Do you think that the forest is important for their soils? If yes in what way (eg
soils for farming, reduces erosion) Apakah menurut anda hutan itu penting bagi tanah? Jika ya, dalam hal apa?(Mis: tanah untuk perkebunan,mengurangi erosi)
37. Do you think the forest provides plants and animals which are useful (for income,
for food, for construction, for medicines) to you and/or others? Could you rank the importance of different uses. Menurut anda apakah hutan itu menyediakan hutan dan binatang yang sangat berguna (bagi pendapatan ,makanan ,perumahan ,obat-obatan )bagi anda dan atau yang lainya? Dapatkah anda menyusumya.
38. Do you have strong cultural attachments with the forest and/or specific animals and plants/habitats within it? Apakah anda mempunyai ikatan budayaan yang kuat terhadap hutan ( kepercayaan )dan spesipikasi binatang dan tanaman /habitat yang ada di dalamnya)?

68
39. Do you believe that you should look after the forest because it is important for your beliefs? Apakah anda yakin ,anda harus menjaga hutan sebab sangat penting bagi keyakinan anda ?
40. Do you believe that we should look after the forest purely because it exists
(existence values)? Apakah anda yakin ,kita harus menjaga kelestarian hutan serta keberadaanya(nilai keberadaan )?
41. Does living next to the Lambusango forest cause problems for people in the
surrounding villages? If so, what are those problems? Apakah tinggal dekat hutan lambusango menimbulkan masalah bagi masyarakat sekitar desa? Jika ya, apa yang menjadi masalah-masalah tersebut
42. Have you heard of the word conservation? If yes, explain what it means. Apakah
anda pernah mendengar kata perlindungan ? jika ya,jelaskan apa maksudnya? Attitudes will be examined using statements with which respondents are asked to agree or disagree. Responses are scored and used to place respondents on an index of attitudes towards forest regulations. Agreement with a positive attitude statement will be scored +1 whereas disagreement will be scored -1. In the same way, agreement with a negative attitudinal statement will be scored -1 whereas disagreement will be scored +1. Don’t know responses will be scored 0. Sikap akan di uji dengan menggunakan pernyataan, yang mana respondent akan di mintai jawaban setuju atau tidak setuju. Respon - respon di beri skor, dimana akan menempatkan respondent pada index sikap terhadap peraturan –peraturan kehutanan. Persetujuan peryataan sikap positif di beri skor +1 dan peryataan tidak setuju di beri skor –1. Persamaannya, peryataan sikap setuju terhadap pernyataan positif di beri skor+1, tidak setuju di tandai dengan skor -1,dan respondent yang tidak tahu sama sekali di beri skor 0.
43. What people need is more important than protecting the forests and the wild
animals and plants within it (Negative attitudinal statement) Kebutuhan manusia lebih penting di banding melindungi hutan dan binatang liar serta tanaman yang ada didalamnya (pernyataan sikap negatif).
44. It is important to protect animals and plants so that our children can see and use
them in the future ( Positive attitudinal statement) Lebih penting melindungi tumbuhan dan binatang sehingga generasi kita nantinya dapat melihat dan memanfaatkanya di masa yang akan datang ( pernyataan sikap positif)
45. The tourists who come to the area are useful to the people (Positive attitudinal
statement) Wisatawan yang datang ke daerah ini adalah menguntungan masyarakat setempat (pernyataan sikap postif).

69
46. The government made the forest reserve to take our land and keep us poor (Negative attitudinal statement) Pemerintah mengadakan hutan konserfasi untuk mengawasi daerah kita dan membiarkan kita hidup miskin ( peryataan sikap negative)
47. People should be allowed in the forest reserve so they can use it how they like
(Negative attitudinal statement) Masyarakat di perbolehkan untuk mengelolah hutan lindung dan menggunakanya sesuka hati
48. It is important to set aside a place for plants and animals to live in (Positive
attitudinal statement) Penting menyisakan lahan untuk binatang dan tumbuhan untuk hidup(pernyataan sikap positif)
49. The forest reserve is owned by the government and they must tell people how to use the forest (Positive attitudinal statement) Hutan lindung adalah milik pemerintah dan mereka harus menyampaikanya kepada masyarakat bagaimana cara pengelolahnya ( pernyataan sikap positif)
50. Logging, hunting and farming should be prevented in the forest reserve, or else all
the animals will disappear (Positive attitudinal statement) Penebangan, perburuan dan perkebunan harus di cegah dalam kawasan hutan lindung,atau semua binatang akan punah (pernyataan sikap positf)
51. People should be allowed to eat game meat. Why keep animals we cannot eat?
(Negative attitudinal statement) Masyarakat harus di perbolehkan untuk memakan daging binatang liar . kenapa kita memelihara binatang yang tidak di makan dagingnya.( pernyataan sikap negative).
52. Animals from the forest cause damage to crops and should be stopped (Negative
attitudinal statement) Binatang yang dari hutan adalah menyebab kerusakan terhadap hasil panen dan harus di hentikan .(pernyataan sikap negative).

70
Bau Bau Environmental Awareness Survey
General Public Levels of Awareness about the Lambusango Conservation Forest and Their Importance Questionnaire
Form No.:_ _ /_ _ _ Date:………….. Interviewer’s Name:…………………….…. Location (e.g. School/office/market)……………………………………………………… 1.Interviewee’s Name Nama…………….. 2.Ethnic Group Suku….. 3.Age Umur 4.Sex Jenis kelamin 5.How many years have you stayed in BauBau?.Sudah berapa lama anda tinggal di Bau Bau?. 6.From where did you move from?.Anda berasai dari mana................................... 7.Occupation: Perkerjaan utama-menurut informan, kira-kira pekerjaan apa.……………………………………….. 8.How many years formal education have you received? Tingkat pendidikan:biasanya berapa lama anda mengenyam pendidijkan?.................................. 9.Membership of groups, association, clubs: Apaka anda tergabund dalam perkumpulan? 10. Do you know about Operation Wallacea? (If yes please explain what you know): Apakah anda tahu Tentang Operation Wallacea? Jika Ya jelaskan apa yang anda ketahui 11. Do you know about the Lambusango forests? (If yes please explain what you know): Apahah Andatahu tentang hutan Lambusango? (Jika ya jelaskan apa yang anda ketahui? If yes to Question 11, answer questions 12 – 34, if no to question end the interview. 12. Do you think that the Lambusango forest is important for your water supplies? Apakah menurut anda hutan Lambusango penting bagi iklim, 13. If yes, in what way? Jika ya, elaskan............................................................................. 14. Do you think that the Lambusango forest is important for your climate? Apakah menurut anda hutan itu penting bagi iklim setempat? 15. If yes, in what way?. Jika ya, elaskan........

71
16. Do you think that the Lambusango forest is important for their soils?... Apakah menurut anda hutan itu penting bagi tanah? 17. If yes in what way (eg soils for farming, reduces erosion)?.... Jika ya, dalam hal apa?(Mis: tanah untuk perkebunan,mengurangi erosi). 18. Do you believe that we should look after the Lambusango forest purely because it exists? Apakah anda yakin ,kita harus menjaga kelestarian hutan serta keberadaanya(nilai keberadaan )? 19.Do you think the forest provides plants and animals which are useful (for income, for food, for construction, for medicines) to you and/or others? Menurut anda apakah hutan itu menyediakan hutan dan binatang yang sangat berguna (bagi pendapatan ,makanan ,perumahan ,obat-obatan )bagi anda dan atau yang lainya? 20. If yes, which is the most important use?. 21. Do you think the Lambusango forest could be a source of plants and animals that might be useful in the future? Apakah meurut anda hutan Lambusango dapat 22. Do you have strong cultural attachments with the forest and/or specific animals and plants/habitats within it? Apakah anda mempunyai ikatan budayaan yang kuat terhadap hutan ( kepercayaan )dan spesipikasi binatang dan tanaman /habitat yang ada di dalamnya)? 23. Do you believe that you should look after the Lambusango forest because it is important for education? Attitudes will be examined using statements with which respondents are asked to agree or disagree. Responses are scored and used to place respondents on an index of attitudes towards forest regulations. Agreement with a positive attitude statement will be scored +1 whereas disagreement will be scored -1. In the same way, agreement with a negative attitudinal statement will be scored -1 whereas disagreement will be scored +1. Don’t know responses will be scored 0. Sikap akan di uji dengan menggunakan pernyataan, yang mana respondent akan di mintai jawaban setuju atau tidak setuju. Respon - respon di beri skor, dimana akan menempatkan respondent pada index sikap terhadap peraturan –peraturan kehutanan. Persetujuan peryataan sikap positif di beri skor +1 dan peryataan tidak setuju di beri skor –1. Persamaannya, peryataan sikap setuju terhadap pernyataan positif di beri skor+1, tidak setuju di tandai dengan skor -1,dan respondent yang tidak tahu sama sekali di beri skor 0. 24.It is important to set aside a place for plants and animals to live in (Positive attitudinal statement) Penting menyisakan lahan untuk binatang dan tumbuhan untuk hidup(pernyataan sikap positif)

72
25.What people need is more important than protecting the forests and the wild animals and plants within it (Negative attitudinal statement) Kebutuhan manusia lebih penting di banding melindungi hutan dan binatang liar serta tanaman yang ada didalamnya (pernyataan sikap negatif).
26.It is important to protect animals and plants so that our children can see and use them in the future ( Positive attitudinal statement) Lebih penting melindungi tumbuhan dan binatang sehingga generasi kita nantinya dapat melihat dan memanfaatkanya di masa yang akan datang ( pernyataan sikap positif)
27.The tourists who come to the area are useful to the people (Positive attitudinal statement) Wisatawan yang datang ke daerah ini adalah menguntungan masyarakat setempat (pernyataan sikap postif).
28.The government made the forest reserve to take our land and keep us poor (Negative attitudinal statement) Pemerintah mengadakan hutan konserfasi untuk mengawasi daerah kita dan membiarkan kita hidup miskin ( peryataan sikap negative) 29.People should be allowed in the forest reserve so they can use it how they like (Negative attitudinal statement) Masyarakat di perbolehkan untuk mengelolah hutan lindung dan menggunakanya sesuka hati 30. The Lambusango forests are a waste of land when people are short of land 31.The forest reserve is owned by the government and they must tell people how to use the forest (Positive attitudinal statement) Hutan lindung adalah milik pemerintah dan mereka harus menyampaikanya kepada masyarakat bagaimana cara pengelolahnya ( pernyataan sikap positif) 32.Logging, hunting and farming should be prevented in the forest reserve, or else all the animals will disappear (Positive attitudinal statement) Penebangan, perburuan dan perkebunan harus di cegah dalam kawasan hutan lindung,atau semua binatang akan punah (pernyataan sikap positf) 33.People should be allowed to eat game meat. Why keep animals we cannot eat? (Negative attitudinal statement) Masyarakat harus di perbolehkan untuk memakan daging binatang liar . kenapa kita memelihara binatang yang tidak di makan dagingnya. ( pernyataan sikap negative). 34.Animals from the forest cause damage to crops and should be stopped (Negative attitudinal statement) Binatang yang dari hutan adalah menyebab kerusakan terhadap hasil panen dan harus di hentikan .(pernyataan sikap negative).

73
Appendix B Estimated Mean & Annual Range of Household Cash Income Sources in Rupiah by
Settlement 2005 Income category
Harapan Jaya(SP7)
Kabungka Lawele Watambo Grand Total
Total Village Income
8200000 31250000 9725000 36463000 85638000
No. of Households
4 2 5 4 15
Average Income
2050000 15625000 1945000 9115750 5709200
Mean Income
200000
637755
154365
1215433 -
Max Profit 3000000 27500000 3000000 20973000 27500000
Carpentry
Min Profit 1000000 3750000 1500000 990000 990000 Total Village Income
1570000 6315000 8291500 100838000 117014500
No. of Households
5 11 16 26 58
Average Income
314000 574091 518219 3878385 2017491
Mean Income
38293 128878 131611 213333 -
Max Profit 1050000 2100000 1750000 34850000 34850000
Cashew
Min Profit 35000 35000 14000 35000 14000 Total Village Income
9278500 2896000 23475000 4280000 39929500
No. of Households
31 12 21 2 66
Average Income
299306 241333 1117857 2140000 604992
Mean Income
59102 59102
Max Profit 2700000 800000 7200000 3980000 7200000
Cocoa
Min Profit 27000 40000 80000 300000 27000 Total Village Income
0 14512500 16462800 2150000 33125300
No. of Households
0 4 22 3 29
Average Income
0 3628125 748309 716667 1142252
Coconut
Mean Income
0 296173

74
Income category
Harapan Jaya(SP7)
Kabungka Lawele Watambo Grand Total
Max Profit 0 14400000 2649600 1920000 14400000 Min Profit 0 0 24000 50000 0 Total Village Income
3132200 100000 75000 3307200
No. of Households
24 1 1 26
Average Income
130508 100000 75000 127200
Mean Income
161137 63922 1587 2500
Max Profit 600000 100000 75000 600000
Coffee
Min Profit 3200 100000 75000 3200 Total
Village Income
6606600 0 59710000 41100000 107416600
No. of Households
2 0 8 5 15
Average Income
3303300 0 7463750 8220000 7161107
Mean Income
161137 0 947778 1370000
Max Profit 6600000 0 36000000 20750000 36000000
Fishing
Min Profit 6600 0 2250000 600000 6600 Total
Village Income
1592000 13330000 0 2395000 17317000
No. of Households
8 5 0 8 21
Average Income
199000 2666000 0 299375 824619
Mean Income
38829 272041 0 79833
Max Profit 400000 5000000 0 1000000 5000000
Livestock
Min Profit 42000 30000 0 60000 30000 Total
Village Income
0 0 0 198337500 198337500
No. of Households
0 0 0 27 27
Average Income
0 0 0 7345833 7345833
Mean Income
0 0 0 6611250
Max Profit 0 0 0 50000000 50000000
Marine business
Min Profit 0 0 0 -50000 -50000* Non-farm business
Total Village Income
43700000 21140000 137565000 25330000 227735000

75
Income category
Harapan Jaya(SP7)
Kabungka Lawele Watambo Grand Total
No. of Households
16 12 22 11 61
Average Income
2731250 1761667 6252955 2302727 3733361
Mean Income
1065854 431429 2183571 84333
Max Profit 10000000 6600000 27000000 10930000 27000000
Min Profit 300000 60000 100000 400000 60000 Total
Village Income
0 38036000 1500000 26833500 66369500
No. of Households
0 16 1 12 29
Average Income
0 2377250 1500000 2236125 2288603
Mean Income
0 781837 63492 896117
Max Profit 0 7000000 1500000 9700000 9700000
NTFPs
Min Profit 0 11000 1500000 126000 11000 Total
Village Income
2990000 2554000 3700000 1707500 10951500
No. of Households
11 14 2 11 38
Average Income
271818 182429 1850000 155227 288197
Mean Income
72927 46531 19048 55250
Max Profit 1200000 1380000 2500000 500000 2500000
Other crops
Min Profit 5000 4000 1200000 30000 4000 Total
Village Income
4772700 2405000 76376833 0 83554533
No. of Households
14 7 39 0 60
Average Income
340907 343571 1958380 0 1392576
Mean Income
116407 49082 1212331 0
Max Profit 1250000 1500000 7500000 0 7500000
Rice
Min Profit 20000 40000 300000 0 20000 Total
Village Income
2400000 10200000 6000000 0 18600000
No. of Households
1 2 2 0 5
Timber related
Average Income
2400000 5100000 3000000 0 3720000

76
Income category
Harapan Jaya(SP7)
Kabungka Lawele Watambo Grand Total
Mean Income
58537 208163 95238 0
Max Profit 2400000 7200000 3000000 0 7200000
Min Profit 2400000 3000000 3000000 0 2400000 Total
Village Income
16360000 27960000 13496000 6400000 64216000
No. of Households
5 9 6 4 24
Average Income
3272000 3106667 2249333 1600000 2675667
Mean Income
399024 570612 214222 213333
Max Profit 6000000 12000000 5856000 3600000 12000000
Transfers
Min Profit 360000 240000 240000 200000 200000 Total
Village Income
20750000 38206000 11390000 4340000 74686000
No. of Households
5 12 8 4 29
Average Income
4150000 3183833 1423750 1085000 2575379
Mean Income
506098 779714 180794 144667
Max Profit 9150000 7200000 3000000 3000000 9150000
Unskilled labour
Min Profit 300000 126000 420000 140000 126000 Total
Village Income
22425000 33330000 211920000 92970000 360645000
No. of House-holds
4 6 12 7 29
Average Income
5606250 5555000 17660000 13281429 12436034
Mean Income
546951 680204 3363810 3099000
Max Profit
12000000 12000000 32400000 19200000 32400000
Wage employ-
ment
Min Profit 2025000 180000 5520000 5520000 180000 Total Total
Village Income
140644800 245266700
579712133 543219500 1508843133
Total No. of
Households
106 136 165 125 532

77
Income category
Harapan Jaya(SP7)
Kabungka Lawele Watambo Grand Total
Total Average Income
1326838 1803432 3513407 4345756 2836171
Total Mean
Income
3430361 5005443 9201780 18107317
Total Max Profit
12000000 27500000 36000000 50000000 50000000
Total Min Profit
5000 0 14000 -50000 -50000
* The negative value here is due to two individuals who had just started new activities. One had started oyster farming, the other had started seaweed farming. They had had to invest heavily in equipment for these activities, and since they had recently established their businesses their costs outweighed their profits, hence the negative values Source: Fieldwork 2005