Embed Size (px)
Citation preview
February 4, 2014
6th Auto Trade Dialogue
SIAM Society of Indian Automobile Manufacturers
SIAM SIAM
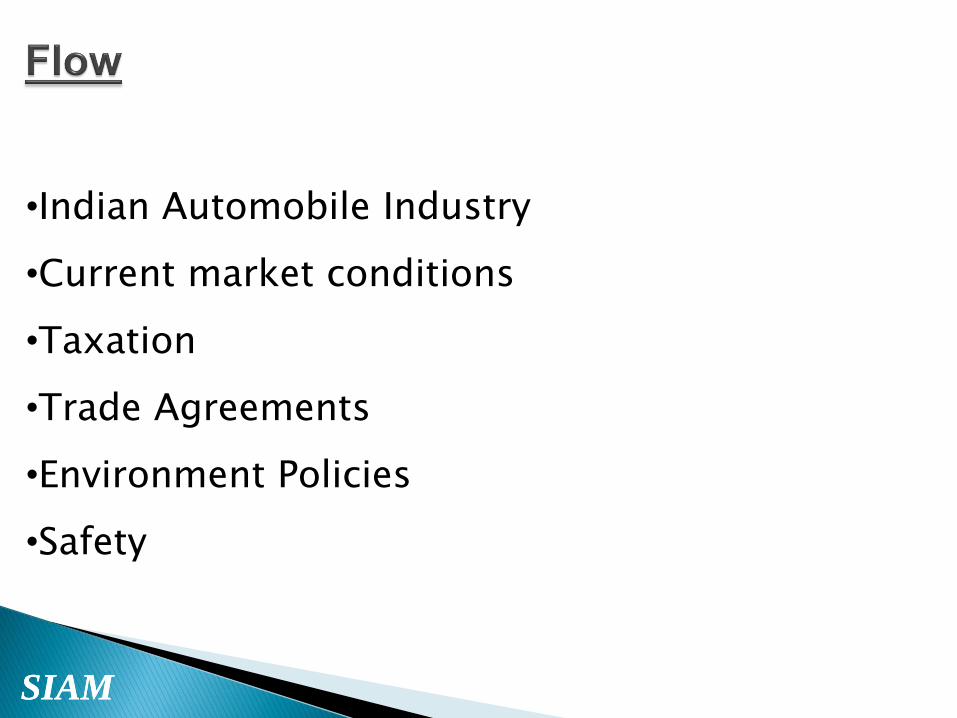
•Indian Automobile Industry
•Current market conditions
•Taxation
•Trade Agreements
•Environment Policies
•Safety

SIAM SIAM
•Indian Automobile Industry
•Current market conditions
•Taxation
•Trade Agreements
•Environment Policies
•Safety
SIAM SIAM
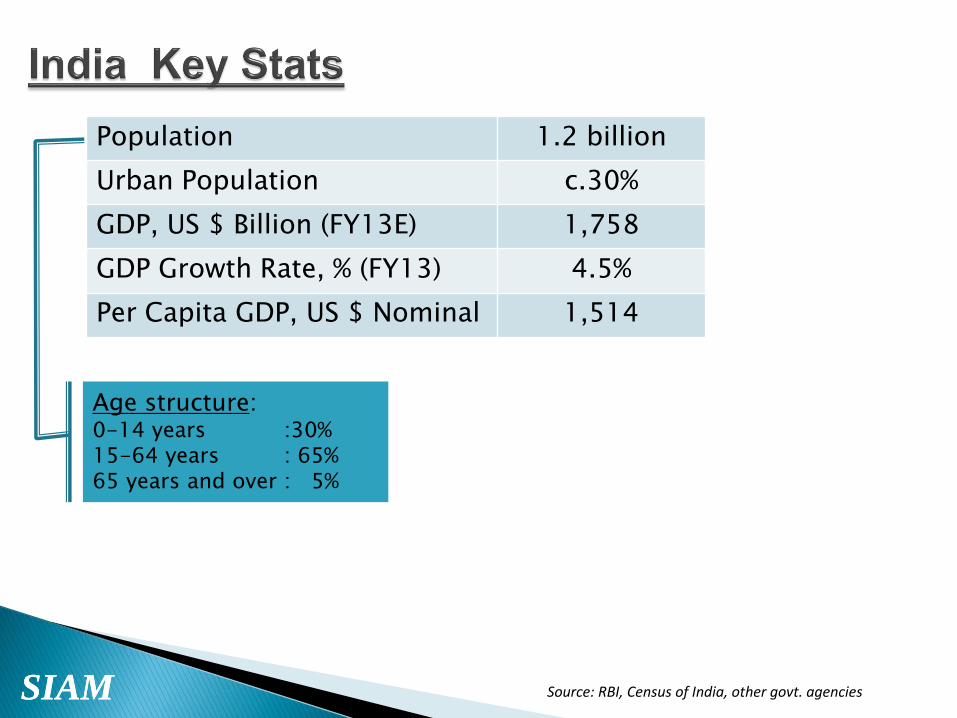
Population 1.2 billion
Urban Population c.30%
GDP, US $ Billion (FY13E) 1,758
GDP Growth Rate, % (FY13) 4.5%
Per Capita GDP, US $ Nominal 1,514
Source: RBI, Census of India, other govt. agencies
Age structure: 0-14 years :30% 15-64 years : 65% 65 years and over : 5%
SIAM SIAM
Source: CRISIL Research
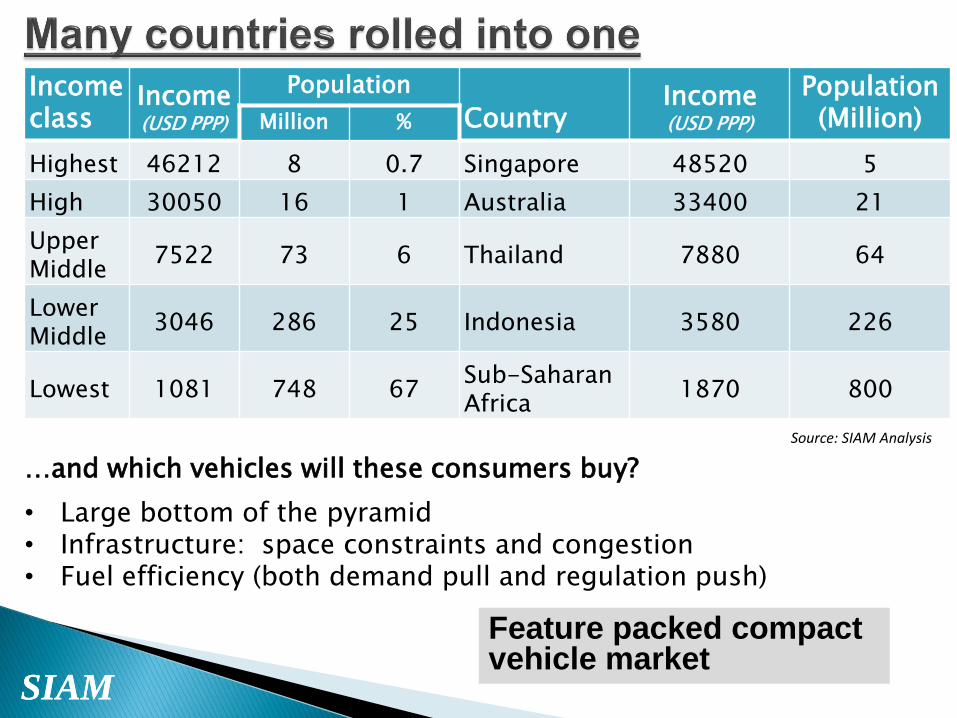
Income class
Income (USD PPP)
Population
Country Income (USD PPP)
Population (Million) Million %
Highest 46212 8 0.7 Singapore 48520 5
High 30050 16 1 Australia 33400 21
Upper Middle
7522 73 6 Thailand 7880 64
Lower Middle
3046 286 25 Indonesia 3580 226
Lowest 1081 748 67 Sub-Saharan Africa
1870 800
…and which vehicles will these consumers buy?
Feature packed compact vehicle market
• Large bottom of the pyramid • Infrastructure: space constraints and congestion • Fuel efficiency (both demand pull and regulation push)
Source: SIAM Analysis
SIAM SIAM
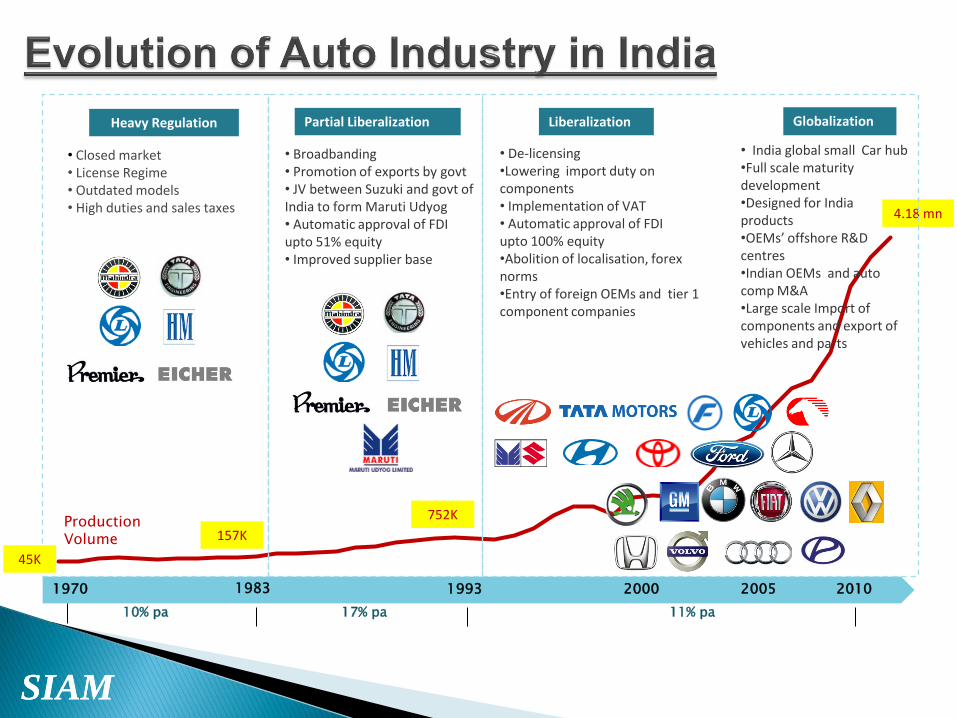
Heavy Regulation Partial Liberalization Liberalization Globalization
• Closed market • License Regime • Outdated models • High duties and sales taxes
• Broadbanding • Promotion of exports by govt • JV between Suzuki and govt of India to form Maruti Udyog • Automatic approval of FDI upto 51% equity • Improved supplier base
• India global small Car hub •Full scale maturity development •Designed for India products •OEMs’ offshore R&D centres •Indian OEMs and auto comp M&A •Large scale Import of components and export of vehicles and parts
• De-licensing •Lowering import duty on components • Implementation of VAT • Automatic approval of FDI upto 100% equity •Abolition of localisation, forex norms •Entry of foreign OEMs and tier 1 component companies
Production Volume
4.18 mn
1970 1983 1993 2000 2005 2010
45K
157K
752K
10% pa 17% pa 11% pa
SIAM
SIAM SIAM
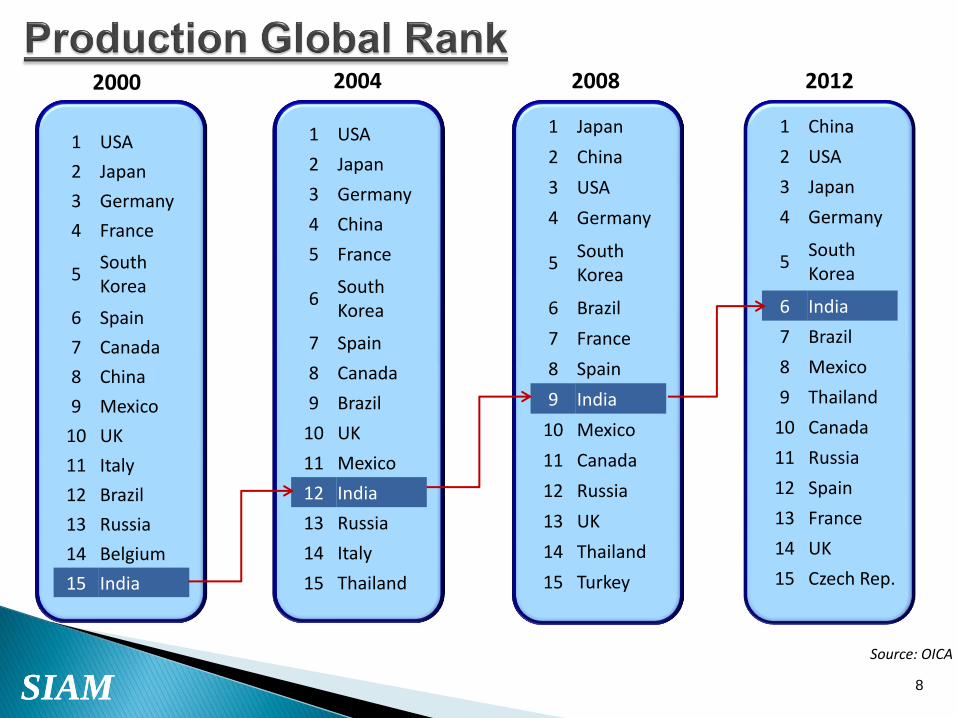
1 USA
2 Japan
3 Germany
4 China
5 France
6 South Korea
7 Spain
8 Canada
9 Brazil
10 UK
11 Mexico
12 India
13 Russia
14 Italy
15 Thailand
1 Japan
2 China
3 USA
4 Germany
5 South Korea
6 Brazil
7 France
8 Spain
9 India
10 Mexico
11 Canada
12 Russia
13 UK
14 Thailand
15 Turkey
1 China
2 USA
3 Japan
4 Germany
5 South Korea
6 India
7 Brazil
8 Mexico
9 Thailand
10 Canada
11 Russia
12 Spain
13 France
14 UK
15 Czech Rep.
8
1 USA
2 Japan
3 Germany
4 France
5 South Korea
6 Spain
7 Canada
8 China
9 Mexico
10 UK
11 Italy
12 Brazil
13 Russia
14 Belgium
15 India
2000 2004 2008 2012
Source: OICA

SIAM SIAM
Auto Policy 2002 ◦ Focus on small cars and utility
vehicles
◦ Promotion of R&D
◦ Impetus to Alternative Fuel Vehicles
◦ Lower emissions using improved vehicle technology, improved fuel quality and Parc modernisation
◦ Automatic approval for 100% FDI; no minimum investment criteria
9
Automotive Mission Plan 2006-16
◦ Infrastructure
◦ Promote brand India
◦ Favorable business environment
◦ Attract investment
◦ Promote R&D
◦ Upgrade quality standards
◦ Upgrade manufacturing technology
◦ Cost competitiveness
◦ Develop R&D capability
◦ Target overseas markets
$145 bn by FY16 &
10% of GDP
$34 bn In
FY07
SIAM
Will fall short of vision target due to implementation and slowdown

SIAM SIAM
• ~ 7% of GDP
• ~ 22% of Manufacturing GDP
Contribution to economy
• Total 1.1 mn
• 0.2mn OEMs
• 0.5mn Auto-Component Companies
• 0.4mn Service Network
Employment
• ~ USD 8 bn or Rs. 39 bn
• 4.3% of total FDI in India
FDI
(Apr-2000 to Apr-2013)
• ~USD 80bn Industry Turnover
Source: SIAM

SIAM SIAM
Countries Cars/1000
pop CVs/1000 pop 2W/1000 pop
Germany 518 36 72
Japan 457 121 98
Indonesia 45 33 216
India 16 5 85
Thailand 68 86 248
China 39 32 74
US 382 388 25
Note: India data is based on 2012, but data for other countries from Wards vehicle population data 2010.
Source: SIAM, Ward’s Auto
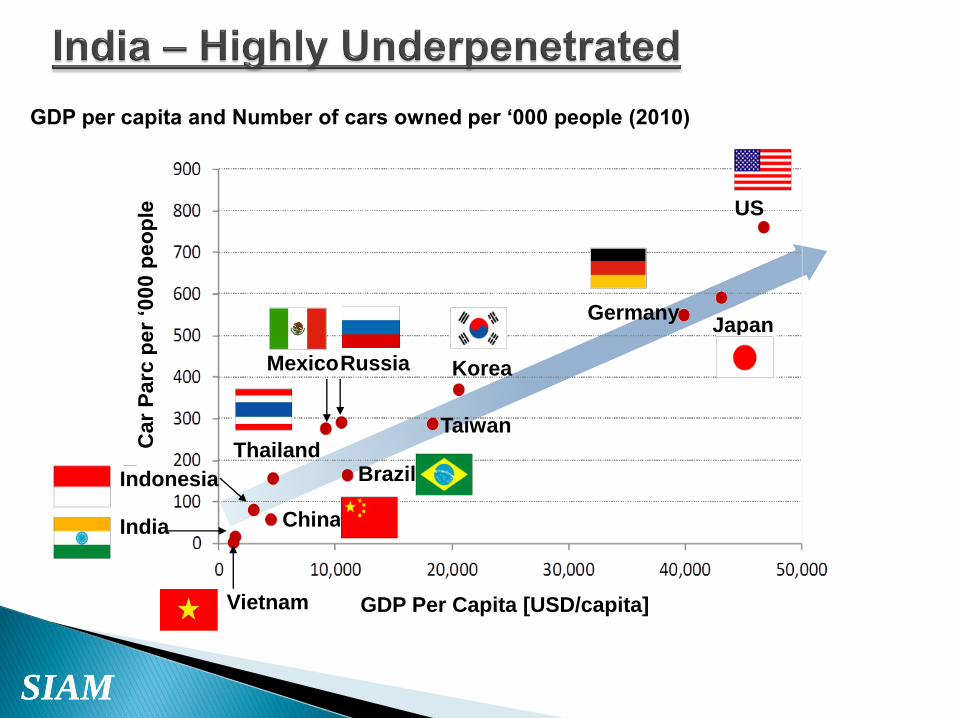
SIAM SIAM
GDP per capita and Number of cars owned per ‘000 people (2010)
Germany
US
Taiwan
Russia Mexico
Brazil Thailand
China
Indonesia
India
Vietnam
Korea
Japan
Car
Parc
per
‘000 p
eo
ple
GDP Per Capita [USD/capita]
SIAM
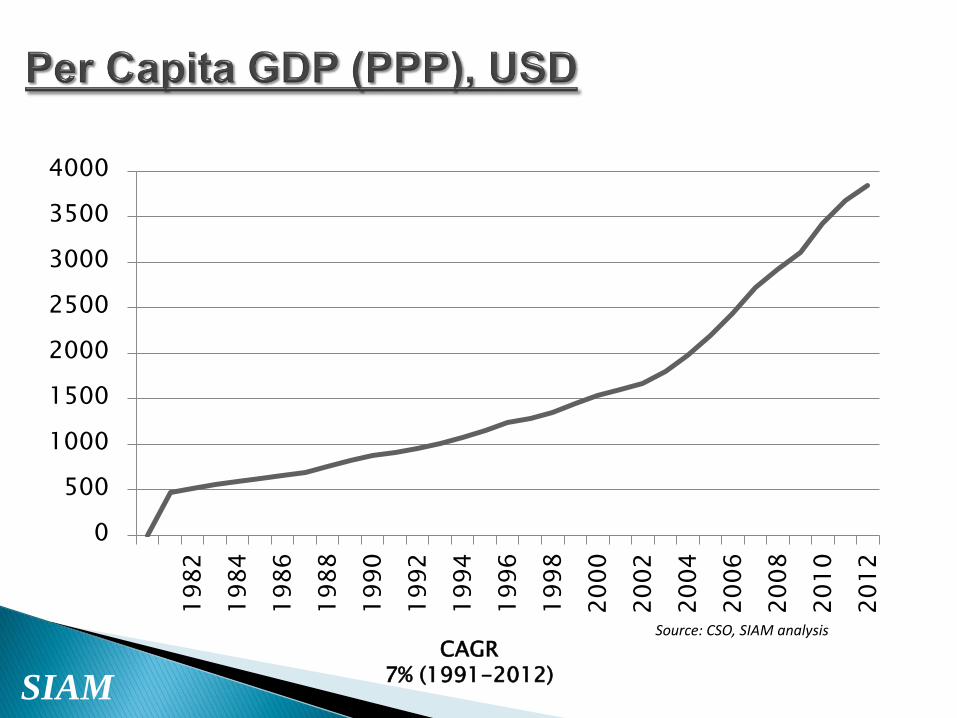
CAGR 7% (1991-2012)
0
500
1000
1500
2000
2500
3000
3500
4000 1
98
2
19
84
19
86
19
88
19
90
19
92
19
94
19
96
19
98
20
00
20
02
20
04
20
06
20
08
20
10
20
12
Source: CSO, SIAM analysis
SIAM SIAM
•Indian Automobile Industry
•Current market conditions
•Taxation
•Trade Agreements
•Environment Policies
•Safety

SIAM SIAM
Source: SIAM, OICA
-
2,000,000
4,000,000
6,000,000
8,000,000
10,000,000
12,000,000
14,000,000
16,000,000
-
500,000
1,000,000
1,500,000
2,000,000
2,500,000
3,000,000
FY04 FY05 FY06 FY07 FY08 FY09 FY10 FY11 FY12 FY13 FY14E
PVs (LHS)
CVs (LHS)
3W (LHS)
2W (RHS)
Note: FY means 12 month ending March. FY14E based on Apr-Dec % Var
FY04-14
CAGR, % FY14E %
Global
Rank
PVs 11% -5.8% 6
CVs 10% -18.4% 5
3Ws 6% -9.3% 1
2Ws 10% 5.4% 2
SIAM
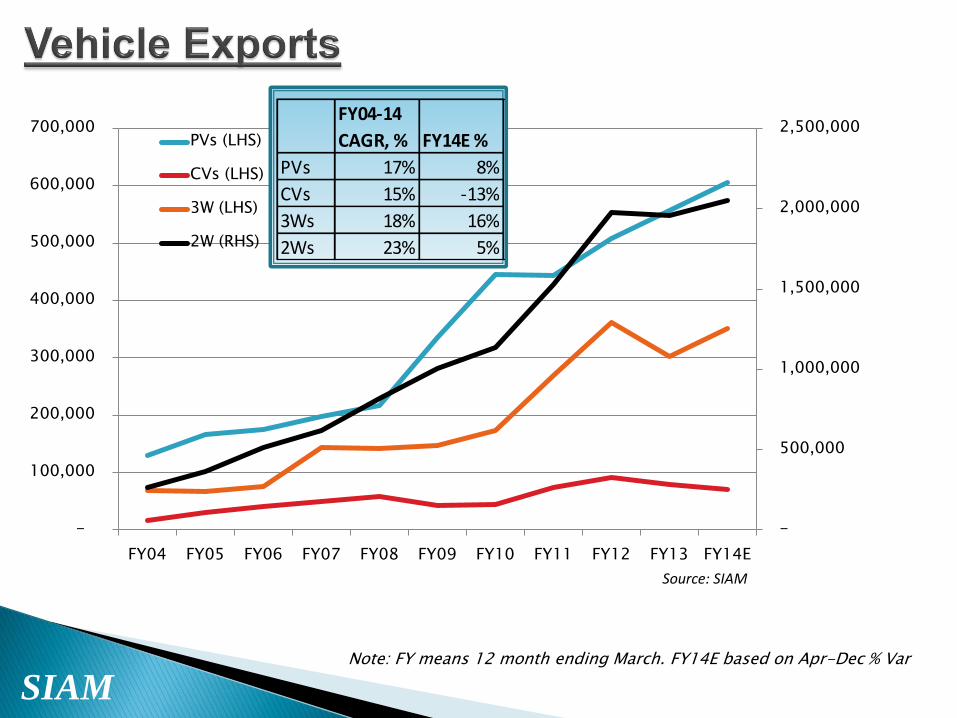
Source: SIAM
Note: FY means 12 month ending March. FY14E based on Apr-Dec % Var
-
500,000
1,000,000
1,500,000
2,000,000
2,500,000
-
100,000
200,000
300,000
400,000
500,000
600,000
700,000
FY04 FY05 FY06 FY07 FY08 FY09 FY10 FY11 FY12 FY13 FY14E
PVs (LHS)
CVs (LHS)
3W (LHS)
2W (RHS)
FY04-14
CAGR, % FY14E %
PVs 17% 8%
CVs 15% -13%
3Ws 18% 16%
2Ws 23% 5%

SIAM SIAM
% GDP growth – Showing some improvement now
7.3%
9.4%
5.3%
4.7% 4.4%
4.8%
4%
5%
6%
7%
8%
9%
10%
F10-Q
2
F10-Q
3
F10-Q
4
F11-Q
1
F11-Q
2
F11-Q
3
F11-Q
4
F12-Q
1
F12-Q
2
F12-Q
3
F12-Q
4
F13-Q
1
F13-Q
2
F13-Q
3
F13-Q
4
F14-Q
1
F14-Q
2
Source: CSO
SIAM SIAM
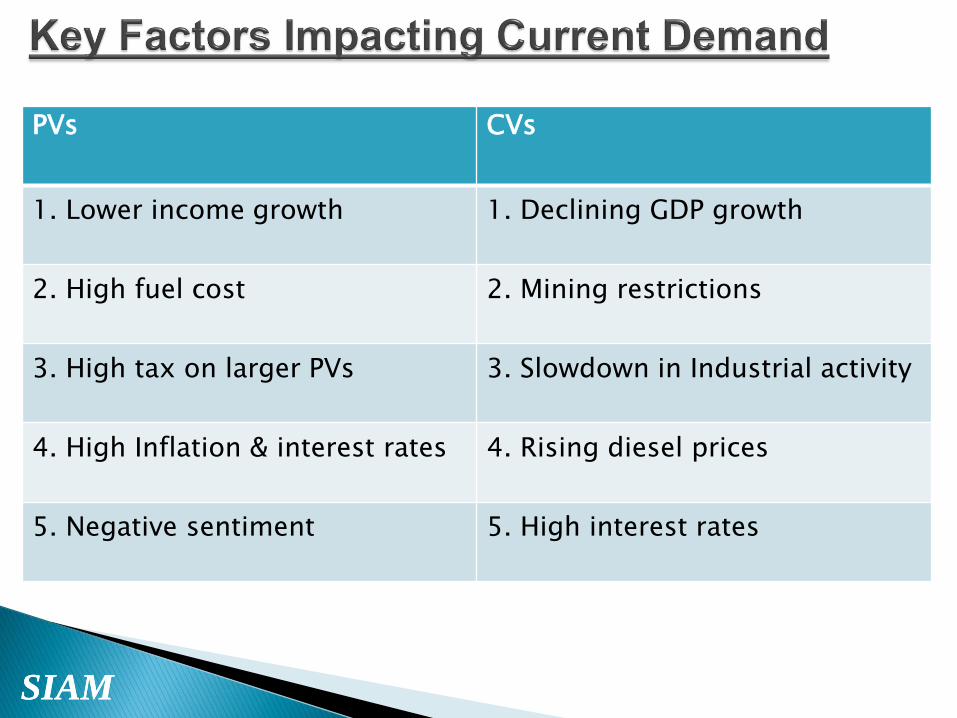
PVs CVs
1. Lower income growth
1. Declining GDP growth
2. High fuel cost
2. Mining restrictions
3. High tax on larger PVs
3. Slowdown in Industrial activity
4. High Inflation & interest rates
4. Rising diesel prices
5. Negative sentiment
5. High interest rates

SIAM SIAM
•Indian Automobile Industry
•Current market conditions
•Taxation
•Trade Agreements
•Environment Policies
•Safety
SIAM SIAM
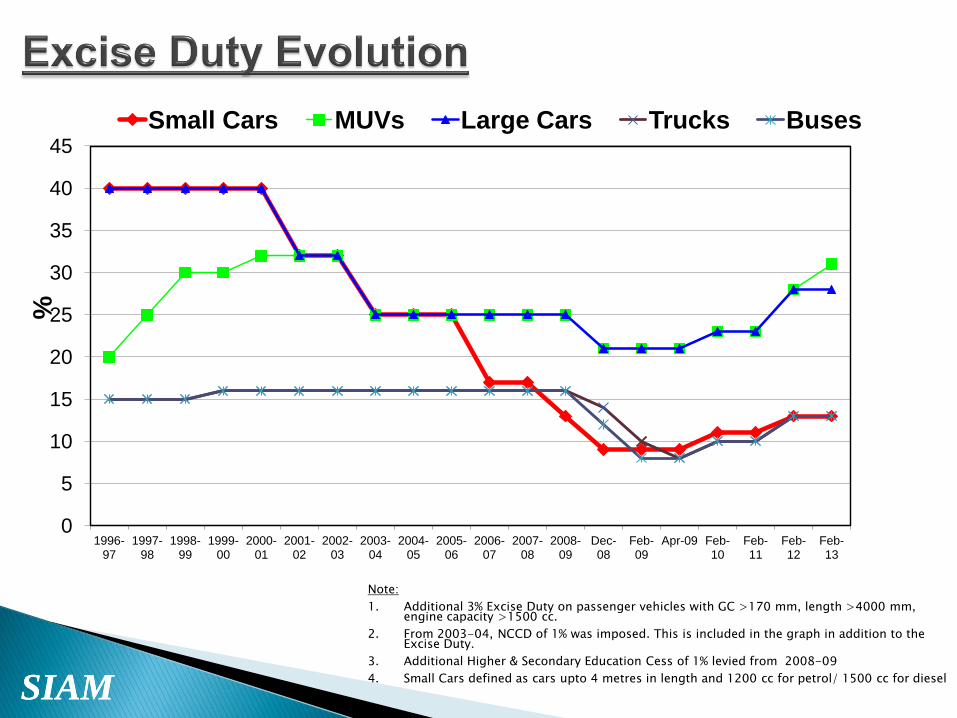
0
5
10
15
20
25
30
35
40
45
1996-97
1997-98
1998-99
1999-00
2000-01
2001-02
2002-03
2003-04
2004-05
2005-06
2006-07
2007-08
2008-09
Dec-08
Feb-09
Apr-09 Feb-10
Feb-11
Feb-12
Feb-13
%
Small Cars MUVs Large Cars Trucks Buses
Note:
1. Additional 3% Excise Duty on passenger vehicles with GC >170 mm, length >4000 mm, engine capacity >1500 cc.
2. From 2003-04, NCCD of 1% was imposed. This is included in the graph in addition to the Excise Duty.
3. Additional Higher & Secondary Education Cess of 1% levied from 2008-09
4. Small Cars defined as cars upto 4 metres in length and 1200 cc for petrol/ 1500 cc for diesel

SIAM 21
Vehicle Category Current Excise Duty
Passenger Vehicles 12-30%
L<4m, 1.2L P, 1.5L D (Small cars ) 12%
L >4m but <1.5 L 24%
L>4m but > 1.5L 27%
MUVs/SUVs/Double Cab 30%
Hybrid cars 12%
Two wheelers 12%
Electric cars, 2W & 3W 6%
Commercial Vehicles 12%
Three wheelers 12%

SIAM SIAM
Tax Category Rate
R & D Cess 0.125%
Education Cess 3% (of excise)
National Calamity Contingent Duty 1%
Central Sales Tax (CST) for out of state
sale
2%
State Value Added Tax (VAT) 12.5%
Octroi (in one state only) 4%
State Road/Registeration Tax 4-21%
SIAM SIAM
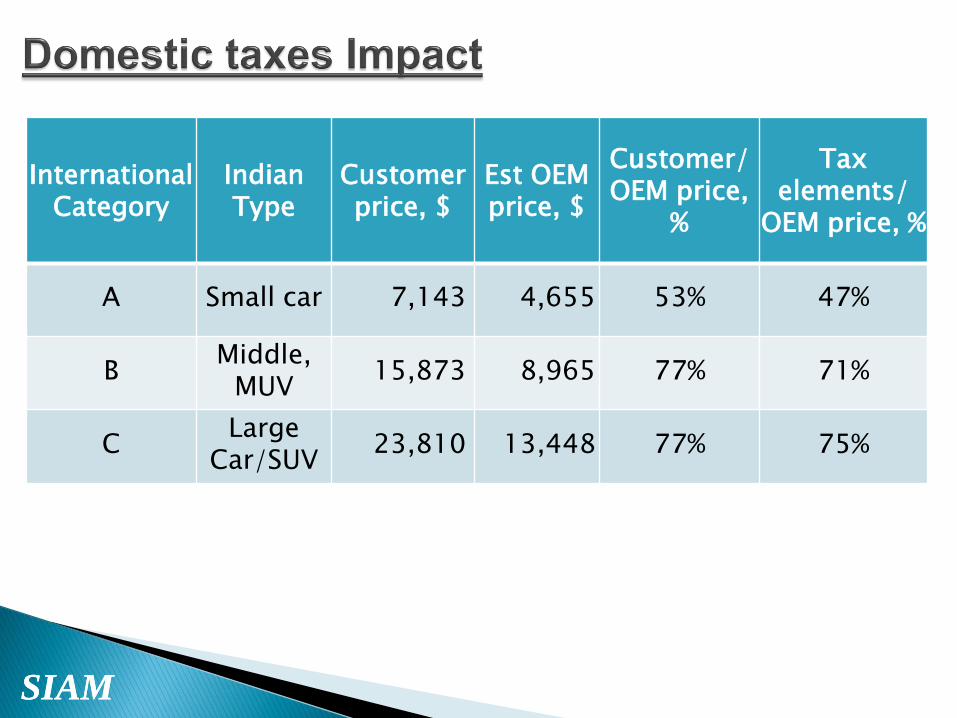
International Category
Indian Type
Customer price, $
Est OEM price, $
Customer/OEM price,
%
Tax elements/
OEM price, %
A Small car 7,143 4,655 53% 47%
B Middle,
MUV 15,873 8,965 77% 71%
C Large
Car/SUV 23,810 13,448 77% 75%
SIAM SIAM
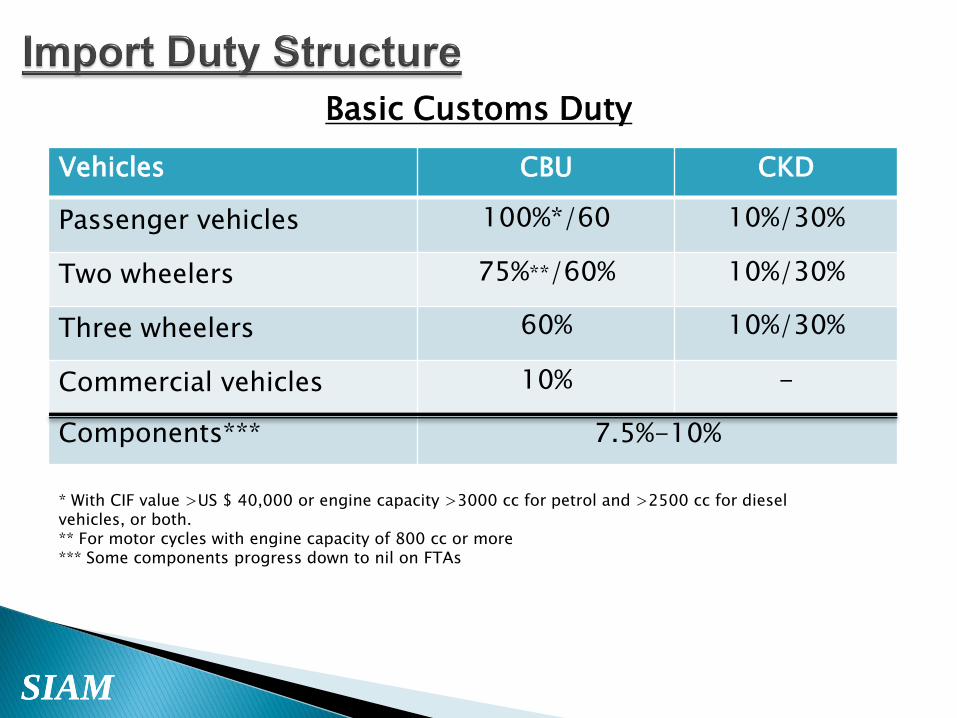
Vehicles CBU CKD
Passenger vehicles 100%*/60 10%/30%
Two wheelers 75%**/60% 10%/30%
Three wheelers 60% 10%/30%
Commercial vehicles 10% -
Components*** 7.5%-10%
Basic Customs Duty
* With CIF value >US $ 40,000 or engine capacity >3000 cc for petrol and >2500 cc for diesel vehicles, or both. ** For motor cycles with engine capacity of 800 cc or more *** Some components progress down to nil on FTAs

SIAM SIAM
Tax Category Rate
Education Cess 3% of tax
National Calamity Contingent Duty 1%
Countervailing Duty (CVD) Equivalent to excise duty
Special CVD 4%

SIAM SIAM
•Indian Automobile Industry
•Current market conditions
•Taxation
•Trade Agreements
•Environment Policies
•Safety
SIAM SIAM
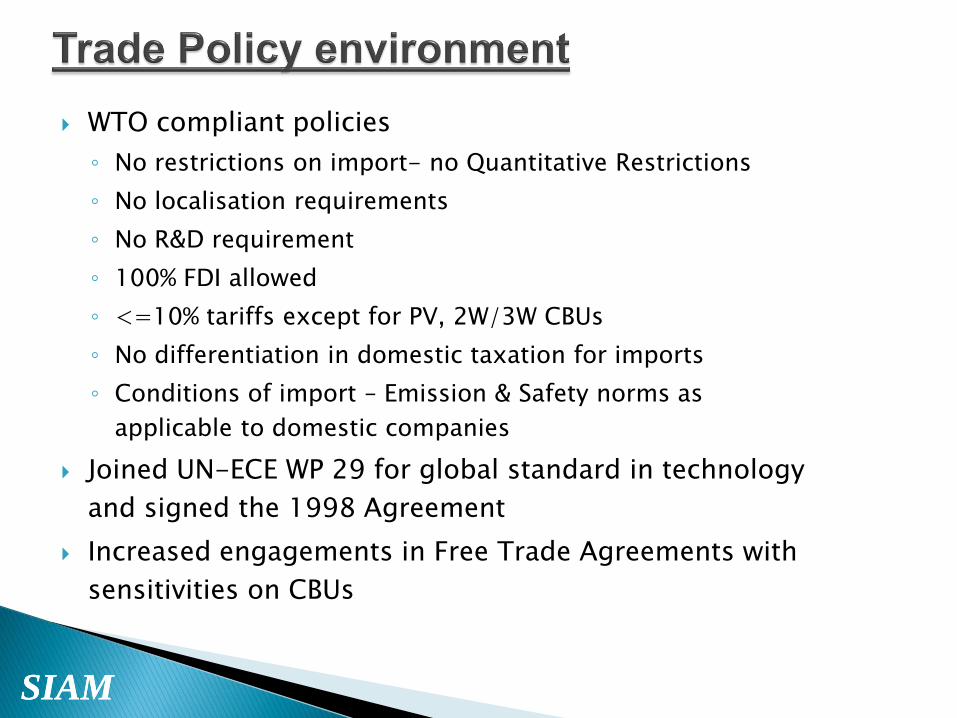
WTO compliant policies
◦ No restrictions on import- no Quantitative Restrictions
◦ No localisation requirements
◦ No R&D requirement
◦ 100% FDI allowed
◦ <=10% tariffs except for PV, 2W/3W CBUs
◦ No differentiation in domestic taxation for imports
◦ Conditions of import – Emission & Safety norms as
applicable to domestic companies
Joined UN-ECE WP 29 for global standard in technology
and signed the 1998 Agreement
Increased engagements in Free Trade Agreements with
sensitivities on CBUs
SIAM
SIAM SIAM
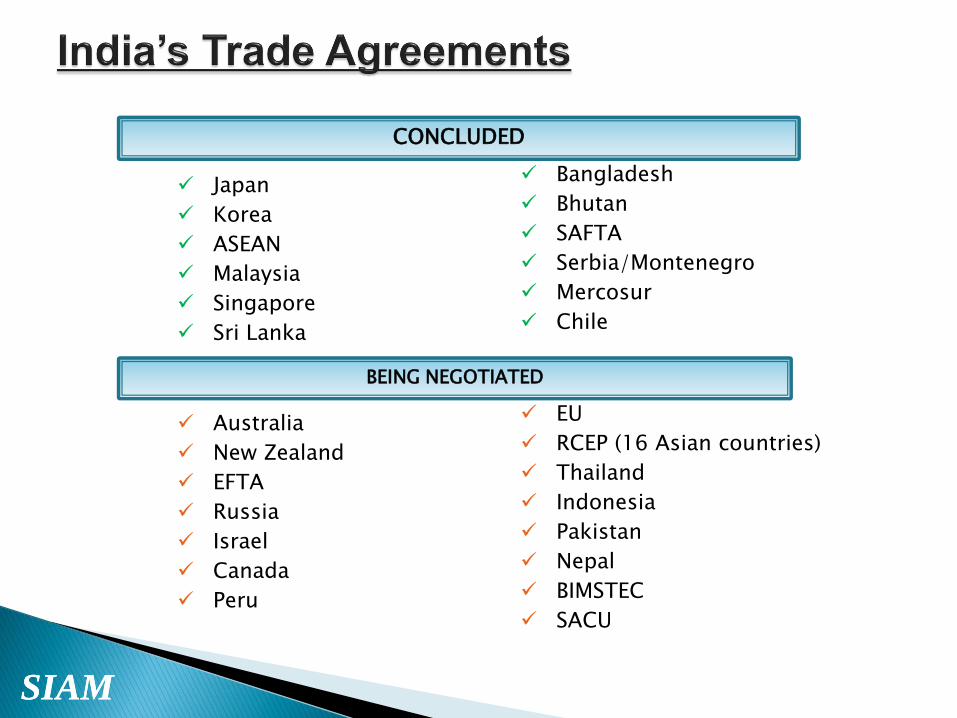
CONCLUDED
BEING NEGOTIATED
Japan
Korea
ASEAN
Malaysia
Singapore
Sri Lanka
Australia
New Zealand
EFTA
Russia
Israel
Canada
Peru
Bangladesh
Bhutan
SAFTA
Serbia/Montenegro
Mercosur
Chile
EU
RCEP (16 Asian countries)
Thailand
Indonesia
Pakistan
Nepal
BIMSTEC
SACU

SIAM SIAM
•Indian Automobile Industry
•Current market conditions
•Taxation
•Trade Agreements
•Environment Policies
•Safety
SIAM SIAM
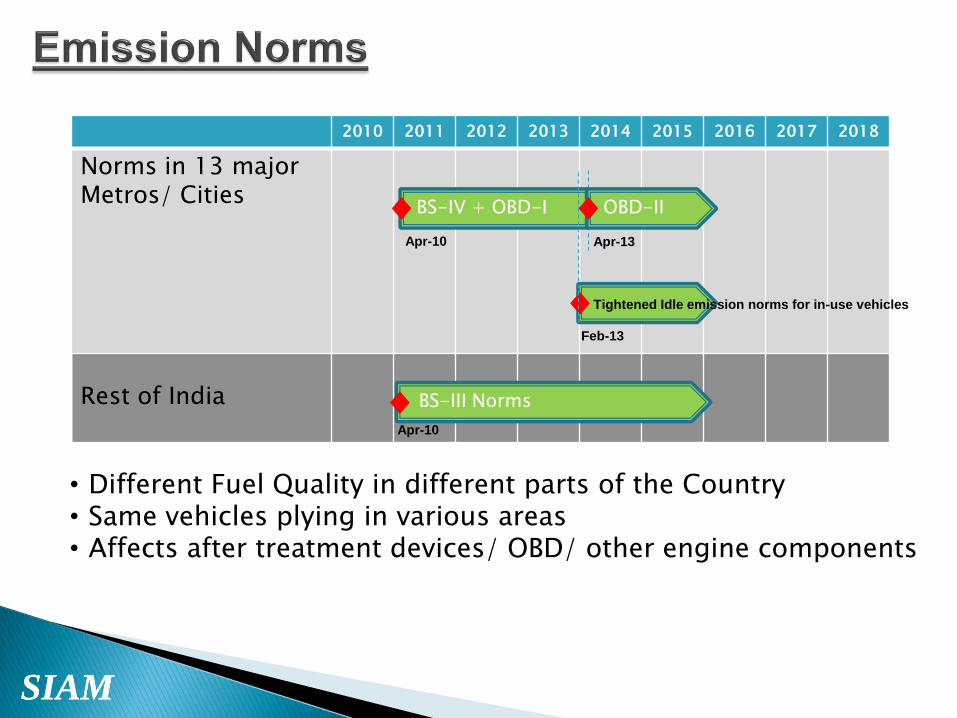
2010 2011 2012 2013 2014 2015 2016 2017 2018
Norms in 13 major Metros/ Cities
Rest of India
BS-IV + OBD-I
BS-III Norms
• Different Fuel Quality in different parts of the Country • Same vehicles plying in various areas • Affects after treatment devices/ OBD/ other engine components
OBD-II
Tightened Idle emission norms for in-use vehicles
Apr-10
Apr-10
Feb-13
Apr-13
SIAM SIAM
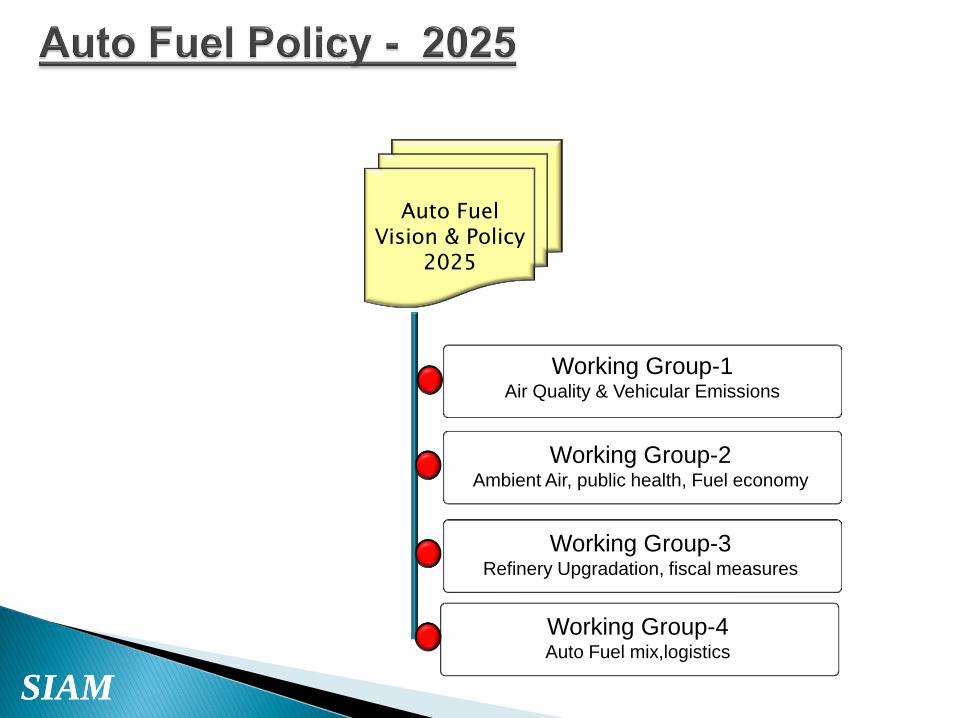
Auto Fuel Vision & Policy
2025
Working Group-1 Air Quality & Vehicular Emissions
Working Group-2 Ambient Air, public health, Fuel economy
Working Group-3 Refinery Upgradation, fiscal measures
Working Group-4 Auto Fuel mix,logistics

SIAM SIAM
•Indian Automobile Industry
•Current market conditions
•Taxation
•Trade Agreements
•Environment Policies
•Safety
SIAM SIAM
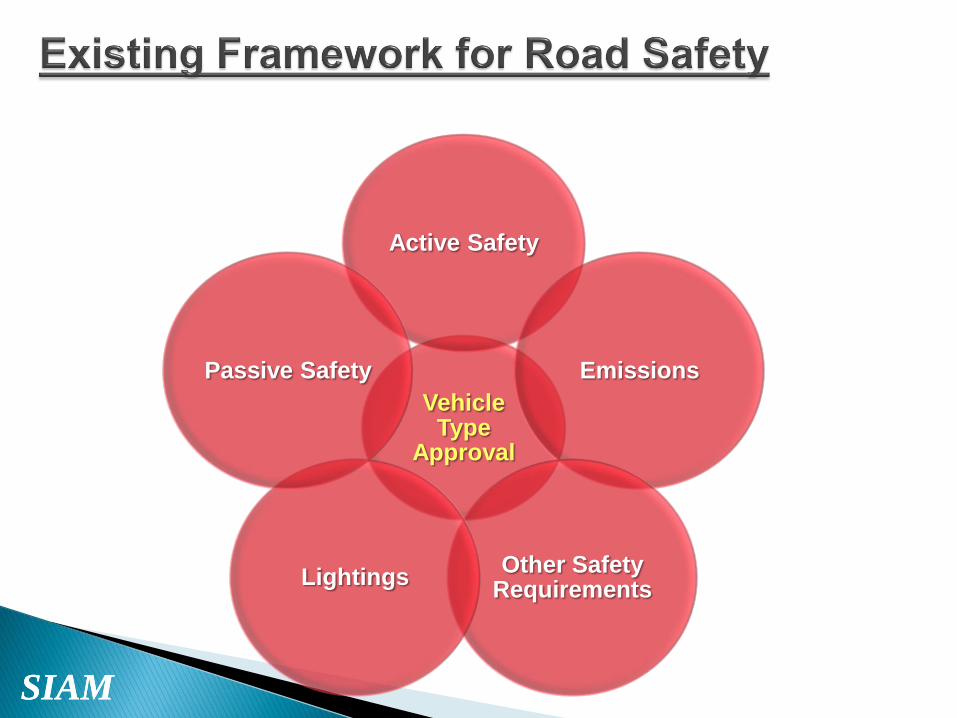
Vehicle Type
Approval
Active Safety
Emissions
Other Safety Requirements
Lightings
Passive Safety

SIAM SIAM
No of road accidents/100,000 people
No of accidents/10,000 vehicles
Source: MoRTH
SIAM SIAM
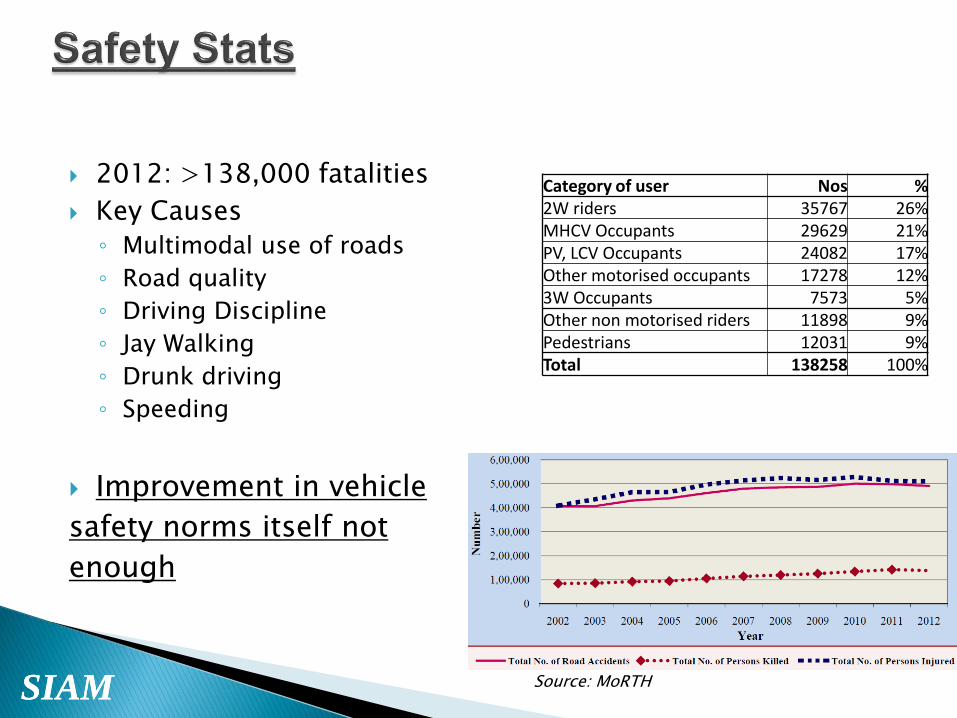
2012: >138,000 fatalities
Key Causes
◦ Multimodal use of roads
◦ Road quality
◦ Driving Discipline
◦ Jay Walking
◦ Drunk driving
◦ Speeding
Improvement in vehicle
safety norms itself not
enough
Source: MoRTH
Category of user Nos % 2W riders 35767 26% MHCV Occupants 29629 21% PV, LCV Occupants 24082 17% Other motorised occupants 17278 12% 3W Occupants 7573 5% Other non motorised riders 11898 9% Pedestrians 12031 9% Total 138258 100%
SIAM SIAM
Auto industry key component of Indian economy- both co-dependant
Notwithstanding current weakness, arguably the most promising market globally
Potential dependant on ◦ Implementation of auto policy
◦ Move to GST & rationalisation of taxation
◦ Investment in infrastructure
◦ Improvement in road safety measures & I&M regimes

SIAM SIAM