Embed Size (px)
DESCRIPTION
Social Watch: 2015 Budget and Congress Power of the 'Coin Purse'
Citation preview

Professor Emeritus Leonor Magtolis Briones
Former National TreasurerLead Convenor, Social Watch Philippines
August 14,2014Max’s Restaurant, QC Memorial Circle


No improvement in poverty for the No improvement in poverty for the past seven yearspast seven years
Source: 2012 Full Year Official Poverty Statistics; 2013 First Semester Official Poverty Statistics, PSA-NSCB
Poverty Incidence (PI) and Subsistence Incidence among Population (%), 2006, 2009, 2012 and 2013 1st sem

Fiscal ProgramFiscal Program
PARTICULARSPARTICULARS2013 2013
Adjusted Adjusted ProgramProgram
2014 2014 ProgramProgram
2015 2015 ProposedProposed
2016 2016 ProposedProposed
Levels in Billion Pesos Revenues Disbursements Surplus/(Deficit) Obligation Budget
Per cent of GDP Revenues Disbursements Surplus/(Deficit) Obligation Budget
Growth Rate Revenues Disbursements Surplus/(Deficit)* Obligation Budget
1,745.91,983.9(238.0)2,005.9
14.716.7(2.0)16.8
13.711.62.09.7
2,018.12.284.3(266.2)2,264.6
15.517.5(2.0)17.4
15.615.1
(11.9)12.9
2,337.32,622.6(285.3)2,605.9
16.218.2(2.0)18.0
15.814.8(7.1)15.1
2,760.83,082.8(322.0)3,077.9
17.119.1(2.0)19.0
18.117.5
(12.9)18.1
GDPGross Financing Mix (%) Foreign Domestic
11,914.5
8.092.0
12,990.3
15.085.0
14,463.5
11.089.0
16,179.0
9.091.0
Notes: *A positive growth rate indicates an improvement in the fiscal balance Source: DBM NBM 119 based on DBM, DOF, and NEDA data

Sources of Revenue
Sources of Tax Revenues, FY 2015
*Includes incremental revenues for BIR from Republic Act No. 10351 (Sin Tax Reform Law of 2012)Source: FY 2015 BESF, primarily from the Department of Finance
Revenue ProgramRevenue Program
Amount (in million pesos)
Net Income Taxes and Profits1,032,120
Tax on Property5,017
Taxes on Domestic Goods and Services700,821
Taxes in International Trade and Transactions456,468
Total2,337,333
Amount (in million pesos) Growth rate (%)
2013 2014 2015 2013-2014 2014-2015
Tax Revenues 1,535,698 1,879,918 2,194,427 22.41 16.73
Non-tax Revenues 177,459 136,133 140,906 (23.29) 3.51
Privatization 2,936 2,000 2,000 (31.88) 0.0
Total 1,716,093 2,018,051 2,337,333 17.6 15.82

National Government FinancingNational Government FinancingFY 2013 to FY 2015 (in million pesos)FY 2013 to FY 2015 (in million pesos)
Particulars 2013a/ 2014 2015
GROSS FOREIGN BORROWINGS 33,767 130,500 95,700
Net Foreign Borrowings (83,821) 4,236 20,898
GROSS DOMESTIC BORROWINGS 520,934 620,011 605,122
Net Domestic Borrowings 402,939 279,734 289,537
NET FINANCING 319,118 283,969 310,436
CHANGE IN CASH 65,933 16,002 24,978
TOTAL NET FINANCING REQUIREMENT 164,062 266,247 283,687
a/ Based on actual data reported in the Cash Operations Report (COR)Source: FY 2015 BESF, primarily from the Bureau of the Treasury
Debt trap. While government is planning to borrow a total of P700.822 Billion, it will only receive P310.435 Billion for both peso and foreign borrowings due to costs of borrowing and other charges.
Debt Servicing in the P2.606 T budget Debt Servicing in the P2.606 T budget does not reflect Principal Amortizationdoes not reflect Principal Amortization
NG Debt Service Expenditures
(in million pesos)2013 2014 2015
Interest Payments 323,434 352,652 372,863
Domestic 222,317 255,970 277,565
Foreign 101,117 96,682 95,298
Principal Amortization 235,583 466,542 390,386
Domestic 117,995 340,277 315,585
Foreign 117,588 126,264 74,802
GRAND TOTAL 559,017 819,194 763,250
Source: FY 2015 BESF, primarily from the Bureau of the Treasury

Source: FY 2015 Budget of Expenditure and Sources of Financing: DBM
Note: Net Lending amounts to PhP16.626B in 2013, PhP24.95Bin 2014 and PhP26.5B for 2015. This is equivalent to percentage distribution of 0.83%, 1.1% and 1.02% in expenditure program by sector respectively.
Allocation by SectorAllocation by Sector

In B
illi
on
s o
f P
eso
s
*Are Personal Services understated?
Source: FY 2015 Budget of Expenditure and Sources of Financing: DBM
Allocation By General Expense Allocation By General Expense ClassClass
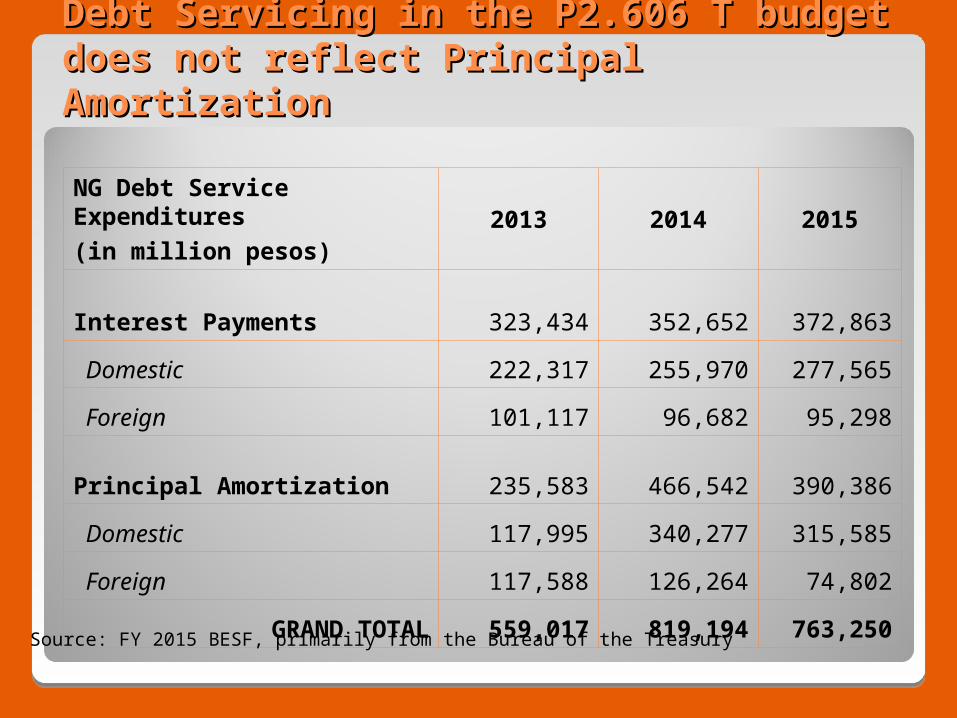
Allocation by RegionAllocation by Region
Source: FY 2015 Budget of Expenditure and Sources of Financing: DBM
In Billion Pesos

Where are the poor? Where are the poor? The 16 poorest provincesThe 16 poorest provinces
Province 2012 Poverty Incidence (%)
Island Region
Lanao del Sur
67.3 Mindanao
Eastern Samar
55.4 Visayas
Apayao 54.7 Luzon
Maguindanao 54.5 Mindanao
Zamboanga del Norte
48.0 Mindanao
Sarangani 46.0 Mindanao
North Cotabato
44.8 Mindanao
Negros Oriental
43.9 Visayas
Northern Samar
43.5 Visayas
Source: 2012 Full Year Official Poverty Statistics, National Statistical Coordination Board
*10 of the 16 poorest provinces are situated in Mindanao; 3 out of 4 in Visayas from the Samar provinces
Province 2012 Poverty Incidence (%)
Island Region
Western Samar
43.5 Visayas
Bukidnon 41.5 Mindanao
Lanao del Norte
41.4 Mindanao
Camiguin 41.0 Mindanao
Masbate 40.6 Luzon
Sultan Kudarat
40.4 Mindanao
Sulu 40.2 Mindanao

WHAT THE 2015 NATIONAL BUDGET WHAT THE 2015 NATIONAL BUDGET LOOKS LIKELOOKS LIKE
The Budget is like a huge, huge box. When it is opened, there are smaller boxes.
National Expenditure
Program Ph2.606 trillion
draft General
Appropriations Act Ph1.74 trillion
Automatic Appropriations Ph866.2 billion

The first smaller box is composed The first smaller box is composed of two even smaller boxes: the of two even smaller boxes: the budgets of agencies and the budgets of agencies and the special purpose funds. in the first special purpose funds. in the first of the two smaller boxes are the of the two smaller boxes are the agencies with the ten highest agencies with the ten highest budgetsbudgets
General Appropriations
Act PhP 1.74 trillion
Special Purpose FundsPhP 378.5 billion
Agency BudgetsPhP 1.361 trillion

There are still items which There are still items which are not listed in the are not listed in the expenditure program.expenditure program.still another box with a still another box with a different color. Inside this different color. Inside this box are two boxes: off box are two boxes: off budget items and direct budget items and direct remittances. the other box remittances. the other box contains the contains the unprogrammed unprogrammed expenditures. expenditures.
Not in the Expenditures/ Not in the Gen. Appropriations Act
Unprogrammed FundsPh 123 billion
Off Budget items and Direct RemittancesPh 40.6 billion
OUTSIDE THE EXPENDITURES BOX

Top 12 Agencies, FY 2013-2015
Dept. FY 2013 GAA
(‘000)
R a n k
FY 2014 GAA
(‘000)
R a n k
FY 2015 NEP
(‘000)
R a n k
DepEd 232,595,221 1 281,774,247 1 318,896,319 1
DPWH 155,517,533 2 206,634,047 2 287,825,956 2
DSWD 56,333,858 6 83,304,463 5 108,880,894 3
DILG 91,164,442 3 100,295,430 3 104,571,005 4
DND 80,420,311 4 82,265,071 6 99,469,167 5
DOH 51,074,586 5 84,356,933 4 87,209,479 6
DOTC 34,185,121 8 45,461,306 8 52,874,342 7
DA 64,474,099 5 68,596,751 7 48,435,703 8
SUCs 32,770,703 9 35,934,625 9 41,224,509 9
ARMM 13,172,022 13 19,615,029 12 24,299,773 10
DENR 23,135,850 10 23,345,621 10 20,849,411 11
The Judiciary 17,006,107 12 18,559,816 13 19,499,422 12

Proposed Special Purpose Funds for 2015Proposed Special Purpose Funds for 2015SPECIAL PURPOSE FUNDS
(in ‘000) GAA 2013GAA 2014
NEP 2015
Budgetary Support to Government Corporations
44,664,500 46,255,210 61,319,392
Allocation to Local Government Units 17,529,452 19,588,843 33,131,405
National Disaster Risk Reduction Management Fund 7,500,000 13,000,000 14,000,000
Contingent Fund 1,000,000 1,000,000 2,000,000
DepEd School Building Program 1,000,000 1,000,000 -
E-Government Fund 1,000,000 2,478,900 1,000,000
International Commitments Fund 2,636,723 4,815,644 7,443,963
Miscellaneous Personnel Benefits Fund
69,089,206 53,535,086 118,142,443
Pension and Gratuity Fund (formerly Retirement Benefits Fund)
98,715,143 120,495,952 140,566,386Source: GAA 2013-2014: DBM; FY 2015 National Expenditure Program

Proposed Special Purpose Funds for 2015Proposed Special Purpose Funds for 2015
1 The PhP22.4 Billion Priority Social and Economic Projects Fund proposed in the 2013 National Expenditure Program was later realigned to concerned agencies as a result of the campaign of ABI for the 2013 Budget.
SPECIAL PURPOSE FUNDS
(in ‘000)
GAA 2013 GAA 2014 NEP 2015
Priority Development Assistance Fund
24,790,000 - -
Priority Social and Economic Projects Fund1 -
Feasibility Studies Fund - 400,000 -
Rehabilitation & Reconstruction Program
20,000,000 1,000,000
TOTAL (in ‘000) 267,925,024 282,569,635 378,603,589
Source: GAA 2013-2014: DBM; FY 2015 National Expenditure Program

UNPROGRAMMED FUNDS (in ‘000)
GAA 2013 GAA 2014 NEP 2015
Budgetary Support to GOCCs 16,826,406 3,036,268 5,060,762
Support to Foreign-Assisted Projects 2,226,655 6,124,491 3,095,319
General Fund Adjustments (for the Share of the ARMM pursuant to R.A.9054; NEP 2015) 1,000,000 1,000,000 800,000
Support for Infrastructure Projects and Social Programs
23,000,000 20,000,000 20,000,000
Disaster Relief & Mitigation Fund - 3,000,000 -
Debt Management Program
60,363,130 1,000,000 -
Proposed Unprogrammed Funds for 2015Proposed Unprogrammed Funds for 2015
Source: GAA 2013-2014: DBM; FY 2015 National Expenditure Program

UNPROGRAMMED FUNDS (in ‘000)
GAA 2013 GAA 2014NEP 2015
AFP Modernization Program 10,632,180 5,000,000 10,000,000
Risk Management Program - 20,000,000 30,000,000
Payment of Total Administrative Disability Pension 3,000,000 243,000 -
Reconstruction and Rehabilitation Program
- 80,000,000 -
People’s Survival Fund
500,000 500,000 -
Equity Value Buy-out of the Metro Rail Transit Corporation 0 0 53,900,000
TOTAL (in ‘000) 117,548,371 139,903,759 123,056,081
Proposed Unprogrammed Funds for 2015Proposed Unprogrammed Funds for 2015
Source: GAA 2013-2014: DBM; FY 2015 National Expenditure Program

AUTOMATIC APPROPRIATIONS
(in ‘000)GAA 2013 GAA 2014 NEP 2015
Interest Payments for Debt Service 333,902,000 352,652,000,000 372,863,000
Internal Revenue Allotment 302,304,001 341,544,726,000 389,860,429
Tax Refunds15,518,556 -
Pension under RA 2087 & 5059 331,000 331,000 331,000
Grant Proceeds 545,844 6,450 140,902
Custom duties and taxes, including Tax expenditures 26,900,000 26,900,000 25,475,000
Net Lending 26,500,000 24,950,000 26,500,000
Employees’ retirement and life insurance premiums 28,125,611 28,859,006 30,149,491
Rewards and Incentives Fund 2,182,808 - -
Special accounts in the general fund 19,240,064 21,116,662 21,242,275
TOTAL 755,219,215 796,029,175 866,231,428
Proposed Automatic AppropriationsProposed Automatic Appropriations for 2015for 2015
Source: GAA 2013-2014: DBM; FY 2015 National Expenditure Program

Issues on Special Purpose Funds, Automatic Issues on Special Purpose Funds, Automatic Appropriations and Unprogrammed FundsAppropriations and Unprogrammed Funds
Lump sum appropriations have always been problematic
◦ since these are not as detailed as regular appropriations, they tend to be vulnerable to abuse.
◦ accountability is sometimes difficult to establish and documentation difficult
◦ in the Philippines, lump sum appropriations include special purpose funds, overall savings and unprogrammed funds

To SummarizeTo Summarize Total projected National Expenditures-Ph2.758 trillion General Appropriations - Ph1.740 trillion Unprogrammed Expenditures- 123 billion Off Budget Remittances- 29 billion Automatic appropriations- 866 billion
General Appropriations Act to be passed by Congress - Ph1.740 trillion Special Purpose Funds- 379 billion Agency Budgets to be examined 1.361 trillion, of which
are Personnel Expenditures 761 billion free for detailed examination by
Congress 600 billion

WHO HAS THE REAL POWER OF WHO HAS THE REAL POWER OF THE PURSE?THE PURSE?
For the next four months, Congress will work on the budget and approve it by December.
If the Evardone bill will be passed the President can declare savings by January or any other time of the year.
Even now, the DBM has written to Malacanang changing the definition of savings and proposing a bill for approval by Congress.

WHO HAS THE POWER OF THE WHO HAS THE POWER OF THE COIN PURSE?COIN PURSE?
Congressmen and Senators are anxious to ensure their re-election. They are now under pressure to approve either of the proposed bills.
Will they regain their lost Power of the Purse?