Embed Size (px)
Citation preview


Social Security in Finland


Heikki Niemelä and Kari Salminen
Social Security in Finland
Helsinki 2006

Authors:Heikki Niemelä, Leading Researcher, D.Pol.Sc., Senior lecturerResearch department, Social Insurance Institution (Kela)PO Box 450FI-00101 Helsinki, [email protected]
Kari Salminen, Researcher, D.Pol.Sc.Finnish Centre for PensionsKirjurinkatu 3FI-00065 ELÄKETURVAKESKUS, [email protected]
Working group:Jorma Jauhiainen, Social Insurance Institution (Kela)Heikki Niemelä, Social Insurance Institution (Kela)Reijo Ollikainen, Finnish Centre for Pensions (ETK)Pekka Piispanen, Finnish Pension Alliance (TELA)Pertti Pykälä, Social Insurance Institution (Kela)Juho Saari, Ministry of Social Affairs and HealthKari Salminen, Finnish Centre for Pensions (ETK)Reijo Vanne, Finnish Pension Alliance (TELA)
Finnish Centre for Pensions (ETK)Kirjurinkatu 3FI-00065 Eläketurvakeskus, Finlandwww.etk.fi
Social Insurance Institution (Kela)Nordenskiöldinkatu 12PO Box 450FI-00101 Helsinki, Finlandwww.kela.fi
Ministry of Social Affairs and HealthMeritullinkatu 8FI-00023 Government, Finlandwww.stm.fi
Finnish Pension Alliance (TELA)Lastenkodinkuja 1FI-00180 Helsinki, Finlandwww.tela.fi
Translation: Daryl Taylor and Marckwort Ltd.
Graphic design: Kirmo Kivelä
Layout: Petra Niilola, Kela, Research department
ISBN 951-669-706-2 (print), 951-669-707-0 (pdf)
Second revised impressionVammalan Kirjapaino OyVammala 2006

ForewordTo mark the Finnish Presidency of the European Union in 2006 the Social Insurance Insti-tution (Kela), the Finnish Centre For Pensions (ETK), the Finnish Pension Alliance (TELA) and the Finnish Ministry of Social Affairs and Health have published Social Security in Finland chiefly for foreign readers. This is a revised impression of a joint publication that originally appeared in 2003. The European Union has assisted in the publication and translation of this book.
Social Security in Finland seeks to provide a concise outline of the historical develop-ment of Finnish social security, and of its current condition and prospects. It begins by describing the evolution of Finnish social security – especially in the post-war period – and then goes on to explain the current state of social welfare benefits, health-related social security and social services with particular reference to social welfare benefits. Social expenditure and its financing are not described together with social security benefits, but in a separate chapter.
A working group was appointed to examine drafts of the publication and provide com-mentary on the manuscript at various stages. The members of this working group were Jorma Jauhiainen, Heikki Niemelä, Reijo Ollikainen, Pekka Piispanen, Pertti Pykälä, Juho Saari, Kari Salminen and Reijo Vanne.
Professor Matti Alestalo, Research Professor Jaakko Kiander and Professor Emeritus Hannu Soikkanen also read the manuscript and suggested various constructive changes, which we have tried to accommodate where possible. Head of Department Jussi Haapa-aho, Ministerial Adviser Raimo Jämsen, Chief of Health Research Timo Klaukka and Senior Lecturer Markku Mansner have also read the draft and made some necessary modifications. The chapter on rehabilitation was inspected by Secretary-General Heidi Paatero and Medical Adviser Paavo Rissanen, and the chapter on social services was checked by planning officer Milla Roos. The pension and income security and the health and income support departments of the Social Insurance Institution also examined the social security sections of the publication related to the income security and health functions of these departments.
Publications Editor Tarja Hyvärinen checked the wording of the Finnish text and worked with clerical officer Ulla Lehvonen, research assistant Petra Niilola and research secretary Kristiina Gyllenbögel to prepare the publication for printing. Clerical officer Anne-Mari Saari prepared the graphs and tables.
We would like to thank all of the foregoing for their co-operation.
Helsinki, April 2006
HeikkiNiemelä KariSalminen

Table of Contents
1. The formation of Finnish social security ....................................91.1. The period of reconstruction ......................................................... 101.2. The emergence of modern social insurance ...................................... 121.3. Social security becomes part of incomes policy ................................ 141.4. Health and social services become universal .................................... 151.5. From the recession of the 1990s to the first decade
of the 21st century ....................................................................... 181.6. Trends in social expenditure between 1960 and 2004 ........................ 23
2. Income support ............................................................................ 252.1. Pension insurance ........................................................................ 25
2.1.1. Earnings-related pensions .................................................... 262.1.2. The national pension scheme ................................................ 29
2.2. Sickness allowance in sickness insurance ......................................... 312.3. Unemployment benefit ................................................................. 31
2.3.1. Basic security for the unemployed ......................................... 312.3.2. Earnings-based security for the unemployed ........................... 332.3.3. Changes in unemployment security ........................................ 33
2.4. Industrial accident insurance ......................................................... 342.5. Income support of families with children ........................................ 35
2.5.1. Maternity grant .................................................................. 352.5.2. Family allowance ................................................................ 352.5.3. Parental allowance .............................................................. 35
2.6. Housing allowance ....................................................................... 362.7. Financial aid for students .............................................................. 372.8. Other income support ................................................................... 37
2.8.1. Conscript’s allowance .......................................................... 372.8.2. Special assistance for immigrants .......................................... 382.8.3. Pension support for long-term unemployment ......................... 38
2.9. Local authority income support ..................................................... 38
3. Health-related social security .................................................... 403.1. Health services ........................................................................... 403.2. Medical care supported by the national sickness insurance scheme ...... 413.3. Occupational health care .............................................................. 423.4. Rehabilitation ............................................................................. 433.5. Benefits for the disabled .............................................................. 46
3.5.1. Disability allowance and child disability allowance .................. 463.5.2. Pensioners’ care allowance ................................................... 46
4. Social services .............................................................................. 484.1. Children’s day-care ....................................................................... 484.2. Children’s day-care subsidies ......................................................... 49
4.2.1. Child home care allowance ................................................... 494.2.2. Private day-care allowance ................................................... 494.2.3. Partial care allowance .......................................................... 50
4.3. Informal care allowance ............................................................... 504.4. Geriatric services ......................................................................... 514.5. Care of intoxicant abusers ............................................................. 51
5. Social expenditure and financing ............................................... 535.1. Social expenditure ....................................................................... 535.2. Financing of social expenditure ..................................................... 555.3. Pensions .................................................................................... 57
5.3.1. Total pension expenditure ................................................... 575.3.2. Earnings-related pension insurance ........................................ 585.3.3. National pension insurance .................................................. 62
5.4. Sickness insurance ....................................................................... 645.5. Rehabilitation ............................................................................. 665.6. Unemployment benefit ................................................................. 675.7. Income support of families with children ........................................ 685.8. Housing allowance and financial aid for students .............................. 685.9. Conscript’s allowance, special assistance for immigrants
and pension support for long-term unemployment ............................ 685.10. Income support ........................................................................... 695.11. Health and social services ............................................................. 69
6. Outlook for social security ......................................................... 71Relevant links on the World Wide Web ......................................................... 76

Social Security in Finland | The formation of Finnish social security 9
1. The formation of Finnish social security
For reasons of social structure, history and politics, the formation of social security1 in Fin-land has differed from that of the other Nordic countries. For many years Finland remained more dominated by agriculture than her Nordic neighbours. Even in the 1950s the number of smallholdings in Finland was increasing, whereas the number of farms in the other Nordic countries was decreasing and the average size of farms was growing. In terms of history Finland differed from the other Nordic countries in that it was an autonomous Grand Duchy of the Russian Empire over the period 1809–1917 with no parliamentary administrative practices of its own. This meant that many reforms, such as the introduction of compulsory schooling and the reform of poor relief were postponed until the 1920s following Finnish independence. Finland had developed its own autonomous nation State, however, with a Parliament, albeit one with limited powers, elected in 1907 by universal suffrage, making Finnish women the first in Europe to secure voting rights. From the 1860s onward Finland had grown apart from Russia. The political reasons that made Finland different from the other Nordic countries arose on account of the 1918 civil war that accompanied the at-tainment of national independence.
Finland was a poor country that industrialised at a late stage, but it caught up with the other Nordic countries and Western Europe economically, socially and politically in the 1920s and 1930s. Finland at this stage could be characterised as a small, open economy that mainly exported forest industry products and was thus highly vulnerable to interna-tional economic trends. The social impact of the forest industry was profound, as peasants owned much of the Finnish forest. Procurement and transport of wood provided work for the landless people of the countryside and for smallholders. This meant that agriculture and the forest industry were interlinked, and smallholders could make a living by supple-menting their incomes from forest industry sources.
Aside from employee industrial accident insurance (dating from 1895), Finnish social security remained underdeveloped by comparison with other western European countries in the interwar period. With the exception of State civil servants, for whom a Pensions Act was introduced in 1924, most Finns were not covered by a social security scheme in the form of insurance. Social security at this time chiefly depended on municipal poor relief – as it had done during the pre-independence period as an autonomous Grand Duchy. Finland was a national agrarian society, in which economic policy was governed by liberalism emphasising free enterprise and individual initiative, and in which the independent smallholder was viewed as some kind of ideal. The civil war had also divided the country both politically and socially.
Attempts were made to promote social security by implementing extensive land reforms, including the liberation including the liberation of crofters in 1918 and the Settlement Act of 1936. These reforms were viewed as measures to bring equilibrium in social development
1 Social security is here understood in the broad sense to include income protection, health-related social secu-rity and social services.
10
and reinforce social peace with a peasant vision. With the liberation of crofters and division of farms, Finnish agriculture became dominated by smallholders, which may be considered to have obstructed the ascendancy of right-wing radical tendencies. Finnish labour laws were revised in the 1920s: the Employment Contracts and Employment Regulations Act took effect in 1922 and the Collective Agreements Act in 1924. Reforms were made to the Poor Relief Act in 1922 and the Workers’ Industrial Accident Insurance Act in 1925, and the Health Care Act took effect in 1927.
By contrast with many western European countries in which industrial accident insurance was followed by the evolution of compulsory social insurance as an extension of sickness insurance, Finnish social insurance developed from old-age and disability insurance, which was mainly due to the country’s agriculture-dominated social and industrial structure. The first major reform was the 1937 National Pensions Act. This was considered a significant socio-political reform demonstrating a democratic tendency, and resulted from the new red-ochre government co-operation between the Social Democrats and the Agrarian Party. This typically Nordic political co-operation in the 1930s was a reaction to extremist tendencies from both the left and the right. In the other Nordic countries such government coalitions began to tackle the economic recession and the development of social security in the early 1930s. Finnish social security began to develop towards the end of this decade.
The National Pensions Act was one of the most important Finnish socio-political reforms of the interwar period, and together with the Maternity Grants Act (1938) and the new Workers’ Industrial Accident Insurance Act (1935) it represented significant progress in the evolution of Finnish social security. The National Pensions Act shifted the trend in social insurance away from employee insurance and towards national insurance. Attitudes towards the development of social security in Finland became more positive at this time.
1.1. The period of reconstructionFinnish social thinking changed after the Second World War. The Winter War united the formerly divided people, and the Central Organisation of Finnish Trade Unions (SAK) and the predecessor of the Confederation of Finnish Industry and Employers (STK) agreed in January 1940 on negotiations in a spirit of comradeship in arms. A new way of thinking, stressing common responsibility, fairness and social security emerged in the wake of this wartime spirit. Social security reforms were viewed as measures to reinforce national unity. National unification was one ideological basis in the evolution of Finnish social security schemes after the war, and it also affected the emergence of the incomes policy system at the end of the 1960s.
Although Lord William Beveridge’s social security plan (1942) was known in Finland, it was chiefly the country’s wartime experiences that independently ushered in a similar way of thinking about social security.
Finnish post-war social policy changed with the varying fortunes of political parties and a manifold increase in membership of labour market organisations. The status of these

Social Security in Finland | The formation of Finnish social security 11
organisations was emphasised in the post-war rationing period, and Finland developed into a society dominated by labour market organisations. The principal challenges of the reconstruction period were payment of war reparations, assistance to war invalids, widows and orphans, and resettlement of displaced persons. Resettlement based on the Land Pro-curement Act involved redistributing almost twice the amount of land as was redistributed by the 1918 on the Liberation of Crofters Act, and more than 100,000 smallholdings were created for Carelians and front-line veterans.
Although it was no longer financially possible to improve social security, the 1937 national pension scheme was nevertheless reformed and a family allowance scheme was introduced in 1948. The family allowance scheme may be viewed as a significant socio-political reform, as family allowances covered all families with children. 592,000 families with a total of 1,262,000 children received family allowances in 1950. As these allowances were paid to mothers, many women received money of their own for the first time. With rural livelihoods partially dependent on benefits in kind, family allowances became a substantial element in the incomes of rural families. The employee industrial accident insurance scheme was also extended in 1948 to include white-collar workers, and expectant mothers became eligible for maternity grants in 1949.
Inflation caused mainly by the war eroded the insurance savings principle that had formed the basis of the 1937 National Pensions Act. After the war supplementary pensions began to develop on the subsistence principle. The emphasis of the National Pensions Act shifted from the insurance principle to the subsistence principle, whereby pension benefits are paid from tax revenues and eligibility for them does not require payment of insurance contributions. While the old national pension scheme was of little significance in its last days, the financing of the scheme played an important role during the reconstruction period in creating a State-led basic energy industry.
Following the national pension reform of 1956, the national pension ceased to be ear-nings-related, and became a means-tested and flat-rate pension. Funding was discontinued in the financing of the national pension scheme and a PAYG system was introduced whereby pension expenditure is mainly financed through annual premium income. The preference for the flat-rate model may reflect the strong position of the rural population, which was further supported by the 1956 general strike. The labour market organisations viewed the national pension reform as a victory for the rural population and smallholders, as they expected this to result in an income transfer to the rural population. The 1956 national pension reform was the most significant socio-political reform of the 1950s, and overall pension expenditure increased 2.5-fold between 1956 and 1957. Monthly payments of the national pension meant that for the first time many elderly women in rural areas began receiving money of their own on a regular basis.
FrompoorrelieftosocialwelfareIn the same year as the National Pension Act reform, the long-pending reform of the Poor Relief Act was also implemented though the 1956 Social Assistance Act. Unlike the 1922

12
Poor Relief Act, the new Act no longer required absolute poverty, i.e. being without means, as the criterion of eligibility for social assistance, but an actual lack of earnings disposable for subsistence at any given time. This meant that preventive care could also be given to people of limited means and not only to the indigent. Social assistance included ensuring necessary maintenance and care, together with other support to improve the income and the state of health and welfare of the claimant and of the claimant’s family. The Social Assistance Act signified a departure from poor relief, even though there was little change in the criteria of eligibility for social assistance.
ThebroadeningofhealthcareCo-operation between the State and local authorities in developing health care mainly concerned the treatment of tuberculosis and mental illness, especially in the early 20th century. It was at this time that the local authorities collaborated to construct and operate mental hospitals and tuberculosis sanatoria with State support. Combating tuberculosis was a crucial issue in post-war health care. One indication of this was the fact that under the 1948 Tuberculosis Act, local authorities had a duty to take educational measures against tuberculosis as a condition for receiving State subsidies.
Co-operation between the State and local authorities in the field of health care can be said to have started in earnest with the 1943 General Hospitals Act and the 1950 General Hospitals Construction Act. These laws provided for the establishment and construction of general hospitals and local hospitals for general medical care jointly by the State and local authorities, which also contributed to the costs of the programme. A programme to build general hospitals began, and the first such hospitals began operating in the early 1950s.
The 1956 Hospitals Act introduced a uniform nationwide hospital plan. Medical and health care were assigned to the local authorities, and the general hospital districts formed a federation of local authorities. The Act specified the hospital districts and the membership of local authorities in these federations. Accordingly, the country was divided into 21 general hospital districts, each with its own general hospital. A general hospital district may also include district hospitals maintained by local authority federations, and municipal local hospitals. Under the Act, the State commissioned the building of general hospitals and then transferred ownership of the completed hospitals to the local authority federation of the general hospital district. This meant that a network of general hospitals was built, so that by the end of the 1970s every general hospital district had a general hospital.
1.2. The emergence of modern social insuranceThe end of the rationing period at the beginning of 1956 signified a change in the direction of Finnish economic policy. After the 1957 devaluation imports from the West were deregulated and Finland joined the European Free Trade Association – EFTA in 1961. It joined the OECD in 1969 and concluded a free trade agreement with the EEC at the beginning of 1974. The

Social Security in Finland | The formation of Finnish social security 13
country’s economic policy began to stress the importance of industrialisation, economic growth and growth policy. Accelerating economic growth became an important social issue for improving Finland’s international competitive position. Economic growth was also felt to require broader social security, as social income transfers were held to boost consumer demand, thereby securing the conditions for economic growth. This signified the emergence of modern social security, as it enabled large population groups to have access to the social security system. The change in the social structure of Finland accelerated, and by the mid-1970s the country had changed from an agrarian society to an industrial and service society.
The unemployment benefit reform of 1960 indicated the direction of the evolving social security system. Based on the work of the unemployment security committee, the Agrarian Party minority government proposed a national statutory unemployment insurance scheme. The employers’ organisation took the view that unemployment security should be constructed on a voluntary basis, and should apply only to industrial workers and not smallholders. The employers felt that rural unemployment was a structural problem that should be resolved through national economic policy. The Agrarian Party dropped the idea of compulsory unemployment insurance when a proposal was made to solve the rural unemployment problem by establishing an unemployment allowance scheme in parallel with the unemployment fund scheme administered by the trade unions. The unemployment benefit reform was the first to link the evolution of social security to economic growth and the implementation of structural change in society.
The Earnings-related Pension Acts were enacted in 1961 under pressure from labour market organisations as a labour market solution based on a private member’s bill. The abolition of earnings-linking in the national pension scheme may be viewed as one of the main reasons for the emergence of the earnings-related pension scheme, as the national pension scheme was no longer felt to ensure sufficient employee pension provision. Under the earnings-related pension scheme entitlement to a pension is based on an employment contract, the pensions are earnings-linked, and they are based on a vesting principle. Under this principle, employee pension rights are conserved even when the employer changes. The earnings-related pension scheme seeks to secure the level of consumption reached by those who have participated in working life, whereas the national pension seeks to guarantee minimum pension provision for everyone living in Finland. The financing of earnings-related pensions is based partial funding. This sought both to safeguard pensions and to support industrialisation and investment by enterprises through a system of automatic reborrowing. The reborrowing scheme enables an employer to issue a bond in payment of the portion of the contribution that is not immediately needed to defray pension expenditure.
A third significant socio-political reform in the early 1960s was the introduction of compulsory sickness insurance in 1963. Under the Sickness Insurance Act, everyone living in Finland is insured in the event of illness, pregnancy and childbirth. The Sickness Insurance Act prescribes two main forms of compensation: on the one hand medical care insurance reimburses the necessary costs incurred by illness, pregnancy and childbirth, while on the

14
other hand daily allowance insurance provides compensation for loss of earned income due to these circumstances. The right to daily sickness benefit covers persons aged 16–64, and includes a minimum daily allowance and an earnings-related daily allowance. As an element of sickness insurance, maternity insurance guaranteed a maternity allowance and important maternity welfare services to all expectant mothers. New prospects were also created for rehabilitation and preventive health care, as was a basis for early rehabilitation. The sickness insurance scheme significantly improved the social security system, encour-aging a shift in the emphasis of health care towards non-institutional care, which was also supported by the 1972 Primary Health Care Act.
The reform of the unemployment benefit system and the emergence of the earnings-related pension scheme and sickness insurance constituted a significant enlargement of the social security system and the emergence of modern social insurance. The reforms tended to reinforce the role of labour market organisations in the evolution of social security, and the development of earnings-related social security was given priority.
1.3. Social security becomes part of incomes policy
The drive for national unity, the new direction in domestic policy and the unification of the labour movement helped Finland enter the era of comprehensive incomes policy settlements in 1968. The rise of the Social Democrats as the leading government party also created political opportunities for the development of a labour market-driven social policy. The changeover to an incomes policy negotiation model meant new social expansion and accelerated structural change in Finnish society. The comprehensive incomes policy agreements were drawn up against the background of a national unification ideology through participation of the labour market organisations (the Central Organisation of Finnish Trade Unions – SAK, the Confederation of Finnish Employers – STK and the Central Union of Agricultural Producers and Forest Owners – MTK), popular front governments and the President of the Republic. Improving employee earnings-related social security took precedence in the field of social policy, and the evolution of social security was linked to a reform policy based on economic growth seeking to ensure the country’s international competitiveness and making Finland a modern industrialised welfare state.
Pension provision for State and local government officials and employees became earnings-based on the model of the private-sector earnings-related pension scheme. By the 1970s the national and earnings-related pension schemes had been extended through survivor’s, unemployment, and front-line veterans’ pensions. A pension scheme was intro-duced for farmers and the self-employed persons and was linked to the earnings-related pension scheme in 1970. This meant that the entire working population was then covered by an earnings-based pension scheme. The target level for private-sector earnings-related pensions rose to 60 per cent of earnings in 1975, and earnings-related pensions were

Social Security in Finland | The formation of Finnish social security 15
given priority over the assistance component of national pensions. This meant shifting the emphasis in the evolution of pension provision from the national pension scheme to the earnings-related pension scheme, which was well-suited to an incomes policy based on economic growth and industrialisation.
The continuous economic growth enjoyed after the Second World War came to an end in the OECD countries with the oil crises of 1973 and 1979. Finland suffered recession later than the other OECD countries, and economic growth stagnated in 1975–1977. The recession signified a new direction in Finnish economic policy, and from 1977 the State began to support the competitiveness of enterprises through economic recovery measures. Finland managed to weather the recession fairly rapidly, thanks to its trade with the Soviet Union. Indeed in the 1980s the Finnish economy grew more rapidly than the European average.
The first three stages of the national pension reform were implemented in 1980–1985, but more slowly than planned on account of the economic situation. The national pen-sion became a taxable, but non-means-tested personal minimum pension payable to all residents of Finland. During the era of incomes policy settlements the national pension reform was the first significant socio-political reform in which pensioners’ organisations played a significant role in implementing the reform. Flexible retiring age arrangements were implemented in the national and the earnings-related pension schemes and in the State and local government pension schemes in 1986–1989. This solidified the roles of the national and the earnings-related pension schemes.
The SOVE reform of sickness allowance and accident and motor insurance was agreed by the labour market organisations as part of the 1981 comprehensive incomes policy agreement, and the reforms took effect in 1982. Sickness allowances and benefits from accident and motor insurance were increased and became taxable. The daily allowances and maternity allowances payable from sickness insurance almost doubled. At the same time daily allowance took precedence over earnings-related pensions. The unemployment benefit system was reformed in 1985 as part of the comprehensive incomes policy settlement agreed by the labour market organisations in 1984. The reform changed unemployment assistance and unemployment benefit into earnings-related unemployment allowance and basic unemployment allowance, respectively, and the said allowances were increased and became taxable. The reforms further reinforced the link between Finnish social insurance and gainful employment. However, taxation of benefits tends to reduce income differentials.
1.4. Health and social services become universalHealthcareservicesbecomeextensiveWhile the principal objective in the 1960s was to achieve broad and extensive health care services, the aim of health care policy in the 1970s was to prevent illness and establish a comprehensive health care policy.
The 1972 Primary Health Care Act effected a fundamental reorganisation to promote primary health care. The Act shifted the emphasis in health care policy towards non-insti-

16
tutional medical care and health care. It sought to guarantee universal and equal health care services in various parts of the country and for various population groups. Health care functions were arranged in health centres run by local authorities or local authority federations, which meant the emergence of public primary health care services. Local authorities were required to arrange medical care services, school health care for residents and dental care for persons aged under 17. The State contributed towards the costs of primary health care according to the financial capacity classification of each local authority. The Primary Health Care Act allows patient access to local authority health care services and private health care services, both of which are reimbursed through sickness insurance.
Occupational health care developed from the implementation of sickness insurance by including a provision in sickness insurance legislation on reimbursement of employers for the costs of occupational health care according to national sickness insurance reimbursement criteria. The Primary Health Care Act, as amended in 1978, made occupational health care a part of the primary health care system. Occupational health care became statutory in 1979 when a duty was imposed upon employers to arrange preventive occupational health care for all of their employees.
Coupled with the Occupational Health Care Act, the Primary Health Care Act and the Sickness Insurance Act together ensure access to both public and private health care services.
UniversalnurseryschoolandcrèchefacilitiesThe status of social welfare in the field of social policy changed in the 1960s and 1970s. The decline in agriculture-based society modified the traditional social networks whereby the elderly had been cared for by their children and grandparents cared for their grandchildren. At the same time (in 1970) children were discharged from the legal obligation to provide for their parents. Besides the break-up of the traditional social networks, the need for social services was also increased by the change in family structure, by migration movements, and by the increased participation of women in working life. The development of day-care was significantly influenced by the 1971 report of the committee on principles in social welfare. This report recommended universal access to services on the basis of need instead of the notion of poor relief. Society had to adhere to the service principle in social security policy. As society evolved, certain social situations and problems – including the need for children’s day-care – had changed so that the individual was unable to cope with them without support from society. Such social support should then be “available to all individuals and families in obvious need of this support”.
The first social services of this kind came with the reform of children’s day-care in 1973. The Children’s Day-Care Act separated children’s day-care services from general child wel-fare and redefined them as a basic social service. The reform shifted the emphasis towards achieving greater equality in family costs and in the conditions for raising children, and towards greater gender equality. Local authorities are responsible for arranging day-care, and must provide this for all children in need of such services. The Primary Health Care

Social Security in Finland | The formation of Finnish social security 17
Act and the Children’s Day-Care Act were building blocks for the Finnish welfare state, and established the basis for enlarging the scope of universal public services.
ChildhomecareallowanceThe Child Home Care Allowance Act took effect in 1985 as part of a reform of the care of small children. Child home care allowance is paid to parents with children aged under 3 years who are not in public day-care. The child home care allowance gives parents the freedom to decide how to arrange day-care for their small children.
Home care allowance for small children was extended in 1990 to guarantee a place in local authority day-care to all children aged under 3 years or, alternatively, child home care allowance for the parents of such children. In 1996 the right to day-care was extended to cover all children under school age (seven years). With the introduction in 1997 of private day-care allowance in addition to local authority day-care and child home care allowance, almost all forms of day-care for small children had been covered by public subsidies.
ReformofsocialwelfareThe 1984 reform of the Social Welfare Act repealed the Public Welfare Act and the Social Administration Act. Social assistance was then replaced by income support. Everyone unable to procure reasonable subsistence by other means was entitled to this benefit. The legislative reform involved a new statutory State subsidy system that improved equality in respect of such subsidies for social welfare and health provision and harmonised the subsidy system. Local authority social administration was linked to the State planning system, and the State directed the establishment and administration of social services. Further conditions were also established at this time for co-operation between public health and social welfare services. Local authority social welfare functions were defined so that local authorities had a duty to arrange social services, to pay income support and to provide social assistance. This placed all social services on the same footing with respect to the statutory duty to provide services. A change of principle from poor relief to a universal care policy may be detected in the field of social services at this stage.
The Primary Health Care Act, the Child Day-care Act and the reform of the Public Welfare Act were the building blocks of the Finnish welfare state in the 1970s and 1980s, and they established the basis for the growth of welfare state services.
InformalcareallowanceThe 1984 amendment to the Social Welfare Act introduced a new type of social service in the form of a home care allowance intended for elderly people, disabled persons and the chronically ill, for which local authorities can receive State aid. Even though the Act does not require local authorities to pay home care allowances, all of them have implemented it. The name of the home care allowance was changed to the informal care allowance in 1993. Informal care allowance is mainly paid by local authorities to relatives who care for the elderly, the disabled, or the chronically sick.

18
Child home care allowance and informal care allowance may be considered to represent a new way of thinking in social security. They combine public and private elements, whereby the public sector contributes to the costs incurred in care, and care work takes place in private, chiefly in individual homes.
1.5. From the recession of the 1990s to the first decade of the 21st century
The recession in western economies, the breakdown of trade with Eastern Europe due to the collapse of the Soviet Union, and the financial and fiscal policies pursued at the end of the 1980s drove Finland into its deepest recession of the post-war period at the beginning of the 1990s. Rapidly growing unemployment reduced tax revenues and increased social expenditure, which together with bank subsidies increased the public deficit and borrowing. Financial policy measures were not used to resuscitate the economy to the same extent as in Sweden, because it was feared that this would worsen the deficit in the current account. It was also considered essential to limit the growth in State debt. The public economy was balanced by cutting expenditure and increasing taxation of earned income.
Finland joined the European Economic Area in 1994, the European Union in 1995, and the European Economic and Monetary Union (EMU) in 1999. From the time of joining the European Economic Area Community Law provisions on social security were also applied in Finland seeking to harmonise social security systems as individuals move between the Member States. The most important of these provisions are in Council Regulation (EEC) No 1408/71 and its implementing Regulation No 574/72, which are based on the principle that a person is insured in only one Member State that is generally the country in which the person works. The significance of these provisions appears in particular where they prevent the application in most cases of conditions in national legislation concerning domicile in Finland or Finnish nationality to a person moving between European Union countries.
International economic growth remained strong throughout the year 2000, with the OECD countries recording the fastest growth in a decade. Economic growth in Finland was favourable as the export sector continued to be exceptionally strong and private consump-tion increased. After the year 2000 the grown in Finnish GDP was less rapid. Between 2001 and 2004 GDP increased at an average annual rate of 2 per cent, with economic growth essentially based on private consumption. The high price of oil hampered the international economy and growth in the euro zone, although Russia benefited from high oil prices while remaining an important trading partner of Finland. The employment rate in Finland remained at 67 per cent of the working age population and unemployment fell to 9 per cent over the period from 2001 to 2004. In 2005 the employment rate increased to 68 per cent and unemployment fell to 8.5 per cent. The public economy remained in surplus chiefly on account of social security funds.

Social Security in Finland | The formation of Finnish social security 19
PensioninsuranceThe most significant reform of pension provision in the early 1990s was the reform of survivor’s pensions on 1 July 1990. This gave widowers the right to a survivor’s pension paid from the national and earnings-related pension schemes, whereas previously only widows had been entitled to a survivor’s pension. Widowers had previously been entitled to a survivor’s pension only from the State and local government pension schemes. The size of the orphan’s pension was also increased and the allocation of the surviving spouse’s pension was specified.
The cuts in social expenditure due to the recession were also reflected in pension provision. Efforts were made to cut pension expenditure by skipping the periodic index-linked revaluation and raising the age limit for early retirement. A labour market agreement broadened the financial basis for private and public-sector earnings-related pensions, so that employees also began paying earnings-related pension contributions in 1993. From the beginning of 1995 the general retirement age in the State and local government pension schemes was raised from 63 to 65 years and the target level of pensions was reduced from 66 per cent to 60 per cent. These changes applied to future pensions. The State and local government pension schemes were thereby harmonised with the private-sector earnings-related pension scheme.
The cuts in pension provision continued in 1996, and for private and public sector earnings-related pensions mainly concerned future pensions. The manner of calculating the pensionable wage was changed so that the pensionable wage would be determined based on the earnings of the last ten years of employment. A “bent index” was also introduced for earnings-related pensions, whereby the employment pension indices were different for people of working age and people aged over 65.
The cuts in pension provision also affected national pensions. The separate basic amount of the national pension is no longer paid for new pensions beginning after 1995, and the basic amount was abolished completely in 2001 for pensions beginning before 1996. This made the national pension a minimum pension proportional to the earnings-related pension. Three general increases were made in national pensions (in 2001, 2005 and 2006) that improved the pensions paid to all national pension recipients and persons on small employment pensions.
A statutory earnings-related pension reform took effect at the beginning of 2005. This seeks to reduce growth in earnings-related pension contributions by adjusting them to changes in the age structure of the population and increased life expectancy.
SicknessinsuranceDue to the recession the reimbursement percentages of earnings-related parental allowances in sickness insurance were lowered several times in the early 1990s, and the waiting period for sick-ness allowance was extended. Although the reimbursement percentages for earnings-related daily allowances were lowered, the real value of these daily allowances for claimants on low incomes or with no income was maintained by increasing the lowest daily allowances.

20
The 1996 cuts in social security also affected sickness insurance. The Sickness Insurance Act was amended so that sickness allowance would mainly compensate only for lost earnings. The minimum daily sickness insurance allowance, which had previously been paid to those without earned income, was also abolished. However, people with no earnings could be paid means-tested sickness allowance if the incapacity for work continued for at least 60 days. On the other hand, a minimum daily allowance was maintained for the maternity, paternity and parental allowance, although its level was reduced and index-linking was discontinued. The minimum sickness allowance was restored in 2002 and becomes payable after a waiting period of 55 days.
Aside from earned income insurance, cuts were also made in medical expenses insurance, and especially in reimbursement for medicines: the 90 per cent rate of reimbursement for medicines was reduced to 75 per cent and a fixed co-payment was introduced for medicines reimbursed at the 100 per cent and 75 per cent rate.
OccupationalhealthcareThe recession of the early 1990s led to a cut in reimbursements from sickness insurance for health care expenses from 55 per cent to 50 per cent. The reimbursement system for occupational health care was amended in 1995. The reform sought to reinforce measures to prevent illness and maintain working capacity. Maximum reimbursements were specified for occupational health care and medical care voluntarily arranged by the employer, as well as for other health care. Specialist medical services were restricted and reimbursement of health care for family members was discontinued.
The occupational health care legislation was amended in 2002 to meet the needs of a changing working life and labour force. Under the new legislation, the employer has a duty to arrange and defray the costs of occupational health care to prevent health hazards due to the work and to working conditions, and to protect and improve the safety, working capacity and health of employees.
RehabilitationA comprehensive reform of rehabilitation legislation was implemented on 1 October 1991. The reform sought to clarify roles in the rehabilitation system, and to meet shortfalls in income security during rehabilitation. A duty to arrange rehabilitation and a co-operation provision imposing a duty on organisations were added to the main laws governing social welfare and health care, the labour administration and insurance schemes. This included a provision in the legislation on national and earnings-related pensions stipulating that before making a pension decision the pension provider must, when necessary, investigate the prospects for rehabilitating the employee. Occupational rehabilitation became a statutory obligation at the beginning of 2004 with the aim of ensuring that employee occupational rehabilitation is arranged at an earlier stage.

Social Security in Finland | The formation of Finnish social security 21
Income support during rehabilitation is arranged through the rehabilitation allowance. This benefit is paid to persons of working age between 16 and 64 years if the aim of rehabilitation is continued participation in, return to, or access to working life, and it is not possible to work during the rehabilitation period.
UnemploymentbenefitThe social security amendment proposals of the spring 1993 labour market agreement affected unemployment benefit. The most important modifications concerned the basic unemployment allowance. An employment requirement of six months and a maximum duration of 500 days were introduced for the basic unemployment allowance, matching the regulations governing the earnings-related unemployment allowance. The basic unemployment allowance is also no longer means-tested.
A new unemployment benefit was introduced in the form of the labour market sub-sidy, which is equal to the basic unemployment allowance, but is generally means-tested, meaning that a high spousal income may result in a lower rate of labour market subsidy. Labour market subsidy was mainly intended for young people entering the labour market for the first time. This referred to individuals who had not previously been in work and who were increasingly remaining unemployed (e.g. students and graduates of vocational and academic educational institutions).
In the 1996 budget negotiations the government sought to save FIM 2 billion in unem-ployment security during 1997. Besides public expenditure savings, the government sought to revise the unemployment benefit scheme so that it would increasingly encourage the unemployed to enter the labour market and accept short-term work.
At the beginning of 1997 the employment requirement for unemployment benefit was extended from 6 to 10 months, the waiting period for initial benefit entitlement became 7 days, the manner of wage payment used in reckoning earnings-related unemployment benefit was modified, and the 55 year age limit on entitlement to extended unemployment benefit was increased to 57 years. The labour market subsidy system was also modified. The restriction dating from 1996 on entitlement to labour market subsidy for claimants under 20 years of age was extended to everyone aged under 25. To encourage claimants to seek employment, a less severe means test was applied to supporting spouses, but stricter means testing was introduced for single persons.
HealthandsocialservicesBesides the recession of the early 1990s, health and social services were also affected by the 1993 reform of central government transfers to local government in social welfare and health care. The financing method used for local authority health and social services was changed from expenditure-based central government transfers to formula-based block grants. At the same time the system of statutory guidance gave way to information guidance. This reform stressed local authority liability. The recession also tended to reduce the share of the State in financing services clearly after 1993, just as local authorities were assuming

22
liability for an increasing share of health and social services.Due to the recession, the proportion of social expenditure on services for the elderly
and the disabled, health services and social services for families with children decreased in the early 1990s, but it began to rise again at the end of this decade. The economic crisis does not seem to have changed the relation between income transfers and services. However, an increasing emphasis on services was visible in family policy expenditure by the end of the 1990s. Thus the recession did not shift the emphasis of the Finnish wel-fare state away from services and towards income transfers, otherwise than by increasing unemployment benefit expenditure.
The payment share of health care clients grew during the recession years. This increase was slightly larger in medical care than in other health services. Including the increase in the deductible for expenditures on prescription medicines that are reimbursed from sick-ness insurance and for the costs of examinations and treatment, the per capita medical costs paid by individuals increased by about one fifth over the period 1987–1996. The tax deductibility of medical expenses was abolished in 1992.
The State subsidy to local authorities for health and social services expenditure fell substantially during the recession. Cuts in specialised medical care mainly affected in-stitutional psychiatric care. The reduction in long-term medical care for the elderly was considerable.
Children’s day-care was expanded during the recession and afterwards. A shift of emphasis towards full-time day-care at the expense of part-time day-care and family day-care can be discerned. This has been interpreted as a change towards arrangements whereby day-care becomes a preliminary stage for the school system. On the other hand, real expenditure on children’s day-care has not really increased in recent years because the number of children has fallen.
SummaryDespite cuts in social security in the 1990s, its basic structure remained almost unchanged. Changes made in the first decade of the 21st century mitigated some of the cuts of the 1990s and improved social security: this included a restoration of minimum sickness in-surance allowance and child supplements in labour market subsidy, and renewed payment of child supplements in the national pension. Improvements in social security focused on minimum benefits, including increases in the minimum amounts of sickness benefit, parental allowance and rehabilitation allowance, basic unemployment allowance, family allowances and child home care allowance.
The repeal of the provisions of the Parliament Act concerning the postponement of legislative proposals and the associated reinforcement of majority parliamentarism have facilitated adjustment of the social security system. Majority governments have been able to implement reforms more quickly. The 1995 amendment to the Parliament Act was accom-panied by a reform of fundamental rights whereby individual basic social rights were written

Social Security in Finland | The formation of Finnish social security 23
into the Constitution Act and subsequently, in 2000, into the new Finnish Constitution.The cuts caused by the recession have made Finnish social insurance increasingly em-
ployment and earnings-based, whereas income and means testing are stressed in minimum social welfare provision.
In the field of health and social services and with respect to the changes in medical care and child care services, the status of the most highly professional arm of this sector – emergency medical care and day-care – has been reinforced. On the other hand, less highly professional care services have had to adjust to the pressures of the economic recession. Geriatric care services in particular have been reduced in both scope and content.
During the recession of the 1990s in the Nordic countries Sweden and Finland trans-ferred responsibility for care, especially geriatric care, from the health care to the social services sector without increasing public residential care. Denmark, by contrast, managed to maintain broader entitlement to services even as the overall role of residential care increased. Finland and Sweden have significantly reduced the share of public financing in health care, whereas Denmark and Norway have maintained public financing at the previous level. Compared to the development in the service scheme for the elderly, it may be noted that the extension of children’s day-care also continued throughout the recession of the 1990s in both Sweden and Finland. The Nordic countries are moving in a direction whereby children’s day-care is securing the same rights as basic education for children.
1.6. Trends in social expenditure between 1960 and 2004
We shall here consider changes in social security in terms of the proportion of social expenditure in GDP. Measured in this way, the proportion of social expenditure in GDP at market prices increased by 18 percentage points between 1960 and 2004 (see figure 1). The relatively large fluctuations in the proportion of GDP are mainly due to changes in the growth of GDP. The impact of the economic recession of the 1990s is particularly visible, as this factor increased the proportion of social expenditure in GDP to nearly 35 per cent. The fall in social expenditure to nearly 25 per cent by the end of the 1990s was partly due to brisk growth in GDP and also to social expenditure cuts, until an increase in the average age of the population began to push social expenditure up again at the beginning of the 21st century.
Following a sustained fall, the proportion of social expenditure in GDP began to rise again slightly at the turn of the century. The proportion of social expenditure in Finland’s GDP is at an average level for the 15-member European Union. The proportion of expenditure on services in Finland is higher than the European Union average, but remains lower than in Sweden or Denmark. The lower level of services expenditure in Finland compared to Sweden and Denmark is linked to employment rates in public education, health and social services, which were 4–7 percentage points lower in Finland than in Norway, Sweden and Denmark.

24
Figure 1. Social expenditure as a percentage of GDP at market prices and per capita between 1960 and 2004.
Per capita social expenditure initially increased at a relatively steady rate. After 1970 this rate increased, reaching a peak in the 1980s that was chiefly due to the national pension reform, growth in earnings-related pensions, the reform of sickness insurance allowances and the reform in unemployment allowances and an expansion in health and social services. The rise in per capita social expenditure in the early 1990s was mainly due to mass unemployment. This rise levelled off towards the end of the decade largely as a result of social security cuts and falling unemployment. The growth in per capita social security expenditure in the early years of the 21st century is largely linked to an increase in expenditure allocated to old age, and to sickness and health arising from the increasing average age of the population. The proportion of GDP allocated to social expenditure in Finland is slightly lower than in Sweden or Denmark.
5
10
15
20
25
30
35
40
EUR per capitaat 2004 prices
2004200019951990198519801975197019651960
1 000
2 000
3 000
4 000
5 000
6 000
7 000
8 000%
Social expenditure/GDP, %
Social expenditure

Social Security in Finland | Income support 25
2. Income supportIncome support in Finland is based on the “Nordic model”, whereby everyone living in the country is entitled to benefits that ensure a basic minimum income. The principal elements of the system are forms of insurance against specific causes that provide security against such eventualities as old age, disability, loss of parent or guardian, illness and unemploy-ment, and in respect of maternity and the care of small children.
Council Regulation (EEC) No 1408/71, which seeks to harmonise social security within the European Union, covers a substantial segment of Finnish social security benefits, as its sphere of application includes sickness insurance benefits, public health services, reha-bilitation benefits, disability and old-age pensions, survivors’ pensions, industrial accident insurance, unemployment benefits, family allowance and child homecare allowance. On the other hand, the Regulation does not apply to such matters as social welfare services, which for example include income support and general housing allowance.
2.1. Pension insuranceFinnish pension provision mainly comprises two statutory pension schemes: earnings-related employment and entrepreneur pensions and the national pension. These guarantee pension provision for residents of Finland in the event of old age or incapacity for work and the death of the family breadwinner. Elderly employees are also eligible for unemployment pension. In addition to these two systems, pensions are also paid on the basis of industrial accident and motor insurance (liability insurance). Individual voluntary pension insurance schemes are also quite popular.
Figure 2 shows the overall structure of the pension system. Earnings-related pension is determined according to earnings and years spent at work. The national pension is paid to persons who have not worked or to those who are eligible for only small earnings-related pensions.
There were 1.3 million pensioners in Finland at the end of 2004, accounting for 24.5 per cent of the total population. 43 per cent of pensioners received both an employment and national pension, 9 per cent received the national pension only, and 48 per cent received an earnings-related pension only. Old-age pensions were paid to 876,000 recipients (21 per cent of the population over 16 years of age) and disability pensions were paid to 255,000 persons (7 per cent of the population aged between 16 and 64 years). The average total pension of persons resident in Finland and receiving a pension of their own (excluding survivors’ pensions) was EUR 1,130 per month in 2004. The average size of old-age pensions is still increasing, as the earnings-related pensions of new pensioners are higher than those previously granted and terminated.

26
2.1.1. Earnings-related pensionsThe purpose of earnings-related pensions is to ensure continuation of previously achieved consumption levels on retirement. The size of the pension is affected by the length of the individual’s working history and the earnings from work. The system is statutory and mandatory, applying to all employees and to self-employed persons in agriculture and other sectors. Financing of the earnings-related pension is mainly (about 75 per cent) based on a PAYG system, and the organisations that operate the decentralised system ultimately guarantee the payment of pensions mutually where necessary.
The earnings-related pensions are old-age, disability, unemployment and survivors’ pen-sions, early old-age pension and part-time pension. The earnings-related pensions reform took effect at the beginning of 2005. A corresponding reform was also undertaken in the public sector pension system and entrepreneur pensions. The flexibility of the system was substantially increased. It enables retirement on old-age pension between the ages of 63 and 68 years, but encourages people to continue working and rewards long careers with additional pension accrual. The previously applied early retirement schemes were restricted: only persons born before 1950 are eligible for unemployment pension. The age limit for part-time pension was increased to 58 years and the age limit for early retirement on old-age pension was increased from 60 to 62 years.
Pensions accrue for employment and public service after the age of 18 years, self-employment and degree-oriented studies, care of small children, job alternation leave and claiming periods for earnings-related unemployment allowance. The rate of pension accrual is 1.5 per cent between the ages of 18 and 52 years, 1.9 per cent between the ages of 53
* A pensioner may also receive housing allowance that is proportional to an earnings-related pension. 170,000 persons, or 13 per cent of all pensioners, were receiving housing allowance at the end of 2005. Most of these pensioners were national pension recipients living in rented accommodation. The average housing allowance paid in 2005 was EUR 144 per month.
Figure 2. Structure of the Finnish pensions system 2005*.
250
500
750
1 000
1 250
1 500
1 750
2 000
2 250
National pension
Earnings-relatedpension
4 0003 5003 0002 5002 0001 5001 000500
PensionEUR per month
WagesEUR per month
Net

Social Security in Finland | Income support 27
and 62 years and 4.5 per cent between the ages of 63 and 68 years.During a long working career the pension may increase to a quite large amount compared
to earnings from the active period. The beginning of working careers is often delayed due to extended studying, however, and includes gaps due to family leave and career discontinuations. In practice Finnish employment and entrepreneur pensions are often 50–60 per cent of whole-career earnings. Because of the effect of progressive income taxation, the level of net pensions compared is higher compared to previous net earnings.
When reckoning the pension the earnings of previous years are increased to the level of the pension determination year using an index in which the weighting based on the increase of earnings is 80 per cent and the weighting based on the rise in the cost of living is 20 per cent. After retirement the pension is increased every year using an index in which these weightings are reversed: 80 per cent of the revision is based on the cost of living and 20 per cent is based on the change in earnings level.
The 2005 reform includes a protective clause for persons retiring before the year 2012 from an employment relationship that began before 2005. In such cases the pension will be calculated according to both the old and the new rules. If the pension reckoned under the old rules is higher, then the difference is added to the pension reckoned under the new rules.
DecentralisedimplementationThe basis for the earnings-related pension system was agreed between both sides of labour market and prescribed by law. Pension administration in the private sector has been assigned to private employment pension companies, foundations and funds. There are sev-eral employment pension companies and these usually take the form of mutual insurance companies. These companies are governed by policyholders and representatives of labour market organisations. There are several dozen employment pension foundations and funds. Pension foundations are enterprise-specific, while pension funds cover a broader business sector.
These pension sector operators are supervised by the Insurance Supervision Authority – ISA and ultimately by the Ministry of Social Affairs and Health. The Finnish Centre for Pensions serves as a central agency. The sector has common earnings registers that collate details of employment relationships and earnings. The pension is paid by the “last insti-tution”, meaning the one in which the pensioner was most recently insured. The Finnish Centre for Pensions calculates and distributes the financial liabilities of each pension institution for pensions according to how individual pensioners were insured during their working careers.
The Finnish Centre for Pensions issues earnings-related pension implementation regu-lations and gathers statistics, conducts research and serves as a central co-ordinator for such matters as improving common information systems.

28
PensionfinancingandpreparationforincreasedexpenditureEarnings-related pensions are financed by an insurance contribution that averaged 21.9 per cent of pay in 2005. The employer pays 17.3 per cent and the employee 4.6 per cent. Due to higher pension accrual, the proportion paid by employees over 53 years of age is greater, amounting to 5.8 per cent, while the proportion paid by the employer is corres-pondingly smaller.
Nearly three-quarters of contributions are used for paying current pensions under the PAYG system and just over a quarter is used for funding future pensions. Statutory pension insurance funds currently account for nearly 70 per cent of GDP in Finland and exceed the value of the Finnish housing stock. Funding prepares for upward pressures on pension payment arising from the different sizes of various age groups. Funding of old-age pensions will be enlarged as of 2003 so that by 2013 the additional funding will reach approximately 7.5 per cent of the insured wage sum.
From about 2004 more people will retire than join the labour market as new employees in Finland. The large age groups of the postwar period will begin to retire in the near future. Total pension expenditure as a proportion of GDP will increase from the current figure of about 11 per cent to an estimated 15 per cent in 2030. It is therefore forecast that regardless of funding the average earnings-related pension contribution in the private sector will increase by about 6 percentage points from the current (2005) level by the year 2030. It is estimated to reach a level of nearly 28 per cent of pay at this time.
Figure 3. Private sector earnings-related pension contributions and expenditure in total pay between 2005 and 2050, %.
%
5
10
15
20
25
30
35
Earnings-relatedpension contributions
Earnings-relatedpension expenses
2050204520402035203020252020201520102005

Social Security in Finland | Income support 29
The life expectancy of people in Finland has increased by about one year per decade since the Second World War. This progress is expected to continue. The 2005 pension reform therefore includes a decision to introduce a life expectancy coefficient that will begin to affect the size of pensions in 2010.
A calculation will be made for each birth year class of how much the average remaining lifetime of a person aged 62 years has changed since 2009. The coefficient will reduce the pension level of the age class in question in proportion to the increase in life expectancy. The life expectancy coefficient will be specific for each age group and will not depend on the effective retirement age of the insured person. This means that during their lifetimes the members of each age group will on average receive a pension of similar size and increasing life expectancy will not cause additional pension costs.
It is not the primary purpose of the coefficient to reduce pensions, but to encourage people in Finland to retire later. The effect of the coefficient in reducing pensions will be easy to offset, at least initially by working for a few months longer than was originally intended, whereupon the 4.5 per cent incentive accrual rate will compensate for any loss. The coefficient has been introduced in an effort to deflect part of increased life expectancy into longer working careers and not merely an extension of years of retirement.
In very recent years the working careers of people in Finland have lengthened so that the average age of retirement on old-age pension is slightly over 63 years, although the overall average age of retirement is 59–60 years when including disability and unemployment pensions. The employment rate of persons over 55 years of age has increased substantially in recent years. It was 73 per cent for 55 year-olds and 45 per cent for 60 year-olds in 2004. This progress is expected to continue.
2.1.2. The national pension schemePersons resident in Finland are entitled to a national pension. A Finnish citizen is entitled to a national pension after living in Finland for no less than three years after reaching the age of 16 years. Corresponding regulations govern refugees and stateless persons, citizens of European Union and European Economic Area countries and citizens of certain other countries with which Finland has concluded a bilateral social security agreement. In certain cases citizens of other countries are equated with the foregoing if they have moved between the Member States of the European Union. In the case of a person arriving from a European Union Member State two years may be compensated by the insured period of the other Member State. A foreigner can be granted a pension on living in Finland for the previous five years. The national pension guarantees minimum subsistence for pension recipients with no other pension income or with only a small earnings-related pension.
The benefits paid from the national pension scheme are old-age, disability and unem-ployment pensions. Since 1997 it has been possible to pay only pensioners’ housing allowance, pensioners’ care allowance or front-line veterans’ supplement, and as of 2001 an increase for a child has also been payable, provided that the person receives some statutory pension other than a national pension.

30
The retirement age in the national pension scheme is 65 years, and an early old-age pension can be granted to claimants aged between 60 and 64 years. A disability pension is granted as such to persons aged between 16 and 64 years, and as an individual early retirement pension to persons aged between 60 and 64 years. An unemployment pension is granted to long-term unemployed persons aged between 60 and 64 years.
The national pension is proportional to the earnings-related pension, i.e. its size is determined according to the earnings-related and civil service pensions and to other compensation comparable to pensions. If the monthly earnings-related pension in 2006 is at least EUR 889–1,046, then no national pension is payable. The full monthly national pension was EUR 432–511 in 2006.
Provided that the beneficiary lives in Finland, a national survivor’s pension is paid to a surviving spouse aged under 65 years and to orphans. In the case of a European Union Member State, however, a survivors’ pension may also be paid under certain conditions to a surviving spouse and orphans living in another Member State. A surviving spouse’s pension is payable if the spouse dies and an orphan’s pension is payable if the parent or other guardian dies. Eligibility for a surviving spouse’s pension arises when the surviving spouse and the deceased have or had a mutual child and their marriage was contracted before the deceased reached the age of 65 years. With no mutual child the conditions of eligibility for a surviving spouse’s pension are stricter. Children under 18 years of age and students aged between 18 and 20 years are eligible for a child’s pension. This pension may be paid at a basic or supplemented rate. The size of the pension depends on the income of the surviving spouse and on the survivors’ and assistance pension of the child. A surviving spouse’s pension may also be linked to housing allowance. Payment of both the national pension and the national survivor’s pension is administered by the Social Insurance Institution (Kela).
Pensioners’ housing allowance and pensioners’ care allowance are included in the national pension scheme, but these are discussed separately in the sections on housing allowance and benefits for the disabled.
National pension scheme benefits are linked to a national pension index determined according to the cost-of-living index.
The reform of the private-sector earnings-related pension scheme in 2005 also affected national pensions. Additional accrual on the earnings-related pension does not reduce the size of the national pension, i.e. earnings-related pension accruing after the age of 63 does not affect the national pension. Pension accrual for unsalaried periods (periods of study and childcare) under the reform of private-sector earnings-related pensions will also not reduce the size of the national pension. However, the retiring age under the national pension scheme will continue to be 65 years. This means that the national pension will include a right to a disability benefit for persons aged 63–64 years and entitlement to an unemployment pension for persons born in 1949 or earlier.

Social Security in Finland | Income support 31
2.2. Sickness allowance in sickness insuranceEveryone living permanently in Finland is covered by statutory sickness insurance. The question of when a person is deemed to live in Finland is separately governed by an instrument known as the “Scope Act” (no. 1573 of 1993). Persons working for no less than four months in Finland are also insured against illness, provided that they satisfy the employment condition. Sickness insurance is administered by the Social Insurance Institution (Kela). Voluntary sickness insurance may also be arranged.
Daily sickness allowance is paid to compensate for loss of working capacity. There were 335,500 beneficiaries of sickness allowance in 2004. Persons aged between 16 and 67 years who are unfit for their normal work or for alternative closely comparable work due to illness are entitled to sickness allowance. The amount of sickness allowance payable depends on the earned income. Persons without income are paid the minimum sickness allowance of EUR 15,20 per working day (2005). Persons in the low and middle-income brackets receive a daily allowance of about 70 per cent of earnings. Sickness insurance is paid for no longer than 300 days, beginning after a waiting period including the day when the claimant falls ill and 9 working days for the earnings-related daily allowance or 55 calendar days for the minimum daily allowance. Sickness allowance takes precedence over disability pensions payable under earnings-related pension legislation, and the pension is paid only after the period of daily allowance has ended. On the other hand, sickness allowance is secondary with respect to compensation from accident and motor insurance, and to rehabilitation allowance and compensation for loss of income during rehabilitation.
2.3. Unemployment benefitPersons permanently domiciled in Finland are insured against unemployment. The question of when a person is deemed to live in Finland is separately governed by an instrument known as the “Scope Act” (no. 1573 of 1993). Persons working in Finland are also insured against unemployment regardless of domicile. However, eligibility for unemployment benefit requires residence in Finland in the manner referred to in the Scope Act. Subsistence for the unemployed is mainly ensured through unemployment allowance, labour market subsidy and unemployment pension. Unemployment allowance may be paid as an earnings-related allowance or a basic allowance. Basic unemployment allowance and labour market subsidy are administered by the Social Insurance Institution (Kela), while unemployment funds administer the earnings-related unemployment allowance.
2.3.1. Basic security for the unemployedBasic security for the unemployed comprises basic allowance and labour market subsidy.
BasicallowanceThe basic allowance covers everyone residing in Finland, including citizens of Member States of the European Union or European Economic Area working in Finland. Basic allow-

32
ance is payable to persons aged between 17 and 64 years who are registered as full-time job-seekers at the local employment office and who meet the employment condition. The claimant must also be fit for work and available in the labour market.
After a waiting period of 7 days, the basic allowance is payable for 5 working days weekly for a maximum of 500 days of unemployment to unemployed job-seekers who are not members of an unemployment fund and who continue to meet the employment condition. An unemployed person who has reached the age of 57 years before the end of the maximum payment period is paid basic unemployment allowance until the age of 60 (right to continued unemployment allowance). Such claimants then become eligible for an unemployment pension.
Basic allowance is paid for a maximum of 5 days per week, and amounted to no more than EUR 505 per month in 2006. The basic allowance is incometested and is reduced by income from work and by certain social security benefits. A child supplement of EUR 96–181 per month may be added to the basic unemployment allowance.
LabourmarketsubsidyLabour market subsidy ensures subsistence and improves the claimant’s prospects of returning to the labour market through employment policy measures. Labour market subsidy is pay-able to unemployed persons who have already received basic unemployment allowance or earnings-related unemployment allowance for the maximum period of 500 days, or who are not entitled to unemployment allowance.
Labour market subsidy may be granted to an unemployed person aged 17–64 years, who is registered as a full-time job-seeker at the local employment office, is fit for work and is available in the labour market. Labour market subsidy is paid after a waiting period of 5 days. The waiting period for a person without vocational training entering the labour market for the first time is 5 months. No new waiting period is required for the transfer from unemployment allowance to labour market subsidy if the person has been unemployed without interruption on transferring directly to labour market subsidy after receiving unemployment allowance for the maximum period.
The full labour market subsidy is of the same size as basic unemployment allowance, and also includes a supplement for a child. Unlike basic allowance, labour market subsidy is incometested. With the exception of certain social security benefits, it is reduced by almost all individual and spousal earnings (including common-law spouses).
179,600 claimants were receiving basic unemployment security (basic unemployment allowance and labour market subsidy) in Finland at the end of 2004 at an average monthly payment rate of EUR 521.
The basic unemployment allowance (basic component of earnings-based security) and the labour market subsidy are taxable and are revalued in line with the change in the national pension index.

Social Security in Finland | Income support 33
2.3.2. Earnings-based security for the unemployedEarnings-related unemployment allowance may be granted to an unemployed member of an unemployment fund who meets the criteria of fund membership and time spent in employment. After a waiting period of 7 working days unemployment allowance is paid for 5 working days per week.
The size of the earnings-related unemployment allowance depends on the previous earnings of the unemployed person. The daily allowance comprises a basic component equal to the basic allowance and an earnings-related component. Child supplements are the same as for the basic allowance. The earnings-related component is 45 per cent of the difference between the previous daily wage and the basic component, but must at least equal the basic component.
Earnings-related unemployment allowance is paid for a maximum of 500 days. The allo-wance may also be paid until the age of 60 to an unemployed person who has reached the age of 57 years before the maximum period of 500 days has ended. If unemployment continues after the earnings-related unemployment allowance has ended, then the unemployed person is eligible for labour market subsidy (right to continued unemployment security).
138,000 claimants were receiving an average of EUR 990 per month in earnings-related unemployment allowance at the end of 2004.
Earnings-related unemployment allowance is taxable income.
2.3.3. Changes in unemployment securityThe unemployment security system was also changed at the time of reforming the earn-ings-related pension system. An unemployment security reform took effect on 1 January 2003, and mainly modified the size and duration of the unemployment allowance and the details of the employment condition.
The severance pay of an unemployed person was also linked to unemployment security by increasing the earnings-related unemployment allowance on 1 January 2003 and the basic allowance on 1 July 2005 for 130 days by a severance pay increment for a person who has been made redundant, and who has a working history of at least 20 years. The increase may be paid in both the basic and earnings-related allowances for up to 150 days. From 1 July 2005 it has been possible to add an employment programme supplement to the basic allowance and to the earnings-related unemployment allowance. This requires the preparation of an employment programme at the local employment office and a working history of no less than three years. The employment programme supplement may be paid for a maximum of 185 days.
The age limit for entitlement to continued unemployment allowance was increased from 57 to 59 years. A further requirement for continued unemployment allowance is that the person has a working history of at least 5 years during the past 15 years when the maximum period of 500 days ends. The level of the unemployment allowance paid for the period of continued unemployment allowance was increased to approach the level of pension provision. The proposed amendment concerning days of continued unemployment

34
allowance will thereby supplant the unemployment pension.The employment condition for receiving unemployment allowance remained at 10 months,
but the tracking period for meeting this condition was increased from 24 months to 28 months.
An unemployment pension will continue to be paid to persons born in 1949 or earlier. The right to continued unemployment allowance replaces the unemployment pension for persons whose right to continued unemployment allowance starts after 1 January 2007, i.e. for persons born in 1950 or later. These changes took effect on 1 January 2003.
2.4. Industrial accident insuranceStatutory accident insurance covers all employees and self-employed farmers in Finland. Accident insurance compensates an employee for industrial accidents and the onset of occupational illness. Industrial accident insurance also covers accidents that occur on the journey between home and work. The employers finance statutory accident insurance through insurance contributions. Self-employed farmers have a compensation system based on special legislation, which compensates for accidents in agricultural work or in circumstances due to such work and for occupational illness. Both self-employed farmers and the State are involved in financing this form of accident insurance. Other entrepreneurs in Finland are not required to arrange accident insurance cover for themselves.
An employee who is injured in an accident or who contracts an occupational illness is compensated for such expenses as the costs of medical care, loss of earnings, any lasting disability and rehabilitation expenses. The compensation is based on the Accident Insurance Act and constitutes taxable income. This compensation is primary with respect to other social security benefits, meaning that the said benefits are paid only if they exceed the compensation payable from accident insurance. Survivors’ pension and funeral grants are paid to the surviving spouse and children in cases of fatality. Compensation for accidents under statutory accident insurance was paid to 118,000 employees in 2004.
A full industrial injuries pension amounts to 85 per cent of the annual earnings of the injured person. An industrial injuries pension may also be paid as a partial pension if the injured person is able to continue working despite the accident but at a reduced level of earnings due to a handicap. When the beneficiary of an industrial injuries pension reaches the age of 65 years, then the full industrial injuries pension falls to 70 per cent of annual earnings.
Statutory accident insurance is administered by private accident insurance companies. Statutory provision may be supplemented by voluntary accident insurance.

Social Security in Finland | Income support 35
2.5. Income support of families with childrenThe income support of families with children is arranged through maternity grants, family allowances and parental allowance. Even though child home care allowance is part of in-come support for families with children, it is here considered for the sake of consistency together with social services support for the care of small children. The Social Insurance Institution (Kela) is responsible for administering these benefits.
A maternity grant may be paid to a woman residing in Finland and family allowance is paid for a child living in Finland. Persons working in Finland for not less than four months are also eligible for maternity, paternity and parental allowance, provided that they meet the employment condition.
2.5.1. Maternity grantThe maternity grant seeks to promote the health of the mother and the child. A woman whose pregnancy has lasted for 154 days and who has had a medical examination before the end of the fourth month of pregnancy is entitled to a maternity grant. A maternity grant may also be paid for an adopted child aged under one year. A higher maternity grant is paid to families in which several children are born at the same time or which adopt several children at the same time.
The maternity grant is paid in cash or in the form of a maternity package containing childcare items. The size of the cash benefit in 2004 was EUR 140. An adoption grant of EUR 1,900, EUR 3,000 or EUR 4,500 (in 2006) was also paid to cover the costs of inter-national adoptions, depending on the country of origin of the child.
2.5.2. Family allowanceFamily allowance is paid for the maintenance of children aged under 17 years. The size of the allowance depends on the number of children in the family. The monthly family allowance in 2006 is EUR 100 for the first child, EUR 110.50 for the second child, EUR 131 for the third child, EUR 151.50 for the fourth child, and EUR 172 for the fifth and any subsequent child. Single parents are also paid a monthly family allowance supplement of EUR 36.60 per child.
2.5.3. Parental allowanceMaternity, paternity and parental allowances are paid on the basis of pregnancy, childbirth and childcare. Eligibility for parental allowance requires 180 days of residence in Finland immediately before the estimated date of birth. Corresponding insured periods in other European Union Member States also count towards this time. Parental allowance was granted to 145,400 beneficiaries in 2004, of whom 98,400 were women and 47,000 were men. Maternity allowance is paid to expectant mothers for the first 105 working days, after which parental allowance is payable for a further 158 working days to either the mother or the father. A father living in Finland is entitled to a paternity allowance payable for a maximum of 18 working days during the period of maternity allowance and parental allow-

36
ance. If parental allowance or partial parental allowance has been paid to the father for not less than the last 12 working days of the parental allowance period, then the paternity allowance may be extended for 1–12 working days.
The amount of parental allowance payable depends on earned income. Persons without income are paid the minimum allowance of EUR 15.20 per working day. Persons in the low and middle-income brackets receive a parental allowance of about 70 per cent of earnings.
The average parental allowance paid in 2004 was EUR 980 per month.On 17 March 2006 the principal labour market organisations agreed on an increase in
compensation for the costs of family leave. Under this agreement, maternity allowance will be increased to 90 per cent of earnings for the first 56 working days and the parental al-lowance paid to fathers will rise to 80 per cent of earnings for the first 50 working days.
2.6. Housing allowanceAccommodation is supported through various allowances that reduce the costs of housing: general housing allowance, housing allowance for pensioners and the housing supplement in student grants. The conscript’s allowance may also include a housing allowance. Reim-bursement for accommodation costs is paid to persons participating in labour market training. These benefits are administered by the Social Insurance Institution (Kela).
Housing allowances are means-tested benefits, and as reimbursements for costs incurred they are not taxable.
GeneralhousingallowanceHousing allowance is intended to ease the housing costs of persons on low incomes. The allowance is granted per household. Persons living permanently in the same dwelling are deemed to live in the same household. The household may include only persons living in Finland.
Housing allowance may be paid to persons living in rented, right-of-occupancy or owner-occupied dwellings. The allowance is 80 per cent of the reasonable housing costs exceeding the size of the household’s basic deductible. Housing costs include rent, monthly maintenance charges and part of the interest on housing loans, separately payable heating and water charges, and the costs of maintaining a detached house.
HousingallowanceforpensionersHousing allowance for pensioners may be paid to persons resident in Finland who are aged over 65 years or who are aged 16–64 years and receive a national pension or a survivor’s pension from the Social Insurance Institution (Kela) or pension support for long-term unemployment, special assistance for immigrants or a full disability, unemployment or individual early retirement pension from an authorised pension provider. Housing allowance may also be granted to a person receiving compensation for full disability on the basis of an accident at work, a traffic accident or a military injury.

Social Security in Finland | Income support 37
The housing allowance is 85 per cent of the reasonable housing costs exceeding deductibles.
HousingsupplementinstudentgrantsHousing supplement covers all students living in a rented or right-of-occupancy dwelling,
excepting families with children. Students may also receive a housing supplement for a dwelling rented for the purpose of studies and located in a district other than that of the family’s permanent dwelling. Housing supplement is granted to persons studying abroad on the same grounds as to persons studying in Finland.
This amounts to 80 per cent of the monthly rent or maintenance charge, but may not exceed EUR 210.60 per month (as of 1 November 2005). Housing allowance is determined individually and is means-tested.
2.7. Financial aid for studentsStudent financial aid seeks to ensure subsistence during periods of studying. It is administered by the Social Insurance Institution (Kela).
Financial aid for students for studies pursued in Finland may be paid to a Finnish citizen, to an employee from the European Union or European Economic Area, and to the spouse and dependent children thereof. Citizens of countries other than Finland are eligible if the claimant has lived in Finland for at least two years for a purpose other than studies and the residence in Finland can be considered permanent.
Student financial aid is paid for full-time studies after comprehensive school level, i.e. upper secondary school studies, vocational basic and supplementary education, and higher education degree studies.
Student financial aid comprises a study grant, housing supplement and student loans guaranteed by the State, together with student meal subsidies, travel subsidies for jour-neys to and from school, and loan interest assistance. The size of the study grant depends on the student’s age, housing and family situation, educational institution and economic circumstances. The study grant is means-tested and constitutes taxable income.
2.8. Other income support
2.8.1. Conscript’s allowanceThe conscript’s allowance seeks to ensure subsistence of the conscript’s family members during the period of military service. The individual conscript may be reimbursed for the costs of a dwelling at his disposal. The conscript’s allowance is administered by the Social Insurance Institution (Kela).
Eligibility for conscript’s allowance requires that the military service has reduced the

38
conscript’s ability to earn a living and that he is in need of assistance. Family members entitled to the allowance are the spouse, a common-law spouse with whom the conscript has a mutual child aged under 18 years, and the conscript’s own child or the spouse’s child aged under 18 years.
The conscript’s allowance may include a basic allowance, a housing allowance and a special allowance. The full basic allowance is equal to a full national pension.
The conscript’s allowance is not taxable.
2.8.2. Special assistance for immigrantsThis benefit ensures subsistence in old age and disability for immigrants living in Finland who would otherwise be in sustained need of local authority income support. Eligibility for the benefit requires that the claimant is at least 65 years of age or is unfit for work. The beneficiary must also have lived in Finland without interruption for at least five years before payment of the benefit begins. The special assistance may not exceed the full na-tional pension. It is a means-tested benefit, and its size depends on the income of both the claimant and the claimant’s spouse, and on their property. The special assistance is administered by the Social Insurance Institution (Kela). It is not taxable and is paid from State funds.
2.8.3. Pension support for long-term unemploymentPension support for long-term unemployment has been paid since 1 May 2005. The aim of this support is to move persons who are elderly and have been unemployed for a very long time out of the scope of unemployment security and into the scope of permanent income support. It is a condition for receiving this support that the person was born between 1941 and 1947 and was long-term unemployed on 31 December 2004. The pension support comprises a share of the person’s vested earnings-related pension earned by 31.12.2004 and a share of the national pension equal to the national pension. The pension support becomes payable at the end of the month when the person attains the age of 62 years. A person who has reached the age of 62 years before 1 May 2005 may be granted an old-age pension payable as of the said date that is equal to the pension support. Pension support is administered by the Social Insurance Institution (Kela).
2.9. Local authority income supportIncome support is an income security form of last resort, which supplements other forms of income security. It is a means-tested benefit temporarily granted and paid by the local authority social administration in order to ensure the subsistence of the claimant and the claimant’s family, and to promote the ability of the individual to cope independently. The basic component of local authority income support amounts to approximately 76 per cent of the full national pension. The basic component for a single person in 2006 was a maxi-mum of EUR 383 per month in the first category of local authority districts. Anyone whose

Social Security in Finland | Income support 39
own income and wealth and that of his or her family are insufficient to meet subsistence needs is entitled to income support. Finnish citizenship is not a condition of eligibility for this benefit. Expenditures that are eligible for income support comprise basic income support and supplementary income support. Compensation may also be paid for housing and health care costs and for other expenses.
The deductible portion of housing allowance will be abolished in income support as of 1 September 2006. Basic income support is intended to cover the costs of food and clothing, and minor health care outlays.
Unemployment, housing costs and low incomes are the most important reasons for claiming income support. Unemployed claimants account for about half of all households receiving income support.

40
3. Health-related social securityFinnish health care seeks to ensure health and medical care services for all residents of local authority districts, regardless of place of residence or economic situation. Regardless of residence, an employee may also be entitled to health and medical care services when arriving from a European Union Member State. Treatment may also be provided for persons arriving from other European Union Member States on the basis of the European Health Insurance Card. The services are based on public-sector (State and local authority) health care services that are mainly financed from tax revenues. These are supplemented by private health and medical care supported by the Social Insurance Institution (Kela). There is also a certain amount of private medical care insurance.
The overall costs of health and medical care accounted for a rising share of GDP during the 1970s and 1980s. However, this share fell slightly in the 1990s, and by 2003 was clearly below the average for the OECD countries. The overall costs of health care in 2003 were EUR 10.7 billion, which was 7.4 per cent of GDP, compared to an average in the OECD countries of 8.8 per cent.
3.1. Health servicesSpecialised medical care forms a substantial part of health services. The regional health districts (20) are responsible for arranging specialised medical care. Each local authority must be a member of the regional health district in its area.
Local authority health and care services based on the Primary Health Care Act seek to equalise the provision of primary health care services throughout the country.
The evolution of health and medical care reduced differentials in the use of health services between people in different income brackets since the 1960s. Since the mid-1970s non-institutional services have grown more rapidly than hospital services. However, by international standards the basis for Finnish health and medical care continues to lie in hospital and other institutional care. Even though the emphasis during the recession of the 1990s was on promoting non-institutional care, 40 per cent of all health and medical care expenses continue to be incurred in maintaining hospital wards.
Finns visit the doctor on average four times a year. Most of these visits in non-insti-tutional care occur in the public sector, as health centres account for about half of them and hospital outpatient wards for one fifth. The public sector increased its share during the 1990s.
Beside the local authority health services, there are also private-sector services such as private medical centres, hospitals, laboratories and physical therapy centres.
Most private-sector health services are in large cities, and slightly more than half of them provide physician or dental services. The private sector mainly offers specialist services, and its significance is also considerable in occupational health care. There are

Social Security in Finland | Health-related social security 41
users of private physician services throughout the country. 28 per cent of the population are reimbursed for private physician services each year.
3.2. Medical care supported by the national sickness insurance scheme
Sickness insurance compensates for loss of earnings due to illness by paying a per diem allowance for the period of illness. Sickness insurance also compensates for the costs of using certain private services. These include private medical and dental services, and laboratory, radiological and certain other examinations performed in the private sector. Compensation is also paid for treatment such as physiotherapy that is received in the private sector and prescribed by a physician. The costs incurred in using medicines and in travelling on account of illness are compensated regardless of whether they arise in connection with the use of private or public sector services.
CompensationforusingprivateservicesFor using the foregoing services the patient makes a co-payment that varies according to the type of service concerned. Sickness insurance compensates for the remainder of the expenses. A standard rate principle is applied when compensating for costs incurred in using private services, meaning that the compensation is determined as a certain percentage of the standard rate. The compensation is 60 per cent of the standard rate fee for private private medical and dental services and 75 per cent of the standard rate charge for examinations and treatment. In practice the patient is charged more than the standard rate for these services, which increases the proportion of co-payment.
Most, i.e. about 80 per cent of visits to private physicians that are covered by sickness insurance are visits to specialists.
ReimbursementformedicinesReimbursements for medicines are determined according to the illness concerned and the class of medicines that are used for treatment. The number of compensation classes increased to four at the beginning of 2006.
The largest, 100 per cent compensation may be received for medication that is essential for certain severe and chronic illnesses. Such illnesses include diabetes, epilepsy, glau-coma and cancers. This compensation class is known as the higher special compensation class. The compensation percentage in the lower compensation class is 72 per cent. This class includes medicines for hypertension, asthma, coronary heart disease and rheumatoid arthritis. To be eligible for special compensation the patient must request this from the Social Insurance Institution (Kela), generally appending the written opinion of a specialist physician concerning the severity of the illness.
Basic compensation is normally granted amounting to 42 per cent of the price of me-

42
dicines from the beginning of 2006. The basic compensation class includes medicines for gastric ulcers, antibiotics, inflammation analgesics and allergy medicines.
Some medicines are not eligible for compensation (the zero compensation class). These include most non-prescription medicines for self-medication, certain medicines of trivial therapeutic value and prescription medicines that the pharmaceutical enterprise does not wish to be included in the class of medicines that are eligible for compensation in order to be able to price them without official approval.
A ceiling has been specified for the annual co-payment payable by a patient, and when this ceiling is exceeded the patient receives all necessary medicines that are eligible for compensation until the end of the year on payment of a prescription charge of EUR 1.50 only. The ceiling is EUR 617 per calendar year in 2006.
TravelcompensationSickness insurance compensates for some of the travelling expenses incurred by a patient in connect in with medical treatment. The co-payment was EUR 9.25 per one-way journey in 2006. Compensation is paid in full for expenses exceeding this co-payment. The compen-sation is paid for the costs incurred in using the cheapest mode of transport. The annual co-payment has a ceiling of EUR 157.25, after which no further co-payment is payable.
3.3. Occupational health careThe organisation and implementation of occupational health care are governed by the Occupational Health Care Act. The aim of occupational health care is to achieve health and safety in work, the working environment and the working community, to prevent any health hazards or harm that are involved in work, and to maintain, promote and monitor the health and the working and functional capacity of employees at various stages in the working career.
Under the Sickness Insurance Act, an employer is entitled to reimbursement from the Social Insurance Institution (Kela) for the necessary and reasonable costs of arranging the occupational health care that is referred to in the Occupational Health Care Act. If, in addition to occupational health care, the employer has arranged medical care and other health care for employees, then the employer is also entitled to reimbursement for the costs so incurred. These services are free of charge to the employee.
Under an interim amendment to the Sickness Insurance Act, employers were reimbursed between 1 January 2002 and 31 December 2005 for 60 per cent of the costs incurred in the workplace investigations involved in preventive occupational health care and in preparing and revising a plan of action. This amendment sought to increase occupational health care measures at workplaces with a view to developing work, a working environment and a workplace community that are healthy and safe. From the beginning of 2006 the Sickness Insurance Act was amended to prescribe 60 per cent reimbursement for the total costs of preventive activities in occupational health care. The aim of this is for the increase in the

Social Security in Finland | Health-related social security 43
compensation level to enable more effective implementation of actions that are consistent with the good occupational health care practices referred to in the Occupational Health Care Act, in accordance with the needs of the workplace and in support of the health and working capacity of the working population. 50 per cent compensation is payable for the costs of medical treatment and other health care services.
Self-employed persons and others who work independently are entitled to reimbursement for the costs of their own necessary and reasonable occupational health care. Procurement of occupational health care services is voluntary for entrepreneurs. Pursuant to an amendment to the Sickness Insurance Act, from the beginning of 2006 self-employed persons are also entitled to reimbursement for the necessary and reasonable expenses not only of occupa-tional health care, but also of medical treatment and other health care that they arrange. The main condition for compensation is that the entrepreneur has arranged preventive occupational health care services for him or herself. This compensation is governed in applicable respects by the provisions that apply to employers. The compensation payable to an entrepreneur from the beginning of 2006 is 60 per cent of the costs of occupational health care and 50 per cent of the costs of medical treatment and other health care.
About 82 per cent of employees (1.7 million employees) were covered by occupational health care arranged by their employers in 2002. About 50 per cent of self-employed farmers and only about 10 per cent of other entrepreneurs were covered by occupational health care. With the exception of entrepreneurs, this is good coverage by international standards, however. The coverage of occupational health care is lowest in the construction and transport sector, in small workplaces and among self-employed persons. The costs of occupational health care that were approved for employers in 2002 amounted to some EUR 340.7 million, of which reimbursements totalling approximately EUR 153.1 million were paid to employers. The costs of occupational health care that were reimbursed to self-em-ployed persons in 2004 amounted to some EUR 2.2 million, of which reimbursements under the Sickness Insurance Act totalled approximately EUR 1.1 million and the State share of investigations of the working conditions of self-employed farmers was EUR 1.2 million.
The Social Insurance Institution (Kela) also reimburses the Finnish Student Health Service for arranging basic health care for students at universities and colleges.
3.4. Rehabilitation
BackgroundtorehabilitationThe role of the State in rehabilitation was a modest one until the 1940s, and chiefly con-cerned the upkeep of tuberculosis sanatoria and certain hospitals. Only after the Second World War did the question of invalids lead the State to lend quite fresh support to invalid care and thereby also to rehabilitation. Efforts have been made in recent years to regulate necessary public rehabilitation with optimal detail and clarity in legislation stressing the rights and equality of the person undergoing rehabilitation as a recipient of services. The

44
2004 amendment to the statute governing vocational rehabilitation arranged by the Social Insurance Institution and authorised earnings-related pension providers meant that this activity continues almost solely between the said two parties.
Rehabilitation seeks to promote the ability of persons with disabilities or diminished working capacity to cope with their work, and to support their reintegration into work, social functions and independence. It is organised as part of general services and the social insurance system. This means that rehabilitation is an activity of many administra-tive sectors. The conditions for receiving rehabilitation and the services and benefits of rehabilitation continue to be governed largely by the rehabilitation legislation of 1991. The most important reform of rehabilitation legislation in recent years was the amendment to the earnings-related pension laws that took effect in 2004 and prescribed the right of an employee to vocational rehabilitation.
RehabilitationactivitiesinhealthcareThe rehabilitation functions of local authority health services are stipulated in the Primary Health Care Act, the Specialised Medical Care Act and the Mental Health Act. These laws require local authorities to provide the medical rehabilitation that is required by local residents. Medical rehabilitation includes counselling, investigations of the need and availability of rehabilitation, therapies and rehabilitation periods, instrument services, adaptation training and rehabilitation guidance.
RehabilitationfunctionsofsocialwelfareThe general function of local authority social welfare services is to promote and maintain the safety and functional capacity of individuals, their families and their communities. Their special functions are prescribed in legislation on child welfare, care of intoxicant abusers, and services for the mentally handicapped and the disabled. It is also a function of social services to arrange rehabilitation and other measures promoting employment placement of handicapped persons.
The 2001 Rehabilitating Work Experience Act requires local authorities and local em-ployment offices to collaborate in preparing an individual plan of activation and services for their unemployed clients and to arrange rehabilitative work experience for the long-term unemployed and for recipients of labour market subsidy or income support.
RehabilitationarrangedbytheSocialInsuranceInstitution(Kela)The rehabilitation that is arranged by the Social Insurance Institution is prescribed in the Social Insurance Institution Rehabilitation Benefits and Rehabilitation Act and Re-habilitation Allowances Act, which took effect on 1st October 2005. The Social Insurance Institution (Kela) arranges vocational and medical rehabilitation.
The Social Insurance Institution arranges vocational rehabilitation for the disabled if working capacity and opportunities for gainful employment have substantially deteriorated due to illness, disorder or handicap or if it is probable that without vocational rehabili-

Social Security in Finland | Health-related social security 45
tation a person would retire on a disability pension within about five years due to illness or handicap.
The Social Insurance Institution may arrange medical rehabilitation for severely disabled persons aged under 65 years if an illness or handicap causes, for at least one year, substantial impediment or strain in coping with everyday activities at home or school, or in working life and other life situations outside of public institutional car.
The Social Insurance Institution arranges discretionary rehabilitation including vo-cationally orientated medical rehabilitation (ASLAK®) to maintain the working capacity of persons at work, psychotherapy, individual rehabilitation periods, adaptation courses, rehabilitation courses for classes of illness and rehabilitation therapy mainly for persons of working age and for those who are already working.
In 2004 the rehabilitation expenses of the Social Insurance Institution amounted to EUR 287 million and a total of 86,170 people received rehabilitation services. Rehabilitation allowance was granted to 60,000 beneficiaries.
Earnings-relatedpensionrehabilitationThe aim of rehabilitation in earnings-related pension legislation is for the employee or entrepreneur to be able to continue working or to return to work in spite of illness, disor-der or handicap. Since 2004 an insured person has been eligible for vocational rehabili-tation where a risk of incapacity to work has been verified and this risk may be reduced by appropriate rehabilitation. This rehabilitation is individual vocational rehabilitation. Authorised pension providers are primarily responsible for vocational rehabilitation of the adult population that is established in working life.
The pension provider pays a rehabilitation allowance for the rehabilitation period to a person entering rehabilitation directly from working life. The rehabilitation allowance is equal to a full disability pension under earnings-related pension legislation, plus a supplement of 33 per cent.
Nearly 6,300 people were involved in earnings-related pension rehabilitation in 2004 and EUR 36 million was used for this purpose.
OtherrehabilitationA person undergoing rehabilitation is paid a full per diem allowance or industrial injuries pension under the Industrial Accident Insurance Act for the period of rehabilitation. Motor insurance compensation continues in the normal way during the rehabilitation period. Re-habilitation expenditure under accident and motor insurance amounted to EUR 31 million in 2004 and 1,800 people received rehabilitation services.
Employment administration rehabilitation is mainly intended for unemployed persons and disabled persons who are at risk of unemployment, and for disabled persons outside of the labour market.

46
3.5. Benefits for the disabledThe benefits paid to disabled persons are child disability allowance, regular disability allow-ance and pensioners’ care allowance. The Social Insurance Institution (Kela) is responsible for administering these benefits. Child disability allowance is granted to disabled children living in Finland. Residence in Finland is also a condition of eligibility for disability allow-ance and pensioners’ care allowance.
3.5.1. Disability allowance and child disability allowanceDisability allowance seeks to provide financial support in their everyday life, work and studies mainly to disabled persons of working age other than those who are retired. The allowance is paid to persons aged 16–64 years whose functional capacity is impaired due to illness or handicap. Disability allowance is paid on three levels: basic allowance, higher-rate allowance and special-rate allowance. The allowance was paid to 26,000 persons in 2004.
A disability pension under the National Pensions Act and a full disability pension under earnings-related pension legislation or an individual early retirement pension are impediments to eligibility for disability allowance. A person receiving a benefit for disability under the Industrial Accident Insurance Act, the Motor Insurance Act or the Military Injuries Act is also not eligible for disability allowance.
Child disability allowance may be granted to disabled or chronically ill children aged under 16 years. The allowance is paid at three different rates according to the strain of caring for the child: basic allowance, higher-rate allowance and special-rate allowance. Child disability allowance was paid to 39,000 persons in 2004.
Child disability allowance and regular disability allowance are not paid to persons in public institutional care.
These two allowances are of equal size, varying between EUR 78 and EUR 340 per month as of 2006. A special monthly dietary grant of EUR 21 may also be paid as part of the disability allowance.
The size of the child disability allowance and regular disability allowance are not affected by earnings or wealth. They are not taxable, and are linked to the cost-of-living index.
3.5.2. Pensioners’ care allowancePensioners’ care allowance supports the upkeep and care at home of a sick or disabled person, and reimburses special costs arising from the illness or handicap.
The allowance is payable to claimants resident in Finland who are 65 years old, or to those under 65 years of age who receive a disability pension, rehabilitation allowance or individual early retirement pension. A further condition of eligibility is that the person’s functional capacity has been impaired due to the illness or handicap.
Receipt of benefits based on the need for assistance and paid under the Industrial Accident Insurance Act, the Motor Insurance Act and the Military Injuries Act are imped-iments to eligibility for care allowance. Pensioners’ care allowance is also not paid to persons in institutional care.

Social Security in Finland | Health-related social security 47
Pensioners’ care allowance is scaled into three groups based on the need for assistance and the size of special costs. The monthly rates payable in 2006 varied between EUR 53 and EUR 261, and the allowance was paid to 181,200 beneficiaries in 2004. A special monthly dietary grant of EUR 21 may also be paid as part of the allowance. The care allowance is not taxable.

48
4. Social servicesUnder the Social Welfare Act, local authorities are responsible for arranging social services for their residents. This duty may be discharged through local authority social services provision, subsidised service provision or other arrangements. Social services include social work, child guidance and family counselling, home help services, housing services, institu-tional care, family care, child welfare, children’s day-care and informal care allowance, as well as care for intoxicant abusers. The Social Insurance Institution (Kela) also pays child care allowances as an alternative to children’s day-care services.
Among the various services for children and families, this discussion will focus on children’s day-care and family subsidies for day-care. Services for the elderly include serviced housing, old people’s homes, care at the in-patient wards of health centres, and regular domiciliary care services. The informal care allowance that supports domiciliary care will be examined in greater detail herein.
Local authorities are responsible for financing these services. This finance is largely covered by local tax revenues, supplemented by central government transfers to local government and fees. Local authorities in Finland are entitled to levy taxes, and such taxation is an important source of income.
4.1. Children’s day-careChildren’s day-care means arranging day-care for children in nurseries, as family day-care, as play activities or in the form of other day-care operations.
All children under school age (seven years) are entitled to a full-time place in a nursery or in family day-care arranged by the local authority. Entitlement to day-care begins when the period of maternity, paternity and parental allowance under the Sickness Insurance Act ends, and it continues until the child starts comprehensive school. If the child parti-cipates in pre-school education before starting comprehensive school, then day-care may be arranged on a part-time basis.
The day-care fee is income-related, and the maximum monthly fee for one child was EUR 200 in 2006.
A total of 185,781 children were in day-care in 2004 (54 per cent of children aged between 1 and 6 years)2, of whom 128,128 attended nurseries and 57,653 were in family day-care. 2,404 local authority nurseries and 603 private day-care centres were operating in 2004. Pre-school education was attended by 57,199 children, of whom 44,865 were in pre-school education provided by day-care institutions.
2 The present figures in statistics compiled by the National Research and Development Centre for Welfare and Health (STAKES) are proportioned for children aged from 1 to 6 years, as only about 1–2 per cent of children aged under one year are cared for outside of the home.

Social Security in Finland | Social services 49
4.2. Children’s day-care subsidiesChildren’s day-care subsidies are paid in the form of a cash allowance for arranging day-care for children. The allowance is an alternative to day-care arranged by the local authority. The Social Insurance Institution (Kela) is responsible for administering this allowance. Besides the statutory allowance, a local authority may pay its own allowance to families as a “local authority supplement”. Children’s day-care subsidies are paid in the form of a child home care allowance and a private day-care allowance. No family may receive both child home care allowance and private day-care allowance at the same time.
It is a condition of receiving children’s day-care subsidy that the child is not in local authority day-care.
The right of parents to choose between local authority day-care services and children’s day-care subsidy begins when the period of parental allowance ends, and it continues until no later than the last day of July in the year when the child starts comprehensive school.
4.2.1. Child home care allowanceChild home care allowance is a “family benefit” under the European Community Social Security Regulation (1408/71), which means that actual residence of the child in Finland cannot be a condition for granting this benefit to a person moving between the Member States of the European Union. The benefit is primarily payable to family members of an employee from the country of employment, even when the family members in question live in another European Union country.
The child home care allowance includes a care allowance and a care supplement. The care allowance is paid for each child separately. The monthly allowance in 2006 for one child aged under 3 years was EUR 294, plus a further EUR 84 for each following child aged under 3 years and EUR 50 for other children under school age.
The care supplement is income-related, and is only paid for one child. The care supple-ment may not exceed EUR 168 per month (2006).
The average monthly child home care allowance paid per family in 2004 was EUR 334.
4.2.2. Private day-care allowancePrivate day-care allowance is paid to a private provider of day-care for arranging day-care for a child under school age as assigned by the parents. The allowance is paid for each child in the family from the end of the period of parental allowance until the child starts comprehensive school. If the family has children aged under 3 years, then it may choose between child home care allowance and private day-care allowance.
The private day-care allowance may be paid as a care allowance and a care supplement for each child under school age. EUR 137 per month in care allowance is paid for each child under school age (2006). The care supplement is income-related. It is paid for a child

50
under school age, and may not exceed EUR 135 per month (2006). The average private day-care allowance per family in 2004 was EUR 167 per month.
4.2.3. Partial care allowanceCare allowance may also be paid as a partial monthly allowance of EUR 70 (2006) if the parents reduce their working hours to no more than 30 hours per week on account of child care. This allowance may be paid to the parents of a child under 3 years of age and to children in the first and second grade and participating in compulsory pre-school education.
4.3. Informal care allowanceInformal care allowance refers to the fees payable to carers and services to support the care of an elderly person or a disabled or ill person at home. Informal care allowance may be granted when a person needs care and assistance due to diminished functional capacity, illness, disability or some comparable reason, and it is possible to arrange care in the person’s home by agreeing this with family members or relatives of the person concerned and through the necessary services. Informal care allowance may be granted on the basis of both temporary and long-term need for care.
The informal care allowance in Finland is an official, statutory social service, financed with local authority participation. Local authorities may also receive central government transfers to local government in order to finance the informal care allowance.
Under a law that took effect at the beginning of 2006, the term informal care denotes the organisation of treatment and care of an elderly, handicapped or sick person under domestic conditions with the aid of a relative or another person who is close to the per-son cared for. The term informal care allowance denotes a package of necessary services provided to the person cared for, together with care fees, leave and informal care support services that are provided to the informal carer.
Informal care allowance is financed by local authorities, and is an expenditure falling within the scope of the imputed statutory State subsidy.
Informal care allowance is usually provided in the form of cash and services. The mini-mum size of the allowance in 2005 was EUR 233.56 per month. With the new legislation the minimum care fee rose to EUR 300 per month. The informal care fee is not less than EUR 600 during the therapeutically onerous transition period when the informal carer must take a short leave of absence from work. No income testing is required for the allowance, which instead depends on the disabled person’s need for assistance.
An agreement on informal care allowance is concluded between the informal carer and the local authority, and a plan of care and services is always appended to this agree-ment. The term informal care agreement denotes an assignment agreement on the care arrangements concluded between the carer and the local authority that is responsible for arranging the care.
Social Security in Finland | Social services 51
28,732 persons were covered by the informal care allowance in 2004, of whom 65 per cent were aged over 65 years. This means that informal care allowance is mainly a form of home care allowance for the elderly.
4.4. Geriatric servicesGeriatric services provide for the needs of persons aged over 65 years and seek to sustain and improve their ability to manage their lives independently. The principal geriatric services are domiciliary services and institutional care for the elderly (old people’s homes and care at health centre in-patient wards). Local authority domestic help was provided to 83,790 pensioner households in 2003. Serviced housing for the elderly covered 25,206 persons, 19,990 persons lived in old people’s homes and 11,334 persons were cared for at health centre in-patient wards. 6.8 per cent of the population aged over 65 years was covered by institutional and housing services in 2003.
4.5. Care of intoxicant abusersCare services for intoxicant abusers seek to prevent and diminish the abuse of alcohol, narcotics and other intoxicants and the incidence of related social problems, and to promote the functional ability and security of intoxicant abusers and their families.
Under the Care of Alcohol and Drug Abusers Act local authorities must arrange care of intoxicant abusers of a content and scope reflecting the need arising within their districts. Care services for intoxicant abusers must be arranged both by developing general social welfare and health services and by providing special care services for intoxicant abusers. These services must primarily be arranged as non-institutional care services open to vo-luntary enrolment. When providing services the client must also be assisted in resolving any problems pertaining to income, housing and employment.
Care services for intoxicant abusers are provided as non-institutional basic social welfare and health services at various points of service, including health centres, social welfare offices and mental health offices, in the course of occupational health care, student health services and day centres, and as institutional care in special health care functions, inclu-ding hospital in-patient wards and psychiatric units. Special care services are provided for intoxicant abusers as non-institutional care services at outpatient clinics for intoxicant abusers and short-term treatment centres for young drug abusers, and institutional care services at detoxification centres and rehabilitation units. Housing services are arranged both as general social welfare services and at halfway houses and residential housing services for intoxicant abusers. In recent years some services have been developed in Fin-land that are intended particularly for narcotics abusers, including medical detoxification, replacement therapy and maintenance care for opiate addicts and low-threshold services at health advisory points for narcotics abusers, at which clients may also exchange needles

52
and syringes.Some 43,000 people attended outpatient clinics for intoxicant abusers and about 5,300
sought help at short-term treatment centres for young drug abusers in 2004. About 10,400 people used the services of low-threshold health advisory points for narcotics abusers. Institutional detoxification and rehabilitation units treated about 11,400 people. Most of the clients were male.

Social Security in Finland | Social expenditure and financing 53
5. Social expenditure and financing3
5.1. Social expenditurePublic social expenditure includes statutory pensions and employer-specific supplementary pensions, sickness insurance compensation, expenditure on statutory rehabilitation and occupational health care, expenditure on unemployment benefit, income support for families with children, including parental allowance, housing allowance, income support and the costs of providing health and social services. The portion of expenses that is paid by the client of public services is not included in social expenditure.
Financial aid to students is not counted in social expenditure, even though this is a part of income security. Financial aid to students is counted as education expenditure, as obviously are the costs of providing educational services. Total public education expenditure in Finland is currently about 6 per cent of GDP. All education from pre-school to university level is free of charge in Finland.
The following discussion will examine social expenditure by function in relation to GDP. For example, geriatric expenses will include old-age pensions and the costs of domiciliary services and long-term geriatric care.
Figure 4. Public social expenditure by function as a percentage of GDP in 1960–2004 (Ministry of Social Affairs and Health 2005).
%
5
10
15
20
25
30
35
2004200019951990198519801975197019651960
Administration
Other social security
Housing
Unemployment
Families and children
Surviving spouses andother close relatives
Handicap
Sickness and health
Old age
3 This chapter was written by Jorma Jauhiainen, Pertti Pykälä and Reijo Vanne.

54
Social expenditure constituted 27 per cent of GDP in 2004. This represented growth of 4.3 percentage points in 20 years. The ageing of the population has not yet increased expenditure to any significant degree. Expenses associated with old age have been the largest cost item since the beginning of the 1970s. Old age expenditures were 7.0 per cent of GDP in 1984 and 8.6 per cent of GDP in 2004.
Before the 1970s the costs of medical care and preventive health care were the lar-gest social expenditure item, and these still remain the second largest. These expenses account for 6.6 per cent of GDP. This represents growth of only 0.3 percentage points in 20 years.
The growth in outlays associated with old age is mainly due to maturation of the earnings-related pension system, meaning that that an increasingly large portion of the career of retired persons occurs after legislation on earnings-related pensions took effect, until all retired persons have accrued a pension during their entire career.
The third largest expenditure item is costs associated with disability, but these have remained stable over the last 20 years at 3.4 per cent of GDP.
Besides outlays associated with old age, only unemployed-related social expenditure has increased substantially in relation to GDP over the 20-year period. Unemployment expenditures were 1.3 per cent of GDP in 1984 and 2.7 per cent of GDP in 2004. This diffe-rence is primarily due to the higher unemployment rate in 2004. The relationship between unemployment outlays and GDP and its share of social expenditure peaked in 1993. Their proportion of GDP at this time was 5.4 per cent.
Outlays pertaining to families and children are the fourth largest social expenditure item at 3 per cent of GDP. This represents growth of 0.5 percentage points in 20 years.
Figure 5. Public social expenditure by function at 2004 prices in 1960–2004 (Ministry of Social Affairs and Health 2005).
%
5
10
15
20
25
30
35
40
45
2004200019951990198519801975197019651960
Administration
Other social security
Housing
Unemployment
Families and children
Surviving spouses andother close relatives
Handicap
Sickness and health
Old age
The volume of social expenditure has increase 14-fold in 44 years. The rate of growth in real costs averaged over 10 per cent until the mid 1970s. The relative growth rate has

Social Security in Finland | Social expenditure and financing 55
tended to fall since this time. Growth came to a full stop only in the latter half of the 1990s, when the unemployment outlays that had increased greatly during the recession were falling again. Even since the year 2000 the relative rate of growth has been clearly slower than during the 1980s, for example.
5.2. Financing of social expenditureThe sources of financing of public social expenditure are usually examined according to the direct and nominal payer, and by the type of financing. The expenditure is financed directly by the State, local authorities, employers, and insured individuals. The share of financing paid by the State and local authorities is naturally further dispersed through taxation to other sources in society at large. Nor is it necessarily the nominal payer that will ultimately be affected, for example, by an extra burden, because the imposition of new charges will mean that economic agents change their behaviour within the limits permitted under market conditions.
Public social expenditure is financed in Finland by taxes, parafiscal charges, insurance contributions and client co-payments. All but the last of these are included in the taxes per GDP, which is the ratio of the total statutory taxes and charges collected and payable to the public administration in any given year to the GDP for the same year.
Client co-payments are paid for public services, meaning that there is a connection between the co-payment and the benefit. However, the co-payment is not necessarily related to the cost of providing the service. An insurance contribution, on the other hand, is related to the expected benefit, insofar as the greater the liability for insurance contributions is, the larger the benefit will be. Also in public schemes employers pay insurance contributions in order to insure their employees. As for parafiscal charges, there is no relation between the individual and the benefit or expected benefit, but earmarked charges are, however, paid to the public administrative unit responsible for the benefit scheme concerned. There are no earmarked charges in financing from tax revenues.
Public statutory social security in Finland also involves considerable funding of con-tributions to prepare for future expenditure. In the private sector earnings-related pension scheme there are investment assets serving as coverage for pension liability, i.e. for future pension expenditure, and as a buffer against insurance, investment and cyclical risks. In the public sector earnings-related pension scheme there are large buffer funds to provide for the increase in the number of pensioners in proportion to the size of the working po-pulation. There is a buffer fund in the earnings-related unemployment security scheme in case of cyclical fluctuations, and in the national pension and sickness insurance schemes in order to maintain liquidity.
As social security schemes are classified as funded schemes and pay-as-you-go systems, the risk, cyclical and liquidity buffers are not considered funding by a narrow definition, and thus schemes other than the private sector earnings-related pension scheme are entirely pay-as-you-go systems in the narrow sense. Private sector earnings-related pensions are
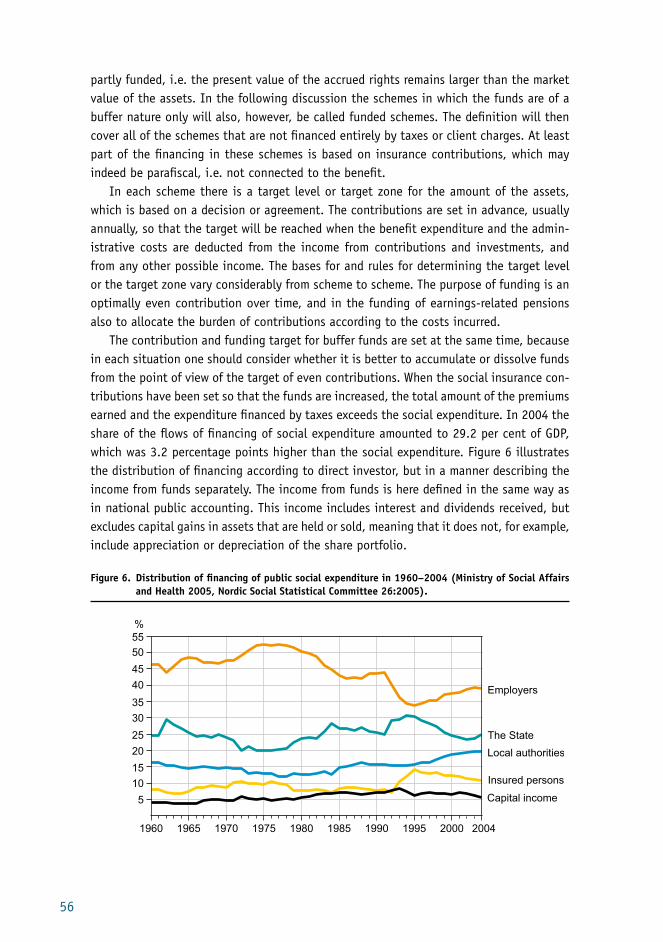
56
partly funded, i.e. the present value of the accrued rights remains larger than the market value of the assets. In the following discussion the schemes in which the funds are of a buffer nature only will also, however, be called funded schemes. The definition will then cover all of the schemes that are not financed entirely by taxes or client charges. At least part of the financing in these schemes is based on insurance contributions, which may indeed be parafiscal, i.e. not connected to the benefit.
In each scheme there is a target level or target zone for the amount of the assets, which is based on a decision or agreement. The contributions are set in advance, usually annually, so that the target will be reached when the benefit expenditure and the admin-istrative costs are deducted from the income from contributions and investments, and from any other possible income. The bases for and rules for determining the target level or the target zone vary considerably from scheme to scheme. The purpose of funding is an optimally even contribution over time, and in the funding of earnings-related pensions also to allocate the burden of contributions according to the costs incurred.
The contribution and funding target for buffer funds are set at the same time, because in each situation one should consider whether it is better to accumulate or dissolve funds from the point of view of the target of even contributions. When the social insurance con-tributions have been set so that the funds are increased, the total amount of the premiums earned and the expenditure financed by taxes exceeds the social expenditure. In 2004 the share of the flows of financing of social expenditure amounted to 29.2 per cent of GDP, which was 3.2 percentage points higher than the social expenditure. Figure 6 illustrates the distribution of financing according to direct investor, but in a manner describing the income from funds separately. The income from funds is here defined in the same way as in national public accounting. This income includes interest and dividends received, but excludes capital gains in assets that are held or sold, meaning that it does not, for example, include appreciation or depreciation of the share portfolio.
Figure 6. Distribution of financing of public social expenditure in 1960–2004 (Ministry of Social Affairs and Health 2005, Nordic Social Statistical Committee 26:2005).
5
10
15
20
25
30
35
40
45
50
55
Capital income
Local authorities
The State
Insured persons
Employers
2004200019951990198519801975197019651960
%

Social Security in Finland | Social expenditure and financing 57
From 1960 onwards the employers’ share of financing reached its highest level in 1972–1979 when the share exceeded 50 per cent (the highest level was 52 per cent). The share paid by insured persons doubled rapidly in the period 1991–1994, increasing from 7 per cent to 14 per cent. The most important reason for this was the employee’s earnings-related pension and unemployment insurance contributions introduced in 1993. The shares of the State and the employers have generally moved in opposite directions. The proportion of income from funds has been relatively stable.
5.3. Pensions
5.3.1. Total pension expenditureBesides the earnings-related pensions of the private and public sectors and the national pensions, total pension expenditure includes pension benefits paid under the Military Injuries Act, the Industrial Accident Insurance Act and the Motor Liability Insurance Act. Early retirement pensions for farmers, such as farmers’ early retirement aid, are also included in total pension expenditure. Figure 7 shows pension expenditure by scheme in relation to GDP.
Figure 7. Share of pension expenditure in GDP in 1960–2004 (Social Insurance Institution statistical yearbooks, 1973–2004).
%
Other
Kela pensions
Public sector
Privat sector
EARNINGS-RELATEDPENSIONS
2
4
6
8
10
12
14
16
2004200019951990198519801975197019651960

58
The share of total pension expenditure in GDP was approximately 11.6 per cent in 2004, of which the pensions paid by the Social Insurance Institution (Kela) amounted to about 1.8 percentage points and statutory earnings-related pensions to around 9 percentage points.
The earnings-related pensions accrue on the basis of length of working career and earnings. This means that it takes a very long time before the effects of legislative amend-ments can be seen. For example, the entry into force of the Employees’ Pensions Act (TEL) continues up to about 2040 in the sense that only by then will all retired persons have been able to accrue a full pension under the Act during their careers in active employment. The Employees’ Pensions Act took effect back in 1962, however.
The share of the earnings-related pension expenditure in GDP started to decrease after the recession of the 1990s, due to both rapid economic growth and cuts in benefits. The renewed increase in this share after the year 2000 was due to sluggish economic growth and the changing age structure of the population. However, the proportion of retired persons in the 55–59 year age group that is most crucial from the point of view of early retirement has continually fallen since the end of the 1980s. The same trend has also prevailed in the 60–64 year age group since the mid 1990s. An important, if not the only reason for this was an increase in the minimum age limits for various early retirement schemes.
The figures in figure 7 also include employer-specific supplementary pensions. This is why the private sector also had earnings-related pension expenditure even before 1962. Nowadays, these pensions are paid in a sum corresponding to approximately 0.3 per cent of GDP.
Benefits are paid to a lesser extent on the basis of voluntary individual pension insurance than of employer-specific supplementary pensions. Voluntary insurance has, however, only become common during the last decade. About one fifth of all persons of working age have voluntary insurance. Contribution revenues are about 0.5 per cent of GDP and this income has increased more rapidly than GDP.
5.3.2. Earnings-related pension insuranceAt the end of 2004 there were 1,232,000 beneficiaries of earnings-related pensions, of whom 1,057,000 drew a private-sector earnings-related pension and 513,000 received a public-sector earnings-related pension. It is possible for a person to receive both a public-sector and a private-sector pension at the same time.
The principal provisions governing the financing principles of earnings-related pensions stipulate the manner of determining the share of the pension contribution to be funded and the share used for the pay-as-you-go component in various earnings-related pension laws, and how to divide the total contribution between employers and employees with respect to work falling within the scope of the said laws. Table 1 shows the level of contributions according to various pension laws in 1990–2005.

Social Security in Finland | Social expenditure and financing 59
Table 1. Earnings-related pension contributions as a percentage of the earnings of insured persons in 1990–2005.
Employees State share of expenditure in the private sector 2005, %
Pensions Act Average total contributionEmployee contribution
1990 1995 2000 2005 1995 2000 2005
Employees’ Pensions Act – TEL 16.9 20.6 21.5
21.6 (19.7–23.3)
4.0 4.7 4.6/5.8 -
Temporary Employees’ Pensions Act – LEL 18.1 21.8 22.2 22.7 4.0 4.7 4.6/5.8 -
Performing Artist and Certain Employee Group Pensions Act – TaEL
14.8 15.0 17.0 19.6 4.0 4.7 4.6/5.8 -
Seamen’s Pensions Act – MEL 16.0 18.0 20.0 22.0 9.0 10.0 11.0 33
State Employees’ Pensions Act – VEL .. 23.5 23.5 23.5 4.0 4.7 4.6/5.8 -
Local Government Pensions Act – KuEL 18.0 24.1 26.4 28.3 4.0 4.7 4.6/5.8 -
Evangelical-Lutheran Church Pensions Act – KiEL
12.4 31.0 31.731.7 (31.0–32.8)
4.0 4.7 4.6/5.8 -
Self-employed
Basic contribution Average
Pensions Act 1990 1995 2000 2005 1995 2000 2005
Self-Employed Persons’ Pensions Act – YEL 16.9 20.2 21.0 21.4/22.6 17.3 19.1 20.1 8
Farmers’ Pensions Act – MYEL 16.9 20.2 21.0 21.4/22.6 8.3 10.4 10.8 86
The employee’s pension contribution had not yet been introduced in 1990. Under the State Employees’ Pensions Act (VEL), the contribution was not determined on the basis of wages and salaries in 1990, but pensions in payment were financed from tax revenues.
In work covered by the Employees’ Pensions Act (TEL) the final total contribution de-pends on how many employees the employer has who are covered by the Act, on the age of the employees, and on the bonuses granted by the authorised pension provider. The bonuses depend on the pension provider’s investment income and solvency. The figures in the table include both the funded component and the pay-as-you-go component. The pay-as-you-go component is used for pensions payable during the year in question. Each pension payable contains a funded component calculated on the basis of funding rules, and the fund is dissolved in proportion to the funded component when the pension is paid. The rest of the pension is financed from the pay-as-you-go system.
The average level of the contribution used for the pay-as-you-go system is determined jointly within the private sector, i.e. in the Employees’ Pensions Act (TEL), the Temporary

60
Employees’ Pensions Act (LEL), the Self-Employed Persons’ Pensions Act (YEL) and the Farmers’ Pensions Act (MYEL). The contribution currently used for the pay-as-you-go sys-tem is about 16 per cent of earnings, and this contribution finances the index increases accumulated at various stages in the pensions payable under these laws, two-thirds of the old-age pensions accrued between the ages of 18 and 54 years, old-age pensions accrued between the ages of 55 and 64 years, and the preserved and vested rights of disability and unemployment pensions in their entirety. Part-time pensions and survivor’s pensions are also financed by the pay-as-you-go system.
In the private sector the other elements of the pension are financed by the funded contribution, i.e. one-third of old-age pensions accrued between the ages of 18 and 54, and the initial amount of disability and unemployment pensions, i.e. the pension before indexation. Besides the pay-as-you-go component, the earnings-related pension contri-bution includes an old-age, disability and unemployment component, the sizes of which are determined actuarially so that future funded pension components can be financed by these and by annual revenues of the size of the discount rate (3 per cent annually). The total contribution differs between the various private-sector pension laws because life expectancy, disability and unemployment risks vary between industries. The average life expectancy is taken into account when determining which component of the contribution to use for funding the old-age pension. When life expectancy increases, the contribution rises, and thus the funding rate does not decrease.
The increase in assets resulting from income from investments covering funded pension components in the private sector corresponds to the increase in pension liabilities. Pension liability is increased by at least 3 per cent annually, and old-age pension liability by a further age-dependent coefficient that is determined by the Ministry of Social Affairs and Health. Age-dependent revision of liability can be used to regulate the rate of dissolution of pension funds. If a pension provider’s income from assets is smaller than the discount rate plus the specified increase in old-age pension liability, then the pension provider must transfer assets from its previously accumulated investment risk buffer or solvency margin as coverage for the pension liability. This decreases the solvency of the pension provider. The specifiable increase in old-age pension liability depends on the average solidity of private sector earnings-related pension providers, i.e. on the size of the investment risk buffer in relation to pension liabilities. As high incomes thus increase average solidity in the short term, the rate of growth in pension liabilities lags behind the income rate.
If the average income from assets is sufficient for increased liabilities, then a larger portion of future pensions can be financed from savings than would be possible without these transfers. The pay-as-you-go component and the contribution will decrease corres-pondingly in the future. Under the Finnish system, the income from pension assets is used to reduce the contribution, and not to increase the pension level as in defined contribution schemes. Correspondingly, poorer investment income primarily means larger contributions, and not smaller pensions.

Social Security in Finland | Social expenditure and financing 61
The funding rate for private sector employee pensions is currently about 30 per cent when calculated as the proportion of investment assets in the current value of pensions in payment or pension rights accrued up to the time of calculation. The probable time of payment and duration of the pension paid on the basis of the accrued rights is taken into account when calculating the current value.
It has not been possible to raise the level of the contribution for farmers’, self-employed persons’ and seamen’s pensions as far as the ratio of the number of pensioners to the number of persons in employment requires. This means that the pensions accrued from work under the Farmers’ Pensions Act (MYEL), the Self-Employed Persons’ Pensions Act (YEL) and the Seamen’s Pensions Act (MEL) are partly financed by the State, and this proportion is estimated and determined annually at the time of the State budget.
The funded component in the public sector is not determined actuarially on the basis of risks, but on the basis of long-term strategies concerning the balance of financing in the pension schemes under the Local Government Pensions Act (KuEL) and the State Em-ployees’ Pensions Act (VEL). The most important factor to be considered in these strategies is to keep the contribution as even as possible, or at least to increase it over time as the ratio of the number of pensioners to the number of persons in employment increases. The funding rules in the private sector also lead to an even development of contributions in comparison with the hypothetical situation in a purely pay-as-you-go system. The greatest element of uncertainty with respect to the development of contributions in the public sector and to the dimensioning of the funded component derives from the projected share of public service provision in the growing need for services arising, for example, from the ageing of the population.
At the end of 2005 the total assets of earnings-related pensions amounted to EUR 102.7 billion, i.e. to approximately 66 per cent of GDP in 2005. EUR 46.4 billion of these assets were invested in securities and EUR 38.7 billion were invested in shares. Invest-ments located in Finland amounted to EUR 31.4 billion, investments elsewhere in the euro currency zone were EUR 42.1 billion and investments outside of the euro currency zone totalled EUR 29.2 billion.
The current private sector coverage and solidity provisions have been in force since the beginning of 1997. The real annual average income from private sector earnings-related pension assets over the period 1997–2005 was about 5.5 per cent. Funding of the local government pension system began in 1988, and the real annual income from investments has been about 4.3 per cent throughout the funding period. The long-term payment calcu-lation for earnings-related pension contributions is based on a real average annual income of 3.5 per cent in the private sector and 4 per cent in the local government scheme.
The evolution of the contribution under the Employees’ Pensions Act (TEL) (figure 8) shows two periods when the contribution has been stable, the early years in the 1960s (5 per cent) and the last decade (about 21 per cent). Between 1970 and 1996 the cont-ribution increased by approximately 16 percentage points.

62
Figure 8. Average earnings-related pension contribution under the Employees’ Pensions Act (TEL) (total employer and employee share) as a percentage of wages in 1962–2006.
2
4
6
8
10
12
14
16
18
20
22
24
200520001995199019851980197519701965
%
The employee contribution was introduced in all earnings-related pension schemes in 1993. Initially this was 3 per cent of the wage. The employer’s contribution was corres-pondingly reduced. The employee’s earnings-related pension contribution was 4.6 per cent (employees aged under 53 years) or 5.8 per cent (employees aged 53 years or more) of pay in 2005. At the time of the reform in earnings-related pension that took effect at the beginning of 2005 a larger earnings-related pension contribution began to be collected from employees and entrepreneurs aged 53 years and over than from younger employees and entrepreneurs. For work under the Seamen’s Pensions Act (MEL), however, the cont-ribution is always 11 per cent of the wage, which matches the employer’s contribution. According to an agreement between labour market organisations, future changes in the contribution under the Employees’ Pensions Act (TEL), the Temporary Employees’ Pensions Act (LEL) and the Performing Artist and Certain Employee Group Pensions Act (TaEL) will be divided equally between the employer and the employee.
5.3.3. National pension insurance762,000 beneficiaries were receiving a national pension at the end of 2004. 664,000 of these received a national pension proportional to the earnings-related pension. The remaining just under 100,000 national pensions were paid as a pure housing allowance, pensioners’ care allowance, front-line veterans’ supplement or child increase. Of the national pensions proportional to the earnings-related pension, 74 per cent were old-age pensions, 23 per cent were disability pensions and the rest were unemployment pensions. The total national pension insurance expenditure was EUR 2,989 million in 2004.
In 2004 national pension insurance was financed by employers’ insurance contributions, State subsidies, a share of value added tax revenues, and income from the assets of the Social Insurance Institution (Kela) (see table 3). Since 1993 a sum granted by Parliament each year has been transferred from value added tax revenues to the national pension

Social Security in Finland | Social expenditure and financing 63
insurance fund. This share was EUR 400 million in 2004. From 2006 onwards value added tax revenues will no longer be credited to the Social Insurance Institution.
Table 2. The bases for the national pension insurance contribution in 1990–2006 (%).
1990 1995 2000 2005 2006
Insured persons 1.55 0.55 - -
Employers
Private sector1*
Class I 3.40 2.40 2.40 1.366 0.898
Class II 4.45 4.00 4.00 3.566 3.098
Class III 5.05 4.90 4.90 4.466 3.998
Public sector
Central government 3.95 3.95 3.95 3.966 1.948
Local authorities and parishes
3.95 3.95 3.15 2.416 1.948
In 2006 the State finances housing allowances for pensioners, survivor’s pensions, front-line veterans’ benefits, disability allowances and child disability allowances in full, and 40 per cent of the costs of national pensions that are proportional to earnings-related pensions.
To ensure the liquidity of the national pension insurance fund, the net current assets of the fund must amount to at least 4 per cent of the fund’s total expenditure at the end of the year. If the income does not suffice to finance the expenditure, then the State pays the remainder as a “guarantee payment”. No guarantee payment was needed in 1999–2001 or 2003, but the reduction in employers’ insurance contributions meant that a guarantee payment of EUR 102 million was needed in 2004. The State may also have to remit a temporary payment in order to secure liquidity when the fund’s assets have fallen to the minimum level.
* The contribution class for private employers depends on the depreciation of enterprise assets.
Table 3. Distribution of income from national pension insurance in 2004.
Income MEUR Share of income, %
Insurance contributions 1,335.7 46.3
State share of benefits 1,127.9
Share of VAT revenues 400.0 39.1
Income from assets 22.1 0.8
Total 2,885.7 100.0

64
5.4. Sickness insuranceThe total expenditure on sickness insurance in 2004, including rehabilitation administered by the Social Insurance Institution (Kela), amounted to EUR 3,372 million. Expenditure on national sickness allowance was EUR 670 million and expenditure on parental allowance was EUR 635 million.
Reimbursement of medicine costs in 2004 amounted to EUR 1,015 million, and 20.6 million co-payments were made by clients. The co-payments made by insured persons covered an average of 34 per cent of the costs of medicines for which compensation was paid. Sickness insurance covered 62 per cent, local authorities 21 per cent and clients 17 per cent of the overall costs of medicines in 2003. The private sector accounted for about 22 per cent of the visits to a physician in outpatient care. The Social Insurance Institution (Kela) reimbursed a total of EUR 65 million to 1,497,000 insured persons for physician fees paid in the private sector in 2004 and the co-payment covered 70 per cent of expenses. 1,029,000 insured persons were reimbursed a total of EUR 95 million in dental surgeon fees and co-payments covered 64 per cent of expenses. EUR 56 million was reimbursed in costs for services provided by medical examination and medical care institutions in the private sector and the co-payment covered 67 per cent of expenses. EUR 141 million was paid in travelling expenses. Reimbursement for occupational health care services amounted to a total of EUR 185 million and the co-payment covered 13 per cent of expenses.
The rehabilitation expenses of the Social Insurance Institution (Kela) in 2004 amounted to EUR 287 million. EUR 228 million was spent on individual rehabilitation, and EUR 59 million was disbursed in rehabilitation allowances. 86,000 persons were reimbursed for rehabilitation services, of whom 17,500 received vocational rehabilitation for persons with impaired working capacity, 21,300 received medical rehabilitation for severe disabilities, and 49,500 received discretionary rehabilitation. Rehabilitation allowance was paid to 60,400 persons. The distribution of rehabilitation costs among other parties is explained in section 5.5.
Sickness insurance was financed in 2004 by contributions paid by insured persons and employers, by State subsidies, by a share of value added tax revenues, by payments from insurance providers pursuant to the “full compensation” principle, and by other income (see table 5).
The costs of minimum payments of parental allowances and the medical expenses of Finnish citizens who have fallen ill in countries with which Finland has concluded a social security agreement are fully financed by the State.
EUR 600 million in VAT revenues were allocated to the sickness insurance fund in 2004. Between 1999 and 2004 a payment of EUR 51.6 million per year has been collected from insurance providers for transfer to the sickness insurance fund in compensation for treat-ment at health centres of persons falling within the scope of motor liability and industrial accident insurance. Other income includes income from assets and recovery payments.
Up to the end of 2005 the net current assets of a sickness insurance fund had to amount to no less than 8 per cent of the fund’s total expenditure at the end of the year in order

Social Security in Finland | Social expenditure and financing 65
to safeguard the liquidity of the fund. Where necessary, the State paid any shortfall as a “guarantee payment”. The size of the guarantee payment has increased annually since 1998 due to the shortage of financing caused by reducing the contributions of the insured. In 2004 the guarantee payment was approximately EUR 711 million. The State may also have to remit a temporary payment in order to secure liquidity when the fund’s assets have fallen to the minimum level.
In recent years assets have been transferred between the national pension insurance fund and the sickness insurance fund, i.e. the minimum level of one fund has been secured by the assets exceeding the minimum level of the other fund. In 1995–1997 assets were transferred from the sickness insurance fund to the national pension insurance fund, and in 1999–2001 assets were transferred from the national pension insurance fund to the sickness insurance fund. These transfers reduced the guarantee payment from the State.
Expenditure on sickness insurance in 2004 exceeded income by EUR 681 million.The financing of sickness insurance was reformed as of the start of 2006. Sickness insurance
was financially divided into earned income insurance and medical expenses insurance. Earned income insurance pays sickness allowance, parental allowance, rehabilitation allowance and the costs of occupational health care. Medical expenses insurance finances reimbursement of medical care expenses, rehabilitation outlays and a share of the costs of the Finnish Student Health Service. The estimated costs of earned income insurance in 2006 were EUR 1,820 million and the costs of medical expenses insurance were EUR 1,980 million.
As of 2006 VAT revenues are no longer remitted as part of the financing of sickness insurance.
The State finances minimum per diem allowances from earned income insurance and a share of the costs of occupational health care for the self-employed. The employers finance 73 per cent and employees and self-employed persons 27 per cent of benefit expenses. The State finances 50 per cent of the costs of medical expenses insurance and a share of the medical care expenses of persons from European Union Member States. Employees and self-employed persons finance 36.9 per cent and beneficiaries finance 13.1 per cent
Table 4. The bases for the sickness insurance contribution in 1990–2005 (%).
1990 1995 2000 2005
Insured persons* 1.70 1.90 1.50 1.50
Employers 1.45 1.60 1.60 1.60
Private sector 1.45 1.60 1.60 1.60
Public sector
Central government 2.70 2.85 2.85 2.85
Local authorities and local authority federations
3.95 2.85 1.60 1.60
Parishes 4.20 7.85 1.60 1.60
* The employee contribution in 1995 was 3.8 per cent of the proportion of the annual salary exceeding EUR 13,500. The pensioners’ contribution was 3 per cent higher in 1995 and 1.7 per cent higher in 2000. There was no increase in the pensioners’ contribution in 2005.

66
of benefit expenses. The operating costs of sickness insurance are divided between the financing parties. Ultimately the State safeguards liquidity.
Table 5. Distribution of income from sickness insurance in 2004.
Income MEUR Share of income, %
Insured persons 987.5 36.7
Employers 984.0 36.6
State share of benefits 38.8 1.4
Share of VAT revenues 600.0 22.3
Insurance providers 51.6 1.9
Other income 18.3 1.1
Total 2,690.2 100.0
Table 6. The bases for the sickness insurance contributions in 2006.
Insurance contributions Contribution percentage in 2006
Earned income insurance
Employers 2,06
Employees and self-employed 0,77
Medical expenses insurance
Employees and self-employed 1,33
Beneficiaries 1,50
4 The Finland´s Slot Machine Association – RAY is a public law association that raises funds through gaming to support work by voluntary social welfare and health organisations. The members of RAY include 97 national social welfare and health sector organisations.
5.5. RehabilitationRehabilitation expenditure in 2000 was EUR 1,213 million, of which the share of income protection amounted to EUR 100 million. The largest expenditure items were the reha-bilitation costs of the public health services (EUR 241 million), of the Social Insurance Institution (Kela) (EUR 225 million), and of social welfare services (EUR 143 million). Other rehabilitation expenditure comprised remedial teaching in comprehensive schools, the labour administration, vocational remedial and special education, rehabilitation of disabled war veterans, rehabilitation of front-line veterans, support from the Finnish Slot Machine Association – RAY4, rehabilitation granted by authorised pension providers and rehabilitation under industrial accident insurance and motor liability insurance.
Of total rehabilitation expenditure in 2000, the State accounted for 40 per cent, local authorities for 38 per cent, employers for 10 per cent, insured persons for 10 per cent, and clients for 2 per cent.
Rehabilitation expenses in 2004 amounted to approximately EUR 1,300 million.

Social Security in Finland | Social expenditure and financing 67
5.6. Unemployment benefitA total of EUR 2,884 million was disbursed in compensation for periods of unemployment
during 2004. This expenditure chiefly comprised earnings-related unemployment allowance (EUR 1,470 million), basic unemployment allowance (EUR 123 million), labour market subsidy (EUR 1,009 million), benefits paid during training (EUR 200 million) and job alternation compensation (EUR 64 million). 295,900 beneficiaries received labour market subsidy or basic unemployment allowance in 2004. 285,000 persons received earnings-related unemployment allowance in the same year.
Unemployment funds collect insurance contributions and are responsible for administering earnings-related unemployment allowance. All employees also pay an unemployment in-surance contribution collected by the Unemployment Insurance Fund.
The unemployment insurance contribution finances part of unemployment benefit ex-penses and upkeep of the unemployment insurance buffer. The unemployment insurance buffer amounted to EUR 219 million at the end of 2004. Employees paid a total of EUR 134 million and employers EUR 979 million in insurance contributions in 2004.
The State finances the whole of the minimum income security scheme for the unemployed and the portion of the earnings-related unemployment allowance corresponding to basic unemployment allowance. The State’s share of the basic unemployment allowance is, how-ever, reduced by the share paid by the Unemployment Insurance Fund corresponding to the unemployment insurance contribution for persons not belonging to an unemployment fund. This share amounted to EUR 26 million in 2004. From the beginning of 2006 local authorities will also be liable for financing unemployment security. Local authorities will finance half of the passive period expenses of labour market subsidy lasting for longer than 500 days.
5.5 per cent of earnings-related unemployment allowances are financed by the unem-ployment funds. The Unemployment Insurance Fund finances the remainder of the earnings-related unemployment allowances after the State and the unemployment funds have paid their respective shares.
Table 7. Unemployment insurance contributions as a percentage of wages.
Year 2000 2005 2006
Employees 1.0 0.25 0.58
EmployersFor the portion of the payroll exceeding EUR 0.84 million.
0.9 0.6 0.75
3.451 2.51 2.951

68
5.7. Income support of families with childrenA total of EUR 1,429 million in family allowances was paid in 2004, and 1,040,000 children were entitled to a family allowance at the end of the year. A total of EUR 359 million was disbursed in childcare subsidies, and there were an average of 84,000 beneficiaries of these subsidies during the year. Maternity grant expenditure was EUR 11.1 million, and 57,400 mothers received this grant. Three-quarters of these beneficiaries chose to receive the grant in the form of a maternity package containing baby clothes and other childcare items.
The State finances family allowances and maternity grants as tax-exempt income. Local authorities finance the costs of child home care allowance and private day-care allowance with the exception of child home care allowance paid for children living abroad, which is paid by the State.
5.8. Housing allowance and financial aid for students
EUR 436 million was paid in general housing allowance in 2004, and 159,300 households had received a housing allowance by the end of the year.
Expenditure on financial aid for student5 was EUR 731 million, and the average number of beneficiaries in 2004 was 242,700.
The State finances the general housing allowance and financial aid for students.
5.9. Conscript’s allowance, special assistance for immigrants and pension support for long-term unemployment
EUR 14.4 million was disbursed in conscript’s allowances, and 12,300 households received this allowance in 2004.
EUR 15 million was disbursed in special assistance for immigrants in 2004, with a total of 3,605 beneficiaries by the end of the year.
5 Outlays on financial aid for students are not counted as social expenditure but educational expenses.
Table 8. Shares in financing unemployment security in 2004.
Income MEUR Share, %
Unemployment funds 82.3 3.1
Central government 1,740.8 65.2
Unemployment Insurance Fund
846.3 31.7
Total 2,669.5 100.0

Social Security in Finland | Social expenditure and financing 69
Between May and December a total of EUR 16 million was paid in earnings-related and national pension shares of pension support for long-term unemployment and a total of EUR 4 million was disbursed in pensioners’ housing allowance and national pensions for persons over 62 years of age retiring on old-age pension in 2005. 2,789 people received a share of the earnings-related pension, 2,672 people received a share of the national pension, and there were 777 recipients of national pension who had retired on old-age pension at the end of 2005.
The State finances the share of earnings-related and national pension in pension support for long-term unemployment, conscript’s allowance and special assistance for immigrants.
5.10. Income supportIncome support was paid to 251,000 households in 2004. There were 401,000 people living in these households. The average monthly number of beneficiary households was 116,000. Households received income support for an average of 5.5 months. Expenditure on income support amounted to EUR 459 million. The income support scheme is financed by local authorities.
5.11. Health and social servicesServices account for more than 9 percentage points of the share of total social expenditure (approximately 27 per cent) in GDP. Table 9 shows social expenditure by function and the share of services by function in 2004.
Social expenditure excluding administrative costs amounted to approximately EUR 39,2 billion in 2004, of which the cost of services was about EUR 13.5 billion.
Local authorities play a key role in providing and financing health and social services, and taxation is an important source of financing. Funding is not used in the public finan-cing of social and health security, and so the expenditure is equal to the financing that is needed and collected.
The costs of providing local authority health and social services amounted to EUR 13.5 billion in 2004. The total cost of health care and medical treatment arranged by local author-ities was EUR 6.7 billion. Local authorities spent EUR 2.7 billion on providing institutional care, home-help and other services for the elderly and the disabled. The costs of children’s day-care and other services for families with children amounted to EUR 2.8 billion. Local authority outlays for other social services amounted to EUR 1.4 billion.
Half of the costs of local authority health and social services are the cost of health services, 20 per cent of service outlays are incurred in services for the elderly and handi-capped and 20 per cent are incurred in providing services for families with children. Besides

70
providing services included in public social expenditure, health and social services are produced by organisations, i.e. in the form of ”third-sector” service provision and as free market services. Private service providers, meaning organisations and businesses, provided nearly one quarter of health and social services in 2004.
Co-payments made by clients finance 6 per cent of local authority health and social service outlays. Local authorities received a statutory State subsidy covering 25 per cent of the costs of arranging health and social services.
Figure 9. Distribution of financing of public health and social services expenditure in 1990–2005 (Ministry of Social Affairs and Health 2005).
Table 9. Social expenditure and the share of services by function in 2004 (Ministry of Social Affairs and Health).
EUR billion Share of services, %Sickness and health 10.0 81
Disability 5.1 26
Old age 13.0 11
Surviving spouses and other close relatives
1.4 0
Families and children 4.5 44
Unemployment 4.0 12
Housing 0.4 100
Other social security 0.8 44
Administration 1.3 -
Total 40.5 35
10
20
30
40
50
60
70
80
90
100
Clients
Employers
Insured persons
The State
Local authorities
20042002200019981996199419921990
%

Social Security in Finland | Outlook for social security 71
6. Outlook for social securityFinnish social security as a whole took shape after the Second World War, and was im-portant in smoothing the transition from an agrarian society to a service and industrial society. Finland developed relatively rapidly into a Nordic welfare state, and the country’s social security reached the Nordic level by the end of the 1980s. In the early 1990s Finland plunged into the most severe economic recession since the Second World War. However, thanks to the comprehensive social security system it was possible to maintain social unity, a reasonable income for the people and adequate services. Despite the cuts of the 1990s, Finnish health and social security is still of an average standard compared to other European countries. Social security seeks to secure a minimum income and a reasonable level of consumption during illness, unemployment, incapacity for work, loss of parent or guardian and old age, and to ensure adequate health and social services.
The Nordic welfare model based on the principle of social mutuality is the basis for Finnish social security reforms. The ongoing changes in the operating environment for social security also have an impact on the social security system and its future financing. The principal changes are ageing of the population, globalisation of operating conditions, structural changes in households and the labour market, and the impact of European integration.
Figure 10. Finnish population by age and gender in 2003 and 2030 (EUROSTAT population forecast 2005).
Men Men WomenWomenAge2003 2030
Age
Population, thousands100200 100 200 100200 100 200
1–56–10
11–1516–2021–2526–3031–3536–4041–4546–5051–5556–6061–6566–7071–7576–8081–8586–9091–
1–56–10
11–1516–2021–2526–3031–3536–4041–4546–5051–5556–6061–6566–7071–7576–8081–8586–9091–
An examination of changes in the age structure of the population in 2001 and 2030 indicates that the age structure of the Finnish population is changing substantially. The baby boom generations born in 1945–1955 will reach retiring age in 2010–2020. The proportion of the population over 65 years of age will rise from 16 per cent to 28 per cent by 2030 (see figure 10). As life expectancy increases, the number of persons who have

72
reached the age of 80 will more than double by 2030. Women will also continue to live longer then men. According to the basic calculations of the SOMERA Commission – which investigated trends in social expenditure and safeguarding social security financing in the long-term – the ageing of the population will increase the share of social expenditure in GDP by about 5 percentage points reckoned from the present level in 30 years’ time, and the share will stabilise at this level. The reform of the earnings-related pensions system that took effect in 2005 will reduce this increase by approximately one percentage point, leaving an increase of four percentage points.
Figure 11. Dependency ratio of elderly persons in 2004, 2025 and 2050 in the present EU countries. Number (percentage) of persons of 65 years of age in proportion to the number aged 15–64 (EUROSTAT).
2004 2025 2050
2004 2025 2050
European Union average
%0 10 20 30 40 50 60 70
ItalyGermanySwedenGreece
BelgiumFrance
PortugalSpain
United KingdomEstonia
LatviaFINLAND
AustriaHungaryDenmarkLithuaniaSlovenia
LuxembourgThe NetherlandsCzech Republic
MaltaPolandCyprusIreland
Slovakia
The population is clearly ageing throughout the territory of the European Union over the next few decades (see figure 11). According to calculations made by the European statistical agency EUROSTAT, the number of persons aged 65 years or more will rise in pro-portion to those aged 15–64 (the dependency ratio of the elderly) in the present European Union area from 24 per cent to 36 per cent in 25 years and thereafter to 49 per cent by 2050. The rate of ageing varies from country to country. Finland is an exception in this comparison, however. By 2025 the dependency ratio of the elderly will increase most in Finland, but thereafter up to 2050 it will increase least by comparison with the whole of the present European Union area.
Economic globalisation – the more liberal global mobility of goods, services and capital – has provided new opportunities for the Finnish business community. At the same time globalisation involves significant uncertainty factors, and providing for these requires broadly-based preparation. This will require modification of social security into more of an instrument for adaptation to change than hitherto. Globalisation also appears to affect

Social Security in Finland | Outlook for social security 73
the tax base, and especially the structure of capital and business taxation, which may lead to a deterioration of the financial basis of the welfare state particularly with respect to taxation. An issue of greater principle is that of the extent to which the social dimension of globalisation should be reinforced through political guidance and common agreement.
The structural change in the labour market has been less thorough than was anticipated in the 1990s, to the extent that this is measured in terms of atypical employment, for example in temporary and part-time work. In spite of a clear shift, there seems to be no continuing trend towards an atypical labour market. However, it has led to the emergence of a problem of the working poor. In addition to this, a long working career seems to require increasingly long-term and ongoing education and more efficient measures to harmonise work and family life. The proportion of one-parent families and one-person households will probably rise, causing increased demand for services.
While regional migration has tailed off to some extent from the trend of the 1990s, it would appear that net migration from rural areas into larger settlements is continuing. The significance of migration in regional population development will be further emphasised in future when the natural population change in the regions becomes negative. Immigration increased rapidly in the 1990s, with a fourfold rise in the number of immigrants. At the same time there have been changes in the reasons for immigration. While migration in the early 1990s was often for humanitarian reasons, chiefly arising from refugeehood, its character had changed by the first decade of the new century. Immigration for the purpose of work has emerged alongside humanitarian immigration, and its importance will grow. This means that an immigration policy based on employment could form part of the re-sponse to the increased demand for labour arising from changes in the age structure of the population. One problem with this is that similar strategies will also be followed in other countries with an ageing population. Integration of an immigrant population will also generate significant expenses for the public economy in the medium term. These changes in migration and immigration will also cause pressures on social security, and especially residence-based health and social security. However, these are transition period expenses. In the long term the changes will strengthen the durability of the public economy and the financial basis of social policy by improving the efficiency of the labour market and increasing productivity.
The reform of earnings-related pensions seeks to maintain a relatively even rate of earnings-related pension contributions despite the changing age structure of the population and the increase in life expectancy. The pension reform enables a clarification of pension legislation, increases fairness and public freedom of choice, and curbs pressures to increase pension contributions. It seeks to maintain current levels in the relationship between the income of pensioners and that of the working population. Furthermore, by staying longer in the labour market, insured persons will be able to improve their pension to wage ratio compared to the outcome under pre-reform provisions. It is felt that these measures will enable the Finnish pension system to adjust to the challenges of an ageing population.
Finnish residence-based minimum benefits have been of a fairly modest standard in
74
international terms. Furthermore, due to cuts made in minimum benefits towards the end of last decade, some of these benefits have fallen behind the general trend in wages and earnings-related benefits. Their real value has also fallen. At the same time, the need for income protection, and particularly labour market subsidy, has remained high as a result of widespread and prolonged unemployment. Unemployment and social security cuts have forced minimum benefit claimants to rely quite extensively on local authority income support that was intended to be a benefit of last resort.
The effects of European integration on the Finnish social security system may be described in three different ways. In the first place, regulations governing the free mobility of labour and the right of citizens of the European Union and their families to move between and reside in the territories of the Member States may increase the use of social security in Finland. As migration flows increase the residence-based or Nordic social security systems will guarantee more extensive social rights to immigrants and so it will be a challenge to guarantee security to the entire population. Secondly, implementation of free mobility of services may affect how the provision and organisation of public services is regulated in Finland. This issue is particularly important from the point of view of regulating the balance between the market and social security. Thirdly, under certain circumstances Economic and Monetary Union in the European Union may affect how the public economy is stabilised when it runs into deficit. In all of these cases international solutions seeking to balance and harmonise European processes and strategies and the special characteristics of national social security attain a decisive status.
In accordance with the government programme, family allowances were increased at the beginning of 2004 and 2005 saw increases in national pensions, child home care al-lowance and minimum sickness benefit, maternity, paternity and parental allowances. In the course of preparing the 2006 budget the government agreed on measures to improve the situation of the worst off members of the population. The seven per cent deductible in housing costs for persons on income support will be abolished on 1 September 2006 and a general increase of five euros will be made in the national pension at the same time. This increase will benefit both recipients of the national pension alone and low-income pensioners receiving both the national pension and an earnings-related pension.
The most important challenges for minimum income security are to make the system clearer and more straightforward, and to ensure a solid financial basis for minimum benefits. The aim in recent years has been for non-income-related benefits to be financed from tax revenues, while financing of insurance benefits is based on social security contributions paid by employers and employees. In accordance with this policy, changes have been made in the financing shares of various parties and the basis for determining certain earnings-related benefits has been revised.
In certain cases, however, insurance contributions have not sufficed to ensure balanced financing, which has led to an increase in State guarantee payments. The financing of sickness insurance was revised from the start of 2006 in order to correct an imbalance in this form of insurance. This reform divided sickness insurance financially into earned

Social Security in Finland | Outlook for social security 75
income insurance and medical expenses insurance. Expenditure on daily allowances paid from earned income insurance is funded through State financing of minimum daily allowances and financing of other daily allowances by employers and insured persons. Medical expenses insurance is financed jointly by insured persons and the State.
The health of the population in Finland has improved over the last 20 years. As the population ages and the baby boom generations reach retiring age, the need for health and social services will grow, and this trend will continue until the 2020s. Despite this positive trend, increased life expectancy and improved health result in higher morbidity and need for care. The demand for services is also growing as the clientele becomes more affluent and requirements and individual needs increase.
The public sector will retain primary responsibility for providing health and social ser-vices. The State and local authorities will be responsible for ensuring that the population receives equitable local authority health and social services, irrespective of place of resi-dence. The State will have to ensure that local authorities enjoy adequate conditions for service provision. Local authorities will have a duty to ensure that the services provided are appropriate and of a high standard.
The share of private-sector and third-sector services in future service provision will increase. These will enable consolidation of the financial basis for services, improve their availability and flexibility, and enhance the functionality of health and social services.
The ability of the private and public sectors to meet the need for health and social services will depend on the available human resources, on the functionality and productivity of public services, on the operating conditions for private services, and on the effectiveness of co-operation between primary health care and specialised services.

76
Relevant links on the World Wide Web
National Public Health Institutewww.ktl.fi
National Research and Development Centre for Welfare and Health (STAKES)www.stakes.fi/english/
Finnish Network for European Social Policy Research (EUSO)http://www.stakes.info/euso/Englishindex.htm
Statistics Finlandwww.stat.fi
Finnish Institute of Occupational Health (FIOH)www.occuphealth.fi


![FSD2273 Finnish Local Government 2004: Inhabitants 2004 · The bibliographic citation for this codebook: Finnish Local Government 2004: Inhabitants 2004 [codebook]. Finnish Social](https://img.dokumen.tips/doc/110x75/5f82f79d5704f30f6924e8fd/fsd2273-finnish-local-government-2004-inhabitants-2004-the-bibliographic-citation.jpg)

![FSD2292 EVA Survey on Finnish Values and Attitudes 2006 · EVA Survey on Finnish Values and Attitudes 2006 [codebook]. Finnish Social Science Data Archive [producer and distributor],](https://img.dokumen.tips/doc/110x75/5ed7658c88ad9966ea656f89/fsd2292-eva-survey-on-finnish-values-and-attitudes-2006-eva-survey-on-finnish-values.jpg)