Embed Size (px)
Citation preview
Chapter 16 SOARING WEATHER
While horse racing may be the "Sport of Kings," soaring may be considered the "King of Sports." Soaring bears the relationship to flying that sailing bears to power boating. Soaring has made notable contributions to meteorology. For example, soaring pilots have probed thunderstorms and mountain waves with findings that have made flying safer for all pilots. However, soaring is primarily recreational.
A sailplane must have auxiliary power to become airborne such as a winch, a ground tow, or a tow by a powered aircraft. Once the sailcraft is airborne and the tow cable released, performance
of the craft depends on the weather and the skill of the pilot. Forward thrust comes from gliding downward relative to the air the same as thrust is developed in a power-off glide by a conventional aircraft. Therefore, to gain or maintain altitude, the soaring pilot must rely on upward motion of the air.
To a sailplane pilot, "lift" means the rate of climb he can achieve in an up-current, while "sink" denotes his rate of descent in a downdraft or in neutral air. "Zero sink" means that upward currents are just strong enough to enable him to hold altitude but not to climb. Sailplanes are highly
171
r efficient machines; a sink rate of a mere 2 feet per second provides an airspeed of about 40 knots, and a sink rate of 6 feet per second gives an airspeed of about 70 knots. Some two-place training craft have somewhat higher sink rates.
In lift, a sailplane pilot usually flies 35 to 40 knots with a sink rate of about 2 feet per second. Therefore, if he is to remain airborne, he must have an upward air cUll-rent of at least 2 feet per
second. There is no point in trying to soar until weather conditions favor vertical speeds greater than the minimum sink rate of the aircraft. These vertical currents develop from several sources, and these sources categorize soaring into five classes: ( 1) Thermal Soaring, (2) Frontal Soaring, (3) Sea Breeze Soaring, (4) Ridge or Hill Soaring, and (5) Mountain Wave Soaring.
THERMAL SOARING
Peter Dixon estimates that about 80 percent of all soaring in the U.S. depends on thermal lift.* What is a thermal? A thermal is simply the updraft in a small-scale convective current. Chapter 4 in the section "Convection," and chapter 9 in the section, "Convective Currents," explain the basic principle of convective circulation. The explanations are adequate for the pilot of a powered aircraft; but to the soaring pilot, they are only a beginning.
All pilots scan the weather pattern for convective activity. Remember that turbulence is proportional to the speed at which the aircraft penetrates ad-
*Peter L. Dixon. SOARING, page 129; 1970; Ballantine Books, New York City.
jacent updrafts and downdrafts. The fast moving powered aircraft experiences "pounding" and tries to avoid convective turbulence. The slower moving soaring pilot enjoys a gradual change from thermals to areas of sink. He chases after local convective cells using the thermals for lift.
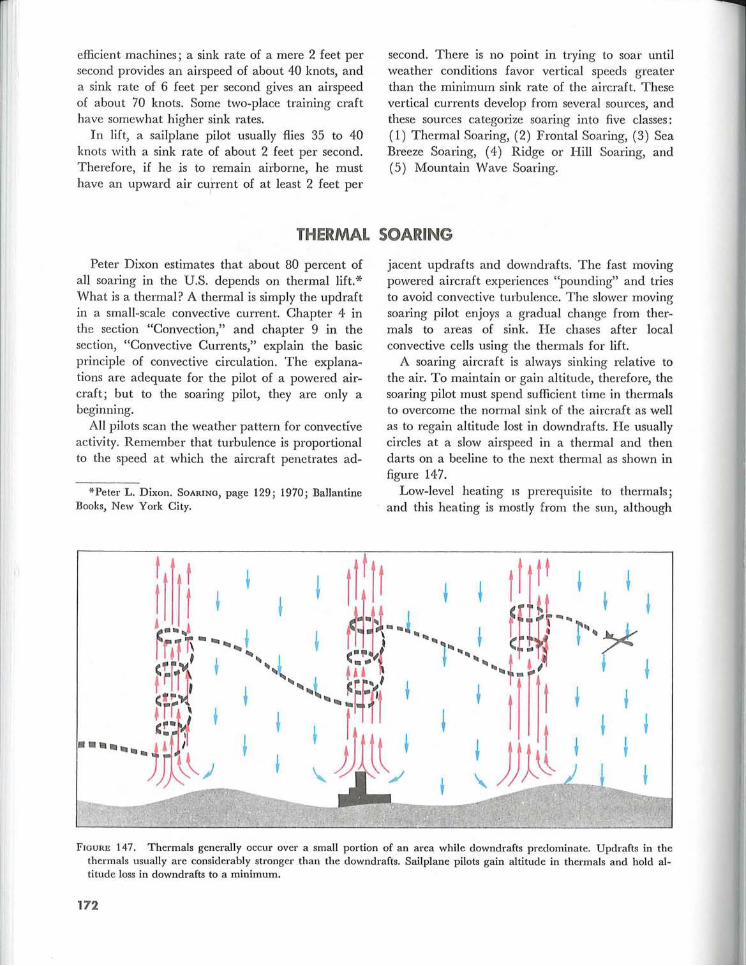
A soaring aircraft is always sinking relative to the air. To maintain or gain altitude, therefore, the soaring pilot must spend sufficient time in thermals to overcome the normal sink of the aircraft as well as to regain altitude lost in downdrafts. He usually circles at a slow airspeed in a thermal and then darts on a beeline to the next thermal as shown in figure 147.
Low-level heating IS prerequisite to thermals; and this heating is mostly from the sun, although
FIGURE 147. Thermals generally occur over a small portion of an area while downdrafts predominate. Updrafts in the thermals usually are considerably stronger than the downdrafts. Sailplane pilots gain altitude in thermals and hold altitude loss in downdrafts to a minimum.
172
it may be augmented by man-made heat sources such as chimneys, factories, and cities. Cool air must sink to force the warm air upward in thermals. Therefore, in small-scale convection, thermals and downdrafts coexist side by side. The net upward displacement of air must equal the net downward displacement. Fast rising thermals generally cover a small percentage of a convective area while slower downdrafts predominate over the remaining greater portion as diagrammed in figure 147.
Since thermals depend on solar heating, thermal soaring is restricted virtually to daylight hours with considerable sunshine. Air tends to become stable at night due to low-level cooling by terrestrial radiation, often resulting in an inversion at or near the surface (see chs. 3 and 6). Stable air suppresses convection, and thermals do not form until the inversion "burns off" or lifts sufficiently to allow soaring beneath the inversion. The earliest that soaring may begin varies from early forenoon to early afternoon, the time depending on the strength of the inversion and the amount of solar heating. Paramount to a pilot's soaring achievement is his skill in diagnosing and locating thermals.
LOCATING THERMALS Since convective thermals develop from uneven
heating at the surface, the most likely place for a thermal is above a surface that heats readily.
Types of Terrain Surfaces When the sky is cloudless, the soaring pilot must
look for those surfaces that heat most rapidly and seek thermals above those areas. Barren sandy or rocky surfaces, plowed fields, stubble fields surrounded by green vegetation, cities, factories, chimneys, etc., are good thermal sources. A pilot learns through experience the most favorable spots in his local area. But terrain features are only part of the story; time of day influences not only when thermals form but also where.
Sun Angle Angle of the sun profoundly affects location of
thermals over hilly landscapes. During early forenoon, the sun strikes eastern slopes more directly than other slopes; therefore, the most favorable areas for thermals are eastern slopes. The favorable areas move to southern slopes during midday. In the afternoon, they move to western slopes before they begin to weaken as the evening sun sinks
toward the western horizon. For example, if a rocky knob protrudes above a grassy plain, the most likely area of thermals is over the eastern slope in the forenoon and the western slope in the afternoon. Once a pilot has sighted a likely surface, he may look for other visual cues.
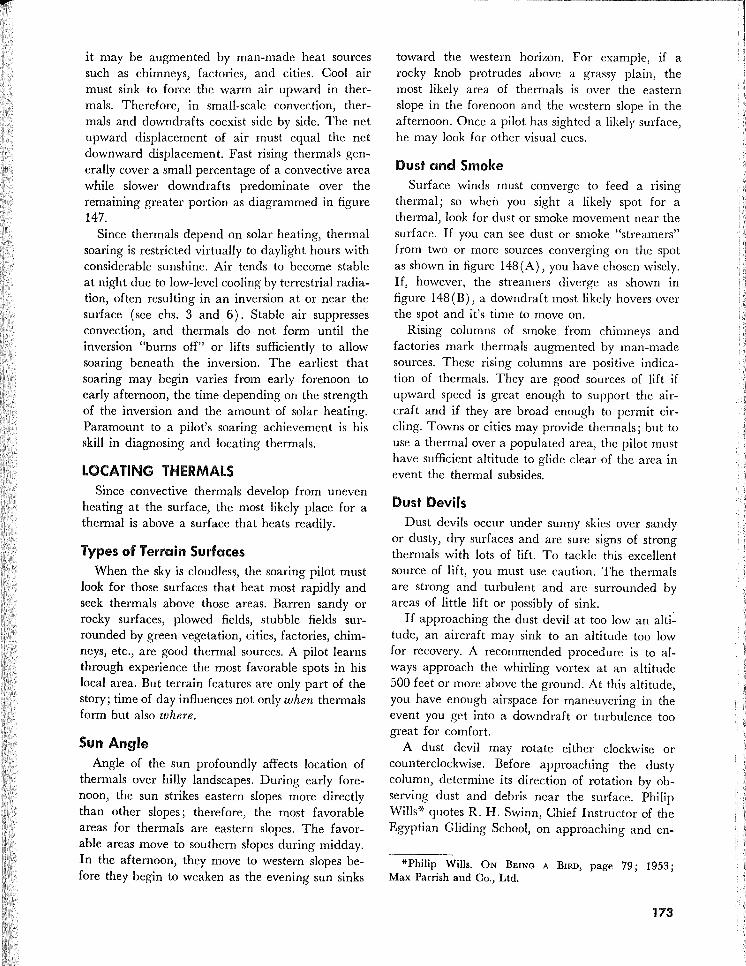
Dust and Smoke Surface winds must converge to feed a rising
thermal; so when you sight a likely spot for a thermal, look for dust or smoke movement near the surface. If you can see dust or smoke "streamers" from two or more sources converging on the spot as shown in figure 148(A), you have chosen wisely. If, however, the streamers diverge as shown in figure 148 (B), a downdraft most likely hovers over the spot and it's time to move on.
Rising columns of smoke from chimneys and factories mark thermals augmented by man-made sources. These rising columns are positive indication of thermals. They are good sources of lift if upward speed is great enough to support the aircraft and if they are broad enough to permit circling. Towns or cities may provide thermals; but to use a thermal over a populated area, the pilot must have sufficient altitude to glide clear of the area in event the thermal subsides.
Dust Devils Dust devils occur under sunny skies over sandy
or dusty, dry surfaces and are sure signs of strong thermals with lots of lift. To tackle this excellent source of lift, you must use caution. The thermals are strong and turbulent and are surrounded by areas of little lift or possibly of sink.
If approaching the dust devil at too Iowan alti: tude, an aircraft may sink to an altitude too low for recovery. A recommended procedure is to always approach the whirling vortex at an altitude 500 feet or more above the ground. At this altitude, you have enough airspace for maneuvering in the event you get into a downdraft or turbulence too great for comfort.
A dust devil may rotate either clockwise or counterclockwise. Before approaching the dusty column, determine its direction of rotation by observing dust and debris near the surface. Philip Wills* quotes R. H. Swinn, Chief Instructor of the Egyptian Gliding School, on approaching and en-
*Philip Wills. ON BEING A BIRD, page 79; 1953; Max Parrish and Co., Ltd.
173
r
A
PROBABLE
THERMAL
CONVERGING DUST AND SMOKE
B
SMOKE DUST
THERMAL
UNLIKELY
DIVERGING DUST AND SMOKE
SMOKE
FIGURE 148. Using surface dust and smoke movement as indications of a thermal. When you have sighted an area which you think will heat rapidly (the red area), look for dust or smoke movement at the surface as an indicator of surface wind. Converging dust or smoke streamers (left) enhance the probability of a thermal. Diverging streamers reduce the likelihood of a thermal.
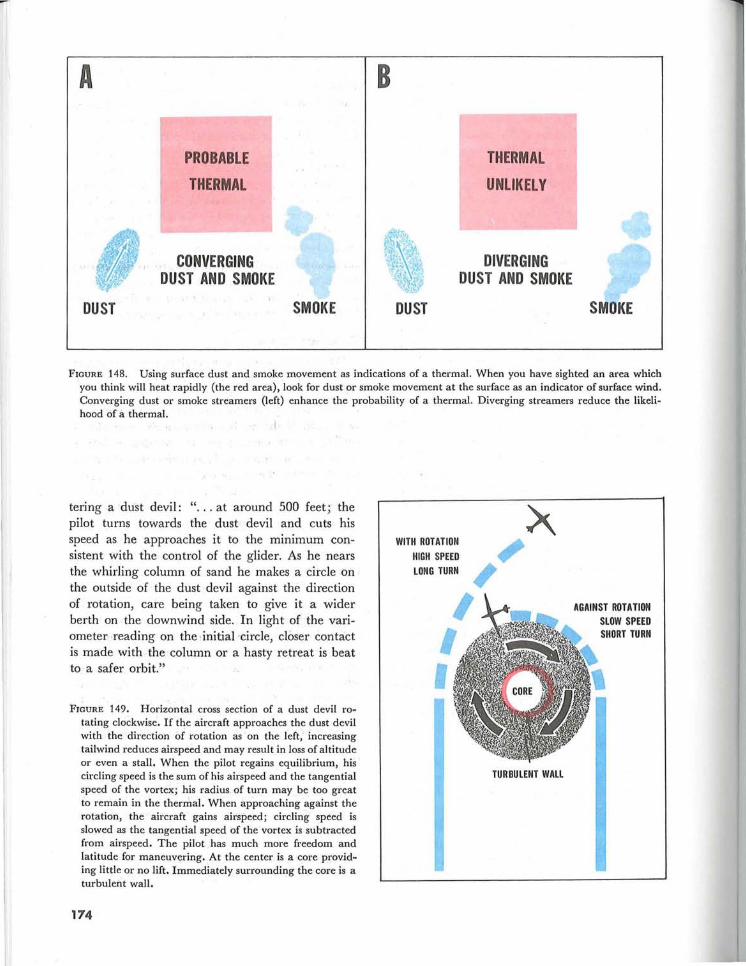
tering a dU'st devil: " . . . at around 500 feet; the pilot turns towards the dust devil and cuts his speed as he approaches it to the minimum consistent with the control of the glider. As he nears the whirling column of sand he makes a circle on the outside of the dust devil against the direction of rotation, care being taken to give it a wider berth on the downwind side. In light of the variometer reading on the .initial ·circle, closer contact is made with the column or a hasty retreat is beat to a safer orbit."
FroURE 149. Horizontal cross section of a dust devil rotating clockwise. If the aircraft approaches the dust devil with the direction of rotation as on the left; increasing tailwind reduces airspeed and may result in loss of altitude or even a stall. When the pilot regains equilibrium, his circling speed is the sum of his airspeed and the tangential speed of the vortex; his radius of turn may be too great to remain in the thermal. When approaching against the rotation, the aircraft gains airspeed; circling speed is slowed as the tangential speed of the vortex is subtracted from airspeed. The pilot has much more freedom and latitude for maneuv«;ring. At the center is a core providing little or no lift. Immediately surrounding the core is a turbulent wall.
174
TURBULENT WALL
AGAINST ROTATION SLOW SPEED SHORT TURN
Why should you enter against the direction of rotation? Figure 149 diagrams a horizontal cross section of a clockwise rotating dust devil and ways of entering it. If you enter with the direction of rotation as on the left, the wind speed is added to your airspeed giving you a fast circling speed probably too great to remain in the thermal. Against the rotation as on the right, wind speed is subtracted from airspeed giving you a slow circling speed.
Why slow your airspeed to a minimum? As you approach the increasing headwinds, the inertia of the aircraft causes a surge in airspeed. If your approach is too fast, the surge could push the airspeed above the red line.
Stay out of the "eye" of the vortex. Centrifugal force in the center throws air outward, greatly reducing pressure within the hollow center. The rarified air in the center provides very little lift, and the wall of the hollow center is very turbulent. Further quoting Mr. Swinn, * "A too tight turn on the downwind side put a part of my inside wing into the vortex; the shock threw me into the straps and the wing bent in an alarming manner. This central area of greatly reduced pressure is something to be experienced to be believed. Closely following on this was the shock of hitting the area of greatest uplift just outside the central core. The net result was that the machine was thrown completely out of the column."
If you are 500 feet or more above the ground but having trouble finding lift, the dust devil is well worth a try. If the thermal is sufficiently broad to permit circling within it, you have it made. The dust column may be quite narrow, but this fact does not necessarily mean the thermal is narrow; the thermal may extend beyond the outer limits of visible dust. The way to find out is to try it. Approach the dusty column against the direction of rotation at minimum airspeed. Enter the column near the outer edge of the dust and stay away from the hollow vortex core. Remain alert; you are circling little more than a wing span away from violent turbulence.
Birds and Sailplanes Soaring birds have an uncanny ability to locate
thermals. When birds remain airborne without
*Ibid., page 80. Mr. Wills' book discusses at length the splendors and perils of dust devil flying by an experienced soaring pilot. It is reconunended reading for a greater insight into this special aspect of soaring.
a
flapping their wings, they are riding a thermal. A climbing sailplane also $hows the pilot's skill in locating thermals. When fishermen are scattered along a river bank or lake shore, the best place to
cast your line is near the fisherman who is catching fish. So it is with soaring. Slip in below the successfully soaring aircraft and catch the thermal he is riding or cut in among or below soaring birds.
Wind causes a thermal to lean with altitude. When seeking the thermal supporting soaring birds or aircraft, you must make allowance for the wind. The thermal at lower levels usually is upwind from your high-level visual cue. A thermal may not be continuous from the surface upward to the soaring birds or sailplane; rather it may be in segments or bubbles. If you are unsuccessful.· in finding the thermal where you expect it, seek elsewhere.
Cumulus Clouds When convective clouds develop, thermal soaring
usually is at its best and the problem of locating thermals is greatly simplified. In chapter 6 we learned that upward moving air expands and cools as it rises. If the air is moist enough, expansional cooling lowers temperature to the dew point; a convective, or cumulus, cloud forms atop the thermal. Cumulus clouds are positive signs of thermals, but thermals grow and die. A cloud grows with a rising thermal; but when the thermal dies, the cloud slowly evaporates. Because the cloud dissipates after the thermal ceases, the pilot who can spot the difference between a growing and dying cumulus has enhanced his soaring skill.
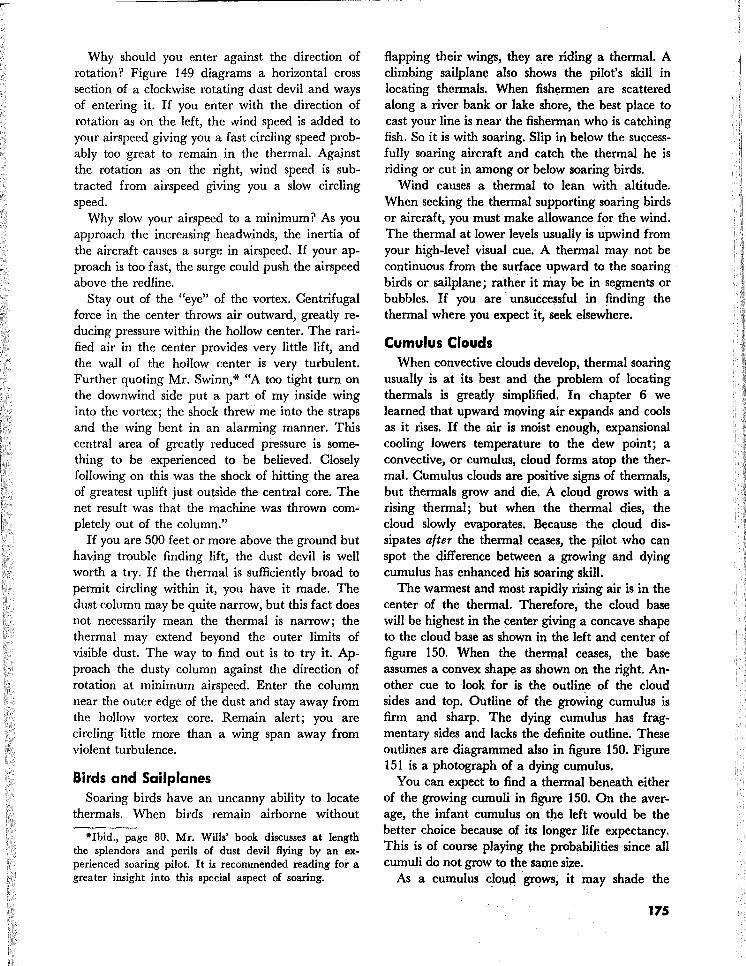
The warmest and most rapidly rising air is in the center of the thermal. Therefore, the cloud base will be highest in the center giving a concave shape to the cloud base as shown in the left and center of figure 150. When the thermal ceases, the baSe assumes a convex shape as shown on the right. Another cue to look for is the outline of the cloud sides and top. Outline of the growing cumulus is firm and sharp. The dying cumulus has fragmentary sides and lacks the definite outline. These outlines are diagrammed also in figure 150. Figure 151 is a photograph of a dying cumulus.
You can expect to find a thermal beneath either of the growing cumuli in figure 150. On the average, the infant cumulus on the left would be the better choice because of its longer life expectancy. This is of course playing the probabilities since all cumuli do not grow to the same size.
As a cumulus clou4grows; it may shade the
175

I! )11
It II
FIGURE 150. Cumulus clouds grow only with active thermals as shown left and center. On the right, the ther'1:f1al has subsided and the cloud is decaying. Look for a thermal only under a cumulus with a concave base and sharp uPAer outlines. A cumulus with a convex base or fragmentary outline is dissipating; the thermal under it has subsided. Mo&t often, a cloud just beginning to grow as on the left is the better choice because of its longer life expectancy.
surface that generated it. The surface cools, temporarily arresting the thermal.. As the cloud dissipates or drifts away with the wind, the surface again warms and regenerates the thermal. This intermittent heating is one way in which thermals occur as segments or bubbles.
Cloud cover sometimes increases as surface heating increases until much of the sky is covered. Again, surface heating is cut off causing the thermals to weaken or cease entirely. The cloudiness may then decrease. If it is not too late in the day, thermals will regenerate. In the interim period of extensive cloud cover, you may have no choice but to land and wait for the clouds to move on or decrease in coverage.
T he clouds may build upward to a high-level inversion and spread out at the base of the inversion to cover much of the sky. Solar heating is cut off and thermals weaken or die. This type of cloudiness can be persistent, often remaining until near sunset, and can halt thermal soaring until another day.
Although abundant convective cloud cover re-
176
duces thermal activity, we cannot quote a definite amount that renders thermals too weak for soaring. About 5/10 cover seems to be a good average approximation. Restriction of thermals by cumulus cloudiness first becomes noticeable at low levels . A sailplane may be unable to climb more than a few hundred feet at a low altitude while pilots at higher levels are maintaining height in or just beneath 6/10 to 8/10 convective cloud cover.
Towering Cumulus and Cumulonimbus When air is highly unstable, the cumulus cloud
can grow into a more ambitious towering cumulus or cumulonimbus. These clouds are a different breed. The energy released by copious condensation can increase buoyancy until the thermals become violent (see chs. 6, 7, and 11). Towering cumulus can produce showers. The cumulonimbus is the thunderstorm cloud producing heavy rain, hail, and icing. Well-developed towering cumulus and cumulonimbus are for the experienced pilot only. Some pilots find strong lift in or near convective precipitation, but they avoid hail which
11
I
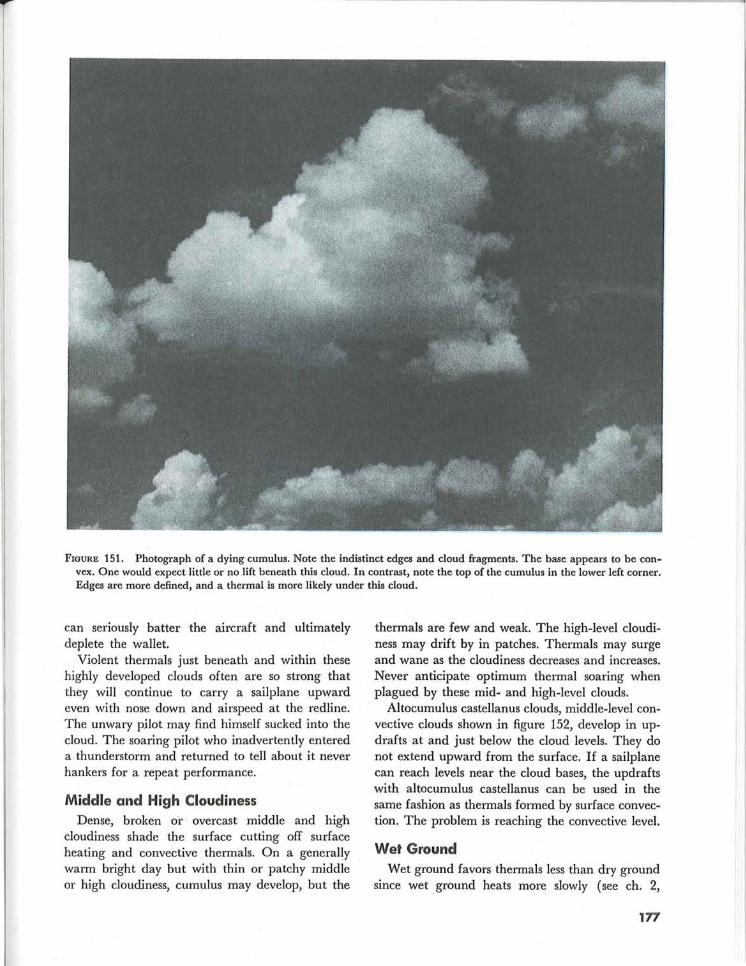
FIGURE 151. Photograph of a dying cumulus. Note the indistinct edges and cloud fragments. The base appears to be convex. One would expect little or no lift beneath this cloud. In contrast, note the top of the cumulus in the lower left corner. Edges are more defined, and a thermal is more likely under this cloud.
can seriously batter the aircraft and ultimately deplete the wallet.
Violent thermals just beneath and within these highly developed clouds often are so strong that they will continue to carry a sailplane upward even with nose down and airspeed at the redline. The unwary pilot may find himself sucked into the cloud. The soaring pilot who inadvertently entered a thunderstorm and returned to tell about it never hankers for a repeat performance.
Middle and High Cloudiness Dense, broken or overcast middle and high
cloudiness shade the surface cutting off surface heating and convective thermals. On a general!y warm bright day but with thin or patchy middle or high cloudiness, cumulus may develop, but the
thermals are few and weak. The high-level cloudiness may drift by in patches. Thermals may surge and wane as the cloudiness decreases and increases. Never anticipate optimum thermal soaring when plagued by these mid- and high-level clouds.
Altocumulus castellanus clouds, middle-level convective clouds shown in figure 152, develop in updrafts at and just below the cloud levels. They do not extend upward from the surface. If a sailplane can reach levels near the cloud bases, the updrafts with altocumulus castellanus can be used in the same fashion as thermals formed by surface convection. The problem is reaching the convective level.
Wet Ground Wet ground favors thermals less than dry ground
since wet ground heats more slowly (see ch. 2,
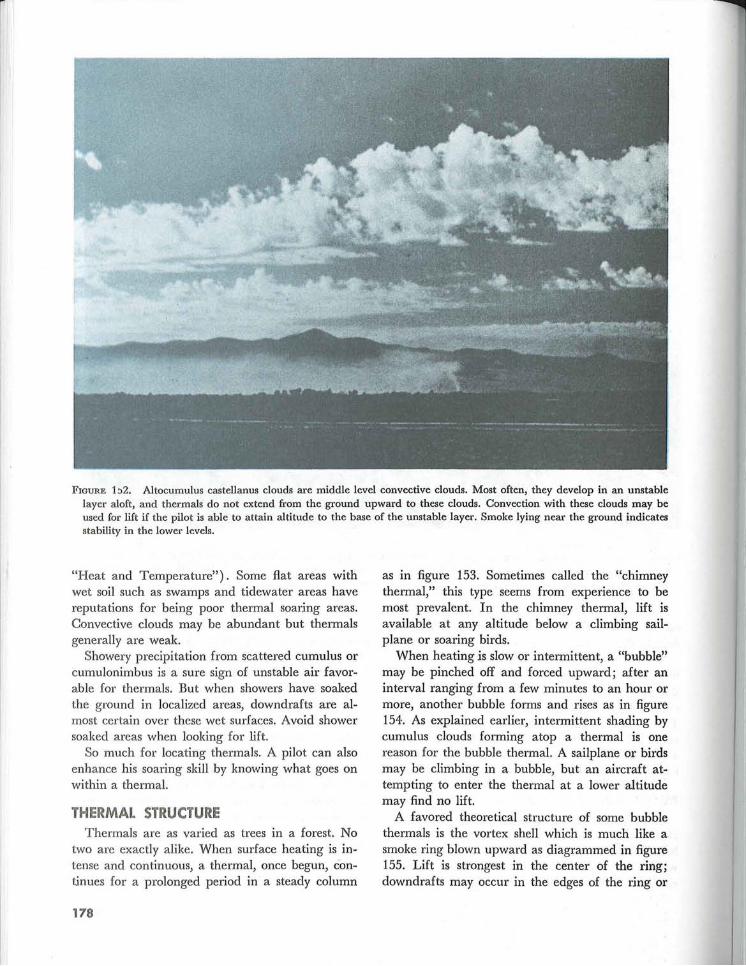
FIGURE 1:>2. Altocumulus castell anus clouds are middle level convective clouds. Most often, they develop in an unstable layer aloft, and thermals do not extend from the ground upward to these clouds. Convection with these clouds may be used for lift if the pilot is able to attain altitude to the base of the unstable layer. Smoke lying near the ground indicates stability in the lower levels.
"Heat and Temperature"). Some flat areas with wet soil such as swamps and tidewater areas have reputations for being poor thermal soaring areas. Convective clouds may be abundant but thermals generally are weak.
Showery precipitation from scattered cumulus or cumulonimbus is a sure sign of unstable air favorable for thermals. But when showers have soaked the ground in localized areas, downdrafts are almost certain over these wet surfaces. Avoid shower soaked areas when looking for lift.
So much for locating thermals. A pilot can also enhance his soaring skill by knowing what goes on within a thermal.
THERMAL STRUCTURE Thermals are as varied as trees in a forest. No
two are exactly alike. When surface heating is intense and continuous, a thermal, once begun, continues for a prolonged period in a steady column
178
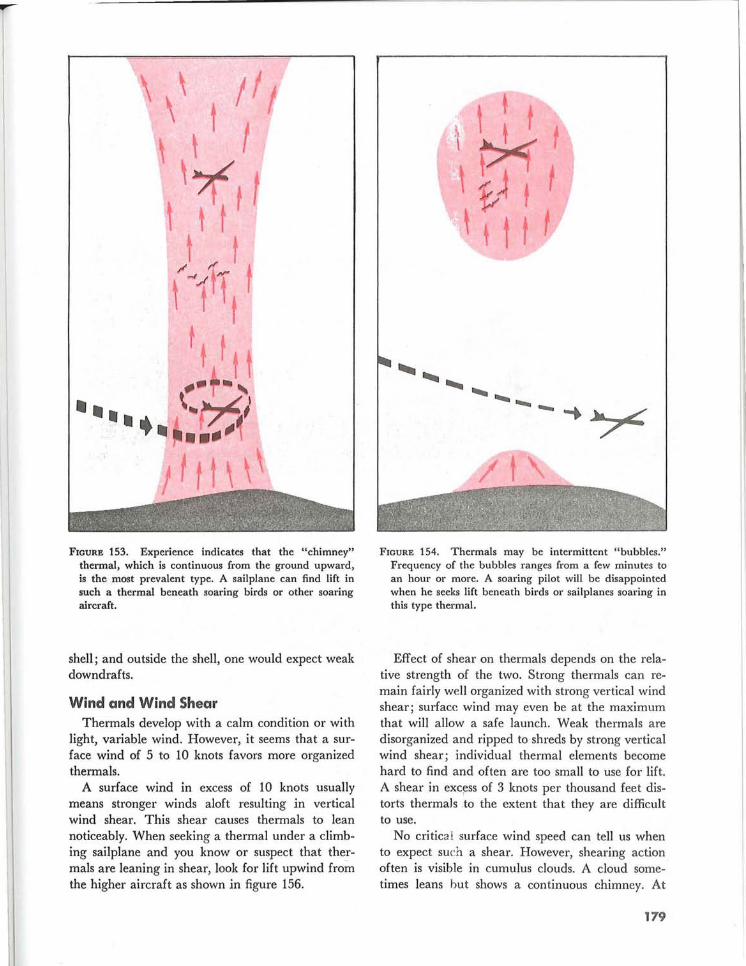
as in figure 153. Sometimes called the "chimney thermal," this type seems from experience to be most prevalent. In the chimney thermal, lift is available at any altitude below a climbing sailplane or soaring birds.
When heating is slow or intermittent, a "bubble" may be pinched off and forced upward; after an interval ranging from a few minutes to an hour or more, another bubble forms and rises as in figure 154. As explained earlier, intermittent shading by cumulus clouds forming atop a thermal is one reason for the bubble thermal. A sailplane or birds may be climbing in a bubble, but an aircraft attempting to enter the thermal at a lower altitude may find no lift.
A favored theoretical structure of some bubble thermals is the vortex shell which is much like a smoke ring blown upward as diagrammed in figure 155. Lift is strongest in the center of the ring; downdrafts may occur in the edges of the ring or
••••
FIGURE 153. Experience indicates that the "chimney" thermal, which is continuous from the ground upward, is the most prevalent type. A sailplane can find lift in such a thermal beneath soaring birds or other soaring aircraft.
shell; and outside the shell, one would expect weak downdrafts.
Wind and Wind Shear Thermals develop with a calm condition or with
light, variable wind. However, it seems that a surface wind of 5 to 10 knots favors more organized thermals.
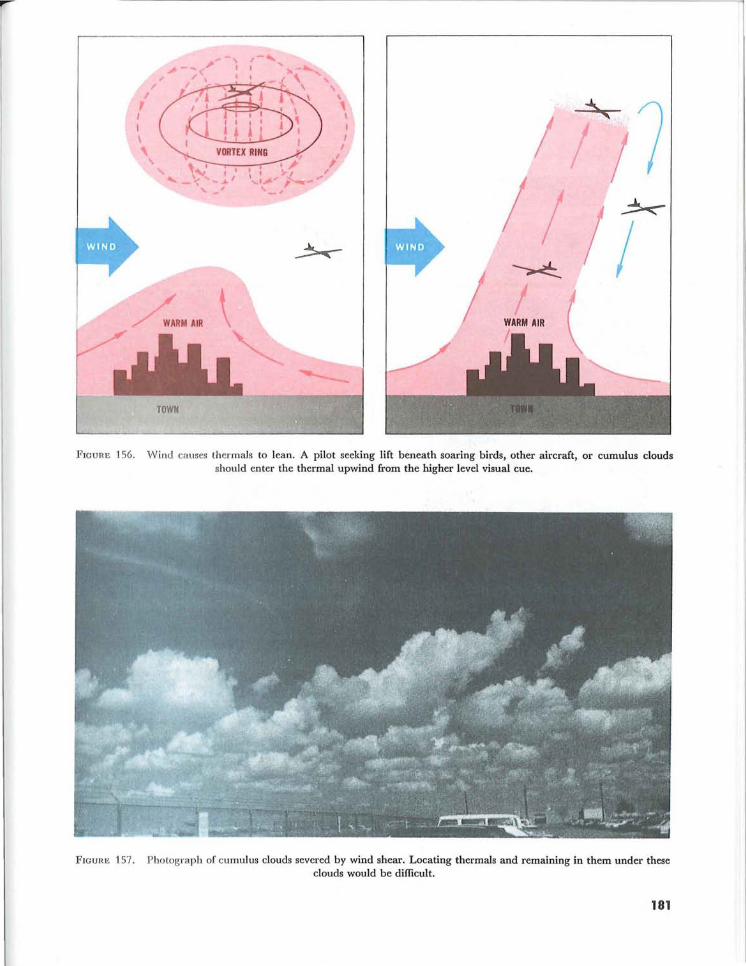
A surface wind in excess of 10 knots usually means stronger winds aloft resulting jn vertical wind shear. This shear causes thermals to lean noticeably. When seeking a thermal under a climbing sailplane and you know or suspect that thermals are leaning in shear, look for lift upwind from the higher aircraft as shown jn figure 156.
I I - ..... IIIIIII!:::1
~ ; I \ t t t
FIGURE 154. Thermals may be intermittent "bubbles." Frequency of the bubbles ranges from a few minutes to an hour or more. A soaring pilot will be disappointed when he seeks lift beneath birds or sailplanes soaring in this type thermal.
Effect of shear on thermals depends on the relative strength of the two. Strong thermals can remain fairly well organized with strong vertical wind shear; surface wind may even be at the maximum that will allow a safe launch. Weak thermals are disorganized and ripped to shreds by strong vertical wind shear; individual thermal elements become hard to find and often are too small to use for lift. A shear in excf'!ss of 3 knots per thousand feet distorts thermals ,to the extent that they are difficult to use.
No critica i surface wind speed can tell us when to expect such a shear. However, shearing action often is visible in cumulus clouds. A cloud sometimes leans but shows a continuous chimney. At
179
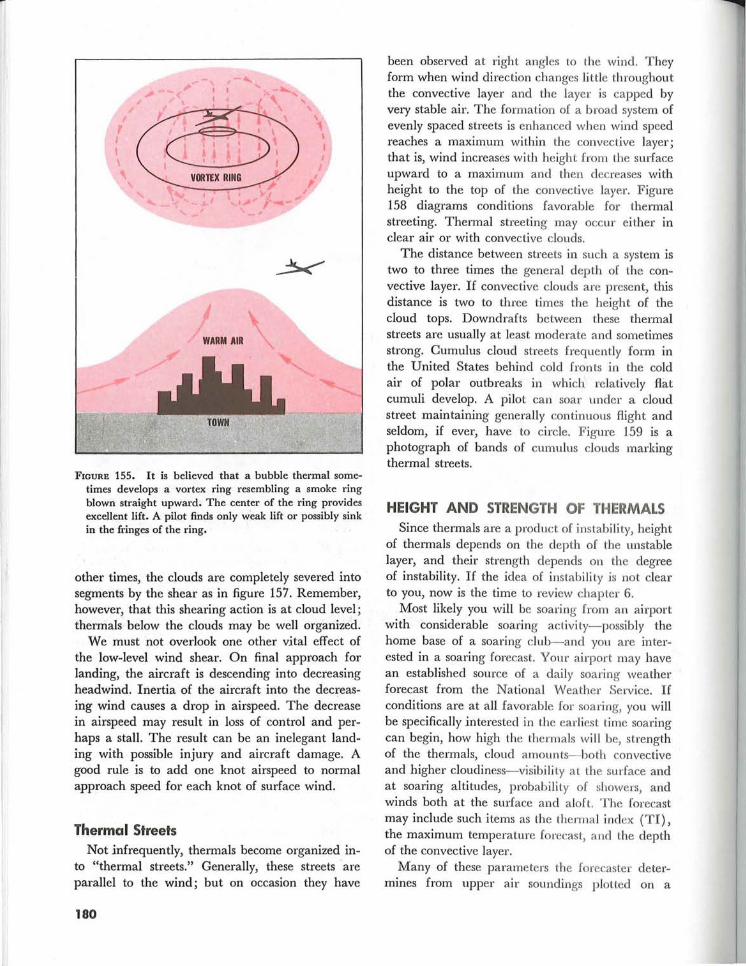
FIGURE 155. It is believed that a bubble thermal sometimes develops a vortex ring resembling a smoke ring blown straight upward. The center of the ring provides excellent lift. A pilot finds only weak lift or possibly sink in the fringes of the ring.
other times, the clouds are completely severed into segments by the shear as in figure 157. Remember, however, that this shearing action is at cloud level; thermals below the clouds may be well organized.
We must not overlook one other vital effect of the low-level wind shear. On final approach for landing, the aircraft is descending into decreasing headwind. Inertia of the aircraft into the decreasing wind causes a drop in airspeed. The decrease in airspeed may result in loss of control and perhaps a stall. The result can be an inelegant landing with possible injury and aircraft damage. A good rule is to add one knot airspeed to normal approach speed for each knot of surface wind.
Thermal Streets Not infrequently, thermals become organized in
to "thermal streets." Generally, these streets -are parallel to the wind; but on occasion they have
180
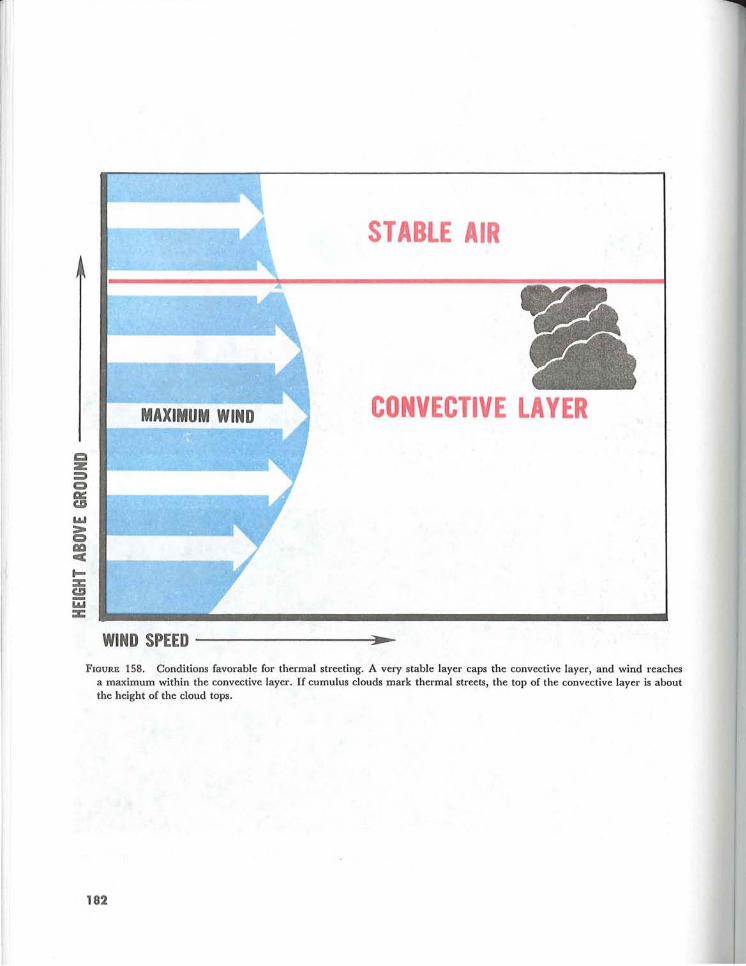
been observed at right angles to the wind. They form when wind direction changes little throughout the convective layer and the layer is capped by very stable air. T he formation of a broad system of evenly spaced streets is enhanced when wind speed reaches a maximum within the convective layer; that is, wind increases with height from the surface upward to a maximum and then decreases with height to the top of the convective layer. Figure 158 diagrams conditions favorable for thermal stl-eeting. Thermal streeting may occur either in clear air or with convective clouds.
The distance between streets in such a system is two to three times the general depth of the convective layer. If convective clouds are present, this distance is two to three times the height of the cloud tops. Downdrafts between these thermal streets are usually at least moderate and sometimes strong. Cumulus cloud streets frequently form in the United Sta tes behind cold fronts in the cold air of polar outbreaks in which relatively flat cumuli develop. A pilot can soar under a cloud street maintaining generally continuous flight and seldom, if ever, have to circle. Figure 159 is a photograph of bands of cumulus clouds marking thermal streets.
HEIGHT AND STRENGTH OF THERMALS Since thermals are a product of instability, height
of thermals depends on the depth of the unstable layer, and their strength depends on the degree of instability. If the idea of instability is not clear to you, now is the time to review chap ter 6.
Most likely you will be soaring from an airport with considerable soaring activity- possibly the home base of a soaring club- and you are interested in a soa ring forecast. Your airport may have an established source of a daily soaring weather forecast from the National Weather Service. If conditions are at a ll favorable for soaring, you will be specifically interested in the earliest time soaring can begin, how high the thel1uals will be, strength of the thermals, cloud amounts- both convective and higher cloudiness- visibi lity a t the surface and at soaring altitudes, probabil ity of showers, and winds both at the surface and aloft . T he forecast may include such items as the thermal index (TI ) , the maximum temperature forecast, and the depth of the convective layer.
Many of these parameters the forecaster determines from upper air soundings plotted on a
TOWN
FIGURE 156. Wind causes thermals to lean. A pilot seeking lift beneath soaring birds, other aircraft, or cumulus clouds should enter the thermal upwind from the higher level visual cue.
FIGURE 157. Photograph of cumulus clouds severed by wind shear. Locating thermals and remaining in them under these clouds would be difficult.
181
STABLE AIR
MAXIMUM WIND CONVECTIVE LAYER
WIND SPEED FIGURE 158. Conditions favorable for thermal streeting. A very stable layer caps the convective layer, and wind reaches
a maximum within the convective layer. If cumulus clouds mark thermal streets, the top of the convective layer is about the height of the cloud tops.
182
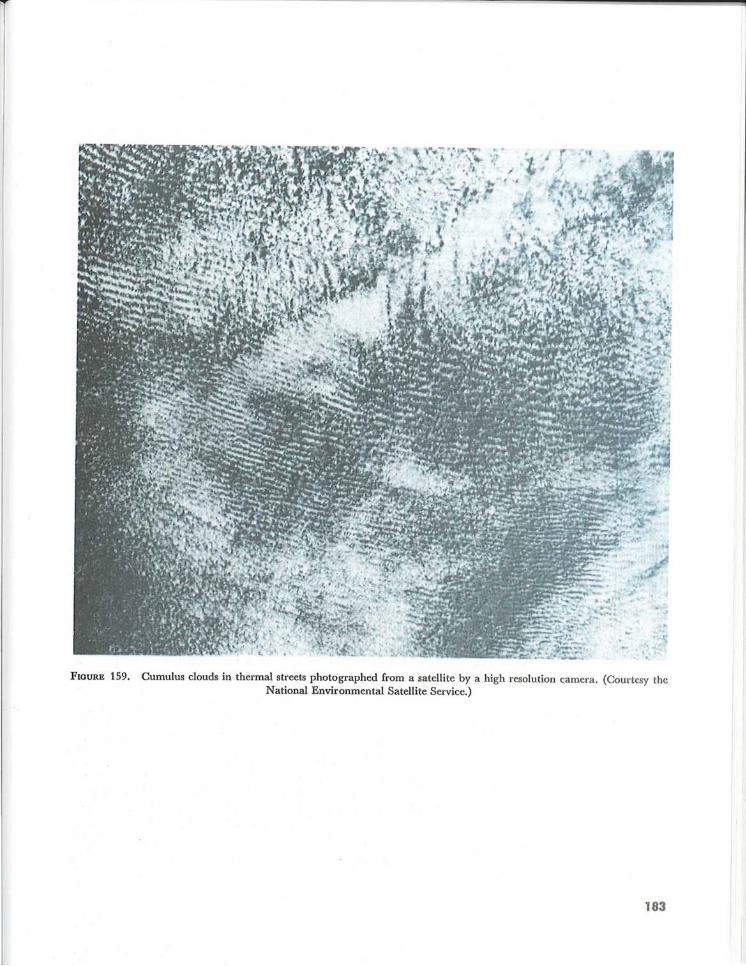
FIGURE 159. Cumulus clouds in thermal streets photographed from a satellite by a high resolution camera. (Courtesy the National Environmental Satellite Service.)
183
pseudo-adiabatic chart. If you become familiar with this chart, you can better grasp the meanings of some of these forecast parameters; and you may try a little forecasting on your own.
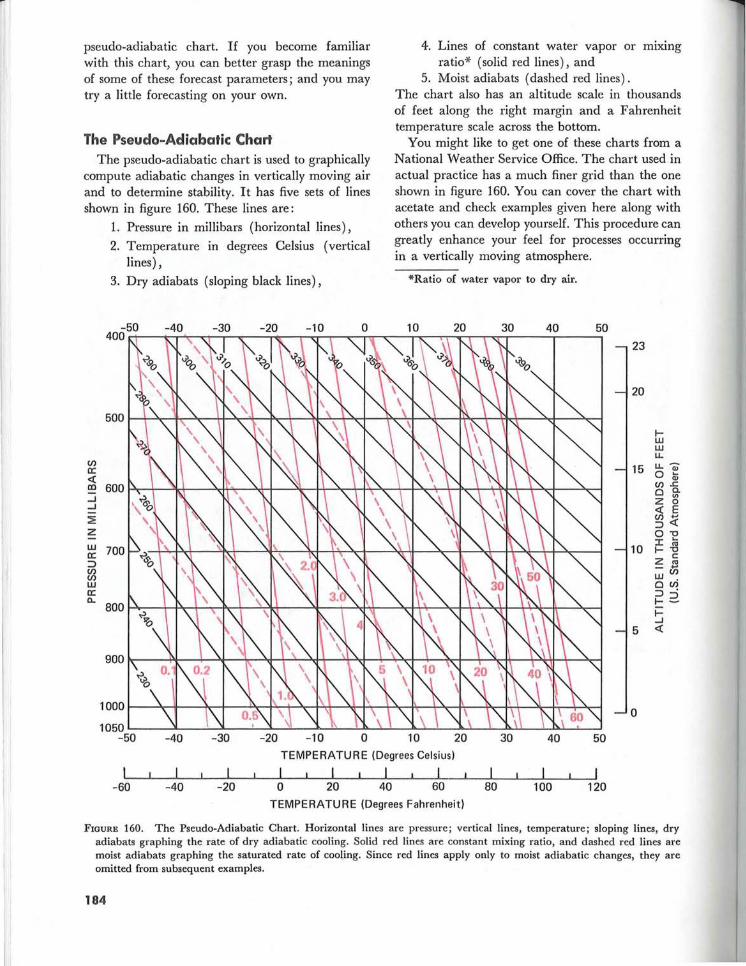
The Pseudo-Adiabatic Chart The pseudo-adiabatic chart is used to graphically
compute adiabatic changes in vertically moving air and to determine stability. It has five sets of lines shown in figure 160. These lines are:
en a:: «
1. Pressure in millibars (horizontal lines),
2. Temperature in degrees Celsius (vertical lines) ,
3. Dry adiabats (sloping black lines),
-40 -30 -20 -10 o
4. Lines of constant water vapor or mixing ratio* (solid red lines), and
5. Moist adiabats (dashed red lines) . The chart also has an altitude scale in thousands of feet along the right margin and a Fahrenheit temperature scale across the bottom.
You might like to get one of these charts from a National Weather Service Office. The chart used in actual practice has a much finer grid than the one shown in figure 160. You can cover the chart with acetate and check examples given here along with others you can develop yourself. This procedure can greatly enhance your feel for processes occurring in a vertically moving atmosphere.
*Ratio of water vapor to dry air.
10 20 30 40 50
23
20
..... UJ UJ U. u.-
15 0 ~ m 600~~~~--~~~~+-~~4+~~~~-+~~~~~-+~4-~~--~~ en..r:.
o ~ Z 0 « E
...J
...J
:2 z UJ a:: ::> en en UJ a:: Q"
1000r---~r-~~r-~~~~~~~~~~~~~~~~~~~~~~~
1050~--~L---~~~~~~~~~~~~~~~~~~~~--~~~-...J
-50 -40 - 30 -20 - 10 o 10 20 30 40 50 TEMPERATURE (Degrees Celsius)
I I I I -60 -40 -20 o 20 40 60 80 100 120
TEMPERATURE (Degrees Fahrenheit)
3~ O'tl J: ~
10 ..... 'tl Z ~ - ... UJen
oen ::> . ..... 2-i= ...J
5 «
o
FIGURE 160. The Pseudo-Adiabatic Chart. Horizontal lines are pressure; vertical lines, temperature; sloping lines, dry adiabats graphing the rate of dry adiabatic cooling. Solid red lines are constant mixing ratio, and dashed red lines are moist adiabats graphing the saturated rate of cooling. Since red lines apply only to moist adiabatic changes, they are omitted from subsequent examples.
184
Examples shown here deal with dry thermals ; and since the red lines in figure 160 concern moist adiabatic changes, they are omitted from the examples. If you care to delve deeper into use of the chart, you will find moist adiabatic processes even more intriguing than dry processes.
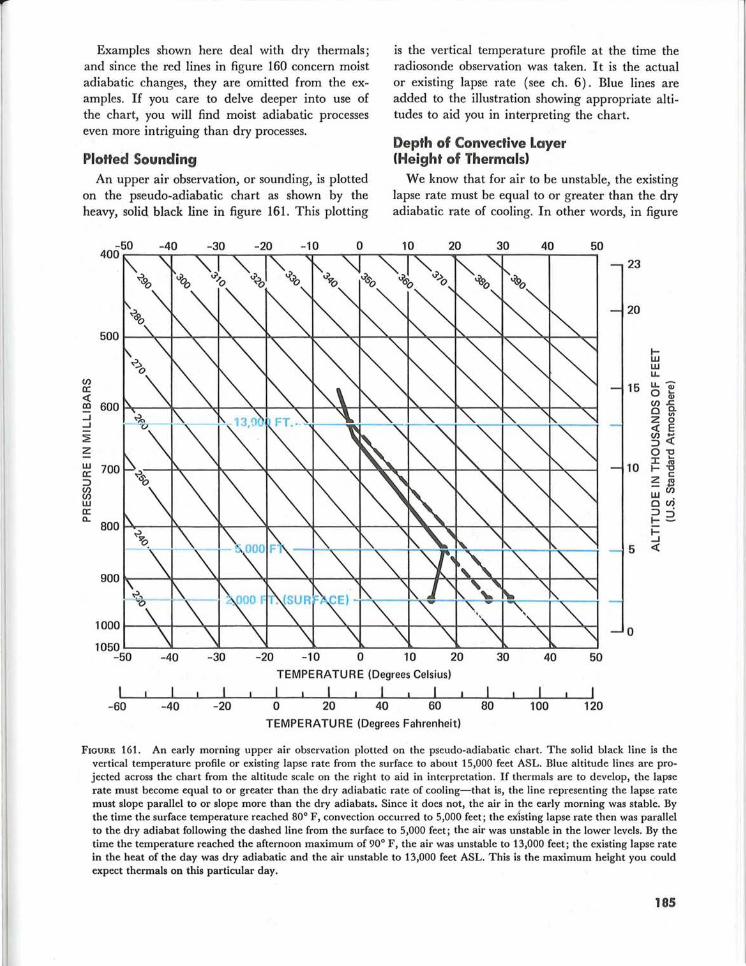
PloHed Sounding An upper air observation, or sounding, is plotted
on the pseudo-adiabatic chart as shown by the heavy, solid, black line in figure 161. This plotting
is the vertical temperature profile at the time the radiosonde observation was taken. I t is the actual or existing lapse rate (see ch. 6). Blue lines are added to the illustration showing appropriate altitudes to aid you in interpreting the chart.
Depth of Convective Layer (Height of Thermals)
We know that for air to be unstable, the existing lapse rate must be equal to or greater than the dry adiabatic rate of cooling. In other words, in figure
-50 -40 -30 -20 -10 0 10 20 30 40 50 400 r---,,--~-.~--~r---~--~.-~--~--~r---,,-----r----~
V) a: <( m 600~--~~--~~--~4-~~4-~~4-~--~~--~~--~--~~--~~ .J .J
~ Z
~ 700 ::::> V) V) w a: Q"
1000 r---~~~~r-~~r-~~--~~--~~--~~--~~--~r+--~~
1050L---~L---~L---~L---~~--~~--~~--~~--~~--~~--~
-50 -40 -30 -20 -10 o 10 20 30 40 50 TEMPERATURE (Degrees Celsius)
I I I I -60 -40 -20 o 20 40 60 80 100 120
TEMPERATURE (Degrees Fahrenheit)
23
20
I-w w u.. u.. -
15 0 ~ V).r: o ~ Z 0 <( E ~~ 0"0 J: :u
10 I- "0
Z ~ - ... wV)
o<n ::::> • 1-2-~
5 <{
o
FIGURE 161. An early morning upper air observation plotted on the pseudo-adiabatic chart. The solid black line is the vertical temperature profile or existing lapse rate from the surface to about 15,000 feet ASL. Blue altitude lines are projected across the chart from the altitude scale on the right to aid in interpretation . If thermals are to d evelop, the lapse rate must become equal to or greater than the dry adiabatic rate of cooling-that is, the line representing the lapse rate must slope parallel to or slope more than the dry adiabats. Since it does not, the air in the early morning was stable. By the time the surface temperature reached 80° F, convection occurred to 5,000 feet; the exlsting lapse rate then was parallel to the dry adiabat following the <lashed line from the surface to 5,000 feet; the air was unstable in the lower levels. By the time the temperature reached the afternoon maximum of 90° F, the air was unstable to 13,000 feet; the existing lapse rate in the heat of the day was dry adiabatic and the air unstable to 13,000 feet ASL. This is the maximum height you could expect thermals on this particular day.
185
161, the solid black line representing the plotted existing lapse rate would slope parallel to or slope more than the dry adiabats. Obviously it does not. Therefore, at the time the sounding was taken, the air was stable; there was no convective or unstable layer, and thermals were nonexistent. Thermal soaring was impossible.
Now assume that the sounding was made about the time of sunrise. Surface temperature was 59° F (15° C). As temperature rises near the surface during the day, air in the lower levels is warmed and forced upward, cooling at the dry adiabatic rate. Convection begins in the lowest levels. By the time the surface temperature reaches 80° F (about 27° C), convection lifts the air to the level at which it cools adiabatically to the temperature of the surrounding air at 5,000 feet. The existing lapse rate now becomes dry adiabatic from the surface to 5,000 feet and follows the dashed line from the surface to that level. Surface elevation is 2,000 feet ASL; so the convective layer is now 3,000 feet deep. Thermals exist to 3,000 feet above the surface, and low-level soaring is now possible. Above 5,000 feet the lapse rate still is essentially unchanged from the initial lapse rate.
Maximum Height of Thermals Let's further assume that maximum temperature
forecast for the day is 90° F (about 30° C). Plot 90° F at the surface elevation and draw a.line (the dashed black line) parallel to the dry adiabats to the level at which it intersects the early morning sounding. This level is 13,000 feet ASL. The convective layer at time of maximum heating would be 11,000 feet deep and soaring should be possible to 13,000 feet ASL. The existing lapse rate in the heat of the day would follow the dashed line from the surface to 13,000 feet; above 13,000, the lapse rate would remain essentially unchanged.
Remember that we are talking about dry thermals. If convective clouds form below the indicated maximum thermal height, they will greatly distort the picture. However, if cumulus clouds do develop, thermals below the cloud base should be strengthened. If more higher clouds develop than were forecast, they will curtail surface heating, and most likely the maximum temperature will be cooler than forecast. Thermals will be weaker and will not reach as high an altitude.
Thermal Index (Tn Since thermals depend on sinking cold air forc
ing warm air upward, strength of thermals depends
186
on the temperature difference between the sinking air and the rising air-the greater the temperature difference the stronger the thermals. To arrive at an approximation of this difference, the forecaster computes a thermal index (TI).
A thermal index may be computed for any level; but ordinarily, indices are computed for the 850-and 700-millibar levels, or about 5,000 and 10,000 feet respectively. These levels are selected because they are in the altitude domain of routine soaring and because temperature data are routinely available for these two levels.
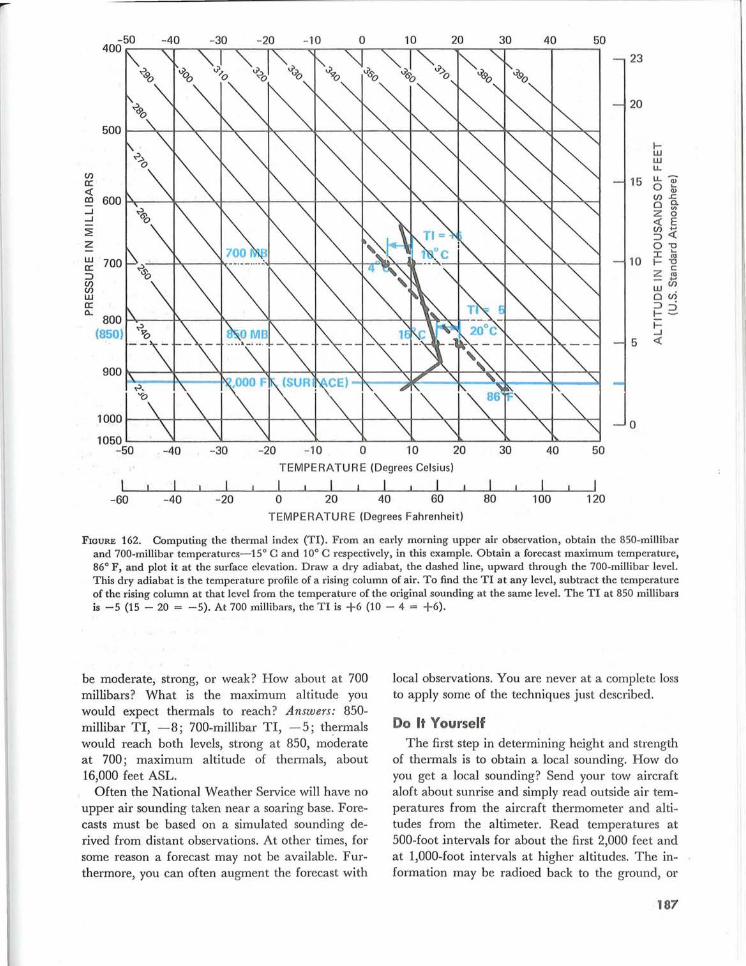
Three temperature values are needed-the observed 850-millibar and 700-millibar temperatures and the forecast maximum temperature. Let's assume a sounding as in figure 162 with an 850-millibar temperature of 15° C, a 700-millibar temperature of 10° C, and forecast maximum of 86° F (30° C). Plot the three temperatures using care to place the maximum temperature plot at field elevation (2,000 feet in figure 162). Now draw a line (the black dashed line) through the maximum temperature parallel to the dry adiabats. Note that the dashed line intersects the 850-millibar level at 20° C and the 700-millibar level at 4° C. Algebraically subtract these temperatures from actual sounding temperatures at corresponding levels. Note the difference is _5° C at 850 millibars (15 - 20 = -5) and +6 at 700 millibars (10-4 = +6). These values are the Tl's at the two levels.
Strength of thermals is proportional to the magnitude of the negative value of the TI. A TI of -8 or - 10 predicts very good lift and a long soaring day. Thermals with this high a negative value will be strong enough to hold together even on a windy day. A TI of -3 indicates a very good chance of sailplanes reaching the altitude of this temperature difference. A TI of - 2 to zero leaves much doubt; and a positive TI offers even less hope of thermals reaching the altitude. Remember that the TI is a forecast value. A miss in the forecast maximum or a change in temperature aloft can alter the picture considerably. The example in figure 162 should promise fairly strong thermals to above 5,000 feet but no thermals to 10,000.
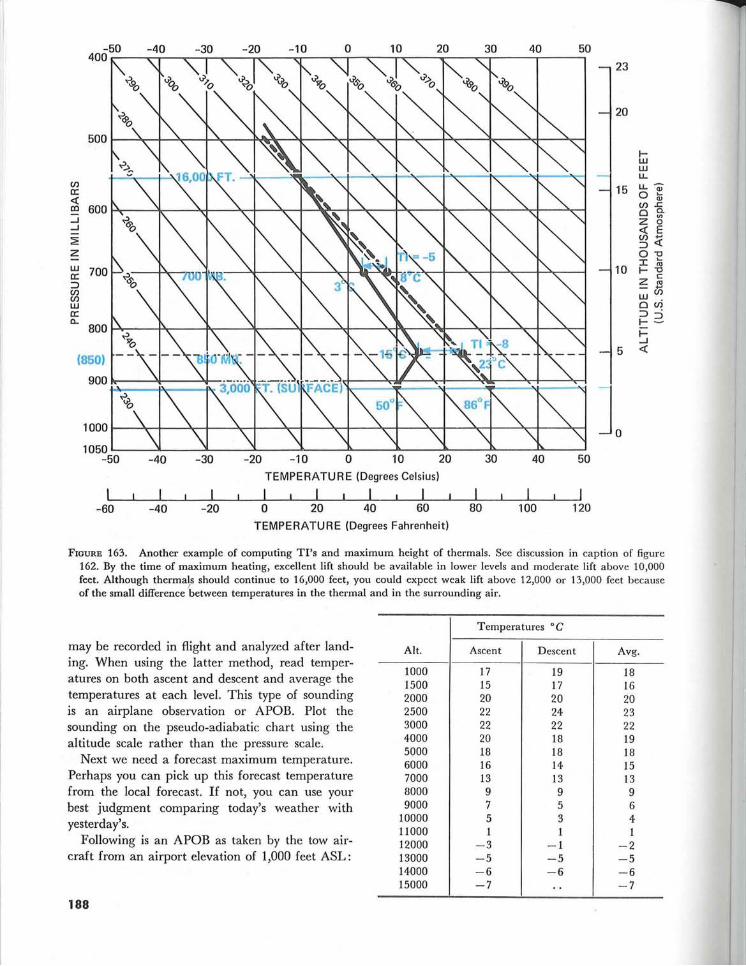
Figure 163 is another example showing an early morning sounding with a 3,000-foot surface temperature of 10° C (50° F), an 850-millibar temperature of 15° C, a 700-millibar temperature of 3° C, and a forecast maximum of 86° F (30° C). What are the Tl's at 850 and 700 millibars? Would you expect thermals to 850 millibars? Would they
-50 -40 -30 - 20 -10 0 10 20 30 40 50 400 .---~r-~-,~~-,~---o--~~--~~~--~--~rT----~-----'
If)
a: «
23
20
.w W LL.
15 ~ ~ m 600~--~~--~~--~4-~~4-~r-~~---+~--~~--~--~~--~~ '" 1f) L:
o ~ Z 0 « E
-' -' ~ Z
~ 700 ~ If) If) w a: !l.
~~ O"E J: co
10 .-"0 c Z co
ci5 w . o If) ~ .
800~--~~--~~--~----~--~tt---~+-~~*.-2-i=
(850) -' 5 «
1000~~~r-~~~~~r-~~--~~--~~--~~--~r+--~r+--~~
1050~~~~--~~--~~--~~---J~--~~--~~--~~--~~--~
o
-50 -40 -30 -20 - 10 o 10 20 30 40 50 TEMPE RATU R E (Degrees Celsius)
I I I I -60 -40 -20 o 20 40 60 80 100 120
TEMPERATURE (Degrees Fahrenheit)
FIGURE 162. Computing the thermal index (TI). From an early morning upper air observation, obtain the 8S0-millibar and 700-millibar temperatures- 1So C and 100 C respectively, in this example. Obtain a forecast maximum temperature, 860 F, and plot it at the surface elevation. Draw a dry adiabat, the dashed line, upward through the 700-millibar level. This dry adiabat is the temperature profile of a rising column of air. To find the TI at any level, subtract the temperature of the rising column at that level from the temperature of the original sounding at the same level. The TI at 850 millibars is -5 (15 - 20 = -5). At 700 millibars, the TI is +6 (10 - 4 = +6).
be moderate, strong, or weak? How about at 700 millibars? What is the maximum altitude you would expect thermals to reach? Answers: 850-millibar TI, -8; 700-millibar TI, -5; thermals would reach both levels, strong at 850, moderate at 700; maximum altitude of thermals, about 16,000 feet ASL.
Often the National Weather Service will have no upper air sounding taken near a soaring base. Forecasts must be based on a simulated sounding derived from distant observations. At other times, for some reason a forecast may not be available. Furthermore, you can often augment the forecast with
local observations. You are never at a complete loss to apply some of the techniques just described.
Do It Yourself The first step in determining height and strength
of thermals is to obtain a local sounding. How do you get a local sounding? Send your tow aircraft aloft about sunrise and simply read outside air temperatures from the aircraft thermometer and altitudes from the altimeter. Read temperatures at 500-foot intervals for about the first 2,000 feet and at 1,000-foot intervals at higher altitudes. The information may be radioed back to the ground, or
187
50 - 50 -40 -30 -20 - 10 0 10 20 30 40 400.---~r-~--~r---~--~--~~--~-'~---'--~~-----'-----'
Vl a: <x: 00 600~--~~--~+---~4-~~4-~~~~---r~---+~--~--~~--~~ -I -I
~ Z
~ 700 :::> Vl Vl w a: a.
(850)
900 h---~,----""">+--:
1000~~~~~~~~~r-~~--~~--~~--~.;--~r+--~r+--~~
1050~--~~--~~--~~--~~--~~--~~--~~--~~--~~--~
-50 -40 -30 -20 -10 o 10 20 30 40 50 TEMPERATURE (Degrees Celsius)
I I I I -60 -40 -20 o 20 40 60 80 100 120
TEMPERATURE (Degrees Fahrenheit)
23
20
Iw W LL
15 LL Qj o ~ Vl.I;; o sr Z 0 <x: E ~~ 0-0
10 ~ ~ Z c:
w ~ ouj :::> . 1-2 ~ -I
5 <x:
1
FIGURE 163. Another example of computing TI's and maximum height of thermals. See discussion in caption of figure 162. By the time of maximum heating, excellent lift should be available in lower levels and moderate lift above 10,000 feet. Although thermals should continue to 16,000 feet, you could expect weak lift above 12,000 or 13,000 feet because of the small difference between temperatures in the thermal and in the surrounding air.
may be recorded in flight and analyzed after landing. When using the latter method, read temperatures on both ascent and descent and average the temperatures at each level. This type of sounding is an airplane observation or APOB. Plot the souncling on the pseudo-adiabatic chart using the altitude scale rather than the pressure scale.
Next we need a forecast maximum temperature. Perhaps you can pick up this forecast temperature from the local forecast. If not, you can use your best judgment comparing today's weather with yesterday's.
Following is an APOB as taken by the tow aircraft from an airport elevation of 1,000 feet ASL:
188
Alt.
1000 1500 2000 2500 3000 4000 5000 6000 7000 8000 9000
10000 11000 12000 13000 14000 15000
Temperatures 0 C
Ascent Descent Avg.
17 19 18 15 17 16 20 20 20 22 24 23 22 22 22 20 18 19 18 18 18 16 14 15 13 13 13 9 9 9 7 5 6 5 3 4 1 1 1
-3 -1 -2 -5 -5 -5 -6 -6 -6 -7 .. -7
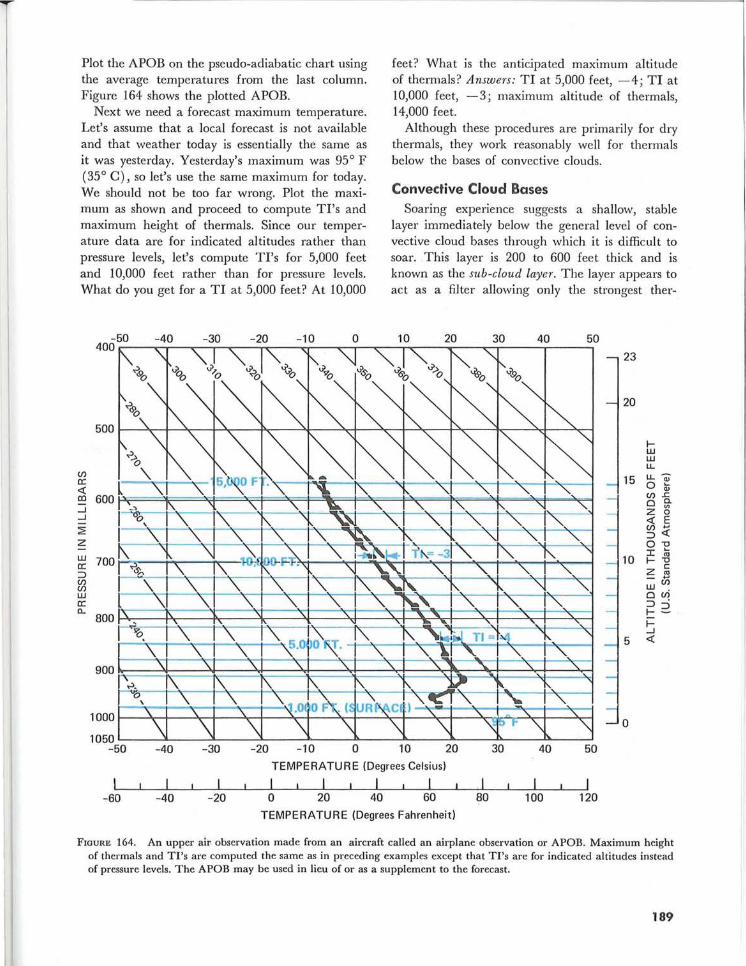
Plot the APOB on the pseudo-adiabatic chart using the average temperatures from the last column. Figure 164 shows the plotted APOB.
Next we need a forecast maximum temperature.
feet? What is the anticipated maximum altitude of thermals? Answers.' TI at 5,000 feet, -- 4; TI at 10,000 feet, -- 3; maximum altitude of thermals, 14,000 feet.
Let's assume that a local forecast is not available and that weather today is essentially the same as it was yesterday. Yesterday's maximum was 95 0 F (35 0 C), so let's use the same maximum for today. We should not be too far wrong. Plot the maximum as shown and proceed to compute TI's and maximum height of thermals. Since our temperature data are for indicated altitudes rather than pressure levels, let's compute TI's for 5,000 feet and 10,000 feet rather than for pressure levels. What do you get for a TI at 5,000 feet? At 10,000
Although these procedures are primarily for dry thermals, they work reasonably well for thermals below the bases of convective clouds.
(f) 0: <{ co ...J ...J
~ Z
w 0: ::J (f) (f) W 0: a.
Convective Cloud Bases
Soaring experience suggests a shallow, stable layer immediately below the general level of convective cloud bases through which it is difficult to soar. This layer is 200 to 600 feet thick and is known as the sub-cloud layer. The layer appears to act as a filter allowing only the strongest ther-
-50 400
-40 -30 -20 -1 0 o 10 20 30 40 50
500
600
700
800
'" '\ <i>0o "'<i>t ""<i>.:» ""-<i><i>o r"-<2 "'J<i>S- "'<i>J ""-<i>/ ~. '" '-r. ':>090
~~""~ ~ ~ [\~ ''\ '" "'~~ ~ 0'0 '\.
~ ~\, '\ "" "" ~~~~~ ",,"" 0 ~ ~ ~ \.. \.. ""- ""-. ""-. ", !. -, ". ".!.~ ~ ~ ". ""-. ", " ~ I vo, "'-. ''''-. 'K ~ "'. "'. ~'" '- ~ 1 \.. '\ \.. 'I~--~--r'\. ~~ ~. '-. 1 t\ \ .~ InO-F-~ \.t~~~ T~ -3 "'. "'. "K 1 ~¢, 1\ 1\ -. \. ' '\ ,,~ '-. '-. '-, '-. I \. \.. I "'-. ~ "'-. "'-. ~ f'.. " "'. [ \. \., \.. "'-. '\. ~'. '-. '\. ~~ '\. \! '\. , , " , ,
I ". !'. ". ~ '!;. ". '-,
~'" ~. \. "\ 1 \~14·0~~1\!:.' '\. '\. ~'tt T' l~ '.
\. '\, ~ '.. 1 '\, 900 '\
'.>. 1\. ~"b~ \.
1000
1050 -50
-60
\.
\J -40
-40
\.
\. \. \. " " \. "- " " \. f'. l\ '\. ~"'-¥ ,~ 1',-, \.\. ·h .Ot 0 ~ (~ UR~C¢ ) ~ '\, ~ ,
\j \j \ '\ '{ \l ~ :J... "l " -30 -20 -10 0 10 20 30 40 50 TEMPERATURE (Degrees Celsius)
I I I I I I -20 0 20 40 60 80 100 120
TEMPE RA TU R E (Degrees Fahrenheit)
23
20
~ w W LL
15 LL~ o .... Q)
(f)J:: o C.
V> Z 0 <{ E (f) ... ::J<{ 0-0
10 J: :;; ~-o
Z C ro ...
~~ O(f) ::J . ~2 i= ...J
- 5 <{
o
FIGURE 164. An upper air- observation made from an aircraft called an airplane observation or APOB. Maximum height of thermals and TI's are computed the same as in p~eceding examples except that TI's are for indicated altitudes instead of pressure levels. The APOB may be used in lieu of or as a supplement to the forecast.
189
mals to penetrate it and form convective clouds. Strongest thermals are beneath developing cumulus clouds.
Thermals intensify within a convective cloud; but evaporation cools the outer edges of the cloud causing a downdraft immediately surrounding it. Add to this the fact that downdrafts predominate between cumulus clouds, and you can see the slim chance of finding lift between clouds above the level of the cloud base. In general, thermal soaring during convective cloud activity is practical only at levels below the cloud base.
In chapter 6, we learned to estimate height in . thousands of feet of a convective cloud base by dividing the surface temperature-dew point spread by 4. If tne rising column were self-contained-that is, if no air were drawn into the sides of the thermal-the method would give a fairly accurate height of the base. However, this is not the case. Air is entrained or drawn into the sides of the thermal; and this entrained air lowers the water vapor content of the thermal allowing it to reach a somewhat higher level before condensation occurs. Bases of the clouds are generally 10 to 15 percent higher than the computed height.
Entrainment is a sticky problem; observers and forecasters can only estimate its effect. Until a positive technique is developed, heights of cumulus bases will tend to be reported and forecast too low. Currently, in the eastern United States, cumulus bases are seldom reported above 6,000 feet when the base may actually be 7,000 or 8,000 feet. In the western part of the country, cumulus bases have been observed by aircraft at 12,000 to 14,000 feet above the ground but seldom are reported above 10,000 feet.
CROSS-COUNTRY THERMAL SOARING A pilot can soar cross-country using either iso
lated thermals or thermal streets. When using isolated thermals, he gains altitude circling in thermals and then proceeds toward the next thermal in the general direction of his cross-country. Under a thermal street, he may be able to proceed with little if any circling if his chosen course parallels the thermal streets. It goes without saying that he can obtain the greatest distance by flying in the direction of the wind.
190
In the central and eastern United States, the most favorable weather for cross-country soaring occurs behind a cold front. Lindsay* has found that about 82 percent of thermal cross-countrys in these areas were made after a cold front had passed and ahead of the following high pressure center. Four factors contribute to making this pattern ideal. (1) The cold polar air is usually dry, and thermals can build to relatively high altitudes. (2) The polar air is colder than the ground; and thus, the warm ground aids solar radiation in heating the air. Thermals begin earlier in the morning and last later in the evening. On occasions, soarable lift has been found at night. (3) Quite often, colder air at high altitudes moves over the cold, low-level outbreak intensifying the instability and strengthening the thermals. (4) The wind profile frequently favors thermal streeting-a real boon to speed and distance.
The same four factors may occur with cold frontal passages over mountainous regions in the western United States. However, rugged mountains break up the circulation; and homogeneous conditions extend over smaller areas than over ,the eastern parts of the country. The western mountain regions and particularly the desert southwest have one decided advantage. Air is predominantly dry with more abundant daytime thermal activity favoring cross-country soaring although it may be for shorter distances.
Among the world's most favorable tracks for long distance soaring is a high plains corridor along the east slope of the Rocky Mountains stretching from southwest Texas to Canada. ** Many crosscountry records have been set in this corridor. Southwest Texas is the chosen site for many national and international soaring meets. Terrain in the corridor is relatively flat and high with few trees; terrain surface ranges from barren to short grass. These surface features favor strong thermal activity. Prevailing wind is southerly and moderately strong giving an added boost to northbound cross-coun trys.
*Charles V. Lindsay. "Types of Weather Favoring Cross-Country Soaring." Soaring, December 1964, pp. 6-9.
** For an in-depth discussion of this area, see "Thermal Soaring-Southwest Style," by David H. Owens, Soaring, May 1966, pp. 10-12.
FRONTAL SOARING
Wann air forced upward over cold air above a frontal surface can provide lift for soaring. However, good frontal lift is transitory, and it accounts for a very small portion of powerless flight. Seldom will you find a front parallel to your desired crosscountry route, and seldom will it stay in position long enough to complete a flight. A slowly moving front provides only weak lift. A fast moving front often plagues the soaring pilot with cloudiness and turbulence.
A front can on occasion provide excellent lift for a short period. You may on a cross-country be riding wave or ridge lift and need to move over a flat area to take advantage of thermals. A front may offer lift during your transition.
Fronts often are marked by a change in cloud type or amount. However, the very presence of clouds may deter you from the front. Spotting a dry front is difficult. Knowing that a front is in the vicinity and studying your aircraft reaction can tell you when you are in the frontal lift. Staying in the lift is another problem. Observing ground indicators of surface wind helps.
An approaching front may enhance thermal or hill soaring. An approaching front or a frontal passage most likely will disrupt a sea breeze or mountain wave. Post frontal thermals in cold air were discussed earlier.
SEA BREEZE SOARING
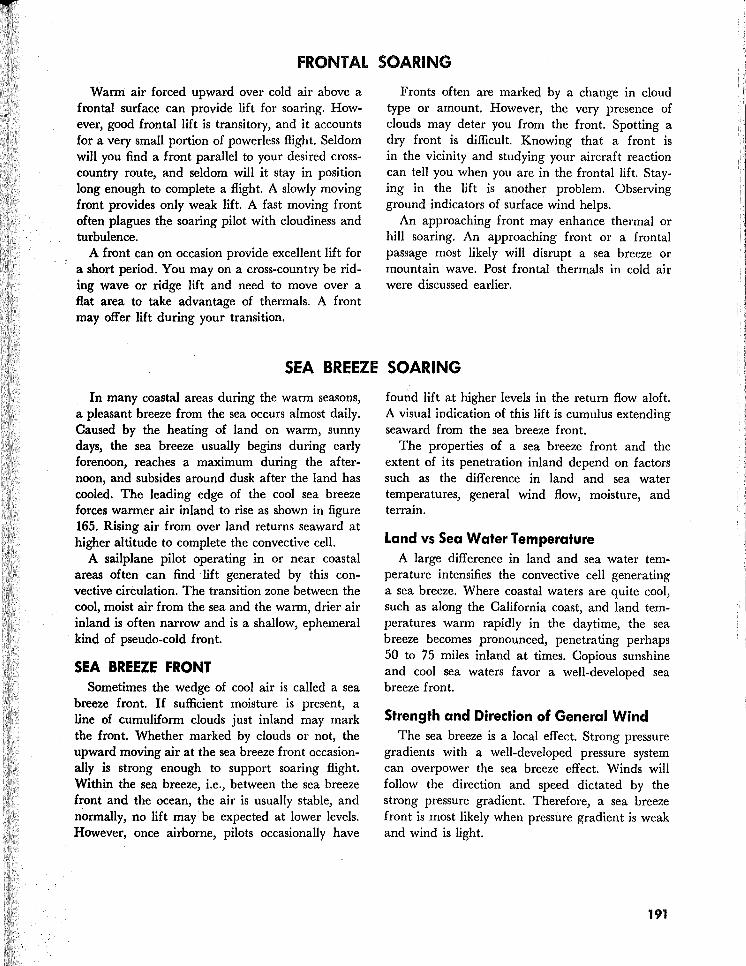
In many coastal areas during the wann seasons, a pleasant breeze from the sea occurs almost daily. Caused by the heating of land on wann, sunny days, the sea breeze usually begins during early forenoon, reaches a maximum during the afternoon, and subsides around dusk after the land has cooled. The leading edge of the cool sea breeze forces wanner air inland to rise as shown in figure 165. Rising air from over land returns seaward at higher altitude to complete the convective cell.
A sailplane pilot operating in or near coastal areas often can find lift generated by this convective circulation. The transition zone between the cool, moist air from the sea and the wann, drier air inland is often narrow and is a shallow, ephemeral kind of pseudo-cold front.
SEA BREEZE FRONT Sometimes the wedge of cool air is called a sea
breeze front. If sufficient moisture is present, a line of cumulifonn clouds just inland may mark the front. Whether marked by clouds or not, the upward moving air at the sea breeze front occasionally is strong enough to support soaring flight. Within the sea breeze, i.e., between the sea breeze front and the ocean, the air is usually stable, and nonnally, no lift may be expected at lower levels. However, once airborne, pilots occasionally have
found lift at higher levels in the return flow aloft. A visual indication of this lift is cumulus extending seaward from the sea breeze front.
The properties of a sea breeze front and the extent of its penetration inland depend on factors such as the difference in land and sea water temperatures, general wind flow, moisture, and terrain.
Land vs Sea Water Temperature A large difference in land and sea water tem
perature intensifies the convective cell generating a sea breeze. Where coastal waters are quite cool, such as along the California coast, and land temperatures wann rapidly in the daytime, the sea breeze becomes pronounced, penetrating perhaps 50 to 75 miles inland at times. Copious sunshine and cool sea waters favor a well-developed sea breeze front.
Strength and Direction of General Wind The sea breeze is a local effect. Strong pressure
gradients with a well-developed pressure system can overpower the sea breeze effect. Winds will follow the direction and speed dictated by the strong pressure gradient. Therefore, a sea breeze front is most likely when pressure gradient is weak and wind is light.
191
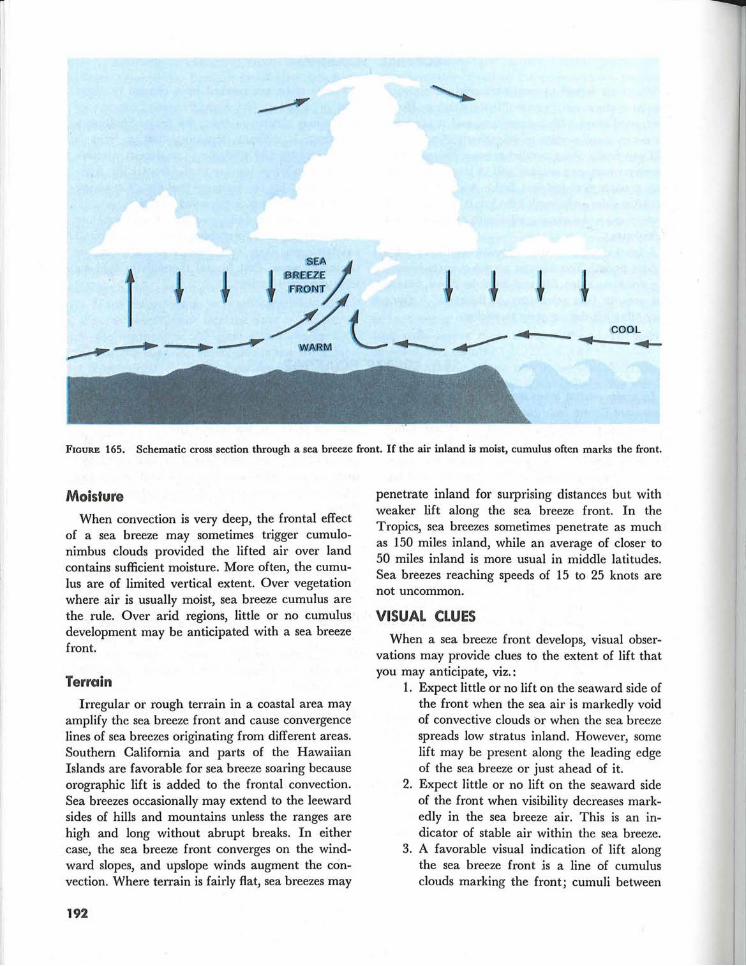
FIGURE 165. Schematic cross section through a sea breeze front. If the air inland is moist, cumulus often marks the front.
Moisture
When convection is very deep, the frontal effect of a sea breeze may sometimes trigger cumulonimbus clouds provided the lifted air over land contains sufficient moisture. More often, the cumulus are of limited vertical extent. Over vegetation where air is usually moist, sea breeze cumulus are the rule. Over arid regions, little or no cuinulus development may be anticipated with a sea breeze front.
Terrain
Irregular or rough terrain in a coastal area may amplify the sea breeze front and cause convergence lines of sea breezes originating from different areas. Southern California and parts of the Hawaiian Islands are favorable for sea breeze soaring because orographic lift is added to the frontal convection. Sea breezes occasionally may extend to the leeward sides of hills and mountains unless the ranges are high and long without abrupt breaks. In either case, the sea breeze front converges on the windward slopes, and upslope winds augment the convection. Where terrain is fairly fiat, sea breezes may
192
penetrate inland for surprising distances but with weaker lift along the sea breeze front. In the Tropics, sea breezes sometimes penetrate as much as 150 miles inland, while an average of closer to 50 miles inland is more usual in middle latitudes. Sea breezes reaching speeds of 15 to 25 knots are not uncommon.
VISUAL CLUES When a sea breeze front develops, visual obser
vations may provide clues to the extent of lift that you may anticipate, viz.:
1. Expect little or no lift on the seaward side of the front when the sea air is markedly void of convective clouds or when the sea breeze spreads low stratus inland. However, some lift may be present along the leading edge of the sea breeze or just ahead of it.
2. Expect little or no lift on the seaward side of the front when visibility decreases markedly in the sea breeze air. This is an indicator of stable air within the sea breeze.
3. A favorable visual indication of lift along the sea breeze front is a line of cumulus clouds marking the front; cumuli between

o I
the sea breeze front and the ocean also indicate possible lift within the sea breeze air, especially at higher levels. Cumulus bases in the moist sea air often are lower than along the front.
4. When a sea breeze front is void of cumulus but converging streamers of dust or smoke are observed, expect convection and' lift along the sea breeze front.
5. Probably the best combination to be sighted is cumuli and converging dust or smoke plumes along the sea breeze front as it moves upslope over hills or mountains. The upward motion is amplified by the upslope winds.
6. A difference in visibility between the sea air and the inland air often is a visual clue to the leading edge of the sea breeze. Visibility in the sea air may be restricted by haze while visibility inland is unrestricted. On the other hand, the sea air may be quite clear while visibility inland is restricted by dust or smoke.
10 I
1000
2000
3000
4000 .. 20 I
30 I
STATUTE MILES
LOCAL SEA BREEZE EXPLORATIONS Unfortunately, a sea breeze front is not always
easy to find, and it is likely that many an opportunity for sea breeze soaring goes unnoticed. As yet, little experience has been accrued in locating a belt of sea breeze lift without visual clues such as clouds, haze, or converging smoke or dust plumes. As the sport of soaring grows, so will the knowledge of sea breeze soaring expand and the peculiarities of more local areas come to light. In the United States, the area where the most experience probably has been gained is over the southern California high desert where the sea breeze moves eastward over the Los Angeles Coastal Plain into the Mojave Desert.
Los Angeles "Smoke Front" The sea breeze front moving from the Los An
geles coastal plain into the Mojave Desert has been dubbed the "Smoke Front." It has intense thermal activity and offers excellent lift along the leading edge of the front. Associated with the sea breeze
FIGURE 166. Sea breeze flow into the San Fernando Valley. Note the San Fernando convergence zone, upper left, and the Elsinore convergence zone, lower right.
193
that moves inland over the Los Angeles coastal plain are two important zones of convergence, shown in figure 166. Sea breezes of different origin meet in the convergence zones producing vertical currents capable of supporting sailplanes. One convergence line is the "San Fernando Convergence Zone;" a larger scale zone is in the Elsinore area, also shown in figure 166. This convergence zone apparently generates strong vertical currents since soaring pilots fly back and forth across the valley along the line separating smoky air to the north from relatively clear air to the south. Altitudes reached depend upon the stability, but usually fall within the 6,000 feet to 12,000 feet ASL range for the usual dry thermal type lift. Seaward, little or no lift is experienced in the sea breeze air marked by poor visibility.
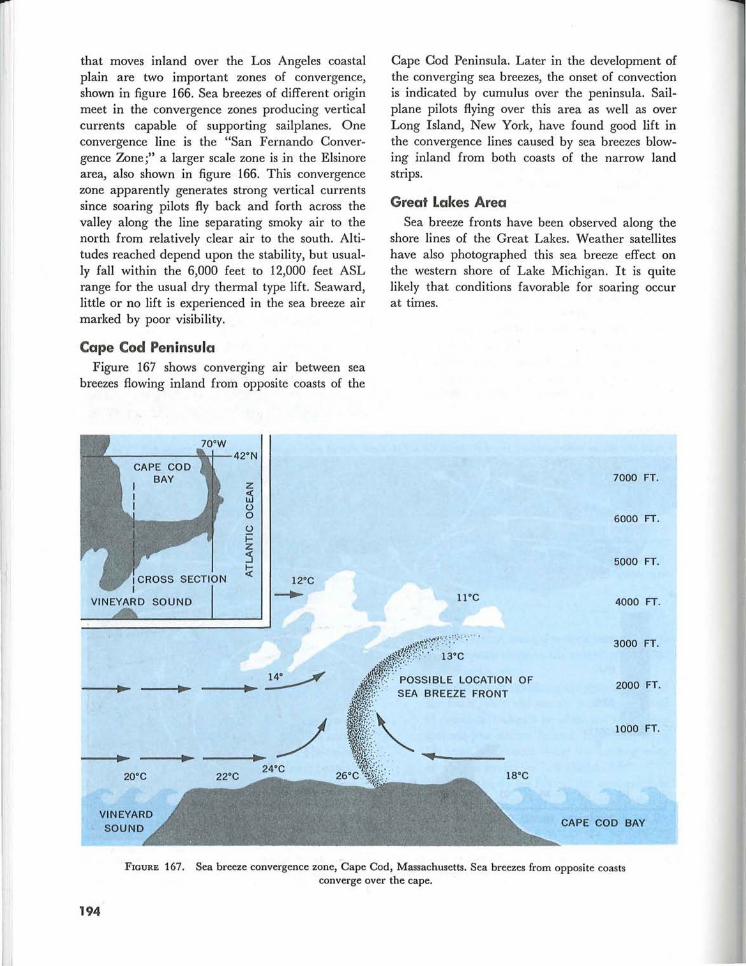
Cape Cod Peninsula Figure 167 shows converging air between sea
breezes flowing inland from opposite coasts of the
,..-------la.-\- 42°N
VINEYARD SOUND
12°C ~
Cape Cod Peninsula. Later in the development of the converging sea breezes, the onset of convection is indicated by cumulus over the peninsula. Sailplane pilots flying over this area as well as over Long Island, New York, have found good lift in the convergence lines caused by sea breezes blowing inland from both coasts of the narrow land strips.
Great Lakes Area Sea breeze fronts have been observed along the
shore lines of the Great Lakes. Weather satellites have also photographed this sea breeze effect on the western shore of Lake Michigan. It is quite likely that conditions favorable for soaring occur at times.
7000 FT.
6000 FT.
5000 FT.
11°C 4000 FT.
3000 FT.
OF 2000 FT.
1000 FT.
CAPE COD BAY
FIGURE 167. Sea breeze convergence zone, Cape Cod, Massachusetts. Sea breezes from opposite coasts converge over the cape.
194
RIDGE OR HILL SOARING
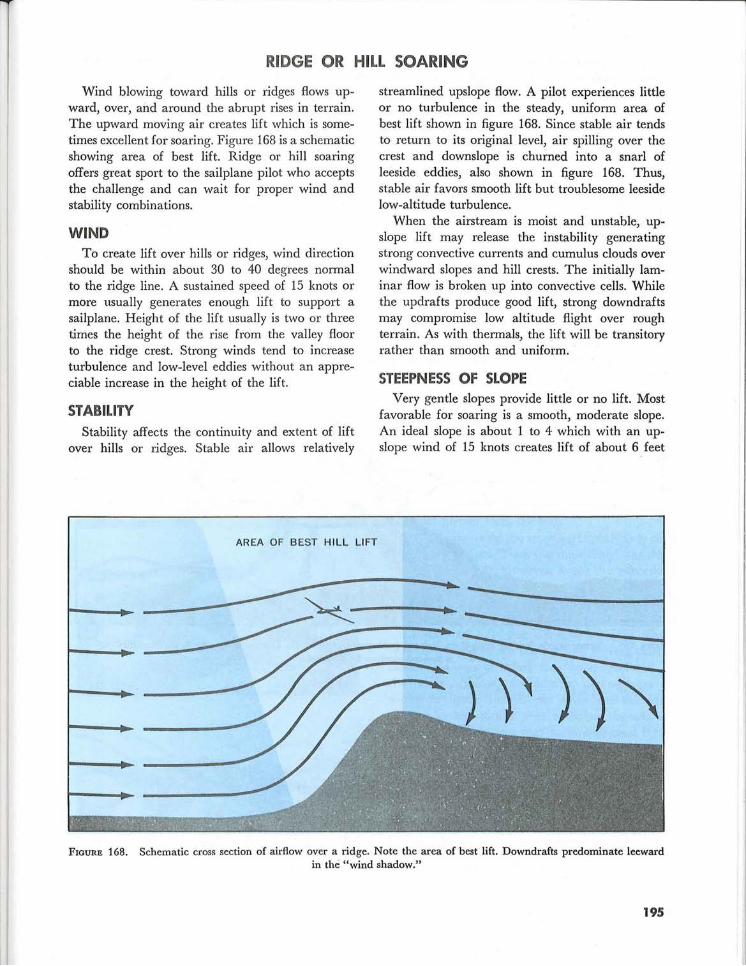
Wind blowing toward hills or ridges flows upward, over, and around the abrupt rises in terrain. The upward moving air creates lift which is sometimes excellent for soaring. Figure 168 is a schematic showing area of best lift. Ridge or hill soaring offers great sport to the sailplane pilot who accepts the challenge and can wait for proper wind and stability combinations.
WIND To create lift over hills or ridges, wind direction
should be within about 30 to 40 degrees normal to the ridge line. A sustained speed of 15 knots or more usually generates enough lift to support a sailplane. Height of the lift usually is two or three times the height of the rise from the valley floor to the ridge crest. Strong winds tend to increase turbulence and low-level eddies without an appreciable increase in the height of the lift.
STABILITY Stability affects the continuity and extent of lift
over hills or ridges. Stable air allows relatively
AREA OF BEST HILL LIFT
streamlined upslope flow. A pilot experiences little or no turbulence in the steady, uniform area of best lift shown in figure 168. Since stable air tends to return to its original level, air spilling over the crest and downslope is churned into a snarl of leeside eddies, also shown in f:igure 168. Thus, stable air favors smooth lift but troublesome leeside low-altitude turbulence.
When the airstream is moist and unstable, upslope lift may release the instability generating strong convective currents and cumulus clouds over windward slopes and hill crests. The initially laminar flow is broken up into convective cells. While the updrafts produce good lift, strong downdrafts may compromise low altitude flight over rough terrain. As with thermals, the lift will be transitory rather than smooth and uniform.
STEEPNESS OF SLOPE Very gentle slopes provide little or no lift. Most
favorable for soaring is a smooth, moderate slope. An ideal slope is about 1 to 4 which with an upslope wind of 15 knots creates lift of about 6 feet
~--
-;;
FIGURE 168. Schematic cross section of airflow over a ridge. Note the area of best lift. Downdrafts predominate leeward in the "wind shadow."
195
per second. With the same slope, a high-performance sailcraft with a sinking speed of 2 feet per second presumably could remain airborne with only a 5-knot wind!
Very steep escarpments or rugged slopes induce turbulent eddies. Strong wmds extend these eddies to a considerable height usually disrupting any
WIND DIRECTION
potential lift. The turbulent eddies also enhance the possibility of a low-altitude upset.
CONTINUITY OF RIDGES Ridges extending for several ' miles without
abrup't breaks tend to provide 'uniform lift through-
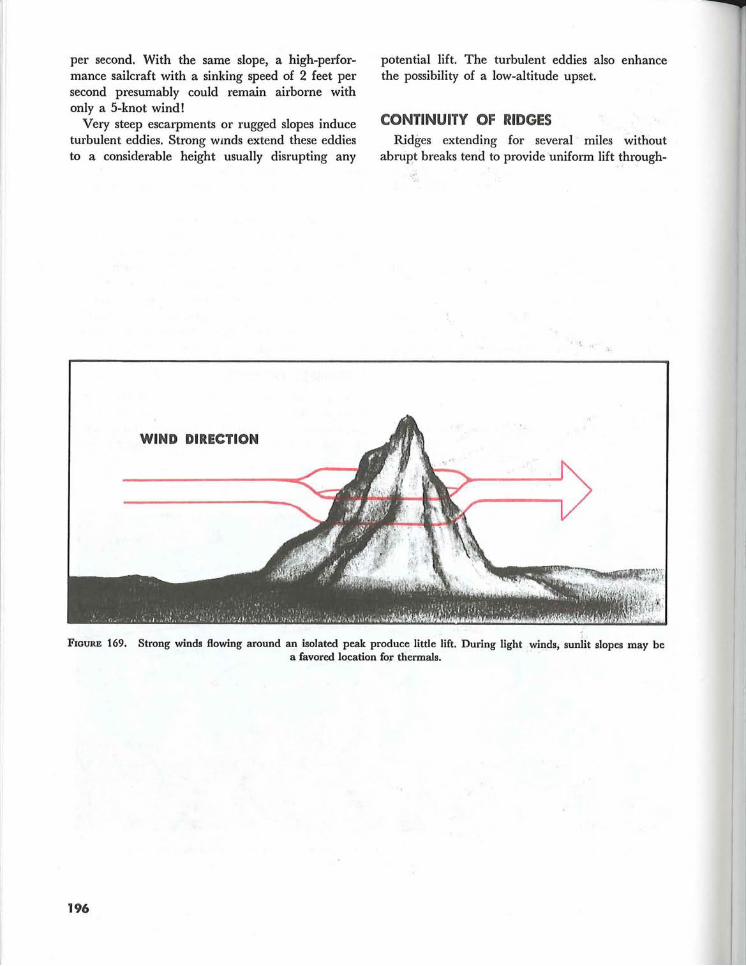
FIGURE 169. Strong winds flowing around an isolated peak. produce little lift. During light winds, sunlit slopes may be a favored location for- thermals.
196
out their length. In contrast, a single peak diverts wind flow around the peak as well as over it and thus is less favorable for soaring. Figure 169 shows wind flow around an isolated peak.
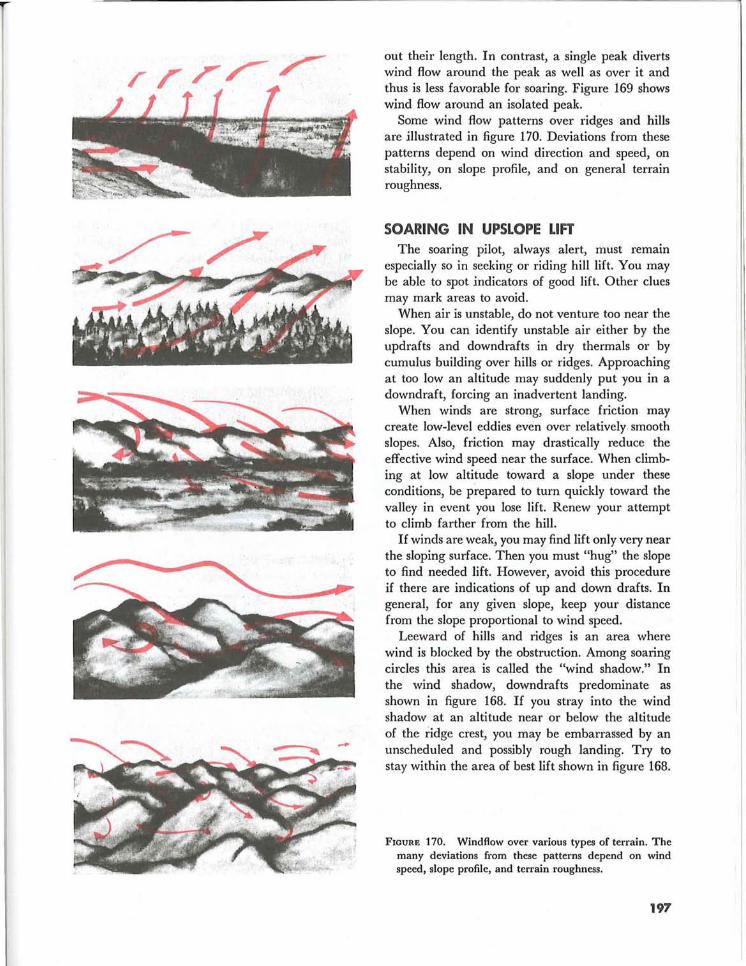
Some wind flow patterns over ridges and hills are illustrated in figure 170. Deviations from these patterns depend on wind direction and speed, on stability, on slope profile, and on general terrain roughness.
SOARING IN UPSLOPE LIFT The soaring pilot, always alert, must remain
especially so in seeking or riding hill lift. You may be able to spot jndicators of good lift. Other clues may mark areas to avoid.
When air is unstable, do not venture too near the slope. You can identify unstable air either by the updrafts and downdrafts in dry thermals or by cumulus building over hills or ridges. Approaching at too Iowan altitude may suddenly put you in a downdraft, forcing an inadvertent landing.
When winds are strong, surface friction may create low-level eddies even over relatively. smooth slopes. Also, friction may drastically reduce the effective wind speed near the surface. When climbing at low altitude toward a slope under these conditions, be prepared to turn quickly toward the valley in event you lose lift. Renew your attempt to climb farther from the hill.
If winds are weak, you may find lift only very near the sloping surface. Then you must "hug" the slope to find needed lift. However, avoid this procedure if there are indications of up and down drafts. In general, for any given slope, keep your distance from the slope proportional to wind speed.
Leeward of hills and ridges is an area where wind is blocked by the obstruction. Among soaring circles thls area is called the "wind shadow." In the wind shadow, downdrafts predominate as shown in figure 168. If you stray into the wind shadow at an altitude near or below the altitude of the ridge crest, you may be embarrassed by an unscheduled and possjbly rough landing. Try to stay within the area of best lift shown in figure 168.
FIGURE 170. Wind flow over various types of terrain. The many deviations from these patterns depend on wind speed, slope profile, and terrain roughness.
197
MOUNTAIN WAVE SOARING
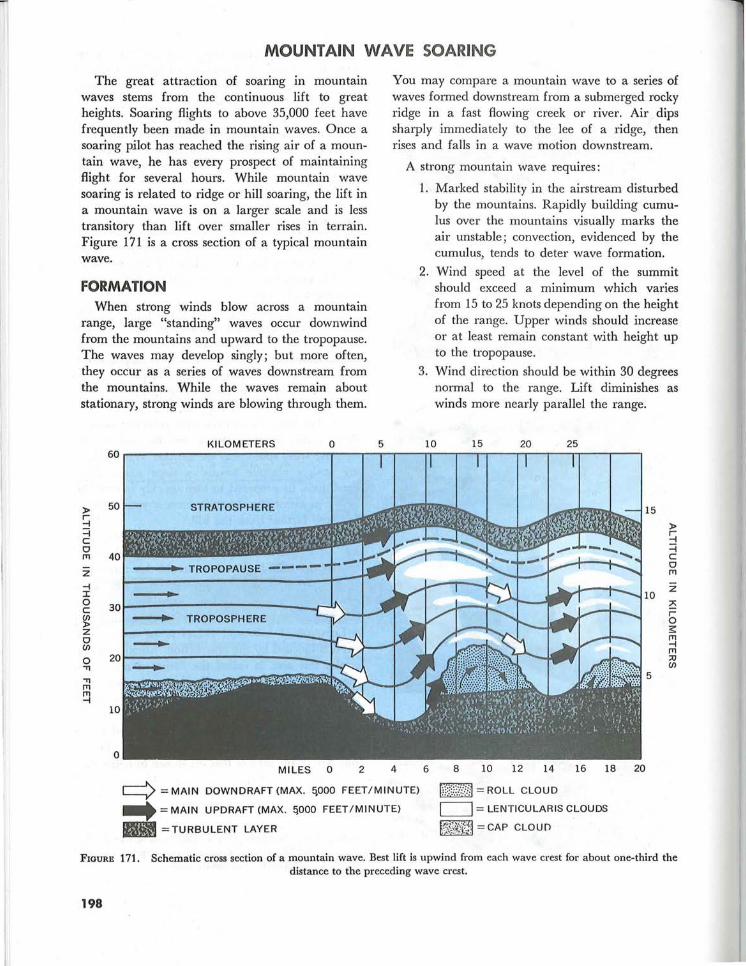
The great attraction of soaring in mountain waves stems from the continuous lift to great heights. Soaring flights to above 35,000 feet have frequently been made in mountain waves. Once a soaring pilot has reached the rising air of a mountain wave, he has every prospect of maintaining flight for several hours. While mountain wave soaring is related to ridge or hill soaring, the lift in a mountain wave is on a larger scale and is less transitory than lift over smaller rises in terrain. Figure 171 is a cross section of a typical mountain wave.
FORMATION When strong winds blow across a mountain
range, large "standing" waves occur downwind from the mountains and upward to the tropopause. The waves may develop singly; but more often, they occur as a series of waves downstream from the mountains. While the waves remain about stationary, strong winds are blowing through them.
KILOMETERS o 5
You may compare a mountain wave to a series of waves formed downstream from a submerged rocky ridge in a fast flowing creek or river. Air dips sharply immediately to the lee of a ridge, then rises and falls in a wave motion downstream.
A strong mountain wave requires:
1. Marked stability in the airstream disturbed by the mountains. Rapidly building cumulus over the mountains visually marks the air unstable; convection, evidenced by the cumulus, tends to deter wave formation.
2. Wind speed at the level of the summit should exceed a minimum which varies from 15 to 25 knots depending on the height of the range. Upper winds should increase or at least remain constant with height up to the tropopause.
3. Wind direction should be within 30 degrees normal to the range. Lift diminishes as winds more nearly parallel the range.
10 15 20 25 60 ~-------------------------r---r-.~---.r--'--rT---''--'--II---'---'
Z
-f :I: o C
~ Z CJ U>
o " " rTJ
~
50 STRATOSPHERE
• 30 ~-----------------------r-U\
---t.~ TROPOSPHERE >---i-_-
20 ~---------------------__
10
o MILES 0 2 4
c:::> = MAIN DOWNDRAFT (MAX. 5,000 FEET/MINUTE)
.... = MAIN UPDRAFT (MAX. 5,000 FEET/MINUTE)
l1li =TURBULENT LAYER
6
15
10
5
8 10 12 14 16 18 20
hi~:.:/A = ROLL CLOUD
[==:J = LENTICULAR IS CLOUDS
~ CAP CLOU .... ~== II
~
~ ::j c CJ rTJ
Z
~ r 0 3::: rTJ -f rTJ ::u U>
FIGURE 171. Schematic cross section of a mountain wave. Best lift is upwind from each wave crest for about one-third the distance to the preceding wave crest.
198
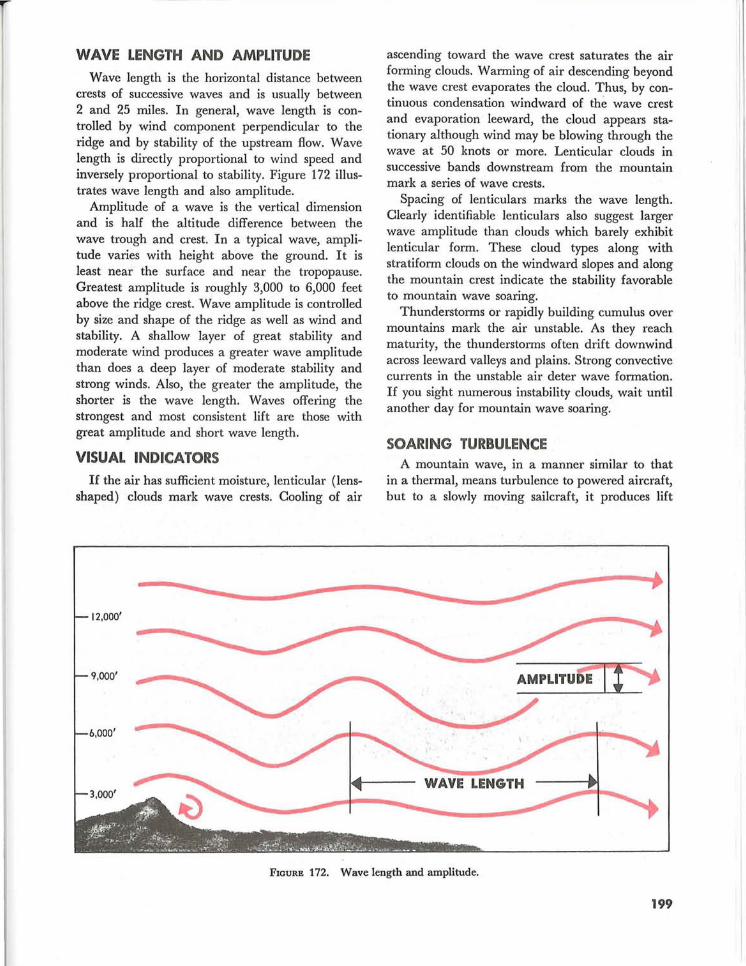
WAVE LENGTH AND AMPLITUDE Wave length is the horizontal distance between
crests of successive waves and is usually between 2 and 25 miles. In general, wave length is controlled by wind component perpendicular to the ridge and by stability of the upstream flow. Wave length is directly proportional to wind speed. and inversely proportional to stability. Figure 172 1llustrates wave length and also amplitude.
Amplitude of a wave is the vertical dimension and is half the altitude difference between the wave trough and crest. In a typical wave, ampl~tude varies with height above the ground. It 1S least near the surface and near the tropopause. Greatest amplitude is roughly 3,000 to 6,000 feet above the ridge crest. Wave amplitude is controlled by size and shape of the ridge as well as ,:~nd and stability. A shallow layer of great stab1hty . and moderate wind produces a greater wave amphtude than does a deep layer of moderate stability and strong winds. Also, the greater the amplitude, the shorter is the wave length. Waves offering the strongest and most consistent lift are those with great amplitude and short wave length.
VISUAL INDICATORS If the air has sufficient moisture, lenticular (lens
shaped) clouds mark wave crests. Cooling of air
12.000'
9,000'
6,000'
ascending toward the wave crest saturates the air forming clouds. Warming of air descending beyond the wave crest evaporates the cloud. Thus, by continuous condensation windward of the wave crest and evaporation leeward, the cloud appears stationary although wind may be blowing through the wave at 50 knots or more. Lenticular clouds in successive bands downstream from the mountain mark a series of wave crests.
Spacing of lenticulars marks the wave length. Clearly identifiable lenticulars also suggest larger wave amplitude than clouds which barely exhibit lenticular form. These cloud types along with stratiform clouds on the windward slopes and along the mountain crest indicate the stability favorable to mountain wave soaring.
Thunderstorms or rapidly building cumulus over mountains mark the air unstable. As they reach maturity, the thunderstorms often drift downwi.nd across leeward valleys and plains. Strong convective currents in the unstable air deter wave formation. If you sight numerous instability clouds, wait until another day for mountain wave soaring.
SOARING TURBULENCE A mountain wave, in a manner similar to that
in a thermal, means turbulence to powered aircra~t, but to a slowly moving sailcraft, it produces hft
..
FIGURE 172. Wave length and amplitude.
199
and sink above the level of the mountain crest. But as air spills over the crest like a waterfall, it causes strong downdrafts. The violent overturning forms a series of "rotors" in the wind shadow of the mountain which are hazardous even to a sailplane (see ch. 9, figs. 81 through 84). Clouds resembling long bands of stratocumulus sometimes mark the area of overturning air. These "rotor clouds" appear to remain stationary, parallel the range, and stand a few miles leeward of the mountains. Turbulence is most frequent and most severe in the standing rotors just beneath the wave crests at or below mountain-top levels. This rotor turbulence is especially violent in waves generated by large mountains such as the Rockies. Rotor turbulence with lesser mountains is much less severe but is always present to some extent. The turbulence is greatest in well-developed waves.
FAVORED AREAS Mountain waves occur most frequently along
the central and northern Rockies and the northern Appalachians. Occasionally, waves form to the lee of mountains in Arkansas, Oklahoma, and southwestern Texas. Weather satellites have observed waves extending great distances downwind from the Rocky Mountains; one series extended for nearly 700 miles. The more usual distance is 150 to 300 miles. WillIe Appalachian waves are not as strong as those over the Rockies, they occur frequently; and satellites have observed them at an
average of 115 miles downwind. Wave length of these waves averages about 10 nautical miles.
RIDING THE WAVES You often can detect a wave by the uncanny
smoothness of your climb. On first locating a wave, turn into the wind and attempt to climb directly over the spot where you first detected lift provided you can remain at an altitude above the level of the mountain crest. The lee side turbulent area is for the experienced pilot only. After cautiously climbing well up into the wave, attempt to determine dimensions of the zone of lift. If the wave is over rugged terrain, it may be impossible and unnecessary to determine the wave length. Lift over such terrain is likely to be in patchy bands. Over more even terrain, the wave length may be easy to determine and use in planning the next stage of flight.
Wave clouds are a visual clue in your search for lift. The wave-like shape of lenticulars is usually more obvious from above than from below. Lift should prevail from the crest of the lenticulars upwind about one-third the wave length. When your course takes you across the waves, climb on the windward side of the wave and fly as quickly as possible to the windward side of the next wave. Wave lift of 300 to 1,206 feet per minute is not uncommon. Soaring pilots have encountered vertical currents exceeding 3,000 feet per minute, the strongest ever reported being 8,000 feet per minute.
IN CLOSING
Records are made to be broken. Altitude and distance records are a prime target of many sailplane enthusiasts. Distance records may be possible by flying a combination of lift sources such as thermal, frontal, ridge, or wave. Altitude records are set in mountain waves. Altitudes above 46,000 feet have been attained over the Rocky Mountains; soaring flights to more than 24,000 feet have been made in Appalachian waves; and flights to as high
200
as 20,000 feet have been recorded from New England to North Carolina.
We sincerely hope that this chapter has given you an insight into the minute variations in weather that profoundly affect a soaring aircraft. When you have remained airborne for hours without power, you have met a unique challenge and experienced a singular thrill of flying.
GLOSSARY OF WEATHER TERMS
A
absolute instability-A state of a layer within the atmosphere in which the vertical distribution of temperature is such that an air parcel, if given an upward or downward push, wiII move away from its initial level without further outside force being applied.
absolute temperature scale-See Kelvin Temperature Scale.
absolute vorticity-8ee vorticity.
adiabatic process-The process by which fixed relationships are maintained during changes in temperature, volume, and pressure in a body of air without heat being added or removed from the body.
advection-The horizontal transport of air or atmospheric properties. In meteorology, sometimes referred to as the horizontal component of convection.
advection fog-Fog resulting from the transport of warm, humid air over a cold surface.
air density-The mass density of the air in terms of weight per unit volume.
air mass-In meteorology, an extensive body of air within which the conditions of temperature and moisture in a horizontal plane are essentially uniform.
air mass classmcation-A system used to identify and to characterize the different air masses according to a basic scheme. The system most commonly used classifies air masses primarily according to the thermal properties of their source regions: "tropical" (T); "polar" (P); and "Arctic" or "Antarctic" (A). They are further classified according to moisture characteristics as "continental" (c) or "maritime" (m).
air parcel-8ee parcel.
albedo-The ratio of the amount of electromagnetic radiation reflected by a body to the amount incident upon it, commonly expressed in percentage; in meteorology, usually used in reference to insolation (solar radiation); i.e., the albedo of wet sand is 9, meaning that about 9% of the incident insolation is reflected; albedoes of other surfaces range upward to 80-85 for fresh snow cover; average albedo for the earth and its atmosphere has been calculated to range from 35 to 43.
altimeter-An instrument which determines the altitude of an object with respect to a fixed level. See pressure altimeter.
altimeter setting-The value to which the scale of a pressure altimeter is set so as to read true altitude at field elevation.
altimeter setting indicator-A preClSlon aneroid barometer calibrated to indicate directly the altimeter setting.
altitude-Height expressed in units of distance above a reference plane, usually above mean sea level or above ground.
(1) corrected altitude-Indicated altitude of an aircraft altimeter corrected for the temperature of the column of air below the aircraft, the correction being based on the estimated departure of existing temperature from standard atmospheric temperature; an approximation of true altitude.
(2) density altitude-The altitude in the standard atmosphere at which the air has the same density as the air at the point in question. An aircraft will have the same performance characteristics as it would have in a standl!-rd atmosphere at this altitude.
(3) indicated altitude-The altitude above mean sea level indicated on a pressure altimeter set at current local altimeter setting.
(4) pressure altitude-The altitude in the standard atmosphere at which the pressure is the same as at the point in question. Since an altimeter operates solely on pressure, this is the uncorrected altitude indicated by an altimeter set at standard sea level pressure of 29.92 inches or 1013 millibars.
(5) radar altitude-The altitude of an aircraft determined by radar-type radio altimeter; thus the actual distance from the nearest terrain or water feature encompassed by the downward directed radar beam. For all practical purposes, it is the" actual" distance above a ground or inland water surface or the true altitude above an ocean surface.
(6) true altitude-The exact distance above mean sea level.
altocumulus-White or gray layers or patches of cloud, often with a waved appearance; cloud elements appear as rounded masses or rolls; composed mostly of liquid water droplets which may be supercooled; may contain ice crystals at subfreezing temperatures.
altocumulus castellanus-A species of middle cloud of which at least a fraction of its upper part presents some vertically developed, cumuliform protuberances (some of which are taller than they are wide, as castles) and which give the cloud a crenelated or turreted appearance; especially evident when seen from the side; elements usually have a common base arranged in lines. This cloud indicates instability and turbulence at the altitudes of occurrence.
anemometer-An instrument for measuring wind speed.
201
aneroid barometer-A barometer which operates on the principle of having changing atmospheric pr;essure bend a metallic surface which, in turn, moves a pointer across a scale graduated in units of pressure.
angel-In radar meteorology, an echo caused by physical phenomena not discernible to the eye; they have been observed when abnormally strong temperature and/or moisture gradients were known to exist; sometimes attributed to insects or birds flying in the radar beam.
anomalous propagation (sometimes called AP)-In radar meteorology, the greater than normal bending of the radar beam such that echoes are received from ground targets at distances greater than normal ground clutter.
anticyclone-An area of high atmospheric pressure which has a closed circulation that is anticyclonic, i.e., as viewed from above, the circulation is clockwise in the Northern Hemisphere, counterclockwise in the Southern Hemisphere, undefined at the Equator.
anvil cloud-Popular name given to the top portion of a cumulonimbus cloud having an anvil-like form.
APOB-A sounding made by an aircraft.
Arctic air-An air mass with characteristics developed mostly in winter over Arctic surfaces of ice and snow. Arctic air extends to great heights, and the surface temperatures are basically, but not always, lower than those of polar air.
Arctic front-The surface of discontinuity between very cold (Arctic) air flowing directly from the Arctic region and another less cold and, consequently, less dense air mass.
astronomical twilight--8ee twilight.
atmosphere-The mass of air surrounding the Earth.
atmospheric pressure (also called barometric pressure)-The pressure exerted by the atmosphere as a consequence of gravitational attraction exerted upon the "column" of air lying directly above the point in question.
atmospherics-Disturbing effects produced in radio receiving apparatus by atmospheric electrical phenomena such as an electrical storm. Static.
aurora-A luminous, radiant emission over middle and high latitudes confined to the thin air of high altitudes and centered over the earth's magnetic poles. Called "aurora borealis" (northern lights) or "aurora australis" according to its occurrence in the Northern or Southern Hemisphere, respectively.
attenuation-In radar meteorology, any process which reduces power density in radar signals.
(1) precipitation attenuation-Reduction of power density because of absorption or reflection of energy by precipitation.
(2) range attenuation-Reduction of radar power density because of distance from the antenna. It occurs in the outgoing beam at a rate proportional to 1/range2 • The return signal is also attenuated at the same rate.
202
B backing-Shifting of the wind in a counterclockwise di
rection with respect to either space or time; opposite of veering. Commonly used by meteorologists to refer to a cyclonic shift (counterclockwise in the Northern Hemisphere and clockwise in the Southern Hemisphere).
baCkscatter-Pertaining to radar, the energy reflected or scattered by a target; an echo.
banner cloud (also called cloud banner)-A banner-like cloud streaming off from a mountain peak.
barograph-A continuous-recording barometer.
barometer-An instrument for measuring the pressure of the atmosphere; the two principle types are mercurial and aneroid.
barometric altimeter--8ee pressure altimeter.
barometric pressure-Same as atmospheric pressure.
barometric tendency-The change of barometric pressure within a specified period of time. In aviation weather observation~, routinely determined periodically, usually for a 3-hour period.
beam resolution--8ee resolution.
Beaufort scale-A scale of wind speeds.
black blizzard-Same as duststorm.
blizzard-A severe weather condition characterized by low temperatures and strong winds bearing a great amount of snow, either falling or picked up from the ground.
blowing dust-A type of lithometeor composed of dust particles picked up locally from the surface and blown about in clouds or sheets.
blowing sand-A type of lithometeor composed of sand picked up locally irom the surface and blown about in clouds or sheets.
blowing snow-A type of hydrometeor composed of snow picked up from the surface by the wind and carried to a height of 6 feet or more.
blowing spray-A type of hydrometeor composed of water particles picked up by the wind from the surface of a large body of water.
bright band-In radar meteorology, a narrow, intense echo on the range-height indicator scope resulting from watercovered ice particles of high reflectivity at the melting level.
Buys Ballot's law-If an observer in the Northern Hemisphere stands with his back to the wind, lower pressure is to his left.
c calm-The absence of wind or of apparent motion of the
air.
cap cloud (also called cloud cap)-A standing or stationary cap-like cloud crowning a mountain summit.
ceiling-In meteorology in the U.S., (1) the height above the surface of the base of the lowest layer of clouds or obscuring phenomena aloft that hides more than half of the sky, or (2) the vertical visibility into an obscuration. See summation principle.
ceiling balloon-A small balloon used to determine the height of a cloud base or the extent of vertical visibility.
ceiling light-An instrument which projects a vertical light beam onto the base of a cloud or into surfacebased obscuring phenomena; used at night in conjunction with a clinometer to determine the height of the cloud base or as an aid in estimating the vertical visibility.
ceilometer-A cloud-height measuring system. It projects light on the cloud, detects the reflection by a photoelectric cell, and determines height by triangulation.
Celsius temperature scale (abbreviated C)-A temperature scale with zero degrees as the melting point of pure ice and 100 degrees as the boiling point of pure water at standard sea level atmospheric pressure.
Centigrade temperature scale-Same as Celsius temperature scale.
chaff-Pertaining to radar, (1) short, fine strips of metallic foil dropped from aircraft, usually by military forces, specifically for the purpose of jamming radar; (2) applied loosely to echoes resulting from chaff.
change of state-In meteorology, the transformation of water from one form, i.e., solid (ice), liquid, or gaseous (water vapor), to any other form. There are six possible transformations designated by the five terms following:
(1) condensation-The change of water vapor to liquid water.
(2) evaporation-The change of liquid water to water vapor.
(3) freezing-The change of liquid water to ice.
(4) melting-The change of ice to liquid water.
(5) sublimation-The change of (a) ice to water vapor or (b) water vapor to ice. See latent heat.
Chinook-A warm, dry foehn wind blowing down the eastern slopes of the Rocky Mountains over the adjacent plains in the U.S. and Canada.
cirri form-All species and varieties of cirrus, cirrocumulus, and cirrostratus clouds; descriptive of clouds composed mostly or entirely of small ice crystals, usually transparent and white; often producing halo phenomena not observed with other cloud forms. Average height ranges upward from 20,000 feet in middle latitudes.
cirrocumulus-A cirriform cloud appearing as a thin sheet of small white puffs resembling flakes or patches of cotton without shadows; sometimes confused with altocumulus.
cirrostratus-A cirriform cloud appearing as a whitish veil, usually fibrous, sometimes smooth; often produces halo phenomena; may totally cover the sky.
cirrus-A cirriform cloud in the form of thin, white featherlike clouds in patches or narrow bands; have a fibrous and/or silky sheen; large ice crystals often trail down-
ward a considerable vertical distance in fibrous, slanted, or irregularly curved wisps called mares' tails.
civil twilight-See twilight.
clear air turbulence (abbreviated CAT)-Turbulence encountered in air where no clouds are present; more popularly applied to high level turbulence associated with wind shear.
clear icing (or clear ice)-Generally, the formation of a layer or mass of ice which is relatively transparent because of its homogeneous structure and small number and size of air spaces; used commonly as synonymous with glaze, particularly with respect to aircraft icing. Compare with rime icing. Factors which favor clear icing are large drop size, such as those found in cumuliform clouds, rapid accretion of supercooled water, and slow dissipation of latent heat of fusion.
climate-The statistical collective of the weather conditions of a point or area during a specified interval of time (usually several decades); may be expressed in a variety of ways.
climatology-The study of climate.
clinometer-An instrument used in weather observing for measuring angles of inclination; it is used in conjunction with a ceiling light to determine cloud height at night.
cloud bank-Generally, a fairly well-defined mass of cloud observed at a distance; it covers an appreciable portion of the horizon sky, but does not extend overhead.
cloudburst-In popular teminology, any sudden and heavy fall of rain, almost always of the shower type.
cloud cap-See cap cloud.
cloud detection radar-A vertically directed radar to detect cloud bases and tops.
cold front-Any non-occluded front which moves in such a way that colder air replaces warmer air.
condensation-See change of state.
condensation level-The height at which a rising parcel or layer of air would become saturated if lifted adiabatically.
condensation nuclei-Small particles in the air on which water vapor condenses or sublimates.
condensation trail (or contrail) (also called vapor trail)A cloud-like streamer frequently observed to form behind aircraft flying in clear, cold, humid air.
conditionally unstable air-Unsaturated air that will become unstable on the condition it becomes saturated. See instability.
conduction-The transfer of heat by molecular action through a substance or from one substance in contact with another; transfer is always from warmer to colder temperature.
constant pressure chart-A chart of a constant pressure surface; may contain analyses of height, wind, temperature, humidity, and/or other elements.
203
continental polar air--S'ee polar air.
continental tropical air--S'ee tropical air.
contour-In meteorology, (1) a line of equal height on a constant pressure chart; analogous to contours on a relief map; (2) in radar meteorology, a line on a radar scope of equal echo intensity.
"-contouring circuit-On weather radar, a circuit which
displays multiple contours of echo intensity simultaneously on the plan position indicator or range-height indicator scope. See contour (2).
contrail-Contraction for condensation trail.
convection-(l) In general, mass motions within a fluid resulting in transport and mixing of the properties of that fluid. (2) In meteorology, atmospheric motions that are predominantly vertical, resulting in vertical transport and mixing of atmospheric properties; distinguished from advection.
convective cloud--S'ee cumuliform.
convective condensation level (abbreviated CCL)-The lowest level at which condensation will occur as a result of convection due to surface heating. When condensation occurs at this level, the layer between the surface and the CCL will be thoroughly mixed, temperature lapse rate will be dry adiabatic, and mixing ratio will be constant.
convective instability-The state of an unsaturated layer of air whose lapse rates of temperature and moisture are such that when lifted adiabatically until the layer becomes saturated, convection is spontaneous.
convergence-The condition that exists when the distribution of winds within a given area is such that there is a net horizontal inflow of air into the area. In convergence at lower levels, the removal of the resulting excess is accomplished by an upward movement of air; consequently, areas of low-level convergent winds are regions favorable to the occurrence of clouds and precipitation. Compare with divergence.
Coriolis force-A deflective force resulting from earth's rotation; it acts to the right of wind direction in the Northern Hemisphere and to the left in the Southern Hemisphere.
corona-A prismatically colored circle or arcs of a circle with the sun or moon at its center; coloration is from blue inside to red outside (opposite that of a halo); varies in size (much smaller) as opposed to the fixed diameter of the halo; characteristic of clouds composed of water droplets and valuable in differentiating between middle and cirriform clouds.
corposant--S'ee St. Elmo's Fire.
corrected altitude (approximation of true altitude)--S'ee altitude.
cumuliform-A term descriptive of all convective clouds exhibiting vertical development in contrast to the horizontally extended stratiform types.
cumulonimbus-A cumuliform ~loud·type; it is heavy and dense, with considerable vertical extent in the form of
204
massive towers; often with tops in the shape of an anvil or massive plume; under the base of cumulonimbus, which often is very dark, there frequently exists virga, precipitation and low ragged clouds (scud), either merged with it or not; frequently accompanied by lightning, thunder, and sometimes hail; occasionally produces a tornado or a waterspout; the ultimate manifestation of the growth of a cumulus cloud, occasionally extending well into the stratosphere.
cumulonimbus mamma-A cumulonimbus cloud having hanging protuberances, like pouches, festoons, or udders, on the under side of the cloud; usually indicative of severe turbulence.
cumulus-A cloud in the form of individual detached domes or towers which are usually dense and well defined; develops vertically in the form of rising mounds of which the bulging upper part often resembles a cauliflower; the sunlit parts of these clouds are mostly brilliant white; their bases are relatively dark and nearly horizontal.
cumulus fractus--S'ee fractus.
cyclogenesis-Any development or strengthening of cyclonic circulation in the atmosphere.
cyclone-(l) An area of low atmospheric pressure,. which has a closed circulation that is cyclonic, i.e., as viewed from above, the circulation is counterclockwise in-the Northern Hemisphere, clockwise in the Southern Hemisphere, undefined at the Equator. Because cyclonic circulation and relatively low atmospheric pressure usually coexist, in common practice the terms cyclone and low are used interchangeably. Also, because cyclones often are accompanied by inclement (sometimes destructive) weather, they are frequently referred to simply as storms. (2) Frequently misused to denote a tornado. (3) In the Indian Ocean, a tropical cyclone of hurricane or typhoon force.
D
deepening-A decrease in the central pressure of a pressure system; usually applied to a low rather than to a high, although technically, it is acceptable in either sense.
density-(l) The ratio of the mass of any substance to the volume it occupies-weight per unit volume. (2) The ratio of any quantity to the volume or area it occupies, i.e., population per unit area, power densiry.
density altitude-See altitude.
depression-In meteorology, an area of low pressure; a low or trough. This is usually applied to a certain stage in the development of a tropical cyclone, to migratory lows and troughs, and to upper-level lows and troughs that are only weakly developed.
dew-Water condensed onto grass and other objects near the ground, the temperatures of which have fallen below the initial dew point temperature of the surface air, but is still above freezing. Compare with frost.
dew point (or dew-point temperature)-The temperature to which a sample of air must be cooled, while the
mixing ratio and barometric pressure remain constant, in order to attain saturation with respect to water.
discontinuity-A zone with comparatively rapid transition of one or more meteorological elements.
disturbance-In meteorology, applied rather loosely: (1) any low pressure or cyclone, but usually one that is relatively small in size; (2) an area where weather, wind, pressure, etc., show signs of cyclonic development; (3) any deviation in flow or pressure that is associated with a disturbed state of the weather, i.e., cloudiness and precipitation; and (4) any individual circulatory system within the primary circulation of the atmosphere.
diurnal-Daily, especially pertaining to a cycle completed within a 24-hour period, and which recurs every 24 hours.
divergence-The condition that exists when the distribution of winds within a given area is such that there is a net horizontal flow of air outward from the region. In divergence at lower levels, the resulting deficit is compensated for by subsidence of air from aloft; consequently the air is heated and the relative humidity lowered making divergence a warming and drying process. Low-level divergent regions are areas unfavorable to the occurrence of clouds and precipitation. The opposite of convergence.
doldrums-The equatorial belt of calm or light and variable winds between the two tradewind belts. Compare intertropical convergence zone.
dowrldraft-A relative small scale downward current of air; often observed on the lee side of large objects restricting the smooth flow of the air or in precipitation areas in or near cumuliform clouds.
drifting snow-A type of hydrometeor composed of snow particles picked up from the surface, but carried to a height of less than 6 feet.
drizzle-A form of precipitation. Very small water drops that appear to float with the air currents while falling in an irregular path (unlike rain, which falls in a comparatively straight path, and unlike fog droplets which remain suspended in the air).
dropsonde-A radiosonde dropped by parachute from an aircraft to obtain soundings (measurements) of the atmosphere below.
dry adiabatic lapse rate-The rate of decrease of temperature with height when unsaturated air is lifted adiabatically (due to expansion as it is lifted to lower pressure). See adiabatic process.
dry bulb-A name given to an ordinary thermometer used to determine temperature of the air; also used as a contraction for dry-bulb temperature. Compare wet bulb.
dry-bulb temperature-The temperature of the air.
dust-A type of lithometeor composed of small earthen particles suspended in the atmosphere.
dust devil""":A small, vigorous whirlwind, usually of short duration, rendered visible by dust, sand, and debris picked up from the ground.
duster-Same as duststorm.
duststorm (also called duster, black blizzard)-An unusual, frequently severe weather condition characterized by strong winds and dust-filled air over an extensive area.
D-value-Departure of true altitude from pressure altitude (see altitude); obtained by algebraically subtracting true altitude from pressure altitude; thus it may be plus or minus. On a constant pressure chart, the difference between actual height and standard atmospheric height of a constant pressure surface.
E
echo--In radar, (1) the energy reflected or scattered by a target; (2) the radar scope presentation of the return from a target.
eddy-A local irregularity of wind in a larger scale wind flow. Small scale eddies produce turbulent conditions.
estimated ceiling-A ceiling classification applied when the ceiling height has been estimated by the observer or has been determined by some other method; but, because of the specified limits of time, distance, or precipitation conditions, a more descriptive classification cannot be applied.
evaporation--See change of state.
extratropical low (sometimes called extratropical cyclone, extratropical storm)-Any cyclone that is not a tropical cyclone, usually referring to the migratory frontal cyclones of middle and high latitudes.
eye-The roughly circular area of calm or relatively light winds and comparatively fair weather at the center of a well-developed tropical cyclone. A wall cloud marks the outer boundary of the eye.
F Fahrenheit temperature scale (abbreviated F)-A tem
perature scale with 32 degrees as the melting point of pure ice and 212 degrees as the boiling point of pure water at standard sea level atmospheric pressure (29.92 inches or 1013.2 millibars).
Fall wind-A cold wind blowing downslope. Fall wind differs from foehn in that the air is initially cold enough to remain relatively cold despite compressional heating during descent.
filling-An increase in the central pressure of a pressure system; opposite of deepening; more commonly applied to a low rather than a high.
first gust-The leading edge of the spreading downdraft, plow wind, from an approaching thunderstorm.
flow line-A streamline.
foehn-A warm, dry downslope wind; the warmness and dryness being due to adiabatic compression upon descent; characteristic of mountainous regions. See adiabatic process, Chinook, Santa Ana.
fog-A hydrometeor consisting of numerous minute water droplets and based at the surface; droplets are small enough to be suspended in the earth's atmosphere in-
205
definitely. (Unlike driv:.le, it does not fall to the surface; differs from cloud only in that a cloud is not based at the surface; distinguished from haze by its wetness and gray color.)
fractu_Clouds in the form of irregular shreds, appearing as if torn; have a clearly ragged appearance; applies only to stratus and cumulus, i.e., cumulus fractus and stratus fractus.
freezing-8ee change of state.
freezing level-A level in the atmosphere at which the temperature is 00 C (320 F).
front-A surface, interface, or transition zone of discontinuity between two adjacent air masses of different densities; more simply the boundary between two different air masses. See frontal zone.
frontal zone-A front or zone with a marked increase of density gradient; used to denote that fronts are not truly a "surface" of discontinuity but rather a "zone" of rapid transition of meteorological elements.
frontogenesis-The initial formation of a front or frontal zone.
frontolysis-The dissipation of afront.
frost (also hoarfrost)-Ice crystal deposits formed by sublimation when temperature and dew point are below freezing.
funnel cloud-A tornado cloud or vortex cloud extending downward from the parent cloud but not reaching the ground.
G
glaze-A coating of ice, generally clear and smooth, formed by freezing of super.cooled water on a surface. See clear icing.
gradient-In meteorology, a horizontal decrease in value per unit distance of a parameter in the direction of maximum decrease; most commonly used with pressure, temperature, and moisture.
ground clutter-Pertaining to radar, a cluster of echoes, generally at short range, reflected from ground targets.
ground fog-In the United States, afog that conceals less than 0.6 of the sky and is not contiguous with the base of clouds.
gust-A sudden brief increase in wind; according to U.S. weather observing practice, gusts are reported when the variation in wind speed between peaks and lulls is at least 10 knots.
H hail-A form of precipitation composed of balls or irregular
lumps of ice, always produced by convective clouds which are nearly always cumulonimbus.
halo-A prismatically colored or whitish circle or arcs of a circle with the sun or moon at its center; coloration, if not white, is from red inside to blue outside (opposite
206
that of a corona); fixed in size with an angular diameter of 220 (common) or 46 0 (rare); characteristic of clouds composed of ice crystals; valuable in differentiating between cirriform and forms of lower clouds.
haze-A type of lithometeor composed of fine dust or salt particles dispersed through a portion of the atmosphere; particles are so small they cannot be felt or individually seen with the naked eye (as compared with the larger particles of dust), but diminish the visibility; distinguished from fog by its bluish or yellowish tinge.
high-An area of high barometric pressure, with its attendant system of winds; an anticyclone. Also high pressure system.
hoar frost-8ee frost.
humidity-Water vapor content of the air; may be expressed as specific humidiry, relative humidiry, or mixing ratio.
hurricane-A tropical cyclone in the Western Hemisphere with winds in excess of 65 knots or 120 km/h.
hydrometeor-A general term for particles of liquid water or ice such as rain, fog, frost, etc., formed by modification of water vapor in the atmosphere; also water or ice particles lifted from the earth by the wind such as sea spray or blowing snow.
hygrograph-The record produced by a continuousrecording hygrometer.
hygrometer-An instrument for measuring the water vapor content of the air.
I ice crystals-A type of precipitation composed of unbranched
crystals in the form of needles, columns, or plates; usually having a very slight downward motion, may fall from a cloudless sky.
ice fog-A type of fog composed of minute suspended particles of ice; occurs at very low temperatures and may cause halo phenomena.
ice needles-A form of ice crystals.
ice pellets-Small, transparent or translucent, round or irregularly shaped pellets of ice. They may be (1) hard grains that rebound on striking a hard surface or (2) pellets of snow encased in ice.
icing-In general, any deposit of ice forming on an object. See clear icing, rime icing, glaze.
indefinite ceiling-A ceiling classification denoting vertical visibiliry into a surface based obscuration.
indicated altitude-8ee altitude.
insolation-Incoming solar radiation falling upon the earth and its atmosphere.
instability-A general term to indicate various states of the atmosphere in which spontaneous convection will occur when prescribed criteria are met; indicative of turbulence. See absolute instability, conditionally unstable air, convective instability.
intertropical convergence zone-The boundary zone between the trade wind system of the Northern and Southern Hemispheres; it is characterized in maritime climates by showery precipitation with cumulonimbus clouds sometimes extending to great heights.
inversion-An increase in temperature with height-a reversal of the normal decrease with height in the troposphere; may also be applied to other meteorological properties.
isobar-A line of equal or constant barometric pressure.
iso echo--In radar circuitry, a circuit that reverses signal strength above a specified intensity level, thus causing a void on the scope in the most intense portion of an echo when maximum intensity is greater than the specified level.
isoheight-on a weather chart, a line of equal height; same as contour (1).
isoline-A line of equal value of a variable quantity, i.e., an isoline of temperature is an isotherm, etc. See isobar, isotach, etc.
isoshear-A line of equal wind shear.
isotach-A line of equal or constant wind speed.
isotherm-A line of equal or constant temperature.
isothermal-of equal or constant temperature, with re-spect to either space or time; more commonly, temperature with height; a zero lapse rate.
J jet stream-A quasi-horizontal stream of winds 50 knots or
more concentrated within a narrow band embedded in the westerlies in the high troposphere.
K katabatic wind-Any wind blowing downslope. See fall
wind, foehn.
Kelvin temperature scale (abbreviated K)-A temperature scale with zero degrees equal to the temperature at which all molecular motion ceases, i.e., absolute zero (00 K = -2730 C); the Kelvin degree is identical to the Celsius degree; hence at standard sea level pressure, the melting point is 273 0 K and the boiling point 3730 K.
knot-A unit of speed equal to one nautical mile per hour.
L land breeze-A coastal breeze blowing from land to sea,
caused by temperature difference when the sea surface is warmer than the adjacent land. Therefore, it usually blows at night and alternates with a sea breeze, which blows in the opposite direction by day.
lapse rate-The rate of decrease of an atmospheric variable with height; commonly refers to decrease of temperature with height.
latent heat-The amount of heat absorbed (converted- to kinetic energy) during the processes of change of liquid water to water vapor, ice to water vapor, or ice to liquid
water; or the amount released during the reverse processes. Four basic classifications are:
(1) latent heat of condensation-Heat released during change of water vapor to water.
(2) latent heat of fusion-Heat released during change of water to ice or the amount absorbed in change of ice to water.
(3) latent heat of sublimation-Heat released during change of water vapor to ice or the amount absorbed in the change of ice to water vapor.
(4) latent heat of vaporization-Heat absorbed in the change of water to water vapor; the negative of latent heat of condensation.
layer-In reference to sky cover, clouds or other obscuring phenomena whose bases are approximately at the same level. The layer may be continuous or composed of detached elements. The term "layer" does not imply that a clear space exists between the layers or that the clouds or obscuring phenomena composing them are of the same type.
lee wave-Any stationary wave disturbance caused by a barrier in a fluid flow. In the atmosphere when sufficient moisture is present, this wave will be evidenced by lenticular clouds to the lee of mountain barriers; also called mountain wave or standing wave.
lenticular cloud (or lenticularis)-A species of cloud whose elements have the form of more or less isolated, generally smooth lenses or almonds. These clouds appear most often in formations of orographic origin, the result of lee waves, in which case they remain nearly stationary with respect to the terrain (standing cloud), but they also occur in regions without marked orography.
level of free convection (abbreviated LFC)-The level at which a parcel of air lifted dry-adiabatically until saturated and moist-adiabatically thereafter would become warmer than its surroundings in a conditionally unstable atmosphere. See. conditional instability and adiabatic process.
lifting condensation level (abbreviated LCL)-The level at which a parcel of unsaturated air lifted dryadiabatically would become saturated. Compare level oj Jree convection and convective condensation level.
lightning-Generally, any and all forms of visible electrical discharge produced by a thunderstorm.
lithometeor-The general term for dry particles suspended in the atmosphere such as dust, haze, smoke, and sand.
low-An area of low barometric pressure, with its attendant system of winds. Also called a barometric depression or cyclone.
M mammato cumulus-Obsolete. See cumulonimbus mamma.
mare's tail--8ee cirrus.
maritime polar air (abbreviated mP)-See polar air.
maritime tropical air (abbreviated mT)--8ee tropical air.
207
maximum wind axis--On a constant pressure chart, a line denoting the axis of maximum wind speeds at that constant pressure surface.
mean sea level-The average height of the surface of the sea for all stages of tide; used as reference for elevations throughout the U.S.
measured ceiling-A ceiling classification applied when the ceiling value has been determined by instruments or the known heights of unobscured portions of objects, other than natural landmarks.
melting-8ee change of state.
mercurial barometer-A barometer in which pressure is determined by balancing air pressure against the weight of a column of mercury in an evacuated glass tube.
meteorological visibility-In U.S. observing practice, a main category of visibility which includes the subcategories of prevailing visibility and runway visibility. Meteorological visibility is a measure of horizontal visibility near the earth's surface, based on sighting of objects in the daytime or unfocused lights of moderate intensity at night. Compare slant visibility, runway visual range, vertical !,isibility. See surface visibility, tower visibility, and sector visibility.
meteorology-The science of the atmosphere.
microbarograph-An aneroid barograph designed to record atmospheric pressure changes of very small magnitudes.
millibar (abbreviated mb.)-An internationally used unit of pressure equal to 1,000 dynes per square centimeter. It is convenient for reporting atmospheric pressure.
mist-A popular expression for drizzle or heavy fog.
mixing ratio-The ratio by weight of the amount of water vapor in a volume of air to the amount of dry air; usually expressed as grams per kilogram (g/kg).
moist-adiabatic lapse rate-8ee saturated-adiabatic lapse rate.
moisture-An all-inclusive term denoting water in any or all of its three states.
monsoon-A wind that in summer blows from sea to a continental interior, bringing copious rain, and in winter blows from the interior to the sea, resulting in sustained dry weather.
mountain wave-A standing wave or lee wave to the lee of a mountain barrier.
N nautical twilight-8ee twilight.
negative vorticity-8ee vorticity.
nimbostratus-A principal cloud type, gray colored, often dark, the appearance of which is rendered diffuse by more or less continuously falling rain or snow, which jn most cases reaches the ground. It is thick enough throughout to blot out the sun.
208
noctilucent clouds-Clouds of unknown composition which occur at great heights, probably around 75 to 90 kilometers. They resemble thin cirrus, but usually with a bluish or silverish color, although sometimes orange to red, standing out against a dark night sky. Rarely observed.
normal-In meteorology, the value of an element averaged for a given location over a period of years and recognized as a standard.
numerical forecasting-8ee numerical weather prediction.
numerical weather prediction-Forecasting by digital computers solving mathematical equations; used extensively in weather services throughout the world.
o obscuration-Denotes sky hidden by surface-based. obscur
ing phenomena and vertical visibility restricted overhead.
obscuring phenomena-Any hydrometeor or lithometeor other than clouds; may be surface based or aloft.
occlusion--8ame as occluded front.
occluded front (commonly called occlusion, also called frontal occlusion)-A composite of two fronts as a cold front overtakes a warm front or quasi-stationary front.
orographic-Of, pertaining to, or caused by mountains as in orographic clouds, orographic lift, or orographic precipitation.
ozone-An unstable form of oxygen; heaviest concentrations are in the stratosphere; corrosive to some metals; absorbs most ultraviolet solar radiation.
p
parcel-A. small volume of air, small enough to contain uniform distribution of its meteorological properties, and large enough to remain relatively self-contained and respond to all meteorological processes. No specific dimensions have been defined, however, the order of magnitude of 1 cubic foot has been suggested.
partial obscuration-A designation of sky cover when part of the sky is hidden by surface based obscuring phenomena.
pilot balloon-A small free-lift balloon used to determine the speed and direction of winds in the upper air.
pilot balloon observation (commonly called PIBAL)-A method of winds-aloft observation by visually tracking a pilot balloon.
plan position indicator (PPI) scope-A radar indicator scope displaying range and azimuth of targets in polar coordinates.
plow wind-The spreading downdraft of a thunderstorm; a strong, straight-line wind in advance of the storm. See first gust.
polar air-An air mass with characteristics developed over high latitudes, especially within the subpolar highs. Continental polar air (cP) has .;old surface temperatures, low moisture content, and, especially in its source regions, has great stability in the lower layers. It is shallow in com-
parison with Arctic air. Maritime polar (mP) initially possesses similar properties to those of continental polar air, but in passing over warmer wa~er it becomes unstable with a higher moisture content. Compare tropical air.
polar front-The semipermanent, semicontinuous jront separating air masses of tropical and polar origins.
po~itive vorticity-See vorticity.
power density-In radar meteorology the amount of radiated energy per unit cross sectional area in the radar beam.
precipitation-Any or all forms of water particles, whether liquid or solid, that fall from the atmosphere and reach the surface. It is a major class of hydrometeor, distinguished from cloud and virga in that it must reach the surface.
precipitation attenuation-See attenuation.
preBBure-See atmospheric pressure.
preBBure altimeter-An aneroid barometer with a scale graduated in altitude instead of pressure using standard atmospheric pressure-height relationships; shows indicated altitude (not necessarily true altitude); may be set to measure altitude (indicated) from any arbitrarily chosen level. See altimeter setting, altitude.
pressure altitude-8ee altitude.
preBBure gradient-The rate of decrease of pressure per unit distance at a fixed time.
preBBure jump-A sudden, significant increase in station pressure.
preBBure tendency-8ee barometric tendency.
prevailing easterlies-The broad current or pattern of persistent easterly winds in the Tropics and in polar regions.
prevailing visibility-In the U.S., the greatest horizontal visibility which is equaled or exceeded throughout half of the horizon circle; it need not be a continuous half.
prevailing westerlies-The dominant west-to-east motion of the atmosphere, centered over middle latitudes of both hemispheres.
prevailing wind-Direction from which the wind blows most frequently.
prognostic chart (contracted PROG)-A chart of expected or forecast conditions.
pseudo-adiabatic lapse rate-8ee saturated-adiabatic lapse rate.
psychrometer-An instrument c.onsisting of a wet-bulb and a dry-bulb thermometer for measuring wet-bulb and drybulb temperature; used to determine water vapor content of the air.
pulse-Pertaining to radar, a brief burst of electromagnetic radiation emitted by the radar; of very short time duration. See pulse length.
pulse length-Pertaining to radar, the dimension of a radar pulse; may be expressed as the time duration or the length in linear units. Linear dimension is equal to time duration multiplied by the speed of propagation (approximately the speed of light).
Q quasi-stationary front (commonly called stationary
front)-Ajront which is stationary or nearly so; conventionally, a front which is moving at a speed of less than 5 knots is generally considered to be quasi-stationary.
R RADAR (contraction for radio detection and ranging)
An electronic instrument used for the detection and ranging of distant objects of such composition that they scatter or reflect radio energy. Since hydrometeors can scatter radio energy, weather radars, operating on certain frequency bands, can detect the presence of precipitation, clouds, or both.
radar altitude-8ee altitude.
radar beam-The focused energy radiated by radar similar to a flashlight or searchlight beam.
radar ech0-8ee echo.
radarsonde observation-A rawinsonde observation in which winds are determined by radar tracking a balloon-borne target.
radiation-The emission of energy by a medium and transferred, either through free space or another medium, in the form of electromagnetic waves.
radiation fog-Fog characteristically resulting when radiational cooling of the earth's surface lowers the air temperature near the ground to or below its initial dew point on calm, clear nights.
radiosonde-A balloon-borne instrument for measuring pressure, temperature, and humidity aloft. Radiosonde observation-a sounding made by the instrument.
rain-A form of precipitation; drops are larger than driwe and fall in relatively straight, although not necessarily vertical, paths as compared to drizzle which falls in irregular paths.
rain shower-8ee shower.
range attenuation-8ee attenuation.
range-height indicator (RHI) scope-A radar indicator scope displaying a vertical cross section of targets along a selected azimuth.
range resolution-8ee resolution.
RAOB-A radiosonde observation.
rawin-A rawinsonde observation.
rawinsonde observation-A combined winds aloft and radiosonde observation. Winds are determined by tracking the radiosonde by radio direction finder or radar.
209
refraction-In radar, bending of the radar beam by variations in atmospheric density, water vapor content, and temperature.
(1) normal refraction-Refraction of the radar beam under normal atmospheric conditions; normal radius of curvature of the beam is about 4 times the radius of curvature of the Earth.
(2) superrefraction-More than normal bending of the radar beam resulting from abnormal vertical gradients of temperature and/or water vapor.
(3) subrefraction-Less than normal bending of the radar beam resulting from abnormal vertical gradients of temperature and/or water vapor.
relative humidity-The ratio of the existing amount of water vapor in the air at a given temperature to the maximum amount that could exist at that temperature; usually expressed in percent.
relative vorticity-See vorticity.
remote scope-In radar meteorology a "slave" scope remoted from weather radar.
resolution-Pertaining to radar, the ability of radar to show discrete targets separately, i.e., the better the resolution, the closer two targets can be to each other, and still be detected as separate targets.
(1) beam resolution-The ability of radar to distinguish between targets at approximately the same range but at different azimuths.
(2) range resolution-The ability of radar to distinguish between targets on the same azimuth but at different ranges.
ridge (also called ridge line)-In meteorology, an elongated area of relatively high atmospheric pressure; usually associated with and most clearly identified as an area of maximum anticyclonic curvature of the wind flow (isobars, contours, or streamlines).
rime icing (or rime ice)-The formation of a white or milky and opaque granular deposit of ice formed by the rapid freezing of supercooled water droplets as they impinge upon an exposed aircraft.
rocketsonde-A type of radiosonde launched by a rocket and making its measurements during a parachute descent; capable of obtaining soundings to a much greater height than possible by balloon or aircraft.
roll cloud (sometimes improperly called rotor cloud)A dense and horizontal roll-shaped accessory cloud located on the lower leading edge of a cumulonimbus or less often, a rapidly developing cumulus; indicative of turbulence.
rotor cloud (sometimes improperly called roll cloud)A turbulent cloud formation found in the lee of some large mountain barriers, the air in the cloud rotates around an axis parallel to the range; indicative of possible violent turbulence.
runway temperature-The temperature of the air just above a runway, ideally at engine and/or wing height, used in the determination of density altitude; useful at airports when critical values of density altitude prevail.
210
runway visibility-The meteorological visibility along an identified runway determined from a specified point on the runway; may be determined by a transmissometer or by an observer.
runway visual range-An instrumentally derived horizontal distance a pilot should see down the runway from the approach end; based on either the sighting of high intensity runway lights or on the visual contrast of other objects, whichever yields the greatest visual range.
s St. Elmo's Fire (also called corposant)-A luminous brush
discharge of electricity from protruding objects, such as masts and yardarms of ships, aircraft, lightning rods, steeples, etc., occurring in stormy weather.
Santa Ana-A hot, dry, foehn wind, generally from the northeast or east, occurring west of the Sierra Nevada Mountains especially in the pass and river valley near Santa Ana, California.
saturated adiabatic lapse rate-The rate of decrease of temperature with height as saturated air is lifted with no gain or loss of heat from outside sources; varies with temperature, being greatest at low temperatures. See adiabatic process and dry-adiabatic lapse rate.
saturation-The condition of the atmosphere when actual water vapor present is the maximum possible at existing temperature.
scud-Small detached masses of stratusfractus clouds below a layer of higher clouds, usually nimbostratus.
sea breeze-A coastal breeze blowing from sea to land, caused by the temperature difference when the land surface is warmer than the sea surface. Compare land breeze.
sea fog-A type of advection fog formed when air that has been lying over a warm surface is transported over a colder water surface.
sea level pressure-The atmospheric pressure at mean sea level, either directly measured by stations at sea level or empirically determined from the station pressure and temperature by stations not at sea level; used as a common reference for analyses of surface pressure patterns.
sea smoke-Same as steam fog.
sector visibility-Meteorological visibility within a specified sector of the horizon circle.
sensitivity time control-A radar circuit designed to correct for range attenuation so that echo intensity on the scope is proportional to reflectivity of the target regardless of range.
shear-8ee wind shear.
shower-Precipitation from a cumuliform cloud; characterized by the suddenness of beginning and ending, by the rapid change of intensity, and usually by rapid change in the appearance of the sky; showery precipitation may be in the form of rain, ice pellets, or snow.
slant visibility-For an airborne observer, the distance at which he can see and distinguish objects on the ground.
r I
sleet--8ee ice pellets.
smog-A mixture of smoke andfog.
smoke-A restriction to visibility resulting from combustion.
snow-Precipitation composed of white or translucent ice crystals, chiefly in complex branched hexagonal form.
snow flurry-Popular term for snow shower, particularly of a very light and brief nature.
snow grains-Precipitation of very small, white opaque grains of ice, similar in structure to snow crystals. The grains are fairly flat or elongated, with diameters generally less than 0.04 inch (1 mm.).
snow pellets-Precipitation consisting of white, opaque approximately round (sometimes conical) ice particles having a snow-like structure, and about 0.08 to 0.2 inch in diameter; crisp and easily crushed, differing in this respect from snow grains; rebound from a hard surface and often break up.
snow shower--8ee shower.
801ar radiation-The total electromagnetic radiation emitted by the sun. See insolation.
sounding-In meteorology, an upper-air observation; a radiosonde observation.
source region-An extensive area of the earth's surface characterized by relatively uniform surface conditions where large masses of air remain long enough to take on characteristic temperature and moisture properties imparted by that surface.
specific humidity-The ratio by weight of water vapor in a sample of air to the combined weight of water vapor and dry air. Compare mixing ratio.
squall-A sudden increase in wind speed by at least 15 knots to a peak of 20 knots or more and lasting for at least one minute. Essential difference between a gust and a squall is the duration of the peak speed.
squall line-Any nonfrontal line or narrow band of active thunderstorms (with or without squalls).
stability-A state of the atmosphere in which the vertical distribution of temperature is such that a parcel will resist displacement from its initial level. (See also instability.)
standard atmosphere-A hypothetical atmosphere based on climatological averages comprised of numerous physical constants of which the most important are:
(1) A surface temperature of 59 0 F (150 C) and a surface pressure of 29.92 inches of mercury (1013.2 millibars) at sea level;
(2) A lapse rate in the troposphere of 6.50 C per kilometer (approximately 20 C per 1,000 feet);
(3) A tropopause of 11 kilometers (approximately 36,000 feet) with a temperature of -56.5 0 C; and
(4) An isothermal lapse rate in the stratosphere to an altitude of 24 kilometers (approxima~ely 80,000 feet).
standing cloud (standing lenticular altocumulus)--8ee lenticular cloud.
standing wave-A wave that remains stationary in a moving fluid. In aviation operations it is used most commonly to refer to a lee wave or mountain wave.
stationary front-8ame as quasi-stationary front.
station pressure-The actual atmospheric pressure at the observing station.
steam fog-Fog formed when cold air moves over relatively warm water or wet ground.
storm detection radar-A weather radar designed to detect hydrometeors of precipitation size; used primarily to detect storms with large drops or hailstones as opposed to clouds and light precipitation of small drop size.
stratiform-Descriptive of clouds of extensive horizontal development, as contrasted to vertically developed cumuliform clouds; characteristic of stable air and, therefore, composed of small water droplets.
stratocumulus-A low cloud, predominantly stratiform in gray and/or whitish patches or layers, mayor may not merge; elements are tessellated, rounded, or roll-shaped with relatively flat tops.
stratosphere-The atmospheric layer above the tropopause, average altitude of base and top, 7 and 22 miles respectively; characterized by a slight average increase of temperature from base to top and is very stable; also characterized by low moisture content and absence of clouds.
stratus-A low, gray cloud layer or sheet with a fairly uniform base; sometimes appears in ragged patches; seldom produces precipitation but may produce driv:}e or snow grains. A stratiform cloud.
stratus fractus--8ee fractus.
streamline-In meteorology, a line whose tangent is the wind direction at any point along the line. A flowline.
sublimation--8ee change of state.
subrefraction--8ee refraction.
subsidence-A descending motion of air in the atmosphere over a rather broad area; usually associated with divergence.
summation principle-The principle states that the cover assigned to a layer is equal to the summation of the sky cover of the lowest layer plus the additional coverage at all successively higher layers up to and including the layer in question. Thus, no layer can be assigned a sky cover less than a lower layer, and no sky cover can be greater than 1.0 (10/10).
superadiabatic lapse rate-A lapse rate greater than the dry-adiabatic lapse rate. See absolute instability.
supercooled water-Liquid water at temperatures colder than freezing.
superrefraction--8ee refraction.
surface inversion-An inversion with its base at the surface, often caused by cooling of the air near the surface as a result of terrestrial radiation, especially at night.
211
surface visibility-Visibility observed from eye-level above the ground.
synoptic chart-A chart, such as the familiar weather map, which depicts the distribution of meteorological conditions over an area at a given time.
T target-In radar, any of the many types of objects detected
by radar.
temperature-In general, the degree of hotness or coldness as measured on some definite temperature scale by means of any of various types of thermometers.
temperature inversion-See inversion.
terrestrial radiation-The total infrared radiation emitted by the Earth and its atmosphere.
thermograph-A continuous-recording thermometer.
thermometer-An instrument for measuring temperature.
theodolite-An optical instrument which, in meteorology, is used principally to observe the motion of a pilot balloon.
thunderstorm-In general, a local storm invariably produced by a cumulonimbus cloud, and always accompanied by lightning and thunder.
tornado (sometimes called cyclone, twister)-A violently rotating column of air, pendant from a cumulonimbus cloud, and nearly always observable as "funnel-shaped." It is the most destructive of all small-scale atmospheric phenomena.
towering cumulus-A rapidly growing cumulus in which height exceeds width.
tower visibility-Prevailing VIsibility dctermined from the control tower.
trade winds-Prevailing, almost continuous winds blowing with an easterly component from the subtropical high pressure belts toward the intertropical convergence :cone; northeast in the Northern Hemisphere, southeast in the Southern Hemisphere.
transmissometer-An instrument system which shows the transmissivity of light through the atmosphere. Transmissivity may be translated either automatically or manually into visibility and/or runway visual range.
tropical air-An air mass with characteristics developed over low latitudes. Maritime tropical air (mT), the principal type, is produced over the tropical and subtropical seas; very warm and humid. Continental tropical (cT) is produced over subtropical arid regions and is hot and very dry. Compare polar air.
tropical cyclone-A general term for a cyclone that originates over tropical oceans. By international agreement, tropical cyclones have been classified according to their intensity, as follows:
(1) tropical depression-winds up to 34 knots (64 km/h);
(2) tropical storm-winds of 35 to 64 knots (65 to 119 km/h);
212
(3) hurricane or typhoon-winds of 65 knots or higher (120 km/h).
tropical depression-See tropical cyclone.
tropical storm-See tropical cyclone.
tropopause-The transition zone between the troposphere and stratosphere, usually characterized by an abrupt change of lapse rate.
troposphere-That portion of the atmos,.bhere from the earth's surface to the tropopause; that is, the lowest 10 to 20 kilometers of the atmosphere. The troposphere is characterized by decreasing temperature with height. and by appreciable water vapor.
trough (also called trough line)-In meteorology, an elongated area of relatively low atmospheric pressure; usually associated with and most clearly identified as an area of maximum cyclonic curvature of the wind flow (isobars, contours, or streamlines); compare with ridge.
true altitude-See altitude.
true wind direction-The direction, with respect to true north, from which the wind is blowing.
turbulence-In meteorology, any irregular or disturbed flow in the atmosphere.
twilight-The intervals of incomplete darkness following sunset and preceding sunrise. The time at which evening twilight ends or morning twilight begins is determined by arbitrary convention, and several kinds of twilight have been defined and used; most commonly civil, nautical, and astronomical twilight.
(1) Civil Twilight-The period of time before sunrise and after sunset when the sun is not more than 6° below the horizon.
(2) Nautical Twilight-The period of time before sunrise and after sunset when the sun is not more than 12° below the horizon.
(3) Astronomical Twilight-The period of time before sunrise and after sunset when the sun is not more than 18° below the horizon.
twister-In the United States, a colloquial term for tornado.
typhoon-A tropical cyclone in the Eastern Hemisphere with winds in excess of 65 knots (120 km/h).
u undercast-A cloud layer of ten-tenths (1.0) coverage (to
the nearest tenth) as viewed from an observation point above the layer.
unlimited ceiling-A clear sky or a sky cover that does not meet the criteria for a ceiling.
unstable-See instability.
updraft-A localized upward current of air.
upper front-A front aloft not extending to the earth's surface.
upslope fog-Fog formed when air flows upward over rising terrain and is, consequently, adiabatically cooled to or below its initial dew point.
T
v vapor pressure-In meteorology, the pressure of water
vapor in the atmosphere. Vapor pressure is that part of the total atmospheric pressure due to water vapor and is independent of the other atmospheric gases or vapors.
vapor trail--8ame as condensation trail.
veering-Shifting of the wind in a clockwise direction with respect to either space or time; opposite of backing. Commonly used by meteorologists to refer to an anticyclonic shift (clockwise in the Northern Hemisphere and counterclockwise in the Southern Hemisphere).
vertical visibility-The distance one can see upward into a surface based obscuration; or the maximum height from which a pilot in flight can recognize the ground through a surface based obscuration.
virga-Water or ice particles falling from a cloud, usually in wisps or streaks, and evaporating before reaching the ground.
visibility-The greatest distance one can see and identify prominent objects.
visual range--8ee runway visual range.
vortex-In meteorology, any rotary flow in the atmosphere.
vorticity-Turning of the atmosphere. Vorticity may be imbedded in the total flow and not readily identified by a flow pattern.
(a) absolute vorticity-the rotation of the Earth imparts vorticity to the atmosphere; absolute vorticity is the combined vorticity due to this rotation and vorticity due to circulation relative to the Earth (relative vorticity).
(b) negative vorticity-vorticity caused by anticyclonic turning; it is associated with downward motion of the air.
(c) positive vorticity-vorticity caused by cyclonic turning; it is associated with upward motion of the air.
(d) relative vorticity-vorticity of the air relative to the Earth, disregarding the component of vorticity resulting from Earth's rotation.
w wake turbulence-Turbulence found to the rear of a solid
body in motion relative to a fluid. In aviation terminology, the turbulence caused by a moving aircraft.
wall cloud-The well-defined bank of vertically developed clouds having a wall-like appearance which form the outer boundary of the rye of a well-developed tropical cyclone.
warm front-Any non-occluded front which moves in such a way that warmer air replaces colder air.
warm sector-The area covered by warm air at the surface and bounded by the warm front and cold front of a wave cyclone.
water equivalent-The depth of water that would result from the melting of snow or ice.
waterspout--8ee tornado.
water vapor-Water in the invisible gaseous form.
wave cyclone-A cyclone which forms and moves along a front. The circulation about the cyclone center tends to produce a wavelike deformation of the front.
weather-The state of the atmosphere, mainly with respect to its effects on life and human activities; refers to instantaneous conditions or short term changes as opposed to climate.
weather radar-Radar specifically designed for observing weather. See cloud detection radar and storm detection radar.
weather vane-A wind vane.
wedge-Same as ridge.
wet bulb-Contraction of either wet-bulb temperature or wetbulb thermometer.
wet-bulb temperature-The lowest temperature that can be obtained on a wet-bulb thermometer in any given sample of air, by evaporation of water (or ice) from the muslin wick; used in computing dew point and relative humidity.
wet-bulb thermometer-A thermometer with a muslin-covered bulb used to measure wet-bulb temperature.
whirlwind-A small, rotating column of air; may be visible as a dust devil.
willy-willy-A tropical cyclone of hurricane strength near Australia.
wind-Air in motion relative to the surface of the earth; generally used to denote horizontal movement.
wind direction-The direction from which wind is blowing.
wind speed-Rate of wind movement in distance per unit time.
wind vane-An instrument to indicate wind direction.
wind velocity-A vector term to include both wind direction and wind speed.
wind shear-The rate of change of wind velocity (direction and/or speed) per unit distance; conventionally expressed as vertical or horizontal wind shear.
X-Y-Z zonal wind-A west wind; the westerly component of a
wind. Conventionally used to describe large-scale flow that is neither cyclonic nor anticyclonic.
213

A
Adiabatic Process, 47 Adiabatic Rate of Cooling
Dry, 48 Moist, 48
Advection, 24 Advection Fog, 127, 153 Aerodynamic Contrails, 143 Airborne Weather Radar, 120 Aircraft Accidents, 125 Aircraft Observation (APOB), 187 Air Density. See Atmosphere. Air Mass, 63,148
Modification, 64 Source Region, 63 Thunderstorms. See Thunderstorms.
Altimeter, 17 Altimeter Setting, 18 Altimetry, 17 Altitude, 17
Corrected, 18 Density. See Density Altitude. Indicated, 17 Pressure, 19 True, 17
Altocumulus Clouds. s.ee. Clouds. Altostratus Clouds. See clouds. Aneroid Barometer, 12, 17 Anticyclone, 29 Arctic, 147
Air Masses, 148 Aurora Borealis, 152 Blowing Snow, 153 Clouds, 151 Flying Weather, 154 Fog, 153 Icing, 153 Light from Celestial Bodies, 152 Precipitation, 151 Reflection by Snow Cover, 152 Whiteout, 153
Atmosphere, 1 Composition of, 2 Density of, 3 Standard, 2, 13, 17 Structure of, 2
Atmospheric Pressure, 11 Measurement of, 11
Aurora Borealis, 152
Barometer, 17 Aneroid, 12, 17
B
INDEX
Mercurial, 12 Blowing Restrictions to Visibility, 129, 153 Bora, 32
Canopy Static, 145 Carburetor Icing, 97 Ceiling, 115
c
Celsius (Centigrade) Temperature Scale, 6 Change of State, 39 Changes in Upward and Downward Moving Air, 47 Chinook,32 Cirrocumulus Clouds. See Clouds. Cirrostratus Clouds. See Clouds. Cirrus Clouds. See Clouds. Cirrus Haze, 144 Clear Air Turbulence (CAT), 87,142 Clouds, 53
Altocumulus, 56 Altocumulus Castellanus, 57 Altostratus, 56 Cirriform, 54 Cirrocumulus, 55 Cirrostratus, 55 Cirrus, 54, 139 Classification, 53 Composition, 42 Cumuliform, 50 Cumulonimbus, 54, 61, 81 Cumulonimbus Mamma, 114 Cumulus, 53, 60 Families, 53 Formation, 37, 42 Funnel,113 High,54 Identification, 53 Lenticular, 58, 85, 199 Low, 54 Middle, 54 Nimbostratus, 54, 59 RoIl,115 Rotor, 85 Standing Lenticular, 58, 85, 199 Standing Wave, 58, 84,199 Stratiform, 50 Stratocumulus, 60, 83 Stratus, 53, 59, 128 Towering Cumulus, 61 Vertically Developed, 54
Col,15 Cold Front. See Front. Cold Low, 36 Common IFR Producers, 125
215
Compressional Warming, 47 Condensation, 39 Condensation Nuclei, 40 Condensation Trails, 143 Constant Pressure Analysis, 16 Constant Pressure Chart, 16 Constant Pressure Surface, 17 Contour, 16 Contour Analysis. See Constant Pressure Analysis. Convection, 23 Convective Currents, 24, 80 Convective Turbulence, 80 Cooling by Expansion, 4·7 Coriolis Force, 25, 29 Corrected Altitude, 18 Cross-Country Soaring, 190, 200 Cumuliform Clouds. See Clouds. Cumulonimbus Clouds. See Clouds. Cumulus Clouds. See Clouds. Cyclone, 29
Tropical, 164
D
Deflective Force. See Coriolis Force. Density Altitude, 19
Computing, 21 Density of Air, 3 Dew, 41 Dew Point, 38
Change with Altitude, 51 Dew Point Front, 76 Dissipation Trails, 144 Diurnal Temperature Range, 7 Do's and Don'ts of Thunderstorm Flying, 121 Downdraft, 83, 111 Drainage Wind, 32 Drizzle. See Precipitation. Dry Adiabatic Rate of Cooling, 48 Dry Line, 76 Dust, 129 Dust Devil, 52, 173
E
Easterly Wave, 163 Embedded Thunderstorms. See Thunderstorms. Evaporation, 39 Exhaust Trails, 143 Expansional Cooling, 47
F
Fahrenheit Temperature Scale, 6 First Gust, 111 Flight Planning, 21, 45, 52, 78,85,90,102,121,130,
143, 155 'Fog, 42, 126
Advection, 127, 153 Ground,126
216
Ice, 128, 153 Precipitation Induced, 128 Radiation, .126 Sea, 127 Steam, 153 Upslope, 127
Freezing Precipitation. See Precipitation. Frictional Force, 29 Front, 64, 148
Cold,65 Dew Point, 76 Occluded, 67 Stationary, 65 Warm, 65
Frontal Discontinuities, 65 Frontal Soaring, 191 Frontal Waves and Occlusion, 66 Frontal Weather, 72, 100, 112 Frontogenesis, 71 Fron tolysis, 71 Frost, 41,102, 153 Frozen Precipitation. See Precipitation. Funnel Cloud, 113
G
General Circulation, 26 Ground Fog, 126
H
Hail, 43, 115 Haze, 129 Heat and Temperature, 6
Latent, 40 Heating by Compression, 47 Height Contour, 16 High Altitude Weather, 135 High Clouds. See Clouds. High Level Haze, 144 High Pressure System, 15 Hill Soaring, 195 Humidity, 3b Hurricane, 164 Hurricane Reconnaissance, 167 Hypoxia, 3
Ice Fog, 128, 153 lcing-
Aircraft, 41, 91,153 Carburetor, 97 Clear, 92 Effects of, 91 Ground,102 High Altitude, 145 Icing and Cloud Types, 99 Induction System, 97 Instrument, 98
I
Intensities, 93, 104 Mixed,93 Rime, 92 Structural, 92 Thunderstorm, 101, 114
Inactive Front, 74 Indicated Altitude, 17 Induced Trough, 162 Induction System Icing, 97 Instability, 49, 64 Instability Line, 75 Instrument Icing, 98 Intertropical Convergence Zone, 159 Inversion, 9 Isobar, 15 Isobaric Analysis, 15
Jet Stream, 31, 136 Cirrus, 139
J
Related to Surface Systems, 138 Related to Tropopause, 31, 136 Turbulence, 142
Katabatic Wind, 32
Lake Effect, 43 Land and Sea Breezes, 32 Lapse Rate, 9 Latent Heat, 40
K
L
Lenticular Cloud. See Clouds. Lift, 171 Lightning, 116 Local Winds, 31 Low Clouds. See Clouds. Low Pressure Systems, 15,35
Non-Frontal, 36, 70 Low Stratus Clouds. See Clouds.
Mechanical Turbulence, 82 Melting, 39 Melting Point, 6 Mercurial Barometer, 12 Middle Clouds. See Clouds.
M
Moist Adiabatic Rate of Cooling, 48 Moisture, 37 Monsoon, 160 Mountain Flying, 85 Mountain Wave, 58, 83, 198 Mountain Wave Soaring, 198 Mountain Wind, 31
N
Nimbostratus Clouds. See Clouds. Non-Frontal Low, 36, 70 Northern Lights (Aurora Borealis), 152
o Obscured Sky, 130 Obstructions to Wind Flow, 82 Occluded Front. See Front. Oxygen Pressure, 3 Oxygen, Use of, 4
p
Pilot Reports, 90, 104, 143, 155 Pitot Tube Icing, 98 Plow Wind, 111 Polar Easterlies, 29 Polar Outbreak, 29 Precipitation, 37,42
Drizzle, 43,130 Formation, 42 Freezing, 43 Frozen, 43 Hail,43, 115 Ice Pellets, 43 Rain, 39,43, 130 Snow, 43, 130
Precipitation Induced Fog, 128 Precipitation Static, 117 Pressure Altitude, 19 Pressure Analysis, 15 Pressure, Atmospheric, 11
Measurement of, 11 Sea Level, 13 Station, 12 Units of, 12 Variation with Altitude, 12, 36 Variation with Seasons, 27 Variation with Temperature, 13, 27 Variation with Topography, 29
Pressure Gradient, 24 Pressure Gradient Force, 24 Pressure Patterns, 15,35 Pressure Surface, Constant, 17 Pressure Systems, 15, 35 Pressure Variation. See Pressure. Pressurization, 4 Prevailing Westerlies, 29 Propeller Icing, 95 Pseudo-Adiabatic Chart, 184
Q
Quasi-Stationary Front, 65
217
Radiation, 6 Radiation Fog, 126 Radiosonde, 16 Rain. See Precipitation. Relative Humidity, 38
R
Restrictions to Visibility, 36, 115, 126, 129 Ridge, 15,35 Ridge or Hill Soaring, 195 Rime. See Icing. Roll Cloud. See Clouds. Rotor, 85 Rotor Cloud. See Clouds.
Saint Elmo's Fire, 117 Santa Ana Wind, 32
s
Saturated Adiabatic Rate of Cooling, 48 Saturated Air, 41 Sea Breeze, 32 Sea Breeze Front, 191 Sea Breeze Soaring, 191 Sea Fog, 127 Sea Level Pressure, 13 Sea Smoke, 153 Shear Line, 162 Shear, Wind. See Wind Shear. Signposts in the Sky, 50, 62 Sink,l71 Sink Rate, 171 Slant Visibility, 130 Smoke, 129 Smoke Front, 193 Snow. See Precipitation. Soaring-
Cross-Country, 190, 191,200 Frontal,191 Mountain Wave, 198 Ridge or Hill, 195 Sea Breeze, 191 Thermal, 172 Turbulence, 173, 176, 191, 195, 199
Soaring Weather, 171 Solar Radiation, 6 Source Regions of Air Masses, 63 Spatial Disorientation, 125 Spread, Temperature-Dew Point, 38 Squall Line, 114 Stability, 49, 64 Stable Air, 47,64 Standard Atmosphere, 2, 13, 17 Standard Atmospheric Pressure, 13 Standing Wave. See Mountain Wave. Static-
Canopy, 145 Precipitation, 117
Station Pressure, 12 Stationary Front. See Front. Steam Fog, 153 Stratiform Clouds. See Clouds.
218
Stratocumulus Clouds. See Clouds. Stratosphere, 2 Stratus Clouds. See Clouds. Sublimation, 39, 41 Subtropical High Pressure Belt, 27, 158 Supercooled Water, 41 Surface Weather Chart, 15
Taku,32 Temperature, 6
Diurnal Range, 7 Inversion, 9 Lapse Rate, 9 Measurement, 6 Scales, 6 Seasonal Range, 7
T
Variation with Height, 9 Variation with Latitude, 7 Variation with Topography, 7 World,7
Temperature-Dew Point Spread, 38 Terrain Effects, 43, 101, 150 Terrestrial Radiation, 6 Thermal, 172
Height, 180 Index, 186 Lift, 172 Locating, 173 Streets, 180 Strength, 180 Structure, 178 Terrain Effects on, 173 Types of, 178
Thermal Low, 36, 71 Thermal Soaring, 172 Thunderstorm, 36, 61,105,145
Air Mass, 112 Avoidance, 120 Climatology, 105 Effect on Altimeters, 116 Electricity, 116 Embedded, 51, 72, 101, 121 Flying, 121 Formation, 111 Frontal, 72, 112 Hazards, 113 Life Cycle, 111 Penetration, 123 Radar Observations of, 120 Seasonal Distribution, 105 Severe, 112 Stages of, 111 Steady State, 112 Structure, 111
Tornado, 113 Trade Winds, 29,158 Tropical-
Circulation, 158 Cyclone, 164 Depression, 164
Easterly Wave, 163 High Pressure Belts, 27,158 Intertropical Convergence Zone, 159 Monsoon, 160 Shear Line, 162 Storm, 164 Trade Wind Belts, 27,158 Trough Aloft, 162 Wave, 163
Tropical Weather, 157 Tropopause, 2, 31,136 Troposphere, 2 Trough, 15,35
Aloft, 36, 162 True Altitude, 17 Turbulence, 79
ClearAir,87,142 Convective, 80 In Thunderstorms, 81, 114 Mechanical, 82 Wake, 88 Wind Shear, 65, 86,142
Typhoon, 164
Unstable Air, 47, 64 Updrafts, 50, 111
u
Upper Air Observations, 16, 187 Upslope Fog, 127
Valley Wind, 31 Virga, 39
Wake Turbulence, 88
v
w
Warm Front. See Front. Warming by Compression, 47 Water Surface, EffecJ of, 7,27,32,43,64, 150 Water Vapor, 37 Waterspout, 113 Weather and Aircraft Accidents, 125 Whiteout, 153 Willy-Willy, 164 Wind,23 Wind Gusts, 111 Wind Shadow, 197,200 Wind Shear, 34, 65, 86 Wind Shear Turbulence, 65, 86,142 Wind Systems, 35
219