Embed Size (px)
Citation preview
PT Sarana Multi Infrastruktur (Persero) || www.ptsmi.co.id SMI Insight 3rd Quarter 2014
SMI’s Insight - 3rd Quarter 2014
1
1. Airport Management in Indonesia
Ports
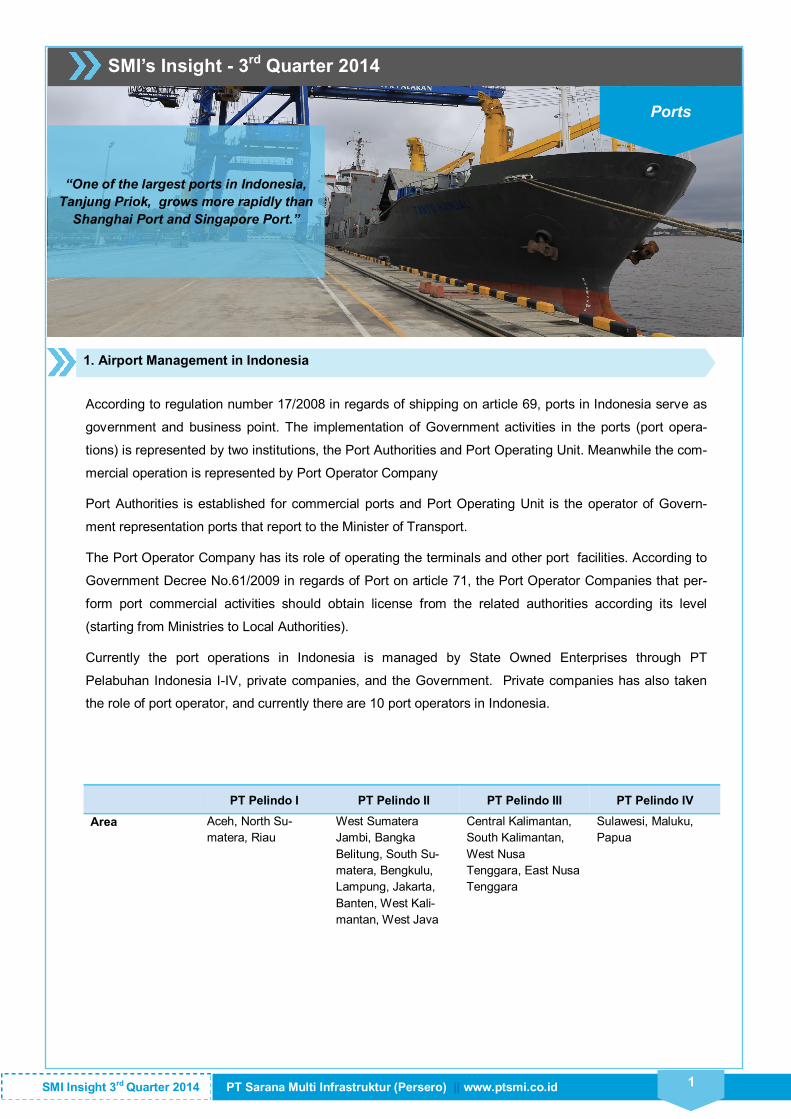
“One of the largest ports in Indonesia,
Tanjung Priok, grows more rapidly than
Shanghai Port and Singapore Port.”
According to regulation number 17/2008 in regards of shipping on article 69, ports in Indonesia serve as
government and business point. The implementation of Government activities in the ports (port opera-
tions) is represented by two institutions, the Port Authorities and Port Operating Unit. Meanwhile the com-
mercial operation is represented by Port Operator Company
Port Authorities is established for commercial ports and Port Operating Unit is the operator of Govern-
ment representation ports that report to the Minister of Transport.
The Port Operator Company has its role of operating the terminals and other port facilities. According to
Government Decree No.61/2009 in regards of Port on article 71, the Port Operator Companies that per-
form port commercial activities should obtain license from the related authorities according its level
(starting from Ministries to Local Authorities).
Currently the port operations in Indonesia is managed by State Owned Enterprises through PT
Pelabuhan Indonesia I-IV, private companies, and the Government. Private companies has also taken
the role of port operator, and currently there are 10 port operators in Indonesia.
PT Pelindo I PT Pelindo II PT Pelindo III PT Pelindo IV
Area Aceh, North Su-
matera, Riau
West Sumatera
Jambi, Bangka
Belitung, South Su-
matera, Bengkulu,
Lampung, Jakarta,
Banten, West Kali-
mantan, West Java
Central Kalimantan,
South Kalimantan,
West Nusa
Tenggara, East Nusa
Tenggara
Sulawesi, Maluku,
Papua
PT Sarana Multi Infrastruktur (Persero) || www.ptsmi.co.id SMI Insight 3rd Quarter 2014 2
PT Pelindo I PT Pelindo II PT Pelindo III PT Pelindo IV
Ports 1. Belawan
2. Dumai
3. Tanjung Pinang
4. Lhokseumawe
5. Pekanbaru
6. Tanjung Balai
Karimun
7. Sibolga
8. Tembilahan
9. Malahayati
10. Tanjung Balai
Asahan
11. Kuala Tanjung
12. Sungai Pakning
13. Batam
1. Tanjung Priok
2. Sunda Kelapa
3. Panjang
4. Palembang
5. Teluk Bayur
6. Pontianak
7. Cirebon
8. Jambi
1. Tanjung Perak
2. Tanjung Intan
3. Tanjung Wangi
4. Sampit
5. Tanjung Tembaga
6. Bima
7. Tanjung Emas
8. Trisakti
9. Benoa
10. Kotabaru
11. Kumai
1. Makassar
2. Balikpapan
3. Samarinda
4. Bitung
5. Ambon
6. Sorong
7. Jayapura
8. Talakan
9. Pantoloan
10. Ternate
11. Kendari
12. Parepare
2
Main Ports 1. Belawan
2. Tanjung Priok
3. Tanjung PeraK
4. Makassar
5. Balikpapan
Total Passenger Flow managed by PT Pelabuhan Indonesia I-IV in 2012: 17.709.141 passengers
Total Container Flow Managed by PT Pelabuhan Indonesia I-IV in 2012: 11.076.865 Twenty Foot Equivalent Units
(TEUs)
Main Projects Port development projects in PPP Book 2013:
1. Port di Maloy, East Kalimantan,
2. Tanjung Priok Port in Jakarta dan
3. Port Terminal in Tanjung Sauh, Batam Riau Islands
2. Container and Passenger Flow
a.Container Flow
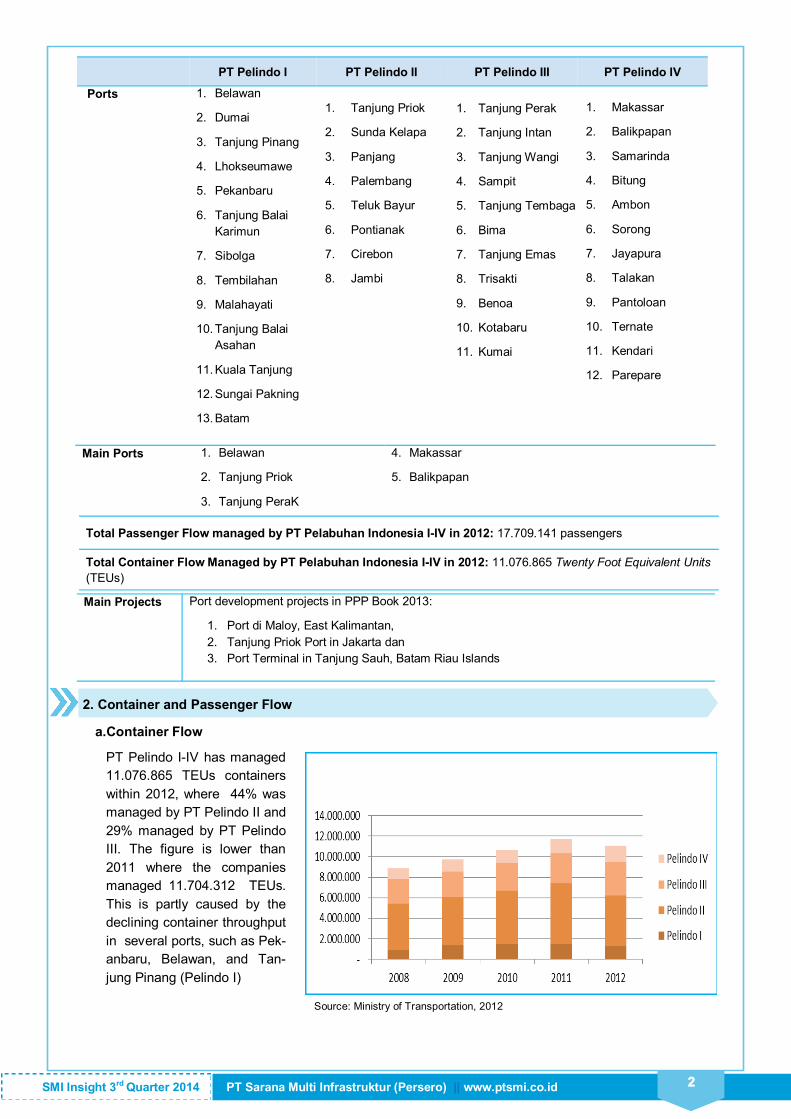
PT Pelindo I-IV has managed
11.076.865 TEUs containers
within 2012, where 44% was
managed by PT Pelindo II and
29% managed by PT Pelindo
III. The figure is lower than
2011 where the companies
managed 11.704.312 TEUs.
This is partly caused by the
declining container throughput
in several ports, such as Pek-
anbaru, Belawan, and Tan-
jung Pinang (Pelindo I)
Source: Ministry of Transportation, 2012
PT Sarana Multi Infrastruktur (Persero) || www.ptsmi.co.id SMI Insight 3rd Quarter 2014 2
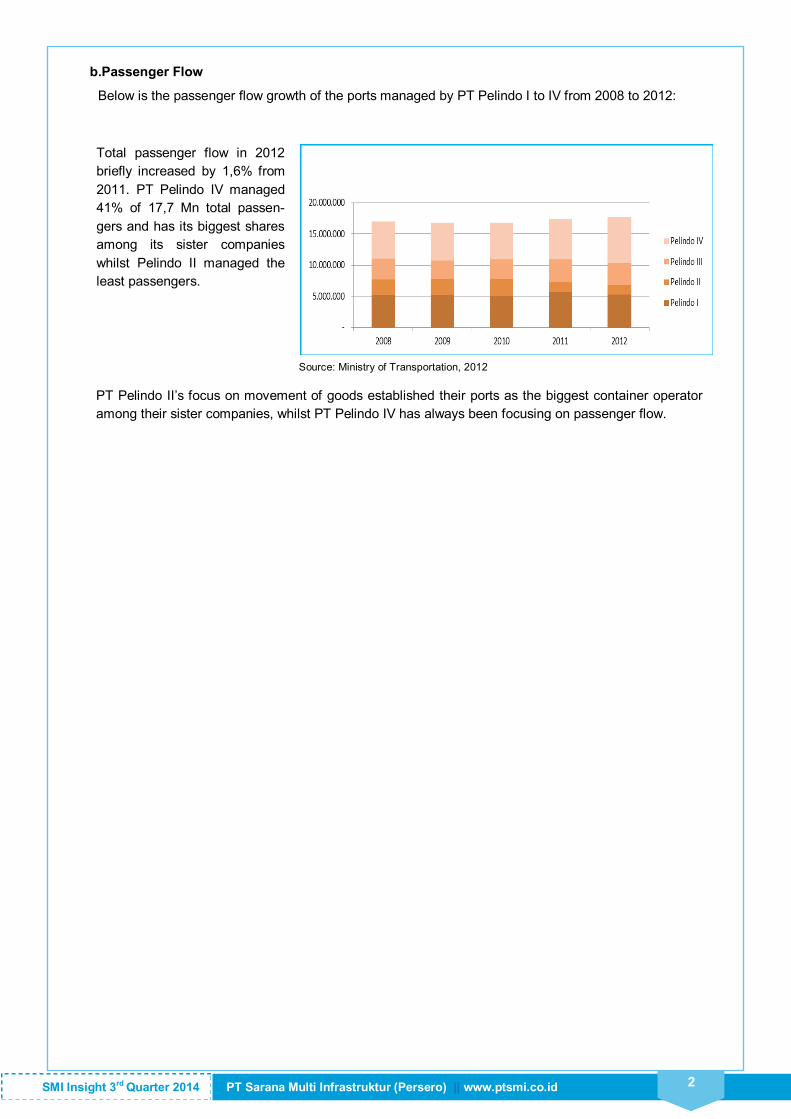
Below is the passenger flow growth of the ports managed by PT Pelindo I to IV from 2008 to 2012:
b.Passenger Flow
PT Pelindo II’s focus on movement of goods established their ports as the biggest container operator
among their sister companies, whilst PT Pelindo IV has always been focusing on passenger flow.
Total passenger flow in 2012
briefly increased by 1,6% from
2011. PT Pelindo IV managed
41% of 17,7 Mn total passen-
gers and has its biggest shares
among its sister companies
whilst Pelindo II managed the
least passengers.
Source: Ministry of Transportation, 2012
PT Sarana Multi Infrastruktur (Persero) || www.ptsmi.co.id SMI Insight 3rd Quarter 2014 3
3. Comparison Between Indonesian Ports and Other Foreign Ports
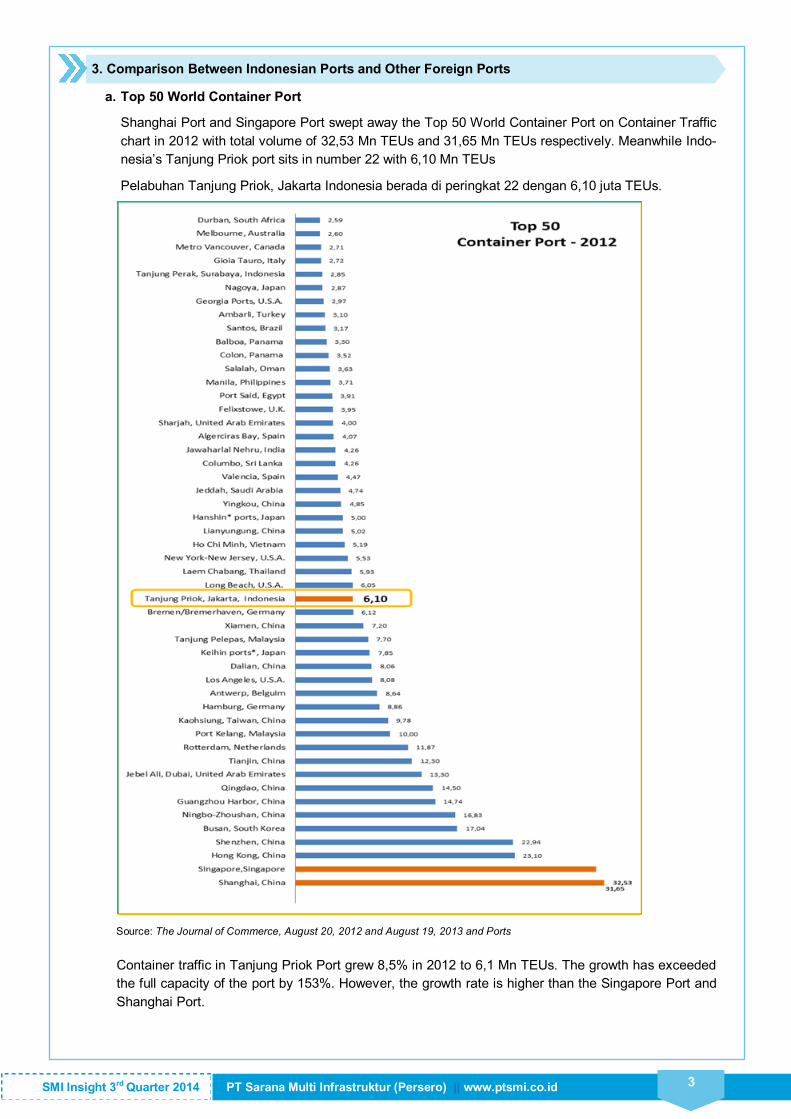
a. Top 50 World Container Port
Shanghai Port and Singapore Port swept away the Top 50 World Container Port on Container Traffic
chart in 2012 with total volume of 32,53 Mn TEUs and 31,65 Mn TEUs respectively. Meanwhile Indo-
nesia’s Tanjung Priok port sits in number 22 with 6,10 Mn TEUs
Pelabuhan Tanjung Priok, Jakarta Indonesia berada di peringkat 22 dengan 6,10 juta TEUs.
Source: The Journal of Commerce, August 20, 2012 and August 19, 2013 and Ports
Container traffic in Tanjung Priok Port grew 8,5% in 2012 to 6,1 Mn TEUs. The growth has exceeded
the full capacity of the port by 153%. However, the growth rate is higher than the Singapore Port and
Shanghai Port.
PT Sarana Multi Infrastruktur (Persero) || www.ptsmi.co.id SMI Insight 3rd Quarter 2014 4
b. Shanghai Port
Within 2011-2012, Shangai Port sit at the top of World’s busiest port list with 31,7 Mn TEUs and
32,52 Mn TEUs respectively. The size of the port has been expanded to 3,95 km2 equal to 470
soccer fields. With the expansion in 2005, the capacity of the port increase significantly from 14
Mn TEUs in 2004 to 32,52 Mn TEUs in 2012. The 2013 annual report stated that the container
throughput of the port increase 3,8% YoY to 33,77 Mn TEUs.
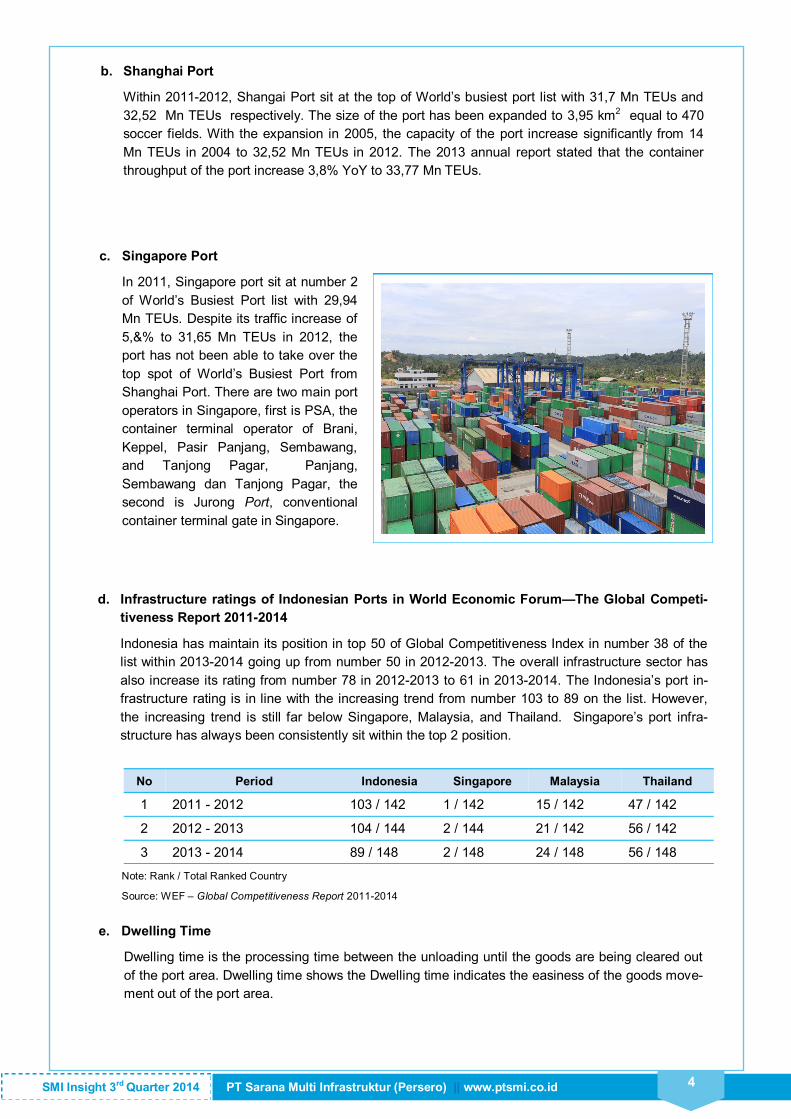
c. Singapore Port
In 2011, Singapore port sit at number 2
of World’s Busiest Port list with 29,94
Mn TEUs. Despite its traffic increase of
5,&% to 31,65 Mn TEUs in 2012, the
port has not been able to take over the
top spot of World’s Busiest Port from
Shanghai Port. There are two main port
operators in Singapore, first is PSA, the
container terminal operator of Brani,
Keppel, Pasir Panjang, Sembawang,
and Tanjong Pagar, Panjang,
Sembawang dan Tanjong Pagar, the
second is Jurong Port, conventional
container terminal gate in Singapore.
d. Infrastructure ratings of Indonesian Ports in World Economic Forum—The Global Competi-
tiveness Report 2011-2014
Indonesia has maintain its position in top 50 of Global Competitiveness Index in number 38 of the
list within 2013-2014 going up from number 50 in 2012-2013. The overall infrastructure sector has
also increase its rating from number 78 in 2012-2013 to 61 in 2013-2014. The Indonesia’s port in-
frastructure rating is in line with the increasing trend from number 103 to 89 on the list. However,
the increasing trend is still far below Singapore, Malaysia, and Thailand. Singapore’s port infra-
structure has always been consistently sit within the top 2 position.
No Period Indonesia Singapore Malaysia Thailand
1 2011 - 2012 103 / 142 1 / 142 15 / 142 47 / 142
2 2012 - 2013 104 / 144 2 / 144 21 / 142 56 / 142
3 2013 - 2014 89 / 148 2 / 148 24 / 148 56 / 148
e. Dwelling Time
Dwelling time is the processing time between the unloading until the goods are being cleared out
of the port area. Dwelling time shows the Dwelling time indicates the easiness of the goods move-
ment out of the port area.
Note: Rank / Total Ranked Country
Source: WEF – Global Competitiveness Report 2011-2014
PT Sarana Multi Infrastruktur (Persero) || www.ptsmi.co.id SMI Insight 3rd Quarter 2014 5
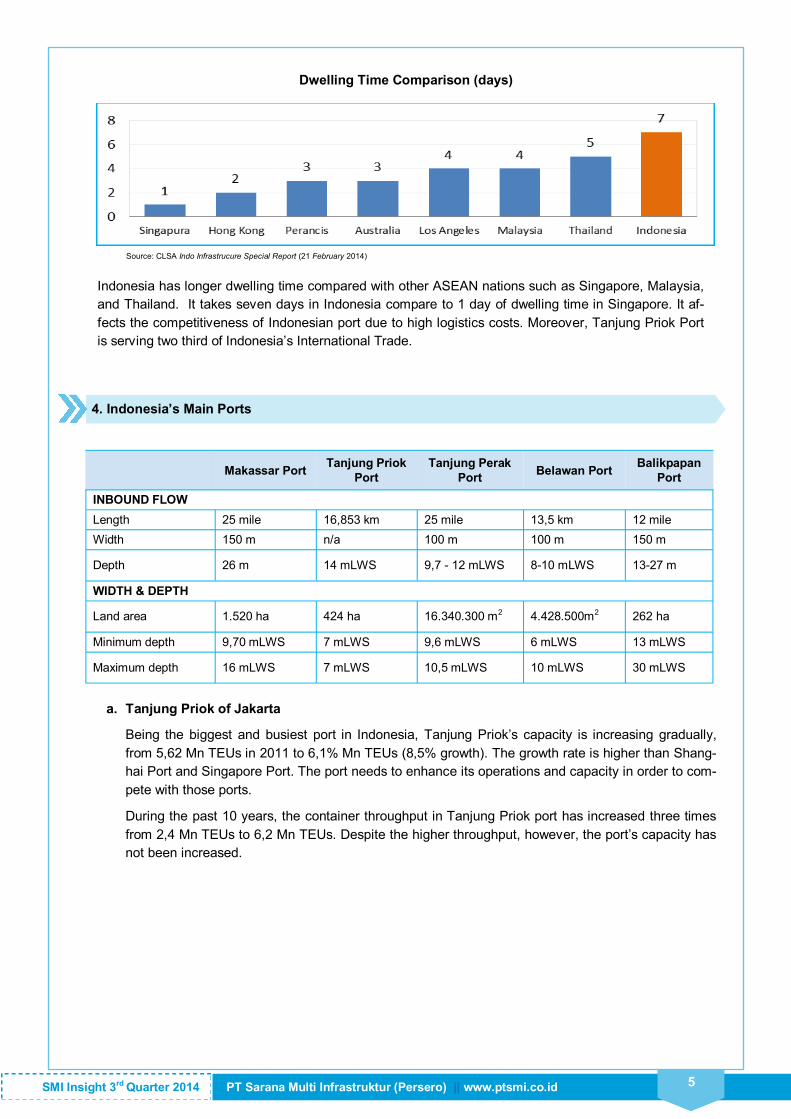
Source: CLSA Indo Infrastrucure Special Report (21 February 2014)
Indonesia has longer dwelling time compared with other ASEAN nations such as Singapore, Malaysia,
and Thailand. It takes seven days in Indonesia compare to 1 day of dwelling time in Singapore. It af-
fects the competitiveness of Indonesian port due to high logistics costs. Moreover, Tanjung Priok Port
is serving two third of Indonesia’s International Trade.
4. Indonesia’s Main Ports
Makassar Port
Tanjung Priok
Port
Tanjung Perak
Port Belawan Port
Balikpapan
Port
INBOUND FLOW
Length 25 mile 16,853 km 25 mile 13,5 km 12 mile
Width 150 m n/a 100 m 100 m 150 m
Depth 26 m 14 mLWS 9,7 - 12 mLWS 8-10 mLWS 13-27 m
WIDTH & DEPTH
Land area 1.520 ha 424 ha 16.340.300 m2 4.428.500m2 262 ha
Minimum depth 9,70 mLWS 7 mLWS 9,6 mLWS 6 mLWS 13 mLWS
Maximum depth 16 mLWS 7 mLWS 10,5 mLWS 10 mLWS 30 mLWS
a. Tanjung Priok of Jakarta
Being the biggest and busiest port in Indonesia, Tanjung Priok’s capacity is increasing gradually,
from 5,62 Mn TEUs in 2011 to 6,1% Mn TEUs (8,5% growth). The growth rate is higher than Shang-
hai Port and Singapore Port. The port needs to enhance its operations and capacity in order to com-
pete with those ports.
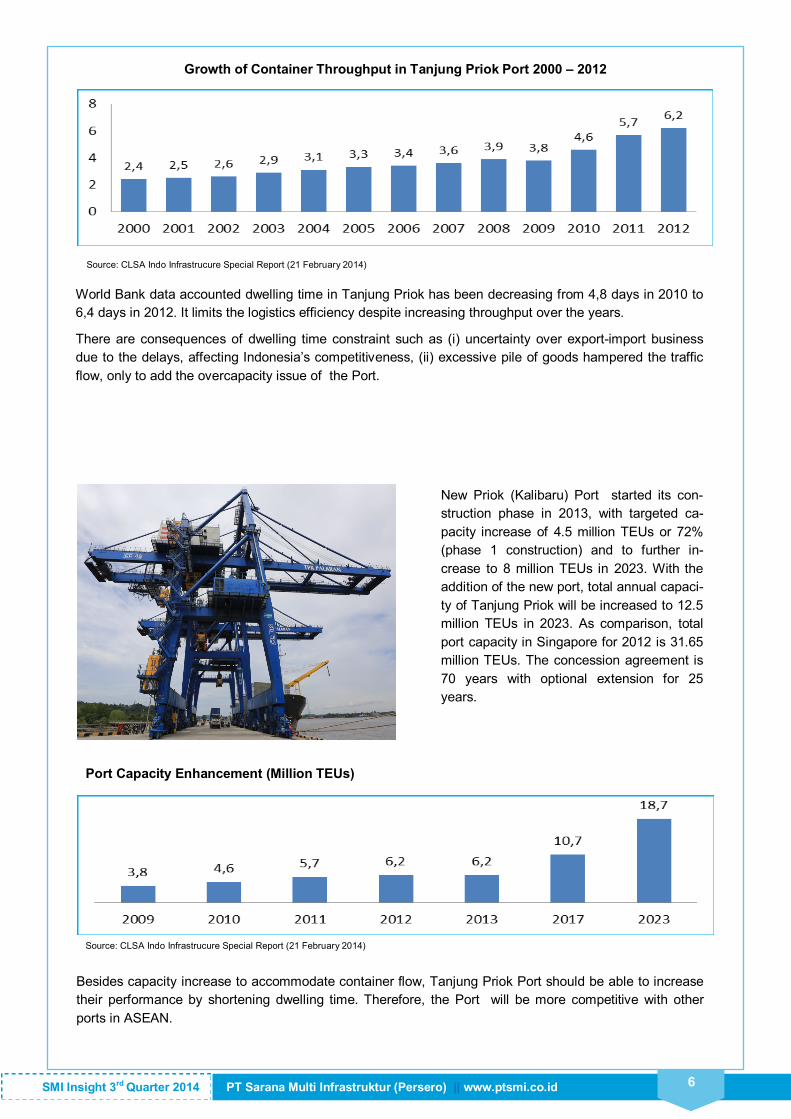
During the past 10 years, the container throughput in Tanjung Priok port has increased three times
from 2,4 Mn TEUs to 6,2 Mn TEUs. Despite the higher throughput, however, the port’s capacity has
not been increased.
Dwelling Time Comparison (days)
PT Sarana Multi Infrastruktur (Persero) || www.ptsmi.co.id SMI Insight 3rd Quarter 2014 6
Growth of Container Throughput in Tanjung Priok Port 2000 – 2012
Source: CLSA Indo Infrastrucure Special Report (21 February 2014)
World Bank data accounted dwelling time in Tanjung Priok has been decreasing from 4,8 days in 2010 to
6,4 days in 2012. It limits the logistics efficiency despite increasing throughput over the years.
There are consequences of dwelling time constraint such as (i) uncertainty over export-import business
due to the delays, affecting Indonesia’s competitiveness, (ii) excessive pile of goods hampered the traffic
flow, only to add the overcapacity issue of the Port.
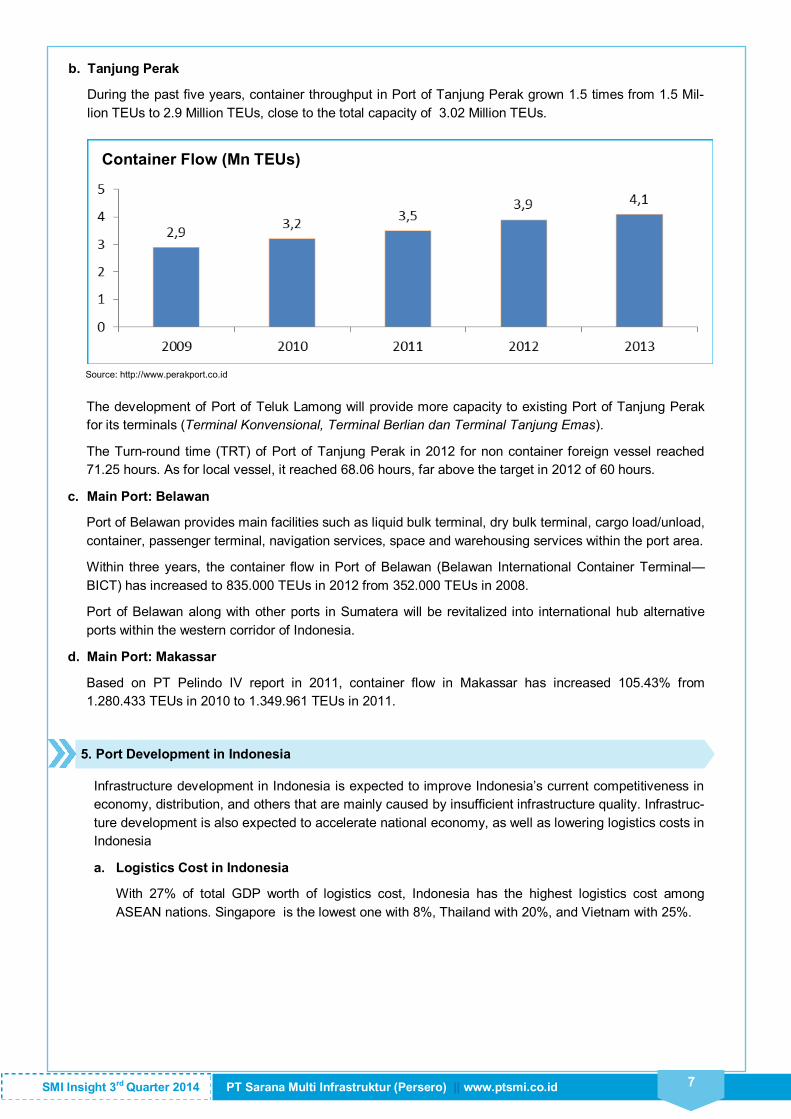
New Priok (Kalibaru) Port started its con-
struction phase in 2013, with targeted ca-
pacity increase of 4.5 million TEUs or 72%
(phase 1 construction) and to further in-
crease to 8 million TEUs in 2023. With the
addition of the new port, total annual capaci-
ty of Tanjung Priok will be increased to 12.5
million TEUs in 2023. As comparison, total
port capacity in Singapore for 2012 is 31.65
million TEUs. The concession agreement is
70 years with optional extension for 25
years.
Source: CLSA Indo Infrastrucure Special Report (21 February 2014)
Besides capacity increase to accommodate container flow, Tanjung Priok Port should be able to increase
their performance by shortening dwelling time. Therefore, the Port will be more competitive with other
ports in ASEAN.
Port Capacity Enhancement (Million TEUs)
PT Sarana Multi Infrastruktur (Persero) || www.ptsmi.co.id SMI Insight 3rd Quarter 2014 7
b. Tanjung Perak
During the past five years, container throughput in Port of Tanjung Perak grown 1.5 times from 1.5 Mil-
lion TEUs to 2.9 Million TEUs, close to the total capacity of 3.02 Million TEUs.
Source: http://www.perakport.co.id
The development of Port of Teluk Lamong will provide more capacity to existing Port of Tanjung Perak
for its terminals (Terminal Konvensional, Terminal Berlian dan Terminal Tanjung Emas).
The Turn-round time (TRT) of Port of Tanjung Perak in 2012 for non container foreign vessel reached
71.25 hours. As for local vessel, it reached 68.06 hours, far above the target in 2012 of 60 hours.
c. Main Port: Belawan
Port of Belawan provides main facilities such as liquid bulk terminal, dry bulk terminal, cargo load/unload,
container, passenger terminal, navigation services, space and warehousing services within the port area.
Within three years, the container flow in Port of Belawan (Belawan International Container Terminal—
BICT) has increased to 835.000 TEUs in 2012 from 352.000 TEUs in 2008.
Port of Belawan along with other ports in Sumatera will be revitalized into international hub alternative
ports within the western corridor of Indonesia.
d. Main Port: Makassar
Based on PT Pelindo IV report in 2011, container flow in Makassar has increased 105.43% from
1.280.433 TEUs in 2010 to 1.349.961 TEUs in 2011.
5. Port Development in Indonesia
Infrastructure development in Indonesia is expected to improve Indonesia’s current competitiveness in
economy, distribution, and others that are mainly caused by insufficient infrastructure quality. Infrastruc-
ture development is also expected to accelerate national economy, as well as lowering logistics costs in
Indonesia
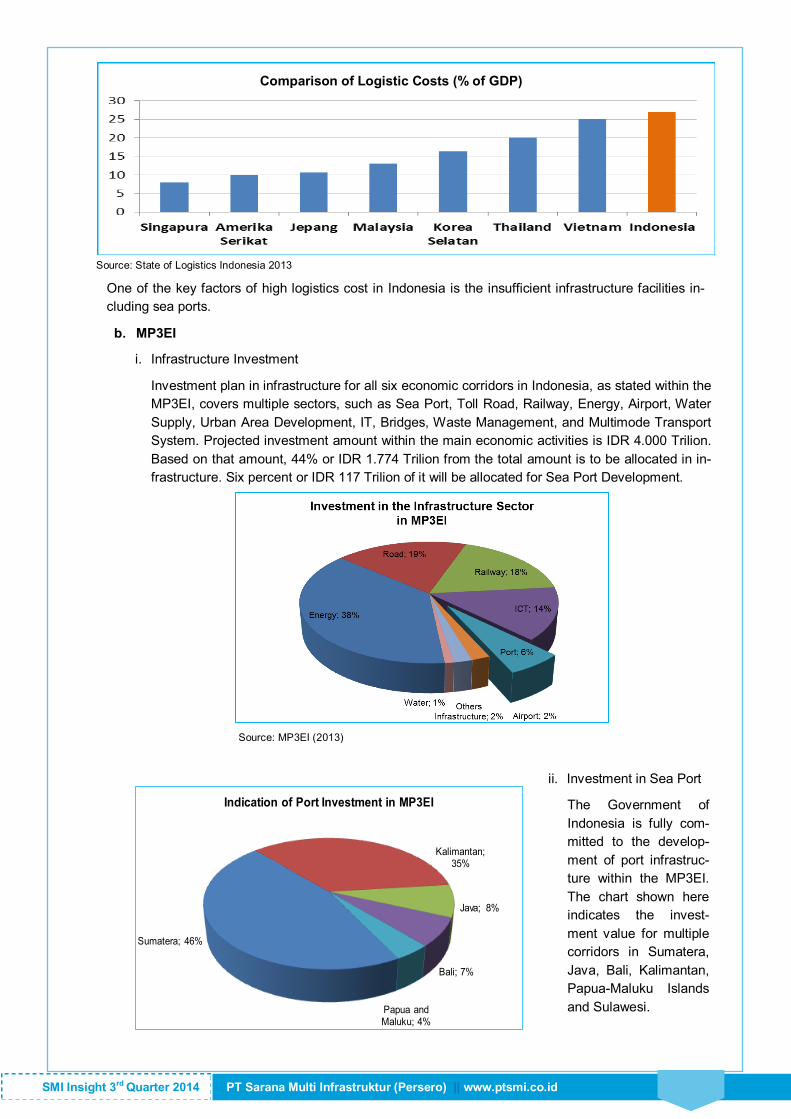
a. Logistics Cost in Indonesia
With 27% of total GDP worth of logistics cost, Indonesia has the highest logistics cost among
ASEAN nations. Singapore is the lowest one with 8%, Thailand with 20%, and Vietnam with 25%.
Container Flow (Mn TEUs)
PT Sarana Multi Infrastruktur (Persero) || www.ptsmi.co.id SMI Insight 3rd Quarter 2014
Source: State of Logistics Indonesia 2013
One of the key factors of high logistics cost in Indonesia is the insufficient infrastructure facilities in-
cluding sea ports.
b. MP3EI
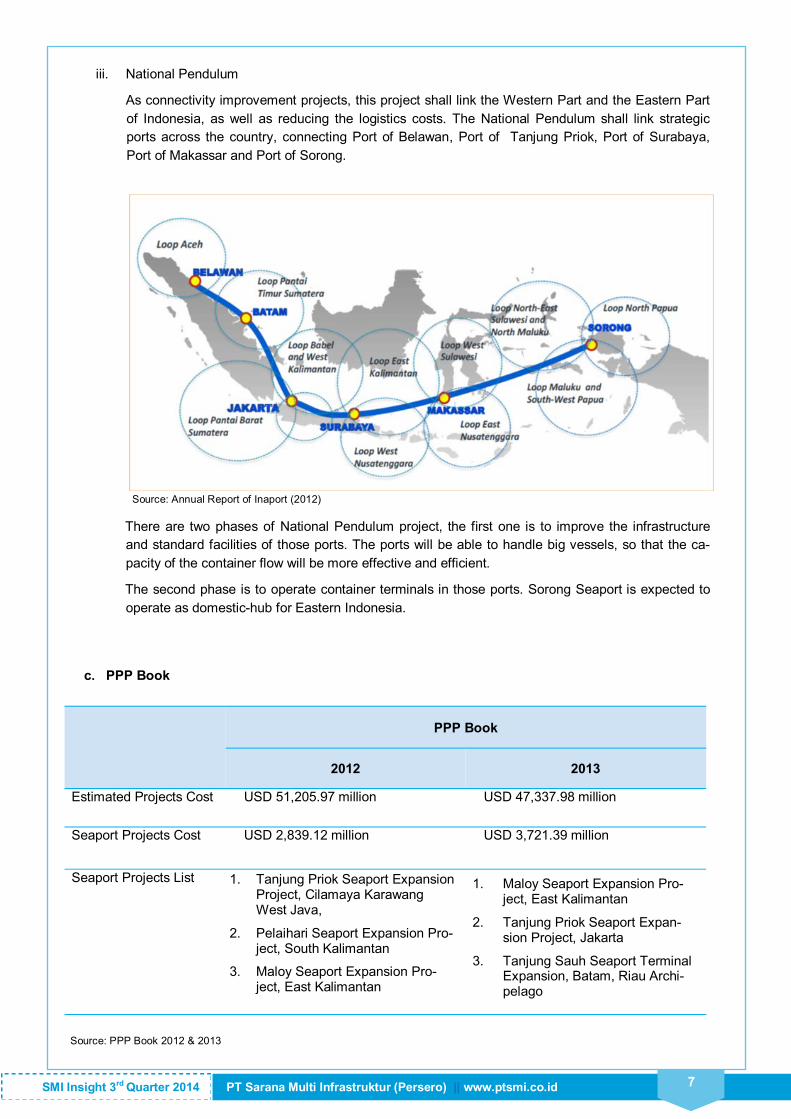
i. Infrastructure Investment
Investment plan in infrastructure for all six economic corridors in Indonesia, as stated within the
MP3EI, covers multiple sectors, such as Sea Port, Toll Road, Railway, Energy, Airport, Water
Supply, Urban Area Development, IT, Bridges, Waste Management, and Multimode Transport
System. Projected investment amount within the main economic activities is IDR 4.000 Trilion.
Based on that amount, 44% or IDR 1.774 Trilion from the total amount is to be allocated in in-
frastructure. Six percent or IDR 117 Trilion of it will be allocated for Sea Port Development.
Source: MP3EI (2013)
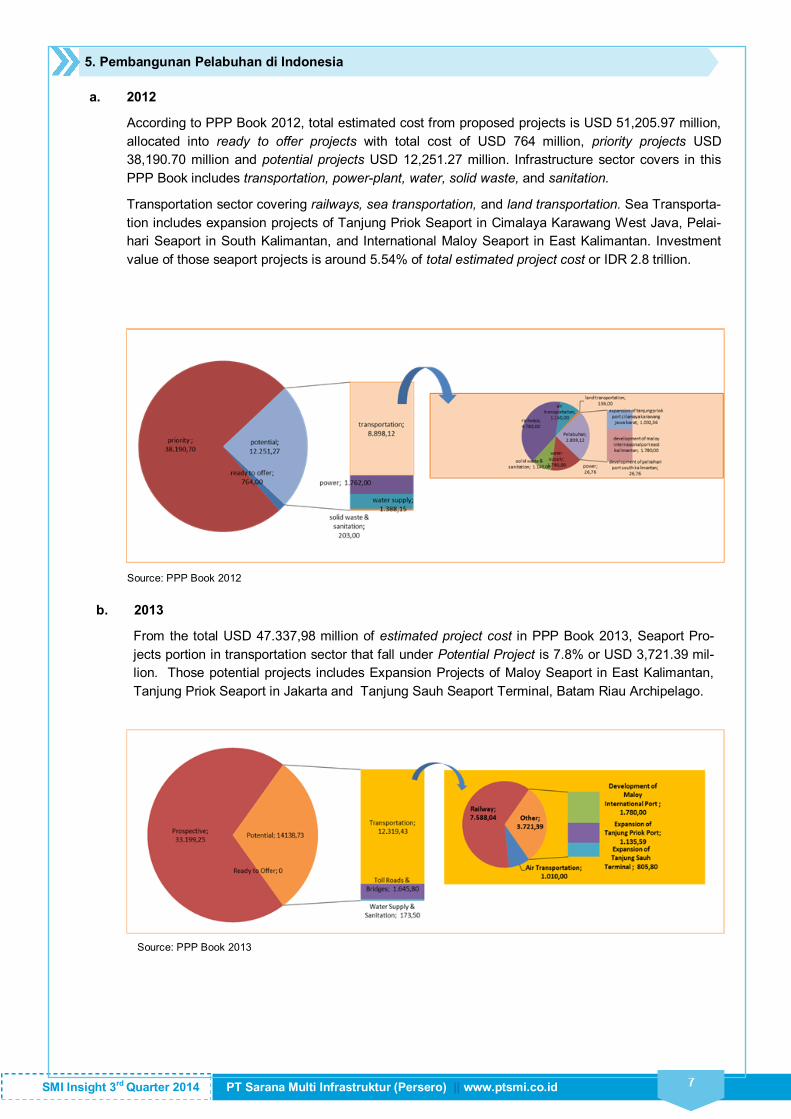
ii. Investment in Sea Port
The Government of
Indonesia is fully com-
mitted to the develop-
ment of port infrastruc-
ture within the MP3EI.
The chart shown here
indicates the invest-
ment value for multiple
corridors in Sumatera,
Java, Bali, Kalimantan,
Papua-Maluku Islands
and Sulawesi.
Comparison of Logistic Costs (% of GDP)
Sumatera; 46%
Kalimantan; 35%
Java; 8%
Bali; 7%
Papua and Maluku; 4%
Indication of Port Investment in MP3EI
PT Sarana Multi Infrastruktur (Persero) || www.ptsmi.co.id SMI Insight 3rd Quarter 2014 7
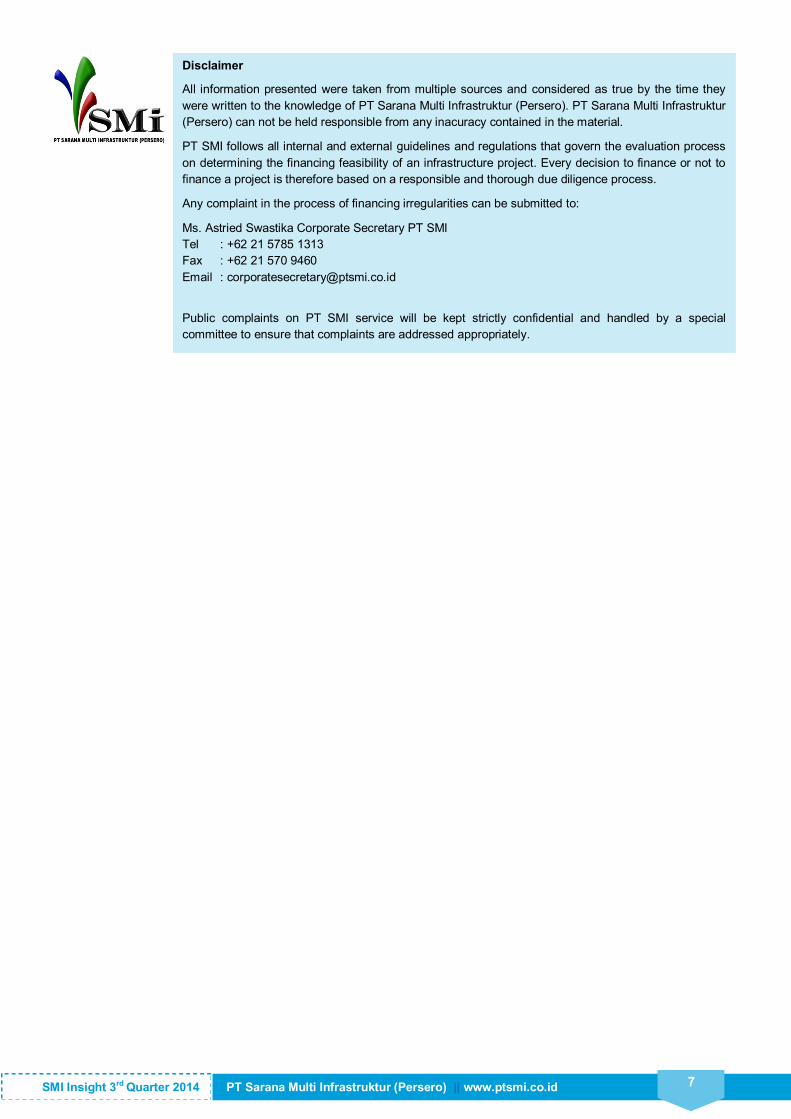
Source: Annual Report of Inaport (2012)
There are two phases of National Pendulum project, the first one is to improve the infrastructure
and standard facilities of those ports. The ports will be able to handle big vessels, so that the ca-
pacity of the container flow will be more effective and efficient.
The second phase is to operate container terminals in those ports. Sorong Seaport is expected to
operate as domestic-hub for Eastern Indonesia.
c. PPP Book
PPP Book
2012 2013
Estimated Projects Cost USD 51,205.97 million USD 47,337.98 million
Seaport Projects Cost USD 2,839.12 million USD 3,721.39 million
Seaport Projects List
Source: PPP Book 2012 & 2013
iii. National Pendulum
As connectivity improvement projects, this project shall link the Western Part and the Eastern Part
of Indonesia, as well as reducing the logistics costs. The National Pendulum shall link strategic
ports across the country, connecting Port of Belawan, Port of Tanjung Priok, Port of Surabaya,
Port of Makassar and Port of Sorong.
1. Maloy Seaport Expansion Pro-ject, East Kalimantan
2. Tanjung Priok Seaport Expan-sion Project, Jakarta
3. Tanjung Sauh Seaport Terminal Expansion, Batam, Riau Archi-pelago
1. Tanjung Priok Seaport Expansion Project, Cilamaya Karawang West Java,
2. Pelaihari Seaport Expansion Pro-ject, South Kalimantan
3. Maloy Seaport Expansion Pro-ject, East Kalimantan
PT Sarana Multi Infrastruktur (Persero) || www.ptsmi.co.id SMI Insight 3rd Quarter 2014 7
a. 2012
According to PPP Book 2012, total estimated cost from proposed projects is USD 51,205.97 million,
allocated into ready to offer projects with total cost of USD 764 million, priority projects USD
38,190.70 million and potential projects USD 12,251.27 million. Infrastructure sector covers in this
PPP Book includes transportation, power-plant, water, solid waste, and sanitation.
Transportation sector covering railways, sea transportation, and land transportation. Sea Transporta-
tion includes expansion projects of Tanjung Priok Seaport in Cimalaya Karawang West Java, Pelai-
hari Seaport in South Kalimantan, and International Maloy Seaport in East Kalimantan. Investment
value of those seaport projects is around 5.54% of total estimated project cost or IDR 2.8 trillion.
Source: PPP Book 2012
b. 2013
From the total USD 47.337,98 million of estimated project cost in PPP Book 2013, Seaport Pro-
jects portion in transportation sector that fall under Potential Project is 7.8% or USD 3,721.39 mil-
lion. Those potential projects includes Expansion Projects of Maloy Seaport in East Kalimantan,
Tanjung Priok Seaport in Jakarta and Tanjung Sauh Seaport Terminal, Batam Riau Archipelago.
Source: PPP Book 2013
5. Pembangunan Pelabuhan di Indonesia
PT Sarana Multi Infrastruktur (Persero) || www.ptsmi.co.id SMI Insight 3rd Quarter 2014 7
Disclaimer
All information presented were taken from multiple sources and considered as true by the time they
were written to the knowledge of PT Sarana Multi Infrastruktur (Persero). PT Sarana Multi Infrastruktur
(Persero) can not be held responsible from any inacuracy contained in the material.
PT SMI follows all internal and external guidelines and regulations that govern the evaluation process
on determining the financing feasibility of an infrastructure project. Every decision to finance or not to
finance a project is therefore based on a responsible and thorough due diligence process.
Any complaint in the process of financing irregularities can be submitted to:
Ms. Astried Swastika Corporate Secretary PT SMI
Tel : +62 21 5785 1313
Fax : +62 21 570 9460
Email : [email protected]
Public complaints on PT SMI service will be kept strictly confidential and handled by a special
committee to ensure that complaints are addressed appropriately.

PT Sarana Multi Infrastruktur (Persero) || www.ptsmi.co.id SMI Insight 3rd Quarter 2014