Embed Size (px)
Citation preview
WP-2012-014
Small Farmers in India:
Challenges and Opportunities
S.Mahendra Dev
Indira Gandhi Institute of Development Research, Mumbai
June 2012
http://www.igidr.ac.in/pdf/publication/WP-2012-014.pdf
Small Farmers in India:
Challenges and Opportunities
S.Mahendra Dev
Indira Gandhi Institute of Development Research (IGIDR)
General Arun Kumar Vaidya Marg
Goregaon (E), Mumbai- 400065, INDIA
Email (corresponding author): [email protected]
Abstract
This paper examines the roles and challenges of small holding agriculture in India. It covers
trends in agricultural growth, cultivation patterns, participation of small holding agriculture,
productivity performance of small holders, linking small holders with markets including
value chains, role of small holders in enhancing food security and employment generation,
differential policies and institutional support for small holders and, challenges and future
options for small holding agriculture including information needs. It also provides lessons
from the experience of India on small holding agriculture for other countries.
Keywords: Small and marginal farmers, food security, livelihoods, value chains, institutions
i

1
Small Farmers in India: Challenges and Opportunities
1
S.Mahendra Dev
1. INTRODUCTION AND BACKGROUND
Agriculture plays a pivotal role in the Indian economy. Although its contribution to gross
domestic product (GDP) is now around one sixth, it provides employment to 56 per cent of the
Indian workforce. Also, the forward and backward linkage effects of agriculture growth increase
the incomes in the non-agriculture sector. The growth of some commercial crops has significant
potential for promoting exports of agricultural commodities and bringing about faster
development of agro-based industries. Thus agriculture not only contributes to overall growth of
the economy but also reduces poverty by providing employment and food security to the
majority of the population in the country and thus it is the most inclusive growth sectors of the
Indian economy. The 12th
Five Year Plan Approach Paper also indicates that agricultural
development is an important component of faster, more inclusive sustainable growth approach.
The structural reforms and stabilization policies introduced in India in 1991 initially focused on
industry, tax reforms, foreign trade and investment, banking and capital markets. The economic
reforms did not include any specific package specifically designed for agriculture. In the post-
reform (since 1991) period, India has done well in some indicators such as economic growth,
exports, balance of payments, resilience to external shocks, service sector growth, significant
accumulation of foreign exchange, Information technology (IT) and stock market, improvements
in telecommunications etc. GDP growth was around 8 to 9% per annum in the period 2004-05 to
2007-08. India is now 2 trillion dollar economy. Investment and savings rates were quite high 32
to 36%.
However, there have been exclusion problems in the country. In other words, real development
in terms of growth shared by all sections of the population has not taken place. We have
problems of poverty, unemployment, inequalities in access to health and education and poor
performance of agriculture sector. One of the excluded sector during the reform period was
agriculture which showed low growth and experienced more farmers’ suicides. There are serious
concerns on the performance of agriculture sector in the country. The post-reform growth was
led by services. Commodity sector growth (agriculture+industry) has not been higher in the post-
reform period as compared to that of 1980s. Particular worry is agriculture sector which showed
lower than 2% per annum in the decade of mid-1990s to mid-2000s. There are also concerns on
food security and livelihoods.
Small holdings agriculture which is the focus of this paper is important for raising agriculture
growth, food security and livelihoods in India. It may be noted that Indian agriculture is the
home of small and marginal farmers (80%). Therefore, the future of sustainable agriculture
growth and food security in India depends on the performance of small and marginal farmers.
1 Paper presented at “Emerging Economies Research Dialogue’ Beijing , China, 14-15 November 2011 organized
by ICRIER.
2
Agricultural Census data shows that there were about 121 million agricultural holdings in India
in 2000-01. Around 99 million were small and marginal farmers. Average size has declined
from 2.3 ha. In 1970-71 to 1.37 ha. In 2000-01. Small and marginal farmers account for more
than 80% of total farm hhs. But their share in operated area is around 44%. Thus, there are
significant land inequalities in India.
The role of small farms in development and poverty reduction is well recognized (Lipton, 2006).
The global experience of growth and poverty reduction shows that GDP growth originating in
agriculture is at least twice as effective in reducing poverty as GDP growth originating outside
agriculture (WDR, 2008). Small holdings play important role in raising agricultural development
and poverty reduction.
The objective of this paper is to examine the role and challenges of small holding agriculture in
achieving agricultural growth, food security and livelihoods in India. The paper also shows that
market oriented reforms are not sufficient and government intervention and other support are
needed for small holdings to achieve the above goals. It is known that small farmers face several
challenges in the access to inputs and marketing. They need a level playing field with large farms
in terms of accessing land, water, inputs, credit, technology and markets.
Small holdings also face new challenges on integration of value chains, liberalization and
globalization effects, market volatility and other risks and vulnerability, adaptation of climate
change etc. (Thapa and Gaiha (2011). Recent “world-wide processes of farm change –
commercialisation of increasing proportions of input and output: institutional developments such
as super markets; privatization of key aspects of technical progress, and of output and process
grades and standards – now indicate large farm focus” (p.59, Lipton, 2006). Therefore, support is
needed for small holdings in the context of these world-wide processes of farm change. There are
also high returns from investments in agricultural R&d, rural roads and other infrastructure and
knowledge generation.
The paper is organized as follows. Section 3 gives a brief background on agricultural growth and
policies on agriculture. Section 3 examines the roles and challenges of small holding agriculture
in India. It covers trends in agricultural growth, cultivation patterns, participation of small
holding agriculture, productivity performance of small holders, linking small holders with
markets, role of small holders in enhancing food security and employment generation,
differential policies and institutional support for small holders and, challenges and future options
for small holding agriculture including information needs. Section 4 provides lessons from the
experience of India on small holding agriculture for other countries.
2. BACKGROUND
One of the paradoxes of the Indian economy is that the decline in the share of agricultural
workers in total workers has been slower than the decline in the share of agriculture in the GDP.
For example, the share of agriculture and allied activities in the GDP declined from 57.7 per cent
in 1950–1 to 15.7 per cent in 2008–9 (Table 1). The share of agriculture in total workers,
however, declined slowly from 75.9 per cent in 1961 to 56.4 per cent in 2004-05 (Table 1).
3
Between 1961 and 2004-05, there was a decline of 34 percentage points in the share of
agriculture in GDP while the decline in share of agriculture in employment was of only 19.5
percentage points. As a result, the gap between labour productivity in agriculture and non-
agriculture increased rapidly.
In terms of growth, the performance of agriculture in the post-Independence era has been
impressive as compared to the pre-Independence period. The all crop output growth of around
2.57 per cent per annum in the post-Independence period (during 1949–50 to 2007-8) was much
higher than the negligible growth rate of around 0.4 per cent per annum in the first half of the last
century. As a result, India achieved significant gains in food grains and non-food grain crops.
The highest growth rate of GDP from agriculture and allied activities of 3.9 per cent per annum
in recent years was recorded in the period 1992-3 to 1996-71 (Table 2). If we look at decadal
average 1980s recorded the highest growth rate of more than 3 per cent per annum. In the post-
reform period, it declined to 2.76 per cent per annum. The deceleration in the growth rate of
GDP from agriculture between the first half of the 1990s and the later period is glaring. It is
disquieting to note that during the 1997–8 to 2004–5, agriculture growth was only 1.6 per cent
per annum (Table 2). Fortunately, it recorded growth of 3.5 per cent per annum during 2004-05
to 2010-11. 12th
Five Year Plan (20012-17) aims to achieve 4% growth in agriculture.
Significant fluctuation in growth of agriculture is a matter of concern (Fig1).
Extensive cultivation has characterized Indian agriculture during the pre-1965 era, and intensive
cultivation in the post-green revolution period. There has been significant increase in the use of
modern inputs in Indian agriculture. During the period 1950–1 to 2003–4, the percentage of net
irrigated area to net cultivated area increased from around 17 to 41. During the same period,
fertilizer consumption showed a significant rise from less than 1 kg/ha to 90 kg/ha. Similarly, the
percentage of area under high yielding varieties (HYVs) to cereals cropped area has risen from
15 in 1970–1 to 75 in the late 1990s. The share of agriculture in electricity consumption also rose
from 4 per cent in 1950–1 to nearly 30 per cent in recent years. All this led to a significant
increase in agricultural output over time.
It may be noted that agriculture is a ‘state subject’ under the Constitution of India. However, the
central government plays a crucial role in shaping agricultural policies. Although Indian
agriculture is in private hands, government policies have greatly influenced its pace and
character.
Broadly, agricultural development policies over time can be divided into four sets of policy
packages: (a) institutional reforms; (b) public investment policies; (c) incentive policies; and (d)
reforms and globalization policies. The relative importance of the first three sets has varied over
time.
Thus, during the first three Five Year Plans (1950–65), the institutional reforms and public
investment packages dominated. The central and state governments enacted a number of laws
regarding land reforms. These laws mainly relate to three aspects: abolition of zamindari system,
land ceiling and redistribution of land, and tenancy reforms. The government was successful in
abolishing the zamindari or intermediary system after paying compensation to the zamindars.
4
The land ceiling laws were not effective although there was redistribution of some land to the
beneficiaries. The tenancy reforms were more successful in two states, West Bengal in the east
and Kerala in the south, than in others. West Bengal succeeded in giving ownership rights to
tenants, particularly sharecroppers (bargardars). Some efforts were made to consolidate
fragmented holdings in India since Independence. In some parts of north and north-west India
these efforts were relatively successful.
There was significant public investment in agriculture during 1950–65. To achieve the objective
of self-sufficiency in food grains, there was massive investment particularly in constructing
irrigation reservoirs and distribution systems. Another important policy during this period was
the expansion of institutional credit which helped reduce informal sources that had been
exploitative in respect of interest rates and terms and conditions.
During the 1967–90 period, incentive policies for adoption of new technology and public
investment policies dominated government strategy in agriculture. After the humiliating
experience with import of food grains in the mid-1960s, there was a vigorous drive for achieving
self-sufficiency in food grains by stepping up public investment in irrigation and introduction of
new technology through incentives. There was a need to increase domestic food production at a
faster rate by much higher productivity without upsetting the agrarian structure. Luckily at that
time new high-yielding dwarf varieties of wheat and rice were available in Mexico and the
Philippines respectively. Yields increased significantly for wheat initially and later for rice. This
breakthrough is popularly known as the ‘green revolution’. The productivity improvement
associated with the green revolution is best described as forest- or land-saving agriculture. It may
be noted that without the green revolution it would not have been possible to lift the production
potential of Indian agriculture.
Incentive policies focused on both inputs and output. Subsidies for inputs like irrigation, credit,
fertilizers, and power increased significantly in the 1970s and 1980s. The objective of the
subsidies is to provide inputs at low prices to protect farmer interests and encourage diffusion of
new technology. Similarly, on the output side, there has been a comprehensive long-term
procurement-cum-distribution policy in the post-green revolution period. The government
announces the support prices at sowing time and agrees to buy all the grains offered for sale at
this price. To support these operations, institutions like the Food Corporation of India (FCI) and
the Agricultural Prices Commission (APC) were established in the mid-1960s.
In the post-reform period, economic reforms in India since 1991 have improved the incentive
framework and agriculture has benefited from reduction in protection to industry. The terms of
trade for agriculture have improved and private investment has increased. Export of
commodities, particularly cereals, has risen and there has been some progress on market reforms
in terms of removing domestic and external controls. However, there were also concerns about
agriculture and food security in the 1990s. There has been emphasis on price factors at the cost
of non-price factors like research and extension, irrigation, and credit. Economic reforms have
largely neglected the agricultural sector and only in the last few years have domestic and external
trade reforms in the sector started.
5
Trade policies in India during the last five decades have been highly interventionist and
discriminating against agriculture. There has been pessimism regarding international trade in
agriculture.
Trade liberalization in agriculture has been faster towards the end of the 1990s in tune with WTO
agreements. There has been considerable progress in the liberalization of export controls, and
quantitative controls on imports and on decontrol of domestic trade. The 11th
Five Year Plan
focused on ‘faster and inclusive growth’. An important aspect of ‘inclusive growth’ in the 11th
Plan is its target of 4 per cent per annum growth in GDP from agriculture and allied sectors. A
detailed agenda for action is spelt out in Mid-term appraisl of 11th
Five Year Plan covering
improved access to water, improvement in the supply of good quality seeds, replenishment of
soil nutrients, improvements in agricultural research and extension, reforms in land tenancy and
improvements in agricultural marketing which is particularly important for perishable produce.
The 12th
Five Year Plan is going to focus on small and marginal farmers and resource poor
regions.
3. ROLES, CHALLENGES AND OPPORTUNITIES FOR SMALL HOLDING
AGRICULTURE IN INDIA
In this section, we examine the role, challenges, policies and opportunities for small holding
agriculture in India. India is a big country with 1.2 billion population. One state’s population is
closer to that of Europe. Therefore, there is also a need to look at regional level to bring out the
variations.
3.1. Role of Small Holding Agriculture
Structure of land holdings: India is a land of small farmers. According to Agricultural Census
2000-01, there were an estimated 98 million small and marginal holdings out of around 120
million total land households in the country. As shown in Table 3, the share of marginal and
small farmers accounted for around 81% of operational holdings in 2002-03 as compared to
about 62% in 1960-61. Similarly, the area operated by small and marginal farmers has increased
from about 19% to 44% during the same period. Recent data for 2005-06 shows that the share of
small and marginal farmers in land holdings was 83% (Chand et al, 2011). Thus, the small
holding character of Indian agriculture is much more prominent today than even before.
The average size of holdings in India declined from 2.3 ha. in 1970-71 to 1.33 ha. in 2000-01. It
may be noted that 63% of land holdings belong to marginal farmers with less than 1 ha. The
average size of marginal holdings is only 0.24 at all India level. The average size of small
holdings is 1.42 ha. Table 4 shows average size of holdings by farm size. The average size of
marginal holdings varies from 0.14 ha. in Kerala to 0.63 ha. in Punjab.
Access to Irrigation: The access to irrigation has increased for all categories of farmers. It is the
highest for marginal farmers followed by small farmers. Table 5 indicates that the percentage of
area under irrigation for small farmers increased from 40 in 1980-81 to 51 in 2000-01. On the
other hand, for large farmers it rose from 16 to 31% during the same period. It may, however, be
noted that large farmers capitalize on cheaper sources like canals while small farmers have to
rent water. About 40 per cent of the irrigated are for large farmers was from canals while it was
less than 25 per cent in the case of small and marginal farmers (NCEUS, 2008).

6
Access to Fertilizers and Area under HYV: The fertilizer per hectare is inversely related to farm
size for both irrigated and unirrigated areas (Table 6). It increased from marginal farmers in
irrigated areas from 100 kgs. in 1980-81 to 252 kgs. in 2001-02. In fact, the per hectare
consumption for all farm sizes was similar on irrigated areas in 1981-82 but it rose faster for
marginal farmers and small farmers in 2001-02. This is true in the case of unirrigated areas also.
Similarly, the percentage of area under high yielding varieties (HYV) is also inversely related to
farm size (Table 7). In the irrigated areas, the coverage of are under HYV was 89%, 86% and
78% respectively in marginal, small and large farmers in 2001-02. In the case of unirrigated
areas, the coverage was above 50% for marginal, small and semi-medium but it was only 30%
for large farmers in 2001-02.
Cropping Intensity: Multiple cropping index is higher for marginal and small farmers than that
for medium and large farmers. For marginal farmers, cropping intensity increased from 134 in
1981-82 to 139 in 2001-02 (Table 8). In the case of large farmer, it rose from 116 to 121 during
the same period. The differences across farm sizes persisted over time.
Cropping Patterns: Do small and marginal farmers grow high value crops? Table 9 shows
cropping patterns by size of farms. Birthal et al (2011) provide four conclusions from these
cropping patterns: (a) small and marginal farmers allocate larger proportion of their cultivated
land to high value crops like fruits, and vegetables ; (b) small and marginal farmers seem to have
comparative advantage in growing vegetables than fruits because of quick returns in the former;
(c) small and marginal farmers allocate larger proportion of rice and wheat than other farmers;
(d) small and marginal farmers allocate lower proportion of land to pulses and oilseeds.
Farm Size, output and productivity: The contribution to output is higher for marginal and small
farmers as compared to their share in area. The share of these farmers was 46.1% in land
possessed but they contribute 51.2% to the total output of the country (Fig 2 and Table 10) at all
India level in 2002-03. There are significant regional variations in their contribution to output.
The share of output is less than the operated area in ten states (Table 10). In rest of the states, the
reverse was true. The contribution of small and marginal farmers to output ranges from 19% in
Punjab to 86% in West Bengal. It is less than 50% in 9 out of 20 states. In the Estern states, the
share of both area and output are high for these farmers. On the other hand, in some of the states
in Central, Western and North-Western regions, medium and large farmers still dominate in both
area and output.
In terms of production, small and marginal farmers also make larger contribution to the
production of high value crops. They contribute around 70% to the total production of
vegetables, 55% to fruits against their share of 44% in land area (Birthal, 2011). Their share in
cereal production is 52% and 69% in milk production. Thus, small farmers contribute to both
diversification and food security. Only in the cases of pulses and oilseeds, their share is lower
than other farmers.
There has been debate in India on the relationship between farm size and productivity. The
results of NSS 2003 Farmers’ survey has empirically established that small farms continue to be
produce more in value terms per hectare than the medium and large farms. Fig 3 shows that
value of output per hectare was Rs.14754 for marginal farmers, Rs.13001 for small farmers, Rs.
7
10655 for medium farmers and Rs.8783 for large farmers. It shows that from efficiency point
of view, small holdings are equal or better than large holdings. Table 11 indicates large
regional variations in the value of output per hectare. For marginal farmers, it varies from
Rs.29448 in Punjab to Rs.7177 in Rajasthan. This is also true for large medium and large farmers
– it ranges from Rs.28983 in Punjab to Rs.4213 in Rajasthan. In many states, small holdings
have higher value of output per hectare than large farms. However, in the case of states like,
Kerala, Madhya Pradesh, Uttar Pradesh, Himachal Pradesh and Tamil Nadu, the large farms
have higher productivity (in value terms) than marginal farmers. In the case of Punjab, the
differences in productivity are not large across farm sizes.
3.2. Small Holders and Livelihoods
We have mentioned above that 98 million out of total 120 million farm holdings are small and
marginal farmers. The sustainability of these farmers is crucial for livelihoods in rural areas and
for the entire country. It is true that small holdings have higher productivity than medium and
large farms. But, as our discussion below shows that it is not enough to compensate for the
disadvantage of the small area of holdings. The cost of cultivation per hectare is also high on
small and marginal farmers than medium and large farms (Table 12). At the all India level, net
farm income per hectare for small holdings is higher than large holdings (Table 13). The data at
state level shows that in 9 out of 20 states, the reverse is true – net farm income per hectare is in
large holdings higher than small holdings2.
However, the monthly income and consumption figures across different size class of land
holdings show that marginal and small farmers have dis-savings compared to medium and large
farmers. The average monthly income of farmer households is comprised of income from wages,
net receipts from cultivation, net receipts from farming of animals and income from non-farm
business. The average monthly consumption of farmer households is comprised of total food and
non-food expenditure.
According to NSS 2003 data, the monthly consumption of marginal farmers was Rs.2482 and
monthly income was Rs.1659 (Table 14 and Fig 4.1). It shows that they have dis-savings of
Rs.823. The dis-savings for small farmers were Rs.655. On the other hand, for large farmers,
monthly income and consumption respectively were Rs.9667 and Rs.6418 with savings of
Rs.3249. Table 14 and Figs 4.2 to 4.7 provides state wise details on monthly income and
consumption according to farm size. As NCEUS (2008) says “consumption expenditure of
marginal and small farmers exceeds their estimated income by a substantial margin and
presumably the deficits have to be plugged by borrowing or other means” (p.12). NCEUS (2008)
also indicates that the poverty for small holding farmers is much higher than other farmers. The
need for increase in productivity and incomes of small holdings and promotion of non-farm
activities for these farmers are obvious. 3.3. Issues and Challenges for Small Holders
There are many issues and challenges for small holding agriculture in India. NSS Farmers’
survey of 2003 brought out many issues relating to small and marginal farmers. Based on this
Survey, NCEUS (2008) says that “some of the general issues that confront marginal-small
farmers as agriculturalists are: imperfect markets for inputs/product leading to smaller value
2 On returns to farming, see Sarthak and Mishra (2011)
8
realizations; absence of access to credit markets or imperfect credit markets leading to sub-
optimal investment decisions or input applications; poor human resource base; smaller access to
suitable extension services restricting suitable decisions regarding cultivation practices and
technological know-how; poorer access to ‘public goods’ such as public irrigation, command
area development, electricity grids; greater negative externalities from poor quality land and
water management, etc” (p.7). This sub-section discusses some of the key issues and challenges
relating to small holding agriculture.
Role of women: The importance of women in agriculture has been increasing. The share of rural
females in agriculture was around 83 per cent in 2004-05 as compared to 67% among rural men,
showing the importance of women in agriculture in rural areas. Percentage of women among
marginal farmers (38.7%) is higher than that for large farmers (34.5%) in 2004-05. These
proportions have increased over time. Agriculture is becoming increasingly feminized as men are
migrating to rural non-farm sector. They work in “land preparation, seed selection and seed
production, sowing, in applying manure, fertilizer and pesticides, weeding, transplanting,
threshing, winnowing and harvesting etc as well as in animal husbandry and dairying, fish
processing, collection of non timber forest produces (NTFPs), back yard poultry, and collection
of fuel wood, fodder and other products for family needs” (GOI, 2007). Despite their importance,
women are continually denied their property rights and access to other productive resources.
Protecting women’s rights in land, enhancing infrastructure support to women farmers, and
giving legal support on existing laws, will facilitate recognition for women as farmers and enable
them to access credit, inputs, and marketing outlets.
Social Groups: The proportion of socially disadvantaged groups such as Scheduled Castes (SCs)
and Scheduled Tribes (STs) is higher among marginal and small farmers than that of medium
and large farmers. Around 22% of semi-marginal and marginal farmers are from SCs compared
to 7.8% in medium and large farmers. SCs have more than half of their holdings of less than half
a hectare. Similarly, 15.6% of small farmers belong to STs compared to 14.9% among medium
and large farmers. The distribution of land ownership among STs is better than SCs. However,
the quality of STs land is probably of the lowest quality. Social identity of farmers is also seen to
mediate access to economic resources and outcomes. Even after accounting for quantity and
quality of land owned by socially deprived classes, their access to information, marketing, credit
and publicly provided inputs and extension services are lower. This shows that they possibly
suffer from discrimination in the delivery of public services as well as market (NCEUS, 2008).
Land Issues: Land and tenancy security: National Commission on Enterprises for Unorganized
Sector argued that there is a strong evidence that relatively successful implementation of even a
modest package of land reforms dramatically improve the prospect of the poor. Regaing small
and marginal farmers, they own and cultivate some land but it is a limiting factor for getting
resources. Therefore, tenancy security is important for small holding farmers.
Land relations are extremely complicated and this complexity has contributed significantly to the
problems facing actual cultivators. Unregistered cultivators, tenants, and tribal cultivators all face
difficulties in accessing institutional credit and other facilities available to farmers with land
titles. One priority is to record and register actual cultivators including tenants and women
cultivators, and provide passbooks to them, to ensure that they gain access to institutional credit
and other inputs. As part of the reforms, lease market should be freed and some sort of security

9
for tenants has to be guaranteed. This will ensure availability of land for cultivation on marginal
and small farmers. The land rights of tribals in the agency areas must be protected. There is
considerable scope for further land redistribution, particularly when waste and cultivable lands
are taken into account. Complementary inputs for cultivation (initial land development, input
minikits, credit, etc.) should be provided to all assignees, and the future assignments of land
should be in the name of women.
On land market, the Report of the Steering Committee recommended the following. “Small
farmers should be assisted to buy land through the provision of institutional credit, on a long
term basis, at a low rate of interest and by reducing stamp duty. At the same time, they should be
enabled to enlarge their operational holdings by liberalizing the land lease market. The two
major elements of such a reform are: security of tenure for tenants during the period of contract;
and the right of the land owner to resume land after the period of contract is over” (Planning
Commission, 2007a). Basically, we have to ensure land leasing, create conditions including
credit, whereby the poor can access land from those who wish to leave agriculture.
Low level of formal education and skills: Education and skills are important for improving
farming practices, investment and productivity. Table 15 gives literacy levels and mean years of
education for unorganized self employed agriculture workers by farm size. It shows that literacy
and mean years of education are lower for small holding farmers compared to medium and large
farmers. For example, literacy among males and females for marginal farmers respectively were
62.5% and 31.2% while the corresponding numbers for medium and large farmers were 72.9%
and 39% (Table 15). Similarly, mean years of education for males among marginal farmers was
3.9 as compared to 5.3 for medium and large farmers. It is important for small holding farmers
to have a reasonable level of awareness regarding information on agriculture. The low level of
farmers’ education limits public dissemination of knowledge. The NSS farmers’ Survey clearly
shows that awareness about bio-fertilizers, minimum support prices and WTO is associated with
education levels which are lower for marginal and small farmers.
Credit and Indebtedness: Small holdings need credit for both consumption and investment
purposes. Increasing indebtedness is one of the reasons for indebtedness among these farmers in
recent years. Table 16 shows that overall indebtedness is not higher for small and marginal
farmers compared to large farmers. However, the indebtedness for the small & marginal farmers
from formal institutional sources is lower than large farmers and the reverse is true in the case of
informal sources. The dependence on money lenders is the highest for sub-marginal and
marginal farmers (Table 17). Table 18 shows that the share of formal source increases with the
size of land. At all India level, the share of formal source varies from 22.6% to 58% for small
and marginal farmers while it varies from 65 to 68% for medium to large farmers. Dependence
of small and marginal farmers on informal sources is high even in states like Andhra Pradesh,
Punjab and Tamil Nadu. For example, small and marginal farmers of Andhra Pradesh have to
depend on 73% to 83% of their loans on informal sources. This indicates very low financial
inclusion for Andhra Pradesh. The NSS data also shows that across social groups, the
indebtedness through formal sources is lower for STs as compared to others.
Globalization challenges: Increasing globalization has added to the problems faced by the small
holding agriculture. The policies of huge subsidies and protection policies by developed
countries have negative effects on small holding farmers in developing countries. If support is

10
not given to small farms, globalization may become advantageous for large farms.There has been
adverse impact of trade liberalization on the agricultural economy of the regions growing crops
such as plantation, cotton and oil seeds in which foreign trade is important. With liberalization,
the issue of efficiency has become highly relevant as domestic production has to compete with
products of other countries. In the recent years domestic prices of several agricultural
commodities have turned higher than international prices. India is not able to check import of a
large number of commodities even at high tariff. This is true not only in the case of import from
developed countries where agriculture is highly subsidized but also in the case of products from
developing countries. India is facing severe import competition in the case of items like palm oil
from Malaysia and Indonesia, spices from Vietnam, China and Indonesia, tea from Sri Lanka and
rice from Thailand and Vietnam (Planning Commission, 2007). To compete in the global market,
the country needs to reduce various post- harvest costs and undertake suitable reforms to
improve efficiency of domestic markets and delivery systems. To be able to successfully
compete in a liberalized trade regime, therefore, there is need for a paradigm shift from merely
maximizing growth to achieving efficient growth. For farmers, perhaps the single most adverse
effect has been the combination of low prices and output volatility for cash crops. The effect of
volatility in international prices on domestic agriculture should be checked by aligning tariffs
with the changing price situation.
Impact of climate change: Climate change is a major challenge for agriculture, food security and
rural livelihoods for millions of people including the poor in India. Adverse impact will be more
on small holding farmers. Climate change is expected to have adverse impact on the living
conditions of farmers, fishers and forest-dependent people who are already vulnerable and food
insecure. Rural communities, particularly those living in already fragile environments, face an
immediate and ever-growing risk of increased crop failure, loss of livestock, and reduced
availability of marine, aquaculture and forest products. They would have adverse effects on food
security and livelihoods of small farmers in particular. In order to have climate change sensitive
and pro-poor policies, there is a need to focus on small farmers. Agriculture adaptation and
mitigation could provide benefits for small farmers. The coping strategies would be useful to
have long term adaptation strategies. There is a significant potential for small farmers to
sequester soil carbon if appropriate policy reforms are implemented. The importance of
collective action in climate change adaptation and mitigation is recognized. Research and
practice have shown that collective action institutions are very important for technology transfer
in agriculture and natural resource management among small holders and resource dependent
communities.
Water problems: Water is the leading input in agriculture. Development of irrigation and water
management are crucial for raising levels of living in rural areas. Agriculture has to compete for
water with urbanization, drinking water and industrialization. As mentioned above, small holding
agriculture depend more on ground water compared to large farmers who has more access on
canal water. Ground water is depleting in many areas of India. Marginal and small farmers are
going to face more problems regarding water in future. Therefore, water management is going to
be crucial for these farmers (more on this below).
Diversification: There has been diversification of Indian diets away from foodgrains to high
value products like milk and meat products and vegetables and fruits. The increasing middle-
class due to rapid urbanization, increasing per-capita income, increased participation of women
11
in urban jobs and impact of globalization has been largely responsible for the diet diversification
in India. Hi-value products have caught the fancy of the expanding middle class and the result is
visible in the growing demand for hi-value processed products. There is growing demand for
non-foodgrain items in India. The expenditure elasticity for non-cereal food items is still quite
high in India. It is thrice as high when compared to cereals in the rural areas and over ten times
as high in urban areas. Per capita consumption of fruits and vegetables showed the highest
growth followed by edible oils. Diversification to high value crops and allied activities is one of
the important sources for raising agricultural growth. Since risk is high for diversification,
necessary support in infrastructure and marketing are needed. Price policy should also encourage
diversification. Small and marginal farmers can get higher incomes with diversification. But,
there are risks in shifting to diversification as the support systems are more for food grains.
There is a need for support systems for diversification to help the small holder farmers.
Risk and vulnerability: There is enough evidence to suggest that poor and poorest of the poor
households are vulnerable to a range of risks affecting individuals, households or whole
communities which can have a devastating affect on their livelihoods and well being. They have
higher exposure to a variety of risks at individual or household level. Some of them are (a) health
shocks: illness, injury, accidents, disability; (b) labour market risk: many work in informal sector
and have high risk of unemployment and underemployment; (c)harvest risks, life cycle risks, social
risk and special risks for vulnerable groups. In addition, they have community risks such as
droughts, floods, cyclones, structural adjustment policies etc. Small and marginal farmers are
vulnerable to all these risks. Most of the coping mechanisms followed by households are:
borrowing, sale of assets, spending from savings, assistance from relatives and govt., expanded
labour supply, child labour, bonded labour, reducing consumption, migration etc. Comprehensive
social protection programmes are required to address the negative effects due risks and
vulnerabilities. India has many social protection programmes. The present major schemes for the
poor in India fall into four broad categories: (i) food transfer like public distribution system
(PDS) and supplementary nutrition (ii) self employment (iii) wage employment and (iv) social
security programmes for unorganized workers. The effectiveness of these programmes have to
be improved so that small and marginal farmers can also benefit from these programmes. Crop
insurance programmes and future markets have to be strengthened to reduce risks in price and
yields. 3.4. Opportunities for Small Holding Agriculture
Inspite of above challenges, there are many technological and institutional innovations which can
enable marginal and small farmers to raise agricultural productivity and increase incomes
through diversification and high value agriculture.
Before going to technological innovations, we discuss below the policy issues under research and
extension in agriculture. These are applicable to small and marginal farmers.
3.4.1. Research and Extension
The yield growth for many crops has declined in the 1990s. Technology plays an important role
in improving the yields. The National Commission on Farmers also indicates that there is a large
knowledge gap between the yields in research stations and actual yields in farmers’ fields. There
12
seems to be a technology fatigue in Indian agriculture. The yield gaps given y the Planning
Commission (2007) are the following.
The 2003-05 data show very large yield gaps:
• Wheat: 6% (Punjab) to 84% (M.P.)
• Rice: Over 100% in Assam, Bihar, Chattisgarh and UP
• Maize: 7% (Gujarat) to 300% (Assam)
• Jowar: 13% (M.P.) to 200% (Karnataka)
• Mustard: 5% (Haryana) to 150% (Chattisgarh)
• Soybean: 7% (Rajasthan) to 185% (Karnataka)
• Sugarcane: 16% (A.P.) to 167% (M.P.)
A fresh look at the priorities of Indian agricultural research system is necessary in light of
emerging prospects. There is only marginal increase in the funds for research in the recent
budgets. Of course states have to take a lead in research and extension. It is known that India
spends only 0.5 per cent of GDP on agricultural research as compared to more than 1 per cent by
other developing countries. There is considerable potential for raising the effectiveness of these
outlays by reordering the priorities in agricultural research and redefining the relative roles of
public and private sectors in research and extension3.
A review of the research and development activities of the Indian Council of Agricultural
Resarch (ICAR) system during the first two years of the 10th
Plan revealed several weaknesses.
Some of these are (a) there is inadequate emphasis on the needs of rainfed areas, which account
for over 60% of cultivated area; (b) crop bias with major focus on rice and wheat; (c)
proliferation of programmes resulting in resources being spread thinly and lack of focus in areas
of relevance and opportunity; (d) inadequate priority to emerging challenges, particularly post-
harvest, marketing and environmental conservation; (e) the multiplicity of institutes with
overlapping mandates has led to duplication of research work; (f) lack of accountability, less
emphasis on multidisciplinary research, weak interaction among researchers, extension workers
and farmers and the private sector and, excessive centralization of planning and monitoring. A
thorough reform of ICAR system is needed to address these weaknesses.
There is a need to shift away from individual crop-oriented research focused essentially on
irrigated areas towards research on crops and cropping systems in the dry lands, hills, tribal and
other marginal areas4. Dry land technology has to be improved. In view of high variability in
agro-climatic conditions in such unfavourable areas, research has to become increasingly
location-specific with greater participation or interaction with farmers. Horticulture crops that are
land-saving and water-saving should be encouraged in dry land areas. Research has to be
improved on horticulture crops.
Progress in post-harvest technology is essential to promote value addition through the growth of
agro-processing industry. Private sector participation in agricultural research, extension and
marketing is becoming increasingly important especially with the advent of biotechnology and
3 More on research and extension, see Rao (2005)
4 See Swaminathan (2007) on research and technology
13
protection being given to intellectual property. However, private sector participation tends to be
limited to profitable crops and enterprises undertaken by resource rich farmers in well endowed
regions. Moreover, private sector is not interested in research for better techniques of soil and
water management, rainfed agriculture, cropping systems, environmental impact and long term
sustainability. Therefore, the public sector research has to increasingly address the problems
facing the resource-poor farmers in the less endowed regions. The new agricultural technologies
in the horizon are largely biotechnologies. Effective research is needed to have biotechnologies
suitable to different locations in India.
Regarding extension, the existing Training and Visit (T and V) system of extension is top-down
in its approach and there is little participation by the farmers. There is a need to take corrective
steps to deal with the near collapse of the extension system in most states. In the absence of
public provision of such services, the resource poor and gullible farmers are becoming the
victims of exploitation by the unscrupulous traders and money lenders interested in selling inputs
such as seeds, fertilizers and pesticides. There is, therefore, an immediate need for reforming and
revitalizing the existing agricultural extension system in the country. The main ingredient of
reforms should be : (a) active involvement of farmers through user groups/associations; (b)
participation by the private sector and the NGOs; (c) increasing use of media and information
technology including cyber kiosks to disseminate the knowledge on new agricultural practices
and the information on output and input prices; and (d) building gender concerns into the system,
for example, by manning the extension services predominantly by women5.
The returns to investment on research and extension will be much higher on agricultural growth
as compared to other investments.
3.4.2.Technological Innovations
It may be noted that agricultural technologies are ‘scale neutral’ but not ‘resource neutral’ (Singh
et al, 2002). Small holder-oriented research and extension should give importance to cost
reduction without reduction in yields. Therefore, new technological innovations are needed.
“These include low external input and sustainable agriculture approaches based on ecological
principles but without the use of artificial chemical fertilizers, pesticides or agro-ecological
principles but without the use of artificial chemical fertilizers, pesticides, or genetically modified
organisms; and biotechnology” (Thapa and Gaiha, 2011).
The need for adopting the methods of an evergreen revolution has become very urgent now. As
Swaminathan (2010) mentions, among other things, there are two major pathways to fostering an
evergreen revolution. The first is organic farming. Productive organic farming needs
considerable research support, particularly in the areas of soil fertility replenishment and plant
protection. The other pathway to an evergreen revolution is green agriculture. In this context,
ecologically sound practices like conservation farming, integrated pest management, integrated
nutrient supply and natural resources conservation are promoted. Green agriculture techniques
could also include the cultivation of crop varieties bred through use of recombinant DNA
technology if they are good in resisting to biotic and abiotic stresses or have other attributes like
improving nutritive quality (Swaminathan, 2010).
5 See Rao (2005)

14
Zero Tillage: Cultivation practices such as zero-tillage (which involves injecting seeds directly
into the soil instead of sowing on ploughed fields) combined with residue management and
proper fertilizer use can help to preserve soil moisture, maximize water infiltration, increase
carbon storage, minimize nutrient runoff, and raise yields. Iis expanding rapidly in India. In
2005, in the rice–wheat farming system of the Indo-Gangetic plain, farmers adopted zero-tillage
on 1.6 million hectares; by 2008, 20–25 percent of the wheat in two Indian states (Haryana and
Punjab) was cultivated using minimum tillage. (WDR, 2010).
Public Sector Led Improved Technologies: Public sector led improved technologies have been
helping small farmers in India. The improved wheat varieties in Punjab and technology of single
cross hybrid for maize have significantly contributed in enhancing yields in small farms.
Mysore’ study (2010) on horticulture shows that one of the driving forces for horticulture
development in India is due to ‘easy-to-fit' technologies in the system. The study highlights a
number of public sector driven improved technologies. These include: (a) productivity enhancing
technologies; (b) input saving technologies; (c) nutrient balancing technologies; (d) value adding
technologies. The small interventions reduced crop damage, increased production and raised
income both in domestic and export markets. There are also technologies regarding efficient
water management (more on this below).
Rural women play a significant role in animal husbandry and are directly involved in major
operations like feeding, breeding, management and health care. As the ownership of livestock is
more evenly distributed with landless laborers, and marginal farmers, the progress in this sector
will result in a more balanced development of the rural economy, particularly in the reduction of
poverty and malnutrition. As Singh et al (2002) mention, priorities for live-stock technology
development are animal health, nutrition, and reproduction.
Nutrient Management: Nitrogen applied in fertilizers, manures, biosolids and other N sources are
not used efficiently by crops. Management strategies to improve the nitrogen use efficiency of
crops which reduce fertilizer requirements focus on fertilizer best management practices. A note
written for IFPRI by Flynn (2009) says that the best practices should look at application type,
application rates, application timing and application placement. For example, balancing
application rates of nitrogen with other required nutrients including phosphorus, potassium and
sulphur is a major way of improving nitrogen use efficiency. Similarly, appropriate nitrogen
application rates are important in order to have effectiveness on yields.
Another way is switching to organic production which can reduce fertilizer use. Better use of
existing organic sources of nutrients, including animal manure, crop residues, and nitrogen-
fixing crops such as legumes. Such organic nitrogen sources may also contribute to raising
sequestration of carbon in soils (Flynn, 2009). However, yields have to be maintained with
organic farming as compared to cultivation with chemical fertilizers.
Bio-technology: The term biotechnology covers a wide range of scientific techniques and
products that can be used in numerous ways to boost and sustain the productivity of crops,
livestock, fisheries and forests. Though agricultural biotechnology is used synonymously with
genetic modification by general public, there are many techniques in biotechnology apart from
genetic modification. The other techniques are –genomics and bioinformatics, marketed-assisted
15
selection, diagnostic procedures, micro propagation, tissue culture, cloning, artificial
insemination, embryo transfer and other technologies (Rao and Dev, 2010).
Recently India had two revolutions in technology. One is BT cotton and the other is hybrid
maize. Studies on Bt cotton showed that small farmers benefited from the introduction of this
technology. A study on four districts of Andhra Pradesh (Warangal, Nalgonda, Guntur, Kurnool)
examined, among other things, whether the benefits of Bt Cotton technology are shared by all
groups of farmers across social categories and size groups (Rao and Dev, 2010). The green
revolution technologies have been utilized by upper strata of farmers and later gradually spread
to other strata. But in the case of biotechnological application, the small farmers and SC and ST
farmers also made use of the technology well since the beginning. The small farmers growing Bt
cotton have significantly improved their position compared to the non-Bt growing small farmers.
The net income improved by 69 per cent and farm business income improved by 108 per cent.
This clearly shows that the small farmers are better off with Bt cotton than without Bt cotton.
Same is the case with Scheduled Castes (SCs). Bt cotton led to improving the net income by 59
per cent. The farm business income is higher by three times than non-Bt farmers from SCs.
Therefore, it is very clear that the farmers from SCs, who are also generally small farmers, got
benefited from adopting this technology.
Information technology: Changes in information technology will help in a big way to improve
agri-business and incomes of small farmers. Indian private companies and NGOs are global
leaders in providing information to farmers, as a spinoff from India’s meteoric rise as a world
leader in ICTs. E-Choupal has expanded access to internet in rural areas. Up to 6,400 internet
kiosks were set up between 2000 and 2007 by ITC Limited, one of the largest agricultural
exporters. It reaches about 4 million farmers growing a range of crops - soybean, coffee, wheat,
rice, pulses or shrimp - in over 40,000 villages. They get free information in their language about
local and global market prices, weather forecasts, farming practices and crop insurance. It serves
as a purchase centre, cutting marketing costs and allowing farmers to obtain a bigger farm price.
The M. S. Swaminathan Research Foundation established Knowledge Centers in Pondicherry in
1997. With the support of the Indian Space Research Organization, centers in each village are
connected by satellite to a hub at Villianur. The women self-help groups use the centers’
computers to manage their business accounts and coordinate their activities, using video links
with the other villages.
The declining costs of ICTs are giving small farmers much greater access to information. Mobile
phone coverage in India is expanding at breakneck speed. Nokia sold several lakhs of new
mobile phone handsets, and new subscriptions are averaging 6 million a month, many in rural
areas. Computers are now being linked through mobile phone networks to greatly expand the
scope of information. By linking communication technologies to market exchanges in
commercial centers, even small farmers can overcome the enormous informational asymmetries
that limit their bargaining power in traditional supply chains. The revolution in mobile phones is
helping the small farmers to get information about crop prices and input prices and other related
information on agriculture.
3.4.3. Institutional Innovations
Small holding agriculture faces many challenges. But, a number of innovative institutional
models are emerging and there are many opportunities for small and marginal farmers in India.
Institutions relating to (a) land and water management, (b) group or cooperative approach for
16
inputs and marketing and, (c) value chains and super markets can enhance productivity,
sustainability and incomes of small holding agriculture.
Institutions for sustainable land and water management
Development of irrigation and water management are crucial for raising levels of living in rural
areas6. Major areas of concern in irrigation are: decline in real investment, thin spread of
investment, low recovery of costs, decline in water table, wastages and inefficiencies in water
use and, non-involvement of users Both investment and efficiency in use of water are needed.
Major areas of reforms needed in irrigation are: stepping up and prioritizing public investment,
raising profitability of groundwater exploitation and augmenting ground water resources, rational
pricing of irrigation water and electricity, involvement of user farmers in the management of
irrigation systems and, making groundwater markets equitable (Rao, 2005). In a recent study,
Shah et al (2009) indicate that the impact of the drought of 2009 is expected be less severe than
the drought of 2002 due to ground water recharge in the last few years. Ground water can be
exploited in a big way in Eastern region. Watershed development and, water conservation by the
community are needed under water management. New watershed guidelines based on
Parthasarathy Committee’s recommendations were accepted by the Central Cabinet in March
2009. The implementation has to be stepped up in order to obtain benefits in rainfed areas.
National Rainfed Area Authority has big responsibility in matters relating to water conservation
and watershed development. Assets created under NREGS can help in improving land and water
management.
Environmental concerns are among the policy priorities in India. Particularly degradation of land
and water is alarming. Watershed development under the new guidelines, in general, has an
overall positive impact on environment. However, groundwater tables are depleting at an
alarming rate. The de facto privatization of groundwater and subsidized power supply are the
main culprits. There has been a neglect of minor irrigation sources like tanks. Shortage of
drinking water has accentuated and quality of water has declined over time.
An integrated approach is needed for water resources management in the country. An appropriate
strategy should integrate institutional approaches with market principles. Since institutional
innovation (Water user associations) is already in place for canal irrigation, it is time now to
implement volumetric pricing. There is a need to de-link water rights from land rights in order to
ensure equity and sustainability.
Institutions like the water user associations (WUAs) and watershed committees are important for
water management. The experience of Andhra Pradesh shows that the impact of WUAs has been
encouraging in these areas. especially in terms of providing irrigation to tail end farmers. This
has been made possible by cleaning of canals and water courses and monitoring of water losses
by the WUAs. Area under paddy is reported to have increased significantly following reforms.
However, much of the reported increase could be statistical because of underreporting of
irrigated area before reform , as this meant lesser payment of water tax to revenue department.
Paddy yields are reported to have increased by 40%. Long term solution for effective functioning
of WUAs is awareness building and promoting participatory monitoring and evaluation. Unlike
in the case of canal irrigation, WUAs are not found to be effective in respect of tank irrigation
due to insufficient allocations.
6 On land and water management, see Vaidyanathan (2006)
17
In the case of land and forestry, watershed approach and Joint Forest Management are crucial for
protecting the environment. The critical issue is sustainability of these programmes. Although
watersheds have shown positive economic impact, the social issues are missing. More
participatory approach and involvement of women would lead to sustainability of watershed
development approach. In the case of JFM, the focus is more on high income areas like timber.
Low value products constituting sources of livelihoods for the poor have low priority. Customary
rights of the tribals on podu (shifting cultivation) have to be recognised. Awareness and
involvement of the civil society is a precondition for checking environmental degradation.
Environmental movements would have a discerning impact in this regard.
Another concern is the land degradation due to excessive use of fertilizers and pesticides.
Government has programmes such as Integrated Pest Management (IPM) and Integrated Nutrient
Management (INM). Keeping in view the ill effects of pesticides and also National Policy on
Agriculture, Integrated Pest Management Approach (IPM) approach has been adopted as a
cardinal principle and main plank of plant protection in the country in the overall crop
production programme. Besides ongoing activities, the thrust area will be pertaining to Pest Risk
Analysis (PRA) and post entry quarantine surveillance. This has become essential in the light of
WTO agreement, which will facilitate more and speedier movement of plants, planting materials
globally.
Women’s collectives: Women’s cooperatives, producer women’s groups and other forms of
group efforts, where they do not already exist, should be promoted to overcome constraints of
small and uneconomic land holdings, for the dissemination of agricultural technology and other
inputs, as well as for marketing of produce (Agarwal, 2010). There has also been greater
emphasis on women’s collectives. For example, Deccan Development Society (DDS), an NGO
enables women from landless families to access various government schemes to establish claims
on land, through purchase and lease. There are “four critical steps that ensured local food
security in an experiment by the Deccan development society in Andhra Pradesh where the
‘sangams’ – women’s collectives (i) improved 6,000 acres of degraded land, (ii) dalit women
took cultivable land on lease, (iii) organised their own public distribution of grains with accent
on coarse cereals consumed by 65 per cent of our rural population; built grain banks at village
level, and (iv) made systematic collection and preservation of seed varieties” (Krishnaraj, 2006).
Raturi’s study (2011) shows that Gujarat and Andhra Pradesh have tried to put in place different
institutional environment to make a fundamental change in the institutional arrangement for
supporting rural development and agriculture sector. In Gujarat, state government introduced
Krishi Mohatsav. A month long intensive campaign is launched during the month of May each
year. “Over 100,000 government officials from the Chief Minister down to staff at the taluka
level from over 15 departments of the government, and over 1500 scientists, are involved in the
program” (Raturi, 2011). This Mohatsava serves as an institutional platform at the village level
and proved to be an important support for farmers.
An initiative in Andhra Pradesh based on the Self Help Group (SHG) provides another example
of an institutional platform for agriculture. The Community Managed Sustainable Agriculture
(CMSA) programme was initiated by the Society for Elimination of Rural Poverty (SERP) in
Andhra Pradesh in 2004. The mandate of the program is to eradicate poverty and to improve
18
livelihoods of the poor. It may also help in nutrition because of improvements in livelihoods. The
initiative aims to address the major causes of agriculture distress and helps farmers in adopting
sustainable agricultural practices. CMSA has now reached 8033 villages in 503 mandals of all 22
districts (Raturi, 2011). It covers about 2.7 million acres and benefit about 1.05 million farmers.
Institutions for Marketing of Small Holdings
For small and marginal farmers, marketing of their products is main problem apart from credit
and extension. In recent years , there has been some form of contract arrangements in several
agricultural crops such as tomatoes, potatoes, chillies, gherkin, baby corn, rose, onions, cotton,
wheat, basmati rice, groundnut, flowers, and medicinal plants. There is a silent revolution in
institutions regarding non-cereal foods. New production –market linkages in the food supply
chain are: spot or open market transactions, agricultural co-operatives and contract farming
(Joshi and Gulati, 2003).
One of the most successful producer organization is the Indian dairy cooperative which in 2005
had a net work of more than 100,000 village level dairy cooperatives with 12.3 million members
(see Birthal et al 2008).
Contract farming has a potential to help the small and marginal farmers overcome constraints in
accessing inputs, credit, extension and marketing. In recent years, there has been some form of
contract arrangements in several agricultural crops such as tomatoes, potatoes, chilies, gherkin,
baby corn, rose, onions, cotton, wheat, basmati rice, groundnut, flowers, and medicinal plants
and is spreading throughout India in states like Andhra Pradesh (Dev and Rao, 2005), Tamil
Nadu, Karnataka, Punjab and Maharashtra.
While the pros of contract farming are potentially many, the sponsoring companies may be
unreliable, may exploit a monopoly position, and/or have inefficient management and marketing
problems that could result in manipulation of quota and non-fulfillment of commitments.
Contract farming in India is neither backed up by law nor by an efficient legal system. This is the
single most constraint to widespread use of contract farming in India. The legal system can be
improved with legislative measures like the model contract and code of practice, registration of
contracts with marketing committees and tribunals for efficient, speedy and corrupt-free dispute
resolutions.
There is a need to revamp some of the legal hurdles for agro processing and APMC Act7. Several
State Governments have already amended their APMC Acts allowing varying degrees of
flexibility. However several States are yet to notify the relevant rules that would make the
amendment fully operational. These steps should be speedily completed to provide a boost to
promotion of direct marketing, contract farming, and setting up of markets in private and co-
operative sectors.
Most important problem for the small farmers is output price fluctuations. There is a big gap
between producer prices and consumer prices. There are different models for marketing
collectively by the small and marginal farmers. These are: self help group model, co-operative
model, small producer co-operatives and contract farming. Apni Mandi in Punjab, Rytu Bazars in
7 See Chadha (2009) on agro processing and rural industrialization
19
Andhra Pradesh, dairy co-operatives are some of the successful cases in marketing. The real
challenge lies in organising the small and marginal farmers for marketing and linking them to
high value agriculture. Thus, group approach is needed for getting benefits from marketing.
Super markets and supply chains: Small farmers can benefit from the emerging super markets
and value chains. The presence of super markets as retail trade is rapidly expanding in the
emerging economies. According to Reardon and Gulati (2008), this process has developed in an
astonishing speed: Supermarkets now enjoy a retail share of 50-60% in South America, East
Asia (China excluded) and South Africa; and a 30-50% in Mexico, Central America and much of
South East Asia. While in China, India and Vietnam their market is still low and variable (2-
20%), it is experiencing an annual growth between 30% and 50%.
Reardon and Minten (2011a) examine the patterns and dynamics of diffusion of modern food
retail in India. They emphasized three surprises in the rise of modern food retail in India. They
are: “(1) that has occurred since the 1960s with waves of government, coop, and then private retail; (2)
that the private retail wave has been extremely fast in particular in its second phase, in the pst 6 years,
when it grew at 49% per year on average, some 5 times faster than the fast growth being experienced in
the GDP; (3) that the rise of private retail chains has been unique or rare in is drivers (in its great majority
by domestic capital, not foreign investment), and “early” (compared with the prior experience in other
developing countries) in its penetration of the food markets of the poor, of small cities and even rural
areas, of fresh product markets, and its use of diverse formats to help toward the above ends” (p.20,
Reardon and Minten, 2011a).
In a study on food supply chains in India, Reardon and Minten (2011) indicate the following
changes in the past two decades.
(1) A modern sector is emerging in the whole sale sector with the growth of moden logistics
firms and specialized modern wholesalers.
(2) Tradition segment of the whole sale sector is also transforming. Based on earlier studies,
this study presents the findings on transformation of traditional whole sale sector as
follows.
(a) Rural traditional market transformation is much more advanced in certain regions For
example, West and Central regions of Madhya Pradesh and West and Central Uttar
Pradesh are different from Eastrn regions of these states.
(b) The marginal farms (0-1 hectare) look more like traditional rural India with low
market surplus, chemical use, credit use, lower use of clod stores etc. On the other
hand, small and medium farmers are more dynamic.
(c) The conventional view is that food supply chains are dominated by long chain of
many hands. The recent findings show that supply chains can be short.
(d) Conventional view is that farmers are at the mercy of money lender of because of tied
credit. But, the surveys show that less than 5 per cent take advance or credit in any
form from brokers or wholesalers.
(e) The surveys show rapid development of cold stores for potato in Uttar Pradesh and
Bihar in 2000s.
In India, the expansion of modern retailing has the potential to spark investment in marketing
efficiency and processing that yields benefits to both producers and consumers. In those cases
20
where small producers have been able to integrate into the supplying chains, supermarkets have
offered enhanced security and considerably higher margins than the traditional clients, such as
wholesales and groceries. However, there is scope for exploitation in contract farming and super
markets if rules are not framed properly. 3.5. Policies to Support to Small Holders
In the case of small holding agriculture, Government has to play an important role in improving
productivity and incomes of small farmers. The 11th
Five Year Plan says that “the agricultural
strategy must focus on 85% of farmers who are small and marginal, increasingly female, and
who find it difficult to access inputs, credit and extension or to market their output. While some
of these farmers may ultimately exit from farming, the overwhelming majority will continue to
remain in the sector and the objective of inclusiveness requires that their needs are attended to”
(p.8, Vol.3).
The National Commission for Enterprises in the Unorganized Sector (NCEUS) has
recommended a special programme for marginal and small farmers. The report of NCEUS
analyses the status and constraints faced by marginal and small farmers and focuses on the need
for a special programme which aimed at capacity building of these farmers, both the farm and
non-farm activities. As the marginal and small farmers suffer from market failures in agriculture
in terms of credit, input supplies and marketing of output, accessto new technologies etc. NCUS
recommended the four measures. These are: (a) Special programmes for maginal and small
farmers; (b) Emphasis on accelerated land and water management; (c) credit for marginal and
small farmers; (d) Farmers’ debt relief commission.
The Commission strongly advocates that a strategy for marginal and small farmers must focus on
group approaches in order to benefit from the economies of scale. A focused approach can be
used to incentivize the formation of farmer’s groups and apex organizations and government and
other can facilitate in finding solutions to problems of irrigation, inputs, procurement, markets
and risk. The Commission has considered four important models for group approach in the
country. These are: Co-operatives, Producer’s Companies, Farmers’ groups such as those in
Andhra Pradesh and SEWA (Self Employed Women’s Association) Farmers’ model.
Cooperatives and farmers’ groups on the lines of Self Help Groups (SHGs) seem to hold greater
promise for expansion. It may be noted that formation of marginal and small farmers’ groups on
the lines of SHGs has developed under agency structure such as ‘Velugu’ or Indira Kranti
Pradham (IKP) or CMSA mentioned above in Andhra Pradesh, ‘Kudumbashree’ in Kerala and
SEWA in Gujarat. Such initiatives are being developed in Tamil Nadu, West Bengal, Orissa and
Madhya Pradesh as well. As the Commission mentions that the ‘main lesson of these experiences
is the capacity building and group formation among the poor marginal and small farmers can not
be simply seen as an extension of routine departmental activity and as one of the many activities
that a programme seek to promote” (p.39). These groups under agency approach can be
promoted where farmers’ cooperatives are not operating.
The elements of special programmes advocated by NCEUS (2008) are the following
(a) Promotion of Marginal and Small Farmers’ Groups: In many states groups on lines of self
help groups (SHGs) are few. Special efforts have to be made to facilitate formation of
such groups. The special programme proposes setting up of Marginal and Small Farmers’
21
Development Society (MSFDS) for the promotion, capacity building and coordination of
development of marginal and small famer’s groups.
(b) Enabling greater access to institutional credit: Linking Marginal and small farmer’s
groups to banks is an essential step towards needed credit flow to these farmers.
(c) Training and capacity building: The special programme aims at motivating and enabling
marginal and small farmers to acquire skills by establishing Community Resource
Centres, by promoting marginal and small farmer activists at the village, cluster and
block levels.
(d) Support for strengthening and creation of non-farm activities: This aims to bridge the
farm activities and non-farm activities of small holding agriculture as income from small
farming is hardly sufficient to meet the basic needs of the farm households.
(e) Gender-focused activities: It is known that the share of women is increasing in
agriculture. This programme aims that the farmers’ groups should have adequate
representation of women farmers.
(f) Planning for development of Marginal and Small Farmers: The Marginal and Small
Farmer’s Development Society wou;d develop a medium term development strategy for
these farmers.
Rural non-farm sector
As mentioned above, the income from small and marginal farms is not enough to take care of
daily consumption and they have to borrow to survive. Therefore, small holdings farmers have to
get part of income from rural non-farm activities. Therefore, promotion of rural non-farm sector
is essential for generating incomes for rural population. Poverty can not be removed with 55% of
workers in agricultural sector. Ultimately, many of the small and marginal farmers have to be
shifted to rural non-farm sector and urban areas.
India currently produces about 50 million tonnes of fruits and 90 million tonnes of vegetables.
Only 2% of these fruits and vegetables are processed as against 23% in China, 78% in
Phillippines, 83% in Malaysia. Half of those engaged in agriculture are still illiterate and just 5%
have completed higher secondary education. Even in 2004-05, around 60% of rural male workers
and 85% of rural female workers are either illiterate or have been educated upto primary level. In
other words, education and skills are constraints. India can learn from China on rural
transformation. China experienced a structural transformation in the last three decades. The
state’s role has been decisive in building up the physical and social infrastructure (including
land reforms). India should learn from China on reforms in agricultural growth, rural non-farm
employment, public investment and human development. The impact of growth on poverty
reduction is quite significant (Rao, 2007). China started with agricultural reforms. Agricultural
growth was quite high. The economic and institutional reforms in the whole economy created
space for rural non-farm sector (TVEs and others). Diversification towards rural non-form sector
in China is one of the important factors responsible for rural poverty reduction (poverty is only
3%). This was partly due to agricultural productivity.
Rural Infrastructure Development
Regarding protection of agriculture in OECD countries, some suggest that developing countries
also should protect their agriculture. However, a better option is to provide more rural and
agricultural goods that are undersupplied by the market (Lipton, 2006). It also includes rural
22
infrastructure development like roads, irrigation, communications etc. Returns are also high from
investments in agricultural R&D, rural roads and other infrastructure and knowledge generation
(Hazell, 2011). The rural infrastructure will enable small and marginal farmers to compete with
other famers in India as well as in other countries. 4. LESSONS FROM INDIAN EXPERIENCE
Indian experience on small holding agriculture provides some lessons for developing countries.
(a) Green revolution and Small Farms: India’s green revolution which started in the mid-1960s
heralded a new era in Indian agriculture. The cultivation of high yielding varieties of seeds at
recommended dosages of fertilizers were encouraged in water assured areas. Initially, the
medium and large farmers in irrigated areas benefited from the new technology. However, small
holding agriculture also benefited from green revolution because of government support in
accessing services.
(b) Food grains management: The food grains management policy of India consists of three
instruments: (a) minimum support prices and procurement; (b) buffer stock and (c) public
distribution system. During 2006-08, there were significant increase in global food prices of rice
and wheat. In the case of India, food grain prices increased only around 10 per cent as compared
to global food price increase of 80 to 90 per cent. Food grain management is partly responsible
for insulation from the rise of global food grain prices. Small and marginal farmers also
benefited from these policies.
(c) Dairy cooperatives: Other countries can learn from the dairy cooperatives in India. The country’s
dairy sector is dominated by smallholders, and contracting with a large number of them involves
transaction costs for the processors. The processors do not have much choice but to take milk
from smallholder producers. The problem of the higher cost of contracting with small producers
is overcome by contracting with a single person in the village⎯often an agent⎯who acts as an
intermediary between the processor and producers (Birthal et al, 2008).
National Dairy Development Board covers 1,40, 227 village level societies and 14 million farm
families of which 4 million are women. It has a daily procurement of 22 million liters of milk8.
Amul Pattern of dairy cooperatives have contributed immensely to the fact that India has
progressed from a milk-deficit country to emerge as the largest milk-producing nation in the
world. In the process, they have generated millions of days of employment for the rural poor and
improved their socio-economic condition9.
(d) Water management in Gujarat: The government of Gujarat played an important role in the
Gujarat miracle for agriculture in 2000s. Gujarat has recorded high and steady growth at 9.6%
per year in agricultural state domestic product since 1999-2000. What are the factors responsible
for this high growth? According to Shah et al (2009), “the Gujarat government has aggressively
pursued an innovative agriculture development programme by liberalising markets, inviting
private capital, reinventing agricultural extension, improving roads and other infrastructure”. If it
is only canal irrigation, high growth should have been mainly in South and Central Gujarat.
8 See www.nddb.org
9 Speech of Chairman, Amul Dairy, 2007
23
However, the evidence shows that dry Saurashtra and Kachchh, and North Gujarat that have
been at the forefront. “These could not have performed so well but for the improved availability
of groundwater for irrigation. Arguably, mass-based water harvesting and farm power reforms
have helped energise Gujarat’s agriculture” (Shat et al, 2009). This is possible due to more than
100,000 check dams and major programme on Khet Talavadi (water ponds in the fields). 10
(e) Self Help groups and group approach: The women’s self help group (SHG) movement
particularly SHG-bank linkage programme has spread all over the country. As mentioned above,
there are two successful models in the country. One is Andhra Pradesh model and the other is
Kerala model. These programme’s interventions and processes have resulted in a sustained
process of empowerment of its women members. The real power of the SHG-bank linkage
model (SBL model) lies in the economies of scale created by Self Help Group (SHG)
Federations (comprising 150−200 SHGs each). This is evident, for example, in bulk purchase of
inputs (seeds, fertilisers etc.) and marketing of outputs (crops, vegetables, milk, NTFPs etc).
Government of India has now started National Rural Livelihoods Mission (NRLM) in 2011.
There is a clear understanding that the SBL programme can only be successful if it is tied up
with livelihood programmes such as improved agriculture, dairying, marketing etc.
(f) Institutional innovations: As discussed above, there are many institutional innovations in
input services, land water management and output marketing for marginal and small farmers.
Other countries can learn from these experiences.
(g) Rights based approach: India has been rights approach for several development programmes
and to maintain transparency. The country has Right to Information, 100 days of guaranteed
unskilled employment under National Rural Employment Guarantee Act, Right to Education. It
is also going for Right to Food by introducing National Food Security Act. These rights approach
puts pressures on governments to deliver the services to citizens. Basically we have to go
beyond supply side and focus on demand side. Social pressures are needed for public action.
Better monitoring systems have to be developed at Central, state, district and village levels to
realize rights. Justiciability is one aspect of rights. However, one (particularly the poor) can not
go to court every time right is violated. It is the responsibility of citizens and NGOs to organize
campaigns for better functioning of the programmes. Public accountability is crucial for the
success of rights approach.
(h) Learning from others: India also can learn from countries like China and Brazil on
agriculture and other policies on reducing poverty. India can learn from China on agricultural
transformation, education, infrastructure, macro policies, doing business, equitable asset
distribution and, rural non-farm sector development. Similarly, Latin American Countries like
Brazil can offer lessons to India on agriculture research (e.g.Agriculture research corporation
EMBRAPA) and Zero hunger programme.
10
See Gulati (2009)

24
References
Birthal, P.S., A.K. Jha, M.M. Tiongco and C. Narrod (2008), “Improving Farm to Market Linkages
through contract farming: A Case Study of Small Holder Dairying in India”, IFPRI discussion paper
00814. Washington, D.C.
Birthal, P.S., PK Joshi and AV Narayanan (2011), “Agricultural Diversification in India: Trends,
contribution to growth and small farmer participation”, ICRISAT, mimeo
Chand, R., PA Lakshmi Prasanna and Aruna Singh (2011), “Farm size and productivity: Understanding
the strengths of smallholders and improving their livelihoods”, Economic and Political Weekly, Vol.46,
Nos. 26 and 27.
Dev, Mahendra, S. Inclusive growth in India: Agriculture, poverty and human development. Oxford
University Press; 2008.
Sarthak, Gaurav and Srijit Mishra (2011), “Size Class and returns to Cultivation in India: A Cold Case
Reopened”, IGIDR working paper No.WP2011-27, Mumbai
Gulati, Ashok (2009), “Emerging Trends in Indian Agriculture: What can we learn from these?”
2nd
Prof. Dayanath Jha Memorial Lecture, National Centre for Agricultural Economics and Policy
Research, New Delhi
Hazell, Peter (2011), “Five Big Questions about Five Hundred Million Small Farms”, paper presented at
the Conference on new directions for small holder agriculture, 24-25 January 2011, Rome, IFAD.
Joshi P K and A. Gulati (2003), ‘From Plate to Plough: Agricultural Diversification in India’, Paper
presented at the Dragon and Elephant: A Comparative Study of Economic and Agricultural Reforms in
China and India’, New Delhi, India, March 25-26
Lipton, M. (2006), “Can Small Farmers Survive, Prosper, or be the Key Channel to cut Mass Poverty”,
Journal of Agricultural and Development Economics, Vol 3, No.1, 2006, pp58-85
Madhur, Gautam (2011), "India: Accelerating Agricultural Productivity Growth- Policy and Investment
Options", mimeo, World Bank, Washington, D.C.
NCEUS (2008), “A Special Programme for Marginal and Small Farmers”, A Report prepared by the
National Commission for Enterprises in the Unorganized Sector, NCEUS, New Delhi
Rao, CH, Hanumatha (2005), Agriculture, Food security, Poverty and Environment” Oxford University
Press, New Delhi
Rao, NC and Dev, S.Mahendra (2010), Biotechnology in Indian Agriculture: Potential, Performance and
Concerns, Academic Foundation, New Delhi
Reardon , T and B. Minten (2011) , “The Quiet Revolution in India’s Food Supply Chains”, IFPRI
Discussion Paper 01115, August 2011.
25
Reardon , T and B. Minten (2011 a), “Surprised by Supermarkets: Diffusion of Modern Food Retail in
India”, Journal of Agribusiness in Developing and Emerging Economies 1 (2).
Singh, R.B., P.Kumar and T.Headwood (2002), “Smallholder farmers in India: Food Security and
Agricultural Policy”, FAO, Regional office for Asia and the Pacific, Bangkok.
Shah, Tushaar, Ashok Gulati , Hemant P , ganga Shreedhar , R C Jain (2009), “Secret of Gujarat Agrarian
Miracle after 2000”, Economic and Political Weekly, Vol. 44, No.52
Sundaram, K. (2001), "Employment and Poverty in 1990s, Further Results from NSS 55th Round,
Employment-unemployment survey, 1999-00", Economic and Political Weekly, 11 August, pp.3039-49
Sundaram, K. (2007), "Employment and Poverty in India, 2000-2005", Economic and Political Weekly,
July 28, pp.3121-3131
Thapa, G. and R. Gaiha (2011), “Smallholder farming in Asia and the Pacific: Challenges and
Opportunities”, paper presented at the Conference on new directions for small holder agriculture, 24-25
January 2011, Rome, IFAD
Vaidynathan, A. (2010), “Agricultural Growth in India: Role of Technology, Incentives and Institutions”,
Oxford Collected Essays.

26
Tables Table 1 Share of Agriculture in GDP and Employment: All India
Year Share in GDP (%) Share in Employment (%)
Agriculture, forestry and fishing
Agriculture*
1950-1 57.7 50.2 --
1960-1 53.0 47.3 75.9
1980-1 39.7 35.8 --
2004-5 18.9 15.9 56.4
2008-9 15.7 13.3 --
Source: ‘National Accounts Statistics of India: 1950–51 to 2002–03’, Economic and Political Weekly Research Foundation, December 2004, Mumbai; Brochure on the New Series of National Accounts, Base Year 2005; K. Sundaram, (2001, 2007) Table 2 Growth Rates in Agriculture GDP: All India
Period Growth Rate (per cent per annum)
1950-1 to 1964-5 2.51
1867-8 to 1980-1 2.20
1980-1 to 1990-1 3.07
1992-3 to 1996-7 3.85
1992-3 to 2001-2 2.76
1997-8 to 2004-5 1.60
2004-5 to 2010-1 3.47
Source: National Accounts Statistics. Various years. Central Statistical Organisation, Government of India. Note: GDP is in 1980–1 constant prices from 1950–1 to 1980–1; in 1993–4 constant prices for the period 1980–1 to 2004–5; in 2004-5 constant prices for the period 2004-5 to 2010-1. Quick estimates for 2009-10 and advanced estimates for 2010-1.
Table 3. Changes in Percentage Distribution of Operate Holdings and Operated Area
Percentage Distribution of farm holdings Percentage Distribution of Operated Area
Land Class 1960-61 1981-82 1991-92 2002-03 1960-61 1981-82 1991-92 2002-03
Marginal 39.1 45.8 56.0 62.8 6.9 11.5 15.6 22.6
Small 22.6 22.4 19.3 17.8 12.3 16.6 18.7 20.9
Small&Marginal 61.7 68.2 75.3 80.6 19.2 28.1 34.3 43.5
Semi-medium 19.8 17.7 14.2 12.0 20.7 23.6 24.1 22.5
Medium 14.0 11.1 8.6 6.1 31.2 30.1 26.4 22.2
Large 4.5 3.1 1.9 1.3 29.0 18.2 15.2 11.8
Total 100.0 100.0 100.0 100.0 100.0 100.0 100.0 100.0
Note: Marginal 0.01 to 1.00 ha.; Small 1.01 to 2.00 ha; Semi-Medium 2.00 to 4.00 ha; Medium 4.01 to 10.00 ha;
Large above 10 ha.
Source: NCEUS (2008) National Sample Survey Land Holdings 8th
, 17th
, 26th
, 37th
, 48th
, 55th Rounds, Central
Statistical Organization, Government of India
Table 4. Average Size of Land Holdings
State/UT Marginal Small Semi- Medium Large All
Medium Holdings
1 2 3 4 5 6 7
Andhra Pradesh 0.44 1.42 2.67 5.70 16.34 1.25
Arunachal Pradesh 0.50 1.32 2.66 5.77 16.13 3.69
Assam 0.39 1.30 2.73 5.22 53.02 1.15
Bihar 0.30 1.21 2.62 5.24 15.50 0.58
Chhattisgarh 0.44 1.42 2.70 5.76 16.49 1.60
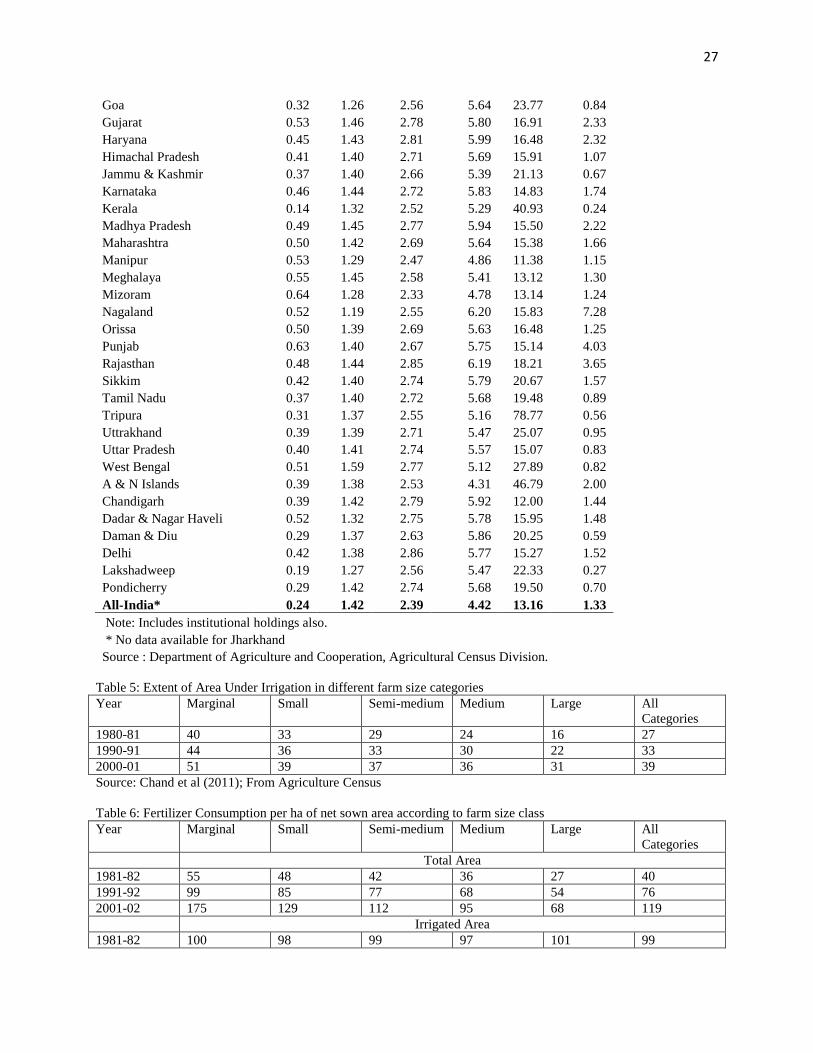
27
Goa 0.32 1.26 2.56 5.64 23.77 0.84
Gujarat 0.53 1.46 2.78 5.80 16.91 2.33
Haryana 0.45 1.43 2.81 5.99 16.48 2.32
Himachal Pradesh 0.41 1.40 2.71 5.69 15.91 1.07
Jammu & Kashmir 0.37 1.40 2.66 5.39 21.13 0.67
Karnataka 0.46 1.44 2.72 5.83 14.83 1.74
Kerala 0.14 1.32 2.52 5.29 40.93 0.24
Madhya Pradesh 0.49 1.45 2.77 5.94 15.50 2.22
Maharashtra 0.50 1.42 2.69 5.64 15.38 1.66
Manipur 0.53 1.29 2.47 4.86 11.38 1.15
Meghalaya 0.55 1.45 2.58 5.41 13.12 1.30
Mizoram 0.64 1.28 2.33 4.78 13.14 1.24
Nagaland 0.52 1.19 2.55 6.20 15.83 7.28
Orissa 0.50 1.39 2.69 5.63 16.48 1.25
Punjab 0.63 1.40 2.67 5.75 15.14 4.03
Rajasthan 0.48 1.44 2.85 6.19 18.21 3.65
Sikkim 0.42 1.40 2.74 5.79 20.67 1.57
Tamil Nadu 0.37 1.40 2.72 5.68 19.48 0.89
Tripura 0.31 1.37 2.55 5.16 78.77 0.56
Uttrakhand 0.39 1.39 2.71 5.47 25.07 0.95
Uttar Pradesh 0.40 1.41 2.74 5.57 15.07 0.83
West Bengal 0.51 1.59 2.77 5.12 27.89 0.82
A & N Islands 0.39 1.38 2.53 4.31 46.79 2.00
Chandigarh 0.39 1.42 2.79 5.92 12.00 1.44
Dadar & Nagar Haveli 0.52 1.32 2.75 5.78 15.95 1.48
Daman & Diu 0.29 1.37 2.63 5.86 20.25 0.59
Delhi 0.42 1.38 2.86 5.77 15.27 1.52
Lakshadweep 0.19 1.27 2.56 5.47 22.33 0.27
Pondicherry 0.29 1.42 2.74 5.68 19.50 0.70
All-India* 0.24 1.42 2.39 4.42 13.16 1.33
Note: Includes institutional holdings also.
* No data available for Jharkhand
Source : Department of Agriculture and Cooperation, Agricultural Census Division.
Table 5: Extent of Area Under Irrigation in different farm size categories
Year Marginal Small Semi-medium Medium Large All
Categories
1980-81 40 33 29 24 16 27
1990-91 44 36 33 30 22 33
2000-01 51 39 37 36 31 39
Source: Chand et al (2011); From Agriculture Census
Table 6: Fertilizer Consumption per ha of net sown area according to farm size class
Year Marginal Small Semi-medium Medium Large All
Categories
Total Area
1981-82 55 48 42 36 27 40
1991-92 99 85 77 68 54 76
2001-02 175 129 112 95 68 119
Irrigated Area
1981-82 100 98 99 97 101 99
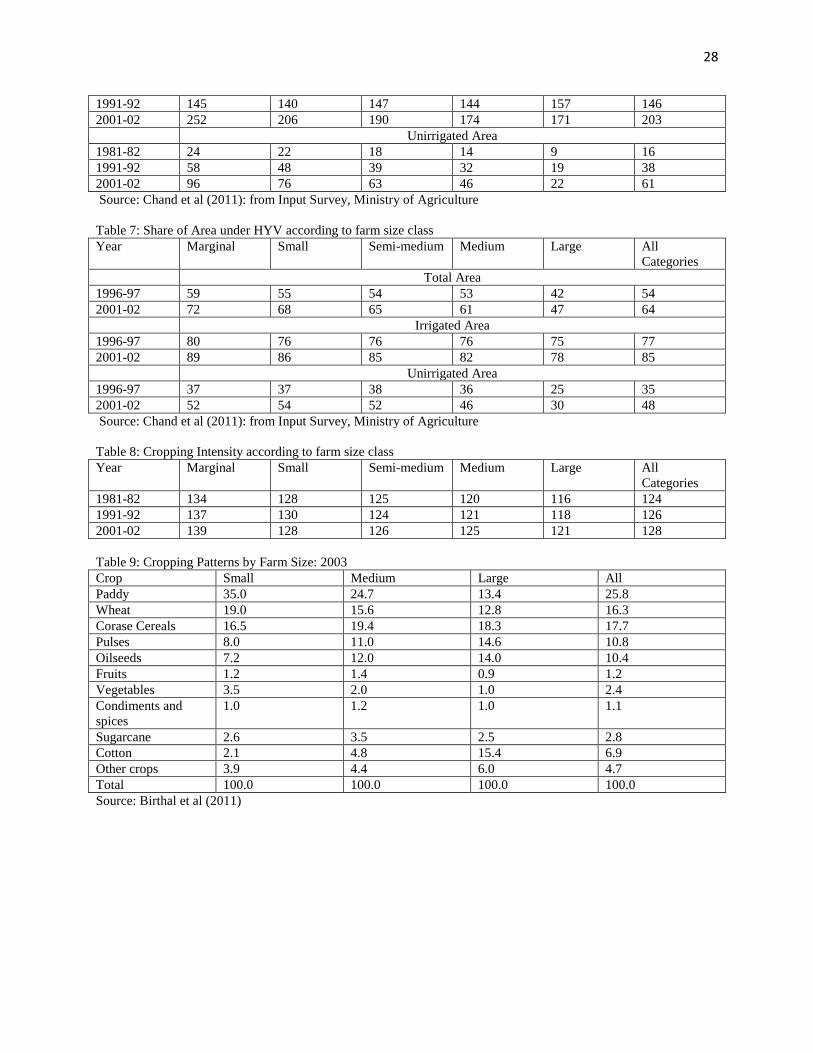
28
1991-92 145 140 147 144 157 146
2001-02 252 206 190 174 171 203
Unirrigated Area
1981-82 24 22 18 14 9 16
1991-92 58 48 39 32 19 38
2001-02 96 76 63 46 22 61
Source: Chand et al (2011): from Input Survey, Ministry of Agriculture
Table 7: Share of Area under HYV according to farm size class
Year Marginal Small Semi-medium Medium Large All
Categories
Total Area
1996-97 59 55 54 53 42 54
2001-02 72 68 65 61 47 64
Irrigated Area
1996-97 80 76 76 76 75 77
2001-02 89 86 85 82 78 85
Unirrigated Area
1996-97 37 37 38 36 25 35
2001-02 52 54 52 46 30 48
Source: Chand et al (2011): from Input Survey, Ministry of Agriculture
Table 8: Cropping Intensity according to farm size class
Year Marginal Small Semi-medium Medium Large All
Categories
1981-82 134 128 125 120 116 124
1991-92 137 130 124 121 118 126
2001-02 139 128 126 125 121 128
Table 9: Cropping Patterns by Farm Size: 2003
Crop Small Medium Large All
Paddy 35.0 24.7 13.4 25.8
Wheat 19.0 15.6 12.8 16.3
Corase Cereals 16.5 19.4 18.3 17.7
Pulses 8.0 11.0 14.6 10.8
Oilseeds 7.2 12.0 14.0 10.4
Fruits 1.2 1.4 0.9 1.2
Vegetables 3.5 2.0 1.0 2.4
Condiments and
spices
1.0 1.2 1.0 1.1
Sugarcane 2.6 3.5 2.5 2.8
Cotton 2.1 4.8 15.4 6.9
Other crops 3.9 4.4 6.0 4.7
Total 100.0 100.0 100.0 100.0
Source: Birthal et al (2011)
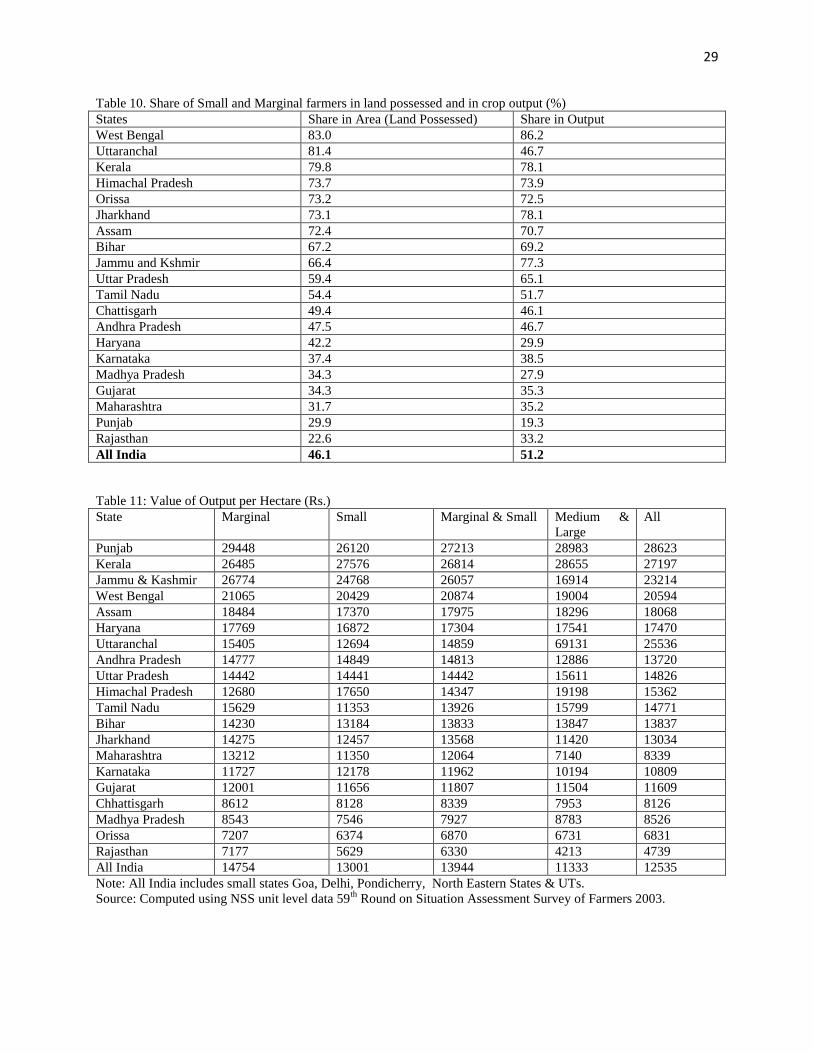
29
Table 10. Share of Small and Marginal farmers in land possessed and in crop output (%)
States Share in Area (Land Possessed) Share in Output
West Bengal 83.0 86.2
Uttaranchal 81.4 46.7
Kerala 79.8 78.1
Himachal Pradesh 73.7 73.9
Orissa 73.2 72.5
Jharkhand 73.1 78.1
Assam 72.4 70.7
Bihar 67.2 69.2
Jammu and Kshmir 66.4 77.3
Uttar Pradesh 59.4 65.1
Tamil Nadu 54.4 51.7
Chattisgarh 49.4 46.1
Andhra Pradesh 47.5 46.7
Haryana 42.2 29.9
Karnataka 37.4 38.5
Madhya Pradesh 34.3 27.9
Gujarat 34.3 35.3
Maharashtra 31.7 35.2
Punjab 29.9 19.3
Rajasthan 22.6 33.2
All India 46.1 51.2
Table 11: Value of Output per Hectare (Rs.)
State Marginal Small Marginal & Small Medium &
Large
All
Punjab 29448 26120 27213 28983 28623
Kerala 26485 27576 26814 28655 27197
Jammu & Kashmir 26774 24768 26057 16914 23214
West Bengal 21065 20429 20874 19004 20594
Assam 18484 17370 17975 18296 18068
Haryana 17769 16872 17304 17541 17470
Uttaranchal 15405 12694 14859 69131 25536
Andhra Pradesh 14777 14849 14813 12886 13720
Uttar Pradesh 14442 14441 14442 15611 14826
Himachal Pradesh 12680 17650 14347 19198 15362
Tamil Nadu 15629 11353 13926 15799 14771
Bihar 14230 13184 13833 13847 13837
Jharkhand 14275 12457 13568 11420 13034
Maharashtra 13212 11350 12064 7140 8339
Karnataka 11727 12178 11962 10194 10809
Gujarat 12001 11656 11807 11504 11609
Chhattisgarh 8612 8128 8339 7953 8126
Madhya Pradesh 8543 7546 7927 8783 8526
Orissa 7207 6374 6870 6731 6831
Rajasthan 7177 5629 6330 4213 4739
All India 14754 13001 13944 11333 12535
Note: All India includes small states Goa, Delhi, Pondicherry, North Eastern States & UTs.
Source: Computed using NSS unit level data 59th
Round on Situation Assessment Survey of Farmers 2003.
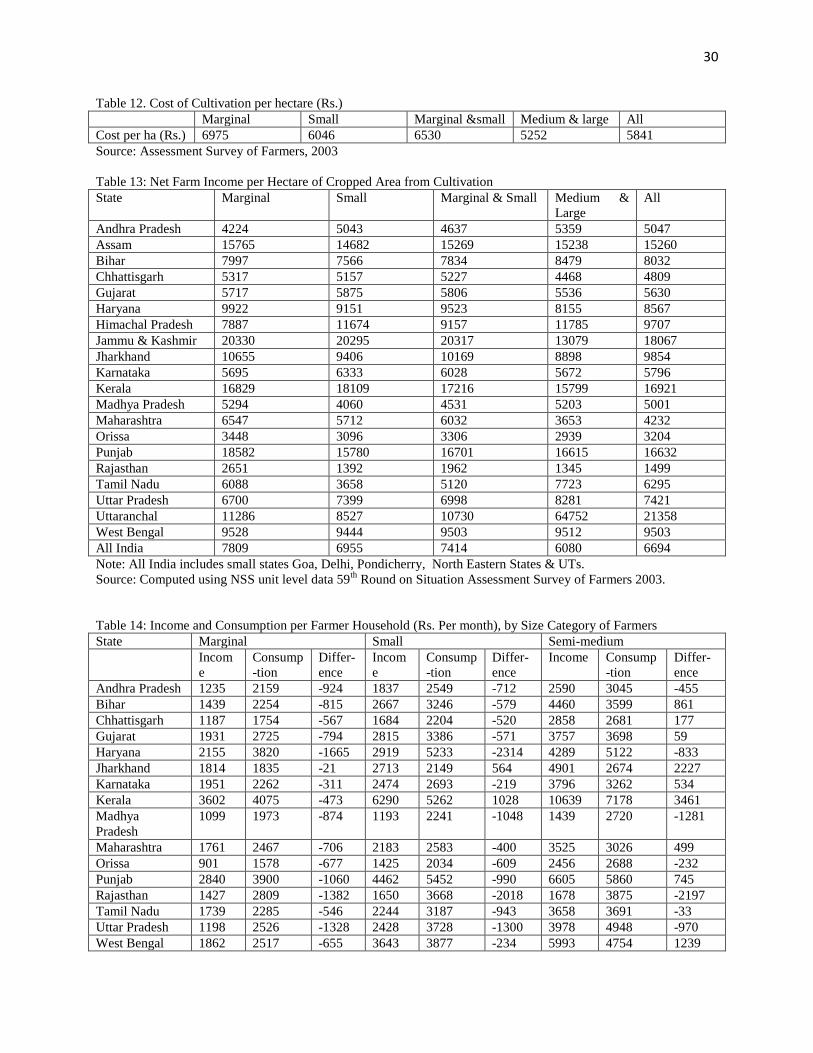
30
Table 12. Cost of Cultivation per hectare (Rs.)
Marginal Small Marginal &small Medium & large All
Cost per ha (Rs.) 6975 6046 6530 5252 5841
Source: Assessment Survey of Farmers, 2003
Table 13: Net Farm Income per Hectare of Cropped Area from Cultivation
State Marginal Small Marginal & Small Medium &
Large
All
Andhra Pradesh 4224 5043 4637 5359 5047
Assam 15765 14682 15269 15238 15260
Bihar 7997 7566 7834 8479 8032
Chhattisgarh 5317 5157 5227 4468 4809
Gujarat 5717 5875 5806 5536 5630
Haryana 9922 9151 9523 8155 8567
Himachal Pradesh 7887 11674 9157 11785 9707
Jammu & Kashmir 20330 20295 20317 13079 18067
Jharkhand 10655 9406 10169 8898 9854
Karnataka 5695 6333 6028 5672 5796
Kerala 16829 18109 17216 15799 16921
Madhya Pradesh 5294 4060 4531 5203 5001
Maharashtra 6547 5712 6032 3653 4232
Orissa 3448 3096 3306 2939 3204
Punjab 18582 15780 16701 16615 16632
Rajasthan 2651 1392 1962 1345 1499
Tamil Nadu 6088 3658 5120 7723 6295
Uttar Pradesh 6700 7399 6998 8281 7421
Uttaranchal 11286 8527 10730 64752 21358
West Bengal 9528 9444 9503 9512 9503
All India 7809 6955 7414 6080 6694
Note: All India includes small states Goa, Delhi, Pondicherry, North Eastern States & UTs.
Source: Computed using NSS unit level data 59th
Round on Situation Assessment Survey of Farmers 2003.
Table 14: Income and Consumption per Farmer Household (Rs. Per month), by Size Category of Farmers
State Marginal Small Semi-medium
Incom
e
Consump
-tion
Differ-
ence
Incom
e
Consump
-tion
Differ-
ence
Income Consump
-tion
Differ-
ence
Andhra Pradesh 1235 2159 -924 1837 2549 -712 2590 3045 -455
Bihar 1439 2254 -815 2667 3246 -579 4460 3599 861
Chhattisgarh 1187 1754 -567 1684 2204 -520 2858 2681 177
Gujarat 1931 2725 -794 2815 3386 -571 3757 3698 59
Haryana 2155 3820 -1665 2919 5233 -2314 4289 5122 -833
Jharkhand 1814 1835 -21 2713 2149 564 4901 2674 2227
Karnataka 1951 2262 -311 2474 2693 -219 3796 3262 534
Kerala 3602 4075 -473 6290 5262 1028 10639 7178 3461
Madhya
Pradesh
1099 1973 -874 1193 2241 -1048 1439 2720 -1281
Maharashtra 1761 2467 -706 2183 2583 -400 3525 3026 499
Orissa 901 1578 -677 1425 2034 -609 2456 2688 -232
Punjab 2840 3900 -1060 4462 5452 -990 6605 5860 745
Rajasthan 1427 2809 -1382 1650 3668 -2018 1678 3875 -2197
Tamil Nadu 1739 2285 -546 2244 3187 -943 3658 3691 -33
Uttar Pradesh 1198 2526 -1328 2428 3728 -1300 3978 4948 -970
West Bengal 1862 2517 -655 3643 3877 -234 5993 4754 1239

31
All India 1659 2482 -823 2493 3148 -655 3589 3685 -96
State Medium Large All
Incom
e
Consump
-tion
Differ-
ence
Incom
e
Consump
-tion
Differ-
ence
Income Consump
-tion
Differ-
ence
Andhra Pradesh 5479 4133 1346 9418 5724 3694 1634 2386 -752
Bihar 9526 5678 3848 27766 8174 19592 1810 2459 -649
Chhattisgarh 3860 3716 144 10500 5161 5339 1618 2045 -427
Gujarat 6355 4687 1668 5084 4391 693 2684 3127 -443
Haryana 5353 6463 -1110 16110 8234 7876 2882 4414 -1532
Jharkhand 7990 2773 5217 23433 3251 20182 2069 1897 172
Karnataka 5178 3563 1615 16837 8844 7993 2616 2608 8
Kerala 15045 8820 6225 *** *** *** 4004 4250 -246
Madhya
Pradesh
3066 3667 -601 8000 6108 1892 1430 2339 -909
Maharashtra 6244 3877 2367 15653 7241 8412 2463 2689 -226
Orissa 3724 2771 953 11451 5314 6137 1062 1697 -635
Punjab 13770 7836 5934 34340 13078 21262 4960 4840 120
Rajasthan 1682 4368 -2686 706 4939 -4233 1498 3288 -1790
Tamil Nadu 9061 3793 5268 26984 9030 17954 2072 2506 -434
Uttar Pradesh 7974 6732 1242 7850 6776 1074 1633 2899 -1266
West Bengal 3864 5234 -1370 *** *** *** 2079 2668 -589
All India 5681 4626 1055 9667 6418 3249 2115 2770 -655
Note: All India includes small states Goa, Delhi, Pondicherry, North Eastern States & UTs.
Source: Computed using NSS unit level data 59th
Round on Situation Assessment Survey of Farmers 2003.
Table 15: Literacy and Mean Years of Education of Unorganized Agricultural Self-employed Workers, 2004-2005
Land Size/Class Literacy Rate Mean Years of Education
Male Female Total Male Female Total
Landless 45.6 25.5 34.0 2.2 1.5 1.8
0.01 – 0.40 ha 59.2 31.1 43.7 3.7 1.7 2.6
0.41 – 1.00 ha 64.5 31.7 51.4 4.1 1.7 3.2
Marginal 62.5 31.2 48.1 3.9 1.7 2.9
Small 68.7 34.8 55.9 4.7 1.9 3.6
2.00 – 4.00 ha 70.2 37.1 57.6 4.9 2.1 3.8
> 4.00 ha 77.4 42.0 63.3 5.8 2.5 4.5
Medium & Large 72.9 39.0 59.7 5.3 2.2 4.1
All 67.4 34.1 53.4 4.5 1.9 3.4
Source: NCEUS (2008) Computed using NSS unit level data 61st Round in Employment and Unemployment
Situation in India.
Table 16: Prevalence Rate of Indebtedness by Farm Size, All India (Percentage) 2003.
Land Size (ha) Formal Informal Both Total
<= 0.40 12.7 30.3 3.5 46.5
0.41 – 1.00 18.8 21.7 4.6 45.0
1.01 – 2.00 25.9 17.9 7.0 50.8
> 2.00 34.7 14.4 8.6 57.8
Total 20.4 23.0 5.3 48.6
Source: Computed using NSS unit level data 59th
Round on Situation Assessment Survey of Farmers 2003.

32
Table 17: Percentage Distribution of Outstanding Loans by Farm Size & Sources (2003)
Source of Loan Size Class of Land
Possessed (hectares)
<=0.40 0.41 – 1.00 1.01 – 2.00 Above 2.00
Government 3.9 3.8 1.7 1.4
Co-operative society 14.1 17.0 2.5 22.8
Bank 24.4 32.0 35.4 42.6
Total: Institutional 42.4 52.8 57.6 66.8
Agricultural/
Professional money
lender
32.4 30.8 25.9 20.0
Trader 4.9 4.6 4.2 6.0
Relatives & friends 15.2 9.1 8.8 5.2
Doctor, lawyer &
other professionals
1.4 0.7 0.8 0.8
Others 3.6 2.0 2.6 1.2
Total: Non-
Institutional
57.6 47.2 42.4 33.2
Source: Computed using NSS unit level data 59th
Round on Situation Assessment Survey of Farmers 2003.
Table 18: Percentage Distribution of outstanding loans by formal and informal source across size classes of land in
selected states: 2003
State
Size Class of Land owned
<0.01
0.0 I -
0.40
0.40 -
1.00
1.01 -
2.00
2.0 I -
4.00
4.01 -
10.00 10.00+
All
sizes
Foraml Sources
AP 16.9 19.3 25.1 26.6 41.5 48.6 49.5 31.4
Bihar 36.5 20.8 47.0 66.1 63.4 19.6 70.1 39.2
Maharashtra 58.3 83.2 80.2 78.8 83.8 88.7 91.1 83.8
Orissa 64.7 62.4 77.1 72.1 88.4 96.9 13.2 74.8
Punjab 24.8 29.2 65.6 49.1 61.2 47.5 30.1 47.9
Tamil Nadu 19.1 37.4 46.0 61.5 65.2 74.3 82.9 53.4
All India 22.6 43.3 52.8 57.6 65.1 68.8 67.6 57.7
Informal Sources
AP 83.2 80.9 75.0 73.4 58.4 51.4 50.5 68.5
Bihar 63.5 79.2 53.0 33.8 36.6 80.4 29.9 58.5
Maharashtra 41.6 16.8 19.8 21.1 16.2 11.3 8.9 16.2
Orissa 35.4 37.5 22.8 27.9 11.7 3.2 86.8 25.1
Punjab 75.2 71.0 34.5 50.9 38.8 52.4 70.0 52.1
Tamil Nadu 80.9 62.5 53.9 38.6 34.7 25.7 17.2 46.5
All India 77.4 56.7 47.2 42.4 34.0 31.2 32.8 42.3
Source: Calculated from NSSO (2005)

33
Fig 1. GDP growth in Agriculture in India
-15
-10
-5
0
5
10
15
20Plan Comm
WB-WDI Annual Growth Rate
-1.00
0.00
1.00
2.00
3.00
4.00
5.00
6.00
7.00
19
65
19
67
19
69
19
71
19
73
19
75
19
77
19
79
19
81
19
83
19
85
19
87
19
89
19
91
19
93
19
95
19
97
19
99
20
01
20
03
20
05
20
07
20
09
20
11
5-Year Average Growth Rate
Source: Madhur (2011)
Fig 2
1475413001 12903
106558783
12535
0
2000
4000
6000
8000
10000
12000
14000
16000
Marginal Small Semi-Med Medium Large AllVal
ue
of
Ou
tpu
t P
er
He
ctar
e
Fig. 3: Value of Output per Hectare (Rs.) 2002-2003

34
Fig 4.1
Fig 4.2.
Fig 4.3
Fig 4.4
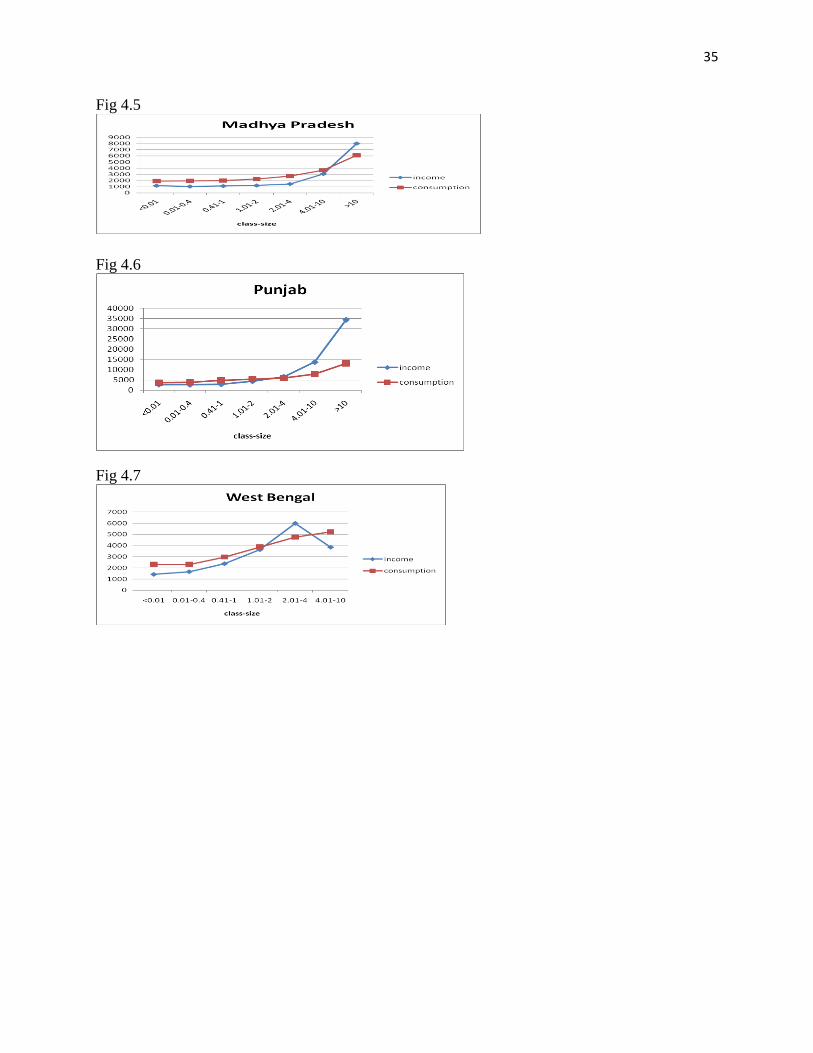
35
Fig 4.5
Fig 4.6
Fig 4.7