Embed Size (px)
Citation preview

1
Small and Medium Business Agenda
Final

2
Table of Contents 0.1 Overview ............................................................................................................................................ 4
1. Introduction ........................................................................................................................................ 4
1.1 Definition of SMEs ...................................................................................................................... 5
1.2 Characteristics of SMEs in Jordan ........................................................................................ 6
1.3 SMEs and Employment ............................................................................................................. 7
1.4 Jordan's Economy ...................................................................................................................... 9
1.5 Moving Forward ......................................................................................................................... 12
2. Tax Incentives .................................................................................................................................. 14
2.1 Background and Issues .......................................................................................................... 14
2.2 Benchmarking and Best Practices ...................................................................................... 22
2.2.1 VAT Collection Threshold ............................................................................................... 26
2.2.2 Less frequent filing requirements for small firms ................................................ 27
2.2.3 Cash accounting for small firms ................................................................................. 28
2.2.4 Income Tax Simplification Provisions ....................................................................... 28
2.2.5 Simplified Financial Accounting for Small Firms ................................................... 29
2.2.6 Other Simplification Measures ..................................................................................... 30
2.3 Gap Analysis ............................................................................................................................... 31
2.4 Recommendations .................................................................................................................... 32
3. Innovation .......................................................................................................................................... 34
3.1 Background and Issues .......................................................................................................... 34
3.2 Benchmarking ............................................................................................................................ 37
3.2.1 Global Innovation Best Practices ................................................................................ 39
3.2.2 United States of America ............................................................................................... 41
3.2.3 Germany .............................................................................................................................. 42
3.2.4 Sweden ................................................................................................................................. 42
3.2.5 UK ........................................................................................................................................... 43
3.2.6 Singapore ............................................................................................................................ 44
3.3 Gap Analysis ............................................................................................................................... 45
3.4 Recommendations .................................................................................................................... 49
4. Access to Capital ............................................................................................................................. 52

3
4.1 Background and Issues .......................................................................................................... 52
4.1.1 Debt Finance ...................................................................................................................... 52
4.1.2 Commercial Banks ........................................................................................................... 54
4.1.3 Seed Money and Venture Capital (Equity Capital) .............................................. 56
4.1.4 Incubators ........................................................................................................................... 60
4.1.5 Loan Guarantees ............................................................................................................... 61
4.1.6 Other Financial Support Instruments ....................................................................... 62
4.1.7 SMEs and Interest Rate Structure ............................................................................. 62
4.2 Benchmarking ............................................................................................................................ 64
4.2.1 International Reports ...................................................................................................... 65
4.2.2 Experience of Other Nations ........................................................................................ 69
4.3 Gap Analysis ............................................................................................................................... 71
4.4 Recommendations .................................................................................................................... 74
5. Improving Exports .......................................................................................................................... 78
5.1 Background ................................................................................................................................. 78
5.2 Benchmarking ............................................................................................................................ 81
5.3 Gap Analysis ............................................................................................................................... 87
5.4 Recommendations .................................................................................................................... 88
6. Education ......................................................................................................................................... 90
6.1 Background ................................................................................................................................. 90
6.2 Benchmarking ............................................................................................................................ 93
6.3 Gap Analysis ........................................................................................................................... 93
6.4 Recommendations .................................................................................................................... 94
7. Government Procurement ........................................................................................................... 95
7.1 Background ................................................................................................................................. 95
7.2 Benchmarking ............................................................................................................................ 98
7.3 Gap Analysis ............................................................................................................................. 100
7.4 Recommendations .................................................................................................................. 102

4
0.1 Overview Sawtouna is Jordan's first Civil Society led, proactive, entrepreneur, start-up, and small/medium enterprise (SME) advocacy effort. The project strives to make grassroots entrepreneurship commonplace in the Jordanian business environment. Sawtouna was formed, and is overseen by, the Public Policy Advocacy Committee (PPAC) at the Young Entrepreneurs' Association (YEA), which has been advocating public policy reform through proactive position papers to legislative bills since the YEA's inception in 1999. The third round of Sawtouna focuses on developing a Small and Medium Business Agenda (SMBA) for Jordan.
The components of the small business agenda include several key pillars:
I. Small and Medium Business Tax Breaks: Within this component, potential legislation improvements and a tax credit system will be suggested.
II. Improved Access to Capital: Examining bank lending practices, support to smaller communities, and increased support for underserved communities, as well as support for rural business.
III. Improved government procurement options that will help grow SMEs and expand their employment potential.
IV. Increased SME Exports: Advocating trade promotion and export regulations, helping micro-enterprises export, improving export access to finance, amongst other factors
V. Development and Education Opportunities for Entrepreneurs: Developing programs, focusing on disadvantaged groups, looking at entrepreneurial infrastructure
VI. Encouraging innovation: Focus on start-up encouragement, tools for high-growth potential SMEs, agriculture research, investment in ICT infrastructure, etc.
VII. Small and Medium Business Protection: Improving Regulations for Small Businesses
1. Introduction It is generally viewed that entrepreneurship is one of the most significant drivers of economic growth.i However, in developing countries, where statistics are usually unreliable or simply unavailable, determining the size of the SME sector is more challenging, particularly since the size of the informal economy is usually greater in developing countries than in developed ones. Nonetheless, it is recognized that the contribution of SMEs in developing countries ranges between 50% and 70% of Gross Domestic Product (GDP).ii A cross-country analysis of SMEsiii revealed that there is a strong connection between the relative strength of the SME sector and economic development. In a review of 76 countries, it was shown that the role of SMEs in GDP and national income creation is quite significant – with just over half of GDP being generated by SMEs in developed nations, 39% in medium-income nations and only 16% in developing nations. Even when accounting for numerous growth factors (such as the surrounding business environment, entry and exit barriers, ensuring property rights, and firm legislative environment), there was a significant connection between economic development and the extent of the SME sector.
Broad empirical evidence highlighting the importance of SMEs concludes:iv
SMEs are where many entrepreneurs and future large companies start.

5
SMEs tend to use medium-sophistication level technology at the level of factor endowment ratios in most developing countries.
1.1 Definition of SMEs
While there is no universally accepted definition of Small and Medium Enterprises, there are generally accepted traits; the number of employees in an organization cannot exceed a certain amount (in some countries the limit is 100 employees, in others, 250 employees), as well as the fact that they should have limited levels of revenues and assets. The Multilateral Investment Guarantee Agency (MIGA) and the International Finance Corporation (IFC) both classify SMEs as organizations with fewer than 300 employees, owning less than USD 15 million in assets, and earning less than USD 15 million annually.v Note that the definition allows for factors such as the number of employees, capital and revenues determine whether a firm falls within the SME category. The wisdom of the definition is to allow for disparities among industries. For example, a garment manufacturing firm may employ a large number of employees yet its revenues may not exceed an R&D firm that employs few employees.vi
Standard definitions of SMEs vary across the MENA countries in terms of the size of workforce. A sample of definitions from MENA countries is given in Table 1.
Table 1 Standard Definitions of SMEs across MENA
Micro Small Medium Egypt 1 to 4 employees 5 to 14 employees 15 to 49 employees Lebanon 1 to 9 employees 10 to 49 employees 50 to 99 employees Oman 1 to 5 employees 6 to 20 employees 21 to 100 employees Jordan 1 to 4 employees 5 to 19 employees 20 to 99 employees* UAE 1 to 9 employees 10 to 49 employees 50 to 499 employees Tunisia 1 to 9 employees 11 to 49 employees 50 to 99 employees
Source: SMEs Database, World Bank, January 2007, taken from Dababneh, R, and Tukan, F, “Booklet of Standardized SME Definitions,” USAID, August 2007 * Department of Statistics In the Jordan Third National Human Development Report 2011, SMEs (including micro enterprises) are defined as all enterprises which have less than 100 employees. In September 2005, the industrial SMEs definition was endorsed by the Prime Ministry as a national standardized definition to be used among all relevant governmental departments. The definition is as follows:
• Small enterprises employ between 10 and 49 employees and have a registered capital of more than JD30,000
• Medium enterprises employ between 50 and 249 employees and have a registered capital of more than JD30,000vii
The Central Bank of Jordan's definition, released 13th January 2011 is that SMEs should not be:

6
1. A public shareholding company, or an insurance company, or a financial intermediary company
Small companies:
1. That its assets are less than JD 1 million or that its annual sales are less than JD 1 million
2. That it has between 5-20 employees
Medium companies:
1. That its assets are between JD 1 - 3 million or that its annual sales are between JD 1 - 3 million
2. That it has between 21-100 employees
A major recommendation of this agenda will be to comprehensively define SMEs by sector, based on the creation of a unified SME Task Force.
1.2 Characteristics of SMEs in Jordan The private economy in Jordan is almost entirely comprised of SMEs, which represent nearly 99.6% of all firms outside the agricultural sector. This number is based on the latest Department of Statistics Enterprise Survey and measures all firms with 99 employees or less as a percentage of the total number of firms. Most Jordanian SMEs work within the formal sector and are registered, as specified by law. However, a sizeable percentage of self-employed firms are in the unregistered (informal) sector (that is, firms that deliver lawfully permitted services and products without registering with the proper authorities). viii
In terms of employment, formal SMEs play a significant role in employment, as they employ approximately 71.4% of the private sector’s workforce and almost 49.4% of all the personnel in the country’s private and public sectors. ix Figure 1 shows the proportional contribution of formal SMEs to the number of registered establishments and employment opportunities in Jordan.
Figure 1 Contributions of SMEs to Number of Establishments and Employees
Source: Establishments Census, Department of Statistics, 2006
0 100 200 300 400 500 600 700
Employees
Establishments
Thousands
From 1-4
From 5-19
20-49
50-99
100 and More

7
Figure 3 shows the presence of SMEs across the four sectors. x Figure 2 Dominance of SMEs with Number of Employees and Establishments by Sector
Source: Establishments Census, Department of Statistics, 2006 The following are the characteristics that SME owners are exhibited:xi
• Ownership: Majority of SMEs are sole proprietorships. Of the companies surveyed for the Jordan Human Development Report (2011), 80% are classified as sole proprietorships. Only 7% of entrepreneurs own limited liability companies.
• Management Style: Most SMEs are run by their owners. Presently, 76% of SMEs have at least two employees.
• Educational Attainment: 79% of SME owners held secondary school degrees, or higher and 42% held Bachelor’s degrees or beyond.
• Age: With 77% of employers between 21-50 years of age, most SME owners can be classified middle-aged and below. The business owners fell into the following age groups: 21-30 years of age (16%), 31-35 (13%), 36-40 (18%), 41-45 (15%) and 46-50 (15%).
1.3 SMEs and Employment New small businesses were a large contributor to job creation during 2000-2006, employing 1-4 employees per firm and creating almost 20,000 new jobs. Most new jobs came from large firms employing 100 or more employees. These firms were the largest contributor of all the segments, introducing almost 71,500 new jobs during 2000-2006, as shown in Figure 4.
0 50 100 150 200 250
No.of Establishments
No. of Employees
No.of Establishments
No. of Employees
No.of Establishments
No. of Employees
No.of Establishments
No. of Employees
No.of Establishments
No. of Employees
From
1‐4
From
5‐19
From
20‐49
From
50‐99
100 and More
Thousands
Minning and Manufacturing
Construction
Wholesale and Retail Trade
Services

8
Figure 3 New Jobs Created, by Size of Firm, 2000-2006
Source: Establishments Census, Department of Statistics, 2006 Several varying trends within the employment category are observed: xii
1. Growing significance of large companies in terms of overall employment, with the
average number of employees per enterprise increasing from 2.66 employees per firm to 4.05 employees per firm between 2000 and 2007.
2. Rising significance of large firms as job creators--their share in the workforce in 2000 increased from 21.6% up to 28.6% in 2007.
3. Increasing importance of the small enterprise segment in job creation, with the average number of employees per enterprise increasing from 1.41 employees per firm in 2000, up to 2.66 employees per firm in 2007. Their share in total employment decreased from 72% to 65% during the period.
4. The falling importance of companies that employ 50-99 employees as the average employment size per enterprise went down from 70.4 to 69.1 employees per enterprise. However, the share of these enterprises in total employment remained stagnant at 6.4% during the 2000 to 2007time period.
The table below shows the annual income of the various enterprise sizes, showing that as a percentage, 81% of large enterprises (over 100 employees) earn over JD 100,000 annually compared to 1% of enterprises with less than 5 employees.
Table 2 Income Bracket per Size of Enterprise
Income Bracket
Number of Enterprises From 1-4
From 5-19
From 20-49
From 50-99
100 and more
<5,000 76,456 1,523 93 32 18 5,000-10,000 32,400 1,803 81 14 7 10,001-20,000 15,010 1,785 121 13 12 20,001-40,000 6,494 1,198 110 26 11 40,001-60,000 2,853 849 165 24 12 60,001-100,000 1,587 883 221 45 48
0
10
20
30
40
50
60
70
80
Small Medium Large
New
Job
s C
reat
ed,
20
00
to
20
07
, Th
ou
san
ds
Company Size

9
>100,000 785 958 607 331 448 Total 135,585 8,999 1,398 485 556 >100,000 as % of total enterprises 0.6% 10.6% 43.4% 68.2% 80.6%
Source: Establishments Survey, DOS, 2006
1.4 Jordan's Economy Jordan’s ranking in the Global Competitiveness Report 2011-2012 has fallen; it is now ranked 71 among 142 countries (it was 65 among 139 countries last year). This indicates a drop of 26 places over the 45th place in the 2005/2006 report. Jordan is a ‘Stage 2’ economy, that is, an economy that is efficiency driven.
Jordan’s drop to 71st place signals a weakening of the competitive environment in the nation, with many indicators showing significant drops, including but not limited to basic requirements, institutions, infrastructure, the labor market and innovation.
Each component of the global competitiveness index, has seen a similar drop, with the exception of the efficiency of goods markets (which remained the same), market size and business sophistication, each of which showed minor changes, over the period.
Looking at the sub-indices, there has been some improvement over the previous year, specifically in the overall macro-economic environment, showing a steady improvement between 2008/2009 and this year. On the other hand, the drop in other dimensions is considerable.
Utilizing the Global Competitiveness Report, 2011-2012, it is evident that Jordan has a solid transportation infrastructure. According to the report’s statistics, Jordan has one of the best transportation infrastructures of the non-oil producing MENA nations. For example, it is ranked 41st, in terms of overall infrastructure, far above Syria’s rank of 75 (although intuitively showing a weaker rank than the oil producing nations). In the quality of air transport infrastructure, Jordan is almost on par with Saudi Arabia, although it is shown to be quite weak in railroad infrastructure, coming in at 107th place.xiii
The Doing Business Report 2011, examines the aspects of the business environment which affect the performance of a firm. In terms of the overall ease of doing business, Jordan has seen a steady deterioration in its rank, from 73rd place in 2005, to 111th place in 2011. Over the period 2005 to 2011, Jordan has remained the same, in terms of the ease of starting a business, and has seen a slight improvement in terms of registering property and trading across borders. Otherwise, every other indicator shows a decline, in terms of rank. The biggest drop was in enforcing contracts, where Jordan’s rank dropped 57 places between 2005 and 2011.
Jordan’s rank in the World Competitiveness Yearbook, has dropped from 37th place in 2007, to 53rd place in 2011. Jordan has dropped its ranking, in most indicators relating to the World Competitiveness Yearbook, including: Basic infrastructure (to the bottom of the 59 nations being measured); Productivity and efficiency (again, to the bottom of the 59 measured nations); and Domestic economy, which dropped to 55th place. Jordan’s position

10
in international trade has also been adversely affected, dropping 25 places in the span of 2009 to 2011.
The Heritage Foundation’s Economic Freedom Index measures the extent to which an economy is free of government interference and regulation. A score of 100 implies maximum freedom. Jordan has seen a steady drop in its economic freedom rank, between 2005 to 2010, although increasing slightly in 2011. In terms of actual score, Jordan has only seen a slight drop in economic freedom (implying that the drop in rank is due to the increasing economic freedom of other nations). Jordan has seen significant improvements in trade and fiscal freedom, between 2005 to 2011. Over the last year the nation has seen a significant improvement in monetary freedom. Investment impediments include excessive bureaucracy and investment laws, where some laws are enforced more strictly than others. There are also minimal impediments, with regards to payments, transfers and moving profits.
The Economic Freedom of the World Index of 2011 relies on 2009 data. According to the Economic Freedom of the World Index (of the Fraser Institute, not the Heritage Foundation), Jordan achieved a score of 6.84 in 2009 (where a score of 10 indicates perfect freedom), and a rank of 55 (a drop of twenty nine places from 2005). Overall, Jordan shows the most freedom, in terms of access to sound money; and the highest rank in freedom to trade internationally, followed closely by access to sound money.
Overall, in terms of competitiveness, Jordan has suffered significant setbacks, especially in the fields of innovation and business capability. The main triumphs Jordan can point to is its bringing inflation under control and making the opening of enterprises easier. In order to reverse the trend of decreasing competitiveness, the public sector will need to invest in enhancing the skills and capabilities of the nation’s citizens and enterprises. For SMEs this has meant that entrepreneurs have an easier time of opening businesses, however, innovation policy and growth capability remain weak.

11
Figure 4 Global Competitiveness Index, Ranking per Nation
Source: Global Competitiveness Report, 2010/2011, World Economic Forum
Jordan, Egypt, Algeria and Libya have each recorded significant drops in their rankings, over the previous year, while Qatar, Saudi Arabia, Tunisia, Oman and Kuwait have shown improvements in their performances. It is of note that most of the nations that have shown improvements in their performances are oil producing nations, while the non-oil producing Arab nations have shown weaker competitiveness levels.
Jordan’s main competitive advantage is its solid institutions, though their contribution to competitiveness has been decreasing over the past two years.
Table 3 Ease of Doing Business Rank 2011
Economy
Ease of Doing Business Rank
Starting a Business
Dealing with Construction Permits
Registering Property
Getting Credit
Protecting Investors
Paying Taxes
Trading Across Borders
Enforcing Contracts
Closing a Business
United Kingdom
4 17 16 22 2 10 16 15 23 7
Saudi Arabia
11 13 14 1 46 16 6 18 140 65
Germany 22 88 18 67 15 93 88 14 6 35
Egypt, Arab Rep.
94 18 154 93 72 74 136 21 143 131
Jordan 111 127 92 106 128 120 29 77 129 98
Lebanon 113 103 142 111 89 93 36 95 122 122
Syrian Arab Republic
144 134 134 80 168 109 110 120 176 95
Source: Doing Business 2011: Making a Difference for Entrepreneurs, Doing Business, 04/11/2010
0
20
40
60
80
100
120Ra
nking
Country
2010/2011
2009/2010

12
According to the most recent assessment of 2011, Jordan performed best in the areas of Paying Taxes, Trading across Borders, and Dealing with Construction Permits, as it ranked 29, 77 and 92, respectively.
The relative improvement in Paying Taxes amongst the other categories can be possibly attributed to a revised tax law reducing rates and abolishing certain types of taxes. Furthermore, filing income and sales tax returns electronically has been made possible.
On the other hand, areas such as Enforcing Contracts, Getting Credit and Starting a Business marked the worst performance in 2011. The country achieved 129th, 128th and 127th place respectively, in the aforementioned aspects.
However, Jordan succeeded in setting up a regulatory framework for establishing a private credit bureau and lowering the threshold for loans to be reported to the public credit registry. Despite these steps, the credit aspect still needs to be addressed as it clearly showed regression compared to the other aspects.
Among other reforms, specialized commercial units were set up in 2008 in Jordanian courts of first instance and conciliation courts. Judges, who serve in these courts, are tasked with solely hearing commercial cases. Moreover, concerned entities and individuals can have online access to court records and can track their cases online.
In 2008, Jordan lowered the minimum capital required to start a business from JD 30,000 to JD 1,000, which translated into a growth of 18% in the number of companies only a year later. xiv
1.5 Moving Forward
The need for a Small Business Agenda within Jordan is large. With slipping scores in the international rankings, and a looming youth unemployment problem, entrepreneurship, and competitive and growing SMEs are essential to Jordan's success. Thus far, there has been no focused SME agenda that looks specifically at their needs, and no unified lobbying effort to ensure that policy makers are aware of this agenda.
It is important to note that the business agenda deals specifically with small and medium sized businesses and their issues. Larger reforms that cover the economy as a whole are noted, but are not the focus of this agenda.
Across Jordan, SMEs in the different governorates face different issues. Rural SMEs may face basic infrastructure issues, compared to urban SMEs. The Business Agenda will try to balance between the needs of both.
There are a few clear comprehensive points that come out of the business agenda. These include:
• Creating an SME Task Force from the government and private sector that will accomplish such issues as defining SMEs systematically

13
• The need to create an SME Think Tank, or a Small and Medium Enterprise Research and Policy Center
• The need for the government to consider SMEs when undertaking any policy decisions
• Using examples from around the world as inspiration for new and innovative policies to encourage SMEs

14
2. Tax Incentives
2.1 Background and Issues
One of the most vital forms of interaction, between a nation’s citizens and their government, is that of paying taxes, and the use by the government of those taxes, for providing the nation with essential services. It also reveals the worth a nation attaches, to the ideals of equality, in terms of both access to resources and the law. Taxations is also the primary source of revenue for the public sector, accounting for 70% of domestic revenues of the Central Government, as of 2010.xv The Global Competitiveness Report, 2011 to 2012, also shows that it is one of the major issues affecting businesses, as shown in the table below.
Table 4 Jordanian’s responses to obstacles to doing business
Issue % of Respondents Inefficient government bureaucracy 12.8 Access to financing 12.6 Tax rates 12.1 Corruption 10.2 Tax regulations 9.6 Poor work ethic in national labor force 9.1 Inadequately educated workforce 7.5 Inflation 7.3 Restrictive labor regulations 5.6 Policy instability 4.9 Government instability/coups 3.4 Inadequate supply of infrastructure 2.9 Crime and theft 0.9 Foreign currency regulations 0.7 Poor public health 0.4
Source: “Global Competitiveness Report, 2011 to 2012,” World Economic Forum
Taxation is one of the most important factors, in doing business in a nation, to the extent that taxes are considered the third greatest hindrance to doing business in Jordan.xvi
Governments obtain taxes in order finance public institutions and services. In order to do this, taxes have to be obtained from the population, and high tax levels do not automatically generate high levels of tax income. For example, between 1982 and 1999, even though the average profit tax rate, globally, dropped from 46% to one third, profit taxes actually rose from 2.1% to 2.4%, of a country’s revenues.xvii This was due to the fact that more enterprises became a part of the formal economy (as a result of various tax incentives). This reveals that excessively bureaucratic tax regimes will result in significant tax evasion, even if tax rates are relatively low.

15
Figure 5 Burdensome taxes, and still poor public services
It is clear from the chart and table below that the highest contributor to taxes is the sales tax (tax on domestic transactions) which by nature is an indirect, and therefore regressive tax.
Figure 6 Proportion of Taxation, 2010
Source: General Government Finance Bulletin, Ministry of Finance, Vol. 13, No. 9, October 2011
Table 5 Composition of the Jordanian Tax Revenues, 2010JD million
0%
10%
20%
30%
40%
50%
60%
70%
80%
90%
100%
Tax Revenues
Taxes on Financial Transactions
Tax on Foreign Trade
Taxes on Domestic Transactions:
Income Tax and Profits:
Overall infrastructure quality Quality of education system
High High
Low Low
Easier More difficult Easier More difficult
Countries ranked by ease of paying taxes, quintiles

16
Income Tax and Profits: 624.6 Corporations, of which: 472.3 Banks and Financial Institutions 191.4 Individuals 84.3 Salaried Employees 54.2 Social Service Tax 13.8 Taxes on Domestic Transactions: 1,997.8 Sales Tax, of Which: 1,987.3 Imported Goods 819.4 Domestic Goods 463.3 Services 400.4 Sales Tax on Commercial Sector 304.2 Other Taxes 10.5 Tax on Foreign Trade 285.6 Total Tax Revenues 2,986
Source: General Government Finance Bulletin, Ministry of Finance, Vol. 13, No. 9, October 2011
There is a significant confusion in Jordan’s tax regime between ‘fees’ and ‘taxes.’ Taxes are costs levied on individuals or groups, in order to provide for national institutions and amenities, meant to be shared by all the citizens of a nation. Ordinarily, there is a direct link between a citizen’s benefits from such amenities/institutions, and the taxes he/she provides. On the other hand, a fee is levied on a person for services rendered specifically for that person, as opposed to the general good.
One of the most relevant forms of business tax is employment tax, along with indirect forms of taxation such as sales and environmental taxation. Such taxes are being increasingly utilized the public sector, in order to obtain the extra income needed to compensate for increasing pressures on public services (there are indications that the public sector is moving towards sales tax as an increasingly important revenue source).
One factor creating unnecessary hindrances in taxation compliance in Jordan is the fact that, according to the conducted focus groups, many auditors have pointed out that they are obliged to find errors in the company’s accounts, in order to avoid accusations of bribery. However, wasta and bribes are indeed frequent, as well as the belief, among SMEs, that they face excessive taxation compliance requirements, as opposed to larger enterprises. Within the focus groups, the most pertinent issue was the question of tax auditor bias. Participants frequently suggested that the tax incentive system be re-structured, in order to increase objectivity. For example, tiny mistakes in tax compliance frequently resulted in heavy fines and damaged reputationsxviii.
Another significant issue was the fact that new instructions, relating to the tax regime, were not advertised, nor information on such changes distributed. Frequently, firms are unaware of the full number of taxes required for full compliance with the law, often being unaware for the reasons for fines being levied on them. When inquiring within the tax department,

17
there are no indications as to who to communicate with, in order to answer such queries. The government has taken partial measures to solve these dilemmas, including the introduction of a temporary income tax law, and the Fiscal Reform Project from the Ministry of Finance.
Taxation affects large organizations significantly differently to small and medium-sized organizations, as seen in the table below. The following table shows the distribution of responding taxpayers (according to the size of each taxpayer) for all the governorates. While 99% of firms are SMEs within Jordan, only 85% are compliant tax payers. Table 6 Tax Payments, by Firm Size and Governorate
LTO MTO STO Total Amman 11.9% 9.3% 19.3% 40.5% Irbid and Jerash 0.4% 0.7% 8.6% 9.7% Balqa 0.1% 0.3% 3.9% 4.3% Karak 0.0% 0.0% 4.3% 4.3% Maan 0.0% 0.1% 4.8% 4.9% Zarqa 1.7% 0.9% 7.5% 10.1% Mafraq 0.1% 0.0% 4.4% 4.5% Tafileh 0.0% 0.0% 4.0% 4.0% Madaba 0.1% 0.3% 4.0% 4.4% Ajloun 0.1% 0.0% 4.4% 4.5% Aqaba 0.4% 0.4% 8.1% 8.9% Total 14.8% 11.9% 73.3% 100.0% Source: “Tax Payer Cost of Compliance Analysis,” Income and Sales Tax Department, Jordan, 2011
While all firms are obliged to pay income tax, only about 13% of small enterprises, and 66% of medium enterprises pay sales tax.xix
Table 7 Type of Tax Paid by Firm Size
Types of Tax LTO MTO STO Income Tax (General) 79.5% 53.3% 10.8% Income Tax (Individuals) 6.0% 13.9% 55.9% Income Tax (Corporations) 13.9% 32.8% 33.2% Sales Tax (General) 76.8% 65.6% 12.6% Special Sales Tax 6.6% 1.6% 0.5% Employee Tax 70.9% 31.1% 7.8%
Source: “Tax Payer Cost of Compliance Analysis,” Income and Sales Tax Department, Jordan, 2011
It is also apparent in terms of taxation needs that small companies, and those in the south have the greatest issues when it comes to keeping physical receipts, and other aspects of

18
tax compliance, such as physical bookkeeping. This is even more apparent when it comes to using computers and other specialized software.
Table 8 Problems in Keeping Organized Receipts, and Computer Usage for Taxation Purposes
Factor Keeping All Physical Receipts in an Organized Manner (out of 4)
Using Computer and Specialized Software
LTO 3.9 4.0
MTO 3.8 3.7 STO 2.9 2.4 Central 3.3 3.3 North 2.8 1.9 South 2.9 2.6 Source: “Tax Payer Cost of Compliance Analysis,” Income and Sales Tax Department, Jordan, 2011
Given the percentages of taxpayers paying each form of tax by type, the total compliance costs are shown below:
Table 9 Tax Compliance Costs, by Size of Firm
Source: “Tax Payer Cost of Compliance Analysis,” Income and Sales Tax Department, Jordan, 2011
It is clear that the cost of compliance, as a percentage of revenues, are very low, at 0.2% for LTOs, 0.4% for MTOs and 3.0% for STOs. xx
Size of Taxpayer
Total Cost of Compliance (JD/Year)
Revenues % of Cost of Compliance according to Revenues
LTO 10,429 4,926,761 0.2%
MTO 2,759 665,173 0.4%
STO 1,814 60,582 3.0%

19
Looking at cost of compliance compared to total taxes paid:
Table 10 Tax Compliance Costs, as a Percentage of Taxes Paid
Size of Taxpayer
Total Cost of Compliance (JD/Year)
Average Total Taxes Paidxxi
% of Cost of Compliance according to Taxes Paid
Average 3,079 181,940 1.7%
LTO 10,429.27 2,588,294 0.4%
MTO 2,758.81 60,828 4.5%
STO 1,813.89 1,627 111.5%
STOs spend more on compliance (on average) than they do on tax payments themselves. The situation is less severe for MTOs which pay an average of 4.5% of their total taxes paid on compliance, and it is negligible for LTOs at 0.4%. This is likely to be the case, as LTOs are much more likely than MTOs and MTOs far more likely than STOs to subscribe to the General Sales Tax. xxii
The basic tax stipulations are as follows:
In 2010, a new income tax law has been issued by which nearly 85% of employees wages in the public and private sectors were exempted from income tax for those whose wages don't exceed 12,000 JDs/ year / person and 24,000 JDs for the main provider (for example: head of family) regardless of the number of family numbers.
The tax percentages is 7% on any amount exceeds the first 12,000 and 14% on anything above that.
As for the income corporate tax, the amount is as follows:
30% on banks and financial companies.
24% on communication companies, mediation and financial exchange.
14% on rest types of companies including industrial and commercial.
Source: “The New Tax Law,” Tax System, Jordan Investment Board, 2011

20
There are certain tax exemption zones that include:
Under the Development Areas Law
Income Tax 5% On all taxable income from activities within the Area
Sales Tax 0% On goods sold into (or within) the Development Area for use in economic activities
Import Duties 0% On all materials, instruments, machines, etc to be used in establishing, constructing and equipping an enterprise in the Area
Social Services Tax 0% On all income accrued within the Area or outside the Kingdom
Dividends Tax 0% On all income accrued within the Area or outside the Kingdom
+++++++++++++++++++++
The following five points summarize the main weaknesses of Jordan’s current incentive program:
• The income tax reductions for selective sectors categorized by development zones significantly increase the tax distortion arising from the existing multi-leveled income tax rates.
• The program’s use of tax holidays is not necessarily an effective means of attracting large-scale, long-term capital investment.
• The current conditions required to obtain import duty exemption for fixed assets are too restrictive and obsolete.
• The narrowly defined sectoral coverage of the program creates an environment that encourages interest groups to seek even more selective incentives, so that government has to increase taxation on the economy as a whole to meet revenue targets.
• All of the current incentives require bureaucratic pre-approval. This administrative discretion is unnecessary and undesirable.
• The incentives within the development zones (given affordability) generally target larger companies
The dilemma of SMEs and taxation is one that offers no clear guidelines, or best international practices, although the reforms instituted by various nations do offer some indicators, regarding how to proceed. The possibility of developing tax incentives specifically for SMEs is relatively minor, as SMEs are usually less efficient than larger firms. Also, the wide variety of SMEs may make it difficult for such incentives to have precise, targeted impacts. It should be emphasized, among the nation’s decision makers, that tax incentives for SMEs will have both positive economic and social effects, although case studies have stated that tax incentives are not the best method of fixing non-tax related problems (a balance should be struck)xxiii. In order to develop a solid SME tax policy, one should consider such factors as:
• Clearly delineating the nature of SMEs, and how to measure them, through such factors as revenue, asset capacity, employee numbers and so on.

21
• A study should be composed, in order to determine which firms would be classified as SMEs, and in which economic sectors. This would make it more efficient to direct government policy and funding towards those firms that really need it within their designated sectors rather than a more general policy due to a less detailed definition.
• A solid and concise explanation of the aims of the SME tax regime. • Delineating specific thresholds for each category of SME. • Delineating the appropriate tax rates for each bracket of income, as well as suitable
profit margins. • Establishing links between taxes, license costs and registration fees • Establishing links between the advantages and costs of registering formally • Ensure that all reforms encompass small companies, as well as medium sized ones. • Always examine the balance between simplicity of the tax regime, in relation to
efficiency and impartiality. • Ensure that the incentives do not create distortions in the economy; align them with
the current tax regime.
Table 11 Certain Reforms to the Tax System
Firm Size Thresholds Applied Taxes
Large All firms administered by large taxpayer unit
General tax system
Medium Firms below LTU but above VAT thresholds
General system (with some simplifications, e.g. less frequent VAT payments)
Small Turnover below VAT threshold
A single presumptive tax based on turnover, replacing all other fiscal levies
Micro Profit below income tax exemption
One-time fee per year (option for several installments?)
The Income and Sales Tax Department offers many services in an attempt to lower the costs of paying taxes, including: offering a call center, open window for complaints and information, a day (Monday) allocated for tax payers to make complaints to the CEO whereby he receives the public, and there is an information web site with links to other web sites. There is also an e-filing system that is currently available to tax payers for filing. Tax returns, information and supporting documentation are widely available to taxpayers (e.g. available at non-government sites, downloaded from government websites). A toll-free telephone service with adequately trained tax specialists is also provided to respond to taxpayer questions.
22
The major concern with the tax department itself is that the focus remains on auditing companies rather than collection. The vast majority of the staff (700) is dedicated to auditing, and much fewer to collections. Moreover, the auditors receive incentives for finding faults with the SMEs, which also skews the system. To this end, there has been no systematic study on the part of the tax department to measure the cost on their part for such detailed monitoring of SMEs.
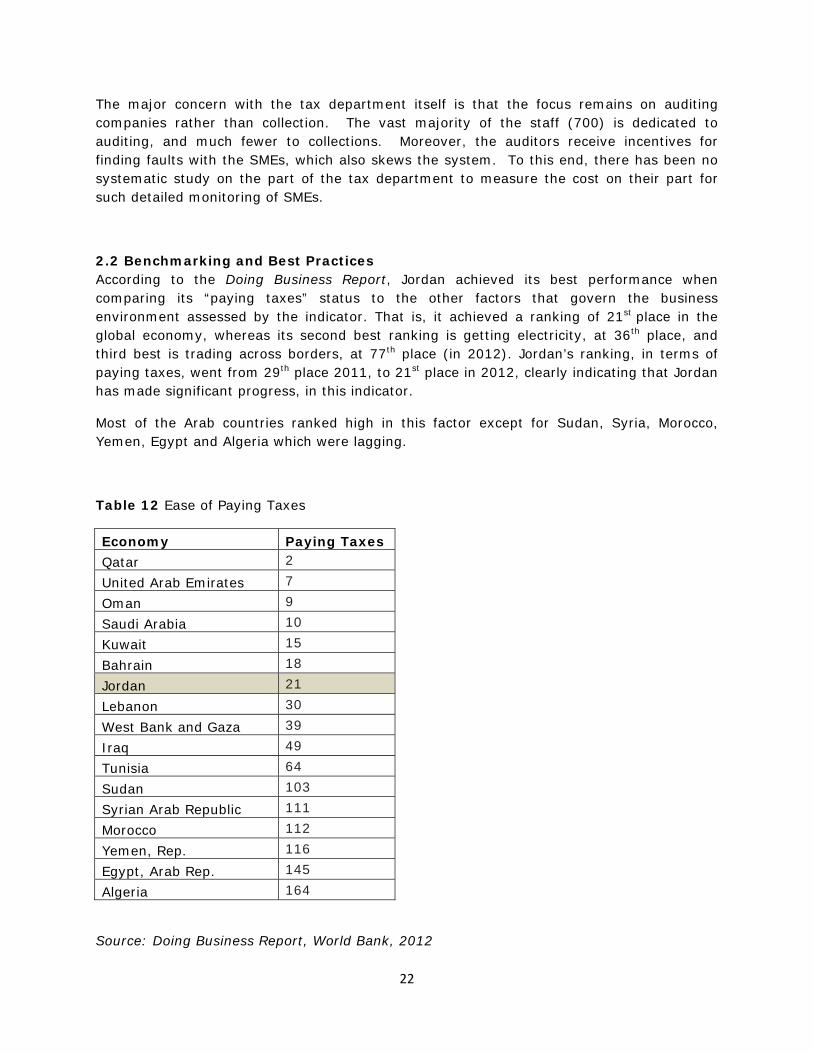
2.2 Benchmarking and Best Practices According to the Doing Business Report, Jordan achieved its best performance when comparing its “paying taxes” status to the other factors that govern the business environment assessed by the indicator. That is, it achieved a ranking of 21st place in the global economy, whereas its second best ranking is getting electricity, at 36th place, and third best is trading across borders, at 77th place (in 2012). Jordan’s ranking, in terms of paying taxes, went from 29th place 2011, to 21st place in 2012, clearly indicating that Jordan has made significant progress, in this indicator.
Most of the Arab countries ranked high in this factor except for Sudan, Syria, Morocco, Yemen, Egypt and Algeria which were lagging.
Table 12 Ease of Paying Taxes
Economy Paying Taxes Qatar 2 United Arab Emirates 7 Oman 9 Saudi Arabia 10 Kuwait 15 Bahrain 18 Jordan 21 Lebanon 30 West Bank and Gaza 39 Iraq 49 Tunisia 64 Sudan 103 Syrian Arab Republic 111 Morocco 112 Yemen, Rep. 116 Egypt, Arab Rep. 145 Algeria 164
Source: Doing Business Report, World Bank, 2012

23
When compared to regional averages, the Jordanian tax system with all its components is highly competitive and is investor friendly. The number of payments, the tax rates and the administration measured by the time all perform better than all the regional averages. The total tax rate as a percentage of profit, at 27.7%, is reasonably lower than the regional average of 32.1%.
Table 13 Ease of Paying taxes
Economy Rank
Payments (number per year)
Time (hours per year)
Profit tax (%)
Labor tax and contributions (%)
Other taxes (%)
Total tax rate (% profit)
Algeria 164 29 451 6.6 29.7 35.7 72 Bahrain 18 25 36 0 14.7 0.4 15 Djibouti 70 35 82 17.7 17.7 3.3 38.7 Egypt 145 29 433 13 27.1 3.6 43.6 Iran 126 20 344 17.8 25.9 0.4 44.1 Iraq 49 13 312 14.9 13.5 0 28.4 Jordan 21 25 116 13 12.4 2.3 27.7 Kuwait 15 15 118 4.7 10.7 0 15.5 Lebanon 30 19 180 6.1 24.1 0 30.2 Morocco 112 17 238 25.2 22.7 1.8 49.6 Oman 9 14 62 10 11.8 0.1 22 Qatar 2 3 36 0 11.3 0 11.3 Saudi Arabia 10 14 79 2.1 12.4 0 14.5 Syria 111 19 336 20 19.3 0.5 39.7 Tunisia 64 8 144 15.2 25.2 22.5 62.9 UAE 7 14 12 0 14.1 0 14.1 West Bank and Gaza 39 27 154 16.2 0 0.6 16.8
Yemen 116 44 248 20 11.3 1.5 32.9 Source: Doing Business Report, 2012
As the chart below shows, Jordan is one of the nations with the least time spent, on tax compliance, with only the UAE, Oman, Qatar and Bahrain showing more efficiency in tax payments.
Figure 7 Compliance Requirements, Hours, Across the MENA Region

24
Source: Doing Business Report, 2012
When examining the tax rates within the manufacturing and service sectors, one notices that Jordan is within international norms, particularly in light of the tax exemptions under the Investment Promotion Law, but still remains behind such nations as Ireland.
Table 14 Comparing tax rates across countries
Capital Taxes Jordan Egypt Israel Tunisia UAE Ireland
Company income tax rate (%) 14/24/30 34/42 36 20/35 0-55 12.5
Tax on other income or revenue Yes None None Yes None None
Buildings 2.0 – 4.0 SL 2.0 SL 2.0 – 8.0 SL 5 SL 4.0 SL 4.0 SL
Manufacturing 14.0 SL 15.0 SL 7.0 – 20.0 SL 5 SL 4.0 SL 4.0 SL
Service 14/24 SL 15.0 SL 6.0 – 20.0 SL 17.5 SL 15.0 SL 15.0 SL
Loss carry-forward Indefinitely 5 years Indefinitely Indefinitely Indefinitely Indefinitely
Withholding tax on dividends None 10.0 25.0 None None 20.0
Property tax (% of rental) 15.0 30.0 – 32.0 N/A 8.0 – 14.0 10.0 4.1
Property transfer tax (%) 10.0+ 5.0 Up to 5.0 5.0 4.0 9.0
Import duty on M&E*** (%) Up to 30.0 Up to 5.0 0.0 Mostly 0
Tax holidays (years) 10+ 5/10/20 7/10 10 + 10 5 No
Accelerated depreciation allowance
Yes Yes Optional Yes Yes Yes
050100150200250300350400450500
Compliance Re
quire
men
ts, H
ours
Nation

25
Import duty exemption Yes Yes Yes Yes Yes Yes
* As the classification of depreciable assets varies by country ** For deferred depreciation in loss years only. Other operating losses may be carried forward for four years. *** The import tariff shown in this table is adapted from Jordan’s Ministry of Finance, Customs Department, “Jordanian customs tariff based on the Harmonized System.” **** According to the International Bureau of Fiscal Documentation (IBFD), as an investment incentive, all the capital goods imported to UAE are exempted from the import duty; according to information published at the official website of Jordan’s Customs Department, import duty is zero on all goods imported to UAE. Despite the inconsistency, both sources indicate an effective zero import duty on M&E. The majority of MENA nations give corporate tax exemptions, ranging from 2 years for nations such as Jordan, to 20 years for nations such as Egypt, with many nations offering the opportunity to extend these exemptions, should additional investments be made. Jordan also gives lowered corporate tax rates to firms in specific economic sectors or parts of the nation.
Table 15 Main Tax Incentives Used in the MENA Region
Tax holidays (years)
Reduced Corporate Income Tax
Exemption CIT for exports
Accelerated Depreciation
Location-based Incentives
Exemption from Indirect Taxes/Duties
Export/Free Zones
Algeria 10 no yes yes yes Yes No
Bahrain - - - - - manufacturers Yes
Egypt 5-10-20 For exports
no yes Yes In specific zones
Yes
Jordan 2-12 Sector specific
yes yes Yes Sector and location specific
Yes
Kuwait 10 no no no No On production items
Yes
Lebanon 10 Location specific
no no Yes Sector specific Yes
Morocco 5 Exports and sector specific
yes yes Yes Export and sector specific
Yes
Oman 5 + 5 no no no No Some imported goods
Yes
Qatar 5 + 5 no no no No On particular Production Inputs
No
Saudi Arabia
10 no no yes No For industrial projects
No
Syria 5 no no no No On production inputs
Yes

26
Tunisia 10 Sector specific
yes yes Yes Exports only Yes
UAE - - - - - In free zones Yes
Yemen 7 no no no no On project fixed assets
Yes
Jordan also offers (along with Tunisia) tax exemptions for foreign employees (income or social, depending on the industry). Free Zones are another attempt at increasing investment through minimizing taxes. Jordan offers organizations various tax exemptions, for investing in the free zones.
2.2.1 VAT Collection Threshold One possible method of lowering tax compliance costs and tax processing costs (as well as increasing overall efficiency) is to cancel sales taxes on firms earning below a certain threshold. This should be implemented, if the net benefits to taxpaying citizens (measured in the drop of tax payments and compliance costs) is greater than the net cost to the public sector (in terms of tax revenue losses).

27
Figure 8 VAT Threshold Values Across Nations
Source: “SME Tax Compliance and Simplification,” OECD Center for Tax Policy and Administration, Retrieved from http://www.oecd.org/dataoecd/22/24/41873897.pdf However, it should be noted that if the sales tax threshold is too high (therefore excluding many companies), many companies may remain in the informal sector, as they are less likely to participate in the system. A low sales tax threshold, while on the one hand bringing in more firms into the tax paying system, may also increase the possibility of tax fraud (for example by falsifying invoices). In other words, as tax payers grow, tax challenges will also grow. In some nations, the threshold varies with the economic sector. For example, in Greece, the sales tax threshold is set at USD 12,999 for companies selling goods (or goods and services, on the condition that services do not amount to over USD 6,500). However, if the business only provides a service, the threshold is USD 6,500. The thresholds, for the various economic sectors in Ireland, range from USD 45,497 to USD 90,933.xxiv In many nations, NGOs are given higher thresholds (for example USD 78,360 in Australia and USD 21,984 in Norway). There are also variances in the possibility of registration requiring sales tax payment. For example, in Austria, companies earning less than USD 9,747 are not obliged to register, while companies earning less than USD 28,597 have the option of not paying taxes. Over one third of sales tax paying companies in Australia, New Zealand and the UK are small sized companies which have chosen to pay taxes. xxv
2.2.2 Less frequent filing requirements for small firms One possibility for lowering tax compliance costs, while conversely increasing the cash flow advantages of companies, is to offer small companies the option to file their claims on a less regular basis. The majority of countries around the world oblige large enterprises to file
0
20000
40000
60000
80000
100000
120000
140000
VAT Th
reshold Va
lues (A
nnua
l Turno
ver
USD
)

28
their returns monthly; if smaller companies were obliged to file their returns quarterly, bi-annually or annually, compliance costs may be lowered (with regards to sales tax). xxvi Currently, most countries around the world require companies to file and pay sales taxes monthly. In some exceptions (such as Ireland, Norway and Jordan), companies are obliged to file and pay every two months. In the Czech Republic, a company can file/pay sales taxes quarterly if it earns under USD 1.9 million annually, while in Spain a company may file quarterly if it files under USD 7.8 million. In Canada, if a firm earns under USD 1,278 annually, it has to file and pay for sales taxes annually, but if it earns between USD 1,278 and USD 425,900 annually, then it has to pay taxes quarterly, but file yearly, while those earning between USD 425,900 to USD 5.1 million annually have to pay and file quarterly. Austria allows a firm to file its reports annually if it earns under USD 129,990 annually, as opposed to USD 143,200 for Sweden. A company may formally request the ability to file tax returns annually, should it earn under USD 157,030 in Norway, or USD 2.6 million in the UK. Canada also applies a rule whereby small businesses may file returns less regularly. In Poland, firms with revenues under USD 1.04 million only have to file quarterly returns. xxvii
2.2.3 Cash accounting for small firms In many governments around the world, sales taxes are accrual based, that is, the taxes are paid on taxable sales, even if the revenues from these sales have not yet arrived at the company. Via the cash accounting system, sales taxes are paid only upon the sales for which revenues have already been paid to the company. If this system is applied to SMEs (and should SMEs keep steady records of revenues received and receipts), then tax compliance costs will be lowered (though to what extent depends on the number of additional documentation required by the government). xxviii For example, firms in Australia, with revenues of under USD 783,600 may utilize the cash accrual basis (with other enterprises earning under USD 1,567,200 being able to take advantage of similar, simplified accounting techniques). Within Ireland, enterprises with revenues under USD 1.3 million can use the cash accrual basis. xxix
2.2.4 Income Tax Simplification Provisions Another method of delineating which tax rates various companies should pay (outside of revenue levels), could include the number of workers, space of the company in sqm, electricity usage and other indicators associated with revenue. The advantages of using such indicators include the facts that it is typically less easy to misrepresent them, and may offer extensive savings in terms of tax compliance and processing. xxx An issue of note is the fact that, by taxing these indicators, firms will be discouraged to invest in these indicators, due to the increasing cost of adding each unit. Conversely, such measures do not discourage revenue growth, or the usage of factors of production which are not taxable. One possible advantage of utilizing such a system is to increase efficiency. For example, taxing electricity will force firms to utilize the resource more wisely, thus reducing strain on the national energy grid, as well as benefiting the environment. xxxi In Poland, a tax card system is utilized, whereby taxes are determined via a variety of factors, including the number of workers, the number of individuals living in the specific area where the economic activity is taking place and the nature of the economic activity taking place. In Spain, unincorporated firms, engaged in any one of nine economic

29
activities, pay taxes on a variety of factors, including the number of workers and electricity usage (as well as the number of tables, in restaurants). xxxii A tax based on corporate profits is unlikely to result in the levels of distortions occurring in other forms of taxation. However, this type of taxation is also biased towards more profitable enterprises. For example, if two firms each earn the same amount of income, but one firm achieves significantly higher profits than the other, then that firm pays less in taxes than the less profitable one. Not only does this form of taxation adversely affect less productive firms, but it discourages enterprises from allocating resources to areas with weak profits. xxxiii Unincorporated firms in Poland can choose whether to pay their taxes on regular income or presumptive taxes on turnover. These rates vary with the activity of the business, with 17% tax rates levied on rental or hotel services, 5.5% on manufacturing or construction activities, 3% for catering services, and so on. xxxiv One method which could be utilized, for the calculation of taxes, is to base taxes on income, adjusted for the costs of the business. For example, firms may be able to file for immediate deductions regarding capital costs, or factor in wages and other possible tax costs (such as social security). xxxv In Austria, unincorporated enterprises earning less than USD 288,578 annually, can choose to be taxed on revenues, after wages, input costs, deductible expenses (up to a certain amount) and assorted taxes, are deducted from revenues. xxxvi
2.2.5 Simplified Financial Accounting for Small Firms Currently, the majority of OECD nations utilize simplified cash accounting income tax regime, measuring only cash flows. With this system, income tax is levied only on revenue streams which have actually been obtained by the firm, and taxes on variable costs are only levied when the money actually leaves the firm. Such a system may significantly lower compliance costs (although this depends on the degree of supporting documentation required). xxxvii In Austria, unincorporated firms with revenues of below USD 519,960 are not obligated to file full financial claims, that is, only income and costs must be reported to the tax administration. In Belgium, any firm earning below USD 649,950 may utilize simplified accounting techniques, although all transactions must be recorded in a book for the treasury, as well as a purchasing and selling ledger. Also, an inventory should be recorded annually, listing all debts, credits and all supplies the firm utilized. In Germany, firms earning less than USD 668,600 may utilize the cash accounting system, instead of having to submit balance sheets, and profit and loss accounts. In Greece, firms may use the cash accounting system if they earn under USD 401,200 for trading firms and USD 200,600 for service firms. In Japan, any asset worth less than USD 2,490 may be automatically expensed; a firm may apply this method provided that expenses amount to less than USD 24,900 annually. In Poland, unincorporated companies, earning less than USD 1 million, may record income and costs in a tax ledger, as opposed to consistent financial accounts. xxxviii In Australia, firms earning less than USD 1.6 million are permitted to combine depreciable assets, in order to perform the depreciation process, thus making the process more efficient (also assets whose value are less than USD 784 are deductible). Assets with shelf lives of

30
under 25 years are depreciated at 30%, whereas those with shelf lives over 25 years are depreciated at 5%.xxxix Such simplified accounting methodologies are also available for Spanish companies which are either unincorporated, or incorporated with revenues of under USD 2.6 million and assets of under USD 1.3 million, and 10 employees or less. In Sweden, sole proprietors earning under USD 434,200 may also utilize this methodology. xl In the UK, unincorporated enterprises with profits below USD 29,389 are permitted to use this system. In America, this method may be utilized for firms earning less than USD 333,000 annually (although this threshold increases to USD 1-10 million for firms not in trade, production, ICT or mining). xli
2.2.6 Other Simplification Measures Another possibility is giving SME owners the right to simply stop paying their social security contributions. Although, while this may reduce the burden on the public sector’s side, it may not reduce time costs on the SME owner’s side, as the owner may have to file equally tedious paperwork with a private sector firm. In Germany, if self-employed individuals wish to stop paying health insurance contributions, they must provide evidence of another form of health insurance. xlii
Within Australia, the income taxes on salaries to employees may be made quarterly (if the amount required is less than USD 19,590 annually). In Ireland, such taxes may be offered quarterly, if the amount required is less than USD 38,997, making the tax payment process more efficient for 76,000 Irish SMEs. New Zealand, Canada and America also allow SMEs to pay these taxes less frequently than larger firms. xliii
Another method various nations are employing, in order to make the tax payment process more efficient, is to introduce electronic payment of taxes. While this may affect businesses of all sizes, it will benefit SMEs to a great extent, due to their more limited resources. In Germany, software was designed specifically for German firms to create electronic “certificates for wage tax deductions” and send it automatically, via the internet, to the tax authorities, lowering tax compliance costs to a remarkable extent. It should be noted that the public sector in Germany offers the software free of charge. In Canada, firms have the option to create their own accounts on tax administration servers, not only allowing firms to obtain information quickly, but also allowing them to perform such tasks as register a company, file tax returns online, pay the tax authorities and obtain tax re-imbursements. In Ireland, tax payment and filing via the internet has been consistently promoted by the government, due to its increased efficiency and reduced tax compliance/administration costs. xliv In Japan, the National Tax Agency has assisted in tax compliance via the development of a tax educational program, offering tax advice and counseling, launching a public relation campaign explaining the necessity of the tax regime, as well as offering information regarding the various laws and procedures of the tax regime. xlv Poland also offers access to tax regime information, via the internet and the distribution of brochures. In Australia, the government, as of July 2007, adopted a streamlined, universal definition for the classification of SME (whereas previously there were a variety of definitions), thus making it easier for Australian SMEs to obtain tax concessions. xlvi

31
2.3 Gap Analysis • Tax Audits: Currently, the nation has no specialized auditors, focusing specifically
on SMEs, thus adversely impacting SMEs, when auditing occurs. • Tax Audits: The tax regime audits a large number of Jordanian companies, at
almost two thirds of the nation’s companies. This puts significant pressure on both the companies being audited, as well as the government to perform these audits. Ideally, a tax regime where fewer companies are audited provides less financial pressure on companies, and less bureaucratic pressure on the public sector.
• Tax Audits: Many auditors have stated that they are obliged to find errors in the company’s accounts, in order to avoid accusations of bribery; and to receive incentives xlvii . In addition, the major focus remains on auditing rather than collecting, costing high amounts and not really treating the problem of collection.
• Tax Rates: Currently, SMEs pay taxes similar to those of larger firms. In an ideal state, SMEs would face lower tax burdens, or in some cases be exempt, according to the specific situation.
• Tax Rates: The current tax rates have placed considerable burden on the nation’s SMEs. In developed nations, cost-benefit analyses are conducted, in order to determine what are the most efficient levels of taxes, for SMEs to pay.
• Sales Tax Threshold: Currently, firms which earn less than JD 50,000 annually are exempted from sales tax. Increasing this threshold will ease tax pressures on many SMEs, while still generating income for the government.
• Rewarding Good Performers: The nation currently does not have a ‘golden list’ for firms with consistently positive tax records. Creating one will provide firms with an incentive to consistently perform adequately in tax compliance.
• Ease of Tax Compliance: The current tax regime is highly complicated and confusing, for many SMEs, resulting in considerable time losses and income lost. There is no agency for assisting companies, which in an ideal situation, would be able to assist firms in comprehending and navigating the nation’s complex tax regime (this would be especially beneficial to SMEs, with less resources which can be dedicated to tax compliance).
• Ease of Tax Compliance: There is no division within the tax department dealing specifically with SMEs. A division dealing with SMEs specifically would greatly increase the efficiency of the process, as well as reduce time wasted and penalties imposed.
• Ease of Tax Compliance: Currently, electronic tax filing is either non-existent, or in its very early stages in Jordan. Also, many SMEs are either unaware or unable to utilize the electronic tax system. By developing specific software, and distributing it to SMEs throughout Jordan, SMEs will be able to file taxes quickly, and in a manner free of complication and potential violation of tax law.
• Ease of Tax Compliance: The Ministry of Finance (or Tax Administration) has not assessed the average cost to SMEs of complying with any of the main taxes (current design) imposed by central government.
• Ease of Tax Compliance: As of yet, no study has been produced, studying methods to reduce the costs of tax compliance. However, the Ministry of Finance is conducting a study of the impact of taxes on the individual. The Ministry of Finance has not assessed the implications of alternative tax policy regimes to apply to SMEs to address tax compliance costs (e.g. under application of basic income tax and basic VAT systems, versus presumptive tax regime for SMEs, VAT exemption for SMEs).
• Tax Violation Penalties: The penalties for tax compliance errors or violations are similar for SMEs and larger firms. Reduced penalties for SMEs would be beneficial in the long run, as fines and penalties for SMEs have much greater impacts than those for larger firms.

32
• Tax Impediments to SME Equity Finance: There have been no studies examining implications for enterprise financing and investment of double taxation of distributed and retained profit undertaken by tax officials.
• Tax Impediments to Risky Investment in SMEs: There are no studies on possible impediments to investment in early-stage, high-risk companies of alternative loss-offset rules governing limits to tax deductibility of business losses, and capital losses on shares, have been analyzed, documented or discussed amongst senior tax officials of the Ministry of Finance.
• Tax Refunds for SMEs: Often take several months to be finalized. • Streamline taxes on exports: No streamlined and easy process for taxes on
exports to encourage SMEs
2.4 Recommendations • Tax Audits: Introduce specialized auditors, focusing specifically on SMEs. Auditors
who specialize specifically in SME tax issues will greatly assist the administration of SMEs in Jordan.
• Tax Audits: Lower the number of audits performed by the tax department, as this causes a burden on both the public and private sectors. Currently 100% of large companies and 65% of SMEs are audited.
• Tax Audits: Revising the tax audit incentive scheme to ensure the protection of SMEs, and renewing the focus on collection within the tax department rather than auditing.
• Tax Rates: A cost-benefit analysis should be conducted, studying the impact of lowering tax rates on SMEs.
• Sales Tax Threshold: The public sector should also study the possibility of increasing the exemption for SMEs paying sales taxes, up from 50,000 JD annually.
• Rewarding Good Performers: A list should be made, stating which companies have no tax violations. This list should then be distributed to lending institutions throughout Jordan.
• Non-Revenue Tax Indicators: The government should conduct a study, into the possibility of utilizing measures other than revenue, for the measurement of taxes liable to the government. These include the number of workers, sqm of the business, value of inputs, electricity usage, and other possible indicators. One advantage of using such indicators is that it is less easy to lie about their usage, as opposed to income obtained, in addition to the reduced administration and compliance costs.
• Expense Elections: In order to encourage the growth of SMEs, such firms should be allowed to use expense elections, for a specified percentage of their capital investments, on a yearly basis. SMEs typically have a limited ability to obtain or generate capital investment, therefore, reducing capital taxes for such firms will encourage them to invest, assisting in the growth of the economy. In specific, SMEs would be able to write off capital investments of a certain amount. Such a system will allow firms to obtain extra revenues during their start-up years, when such support will be vital. The Income Tax Department will be responsible for this system, processing the expense elections as a part of annual tax returns. In order for this recommendation to be effective, the relevant stakeholders (including the Ministry of Industry and Trade, along with the Ministry of Finance), should agree on a definition for SMEs, as well as the maximum level of capital investment which may be exempted.xlviii
• Cash Accounting Tax Payment System: Currently, the nation’s tax system is accrual based, implying that a company pays taxes on sales, even if the actual revenue from that sale has not yet been delivered. Utilizing a cash accounting

33
system, income tax is paid only when the actual revenue has entered the company’s accounts. Applying this system to SMEs will lower compliance costs considerably, (depending on how much additional documentation is needed).
• Tax Filing Frequency: Jordanian SMEs should be allowed to file their tax returns less frequently, as a time and cost saving measure (sales and employee tax). A study should be performed, determining whether it is most efficient to file these returns quarterly, bi-annually or annually.
• SME Specialized Auditors: The public sector should also study the possibility of promoting auditors who specialize in the auditing of SME finances.
• SME Tax Assistance Agency: Create an agency which will assist SMEs in their compliance with tax regulations
• SME Tax Guide: A tax guide specifically tailored for SMEs could be developed. • Methods of Reducing Cost of Compliance: Perform studies, in order to
understand the various methods to reducing the costs of tax compliance. • Tax Violation Penalties: Fees for violating tax laws should be lowered for SMEs • Tax Impediments to Risky Investment in SMEs: Perform studies on possible
impediments to investment in early-stage, high-risk companies of alternative loss-offset rules governing limits to tax deductibility of business losses, and capital losses on shares, have been analyzed, documented or discussed amongst senior tax officials of the Ministry of Finance.
• Tax Refunds for SMEs: Speeding up the process for SMEs to receive tax refunds. • Streamline taxes on exports: Ensure a streamlined and easy process for taxes on
exports to encourage SMEs • S-Corporation Option: Similar to the US model, the Jordanian tax system might
consider the creation of an entity that allows small-business owners, who the income of the corporation flows through to directly, to group their individual and corporate taxation.
• Accounting Methods in SMEs: The accounting methods in SMEs are often underdeveloped, and some training or support provisions may be put in place to help SMEs in this regard.
• Stamp Fees and Other Taxes: Other stamps and fees are also applicable to SMEs and there should be a comprehensive tally of all types of duties on SMEs so that the government will know how to best tackle the issue.

34
3. Innovation
3.1 Background and Issues The increasingly globalized nature of the international economy has resulted in greater competition facing SMEs, in conjunction with greater access to markets, and data/research centers. This increased competition has emphasized the necessity for continuous improvement, innovation and Research and Development (R&D). Many of the innovations re-shaping the world today originate from SMEs. While SMEs offer new goods and services, they also offer new productive processes, along with the development, adoption and improvement of advanced technologies.xlix
In developed nations, SMEs are high value added innovation centers. However, in developing nations such as Jordan, SMEs are composed primarily of low value added goods and services providers, and are limited in terms of innovation. In order to promote innovation in SMEs, a number of steps are required, such as the promotion of technology and cluster chains.
Figure 9 Prosperity via Innovation
However, it should be noted that innovation requires more than just investment in R&D. In order to make maximal use of R&D, complimentary investments in software, education and the development of solid institutions, are all vital. Such investments already exceed investment in physical capital, in nations such as Finland, Sweden, the UK and the US.
Innovation is the practice whereby the worth of products and services are measurably improved, through a planned and implemented process. Innovation may occur as a ‘breakthrough,’ or through gradual small improvements in goods/services; it may come in the form of new or upgraded goods/services, or new or upgraded organizational or production processes.

35
It should be noted that SMEs have potential innovative advantages over larger firms, as a result of the less rigid, more flexible and widely varied organizational structures of SMEs. This is in addition to the fact that SMEs have less bureaucracy to inhibit productivity, as well as innovation. In fact, within the OECD nations, many SMEs have indeed made use of researchers disillusioned with the bureaucracy of large enterprises. Also, in larger enterprises, successful innovators are frequently promoted to management jobs, whereas in SMEs they remain in an innovative capacity.l
Innovation requires a skilled workforce, one which is able to apply new information, data and innovations into the productive process. However, there is no universally agreed upon process for defining innovation or achieving greater levels of innovation. This is, in part due to the relative lack of empirical research into innovation, which in turn results in less precise and effective legislation, aimed at improving innovation. Within Jordan there is no comprehensive policy for innovation. Institutions that support innovation in Jordan mostly focus on the research and development and networking aspects. Some can be seen in Box 1. Box1: Some of the Jordanian Institutions Supporting Innovation The Higher Council for Science and Technology, established in 1987, aims to develop the scientific base of Jordan, by promoting awareness of the benefits of scientific research, as well as offering funding and guidance for scientific activities. The Jordan Enterprise Development Corporation, established in 2003, aims to promote the creation and growth of enterprises within Jordan, especially those engaged in exporting, in order to increase the overall economic well-being of the nation and provides innovation grants. Endeavour strives to promote entrepreneurship in developing nations, by offering networking, strategic help, talent and skill assistance, as well as other services meant to assist SMEs. Jordan Enterprise Development Corporation, or JEDCO, the European Investment Bank, or EIB, and Abraaj Capital have jointly announced the launch of the $50 million Jordan Growth Capital Fund to provide long-term capital and institutional support to small and medium enterprises, or SMEs, in Jordan. El Hassan Science City is meant to advance the attainment, production and implementation of knowledge, within Jordan. It does this through hosting the Higher Council for Science and Technology, the Royal Scientific Society and the Princess Sumaya University for Technology. The Oasis 500 is a Jordanian based seed capital fund which focuses on increasing entrepreneurship in the MENA region, through a variety of initiatives, including training programs, incubation, capital funding and mentorship assistance. There have been several schemes, designed to assist in the development of incubator programs in the nation. The Jordan Innovation Center (JIC), run by the Jordan Enterprise Development Corporation (JEDCO), manages the growth of incubators. Jordan has seven incubators, assisting approximately 100 firms. The incubator assists SMEs with ideas and small scale investments to begin their operations, for example, by providing funds for the

36
working area, along with some consultancy services in the drawing up of the business plan. The program is expected to grow to eight incubators by 2012. Venture capital is a vital component of the capital needed, in the development and growth of SMEs. However, one problem is the limited availability of venture capital, a vital component of investment for small firms relying on innovation. In addition, rarely do Jordanian bank finance R&D projects, due to the high costs, high risks, and relatively low returns offered. One program that has attempted to bridge the venture capital gap is the Jordan ‘REACH’ Program. This program (which ran from 1999 to 2004), was meant to assist the nation’s ICT industry, by improving its enabling environment, financial status and HR capabilities. Specifically, this organization recommended such solutions as developing alternative sources of finance for the ICT sector, as well as improving the usage of IPOs in the nation’s stock exchange in support of ICT companies. Moreover, one of its recommendations was the development of an ICT SME risk financing fund, which would offer investments to ICT firms. Intuitively, long term economic prosperity is predicated, partially, on consistent innovation, in order to increase the value added of each component of the supply chain. Such a task will require significant increases to the nation’s R&D expenditures, from both the public and private sectors (the industrial private sector contributes 4% of the nation’s R&D spending).li

37
3.2 Benchmarking
The small emphasis placed on R&D within the Arab world is underscored by the percentage of GDP spent on R&D, as shown below.
Figure 10 R&D Expenditure, as a Percentage of GDP, 2008*
Source: UNESCO, “Science and Technology,” Institute for Statistics, 2010
*With the exception of Morocco, 2006
In the United States, overall industrial spending on R&D almost tripled (between 1985 and 1995). However, R&D spending among the largest enterprises increased by only 20%, during this period, implying that a significant portion of the increase in this period was accounted for by SMEs, and moderately large firms. Also in the last ten year period recorded by the OECD, the R&D to sales ratio, within SMEs, rose from 3.4% to 3.9% in favor of R&D, whereas for the largest enterprises, this ratio fell from 3.5% to 3.1% during the same time period.lii
Table 16 Global Innovation Index Ranking
Country Rank Score Qatar 26 47.74 United Arab Emirates 34 41.99 Jordan 41 38.43 Bahrain 46 37.8 Lebanon 49 37.11 Kuwait 52 36.64
0
0.5
1
1.5
2
2.5
3
3.5
4
Egypt Jordan Kuwait Morocco Saudi Arabia
Tunisia Finland UK US
R&D Expen
diture, as a
% of G
DP
Nation

38
Saudi Arabia 54 36.44 Oman 57 35.51 Tunisia 66 33.89 Egypt 87 29.21 Morocco 94 28.73 Iran (Islamic Republic of) 95 28.41 Syrian Arab Republic 115 24.82 Yemen 123 20.72 Algeria 125 19.79
Source: 2011 “Global Innovation Index,” INSEAD, retrieved from http://www.globalinnovationindex.org/gii/main/analysis/rankings.cfm?vno=a
As the table above shows, Qatar leads the MENA region, in terms of innovation, with Jordan being third in the MENA region (and 41st overall), with a score of 38.43.liii
Table 17 Global Innovation Index, Linkages
Country Rank Score Oman 4 63.84 United Arab Emirates 5 63.42 Qatar 13 54.2 Saudi Arabia 24 46.78 Jordan 38 38.41 Israel 41 37.17 Tunisia 42 36.57 Bahrain 53 34.63 Iran (Islamic Republic of) 77 29.23 Kuwait 85 27.52 Lebanon 87 26.82 Egypt 90 25.81 Morocco 109 21.68 Algeria 114 18.79 Syrian Arab Republic 120 14.82
Source: 2011 “Global Innovation Index,” INSEAD, retrieved from http://www.globalinnovationindex.org/gii/main/analysis/rankings.cfm?vno=a
As the table above shows, Oman leads the MENA region, in terms of linkages, with Jordan being sixth in the MENA region (and being 38th overall), with a score of 38.41.liv Within this scoring system, the higher the score, the more advanced the nation’s system of linkages (that is, the more the cooperation among universities, the more public investment in innovation, and the more involvement in business or scholarly publications).

39
Table 18 Knowledge Economy Index
Number of Science, Technology and Innovation Info Providers
1995 Knowledge Economy Index
2008 Knowledge Economy Index
Bahrain 5 6.07 5.58 Egypt 20 4.7 4.52 Iraq 1 N/A N/A Jordan 3 4.87 5.23 Kuwait 1 5.51 5.87 Lebanon 7 5.05 4.82 Oman 2 4.28 5.01 Palestine 1 N/A N/A Qatar 1 5.32 5.29 Saudi Arabia 3 4.82 5.24 Sudan N/A N/A N/A Syria 2 3.1 2.93 UAE 7 5.83 6.06 Yemen 2 2 1.9
Source: “Knowledge Economy Index,” World Bank, 1995, 1998 and 2008
As the table above shows, Jordan’s Knowledge Economy Index has increased slightly, between 1995 and 2008, from 4.87 to 5.23 points.
3.2.1 Global Innovation Best Practices
Table 19 Best Practices Utilized around the World
Promoting Industry and Academic Linkages
• Commercialization is promoted by companies in universities. • Collaboration between an enterprise and university will help
raise the number of Industrial PhDs. • The private sector supports the innovation funds in the
universities. The innovation funds encourage many programs; for example entrepreneurship education, technology incubators and entrepreneurs in residence.
Promoting R&D
• In order to promote R&D activities and carry out innovation and research programs, direct funding is provided for national entities and universities.
• A major trend has emerged in improving specific clusters and carrying out R&D in areas of national significance.

40
Providing Tax Credits
• Governments have been consistently involved in encouraging tax credits to businesses engaged in R&D and innovative activities. SMEs highly benefit from this initiative
Inclination Toward a Sustainable Society
• Areas relevant to sustainable development (such as clean environment- energy, climate change) have been taken into consideration through funding as well as tax credits.
SME Support The top innovating countries have paid special attention to SMEs that encourage innovation. Governments support SMEs in forms of monetary funding and proving the "technical knowhow".
Easing Credit Availability
The top innovating countries and their governments have been working on easing credit availability for businesses involved in innovation and research. As a result, this step pours new ideas in to the market and creates an innovative economy. Most of these activities assist in providing support to SMEs.
Promoting an Entrepreneurial Environment
The idea of instilling an "entrepreneurial spirit" and promoting an entrepreneurial environment in the mindsets of businesses and the populace. Such as promoting: a. Incubators arrangement in universities. b. The development of entrepreneurship as an academic subject in
institutes of higher learning. c. Science and technology education.
Developing Physical and ICT Infrastructure
Developing physical and ICT infrastructure facilitates in producing an efficient environment and gets rid of any useless delays. Better physical and IT infrastructure helps improve mass transit systems, broadband expansion and so on
As the table above indicates, the best practices utilized by the most innovative nations in promoting SME development involve creating a strong link between innovation and the academic sector, investing in (and offering significant incentives for) R&D, and creating a legislative, financial and economic environment, in which SMEs can thrive.
Table 20 Innovation Indicators among the Most Developed Nations
Global Innovation Indicator Ranking
R&D Expenditure as % GDP
Time Needed to Start a Business (Days)
Public Expenditure on Education as % of GDP
USA 1 2.68 6 5.7 Germany 2 2.53 18 4.41 Sweden 3 3.63 15 6.85

41
UK 4 1.78 13 5.64 Singapore 5 N/A 3 3.2 South Korea 6 3.22 14 4.22 Switzerland 7 1.78 13 5.64 Denmark 8 2.54 6 7.92 Japan 9 3.39 23 3.48 Netherlands 10 1.73 10 5.52 Canada 11 1.89 5 4.93 Hong Kong 12 N/A 6 3.52 Finland 13 3.47 14 6.14
Source: “Benchmarking Study on Innovation Policy,” CapGemini Consulting, 2009
As the table above shows, the most innovative nations in the world spend between 1.73% and 3.63% of their GDPs on R&D. In such nations, it requires between 3 to 23 days to open a business, and the government spends between 3.2% and 7.92% of its expenditures on education.
3.2.2 United States of America
The US innovation strategy focuses on investing in the building blocks of innovation, promoting competitive markets and supporting specific clusters. Recently, the US president, Barack Obama, dedicated USD 100 billion in the Reinvestment Act to support different areas/ sectors such as energy, education and training, health IT and health research etc. The United States innovation strategy is based on the following 3 pillarslv:
1. Investing in the American Building Blocks of American Innovation: It includes initiatives, which support relevant tools for innovation and research including: a. Investments in R&D b. Human Capital c. Physical Capital d. Technological Capital
2. Promoting Competitive Markets that Spur Productive Entrepreneurship: Creating a national environment ready for entrepreneurship and risk taking.
3. Catalyzing Breakthroughs for National Priorities: Government investment in certain economic sectors such as alternative energy and IT health where the market is too weak to support itself
Nurturing Entrepreneurshiplvi:
a. The Recovery Act increased access to capital for new businesses by lowering the transactional fees and increasing guarantees on small business loans.
b. Provide Training and Mentoring to Entrepreneurs: The U.S Small Business Administration (SBA) provides many counselors who serve more than 1 million entrepreneurs and business owners with small businesses every year.
c. Furthermore, the US administration has many partnerships with various academic institutions such as colleges and universities as well as the philanthropic sector

42
organizations that provide training and mentoring to entrepreneurs in order to promote new businesses in the economy.
d. Encourage entrepreneurship through enhanced access to government data: The US administration launched a website "data.gov", which provides free data access for entrepreneurs.
Initiatives for Building a Better Physical and ICT Infrastructurelvii: Providing a better physical and ICT infrastructure facilitates an efficient environment and minimizes unnecessary delays.
3.2.3 Germany Funding R&D, focusing on SMEs and removing bureaucratic inefficiencies are the main focus areas of the German Innovation Policylviii:
• Overview: Innovation Policy of Germany is based on 4 Pillars: 1. Simplifying the tax and other bureaucratic procedures (developing framework
conditions) 2. Enhancing the performance of the education and science system 3. Providing financial aid to promote a wide range of innovative/creative
activities 4. Supporting links associated with industry-science
• Thematic R&D programs (Direct Research Promotion): includes grant aids that
are given to businesses and public research institutions for R&D projects in high-tech areas. The federal government in 2008 planned to spend USD 3.4 billion on R&D projects whereby USD 2.9 billion was linked to applied R&D and innovation.
• SME Concentration: in 2009/2010 an additional fund of USD 450 million was given to the SME program ‘ZIM Central Innovation Program’
• Industry - Science Linkages: There are many creative policy programs which
involve public and private sector that concentrate on sustaining collaborative R&D and innovation projects.
• Improving Tax Structure: By simplifying the tax system and decreasing the tax burden on businesses and reduce the bureaucratic procedures that may hold back innovation and startup companies.
• Improving the Education System: Germany is adjusting the education system to better accommodate the requirements of technology and innovation.
3.2.4 Sweden Emphasizing strong university research, encouraging business environment, and supporting SMEs are the main pillars of the Swedish innovation policylix:
• Overview: Sweden's main pillars of innovation policy include: - Strong Higher Education Research - Encouraging businesses to focus on innovation

43
- Linking university research with the business sector
Until recently, SMEs were not considered a major contributor to R&D
• National Funds: Funding of SEK 5 billion (EUR 560.9 million) was introduced in 2008 by the Swedish government in a bill for research and innovation (2009-2012) . The research and innovation bill is an initiative that will help promote the commercialization of research results.
• EU Structural Funds: Between the years 2007 and 2013, EUR 100 million is predicted to be spent on encouraging innovation.
• R&D: SME investment in R&D are on a level similar to other industrial countries, however, their share of total R&D is lesser.
• SME Support: Between the years 2006 - 2008, the Swedish Agency for Innovation Systems (VINNOVA) provided EUR 360 million to 360 businesses through its research and growth program.
• Indirect SME Support: The Swedish Agency for Innovation Systems (VINNOVA) provides the enterprises with access to individuals who have experience in the field of R&D and innovation.
• Special Support for Universities: The government is trying to promote research initiatives in universities in order to promote commercialization.
3.2.5 UK The UK is characterized by a strong science base and robust innovation capacity in the services sectorlx:
• Overview: The department for business innovation and skills (BIS) is directing the government's plans in order to provide a "public procurement culture", which will encourage innovation in the country and will help meet the needs for taxpayers in the future.
• The UK Innovation Investment Fund (UKIIF): This GBP 1 billion fund invests in startup companies and growing small businesses in digital and life sciences, clean technology and advanced manufacturing.
• Measures for Small and Medium Sized Businesses (SMBs): - Government Technology Strategy Board (TSB): In 2009, the Technology Strategy
Board (TSB) invested GBP 6.6 million, which was shared by 180 UK SMBs in order to encourage innovation in different technology fields.
- TSB projects also focus on decreasing government energy bills. • Small Business Research Initiative (SBRI): Provides access to R&D
opportunities for high technology SMBs to improve their technology or concept. • Promoting Research in Specific Areas/Clusters: Encouraging innovation through
the creation of a variety of partnerships. - Health innovation and education clusters (HIECs): Providing education and
training as well as promoting innovation in healthcare through partnerships between NHS, higher education sector and blue chip companies.
- Energy and environmental technologies sector: The Five North West Partnership was established at the end of the 2009. The objective of this partnership was to

44
develop the energy and technologies sector in innovation schemes and leadership.
- Measures taken by the Office for Life Sciences (OLS): Securing the UK as a location of choices for global life sciences investments in the future.
• Support for Business R&D: The UK government helps businesses achieve their R&D goals through the following solutions: - R&D tax credits: A funding mechanism for investment through tax deductions.
- Technology Program: This program focuses on developing technologies which facilitates innovation in the United Kingdom. For instance, the program spreads knowledge, recognizes opportunities and solves problems by bringing people together.
- Other R&D support products: Other tax breaks include capital allowances for investment in equipment and properties.
3.2.6 Singapore Singapore's innovation strategy is focused around promoting R&D and linkages between 'research in universities' and the 'corporate sector'lxi:
• Overview: Singapore focuses on promoting R&D while directing their focus on specific areas and creating ties in research between the business market and the higher educational institutions.
• The National Framework for Innovation and Enterprise (NFIE's): SGD 350 million was given to NFIE's initiatives in 2008 through the year 2012. NFIE's function includes strengthening the R&D foundation of the country.
• Establishing Support for Academic Entrepreneurship in Universities: The NFIE focuses on increasing academic entrepreneurship in the Institutes of Higher Learning (IHL). Its purposes include:
1. Establishing enterprise boards within universities to motivate innovation by students.
2. The innovation fund will financially support entrepreneurship education, technology incubators, and other related programs in order to promote the marketing of university created technologies.
• Grants: Translational R&D grants for polytechnics from universities and research organizations
• Creating Enterprise Support Structures: Proof of concept grants includes an amount of SGD 250,000 which will allocated to researchers working in IHL's for them to develop the proof of concepts for their ideas in technology.
1. Technology Incubation Schemes: The companies admitted into technology incubators in IHL's are provided with 85% of the co funding (which is nearly SGD 500,000) "in exchange for equity stake in company".
2. Early Stage Venture Funding Scheme: Will help develop an early stage of VC funds.
• Strategic Research Programs:

45
- The Research Innovation and Enterprise Council (REIC) provided an amount of SGD 1.55 billion to create strategic programs.
• Campus for Research Excellence and Technological Enterprise (CREATE): Research Center bringing together a wide variety of Singapore’s technological universities and research centers (MIT-Singapore Alliance).
• Enhancing Technology Transfer: To promote SME and higher educational institution collaboration, innovation vouchers will be distributed to small and medium sized businesses to obtain R&D and other additional services.
• Supporting Innovation Policy Studies: In order to promote innovation in publicly owned and privately owned businesses in the economy, a local center for innovation studies and projects will be established.
3.3 Gap Analysis
Comprehensive Innovation Policy: Jordan has neither an innovation policy for enterprises or for SMEs.
Promoting Industry and Academic Linkages: One of the most significant gaps within Jordanian innovation is the link between industry and academia. In the vast majority of cases, Jordanian universities focus on teaching, learning and research, whereas the possibility of commercialization, of utilizing their research for the private sector, or in conducting projects in conjunction with the private sector, is almost non-existent. In summary, goods and processes emanating from Jordanian universities, which may enable or enhance the private sector, are minimal. Therefore, the process and ideology of commercialization needs to be implemented into the nation’s higher educational system.
There are some examples of coordination such as the ‘Engineering Partnership Council with Industry,’ within the University of Jordan, which invites 15 entrepreneurs to debate new possibilities, initiatives and potential projects. The ‘Faculty for Factory’ Program is meant to assist the Faculty of Engineering and Technology in facilitating the expansion of industrial SMEs. The program offers incentives for qualified individuals to assist in the running of SMEs, as well as formulate and implement feasible projects. These limited examples are by no means sufficient. It is absolutely vital that the public sector take a much more active role in the promotion R&D, innovative practices and improved competition.
In comparison, the United States government has a wide variety of partnerships within the academic sector, including universities, think tanks and charitable organizations, as well as mentorship programs, in order to ensure that entrepreneurs have the appropriate skills for the industrial world. It should be noted that, of the 2.79% of its GDP that the US spends on R&D, 12.8% of that amount is spent by the higher education sector. However, regarding Jordan, of the 0.42% of its economy that it spends on R&D, only negligible sums are spent by the higher education sector.lxii
Other methods utilized by the American government to promote the role of education in industry involve offering mentors to small businesses; the Small Business Administration

46
offers counselors to over 1 million entrepreneurs, managing small businesses. In Japan, a system has been developed, whereby the intellectual property of universities will be enhanced through increased cooperation between universities (specifically, their intellectual property departments) and companies dealing in technology, thus resulting in increased interactions between the two systems.
One vital part of this process is government investment in education, ensuring that all citizens have the basis for a solid education, imbuing them with basic skills and the foundation for education in science.
Promoting R&D: While the attempts Jordan has made at promoting R&D are significant, the nation still requires much more effort and investment. Both at a national and firm level, R&D expenditures are weak, and insufficient for the creation of new goods and services. As a result, most exports are either low value added goods, or raw materials.
Jordan’s human capital is considered to be amongst the highest levels in the MENA region, with a literacy rate of 92.8% and 99.1% for adults and youth, respectively. This can, in part, be explained by school enrolment rates of 97.6%.lxiii
The Global Competitiveness Report shows Jordan’s capacity for innovation score at 2.73 and ranking at 92ndout of 142 nations, and technological readiness score at 3.81 and ranking at59 out of 142 nations. This indicates that the Jordan may be technologically ready, but other factors are impeding innovation. According to the Global Competitiveness Report, 2011 to 2012, Jordan has registered an extremely negligible number of patents in the year 2011, giving it a rank of 90th place out of 142 nations. This is in comparison to the UAE, with 1.5 patents per million people registered, giving it the 50th rank in the world out of 142 nations. The reasons for the weak levels of innovation and patents in Jordan are numerous. Such reasons include the fact that researchers within public universities (which perform a significant portion of the nation’s research) perform research projects designed to further one’s career, projects of academic interest, and rarely projects that advance the economic and business interests of the nation. Another reason is the fact that the various higher educational institutions do not engage in joint research projects with firms in the private sector. Another major issue is that SMEs do not work together, nor link with larger enterprises to help promote R&D. Most SMEs in Jordan focus their business around trade-based issues, so that any innovation becomes external technically. Their major concern often remains marketing.
This is in stark comparison to other nations, such as the UK, where the government consistently encourages innovation via partnerships among SMEs, thus resulting in the formulation of specific clusters of SMEs, increasing their economic capacities significantly.
Providing Tax Credits: One method which is underutilized, in order to promote SMEs, is offering tax credits to such organizations, thus reducing their tax compliance costs and allowing them to utilize their funds for other purposes. In an ideal state, such a program would be a great boon to SMEs, improving their efficiency and productivity.

47
In Germany, for example, the government has introduced measures to simplify tax compliance procedures (thus saving time for SMEs) as well as introducing tax credits (whereby the government offers tax deductions for the purpose of SME investment).
Easing Credit Availability: Within Jordan, SMEs face considerable difficulty in obtaining affordable loans (as is discussed in detail in the ‘Access to Capital’ chapter). Other countries, however, make obtaining loans significantly easier for SMEs, thus allowing them more flexibility in their finances (including in such matters as spending on R&D). In the USA, the ‘Recovery Act’ assisted in reducing transaction fees for SME loans, and guaranteeing small business loans. In Denmark, public sector research institutions offer funds to SMEs for proof of concept studies (DKK 40 million for 50 proof of concept studies). In Holland, the public sector assists SMEs in obtaining loans, when they do not possess the necessary collateral for obtaining a loan (for example, by offering guarantees for SMEs out of public funds).
Promoting an Entrepreneurial, Innovative Environment: In addition to fostering an academic environment, and making SME access to capital easier, another necessary step is for the government to promote an innovative environment in Jordan. For example, currently, most Jordanian producers focus primarily on lowering the cost of manufacturing their current products, as opposed to spending on R&D and innovation, in order to produce goods of higher value.
The Industrial Research Fund (formed in 1994) was created in order to assist in the advancement of Jordanian industry, by offering technical assistance, and funding for collaborative efforts between the academic and business sectors in Jordan. One proof of the fact that Jordanian producers focus on manufacturing current products, instead of researching and developing new ones: since the Fund’s creation, 44.9% of its funds have gone towards developing current goods and services, as opposed to researching new goods/services. Another 22% of the fund’s revenues were directed to infrastructure projects, having nothing to do with R&D. A further 10% of the fund’s revenues were directed towards the pharmaceuticals industry. It should be noted that the vast majority of pharmaceutical research within Jordan focuses on developing new formulas for already existing and patented medicines. While the pharmaceutical sector does perform research regarding the effectiveness and safety of the product, such research is a negligible amount, consisting only of 0.1% of total sales in the sector.
The strategies currently utilized in Jordanian firms focus, almost entirely, on production, with minimal attention paid to the development of the product or service. Also, they do not conduct research into improved productive methods and techniques, thus limiting the nation’s access to new markets. It should also be noted that most entrepreneurs do not view R&D as a major input to their work, they do not seek it, and they do not know what to do with new ideas.
Scarcity of Reference Sources: In addition to these shortcomings, it should be noted that there is still an unwillingness to accept the possibility of failure among Jordanian enterprises, even though failure and learning from such mistakes are key elements of R&D. Another problem is the scarcity of modern reference sources, such as scientific journals, in Jordan (both in Arabic and English). Another problem is the weakness of the general

48
population, in the English language, thus limiting the amount of foreign information which can be absorbed. Also, entrepreneurs do not know what to do with their ideas (that is, they do not know how to properly fund and implement them), and are unwilling to take risks, due to the fear of bankruptcy that such a risk entails.
Brain Drain: The efforts of the public sector, as well as private companies, to utilize the capabilities of the Jordanian population, have achieved weak results, partially explaining the significant levels of brain drain out of Jordan. The nation’s score for brain drain, from the Global Competitiveness Report, 2011 to 2012, was 3.3 (out of a possible 7), reaching a rank of 73 (out of 142 nations), showing that it is just under the global average, in this regard, as compared to the UAE, with a score of 5.2 (out of a possible 7) and rank of 10 (out of 142 nations).
Utilizing ICT Capabilities: Jordan has made significant strides in its introduction and implementation of ICT infrastructure, which has had positive impacts for both SMEs and larger firms. Although the nation has made significant progress, there still remains significant work to be done. For example, e-business and e-government are both in their infancy within Jordan. This implies that SME owners must pay taxes in person, a very time consuming process. In comparison, in Denmark, the ‘Innovation Center for E-Business’ assists SMEs in developing their ICT skills. Also, developed countries consistently make use of the internet, in assisting SMEs in paying their taxes online (see section 4.2.6 of the ‘Tax Incentives’ chapter for more details).
Limited Government Spending and Funds: The R&D of Jordan, as a percentage of GDP, is 0.42%,lxiv is rather low, compared to Morocco’s figure of 0.64% of GDP, Tunisia’s figure of 1.13% of GDP, America’s figure of 2.79% of GDP, and the international standard of 2%.lxv It should also be noted that the public sector provides the vast bulk of R&D investment. The government provides support through investment in universities. The ‘Higher Council for Science and Technology’ obtains the largest amounts of funding, followed by the ‘National Center for Agricultural Research and Technology Transfer.’ However, this funding remains tight. Jordan also spends little on promoting incubators (this is discussed in detail in the ‘Access to Capital’ chapter). This is in stark comparison to such nations as Denmark, whereby the government invests heavily in incubators (USD 89 million), thus producing highly innovative SMEs, offering high value added products and spurring economic growth.

49
3.4 Recommendations
Creation of a Comprehensive Innovation Policy that includes all aspects of the economy and institutional support, as well as a focus on SMEs.
Promoting Industry and Academic Linkages in order to promote the link between industry and academia, several methods should be adopted:
• Encourage private sector support for innovation funds in universities. Programs funded could include education curriculum that are designed to imbue the skills needed for entrepreneurs to succeed, in addition to technology development programs and entrepreneurs in residence
• A study should be conducted, determining exactly where the gaps are in the nation’s most important economic sectors and the relevant educational centers developing students for work in these sectors
• Investment in ICT in education should be undertaken, in order to facilitate knowledge dispersal
• One of the largest challenges for universities to integrate skills required for innovation includes the lack of connectivity between the university and industry experts to identify those fields where students require innovation. There is also no larger environment beyond the university that helps to encourage innovation amongst students. This includes lack of mentorship opportunities between professors and students. Finally, there is no consistency in the follow-up of innovative ideas at the university level, and few linkages with the private sector to ensure consistent success. Henceforth, a mentorship program should be created, in order to deal with these shortcomings.
• It is important to reconcile the differences in the output of scientific research and the goals of the private and public sectors. This can be achieved through increased communication between academia and these two groups. This objective can be accomplished through establishing conferences and seminars, inviting the heads of academia and the private sector to discuss their beliefs regarding the necessary outcome of education. This can also be achieved by placing private sector heads on the university advisory boards. The private sector could also sponsor specific research programs suited to their needs, and the public sector can facilitate this by distributing documents outlining the research capabilities of universities to private sector firms. (Tax incentives will support in this regard)
Promoting R&D: In order to achieve a change in the nation’s economic and technological structure, significant investments need to be made in R&D, as well as linking the components of innovation.
This can be achieved through:
• Jordan's government actively encouraging innovation (for example, through providing scientists and technical experts) in fields such as renewable energy (solar panels) or water conservation techniques such that it streamlines innovation into national priorities. A study should be performed into the investment requirements for such a project, as well as its potential returns and costs. This should be integrated into government procurement.

50
• Performing a study, to assess the impacts of diverting a certain percentage of the revenues obtained from corporate tax, to national R&D purposes
• The public sector providing books, pamphlets, scientific and cultural journals, within universities, but also to be made available to the public. Such documents should also be made available electronically
• Conducting a study into the costs and benefits of increasing direct funding to national entities and universities
• Conducting a study into steps needed for clustering (for example, urban planning to regroup various economic sectors, tax incentives to cluster SMEs and so on)
Providing Tax Credits: Providing tax credits will not only ease the burdens of SMEs, but also encourage SMEs to be more risk taking, as they will have a financial incentive to do so, even if their research does not bring about the expected results. That is, even if their R&D does not yield a new product or innovative process, SMEs can still enjoy a tax credit, thus ensuring that their investment has not gone to waste. The government should perform a study into the potential impacts (both positive and negative) of utilizing tax credits to promote R&D.
Easing Credit Availability: In order to improve innovation, SMEs must obtain access to sufficient quantities of capital to fund their various projects and potential ideas. This can be accomplished through:
• The Jordan Loan Guarantee Corporation has had limited success in the past. If access to capital is to be improved, this organization must play a significant role in the guaranteeing of loans. A study should be performed, detailing the successes and failures of this organization, as well as the steps needed to improve its performance.
• A legal or regulatory framework must be developed, specifically for venture capital funds, in order to regulate and promote their use.
• Facilitate funds for R&D use
Promoting an Entrepreneurial, Innovative Environment: The idea of instilling an "entrepreneurial spirit" and promoting an entrepreneurial environment in the mindsets of businesses and the populace can be achieved through:
• Increased government support for incubators • Increase coordination between incubators, for example by developing oversight
committees • The development of entrepreneurship as an academic subject in institutes of higher
learning; the government should conduct a study on the requirements of developing entrepreneurship as an actual academic discipline
• Investment in science and technology education • In order to assist SME owners in overcoming their fears of failing, develop financial
‘cushions’ (for example, micro-insurance) for SME owners, should their ventures fail, thus providing them with more incentive to take risk
• The development of an ‘entrepreneurship cluster zone’ would greatly assist the growth of the nation’s SME sector. This would help local entrepreneurs in developing information clusters, via infrastructural and set-up inducements, as well as tax incentives. This initiative has brought considerable results in nations such as the

51
UAE, Oman and Bahrain, essentially concentrating innovative companies and increasing the number of newly created firms. Such a zone will also increase the level of private equity flowing into a nation.
• A greater number of venture capital funds are required in the nation, with special attention paid to funds that encourage female and youth entrepreneurs.
• A program should be formulated to identify and establish the function of all stakeholders in the innovation process, thus combining various stakeholders in order to raise collaboration and mutual support when assisting SMEs. The strategy shall also establish the appropriate Key Performance Indicators needed to gauge the accomplishments and sustainability of these schemes.
• The public sector could support SME value chains and cluster units by strengthening the logistics position of SMEs and establishing purchasing units. SMEs will be made conscious of the advantages of cooperating with other enterprises, whether horizontally or vertically. These linkages will encourage the development of more efficient clusters, capable of combining their strength, in order to generate products and services of export quality. Cluster groups increase strategic capacity and the potential for innovation, via the implementation of best practices learned from each other. This offers higher-end employment opportunities, and assists in the creation of value-chains, in order to generate higher value-added in the company’s services and products. JEDCO has started the National Linkages Program that must be extended.
Utilizing ICT Capabilities:
• Provide access to international databases, offering SMEs a wealth of information and data, which may prove beneficial to their operations.
• Develop ‘entrepreneur cafes’, which will be meeting grounds for business owners • Create centers of R&D, connecting the nation’s SMEs. This will improve the flow of
informational exchange between SMEs.
Limited Government Spending and Funds:
• The nation could also divert a specified amount of the foreign aid it receives to R&D activities, as well as promote partnerships between foreign firms and Jordanian firms, in terms of R&D. The nation could also invest in new products or services to be jointly produced by foreign and Jordanian firms.
• Establish an investment fund, to be paid for with funds from the private sector. • SMEs could also be offered loans for R&D purposes from the public sector at low
interest rates (preferably not exceeding 2%). • The government could take the 1% tax it levies on shareholding companies, for R&D
purposes, and invest it in more applied research. • The government should also focus on identifying areas of strength in Jordan, and
improving upon it, such as pharmaceuticals, phosphates, potash, Dead Sea products, education, call centers and so on.
• Gearing government procurement to encouraging SME innovation

52
4. Access to Capital
4.1 Background and Issues The needs and financial sources of businesses change over their lifecycles. Start-up firms typically utilize internal funds, that is, funds such as the entrepreneur’s own savings, income from friends, family, colleagues and partners, as well as credit from third parties. As a business grows and obtains a positive reputation, it will come to the attention of investors who wish to invest equity into the firm, and higher cash flow makes it easier to obtain bank loans. Finally, a firm may wish to go public, obtaining funds from securities.
Figure 11 Financing Needs and Size of Company
4.1.1 Debt Finance Debt Financing for SMEs comes in a variety of forms, as shown by the chart below. The main issue with obtaining debt finance is not necessarily the lack of such finance, but rather inadequacies, in terms of the range of financial products, the excessive costs of such finance, especially in relation to SMEs. Such inadequacies result from the nature of a highly competitive market, as well as significant barriers to entry for new comers (in terms of finance).
Source: Financial Schemes for Small and Medium Enterprises, ESCWA, UN
Growth
SME Large company
Idea Development Business creation Business development Industrial production
Going public
Development finance
Early stage finance
Seed Capital
Family
Low risk
Bank finance
High risk Financing needs/ level of risk
Time

53
Figure 12 Sources of SME Finance
Table 21 SME Growth Phases and Funding Cycle in the UK
Type of SME Start-up Phase Growth Phase Stable Exit for External Investor
Traditional, providing income for an individual or family or small group of employees
Family, friends, savings, equity in residential property
Asset-backed finance, factoring, bank debt, trade credit
Often none, but debt if required
N/A
High potential with growth aspirations
"Angel" finance, team equity, some venture capital
Venture capital, private placement of equity, asset-backed finance, some bank debt
Venture capital, high-yield debt market, bank debt
Either exit via capital markets or direct access to competitive capital markets
Attractive, with high-tech information and life sciences IPR
"Angel" finance, venture capitals, corporate
Venture capital, corporates, asset-backed finance
Corporates, bank debt
Exit typically via trade sale
Source: UK Banking Review
SME Debt
Individual Finance
Owner's Debt Banks
Relatives, etc.
Commercial Finance Trade Creditors
Possibility of Refinancing
through Banks
Institutional Finance
Direct Capital Markets
Intermediated
Banks
Non‐Bank Financial
Intermediaries
Possibility of refinancing
through Banks
Other

54
4.1.2 Commercial Banks
There are a relatively large number of private commercial banks (28)operating in Jordan are capitalized by central bank funds, remittance income and foreign aid, as well as local deposits, and are -as a result- comparatively liquid.
The amount of credit extended through the banking sector in Jordan during 2010 reached JD 14.5 billion up from JD 9.8 billion in 2006, showing an average annual increase of 12%.lxvi According to official figures, SMEs in Jordan receive only 10% of the overall credit facilities extended by commercial banks.lxvii
Figure 13 Credit facilities extended by commercial banks in Jordan, 2006-2010, Millions JD
Source: “Credit Facilities Extended by Licensed Banks” Central Bank, Monthly Statistical Bulletin, November, 2011
However, loan portfolios remain overwhelmingly dominated by larger industrial and trading firms and, where SMEs are involved; they are almost exclusively trading companies. Research has demonstrated that commercial banks have produced systematic issues for SMEs:
• Interest rates and the cost of lending are often very high, past the reach of SMEs • Time of the loans is limited, generally 4-5 years which is very tight for a newly
established company • Grace periods on loans is limited (generally about 9 months), which is barely enough
time to generate positive cash-flow • Collateral on loans required is often complete in terms of percentage • There is a gap in the language between SMEs and the Bank, while some banks did
initiate an SME window, the type of requirements, training and response do not differ between them and large firms
0
2000
4000
6000
8000
10000
12000
14000
16000
2006 2007 2008 2009 2010
Cred
it Offered
by Co
mmercial Ban
ks
Year

55
• Banks do not rely on business plans when evaluating a loan, and often do not have the needed expertise to evaluate a new or innovative idea
• Inadequate credit rating facilities mean that sometimes SMEs are unfairly denied loans
Figure 14 Sectoral Distribution of Commercial Banks Credit, 2010
Source: “Credit Facilities Extended by Licensed Banks” Central Bank, Monthly Statistical Bulletin, November, 2011
As the chart above shows, 22% of credit facilities within Jordan (as of 2010) have gone construction, 13% going to industry and another 7% going to public utilities.lxviii This shows that the vast majority of credit within Jordan is allocated towards sectors where large firms are dominant, and risk is generally low.
Of the loans offered in Jordan, 2010, 39.9% went to the government.lxix It should be noted that excessive governmental borrowing leaves less funds available for private sector investment, as loans to the public sector carry higher chances of being repaid.
As commercial banks increase their business with such sectors, and form closer relationships with them, increasing levels of trust and security, the incentives for banks to branch out into different sectors is weakened. SME access to capital in Jordan is also limited by what banks believe to be excessive risks and transaction costs, which ultimately do not justify such transactions. Banks also have to contend with a dearth of reliable data on potential borrowers, an inefficient legal and court system which makes it problematic to administer the terms of contracts, as well as the unavailability of the instruments needed to manage risk.
In order for financial markets to distribute financial resources effectively, all stakeholders must have the same necessary data and information. Within developing nations, this is rare,
2%
13%
25%
22%3%
3%
7%
3%
22%Agriculture
Industry
General Trade
Construction
Transportation Services
Tourism, Hotels and Restaurants
Public Services and Utilities
Financial Services
Other

56
leading to a bias against SMEs in terms of lending. This is exacerbated by the fact that banks may find it too expensive and time consuming to ascertain such info themselves. This leads to a perception whereby the risk of lending to SMEs is exaggerated, thus leading to higher interest rates on loans to SMEs, if they are offered at all. This will discourage SMEs seeking low risk, low interest loans, thus increasing risk to lenders, in the long run. Establishing credit bureaus could reduce this impediment; they are already part of standard procedures in developed nations, and growing in importance, in the developing world. By establishing a credit bureau, where lenders can understand the credit and repayment history of a firm, banks obtain a better understanding of a firm’s ability to repay loans, thus reducing interest rates for firms with solid performance, in this regard. It also encourages firms not to be late with their own repayments. The results of a 2004 World Bank Survey reveal that over half of credit bureaus believed that they had reduced processing times and costs by over one quarter. As a global average, a nation which does not have a registry will show private credit levels equivalent to 16% of GDP, increasing to 40% and 67% for nations with public and private registries, respectively.lxx
There are also some difficulties arising from excessive supervisory and adequacy restrictions (or the misinterpretation of them, which punish banks for lending to companies which do not have traditional collateral. The Industrial Development Bank, which was one alternative for funds to SMEs, has been disbanded. Other possibilities for SMEs remain limited.
4.1.3 Seed Money and Venture Capital (Equity Capital)
Solid statistics, regarding the total level of venture capital in Jordan from local and international firms, is currently unavailable. The venture capital industry in Jordan is still in its introductory stages.
As the figure below shows, terms of the Global Competitiveness ‘Availability of Venture Capital’ score, Jordan is significantly below the MENA Average. However, a solid venture capital system is vital for the growth of SMEs, within the nation (and, since SMEs make up the vast majority of enterprises in Jordan, venture capital is vital for economic growth). Not only will venture capital allow firms to (partially) compensate for difficulties in obtaining credit in Jordan, but it will also facilitate entrepreneurship; the nation’s high entrepreneurship rate, at 18%,lxxi cannot be financed solely through bank loans and family funds. While there are a wide variety of organizations assisting in raising venture capital, there are few organizations focusing solely on this matter (that is, their actions impact venture capital availability indirectly).
While there are some private equity funds, they do not traditionally invest in SMEs, preferring instead to invest larger, more established firms. As an example, Atlas Investments, in conjunction with the Arab Bank, has created the Arab Bank MENA Fund, investing in various Middle Eastern Stock Exchanges, including the Amman Stock Exchange. The Jordan Dubai Fund, developed in 2005, by Dubai International Capital, has invested USD 272 million in large scale businesses.lxxii In the Middle East, USD 5.8 billion was raised between 1994 and 2005. lxxiii Most venture capital funds in Jordan are regional, and

57
specialize in financing the ‘growth’ stage or further stages of development. Hence, seed and initial stage funding in Jordan is a challenge for most SMEs to find.lxxiv
Figure 15 Venture Capital Availability GCR Score 2011 to 2012
Source: Global Competitiveness Report 2011 to 2012, World Economic Forum
*Scale of ‘1’ to ‘7,’ with ‘7’ implying the best possible score, and ‘1’ the worst possible score
As was previously mentioned, the importance of venture capital is emphasized by the fact that the vast majority of Jordanian companies (at 99%) are SMEs. However, the vast majority of these SMEs are funded via family and friends, which is incapable of spurring the SME sector to greater growth (angel investment supports less than one fifth of entrepreneurial investment in the nation).lxxv
SMEs traditionally have limited dealings and knowledge of external equity financing. A large portion of Jordanian SME funding originates from family members (at 21% for start-ups), hence are not subjected to open scrutiny of their business.lxxvi
0
1
2
3
4
5
6
GCR
Score
Nation

58
Figure 16 Source of Funds for Small Firms
Source: World Bank Development Indicators, 2004
Figure 17 Source of Funds for Large Firms
Source: World Bank Development Indicators, 2004
Internal Funds70%
Family and Friends11%
Banks5%
State Sources 1%
Other13%
Internal Funds52%
Family and Friends4%
Banks22%
State Sources 5%
Equity5%
Other12%

59
Since SMEs do not usually have international standards they must adhere to for financial accounting, there are significant differences in how they report their financial situations. For example, Chinese firms have two or three different financial books, each formatted for different readers. This results in significant time constraints, as well as raising the costs of loan processing, regarding smaller enterprises.
While there has been increased awareness of the venture capital concept, there are still hindrances to the full implementation of the concept in Jordan. It is evident that much time will be required before it can be considered mainstream (no governing laws for instance). For example, while USD 4.8 billion was raised, in terms of private equity (for the entire MENA region, 2006) just 9% was allocated to venture capital.
Angel investment is the process whereby any investor offers funds based on the plausibility of an idea. Within Jordan, there is no solidified network of known angel investors, which entrepreneurs have access to, such as Silicon Valley in the USA. However, there are some angel investor organizations, as shown in the box belowlxxvii:
Angel Investments within Jordan have shown increased action in the past few years, under the initiatives of investors such as Fadi Ghandour and Maher Qaddura. One significant aspect of Angel Investors is the difficulty in forming connections with other Angel Investors. This led to Oasis 500 developing an Angel Investment Network, which, as of July 2011, had trained 225 entrepreneurs and incubated 23 firms, thus showing that there is potential for investment and growth, should the necessary capital be provided.
Table 22 Seed Money and Venture Capital Firms Assisting Jordanian Companies
Firm Region (Investment Focus)
Stage Investment Size (USD)
Sector
Jabbar Internet Group
MENA Various 0.5 - 5 M E-commerce/Online Retail Jabbar invests in internet companies
Oasis 500 Fund
Jordan Seed 0 - 50k ICT, Digital Media, Mobile Applications
MENA Venture Investments
MENA Angel/Seed 0 - 250k Sector agnostic, looks at all potential sectors
N2V MENA Seed/Early/Growth 0 - 2M + Internet and Mobile PlugandPlay-Egypt.com
MENA Seed/Growth 5k - 50k IT
Venture Capital Bank
MENA Seed to pre-IPO 300k-120M Chemicals, consumer goods, engineering procurement, construction, healthcare, IT outsourcing, real estate development, telecom services
Riyada Enterprise Development
MENA Angel/Seed Innovation
IV Holdings MENA Angel/Seed IT + Others Foursan MENA Angel/Seed IT + Others

60
Capital Partners
4.1.4 Incubators Incubators are programs meant to facilitate the growth of entrepreneurs, via a wide range of services and management support. Incubators are different from R&D parks, in that they typically focus on start-up and younger firms.
Problems with incubators include:
• No networks exist within incubators
Created in 1988, the Jordan Technology Group Incubator Project (a branch of the Venture Capital Division of the JTG) was designed to offer venture funding, to assist in the development of new companies and to bring in FDI. The National Initiative for Innovation has 5 incubators, managing 60 firms. The incubator assists entrepreneurs with solid ideas and visions, in the development of their firms, for example by offering consultancy assistance and formulating business plans. There are plans to enlarge the program into 8 incubators.
The Jordanian Forum for Business and Professional Women has assisted in the development and growth of women run enterprises.
The National Consortium for Technology and Incubation of Businesses, formed in 2003, is tasked with encouraging and assisting in the use of the scientific potential of Jordanian firms.
It should be noted that while equity financing will not be a major source of capital for Jordanian SMEs in the foreseeable future, it is nonetheless a significant component of the access to capital needed by many SMEs.
The Queen Rania Center for Entrepreneurship is a non-profit NGO, dedicated to the development of entrepreneurship and technological progress. This organization offers the ‘Google Award’ for the best online Jordanian company and the ‘Queen Rania Entrepreneurship Competition.’
The Business Development Center, established in 2005, offers management training, operational support and linkage assistance, in order to further the growth of SMEs.
iPARK is a technology incubator, whose purpose is to offer much needed assistance to technological entrepreneurs and SMEs.
Other SME support centers in Jordan include:
• Industrial Scientific Research and Development Fund • King Abdullah II Fund for Development • MeydanValue@Speed Accelerator • Agro-Industries Business Incubator • the National Consortium for Technology and Business Incubation • Jordan Loan Guarantee Corporation

61
• No comprehensive program affecting business training to SME owners • No defined graduation path for SMEs from incubators
4.1.5 Loan Guarantees Another scheme which is currently available to facilitate SME lending in Jordan is the Loan Guarantee Corporation, which was established in 1994 as a public shareholding company with a capital of JD 7 million. lxxviii The establishment of JLGC came in response to the decision undertaken by the Cabinet of Ministers in 1993, which approved the establishment of a public shareholding company for guaranteeing loans to small and medium sized organizations.
Although the JLGC provides SMEs with guarantees to their loans from commercial banks, the decision to guarantee these loans will be based on sufficient collateral available from the SME. Although the concept is quite good in principal, the implementation is awkward due to many conditions for approval and the limitations on the amount of loans that can be processed.
There are several issues with the JLGC:
• Banks on the JLGC Board of Directors provide a conflict of interest • A disproportionate number of loans are given to agricultural and real estate
companies
Table 23 Loans Covered by the Jordan Loans Guarantee Company
Number of Loans Value of Loans Guaranteed Value 2010 2009 2010 2009 2010 2009
SME Loan Guarantee Program* 804 210 4,203,187 1,643,195 2,919,268 1,194,947 Working Capital Loan Guarantee Program 1 1 215,940 215,940 161,955 169,243 Industrial Loan Guarantee Program 21 12 3,869,500 3,036,500 2,610,650 1,816,600 Leasing Loan Guarantee Program 22 22 4,842,431 7,171,706 2,871,602 3,455,800 Total 848 245 13,131,058 12,067,341 8,563,475 6,636,590
*Includes Cars, Pharmacies, Micro-Financing
Source: “Annual Report” Jordan Loans Guarantee Corporation, 2010
As the table above shows, the number of loans offered in the SME Loan Guarantee Program has increased by almost four fold, between 2009 and 2010, while the value of these loans (as well as the guaranteed value) has increased by over 2.5 times in the same time period. It should be noted that, out of the total loans guaranteed by the JLGC, 94.8% of the loans are dedicated to SMEs, while 32% of the value of the loans are dedicated to SMEs.

62
4.1.6 Other Financial Support Instruments
Jordan Enterprise Development Corporation (JEDCO): A Government entity established in 2003 to facilitate enterprise modernization, including the promotion of efficiency and capacity building in target enterprises. JEDCO’s objective is to enable Jordanian businesses to maximize the benefits of economic and trade agreements signed by the Government, confront the challenges of globalization and penetrate non-traditional markets.
JEDCO with support from the EU has given several rounds of grants to SMEs in the industrial and service sector. 267 companies have benefited from the JSMP (Jordan Services Modernization Program), at JD 9.2 million in direct grants. A new OPIC fund is set to help support SME financing, especially in the governorates surrounding Amman which will receive additional support.
This comes as a response to the Ministry of Planning and International Cooperation (MoPIC) which held a meeting in June of this year to discuss ways to implement a national programme to fund SMEs across the country. The programme, scheduled to start by the end of July and to be implemented by the MoPIC and the Ministry of Industry and Trade, seeks to encourage financial institutions to facilitate loans to SMEs, particularly those in governorates. JEDCO and the OPIC Fund, in conjunction with the European Investment Bank have assisted in the development of two new venture capital funds (one of which is dedicated to ICT). JEDCO assists SMEs in the application process, while OPIC assists in offering guarantees. There has also been a single, unified report designed, for use by SMEs, when completing credit reports and interest rates for loans from these funds have dropped to 7.5%, with a grace period of 2 to 3 years and a loan period of 7 to 10 years.
Lending Program for Jordanian Small and Medium Enterprises: The United States has agreed to offer Jordan 300 million USD, for the purpose of promoting Small and Medium Enterprises in the nation. These funds will be channeled into the ‘Lending Program for Jordanian Small and Medium Enterprises,’ whereby the United States will offer loans to Jordanian SMEs over a 10 year period, at discounted interest rates. The focus of this program will be in governorates where unemployment is a significant problem. In the long term, this project is expected to result in growth in revenue and employment, for the Jordanian economy, especially those areas struggling the most, in economic terms.lxxix
UNIDO Investment Promotion Unit (IPU/ UNIDO): The Investment Promotion Unit, Jordan, assists in obtaining soft loans for Jordanian SMEs from the Italian Government, for the purpose of buying Italian equipment. The amounts offered range from USD 136,000 to USD 2.4 million, at 7% interest for Jordanian SMEs and 6% for Italian-Jordanian ventures (which must be paid back within 7 years in addition to a 3 year grace period).lxxx
4.1.7 SMEs and Interest Rate Structure Among the efforts taken in a bid to ease the credit squeeze on the industrial sector, mainly SMEs, the Central Bank of Jordan (CBJ) announced in June 2011 that it will provide financial

63
institutions with loans at the rediscount rate to relend to industrial firms at a fixed interest rate with a maturity period of five years. Often complaining about high interest rates charged by commercial banks on loans extended to industries, which sometimes reach 10%, the SME sector is in dire need of an industrial development bank with long-term financing plans and reasonable interest rates. SMEs will be able to provide local banks with guarantees worth only 30% of the loan, while before banks used to ask for 100% and sometimes 120% guarantees of the loan value. The two monetary policy tools employed by the CBJ to regulate credit are the discount rate and the reserve requirement ratio. Between January 2004 and June 2011, the Re-Discount Rate, which is defined as the interest rate at which the Central Bank of Jordan charges banks or depository institutions that borrow reserves from it, fluctuated significantly from as low as 2.5% at the beginning of 2004 to as high as 7.5% in June 2006. lxxxi More recently, the Central Bank of Jordan raised its key monetary policy interest rates by 25 basis points between May and June 2011. As a result, the following rates were affected: the overnight deposit window rate increased from 2.00% to 2.25%, the repurchase agreement rate increased from 4.00% to 4.25%, and the rediscount rate went up to 4.5% from 4.25%. In this case, the purpose of the increase in interest rates was to maintain fiscal stability and contain inflation. lxxxii In addition, the required reserve ratio on banks’ deposits, which is the required percentage of reserves (deposits) that banks must hold in cash or in deposits at the CBJ, remained at 8% for almost four years, from January 2004 through June 2008. Reacting to the impending financial crisis of 2008, the CBJ raised the ratio to 9% for the months of July and August in 2008. Thereafter, the CBJ raised the required reserve ratio to 10% for the following two months of September and October, and then reduced it to 9% from November 2008-March 2009. Ultimately, it stabilized at 7% in May 2009. It should be noted that increasing or decreasing reserve ratios is used to help control the money supply. lxxxiii Finally, between 2004 and June 2011, the Prime Lending Rate, which is defined as the rate offered to the most favoured customer, i.e. those with high credibility, varied from a low of 6% in January 2004 to a high of 8.45% in November 2008, as illustrated in the figure below. lxxxiv

64
Figure 18 Re-Discount Rate and Prime Lending Rate in Jordan, 2004-June 2011
Source: Central Bank of Jordan. Statistical Database. Money and Banking: Interest Rates Structure. www.cbj.gov.jo
4.2 Benchmarking As the chart below indicates, as a firm matures and grows, its dependence on bank credit will increase significantly. At the ‘Seed’ stage, bank credit forms a minority of a firm’s capital, while at the ‘start-up’ stage it form’s approximately half the firm’s capital, increasing as a portion of capital, until it becomes a solid majority of a firm’s capital, at the ‘maturity’ stage. Purchaser credit also increases as the firm matures, while venture capital and private equity decline.
Figure 19 SME Financial Supply in Developed Countries versus Developing Countries
0
1
2
3
4
5
6
7
8
9نيلثان انوكا
انيسن
وزتم
ولاال
ن ريتش
نيلثان انوكا
انيسن
وزتم
ولاال
ن ريتش
نيلثان انوكا
انيسن
وزتم
ولاال
ن ريتش
نيلثان انوكا
انيسن
وزتم
ولاال
ن ريتش
نيلثان انوكا
انيسن
وزتم
ولاال
ن ريتش
نيلثان انوكا
انيسن
وزتم
ولاال
ن ريتش
نيلثان انوكا
انيسن
وزتم
ولاال
ن ريتش
نيلثان انوكا
انيسن
2004 2005 2006 2007 2008 2009 2010 2011(%)معدل إعادة الخصم (%)معدل اإلقراض الرئيسي
%

65
4.2.1 International Reports
Global Competitiveness Report
Jordanian SMEs face several problems where access to finance is concerned; access to credit was rated as the second most significant impediment to business growth and competitiveness in Jordan, after government bureaucracy, as indicated by the Global Competitiveness Report 2011 to 2012.
Figure 20 The most problematic factors for doing business in Jordan according to the GCR 2011-2012 Report
Source: “Global Competitiveness Report,” 2011/2012, World Economic Forum
As the chart above shows, 12.8% of respondents consider inefficient governmental bureaucracy to be the greatest hindrance to doing business in Jordan, followed by 12.6% who believe that access to financing is the greatest hindrance.
Table 24 Global Competitiveness Report, Financing Issues
8th pillar: Financial Market Development
Rank/134 (2008-2009)
Rank/133 (2009-2010)
Rank/139 (2010-2011)
Rank/142 (2011-2012)
8.01 Availability of financial services 58* 46 67 59
0 2 4 6 8 10 12 14
Inefficient government bureaucracyAccess to financing
Tax rates Corruption
Tax regulationsPoor work ethic in national labor force
Inadequately educated workforceInflation
Restrictive labor regulationsPolicy instability
Government instability/coupsInadequate supply of infrastructure
Crime and theftForeign currency regulations
Poor public health
Percent of Respondents

66
8.02 Affordability of financial services N/A 58 55
8.03 Financing through local equity market
22 6 33 53
8.04 Ease of access to loans 55 45 52 59
8.05 Strength of Investor Protection 86 90 N/A N/A
8.06 Venture capital availability 51 46 54 62
8.07 Restriction on capital flows 44 31 35 N/A
8.08 Soundness of banks 58 37 51 55
8.09 Regulation of securities exchanges 47 25 29 40
8.10 Legal rights index 52 83 86 89
Source: “Global Competitiveness Report,” 2008/2009-2011/2012, World Economic Forum
*Financial Market Sophistication
As the table above shows, in terms of the availability and affordability of financial services, the ease of access to loans, the soundness of banks, Jordan remains in the ‘50s’ region, between 2008/2009 to 2011/2012, with minor fluctuations in between, thus placing it firmly in the middle of the world, in terms of these indicators. However, in terms of financing through local equity markets, the nation’s rank has seen a significant drop, from 22nd place to 53rd place, in the span of 3 years. This reveals that the ability to raise finance through local channels has been severely curtailed, over the past 3 years, a development from which SMEs will bear most of the brunt.
Venture capital availability has seen a drop of 10 places over the previous three years, again putting significant strain on SMEs. Also, the legal rights index dropped by 37 places, between 2008/2009 and 2011/2012, indicating that the legal framework in which loans are offered has seen a greater level of risk and inefficiency, again decreasing the potential for SMEs to obtain access to capital, in Jordan. Overall, the nation has to overcome significant impediments, if it wishes to provide a sound atmosphere for SME loans.
As the table below shows Jordan’s scores in the availability and affordability of financial services, as well as financing through local equity markets, are slightly above the MENA average. However, the nation has fallen significantly behind the MENA average, in terms of the ease of access to loans, and venture capital availability.

67
Table 25 Global Competitiveness Report, Access to Finance Indicators, 2011 to 2012*
Availability of financial services
Affordability of financial services
Financing through local equity market
Ease of access to loans
Venture Capital Availability
Jordan 4.74 4.38 3.81 2.89 2.67
Algeria 2.72 2.32 2.13 2.43 2.12 Bahrain 6.09 5.79 4.63 4.99 4.17 Egypt 4.4 4.02 4.28 2.69 2.97 Kuwait 4.87 4.59 3.92 3.52 3.42 Lebanon 5.31 4.91 2.66 3.41 2.7 Morocco 4.79 4.45 4.24 3.23 3.26 Oman 4.75 4.92 4.49 3.97 3.85 Qatar 5.58 5.6 5.08 5.27 5.39 Saudi Arabia 5.51 5.35 5.11 4.57 4.18 Syria 3.65 3.51 3.41 2.35 2.15 Tunisia 4.54 4.32 4.38 3.04 3.09 UAE 5.48 5.08 4.21 4.27 3.97 Yemen 2.62 2.53 1.1 1.25 2.59 MENA Average 4.44 4.24 3.70 3.20 3.14
Source: Global Competitiveness Report, 2011 to 2012, World Economic Forum
*Scale of 1 to 7, ‘7’ indicating the best possible score, ‘1’ indicating the worst
Table 26: Doing Business Report, Legal Issues
Strength of legal rights index (0-10)
Depth of credit information index (0-6)
Public registry coverage (% of adults)
Private bureau coverage (% of adults)
2005 4 2 0.5 0 2006 4 2 0.6 0 2007 4 2 0.7 0 2008 4 2 0.8 0 2009 4 2 1 0 2010 4 2 1 0 2011 4 2 1.5 0 2012 4 2 1.6 0
Source: “Doing Business Report,” 2005-2012, World Bank, International Finance Corporation

68
As the table above shows, Jordan has a relatively weak legal rights index, remaining at 4 out of a possible 10, between 2005 and 2012, implying that the legal system is not conducive to dispensing loans. The depth of credit information index has remained at 2 out of a possible 6, between 2005 and 2012, implying that the amount of credit information a bank has access to, when analyzing an individual’s credit worthiness, is limited, again leading to inefficient decisions, such as rejecting the applications of potentially suitable entrepreneurs. The percentage of adults covered by a public registry, has remained minimal, between 2005 to 2012, increasing by only 1.1%. Again, this is a significant hindrance to SMEs obtaining capital, as banks will not have the necessary data needed in order to make informed decisions, and therefore are likely to take the more conservative position, and not offer loans to SMEs.
In spite of a relatively large number of financial support bodies in Jordan, and possibly an over-supply of very small-scale credit through commercial Micro-Finance Institutions, it remains exceedingly difficult for growth-oriented SMEs to access financial support. This is mainly due to the fact that most of the available financing mechanisms are the traditional ones channeled through the commercial banking sector.
The ‘Doing Business Report’ (of the World Bank) shows that only 1.5% of Jordan’s population is covered by the Credit Rating Bureau, within the Central Bank.
Table 27 Benchmarking Jordan, Doing Business Report
Region or Economy Credit Information Index*
Public registry coverage (% adults)
Private bureau coverage (% adults)
East Asia & Pacific 2.6 7.0 28 Europe & Central Asia 4.2 11.9 35.5 Latin America & Caribbean 3.3 10.1 31.5 Middle East & North Africa 3.4 5.0 11.3 OECD 4.8 8.5 58.5 South Asia 2.1 0.8 3.8 Sub-Saharan Africa 1.7 2.7 4.9 Egypt 6 2.9 10.3 Finland 5 N/A 14.9 Ireland 5 N/A 100 Israel 5 N/A 88.2 Jordan 2 1.5 N/A Lebanon 5 8.7 N/A Oman 2 19.6 N/A Saudi Arabia 6 N/A 18 Syria 2 2.2 N/A Tunisia 5 22.9 N/A United Arab Emirates 5 8.4 17.7

69
West Bank and Gaza 3 5.6 N/A
Source: “Data Indicators,” World Bank, 2011, Retrieved from http://data.worldbank.org/indicator/IC.CRD.INFO.XQ
*Scale of 0 to 6, with 0=Worst and 6=Best
One method to increase Jordan’s rather low score (of ‘2’ out of a possible ‘6’), in terms of a Credit Information Index, is the development of a solid credit rating system, which will dramatically improve such factors as lending, purchasing on credit, the levels of collateral needed for loans and minimum capital needed for forming an enterprise.
The absence of solid credit markets in Jordan will hinder economic growth, to a great extent, as entrepreneurs cannot ascertain the loans they require in order to form their businesses.
4.2.2 Experience of Other Nations Managing SME Debt: The Indonesian Rakyat Bank, contains a ‘Unit Desa Division,’ which is charged with formulating a national microfinance portfolio (in 2004 31.3 million people were saving money in the bank, at average accounts of USD 108, and 3.2 million individuals were borrowing from the bank, the average amount being USD 540). It should be noted that the Bank managed to transform itself from a national, government subsidized bank into a successful commercial bank by offering financial products that were in high demand, such as passbook savings accounts, minor loans and demand deposits. It transformed each of its 3,600 branches into profit making divisions, each performing to specific standards, measured partially with individual financial accounts and statements. By 2004, the micro banking initiative had earned USD 233 million worth of profits (before taxes), with returns on assets of 6.8%. The Bank ensured compliance with its policies through a variety of measures: denying access to credit for those not repaying their debt, while offering refunds (of up to 25% of interest) for those who consistently pay back their debts on time. Loan officers are offered incentives, for effectively developing and managing efficient portfolios. A loan officer will manage 400 borrowers, a teller will manage 6000 accounts and administrative costs will amount to 8% of the average loan portfolio (which is an improvement over the industry’s average of 10% to 20%). The Desa Division amounts to 25% of the Bank’s assets, as well as 15% of its loan portfolio and 70% of its savings.lxxxv Bank Representatives from the Community: The Agricultural Bank of Mongolia hires loan officers specifically from the respective communities they will be responsible for, thus being able to utilize a deeper understanding of the nature and needs of the community. The bank therefore places greater emphasis on the opinions and analysis of the loan officers, rather than the collateral offered. The bank also uses relatively flexible definitions for the term ‘collateral’. The Wells Fargo Bank in America utilizes a more information and data intensive method of providing capital to SMEs. By utilizing a solid credit scoring model, which continually receives updates regarding the variables affecting each customer’s loan and ability to repay that loan, such as the number of commitments, accounts and financial assets he/she has. This model even allows the bank to accept applications for loans by phone or telephone. This system allows the Bank to process loan applications automatically (at two thirds of loans), giving it the lowest processing costs per loan in the banking sector,

70
at USD 30 per loan). It has expanded to become the largest bank directly serving SMEs in America (measured by the value of loans, USD 6.3 billion as of 2004). lxxxvi Efficient technical assistance can improve the performance of banks, with respect to SMEs, significantly. These include, but are not limited to: hiring international consulting experts, offering training programs market assessments, risk management and developing the capacity of the banks’ SME divisions. Productive Chain Program: The government owned Nacional Financiera of Mexico formulated a productive chain program, in order to connect large, trustworthy firms (in terms of paying back credit) with smaller, more risky SMEs, which usually cannot obtain access to finance. This program contained 190 large firms, along with 70,000 SMEs, with twenty local banks acting as the finance conduits. Since the beginning of the program in 2001, the program has resulted in USD 9 billion being offered to SMEs (along with increasing revenues for the bank, from a deficit of USD 429 million to a surplus of USD 13 million). The Bank also allows customers to perform transactions online; the bank’s website has a page specific for each buyer, with smaller suppliers agglomerated into chains in conjunction with bigger buyers. lxxxvii Leasing: Another method of assisting SME access to capital is through leasing. This is a process whereby one party offers an asset for use by another party, for a certain period of time, for which the first party receives fixed payments. This is usually a medium term method of paying for an asset (such as machinery or other fixed capital). This concept focuses on the lessee’s capability to earn enough revenues in order to consistently pay the installments on the lease, as opposed to examining a firm’s assets or credit history, which makes it quite suitable for SMEs (which frequently have few assets or weak credit histories). In Serbia, efforts are being made to implement the concept of leasing. For example, international consultants from the IFC have engaged in assessing the market for leasing, developing a leasing law, developing training programs, creating awareness campaigns and establishing a ‘National Association of Leasing Companies.’ The IFC’s efforts resulted in the passing of a law, whereby lessors would be able to repossess assets, if they were not offered payments within 6 days. Reinterpreting BASEL: As a result of significant lobbying, various Business Associations throughout Europe have succeeded in implementing changes in the BASEL II Agreement (June 2004), in favor of SMEs. The changes accept more realistic assumptions, regarding the risk levels of offering credit to SMEs; the changes also allow for more room for adjustments, regarding the various national legal structures and regional economic situations. The main purpose of such changes is to offer financial markets the flexibility needed to allocate credit efficiently and cost-effectively, therefore making credit more accessible for SMEs. Internal Rating Diagnostics: As a result of the recent economic crisis, banks have become much more cautious in offering loans, throughout the world. One consequence of this caution is increasing numbers of SMEs being required to perform internal rating diagnostics or obtain credit scores, in order to ascertain loans from banks. Banks will need increasing quantities of information, in a more detailed manner, in order to minimize risk from their points of view. This has led to a backlash, whereby European SMEs, and their respective lobbies, are insisting on transparent rating methodologies from the banks. There is lobbying underway, to ensure that banks consistently and effectively communicate the

71
components of their assessment criteria (as well as the results of each assessment), for SMEs.
4.3 Gap Analysis
Debt-Equity: As venture capital is currently quite expensive, SMEs should be given the option to obtain funds via a combination of debt and equity.
Credit Rating Improvement: Among the obstacles SME owners face, in accessing capital, are the lack of legal institutions capable of reporting a firm’s credit history to relevant parties, as well as the weak structure for movable collateral. The advantages in having a credit bureau are numerous, including the increased potential access to capital, for SMEs. Presently, the Jordanian Central Bank only stores credit data on loans amounting to over 30,000 JD. Such data is managed and accessible to banks only. This institution does not act as a Credit Bureau. A recent survey has shown that one of the primary reasons banks are unwilling to offer loans to SMEs is the fact that SMEs do not have a credit history (as most of their loans are below 30,000 JD).lxxxviii
Diversification of Bank Products: This reveals a need, on the part of the Jordanian financing sector, to diversify its financial products, to bring increased innovation into their finances and to increase technical assistance (for example, by offering mentorship) to SMEs. There is also a need to unify the products available to facilitate the comparison. The Association of Banks is working on a product like this.
Reforming Collateral Legislation: SMEs can more easily access capital in developed nations, than in developing nations, due to the existence of clearly defined laws and regulations, governing the rules of collateral and default. When laws are not clearly defined, and rules regarding collateral and defaults are ambiguous, then the resulting confusion will increase inefficiency, and reduce SME access to capital, as is the case in Jordan. The rules for utilizing moveable capital as collateral in the nation are indeed ambiguous. Thus, SMEs are hindered from obtaining the necessary finance needed to raise their stocks of capital, machinery, or some other form of expansion. Without legal reform, the demand for loans, among SMEs, will continue to be far greater than the supply.lxxxix
Facilitating Environment for Moveable Assets: At present, SME owners can obtain loans by offering collateral, principally in the form of immovable property and vehicles. However, the majority of SMEs and SME owners do not possess enough immovable property for use as collateral. A recently conducted survey has shown that, of loans utilizing only one type of collateral, the vast majority are composed of immovable assets (principally real estate), and a minority used vehicles as collateral. There was no record of movable assets (such as inventory or equipment) being utilized as collateral. This underscores the fact that, should an SME wish to obtain a loan in Jordan at the present time, it will need to possess a substantial amount of immovable assets, as movable assets are unlikely to be considered to

72
be sufficient capital. The reason banks prefer immovable, as opposed to movable, assets include the facts that immovable assets are easy to identify and trace, and that banks will be able to exert greater control over this loan. Whereas movable collateral is difficult to identify, trace and it is easy for the borrower to sell movable collateral, relatively undetected.xc Within Jordan, there is currently no ‘register of pledges’ which may assist in reducing assessment costs for SME loans.
Making Banks More Efficient: The dominance of the banks, in terms of settlement systems (as well as the excessive barriers to entry within the banking system and the widely varying practices of banks, in terms of disclosing their rates) also hinder access to capital, for SMEs.
Make Obtaining a Loan Easier: There are widely varying formats, amongst Jordanian banks, regarding the costs of capital. Some countries mandate an over-arching, unified format for such costs, making comparison across capital providers easier.
Initial Studies: There is little information regarding the quantity and types of data of SME repayments, within the nation, and the small amounts of data existing on this topic are not disseminated across Jordan (should this happen, perceptions of the inherent risk of lending to SMEs would be reduced).
Excessive Paperwork Requirement: Banks require excessive paperwork, frequently which SME owners are unprepared for. High Interest Rates: Interest rates reach up to 11-12%, which is exorbitant for many SMEs. Grace and Payback Periods: Grace periods for loans are rare, and when they are offered, it is rarely for any period over nine months. The time given by a bank to repay the loan is typically too short for an entrepreneur to pay back the entire loan (in some cases being only five years). Loan Guarantees: It should be noted that the JLGC is managed and run by banks, which results in a conflict of interest, regarding its official mandate (with the Corporation’s mandate being to assist development, whereas the banks’ mandate is to increase profits). This results in the Corporation’s loans going to other large or very large companies. Assisting SMEs: The majority of capital within Jordan is not ‘smart capital.’ This shows that there is no targeting, within the banking sector, of such investment, thus leaving a large portion of SMEs at a disadvantage.
Making Banks More Efficient: Within Jordanian banks, loan officers are not trained in various forms of technology and software use, implying that the measures they use to determine which firms get loans are, to a significant extent, obsolete.

73
Table 28 Comparison between the UK and lower income countries in respect of Finance for SMEs
Small firms in the UK Small firms in Jordan • Small businesses have depend to a
significant degree, on short-term credit from the banking sector
• Small companies depend on both formal and informal credit for short-term financing
• A relatively limited percentage of small firms' capital is obtained via shareholders; so debt-to-equity ratios are relatively greater compared to larger companies
• Relatives, friends and associates comprise a significant portion of SME capital and funding.
• Fixed assets are not a vital component of the balance sheets of small companies
• Not confirmed
• The credit and debt history of the company is significant • Not confirmed
• Recently, practices such as leasing and venture capital have increased in usage
• Not confirmed
• Smaller businesses have greater transaction costs than larger companies
• Established
• Small businesses have greater informational asymmetries than larger companies
• Established
• Small companies have weak business planning, a dearth of inter-business assistance and more significant transaction costs than larger companies
• Far more significant in Jordan, especially with regards to financial accounting and operations
• Small companies have weak relations with financial entities
• Very weak relations with financial entities.
In summary, the excessive risks involved in lending to SMEs (due to informational asymmetries, exorbitant transaction costs, lack of awareness regarding the potential benefits of lending to SMEs, lack of history in dealing with SMEs and non-uniform credit scoring systems) have denied Jordanian SMEs a vital source of capital, except for those with sufficient collateral. Other sources of capital, while existent, are minimal and have limited budgets.
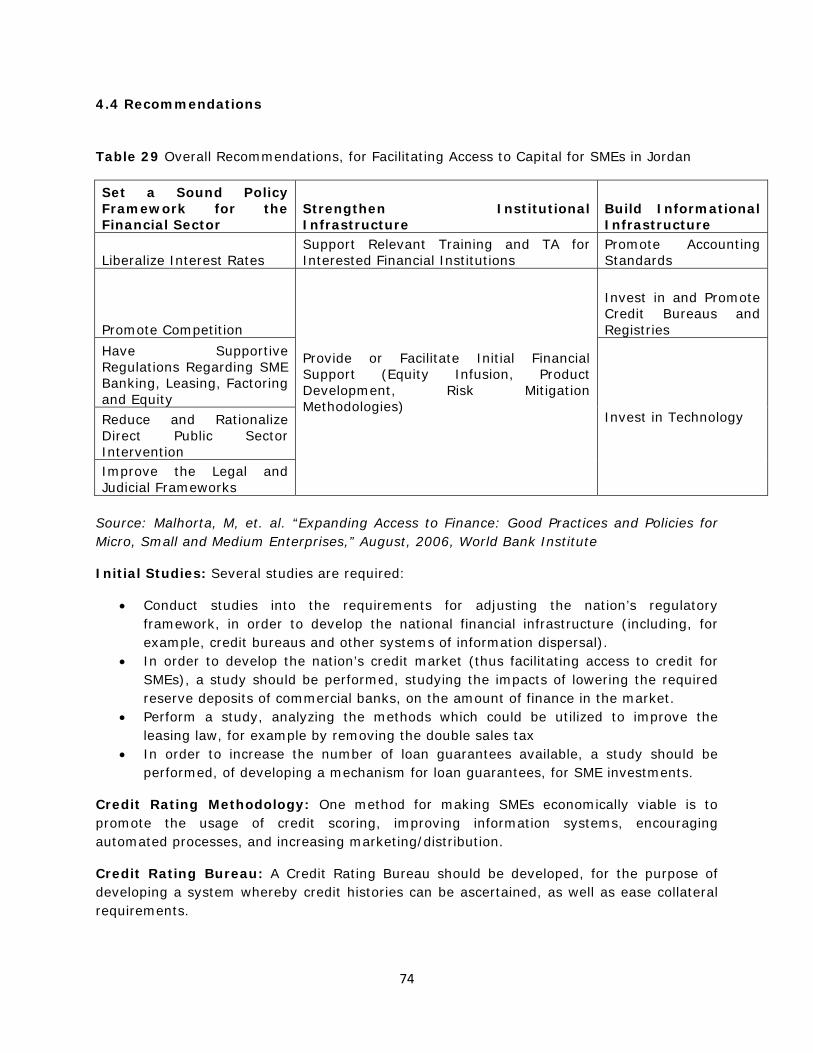
74
4.4 Recommendations
Table 29 Overall Recommendations, for Facilitating Access to Capital for SMEs in Jordan
Set a Sound Policy Framework for the Financial Sector
Strengthen Institutional Infrastructure
Build Informational Infrastructure
Liberalize Interest Rates Support Relevant Training and TA for Interested Financial Institutions
Promote Accounting Standards
Promote Competition
Provide or Facilitate Initial Financial Support (Equity Infusion, Product Development, Risk Mitigation Methodologies)
Invest in and Promote Credit Bureaus and Registries
Have Supportive Regulations Regarding SME Banking, Leasing, Factoring and Equity
Invest in Technology Reduce and Rationalize Direct Public Sector Intervention Improve the Legal and Judicial Frameworks
Source: Malhorta, M, et. al. “Expanding Access to Finance: Good Practices and Policies for Micro, Small and Medium Enterprises,” August, 2006, World Bank Institute
Initial Studies: Several studies are required:
• Conduct studies into the requirements for adjusting the nation’s regulatory framework, in order to develop the national financial infrastructure (including, for example, credit bureaus and other systems of information dispersal).
• In order to develop the nation’s credit market (thus facilitating access to credit for SMEs), a study should be performed, studying the impacts of lowering the required reserve deposits of commercial banks, on the amount of finance in the market.
• Perform a study, analyzing the methods which could be utilized to improve the leasing law, for example by removing the double sales tax
• In order to increase the number of loan guarantees available, a study should be performed, of developing a mechanism for loan guarantees, for SME investments.
Credit Rating Methodology: One method for making SMEs economically viable is to promote the usage of credit scoring, improving information systems, encouraging automated processes, and increasing marketing/distribution.
Credit Rating Bureau: A Credit Rating Bureau should be developed, for the purpose of developing a system whereby credit histories can be ascertained, as well as ease collateral requirements.

75
Increase Loan Guarantee Programs/Revamp JLGC: Undertake studies into providing extended loan guarantee programs to SMEs, either through restructuring and expanding the JLGC or forming reasonable alternatives. The JLGC should re-focus its energies in terms of providing loans, as well as take an active part in reducing impediments to SMEs obtaining finance.
Training from Bank Association: The public sector should also conduct studies into the spreading of knowledge and data regarding best business practices to SMEs and banks. It should also conduct a study into helping banks with financial decision making, risk management, developing systems of storing and transferring data on credit history and efficient market systems. Possible methods for training banks how to identify their target markets and how to tailor their products specifically towards them, especially with regards to Jordanian SMEs.
Electronic Dissemination of Information: Perform a study into the requirements for creating an institutional environment for sending payments electronically, internet banking and trading, as well as the dissemination of credit information. This should be done in addition to performing a study into the necessary requirements for an online credit information system, including scores and ratings.
Make Obtaining a Loan Easier: Another step in making the financial system more SME friendly is to make the process of obtaining a loan easier and more efficient. Training to upgrade SME rating within banks should be undertaken. This should be done in conjunction with best practices pertaining to credit analysis appraisal and rating methodologies, thus ensuring that banks have the data needed to make an informed decision, regarding lending to SMEs.
Study Compliance Issues: The public sector should also conduct a study into the areas which SMEs find most difficult to perform their finance compliance tasks, and utilize such data in order to implement SME friendly accounting and reporting conditions from banks.
Making Banks More Efficient: The public sector should also conduct a study regarding what is required to improve the skill levels of the bank personnel dealing in SME lending. This could include studying the requirements to developing training programs, for teaching bank personnel how to properly evaluate SME lending risk.
Assisting SMEs through Consultancies: A study should be performed, into the possibility of developing links between SMEs and consulting firms or development organizations, in order for such organizations to assist SMEs in developing suitable business plans, so that banks may obtain a better understanding of the SME and lower collateral constraints.
Expanding Existing Banking Facilities: In order to increase the number of lending firms in the economy (as well as the number which consider lending to SMEs to be economically feasible), the government should study the viability, requirements and potential impacts of developing ‘second-tier’ banks (for example, in addition to the primary ‘core banks’, on the periphery there will be cooperative banks). By developing such banks with limited mandates (and therefore compliance costs), lenders more suited to SMEs may emerge.The government should also study the possibility of increasing the number of ‘common bond

76
institutions’ (such as cooperatives and village banks).Within any study is a government review of its definitions of ‘banking business’ and ‘deposits’ in order to increase the number of lending institutions which are not necessarily banks
Encouraging Venture Capital Funds: One necessary step is to encourage venture capital funds. This is an especially challenging task, within a developing nation such as Jordan. However, while challenging, this task is not insurmountable. One possible action which could be taken involves lobbying the Ministry of Finance, in order to draft a law facilitating the growth of venture capital funds. This law could include the following features:
Exempting all investments into venture capital entities, from a firm’s taxes; Requiring venture capital firms to invest in new firms for a certain period (typically
no longer than five years); Ensuring that a certain portion of the fund’s investments go towards high priority
sectors (for example, exports); and Ensuring that such Bodies are subject to consistent regulation and oversight by a
governmental committee.
Develop Public Funds: Another necessary step is to study the possibility of developing a public fund, with the specific intention of promoting venture capital, with a set budget (of approximately JD 30 million).
The entrepreneur will pay back the amount borrowed from the fund, at low interest rates (for example 3%).
The actual evaluation and recommendations regarding potential projects will be conducted by a venture capital investment firm.
Investment into each firm should not exceed a certain limit.
The above is already being considered by JEDCO.
Incentives to Encourage a Public-Private Fund: Another step which should be taken is to study the possibility of offering incentives in order to develop a public-private venture fund, specifically for SMEs.
Incentives to Investors: The government should study the possibility of adjusting legislation, so that institutional investors may invest more funds in venture capital and SMEs with additional tax credits. The government should also study the implications of tax incentives for angel investments.
SME Capital Task Force: The government should also study the possibility of the development of a task force, designed to facilitate debt financing to SMEs. This task force would be charged with a variety of responsibilities, including:
The monitoring of interest rates to SMEs, as well as the prevention of usury Increase access to information, for both creditors and debtors Develop security legislation Improve access to finance for Non-Bank Financial Intermediaries Monitoring and regulating competition within the finance sector

77
Development Investment Bank: Study the possibility of forming a development investment bank, specifically for SMEs, in Jordan. This bank will focus on methods and procedures directly suited to SMEs, support with feasibility studies and cater loans for specific SME needs and suitable rates.
SME Bourse: Study the possibility of implementing an SME bourse (that is a stock market meant specifically for SME capital raising), such as the one currently in place in Egypt.
BASEL Laws and Standards: Perform a study of the understanding of banks, with respect to BASEL laws and standards, as banks frequently misunderstand these provisions, thus limiting the amount of capital in the economy.
Upgrade Bank SME Divisions: While some banks do have a specific division for SMEs, these are rarely utilized, as banks still prefer to deal with larger firms.
Securitization Law: The securitization law should be updated, in order to be more responsive to modern needs.
Equity Finance Instruments: Instruments to be used for ensuring guarantees, regarding equity finances, should be researched and further developed (for example, tax credits).
SME Training: SME accounting methodologies should be improved, in order to facilitate transparency between the investor and entrepreneur, this may be done through training.
‘Secured Transactions Law’: The transaction law should include:
Developing a central registry for moveable assets Conducting a study, into the potential implications on current financial transactions,
of such a law Ensuring that measures for protecting consumers are in place Provide specific definitions for such terms as ‘finance’ ‘collateral’ and other financial
terminology. Study how the law will affect loans within Sharia’h law How the law will impact transactions based on ‘pledges’ How the various rights of debtors and creditors are affected Contingency measures, in the event of a borrower default Study the possibility of forming a pledge registry.
Developing a Cadastre (Pledge Registry): This registry will allow both parties (debtor and creditor) to formally establish a record which will act as evidence of an agreement, regarding moveable assets as collateral. By creating this registry, a creditor can register his/her stake in the moveable assets (collateral). The registry will contain such details as the names of the primary stakeholders (creditor and debtor), the maximum amount of debt to be included, and a general description of the collateral.
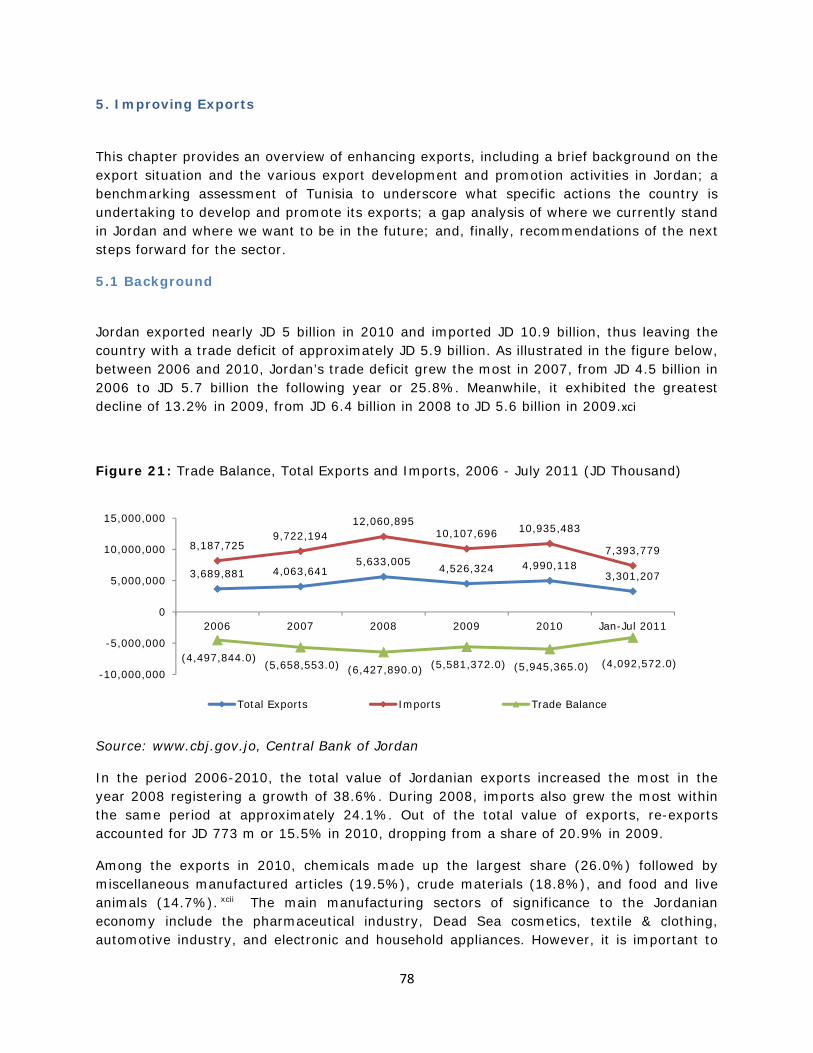
78
5. Improving Exports
This chapter provides an overview of enhancing exports, including a brief background on the export situation and the various export development and promotion activities in Jordan; a benchmarking assessment of Tunisia to underscore what specific actions the country is undertaking to develop and promote its exports; a gap analysis of where we currently stand in Jordan and where we want to be in the future; and, finally, recommendations of the next steps forward for the sector.
5.1 Background
Jordan exported nearly JD 5 billion in 2010 and imported JD 10.9 billion, thus leaving the country with a trade deficit of approximately JD 5.9 billion. As illustrated in the figure below, between 2006 and 2010, Jordan’s trade deficit grew the most in 2007, from JD 4.5 billion in 2006 to JD 5.7 billion the following year or 25.8%. Meanwhile, it exhibited the greatest decline of 13.2% in 2009, from JD 6.4 billion in 2008 to JD 5.6 billion in 2009.xci
Figure 21: Trade Balance, Total Exports and Imports, 2006 - July 2011 (JD Thousand)
Source: www.cbj.gov.jo, Central Bank of Jordan
In the period 2006-2010, the total value of Jordanian exports increased the most in the year 2008 registering a growth of 38.6%. During 2008, imports also grew the most within the same period at approximately 24.1%. Out of the total value of exports, re-exports accounted for JD 773 m or 15.5% in 2010, dropping from a share of 20.9% in 2009.
Among the exports in 2010, chemicals made up the largest share (26.0%) followed by miscellaneous manufactured articles (19.5%), crude materials (18.8%), and food and live animals (14.7%). xcii The main manufacturing sectors of significance to the Jordanian economy include the pharmaceutical industry, Dead Sea cosmetics, textile & clothing, automotive industry, and electronic and household appliances. However, it is important to
3,689,881 4,063,6415,633,005 4,526,324 4,990,118
3,301,207
8,187,7259,722,194
12,060,89510,107,696 10,935,483
7,393,779
(4,497,844.0)(5,658,553.0) (6,427,890.0) (5,581,372.0) (5,945,365.0) (4,092,572.0)
-10,000,000
-5,000,000
0
5,000,000
10,000,000
15,000,000
2006 2007 2008 2009 2010 Jan-Jul 2011
Total Exports Imports Trade Balance

79
note that the manufactured goods focus on basic items and thus create very little value added for the end export product. As for imports in 2010, machinery and transport equipment constituted the largest share (22.8%) followed by mineral fuels and lubricants (22.3%) and manufactured goods (17.1%). xciii
Jordan’s first investment law, which was enacted in 1995, allows exporters to be exempted from customs duties on imported raw material and intermediate goods required for the production of exportable products. Profits acquired through exports are exempted from income tax payment. Goods imported to and/or exported from free zones are exempt from import taxes and customs duties, with the exception of goods released to the domestic market. Industrial goods manufactured in free zones enjoy partial customs duties exemption once released to the domestic market, depending on the proportion of the value of local inputs and locally incurred production costs. Jordan Enterprise Development Corporation (JEDCO)
In Jordan, the body in charge of promoting exports of SMEs is the Jordan Enterprise Development Corporation (JEDCO), which has a clear commitment to enhance the Jordanian economy. JEDCO’s strategic objectives are to increase competitiveness of the SMEs in industrial, services and agriculture sectors, participate in the development of national exports, develop and support entrepreneurship and innovation, and identify and manage the sources of funding. Export Development Activities As part of its partnership with the European Union (EU), JEDCO is implementing two programmes funded by the EU:
• Jordan Services Modernisation Programme (JSMP), aimed at developing Jordan’s
service sector, offers a variety of grants and support services to Jordanian service-sector companies, targeted at enhancing human capital skills, increasing competiveness, creating new domestic opportunities, and increasing exports into global markets.
• Support to Enterprise & Export Development Programme (SEEDP/JUMP II), which offers grants for the development of agro industry and industrial sectors in Jordan, aims to enhance the competitiveness of small and medium enterprises working in such sectors, while additionally creating new domestic opportunities to help Jordanian companies expand into international markets.
Policy Support Activities
• Leverage international trade blocks / agreements: enhance market access based on
proactive and innovative management of current or emerging world economic / trading blocks and bilateral trading arrangements
• Adopt the national export strategy • Coordinate efforts of all organizations involved in implementing the strategy • Monitor the implementation of the strategy • Signing new agreements with potential export countries

80
• Maximize the benefits of existing trade agreements Financing Activities Financing is a pillar of competitiveness that is complementary to grant and technical assistance support. JEDCO aids start-up and existing SMEs to:
• Raise credit or a term loan from banks • Improve its financing structure • Better interact with banks and financial institutions • Access equity financing • Manage its collateral and access guarantees
Export Promotion Activities JEDCO seeks to use cutting-edge tools and technologies, as well as international best practices, to promote Jordanian firms and their exports through the following ways:
• Organizing and participating in trade shows, trade delegations and exhibitions in selected countries
• Organizing trade visits for incoming and outgoing trade missions • Identifying trade opportunities and communicating them with potential Jordanian
companies to work with • Developing and enhancing ties with business support organizations to help create
partnerships between Jordanian private sector and their counterparts • Conducting awareness campaigns and seminars to promote Jordanian exports • Providing assistance for visiting Jordanian businessmen • Bolstering ties with international trade organizations in the countries that Jordan
signed trade agreements with • Providing a huge database of resources, including: Importers/Exporters directory,
country briefs, sector information, market information and research, industrial studies, export opportunity reports, product surveys, trade analyses, trade agreements, trade tools and statistics, publications, and access to several subscribed databases.
• Utilizing Export Finance Schemes of the Islamic Development Bank (IDB), Export Credit Guarantee Scheme of the Inter-Arab Investment Guarantee Corporation (IAIGC).
• Designing and organizing human resource development and training programs for staff and exporters on international marketing, promotion, EU Partnership agreement, WTO agreement, technical requirements in export markets, management systems, e-commerce, information technology, and industrial design.
Jordan Loan Guarantee Corporation
In addition, the body that assists in the extension of loans and/or credit is the Jordan Loan Guarantee Corporation (JLGC). One of the main objectives of JLGC is to encourage banks to lend to newly established, small to medium sized, industrial and service businesses or to ease the development of existing, similarly sized enterprises. JLGC provides financing to SMEs through its Loan Guarantee Program and Credit Guarantee Program. JLGC does not however actually grant loans directly to projects, but rather facilitates the opportunity for the borrower to get the appropriate credit necessary for an export-related project through

81
participating banks at the prevailing interest rate. No extra cost is carried by the borrower as a result of JLGC guaranteeing their credit risks.
Loan Guarantee Scheme for Small & Medium Size Enterprises (SMEs):
• Guarantees intended for small & medium-sized productive projects, owned by private sector in Jordan, with a labor force not exceeding 50 employees.
• Intended for new projects or expansion / modification of existing ones. • 75% guarantee of outstanding balance for all types of loans up to JD 40,000. • 50% guarantee on loans in range of JD 40,000-100,000. • Loans in excess of JD 100,000 may be partially guaranteed. • Loan period cannot exceed 6 years, including a 1 year maximum grace period. • Participating bank is assigned a 1.5% charge on the total ceiling for guarantees
allocated to that bank.
According to a questionnaire-based survey, which was conducted and distributed to Jordanian manufacturing SMEs using random sampling, according to Jordanian SMEs’ perception towards external export barriers, lack of Jordanian government export incentives ranked very high. This barrier can largely explain why current exporters are not exploiting their full potential in the international markets and why non-exporters are not engaged in exporting at all.
5.2 Benchmarking
As Tunisia is considered one of the most competitive economies in the Middle East and North Africa (MENA) region, it acts as a benchmark for other countries to follow. Tunisia’s unique economic growth in the last decade was the result of the government’s economic strategy leading it to have one of the highest standards of living on the entire continent. The GDP at constant prices of Tunisia grew at 7.74% between 2008 and 2010, reaching USD41.383 billion in the year 2010. Although falling in 2009, Tunisia’s exports grew to approximately USD16 billion in 2010. Table 30 Macroeconomic Indicators of Tunisia, 2008-2010
Economic Indicators 2008 2009 2010 GDP at constant prices (USD billion)
35.651 39.007 41.383
GDP at current prices (USD billion)
37.942 40.3334 43.494
Trade deficit (USD billion)
4.532 4.398 5.694
Total exports (USD billion)
16.190 13.335 16.109
Total imports (USD billion)
20.713 17.724 21.792

82
Source: Central Bank and National Institute of Statistics, 2008-2010
Exports in Tunisia are dominated by the hosiery clothes sector followed by crude petroleum, electric cable and finally olive oil, as illustrated in the table below.
Table 31 Main Exports (Million Dinars) in Tunisia, 2007-2009
Sector 2007 2008 2009 Hosiery Clothes 4,522.70 4,563.70 4,172.10 Crude Petroleum 2,631.80 3,218.80 2,093.30 Electric Cable 1,003.10 1,254.10 1,353.50 Olive Oil 696 759.1 533.4 Shoes and Leather Items 606 619.1 564.7 DAP 508.6 1,074.30 502.2 Cloth 505.4 455.2 412.2 Phosphoric Acid 343.9 887.2 418 Super Phosphate 324.9 767 377.6 Sea Products 232.8 237.6 181.9 Dates 211 209.2 237.7 Ceramics 91.4 93.2 108.1 Crude Phosphate 71 180.5 54.9 Waste Paper 17.3 17.2 7.8 Citrus Fruits 13.6 24.9 21.5 Craftsmen Carpets 2.4 2.8 2.6 Source: Agency for the Promotion of Industry and Innovation - October 2011.
One of Tunisia’s key economic developments that ultimately led to the rise in exports was the signing of the Association Agreement with the EU (AAEU) in 1995. This agreement led to the liberalization of trade relations through a reduction of several trade barriers, thus culminating in free trade for industrial goods in 2008, and the enhancement of financial and technical cooperation. Moreover, a national industrial restructuring program, the Mise à Niveau, was introduced to enhance the productivity of Tunisian businesses and competitiveness of firms to prepare them for the global marketplace. The result of the upgrading program featured a participation of 4,428 beneficiary enterprises (85% of companies employing 20 persons and more), an investment of € 2,660 million, and a grants/national fund through Funds for the Development of Industrial Competitiveness (FODEC) of € 372 million of which:
• Material investment activities (supported by 10% to 20%) • Immaterial investment activities (supported by up to 70%)

83
Table 32 Mise a Niveau Results, 1995-2009
Indicators \ Annual 1995 2009
Industrial Exports to the EU 4.5 million TD 18.7 million TD
Number of SMEs (employees>=10) 2,000 5,747
Number of Employees 236,000 488,000
Number of Companies in the Partenariat International (International Partnership)
1,420 2,324
Share of Industrial Exports 12% 25%
Number of Certified Companies 6 1300
Source: Programme de Mise à Niveau website http://www.pmn.nat.tn/cadre-du-pmn/cadre-general Tunisia's industrial sector is comprised of 5,786 enterprises having 10 or more employees, of which 2,783 are totally exporting enterprises. Table 33 Number of Industrial Enterprises by Sector, 2011
Sector Totally Exporting
Other Totally Exporting
Total Share (%)
Manufacture of food products 184 843 1,027 17.7%
Manufacture of construction products, ceramic and glass
27 424 451 7.8%
Manufacture of mechanicals and basic metals
189 430 619 10.7%
Manufacture of electric and electronic equipment
246 130 376 6.5%
Manufacture of chemicals and chemical products
124 387 511 8.8%
Manufacture of textile and wearing apparel
1,697 314 2,011 34.8%
Manufacture of wood and wood products
32 167 199 3.4%
Manufacture of leather and footwear
219 72 291 5.0%
Other manufacturing 65 236 301 5.2%
Total 2,783 3,003 5,786 100% Source: Agency for the Promotion of Industry and Innovation - October 2011.

84
Export Development and Promotion Activities The Tunisian export promotion policy is mainly the responsibility of two ministries:
• The Ministry of Industry, Energy and SME is in charge of the Industrial Upgrading Programme (PMI). The aim of this programme is to strengthen the competitiveness of manufacturing firms and related services. The Ministry developed programs and financial incentives oriented toward export development and promotion. The two main funds are FODEC (Competitiveness Development Fund) and FOPROHOC (a new fund for the promotion of conditioned and packed olive oil). FOPROHOC offers subsidies of up to TD 70,000 (USD58,000) annually on investments in the sector.
• The Ministry of Trade and Crafts is in charge of the Export Development Programme (PDE). CEPEX (Center for Export Promotion) at the Ministry is in charge of export promotion, which provides two main sources of incentives and subsidies: FOPRODEX (Export Promotion Fund), which is funded by the government, and FAMEX (Market Access Facilitation Fund), which is financed through a USD10 million World Bank loan. In addition to these schemes, there is FGEAE, a guarantee fund for exports.
The aforementioned ministries work in parallel with the Agency for the Promotion of Industry (API) and Innovation, which is a public establishment created in 1973 under the control of the Ministry of Industry, Energy and SME; API is responsible for implementing the Government’s policies on the promotion of the industrial sector and provides a support structure for companies and promoters. Moreover, API and the ministries offer Tunisian exporters several incentives to encourage firms to export and to compete internationally. These incentives include grants, subsidies, loans, and tax breaks and deductions. Moreover, API delivers several services, which are organized into five intervention centers, one if which is specifically targeting SMEs:
1. Center for Opportunities and Benefits Management (CFGA) is responsible for facilitating all administrative procedures related to company incorporation and managing the incentives provided under the Investment Code and the Fund for Industrial Promotion and Investment (Fonds de Promotion et de Décentralisation Industrielle, FOPRODI). The “Guichet Unique” is a one-stop shop that ensures rapid procedures (24 hours to set up a new company).
2. Center for Studies and Industrial Prospective (CEPI) is responsible for the organization of national seminars and the development of several studies including the strategic positioning of certain industrial branches, horizontal studies on the industrial environment, and sectoral monographs of the Tunisian industry.
3. Industrial Documentation and Information Center (CDII) offers statistical data and information on Tunisian enterprises, through sectoral directories, CD-ROMs, and access to both an online industrial database and the “Virtual Exhibition of the Tunisian Industry”, an electronic platform where more than 4,500 companies are registered.
4. Company Creation Support Center (CSCE) provides direct assistance to project promoters in the form of organizing training courses, analyzing projects, and offering logistical support, intermediation and follow-up with other relevant

85
institutions. The Centre helps 150-180 promotes each year, on average, to establish very small enterprises (5-7 workers, 100,000 Tunisian Dinars – around USD71,400) both in the manufacturing sector and in the services linked to industry; it also offers these enterprises business incubation services and facilities.
5. Support Center For Small and Medium Size Industry (CAPMI) is the only center officially assigned to the provision of specific services to SMEs in the manufacturing sector through the activities of two specialized agencies:
a. “Task Force PMI” is an agency that brings together the skills of several national and international institutions with the aim of offering the SME sector a specialized support service; and offers technical assistance through preparation of the diagnostic plan and Mise a Niveau plan, which is then submitted to pertinent authorities.
b. “Bourse Nationale de Sous-Traitance et de Parternariat” is an institution created in the UNDP-UNIDO framework to establish a network of subcontracting support agencies in the Arab region. It promotes and supports sub-contracting and industrial partnership opportunities, with a main focus on the SME sector.
As for CEPEX, their promotion activities are as follows:
• CEPEX houses a “One Stop Shop” offering exporters information and facilitation services of customs authorities, Central Bank, trade, transport, telecommunications and insurance.
• Integration of the new technologies and firms’ human resources development are aimed at enhancing private sector competitiveness.
• Creating a real platform of cooperation and enhance synergy between CEPEX and private sector, aiming at reinforcing the Tunisian export sector competitiveness.
• Marketing advice and coaching, with the assistance of United Nations Industrial Development Organization (UNIDO) experts
Based on vast literature of the development of the Tunisian economy, one can surmise that the establishment of export consortia between the public sector and private sector contributed a great deal to the success of Tunisian exports. The table below illustrates the main operators supporting export consortia and their respective support.

86
Table 34 Role of Institutions and Private Sector in Supporting Export Consortia in Tunisia
Actors
Kind of Support Ministries Others Main Operators
Supporting Export Consortia
Ministry of Industry, Energy & SME
BMN – Industrial Modernization Office
• Strategic advice and group coaching (with support of UNIDO experts)
• Authorizing FODEC subsidies The 8 CTS –
Sectoral Service Centres
• One CTS (the Technical Centre for the Textile Industry, CETTEX) gives strategic advice and coaches groups (with support of UNIDO experts)
• CETTEX & CNCC are supporting consortiums “Sourcing” projects
General Direction for Agroalimentary Sector (DGAA)
• Strategic advice and group coaching (with support of UNIDO experts)
• Authorizing FOPROHOC subsidies
General Direction for Electric and Mechanic Sector (DGIM)
• Strategic advice and group coaching (with support of UNIDO experts)
CEPEX – Export Promotion Agency
• Marketing advice and group coaching (with support of UNIDO experts)
• Authorizing FAMEX subsidies The 8 CCIs –
Chambers of Commerce and Industry
• First, basic advice for groups (with support of UNIDO experts)
• Space for meetings and dialogue for new groups, act as an incubator
Employer’s Organizations
UTICA with its numerous national and regional associations
• First, basic advice for groups (with support of UNIDO experts)
• Space for meetings and dialogue for new groups, act as an incubator
Private Consultancy Sector
Private export advisers
• First, basic advice for groups (with support of UNIDO experts)
• Coaching formalized

87
consortium • Provide space for new
consortia in their offices • Act as executive directors
5.3 Gap Analysis The table below details where the Jordan export sector currently stands and where it aims to be in the future.
Table 35 Gap Analysis of Jordan’s Export Sector
Where Are We Now Where We Intend to be JEDCO offers limited grants to a fixed number of companies within specific sectors – agro-industry, industrial and service sector
JEDCO should reduce restrictions in terms of the specific sectors that are permitted to apply for grants, and increase the number of sectors that are eligible for EU grants.
JEDCO is the only government agency that aids in the general development and promotion of exports and does not have the ability to focus on developing individual export companies and consortia
The government should follow the Tunisian example in terms of establishing various agencies or centers with specific export responsibilities and objectives, e.g. export promotion. Agencies/centers modelled after Tunisia’s agencies include: • Agency for the Promotion of Industry and
Innovation (API) • Center for Export Promotion (Centre de
Promotion des Exportations, CEPEX) • Center for Opportunities and Benefits
Management (CFGA) • Center for Studies and Industrial
Prospective (CEPI) • Industrial Documentation and Information
Center (CDII) • Company Creation Support Center
(CSCE) • Support Center For Small and Medium
Size Industry (CAPMI) Absence of a market access fund The Jordanian government should emulate
this practice similar in nature to Tunisia’s FAMEX (Market Access Facilitation Fund) by adopting a comparable market access fund in order to allow existing and potential exporters to access a greater number of markets.
Absence of a fund that focuses on supporting the individual export products
Create new fund that supports the individual export products, e.g. chemicals, textile, and energy, which is similar in nature to FOPROHOC (fund for the promotion of conditioned and packed olive oil)
Absence of a fund that is catered toward improving the competitiveness of SMEs’ export capabilities and potential
Establish a new industrial competiveness fund that is specialized in enhancing the competitiveness of exporters, similar in structure to Tunisia’s FODEC
88
Currently, JEDCO is funded by the Jordanian government and the European Union with restrictions on the types of activities that are applicable for funding. However, the Jordanian government’s allocated funds are limited.
Current allocations are basically funded by EU assistance. At a minimum, the government should continue matching the EU funding. At a maximum, the government should increase the government spending allocation to JEDCO similar to Tunisia’s Mise à Niveau investment of € 2,660 million.
Overall weak Jordanian government export incentives to promote and develop exports
Increase number of Jordanian government export incentives, including tax, fiscal and financial incentives, to enable existing exporters and non-exporters to fully engage in exporting regionally and internationally.
5.4 Recommendations
After outlining the gap analysis in terms of the current export situation in Jordan, it is evident that the Kingdom lacks many of the incentives, which are an essential feature of fostering global exporting capabilities of firms, such as a market access fund like FAMEX in Tunisia, a fund that is product-centric, similar in nature to FOPROHOC of Tunisia, or even a fund aimed at improving the competitiveness of SMEs’ exports. Other limitations include the lack of government agencies assisting in the promotion of exports, weak government export incentives, poor SME access to loans and lack of available funds supporting SMEs’ promotion of exports.
Therefore, recommendations for improving the nation’s exports are as follows:
• Establish a series of funds, including new industrial competiveness fund that is specialized in enhancing the competitiveness of exporters, similar in structure to Tunisia’s FODEC; and a fund that focuses on supporting the individual export products, similar in structure to Tunisia’s FOPROHOC.
• Develop a market access facilitation fund in order to assist through grant schemes companies that are intent upon accessing new markets. Its target should be existing exporters who are considering entry into new markets as well as potential exporters eager to launch their products on a regional or global level. The fund would offset the costs of market visits, market research, meet-the-buyer events, etc. The Fund is similar in design to the one established in Tunisia, and considered a regional best practice.
• Establish dedicated technical and/or sectoral service centers for the various industries in which Jordan leads in export capabilities, mainly chemicals, clothes and footwear, crude materials, and food & live animals. Modelled after Tunisia, such centers would be responsible for providing strategic advice and coaching industrialists.
• Encourage exporting firms to export greater quantities and instigate non-exporters to begin exporting in order to increase their respective revenue streams

89
• Increase the government spending allocation to JEDCO.
• Improve overall Jordanian government incentives, through any of the following methods:
o Implementing an export marketing and investment scheme whereby the
government compensates exporters for costs associated with developing export markets for Jordanian products .
o For benchmark purposes, supply potential exporters with market studies for countries who have witnessed similar economic, specifically export growth, experiences and who aim to enhance their economic competitiveness.
o Offering exporters financial assistance, market research, trade mission opportunities, and showcasing products and services at international exhibitions. More specifically,
Primary export market research - Reimburse the costs of contact with
potential clients in international markets (airfares, car rental, daily allowances).
Reimburse a percentage of the costs of participating in trade fairs and exhibitions.
Aid exporters in connecting with foreign buyers. Launch trade missions locally in the main markets of Jordan, e.g.
Amman, Irbid and Zarqa, in order to put prospective exporters in contact with other global markets.
Encouraging reform of bonds and refund procedures in trade process

90
6. Education
6.1 Background
The education system of the Hashemite Kingdom of Jordan has consistently been reformed since the mid-1900s. The role played by a good education system has been significant in the development of Jordan from a predominantly agrarian nation to an industrialized nation. Despite strained resources, the Ministry of Education developed a highly advanced national curriculum of international standards with a secondary education program that is accredited in world-class universities. Many other countries in the region have developed their education system using Jordan as a model. In fact, the structure of the educational system in Jordan consists of a two-year pre-school education, ten years of mandatory primary education, and two years of secondary academic education after which the students sit for a General Certificate of Secondary Education Exam, known as Tawjihi. xciv Reforms of the educational system increased primary schools enrollment from 71% to 98% between 1994 and 2006. During the same period, transition rate from primary to secondary schools also increased from 63% to 97% and transition rate to higher education varied between 79% and 85% of secondary school graduates. xcv Secondary enrollment rates are higher than the regional average by almost 25%, leading Jordan to achieve full parity in primary and secondary enrollment.xcvi Currently, the total enrollment rate for primary education stands at 98% of students in primary education age, reaching the required level set by the National Millennium Development Goals Report 2010 published by the UNDP in partnership with the Ministry of Planning and International Cooperation, as indicated in Figure 1 below. Enrollment rates decrease to 70% for the secondary level while male enrollment is higher in early childhood pre-school and primary education than female enrollment. However, for secondary level education female enrollment is higher than males with female students comprising 55% of the secondary education population. Furthermore, there is gender balance in attendance to pre-university education. The growth of enrollment rates is reflected in the inclining literacy rate of the population, which currently stands at 92%.xcvii In addition, the Legatum Index of Prosperity 2010 ranked Jordan number 42 in education out of the 110 countries in the world while the Human Development index ranked the kingdom 82 out of 177 countries. xcviii Jordan also demonstrates very small disparity in primary school attendance rates among urban and rural are as compared to the Arab countries. This is mainly because public financing for primary schooling in Jordan targets the poor more than that for any other education level.

91
Figure 22 Percentage of Children Enrolled in Primary School, 1991 to 2009, Actual, 2010 to 2015 Predicted
Source:“Keeping the Promise and Achieiving Aspirations, Second National Millennium Development Goals Report, Jordan, 2010,” Ministry of Planning and International Cooperaiton, UN in Jordan, 2010 In Jordan, the Ministry of Education is responsible for primary and secondary education. Thus, primary and secondary level education is free and obligatory for all Jordanian children; and books are also distributed throughout the Kingdom by the Ministry. Access to higher education is limited to holders of the Tawjihi certificate who can choose between private community colleges, public community colleges or universities. There are more than 20 universities in Jordan including public and private universities. In addition, community colleges in Jordan offer 2 to 3 year diploma programs. The local universities have adopted the credit-hour system, which entitles students to select courses according to a study plan. All post-secondary education is the responsibility of the Ministry of Higher Education and the Council of Higher Education. Since 2000, public expenditures on education in Jordan occupied a leading position when compared to public education expenditures of other Arab countries. In the past ten years, Jordan has allocated an annual average of 11% of total government expenditures on financing and reforming education within the Kingdom as shown in the Table 1 below. However, this table does not reflect the role of inflation and population growth when looking at the figures and thus, it does not represent the real (after inflation) growth in government spending on education. If the increase in spending did not exceed inflation, then spending did not keep up with the rising cost of living. In other words, an increase in spending that fails to match the rising cost of living is not an increase at all; it is in fact a decrease. Hence, taking these factors into account, inflation rose by 49% within the past ten years, amounting to an annual average of 4.9%. Moreover, Jordan population grew by 26% during the same period, amounting to an annual average increase of 2.6%.xcix Thus, growth in real government spending is only represented by any increase in spending over 7.5% and the table below shows a declining growth trend in real spending since 2003.c
86
88
90
92
94
96
98
100
1991 1995 2000 2005 2008 2009 2015Percen
tage
of C
hildren En
rolled in
Prim
ary Scho
ol
Year
Actual Trend
Required Trend

92
Table 36 Education Expenditures
Year Total Education Exp. (thousand JD)
Total Education Exp. as % of Public Exp.
% Growth in Real Education Exp.
2000 304,770 13% - 2001 344,160 13% 5.5% 2002 354,214 13% 5.5% 2003 412,224 13% 5.5% 2004 417,535 12% 4.5% 2005 452,223 12% 4.5% 2006 487,957 11% 3.5% 2007 545,380 10% 2.5% 2008 607,296 9% 1.5% 2009 646,383 9% 1.5% 2010 677,963 9% 1.5% Total 5,250,105 11% -
Source: “The Actual Expenditure of the Jordanian Government Budgets on Education, Health and Employment”, The National Center for Human Rights, 2011.
These indicators show that an entrepreneur in Jordan does have the opportunity to receive an education of reasonable quality, providing him/her with the basic skills needed to enter the labor market. However, the current educational system faces several challenges that weaken the opportunity of the employability of graduates by failing to effectively provide them with the needed skills. Jordan, despite showing impressive improvements in the education system, still needs to address some of the persistent problems facing this sector. The educational sector in Jordan currently faces several challenges, including a mismatch of skills taught and skills required by the employers leading to high unemployment; low quality of government spending (whereby 93% of education expenditures go towards salaries) decreases competitiveness in the educational sector; outdated teaching methodologies; lack of teachers, training and limited use of technology; the curriculum relies to a significant level on rote learning, and does not promote entrepreneurship or analytical skills, thus leaving students unprepared for the future; most schools do not differentiate between students who require and those that do not require special attention; in addition, limited by their small size educational facilities can only provide half-day shifts to students, thereby reducing what the student can daily learn at school. With Jordan’s rising youth population and high unemployment rates, the Jordanian government has to ensure that the quality of education and level of skills imparted can help the new generation to compete effectively in the national and international arena. ci In Jordan, the importance of small and medium enterprises (SMEs) cannot be over looked. Over the last few decades, SMEs have been increasingly capturing the attention of the government, donor community and development agencies. According to the Department of Statistics, DOS, in 2006 SMEs constituted about 99% of all establishments in Jordan while SMEs’ contribution to the GDP amounted to 27% and provided about 49.5% of total employment for the same year. Although the educational system of the nation is adequate, it does not provide education geared specifically towards entrepreneurship or the advancement of SMEs. Therefore, modernizing and reforming the current educational system in parallel with development and strengthening of SMEs can play an effective role in the economic growth and in decreasing unemployment rates, which currently stands at 13%.

93
6.2 Benchmarking
• Based on European Union policies and figures, total educational expenditures should increase to reach 5% of the GDP and 12% of total government expenditures. cii
• The government should introduce policies aimed at raising higher education expenditures from its current level of 0.003% of GDP to reach similar levels of leading nations. Higher education expenditures in the EU stand at 1.13% of the GDP, which is close to the US figure of 1.32%.ciii
• Reform current curriculum to rely significantly on critical analysis and thinking rather than memorization and rote learning. Such reforms can help solve the mismatch problem, promote entrepreneurship and raise the analytical skills of students
• Ensure the long-term recruitment of highly qualified teachers in the schools, as done by the European Council. Programs, including building a critical mass of accomplished teachers in these schools, intensive induction programs, and better working conditions will help retain highly qualified teachers
• Adopt procedures similar to that of Europe and Ireland, which set expenditures for teachers’ salaries at 75% of total education expenditures. Jordan government allocates 93% of education expenditures on salaries, the government should decrease this figure significantly to enhance the quality of government spending and the competitiveness within the educational sector. civ
6.3 Gap Analysis Where are we? Where do we want to be?
• Total educational expenditures are currently at an annual average of 8% of total government spending.
• Increase total educational expenditures to reach 12% of total public expenditures.
• Educational expenditures amount to 3% of the GDP.
• Increase educational expenditure to reach 5% of the total GDP.
• Higher education expenditures currently make up 0.003% of the GDP.
• Increase higher education expenditures to reach 1.2% of the GDP.
• Outdated educational methodology that does not promote entrepreneurship or raise analytical skills
• Introduce modern curricula and teaching methods that promote analytical thinking, enhance entrepreneurship skills and differentiate between average students and those with special needs.
• Several educational facilities are limited, small and overstaffed, allowing them to provide only half-day shifts to meet the demand of students.
• Larger modern facilities with fewer staff, which will improve competitiveness in the sector and enhance the quality of government spending.
• 93% of the education expenditures are attributed to salaries.
• Decrease salaries to reach 75% or less of the total education expenditures.
• Current law requires opening a school for every 10 new students in municipalities.
• Implement policies that amass students in larger schools for the purpose of rationalizing expenditure on education.

94
6.4 Recommendations
• The government should focus on providing sponsored training and educational programs to match market needs, and on promoting the concept of entrepreneurship within the educational curricula.
• Increase real government expenditures for the educational sector, which have been continuously declining, due to the decrease in government support to the education sector.
• Restructure the education expenditures in the Jordanian budget by increasing expenditures on higher education and decreasing the total number of teachers and schools. Regrouping teachers into fewer larger schools will improve the quality of education and will decrease the expenditures on salaries.
• Provide education geared specifically towards the advancement of SMEs. • Amend the current effective education law that requires opening a school for every
10 new students in municipalities. The preferred solution is to amass students in larger schools in order to benefit from the economies of scale and eliminate unwarranted expenses on education.
• 24% of the current government expenditures are spent on the military compared a combined 22% spent on Education, Health and Work. The government should re-examine the percentage spent on education from the total government expenditures and increase it. This could be effectively done by introducing policies that reallocate funds from military expenditures to education expenditure.
• Strategy to fully consider role of private sector in education

7. Gove This chaa brief bseveral procurembe the pfuture, a
7.1 Back
GovernmdevelopegovernmlegislatioRegulatioKingdomMinistry the Jointpurchasein 2010 This is alleviatin
Figure 2
Source: C
The samGovernmbetween
020406080
100120140
rnment Pro
pter providebackground countries t
ment procespossible impand, finally,
kground
ment procured countries
ment procuron: The Govon No. 32
m responsibof Finance, t Procuremee orders for decreased smainly due
ng the Budg
23 Value of
Compiled from
me pattern iment Tende 2010-2009
2005
ocurement
es an overvon the curro undersco
ss; a gap anpact of accerecommend
ement of gs, and up ement regi
vernment Byfor the yeale for proc the Governent Departm specific govsharply by 5e to recenet Deficit.
Purchase O
m Governmen
s also visibrs Directora
9 from JD m
2006
Value of
t
view of goverent procureore specific nalysis of whession into tdations for g
oods and sto as muchme in Jordy-Work Regar 1993. Ccurement; tnment Tendement of the vernment te51% to reant governm
Orders
nt Tenders Di
le when exate in 201
million 433.8
2007
Purchase
95
ernment proement mech measures here we curthe General going forwa
ervices typih as 20% oan is goverulation No. urrently thethe Generaers DirectorPrime Minisenders. Thech JD millio
ment expend
irectorate
amining the0. The valu to 182.06 o
2008
Orders (JD
ocurement phanisms; bebeing take
rrently stand Procuremerd.
ically accouof GDP for rned primar 71 for the yere are thrl Supplies rate of the Mstry. The GSe value of goon 51.1 fromditure redu
e value of gue of goveor by 58%.
8 20
D Millions)
process in Jenchmarkingen to engagd in Jordan
ent Agreeme
nts for 10- developingrily by two year 1986 aee departmDepartmen
Ministry of PSD is responovernment m JD millionuction meas
governmenternment ten
009
Jordan, inclug assessmege SMEs in and what went (GPA) in
15% of GDg countries. main pieceand the Sup
ments withint (GSD) of
Public Worksnsible for issPurchase On 104.9 in 2sures aime
t tenders bynders decre
2010
uding ent of n the would n the
DP for The es of pplies n the f the s and suing rders 2009. ed at
y the eased

Figure 2
Source: C
More reprocuremstate ageinto a sintaken to the three
The JorProcuremthe GPA and reguprocedurand servsuppliers
HoweverGPA (chdisadvantechnoloalongside10% (usgovernm
An additdevelopmused as SMEs. Tbusiness
0
100
200
300
400
500
24 Value of
Compiled from
cently, Jorment procesencies in anngle govern formulate te different d
rdanian govment Agreem on 12/7/20ulates the teres and provices. In ots and Jordan
r, the GPA hiefly Indiantage if lagy and scae their ownsed to be
ment procure
ional notablment of med an instrumhe applicat
s as it opens
113.3
2005
V
Governmen
m Governmen
danian govss. In Augun effort to cunment procuthis new agedepartments
vernment ment (abbre000. The Gendering prmotes non-ther words, nian supplie
suffers from, Pakistan rge and e
ale and scopn domestic f15%) prefeement contr
le limitationdium-sized
ment of targion of the s up compet
246.58
2006
Value of G
nt Tenders
nt Tenders Di
vernments st 2010, thut costs. Thurement uniency and gos.
has recenteviated GPA
GPA subjectsocess in a w-discriminat the GPA s
ers.
m a numbeand Egyp
established pe economifirms. In Joerential maracts.
n to the GPAenterprises
geted econoGPA regulatition with la
290.62
2007
overnment
96
irectorate
have lookehe Governmhe three prot. As of yet overnment p
tly been sA) of the Ws public proway that aimion betweenseeks to pr
r of limitatit) for fearforeign co
es) are alloordan, the grgin to dom
A is that it m (SMEs) proomic and sotion in Jordarge and est
446.15
2008
t Tenders (
ed at the ment issued ocurement a however, nprocuremen
seeking entWTO. Jordan ocurement tms to impron domestic revent discr
ions. Develor that theiompanies (owed to bidgovernment mestic bidd
may not proogrammes. ocial policy,dan would ttablished fo
5 433.
200
(JD Million
idea of dean order to
agencies weno concrete nt tenders a
try into th began negto internatioove the tranand foreignrimination b
oping countr industries(armed witd for govern will eventuers vis. for
ovide much Governmen, such as ththus advers
oreign firms.
83
18
09 2
n)
ecentralizingo merge sere to be me action has re still issue
he Governgotiations toonal competnsparency on firms, prodbetween fo
tries opposes will be th advancenment contually removereign bidde
flexibility font purchasehe promotiosely affect S.
82.06
010
g the everal erged been
ed by
ment o join tition
of the ducts reign
e the at a
es in tracts e the
ers in
or the s are on of SMEs

97
The Committee on Government Procurement comprises the Parties to the Agreement as well as Observers. The majority of parties have been bound by the GPA since its entry into force on 1 January 1996. For some, it entered into force at a later date and other parties joined the Agreement by way of accession. Currently, forty WTO Members are covered by the WTO Agreement on Government Procurement. They comprise: Canada; the European Communities, including its 27 member States; Hong Kong, China; Iceland; Israel; Japan; Korea; Liechtenstein; the Netherlands with respect to Aruba; Norway; Singapore; Switzerland; and the United States. In addition, four intergovernmental organizations, namely the International Monetary Fund (IMF), the International Trade Centre (ITC), the Organization for Economic Co-operation and Development (OECD), and the United Nations Conference on Trade and Development (UNCTAD) have observer status in the WTO Committee on Government Procurement, which administers the Agreement.
Nineteen other WTO Members have observer status under the Agreement. They include: Albania, Argentina, Armenia, Australia, Cameroon, Chile, China, Colombia, Croatia, Georgia, Jordan, the Kyrgyz Republic, Moldova, Mongolia, Oman, Panama, Sri Lanka, Chinese Taipei and Turkey.
The Jordanian negotiation offer to the WTO is comprised of a set of ceilings that Jordan will have to adhere to in terms of value of contracts that it can restrict to local producers. After five years from accession, these ceilings will be dropped to much lower contract values, which enable foreign companies easier access to the market. The ceilings are divided along three main annexes as shown in the table below.
Table 37 Annexes and Jordanian Entities Excluded
Annex Entities Excluded
An
nex
I
Ministry of Health, Ministry of Education Ministry of Public Works and Housing Ministry of Defense Ministry of Information and Communication Technology Ministry of Energy Department of Palestinian Affairs General Sales Tax Department Customs Department Income Tax Department Department of Land and Survey Joint Procurement Department Public Security Department Civil Defense Department The Civil Status and Passport Department
An
ne
x II Greater Amman Municipality

98
Aqaba Special Economic Zone
An
nex
III
Jordan Atomic Energy Commission Jordan Maritime Authority National Aid Fund Natural Resources Authority Jordan Valley Authority Water Authority Civil Aviation Authority National Electric Power Company
The entities included in the annexes are covered by the following ceilings shown in the table below.
Table 2: Ceilings and Annexes by Type of Procurement
Type of Procurement
Annex I Annex II Annex III
Upon accession
After five years
Upon accession
After five years
Upon accession
After five years
Supplies 250,000 130,000 350,000 200,000 400,000 400,000
Services 250,000 130,000 350,000 200,000 400,000 400,000
Construction 10,000,000 8,500,000 10,000,000 8,500,000 15,000,000 8,500,000
Source: Compiled from Government Tenders Directorate
7.2 Benchmarking
International best practices with relation to SMEs and government procurement can be divided into several categories as follows;
1) Reforming Procurement laws to include provisions on SMEs
Several Asian and European countries have adopted new laws that directly address SME procurement.
a) Japan’s Small and Medium Enterprise Basic Law No. 154, July 20, 1963:5cv
Guarantee of opportunity for procurement of receiving orders from State, etc. Article 20
The State shall take the necessary enforcement policy to increase opportunity for receiving orders by SMEs with respect to the procurement of commodities, services, etc. by the State, etc., in order to increasing demand on commodities, services, etc. to be supplied by SMEs.

99
b) Small and Medium Enterprise Development Statute for Taiwan and its revisions and amendments.cvi
2) Overcoming Difficulties Relating to the Size Of Contracts Government procurement contracts can often be considered too large for SMEs to bid for and thus several countries have introduced means to mitigate the affect of contract size on SMEs. Most notable of these examples as highlighted by the European Code of Best Practices Facilitating Access by SMEs to Public Procurement Contracts arecvii:
a) Dividing contracts into various separate lots. In Ireland, contracting authorities when advertising large construction contracts advertise and award contracts for some of the specialist aspects (electrical services, mechanical services, specialist fitting contracts, etc.) separately to bidders who are required to work with the bidder who has been awarded the contract for the coordination of the whole project.
b) Having the possibility to set up framework agreements outside of the main procurement contract in order to respond to needs that arise during the contract. The UK has produced guidance which advises contracting authorities, even if they have a framework agreement in place, to consider how best value for money can be obtained, including the possibility to buy outside the framework agreement ifcviii:
• Short-term market conditions (e.g. an unexpected decrease of the price of a certain product) mean contracting authorities could get better value;
• Innovative goods or solutions are not represented in the existing framework agreements.
Chapter Five: Public Purchasing and Public Construction
Article 37
Where government at any level or a state-owned enterprise undertakes publicly-announced procurement or public construction, they shall assist SMEs to obtain the business opportunities created by this.
Article 38
Where government at any level or a state-owned enterprise undertakes publicly-announced procurement, public construction or commissioning of R&D work, they shall, depending on actual needs, establish a system for qualification and registration of SMEs wishing to serve as suppliers or to bid for a tender.

100
3) Technical Assistance to SMEs Government assistance to SMEs is vital if they to be able to bid successfully for procurement contracts. Several countries have developed programmes directed towards the development of SME technical capacity.
In the United States, The US Small Business Administration (SBA) administers a program whereby retired business executives assist small firms in counseling and training through SBA's Service Corps of Retired Executives (SCORE). This is a volunteer effort in which SMEs are assisted annually in the form of pre-business workshops, one-on-one counseling and seminars.cix
4) Proportionate Bid Requirements Besides known issues such as capital accumulation and obtaining credit facilities, SMEs often struggle with the strict qualification levels imposed by government procurement contracts.
In the UK, for low value procurements, the government instructs procurement authorities to request only two years of financial accounts and if these aren’t available as in the case of start-ups, other information such as management accounts should suffice. cx
7.3 Gap Analysis
The table below details where the Jordan procurement sector currently stands in terms of the GPA and where it aims to be in the future.
Table 4: Gap Analysis of the GPA
Where Are We Now GPA Accession Impact
Current procurement tenders fall under government spending when it comes to the government Aggregate Demand.
Aggregate Demand = Consumption + Government Spending + Investment + (Exports – Imports)
The agreement renders government procurement as imports in relation to aggregate demand and thus decreases its overall government spending, thereby decreasing the gross domestic product of the economy by adding to the deficit of balance of payments.
Government purchases are used as an instrument of targeted economic and social policy, such as the promotion of SMEs. In fact, 99.6% of Jordanian
The application of the GPA regulation in Jordan would thus adversely affect SMEs’ business as it opens up competition with large and established foreign firms. Developing countries oppose the GPA

101
companies are defined as SMEs. (chiefly India, Pakistan and Egypt) for fear that their industries will be at a disadvantage if large and established foreign companies (armed with advances in technology and scale and scope economies) are allowed to bid for government contracts alongside their own domestic firms.
The proposed ceilings by the government last only 5 years vs. the current status quo of no ceilings.
The ceilings expire after 5 years making it increasingly difficult for local firms to compete against multinational companies (MNCs).
Lack of laws to protect SMEs. Jordan has a 10% preferential margin to domestic bidder vs. foreign ones.
The Government will be forced to remove any protection it has through laws on local industry as the GPA does not include laws that protect small business such as the 10% (previously 15%) preferential margin to domestic bidders, thus harming local industries. From the benchmarks, we can surmise that several countries have enacted their own laws to protect SMEs. Therefore, Jordan does not require GPA membership to institute such laws to protect and promote its local industry.
The economy of Jordan is small and developing.
The bargaining power of Jordan in the GPA would be extremely limited with regards to its potential clout within the agreement and its members, e.g. the US, the EU and Canada, should any trade disputes arise. The larger economies would encourage limited protectionism in countries like Jordan in order to increase demand for their own domestic corporations.
Lack of efficiency in the procurement process.
The GPA would not improve efficiency tremendously compared to local measures that can be enacted by the government of Jordan. Recent attempts to introduce E-Procurement and combine the three procurement departments into one are methods that will improve efficiency of the process locally without the need for membership status in the GPA.
Developing economies like Jordan often These large infrastructure projects such as

102
require large infrastructure projects that often do not conform to its natural economic capabilities.
the proposed Red Sea-Dead Sea Canal and nuclear power plant will mostly benefit large MNCs compared to local producers.
Overall weak Jordanian government export incentives to promote and develop domestic contractors and producers.
The Jordanian government lacks the proper mechanisms to encourage local producers to bid for procurement contracts outside of Jordan. The GPA opens international markets to domestic bidders; however, it lacks any mechanisms to ease competition facing Jordanian firms abroad.
7.4 Recommendations
After outlining the gap analysis in terms of the impact of the GPA on the procurement situation in Jordan, it is evident that the Kingdom lacks neither the incentives that are essential to fostering the capabilities of local firms, nor the laws to protect SMEs from foreign competition upon accession to the agreement.
• Based on the current terms, accession on the GPA should be renegotiated due to its negative impact on the Jordanian economy. The negotiation process should be transparent to the public and inclusive of SME participants to increase awareness of the possible ramifications on their respective business.
• Should Jordan pursue accession into the treaty further, the following measures are recommended to protect the national industry:
o Contract ceilings should be increased and made permanent in order to always
ensure SME protection. Furthermore, the proposed Ceilings should be reviewed after 5-10 years to account for inflationary rises and economic growth as Jordan’s contracts are expected to become larger in value.
o Enact measures to protect SMEs from foreign competition similar to the benchmarked European and Asian countries including:
Reforming procurement laws to include provisions on SME participation Dividing large contracts into several lots to allow for increased SME
participation Technical assistance and support mechanisms to SMEs which are
practiced by several GPA member countries Proportionate bid requirements that take into account the SME nature
of the Jordanian Economy. The ease of financial and technical requirements can increase the pool of local bidders for procurement contracts.
Retain and increase the preferential margin given to domestic bidders back to 15%

103
• Aside from the GPA, the government should continue its drive to combine the various procurement agencies into one agency as it would highly improve efficiency throughout the procurement process.
• Pursue E-Procurement further to include all government procurement contracts. E-Procurement is vital to SMEs as it allows uniform access to notices, electronic tendering and online registration, irrespective of the SME location.
• Provisions from government procurement for subcontracting efforts to encourage SMEs, and packaging bids to encourage SMEs to apply.
iOECD. March 2003. “Entrepreneurship and Local Economic Development,” Organization for Economic Cooperation and Development Publishing iiLEDIS. 2007. “Does entrepreneurship lead to economic growth? An unanswered question,” Cobweb information Limited iiiBeck, T, Demirguck-Kunt, A, Levine, R. 2005. “SMEs, Growth, and Poverty: Cross-Country Evidence,” Journal of Economic Growth, Volume 10, Issue 3, Pages 199 to 229 ivITD. “The Importance of SMEs in the Economy,” International Tax Dialogue, SME Conference vDababneh, R, Tukan, F. August 2007. “Booklet of Standardized SME Definitions,” USAID viUNDP. 2011. “Jordan Human Development Report, 2011, Small Businesses and Human Development, in Jordan.” viiUSAID. 25 Aug 2007.“Booklet of Standardized Small and Medium Enterprises Definition.” viiiUNDP. 2011. “Jordan Human Development Report, 2011, Small Businesses and Human Development, in Jordan.” ixUNDP. 2011. “Jordan Human Development Report, 2011, Small Businesses and Human Development, in Jordan.” xUNDP. 2011. “Jordan Human Development Report, 2011, Small Businesses and Human Development, in Jordan.” xiUNDP. 2011. “Jordan Human Development Report, 2011, Small Businesses and Human Development, in Jordan.” xiiUNDP. 2011. “Jordan Human Development Report, 2011, Small Businesses and Human Development, in Jordan.” xiiiGlobal Competitiveness Report, 2011‐2012, World Economic Forum xivUNDP. 2011. “Jordan Human Development Report, 2011, Small Businesses and Human Development, in Jordan.” xv “Summary of Central Government Budget,” Public Finance, Central Bank of Jordan, 2010 xvi “Global Competitiveness Report, 2011 to 2012,” World Economic Forum xvii “Doing Business Report, How to Reform,” World Bank, 2007 xviii Mentioned throughout focus groups, conducted for the report: “Tax Payer Cost of Compliance Analysis,” Income and Sales Tax Department, Jordan, 2011 xix “Tax Payer Cost of Compliance Analysis,” Income and Sales Tax Department, Jordan, 2011 xx “Tax Payer Cost of Compliance Analysis,” Income and Sales Tax Department, Jordan, 2011 xxi From additional database collected by the Income and Sales Tax Department xxii “Tax Payer Cost of Compliance Analysis,” Income and Sales Tax Department, Jordan, 2011 xxiii James, S. “SME Taxation, Good Practice and Guideline for Design,” World Bank and IFC, Retrieved from http://www.oecd.org/dataoecd/49/38/40392978.pdf
xxiv “SME Tax Compliance and Simplification,” OECD Center for Tax Policy and Administration, Retrieved from http://www.oecd.org/dataoecd/22/24/41873897.pdf xxv “SME Tax Compliance and Simplification,” OECD Center for Tax Policy and Administration, Retrieved from http://www.oecd.org/dataoecd/22/24/41873897.pdf

104
xxvi “SME Tax Compliance and Simplification,” OECD Center for Tax Policy and Administration, Retrieved from http://www.oecd.org/dataoecd/22/24/41873897.pdf xxvii “SME Tax Compliance and Simplification,” OECD Center for Tax Policy and Administration, Retrieved from http://www.oecd.org/dataoecd/22/24/41873897.pdf xxviii “SME Tax Compliance and Simplification,” OECD Center for Tax Policy and Administration, Retrieved from http://www.oecd.org/dataoecd/22/24/41873897.pdf xxix “SME Tax Compliance and Simplification,” OECD Center for Tax Policy and Administration, Retrieved from http://www.oecd.org/dataoecd/22/24/41873897.pdf xxx “SME Tax Compliance and Simplification,” OECD Center for Tax Policy and Administration, Retrieved from http://www.oecd.org/dataoecd/22/24/41873897.pdf xxxi “SME Tax Compliance and Simplification,” OECD Center for Tax Policy and Administration, Retrieved from http://www.oecd.org/dataoecd/22/24/41873897.pdf xxxii “SME Tax Compliance and Simplification,” OECD Center for Tax Policy and Administration, Retrieved from http://www.oecd.org/dataoecd/22/24/41873897.pdf xxxiii “SME Tax Compliance and Simplification,” OECD Center for Tax Policy and Administration, Retrieved from http://www.oecd.org/dataoecd/22/24/41873897.pdf xxxiv “SME Tax Compliance and Simplification,” OECD Center for Tax Policy and Administration, Retrieved from http://www.oecd.org/dataoecd/22/24/41873897.pdf xxxv “SME Tax Compliance and Simplification,” OECD Center for Tax Policy and Administration, Retrieved from http://www.oecd.org/dataoecd/22/24/41873897.pdf xxxvi “SME Tax Compliance and Simplification,” OECD Center for Tax Policy and Administration, Retrieved from http://www.oecd.org/dataoecd/22/24/41873897.pdf xxxvii “SME Tax Compliance and Simplification,” OECD Center for Tax Policy and Administration, Retrieved from http://www.oecd.org/dataoecd/22/24/41873897.pdf xxxviii “SME Tax Compliance and Simplification,” OECD Center for Tax Policy and Administration, Retrieved from http://www.oecd.org/dataoecd/22/24/41873897.pdf xxxix “SME Tax Compliance and Simplification,” OECD Center for Tax Policy and Administration, Retrieved from http://www.oecd.org/dataoecd/22/24/41873897.pdf xl “SME Tax Compliance and Simplification,” OECD Center for Tax Policy and Administration, Retrieved from http://www.oecd.org/dataoecd/22/24/41873897.pdf xli “SME Tax Compliance and Simplification,” OECD Center for Tax Policy and Administration, Retrieved from http://www.oecd.org/dataoecd/22/24/41873897.pdf xlii “SME Tax Compliance and Simplification,” OECD Center for Tax Policy and Administration, Retrieved from http://www.oecd.org/dataoecd/22/24/41873897.pdf xliii “SME Tax Compliance and Simplification,” OECD Center for Tax Policy and Administration, Retrieved from http://www.oecd.org/dataoecd/22/24/41873897.pdf xliv “SME Tax Compliance and Simplification,” OECD Center for Tax Policy and Administration, Retrieved from http://www.oecd.org/dataoecd/22/24/41873897.pdf xlv “SME Tax Compliance and Simplification,” OECD Center for Tax Policy and Administration, Retrieved from http://www.oecd.org/dataoecd/22/24/41873897.pdf xlvi “SME Tax Compliance and Simplification,” OECD Center for Tax Policy and Administration, Retrieved from http://www.oecd.org/dataoecd/22/24/41873897.pdf xlvii Mentioned throughout focus groups, conducted for the report: “Tax Payer Cost of Compliance Analysis,” Income and Sales Tax Department, Jordan, 2011 xlviii Chen, D. July 2004. “Reformulating the Tax Incentive Program in Jordan, Analysis and Recommendations,” International Tax Program, Retrieved from http://www.rotman.utoronto.ca/iib/ITP0412.pdf xlix June 2000, “Enhancing the Competitiveness of SMEs through Innovation,” OECD, Retrieved from http://www.oecd.org/dataoecd/20/1/2010176.pdf l June 2000, “Enhancing the Competitiveness of SMEs through Innovation,” OECD, Retrieved from http://www.oecd.org/dataoecd/20/1/2010176.pdf li Shabaneh, A, Nassif, F. 2003.“Research and Innovation: A Futuristic Vision of Public Private Partnerships,” Ministry of Planning, Jordan lii June 2000, “Enhancing the Competitiveness of SMEs through Innovation,” OECD, Retrieved from http://www.oecd.org/dataoecd/20/1/2010176.pdf liii 2011 “Global Innovation Index,” INSEAD, retrieved from http://www.globalinnovationindex.org/gii/main/analysis/rankings.cfm?vno=a

105
liv 2011 “Global Innovation Index,” INSEAD, retrieved from http://www.globalinnovationindex.org/gii/main/analysis/rankings.cfm?vno=a lv “Benchmarking Study on Innovation Policy,” CapGemini Consulting, 2009 lvi “Benchmarking Study on Innovation Policy,” CapGemini Consulting, 2009 lvii “Benchmarking Study on Innovation Policy,” CapGemini Consulting, 2009 lviii “Benchmarking Study on Innovation Policy,” CapGemini Consulting, 2009 lix “Benchmarking Study on Innovation Policy,” CapGemini Consulting, 2009 lx “Benchmarking Study on Innovation Policy,” CapGemini Consulting, 2009 lxi “Benchmarking Study on Innovation Policy,” CapGemini Consulting, 2009 lxiiUNESCO. 2011.“Science and Technology,” Institute for Statistics, 2010 lxiiiUNDP. 2011. “Jordan Human Development Report 2011, Small Businesses and Human Development,” United Nations Development Program lxivUNESCO. 2008. “Data Center,” UNESCO Institute for Statistics, Retrieved from http://stats.uis.unesco.org/unesco/TableViewer/document.aspx?ReportId=136&IF_Language=eng&BR_Topic=0 lxvWorld Bank. 2007. “World Development Indicators” lxvi “Credit Facilities Extended by Licensed Banks” Central Bank, Monthly Statistical Bulletin, November, 2011 lxvii “Workshop Examines Ways to Implement Program to Fund SMEs,” Jordan Times, June 5, 2011, Retrieved from http://www.jordantimes.com/?news=38140 lxviii “Credit Facilities Extended by Licensed Banks” Central Bank, Monthly Statistical Bulletin, November, 2011 lxix “Credit Facilities Extended by Licensed Banks” Central Bank, Monthly Statistical Bulletin, November, 2011 lxxMalhorta, M, et. al. August 2006. “Expanding Access to Finance: Good Practices and Policies for Micro, Small and Medium Enterprises,” August, 2006, World Bank Institute
lxxi “National Investment Reform Agenda, Jordan,” MENA OECD Investment Program lxxii “National Investment Reform Agenda, Jordan,” MENA OECD Investment Program lxxiii “National Investment Reform Agenda, Jordan,” MENA OECD Investment Program lxxiv “National Investment Reform Agenda, Jordan,” MENA OECD Investment Program lxxv “National Investment Reform Agenda, Jordan,” MENA OECD Investment Program lxxvi UNDP. 2011. “Third Human Development Report, Jordan, MSME Survey” lxxvii “Oasisi 500 Commemorates One Year Boot Camp Training Anniversary and Unveils Recent Angel Investment Deal,” Oasis 500, July 5, 2011, Retrieved from http://www.oasis500.com/news lxxviii “Corporate History/Establishment,” Jordan Loans Guarantee Corporation, Retrieved from http://www.jlgc.com/about.htm lxxix 23 October 2011, “Jordan, USA, sign 300 million MoU,” Petra News Agency, Retrieved from http://www.jordanembassyus.org/new/newsarchive/2011/10232011005.htm lxxx “Italy Continues Support for Investment Promotion in Jordan,” UNIDO, November 2004, Retrieved from http://www.unido.org/fileadmin/import/31139_1204UNIDOScope0511Dec2004.17.pdf lxxxiCentral Bank of Jordan. Statistical Database. www.cbj.gov.jo lxxxiiCentral Bank of Jordan. Statistical Database. www.cbj.gov.jo lxxxiiiCentral Bank of Jordan. Statistical Database. www.cbj.gov.jo lxxxivCentral Bank of Jordan. Statistical Database. www.cbj.gov.jo lxxxv Malhorta, M, et. al. “Expanding Access to Finance: Good Practices and Policies for Micro, Small and Medium Enterprises,” August, 2006, World Bank Institute lxxxvi Malhorta, M, et. al. “Expanding Access to Finance: Good Practices and Policies for Micro, Small and Medium Enterprises,” August, 2006, World Bank Institute lxxxvii Malhorta, M, et. al. “Expanding Access to Finance: Good Practices and Policies for Micro, Small and Medium Enterprises,” August, 2006, World Bank Institute lxxxviii O’Brien, K. August 2008. “A White Paper on Legal Obstacles to SME Loans in Jordan,” USAID lxxxix O’Brien, K. August 2008. “A White Paper on Legal Obstacles to SME Loans in Jordan,” USAID xc O’Brien, K. August 2008. “A White Paper on Legal Obstacles to SME Loans in Jordan,” USAID xci Central Bank of Jordan. Monthly Statistical Bulletin. Vol. 47 No. 10. Oct 2011. xcii Ibid.

106
xciii Central Bank of Jordan. Monthly Statistical Bulletin. Vol. 47 No. 10. Oct 2011. xciv₃ USAID in Jordan”, USAID, 2009 http://jordan.usaid.gov/sectors.cfm?inSector=17. xcv₃ Jordan Second Education Reform for Knowledge Economy, The World Bank, 2009. xcvi UNESCO Institute for Statistics. xcvii₃ The 2010 Legatum Prosperity Index. Legatum Institute, 2010. http://www.prosperity.com/country.aspx?id=JO xcviii₃ Human Development Report 2010, UNDP, 2010. http://hdr.undp.org/en/statistics/ xcix UNESCO Institute for Statistics, http://stats.uis.unesco.org/unesco/TableViewer/document.aspx?ReportId=124&IF_Language=eng&BR_Country=4000&BR_Region=40525
c“The actual Expenditure of the Jordanian Government Budgets on Education, Health and Employment₄ , The National Center for Human Right, 2011. ci “The actual Expenditure of the Jordanian Government Budgets on Education, Health and Employment₄ , The National Center for Human Right, 2011.
cii₃ The actual Expenditure of the Jordanian Government Budgets on Education, Health and Employment”, The National Center for Human
Right, 2011. ciii₃ Promoting Efficiency in Education and Training₄ , EC
civ“Key Indicators on Education in Ireland and Europe”, Department of Education and Science, 2006. cv Hannun, Rand. (2004). Review of Government Procurement SME Policies. AMIR 2.0 Achievement of Market‐Friendly Initiatives and Results Program. cvi Ibid. cvii Commission of the European Communities. (2008). European Code of Best Practices Facilitating Access by SMEs to Public Procurement Contracts. Retrieved from http://ec.europa.eu/internal_market/publicprocurement/other_aspects/index_en.htm#smes cviii Ibid cix International Trade Center. (2003) Sme and Export‐Led Growth: are there Roles for Public Procurement Programmes? A Practical Guide for Assessing and Developing Procurement Programmes to Assist SMEs. Retrieved from http://www.wto.org/english/tratop_e/gproc_e/wkshop_tanz_jan03/itcdemo3_e.pdf cx Commission of the European Communities. (2008). European Code of Best Practices Facilitating Access by SMEs To Public Procurement Contracts. Retrieved from http://ec.europa.eu/internal_market/publicprocurement/other_aspects/index_en.htm#smes