Embed Size (px)
Citation preview

10th Capital Markets Day, 2018
SMA SOLAR TECHNOLOGY AG10th Capital Markets DayPierre-Pascal Urbon, CEO/CSODr.-Ing. Jürgen Reinert, CTO/COOUlrich Hadding, CFOJanuary 26, 2018

Disclaimer
IMPORTANT LEGAL NOTICEThis presentation does not constitute or form part of, and should not be construed as, an offer or invitation to subscribe for, underwrite or otherwise acquire, any securities of SMA Solar Technology AG (the "Company") or any present or future subsidiary of the Company (together with the Company, the "SMA Group") nor should it or any part of it form the basis of, or be relied upon in connection with, any contract to purchase or subscribe for any securities in the Company or any member of the SMA Group or commitment whatsoever.All information contained herein has been carefully prepared. Nevertheless, we do not guarantee its accuracy or completeness and nothing herein shall be construed to be a representation of such guarantee. The Company shall assume no liability for errors contained in this document, unless damages are caused intentionally or through gross negligence by the Company. Furthermore, the Company shall assume no liability for effects of activities that evolve from the basis of data and information provided by this presentation.The information contained in this presentation is subject to amendment, revision and updating, which does not underlie any prior announcement by the Company. Certain statements contained in this presentation may be statements of future expectations and other forward-looking statements that are based on the management's current views and assumptions and involve known and unknown risks and uncertainties. Actual results, performance or events may differ materially from those in such statements as a result of, among others, factors, changing business or other market conditions and the prospects for growth anticipated by the management of the Company. These and other factors could adversely affect the outcome and financial effects of the plans and events described herein. The Company does not undertake any obligation to update or revise any forward-looking statements, whether as a result of new information, future events or otherwise. You should not place undue reliance on forward-looking statements which speak only as of the date of this presentation.This presentation is for information purposes only and may not be further distributed or passed on to any party which is not the addressee of this presentation solely after prior consent of the Company. No part of this presentation must be copied, reproduced or cited by the addressees hereof other than for the purpose for which it has been provided to the addressee. The content of this presentation, meaning all texts, pictures and sounds, are protected by copyright. The contained information of the presentation is property of the Company. This document is not an offer of securities for sale in the United States of America. Securities may not be offered or sold in the United States of America absent registration or an exemption from registration under the U.S. Securities Act of 1933 as amended.
2

1. Review 2017 and Outlook

SMA is the World Market Leader for PV Inverters and aLeading Player in Storage and O&M
4
Investment Highlights
Unique positioned in the solar market / Best brand
• World market leader with 65 GW installed base• Complete portfolio to serve all PV segments• 20 subsidiaries with strong service capabilities and
access to all channels• Award-winning 20 GW production to achieve scale
Leverage PV expertise to enter into high margin business
• Strong partnerships to create a new ecosystem• Know-how & products to benefit from strong growth in the
field of battery storage• With ennexOS1, SMA has set the basis to manage the
complexity of integrated solutions• Infrastructure to expand into data-driven business models and
services
Key Financials2017e2
Sales€ 890 m
EBITDA€ 95 m
EPS€ 0.86
Net Cash€ 450 m
Equity Ratio50%
Market Cap3
€ 1.3 bn
10th Capital Markets Day, 2018 1.SMA’s Energy Management Platform2.Preliminary figures
3.Current market capitalization as of 01/25/2017

Record Shipments in 2017 with More than 8.5 GW
5
Sales decline in 2017 was mainly due to regulatory uncertainties in the U.S.
Sales (in € million) Regional Sales Development (2016/2017)3
10th Capital Markets Day, 2018
8.2 8.5GW
-50%AMERICAS
+40%EMEA
+30%APAC
947
Guidance 2018
>890
Guidance 01/171
900-1,000
2017e22016
830-900
1.Guidance Adjustments: Sales €900-950m (08/01/2017); Sales €>900m (11/09/2017)
2.Preliminary figures3.Rounded figures before sales deductions
>9.0Subsidiaries
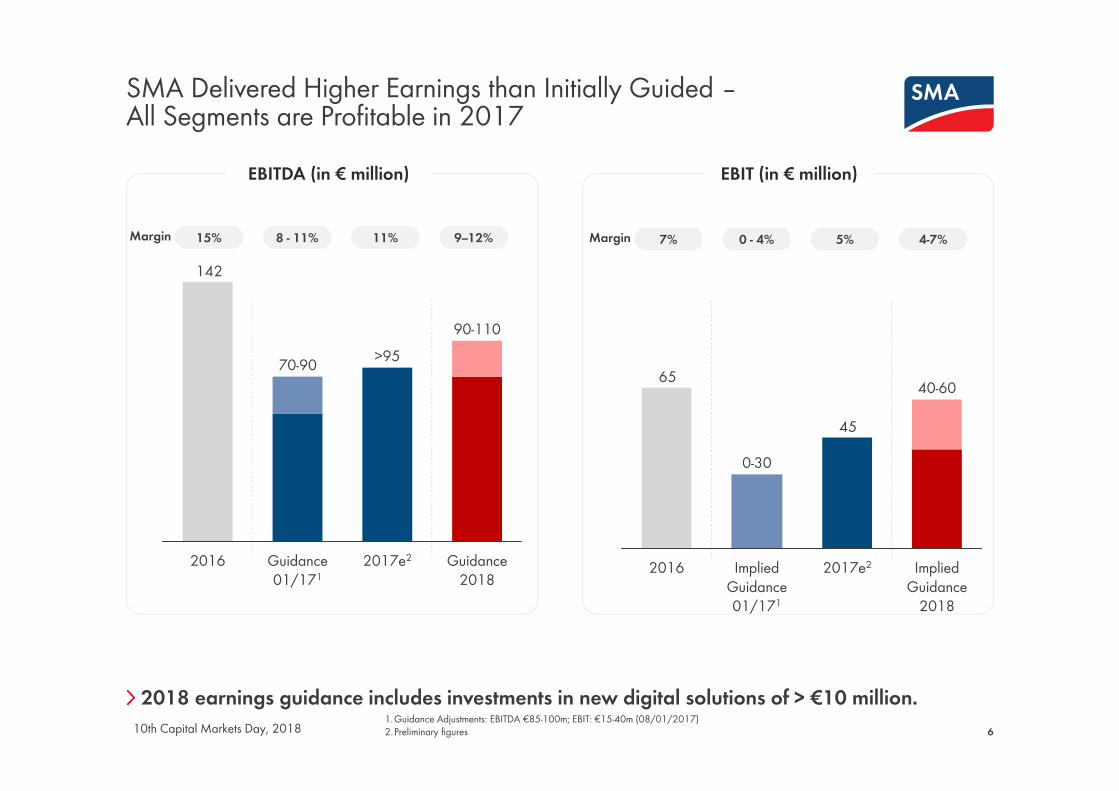
SMA Delivered Higher Earnings than Initially Guided –All Segments are Profitable in 2017
6
2018 earnings guidance includes investments in new digital solutions of > €10 million.
EBITDA (in € million) EBIT (in € million)
10th Capital Markets Day, 2018
15% 11%Margin 8 - 11%
142
Guidance 2018
90-110
2017e2
>95
Guidance 01/171
70-90
2016
9--12% 7% 5%Margin 0 - 4%
45
65
Implied Guidance
2018
2017e2Implied Guidance 01/171
0-30
2016
40-60
4-7%
1.Guidance Adjustments: EBITDA €85-100m; EBIT: €15-40m (08/01/2017)2.Preliminary figures
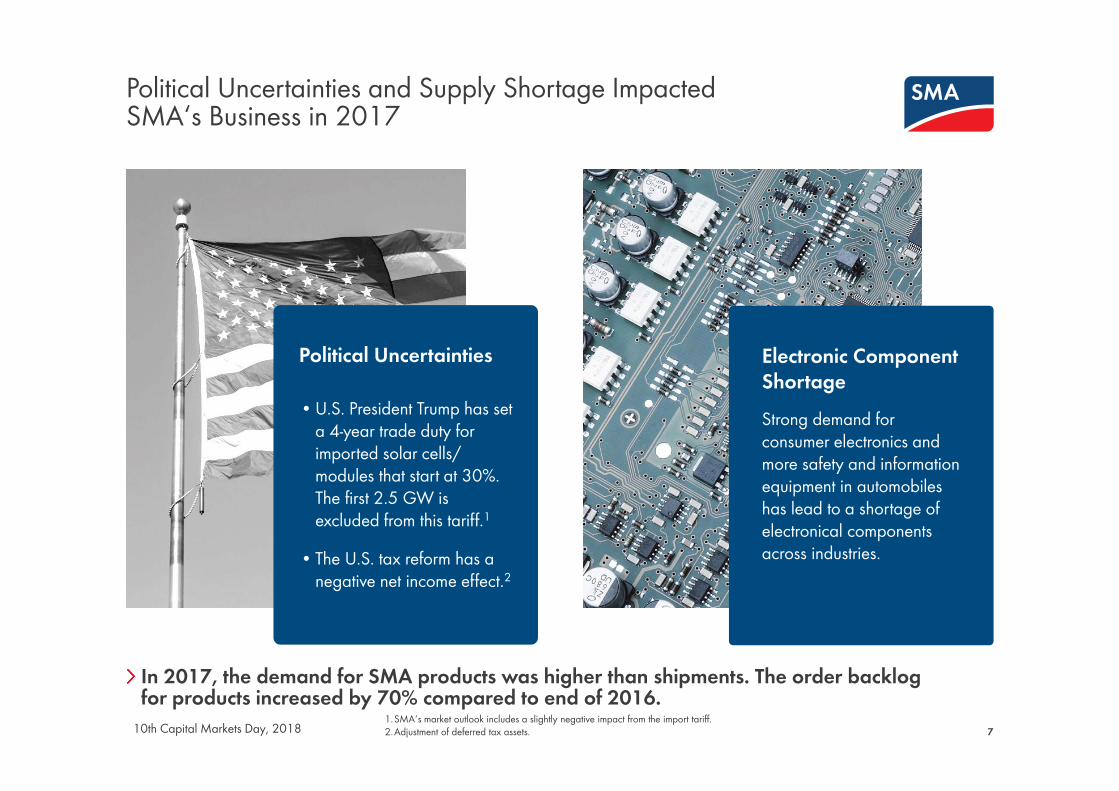
Political Uncertainties and Supply Shortage Impacted SMA‘s Business in 2017
7
In 2017, the demand for SMA products was higher than shipments. The order backlog for products increased by 70% compared to end of 2016.
10th Capital Markets Day, 2018
Political Uncertainties
• U.S. President Trump has set a 4-year trade duty for imported solar cells/ modules that start at 30%. The first 2.5 GW is excluded from this tariff.1
• The U.S. tax reform has a negative net income effect.2
Electronic Component Shortage Strong demand for consumer electronics and more safety and information equipment in automobiles has lead to a shortage of electronical components across industries.
1.SMA‘s market outlook includes a slightly negative impact from the import tariff.2.Adjustment of deferred tax assets.

Bilder Fertigung
SMA Implements its Strategy as Planned to Open up New Profit Pools
810th Capital Markets Day, 2018
LEAN OPERATIONS
• Manufacturing Excellence Award
• Re-energize SMA America
• Disposal of non-core assets (SMA Railway)
SHAPING THE DIGITAL ENERGY REVOLUTION
• New business units for energy services and data driven offerings
• MVV1 is new strategic partner for direct marketing of solar power
• EnnexOS is SMA‘s new platform for energy management
STRENGTHENING MARKET LEADERSHIP
• New large accounts such as Sunrun
• 12% market share in captive market Japan
• 21% market share in price sensitive market India
• 2.6 GW O&M under mgmt.
1 MVV: Leading German energy company with sales >€4bn2 Sunrun: Largest dedicated residential solar company in the US (160.000+ customers)

2. Megatrends

Megatrends are Transforming the Electricity Ecosystem
10
SMA will leverage its existing experience to expand into digital solutions.10th Capital Markets Day, 2018
1 2 3 4Decarbonizationis leading to an expansion of PV capacity, which in turn fosters decentralization and the demand for storage systems
Sector convergenceis providing new means of flexibility –Managing the resulting complexity is creating demand for new energy solutions
The structural transformation of the energy systemwill require solutions to control and manage the increasingly decentralized grid enabled by digitalization
Disruption in the electricity industrycreates new roles to be played by traditional OEMs1 along the entire value chain
1. OEM: Original Equipment Manufacturer

Decarbonization is Expanding PV Capacity, which in turn Fosters Decentralization and Storage Demand
11
Decarbonization is driven by political targets.4
Annual PV capacity additions by scenario
(GW p.a.)1
Cumulative global storage capacity
(GW)3
10th Capital Markets Day, 2018
Decentral vs. central generation share
(% of TWh)2
140
480620
170
820
1600
2020 2030 2040Growth Scenario Breakthrough
Policies, sustainability concerns and strong growth in primary energy demand drive expansion of PV capacity
0%
10%
20%
30%
40%
50%
2020 2030 2040
Integrated solutions, energy management and data-based offerings lead to an increasingly decentralized energy system
0
1000
2000
3000
2020 2030 2040
High share of renewables results in increased volatility and requires capacity balancing and optimization
1 Fraunhofer-Institute for Solar Energy Systems, 20152 Bloomberg New Energy Outlook, 2017: Ratio of non-grid scale (PV, batteries, demand response) to total installed capacity in moderate PV growth scenario3 Bloomberg New Energy Outlook, 2017: Capacity of small scale batteries and utility scale batteries4 Paris agreement from 2015 within the United Nations Framework Convention on Climate Change
Japan
China
Germany
Australia
USA

Sector Convergence Provides new Means of Flexibility –Managing the Resulting Complexity Requires Intelligent Control
Variable power prices and new technologies add new options for energy transfer between sectors.
1 Power-to-Storage
2 Power-to-Heat
3 Power-to-Gas 4 Power-to-Gas Fuels5 Power-to-Motion
1
Power Sector
3
2
4
Transport Sector
Gas Sector
Heat / Cooling Sector
12
5 3
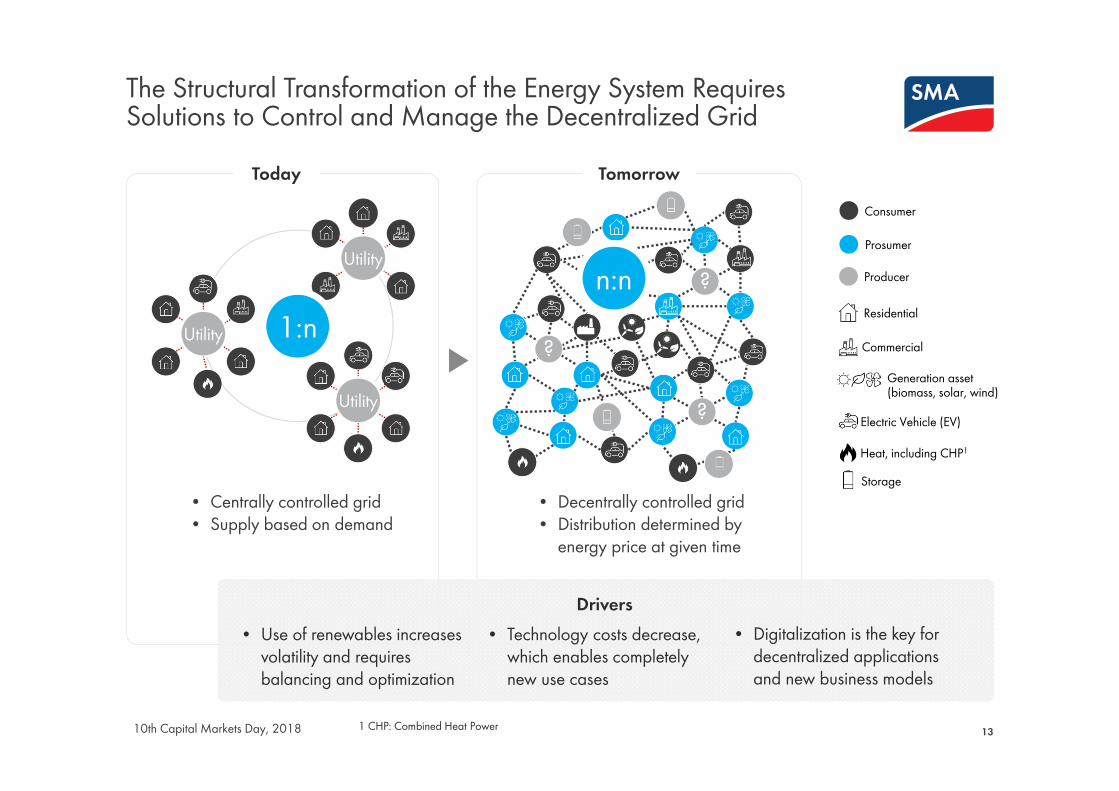
The Structural Transformation of the Energy System Requires Solutions to Control and Manage the Decentralized Grid
13
Today Tomorrow
10th Capital Markets Day, 2018
• Centrally controlled grid• Supply based on demand
• Decentrally controlled grid• Distribution determined by
energy price at given time
Consumer
Prosumer
Producer
Residential
Generation asset (biomass, solar, wind)
Commercial
Electric Vehicle (EV)
Heat, including CHP1
Storage
Drivers• Use of renewables increases
volatility and requires balancing and optimization
• Technology costs decrease, which enables completely new use cases
• Digitalization is the key for decentralized applications and new business models
Utility
Utility
Utility
1:n?n:n
?
?
1 CHP: Combined Heat Power

Disruption in the Energy Industry Creates New Roles to be Played by Traditional OEMs Along the Value Chain
1410th Capital Markets Day, 2018
The solar inverter is the key sensor to collect energy data. SMA has the data analytics and energy management know-how to create new services.
Market Trends
• Energy value chain is expanding to storage & balancing and energy management
• As technological progress accelerates and power prices continue to decline, the integrated utility model becomes less attractive
• Highly competitive and specialized players enter the market to capitalize on their capabilities and resources, leveraging economies of scale
• Additionally peer-to-peer networks emerge
Emerging Player Landscape
Traditional players New players
Traditional value chain steps New value chain steps
Power systems OEMs
Power generation
Storage & balancing
Power Trading
Trans-mission/ Dis-tribution
Power sales
Energy Management(hard-/software)
Systemsmanufacturing
IPPs & infrastructure funds
Prosumers
VPPs & EV Fleet operators
Grid aggregators
Diversified retailers
P2P Networks
Trading houses
Automotive OEMs
Appliance OEMs
Construction companies
Digital & Tech players
Integrated utility
PV component
OEMs
OEM: Original Equipment ManufacturerIPPs: Independent Power Producer
VPPs: Virtual Power Plant, EV: Electric VehicleP2P: Peer-to-Peer

3. Market and Competition

Positive Global Outlook of +10% Volume Growth p.a. Until 2020
16
New growth regions2 become relevant in the near future.1.SMA Market Model Q1 2018; New PV installations, Res ≤10kW plants, Com >10kW to
1MW plants, Uti >1MW plants 2.E.g. Middle East, Mexico, South East Asia
10th Capital Markets Day, 2018
Core Business: PV Installations (GWdc)1
Market Trends
The volume growth in the EMEA and APAC regions is expected to continue.
Growth rates are between 25% and 15%
p.a.
China remains the largest market but
with a rather flattish development.
The utility and commercial segments account for >85% of total volume. Strong growth of 26 GW
(+9% p.a.) is expected until 2020.
Growth in mature markets is driven by the competitive costs of solar power and
significant battery penetration for self-
consumption.
Effective programs drive fast growth from a small base in many countries
(e.g. Indonesia) or help to reach ambitious political
targets (e.g. India).
REGIONS SEGMENTS
2416 17 22 2620 2630 3353 5050
53
201613
136
2020
122
201920182017
102 109
ChinaAPAC
EMEAAMER 25 29 32 35
65 67 73 81
201613
2020
136
2019
122
2018
109
2017
101
11
CommercialUtility
Residential
in GW in GW
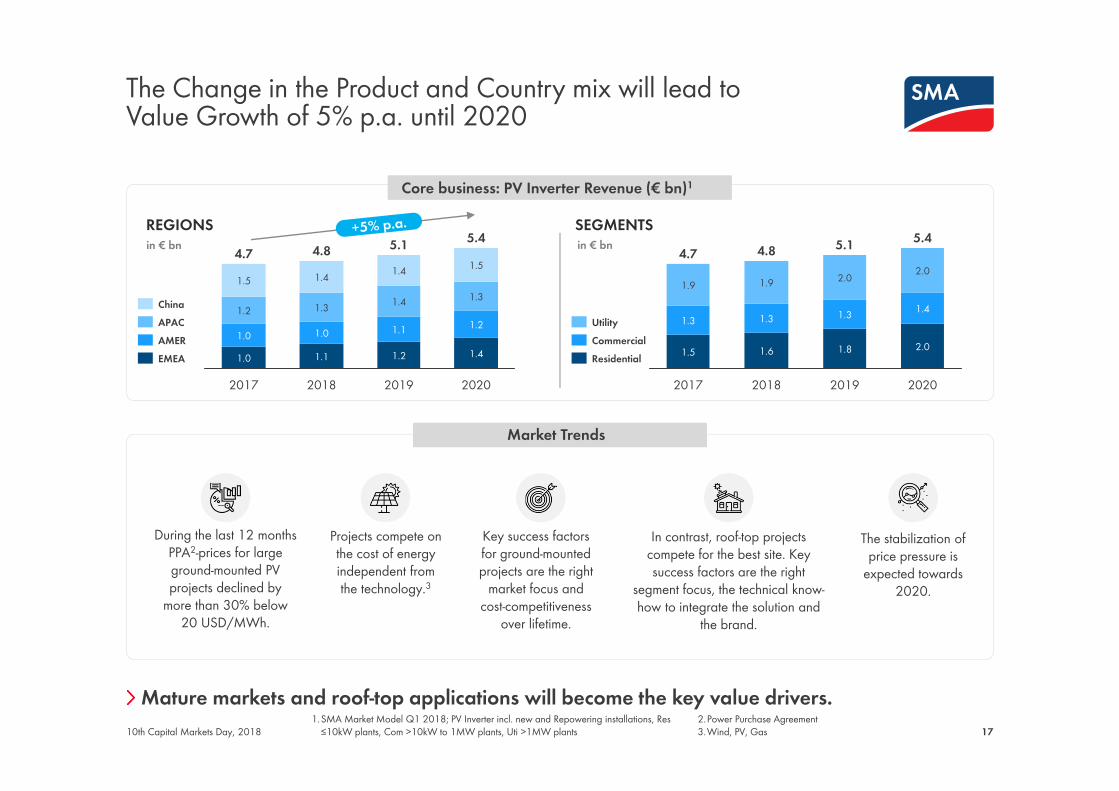
The Change in the Product and Country mix will lead toValue Growth of 5% p.a. until 2020
17
Mature markets and roof-top applications will become the key value drivers.1.SMA Market Model Q1 2018; PV Inverter incl. new and Repowering installations, Res
≤10kW plants, Com >10kW to 1MW plants, Uti >1MW plants 2.Power Purchase Agreement3.Wind, PV, Gas10th Capital Markets Day, 2018
Core business: PV Inverter Revenue (€ bn)1
Market Trends
During the last 12 months PPA2-prices for large ground-mounted PV projects declined by
more than 30% below 20 USD/MWh.
Projects compete on the cost of energy independent from the technology.3
Key success factors for ground-mounted projects are the right
market focus and cost-competitiveness
over lifetime.
In contrast, roof-top projects compete for the best site. Key success factors are the right
segment focus, the technical know-how to integrate the solution and
the brand.
The stabilization of price pressure is
expected towards 2020.
REGIONS SEGMENTS4.7
1.0
1.0
2017
1.3
1.4
1.4
2018
1.1
1.0
4.8
1.1
1.4
1.2
1.5
2020
1.4
1.55.1
1.2
1.2
5.4
1.3
2019EMEAAMERAPACChina
1.9
1.3
1.5
4.7
1.6
1.3
2.0
1.3
2018
4.8
1.9
2017
1.4
2.0
2019
1.8
5.1
2020
2.0
5.4
UtilityCommercialResidential
in € bn in € bn

PV Projects >250 kW move Towards long-term Service Contracts –Battery Storage will Accelerate Growth in Service
18
Core Business: Annual New O&M Contracts by Region1
Market Trends
As Capex for equipment constantly declines, after sales and O&M service
are becoming more important.
In mature markets O&M is a business on its own. Independent service
providers (ISP) are selected separately from the EPC to ensure data
integration, analytics and qualified PV technicians.
For large-scale PV plants investors/asset managers reject
string inverters due to the potential of slower outage response time and higher O&M service costs.
The fast growing battery storage business offers
huge growth potential for ISP with technical expertise
and global service infrastructure.
REGIONSin GW in € bn
Contracts shift from all-inclusive, fixed price models to service plans and customer specific scope of work
10th Capital Markets Day, 2018
GLOBAL
1.2
0.9
2017
1.3
1.0
2018
1.3
1.0
2019
1.4
2020
1.0
25 29 3516 19 23 2722 29 35 415055
6067
21
109
2017 2018
128
2019
147
2020
170
China
EMEAAMERAPAC
Partial O&MFull O&M
1.SMA Market Model Q1 2018; Commercial and Utility segments available for being addressed with new contracts

19
Storage Inverter Installations and Revenues1
Market Trends
Battery storage price reduction is
the most important growth driver for nano- and micro-
grids.
Mature markets will adopt first to
increase residential share (eg. US, EU, JP).
SMA expects storage prices of <750 €/kWh
for residential applications and
<300 €/kWh for utility applications by 2020.
Battery storage can address many use cases in
parallel2. Therefore, competencies in grid
integration and battery technologies are key to untap market potential.
Since every application is different, significant
customization is needed to untap full
potential.
REGIONS
The share of system technology in different battery application is significantly higher compared to the
traditional PV inverter business.
in GW
Battery Storage will Increasingly be Integrated in New and Existing PV Systems and thus Increase Complexity
Greater complexity will lead to lower commodization of PV inverter equipment.10th Capital Markets Day, 2018
2017
0.60.9
3.31.8
1.8
2020
6.6
1.6
3.2
1.2
2.7
0.91.5
2019
2.2
5.4
1.2
2018
4.3
CommercialResidential
Utility
in GWSEGMENTS3
0.2
0.6
1.30.6
2020
6.6
2.31.9
2.2
1.2
1.91.7
2018
4.3
2017
0.7
0.9
5.4
3.3
0.4
0.9
0.3
1.5
1.6
1.0
0.3
1.1
2019
AMER
ChinaAPAC
EMEA
1.SMA MI Market Model Q1 2018 2.E.g. ancillary services, congestion relief, energy shifting, etc.
3.Residential and Commercial incl. behind-the–meter and off-grid remote applications; Utility incl. In-the-grid, co-located and micro-grid applications
in € bnRevenue
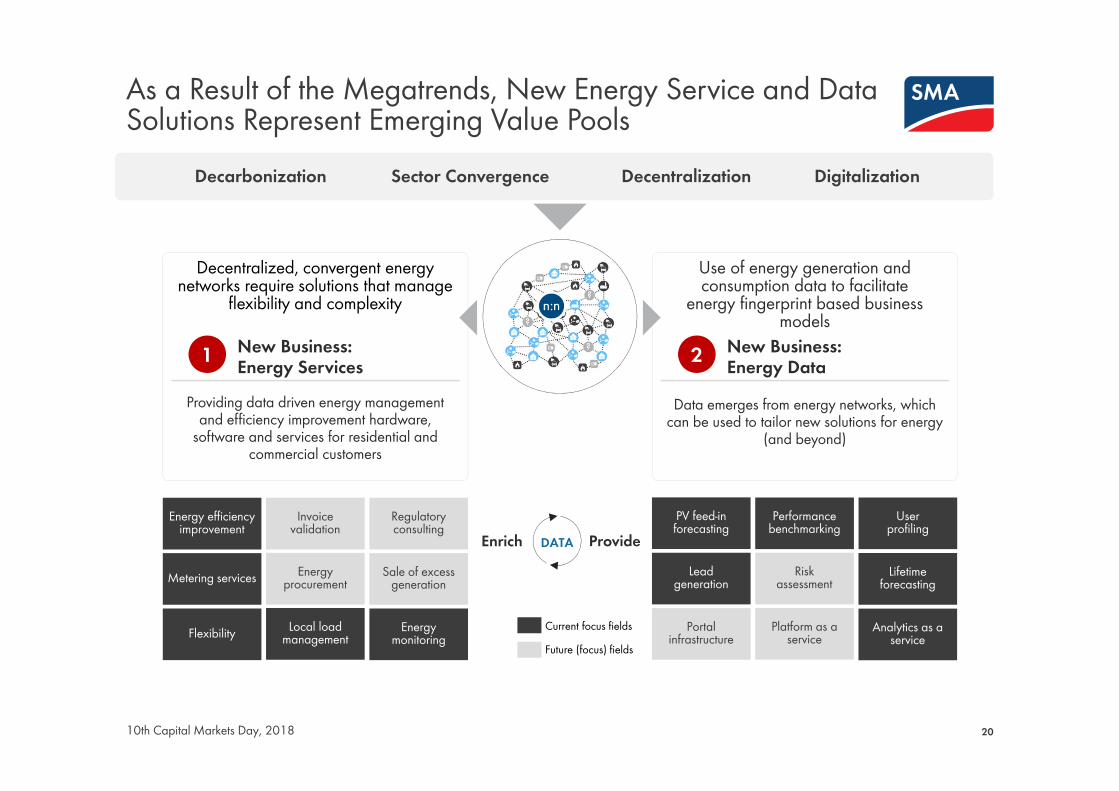
New Business:Energy Services
New Business:Energy Data
As a Result of the Megatrends, New Energy Service and Data Solutions Represent Emerging Value Pools
Current focus fieldsFuture (focus) fields
Data emerges from energy networks, which can be used to tailor new solutions for energy
(and beyond)
PV feed-in forecasting
Performance benchmarking
User profiling
Lead generation
Risk assessment
Lifetime forecasting
Portal infrastructure
Platform as a service
Analytics as a service
Providing data driven energy management and efficiency improvement hardware,
software and services for residential and commercial customers
Energy efficiency improvement
Invoice validation
Regulatory consulting
Metering services Energy procurement
Sale of excess generation
Flexibility Local load management
Energy monitoring
Decentralized, convergent energy networks require solutions that manage
flexibility and complexity
20
Decarbonization Sector Convergence Decentralization Digitalization
1 2
Use of energy generation and consumption data to facilitate
energy fingerprint based business models
Enrich ProvideDATA
10th Capital Markets Day, 2018

Value Pools from the Addressable Market for Selected Energy Services are Expected to be as High as €2.3 bn in 2022
21
Selected EU
USA
GER2022
2,300
2021
1,870
2020
1,360
2019
720
2018
390
All of USASelected EU
Total marketenergy services
Addressable market
2020
2022
SMA2020
Regions
GermanyUS/NYUS/CA
All of EUAsia
Additionaluse cases
In 2022 addressable market for the four considered use cases can reach €880 m for food-retail stores, €650 m for family homes, €640 m for non-food retail chain stores and €120 m for multi-tenant housing
Total market Addressable market (in € m) 1
1.Roland Berger calculations: Relevant buildings are derived from the number of family homes, multi-tenant housing, non-food and food retail stores based on census data and forecasted adoption rates of energy management solutions. The market value per building is calculated based on energy savings potential and the savings share attributable to energy management solutions (8-40 % depending on the use case). A regional scaling is applied to adjust the market share addressable by an energy service provider in USA and European countries between 2017 and 2022 (from 0% to 10-40% depending on the country and use case)10th Capital Markets Day, 2018
4 use cases:
To capture these value pools, an automated management of relevant energy sources and demand is required
Family homes Mutil-tenant houses Non-food retail Food retail

Additionaluse cases
All of USASelected EU
Total marketenergy data
Addressable market
2020
2022
SMA2020
Regions
GermanyUS/NYUS/CA
All of EUAsia
55 use cases identified
Selected EU
DEU2018
USA
35
2019
65
2020
135
2021
270
2022
415
Total market Addressable market (in € m)1
Value Pools from Energy Data are Emerging – Value Pools from Lead Generation Alone Could be €415 m in 2022
22
1. Roland Berger calculations: Number of energy-data based leads derived from marketing budget for digital market content (22% of total marketing budget) by country and type of household appliance (major, small) adjusted for an usage rate of energy data starting at 0% in 2017 and growing to 80% in 2022 (comparable to rates in early internet advertising). Number of leads valued at costs per lead for digital content marketing in manufacturing. A regional scaling is applied to adjust the addressable share over time from 0% in 2017 to 100% in 2022 in USA and European countries. 10th Capital Markets Day, 2018
Lead generation for household appliances1 use case:
With other use cases the addressable market from energy data can be a manifold of the €415 m (2022) for lead generation
Access to data and technologies for data collection and analysis are required to capture this value pool

> The megatrends decarbonization, technical cost decrease, sector convergence and digitalization will lead to a higher share of renewable energy and its growth.
> The need for digital solutions and battery storage will create new value pools.
> PV-inverters will serve as the backbone for smart grids solutions connecting the components and collecting data.
> The traditional PV market is expected to grow in volume and value until 2020. EMEA and APAC as well as Utility and Commercial are key growth markets.
> O&M services gain importance with continuously declining equipment prices and are key for sustainable PV investments
The Disruption in the Energy Sector will Open up New Value Pools for Technology Driven Companies such as SMA
23
SMA has a clear understanding how to approach digital solutions and battery storage and builds upon world market leader position and strong financials.
in € bn
+14%
2020
5.4
2019
1.5
1.3
8.0
9.2
1.1
2018
1.00.80.9
5.2
0.9
7.0
4.7
2017
4.9
6.2 0.40.71.0
0.6
Core and New Business: Global Market Outlook by Sector (in € bn) Market Summary
Digital solutions O&M servicesBattery storage inverters PV inverter business

SMA is the World Market Leader for PV Inverters and theBest Known Inverter Brand1
24
1. IHS PV Inverter Customer Insight Survey 20162.Based on Revenue, SMA estimate3.Based on MW, IHS and SMA estimate
4.China Export Customs data Jan-Nov 20175.Only one / few markets and one technology (e.g. string / optimizer)
Company Market share20172
Trend2016 -> 2017
Segment Split3 Main Markets3
Residential Commercial Utility #1 #2 #3
SMA 14% US IN AU
Comp. 1 13% CN -- --
Comp. 2 11% CN EU --
Comp. 3 6% IN EU US
Comp. 4 5% US EU --
The traditional PV inverter market is rather concentrated (Top 5 players c. 50 %)
Market share gains of Chinese competitors is very much driven by strong growth in China. Top players shipped only c. $280m into international markets in 2017.4Large conglomerates are too inflexible to adapt to fast changing markets. Inverter specialists5have a much higher risk exposure and limited economies of scale.
10th Capital Markets Day, 2018
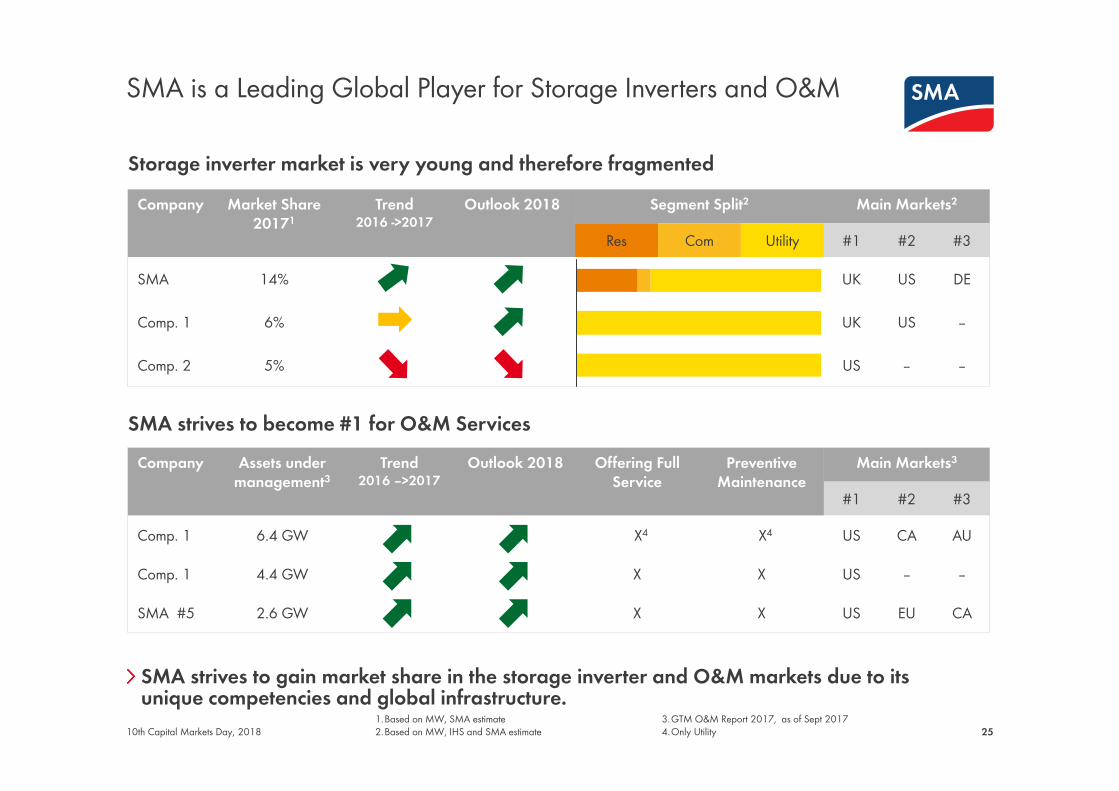
SMA is a Leading Global Player for Storage Inverters and O&M
25
SMA strives to gain market share in the storage inverter and O&M markets due to its unique competencies and global infrastructure.
1.Based on MW, SMA estimate2.Based on MW, IHS and SMA estimate
3.GTM O&M Report 2017, as of Sept 20174.Only Utility
Storage inverter market is very young and therefore fragmentedCompany Market Share
20171Trend
2016 ->2017Outlook 2018 Segment Split2 Main Markets2
Res Com Utility #1 #2 #3
SMA 14% UK US DE
Comp. 1 6% UK US --
Comp. 2 5% US -- --
SMA strives to become #1 for O&M ServicesCompany Assets under
management3Trend
2016 –>2017Outlook 2018 Offering Full
ServicePreventive
MaintenanceMain Markets3
#1 #2 #3
Comp. 1 6.4 GW X4 X4 US CA AU
Comp. 1 4.4 GW X X US -- --
SMA #5 2.6 GW X X US EU CA
10th Capital Markets Day, 2018

4. Strengthening Core Business

27
Smart Technologies Change the Energy Sector Quickly -Connectivity and Integrated Solutions Become the New Standard
Expand new business
Storage Integration to Enable many New Use Cases
New Services to Reduce the Cost of Electricity
Data Analytics to Improve Efficiency
Strengthening core business
Excellent O&M Services, Quality due to Best-in-class Testing and Compliance
Continuous Push in all Segments and all Regions
Cost Competitiveness with New Technologies and Higher Power Classes
10th Capital Markets Day, 2018

SMA Offers Full Suite of Multi-Vendor Operations and Maintenance Services in Selected Markets
28
In 2017, SMA increased PV plants under O&M contracts by 50% from 1.7 GW to 2.6 GW.
10th Capital Markets Day, 2018
Safety and Expert Training
Monitoring, Control &Reporting
Preventive Maintanance
Ancillary Services
Innovative Services Thermal Imaging
Use Case: Multi-Vendor O&M Services
1.Net present value2.Assuming €0.10/Kwh
Repair & Warranty Administration
+98%+99%Plant Performance
Guarantees
• Full Suite & multi-vendor O&M services• Commercial and Utility PV plants
Regional Focus:
• EMEA: GER, UK, France, Spain, Italy• Americas: U.S., Canada, Mexico, Chile• APAC: Australia and Japan
Segment Focus:

SMA Strives To Become #1 O&M Provider in the World
29
A change of 1% availability results in an NPV difference of €2 million over 25 years.11.Net present value; assuming €0.10/KWh
Success Factors & Key Project Wins 2017 (Non-SMA PV Plants)
Quilapilun (110 MWdc), Chile Javiera (70MWdc), Chile
10th Capital Markets Day, 2018
• Global service network ensures proximity and best price point• Innovation in O&M delivery, driving continuous improvements to OPEX costs over life of PV plant• Proven record of increasing yield up to 30%, achieving 99.9+% availability • Influencing investors to chose SMA Inverters + SMA O&M Services to ensure sustainable investment

SMA has Excellent Competencies to Handle the Complexity of Centralized Utility-Scale Power Plants
30
SMA Utility provides its customers up to 99.998% uptime.1.PPA: Power purchase agreement10th Capital Markets Day, 2018
• Increase power size to 6MW
• Reduce 50 % installation costs with pre-tested MV Power Station (40” container)
• Provide advanced grid stability functions (eg. active & reactive power, frequency control)
• Allow high DC/AC-ratios (up to 200%) to reduce specific cost
• Backing our quality promise with contractual commitment
• Introduce bundled offers (equipment and services) to reduce inverter-life-time-cost by up to 20% (Profit+)
Segment Focus Centralized Plant Layout:
Regional Focus: • Worldwide (w/o China), incl. UL and JET-certification
• Turnkey solution incl. PV inverter, DC-combiner, MV-system, storage plant communication and grid control
• Services (eg. Comissioning, grid studies
Use Case Utility: PPA1 Driven Business Model
Success Factors
Medium Voltage Turnkey Solution, up to 6MW 201820162014 2020
+70%
• Repowering demand is increasing as the globally installed base grows older (CAGR >+40% until 2020).
Repowering Market Potential (in GW) New business model: Profit+
Shift 30% CAPEX to OPEX

SMA Offers the Best Technical Solution for Utility-Scale Power Plants with Complex System Design
31
The new products will help SMA to serve complex ground-mounted PV plants.
Improve Cost Competitiveness• Two inverter platform for all global
markets• Increase power size to 150 kW• Higher integration to enhance
power : weight-ratio, optimized installation and O&M
1 PPA:Power purchase agreement2 MV: Medium Voltage
3 Only modules that require optimization are equipped with the SMA optimizer solution (Power+)
Segment Focus: • 3phs inverters for power sizes of up to 150kW• Two product lines to serve solution and value markets• MV2 system for multi MW PV power plants
Regional Focus: • Worldwide, incl. UL and JET certification
Strategic Success Factors
Use Case Utility: PPA1 Driven Business Model
SUNNY HIGHPOWERNext Generation (2019)
SUNNY HIGHPOWER PEAK1 (2018)
60 kW, 1,000 V
SMA Solid-Q (2018)
10th Capital Markets Day, 2018
75 kW, 1,000 V 150 kW, 1,500 V
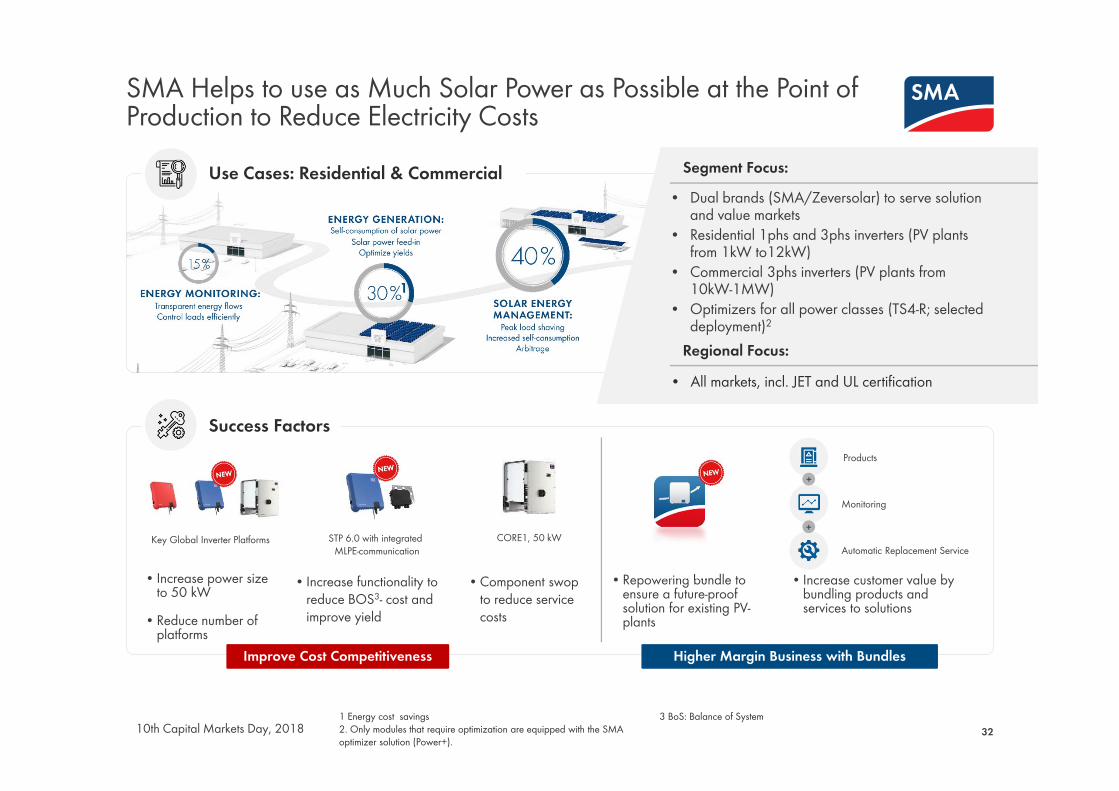
SMA Helps to use as Much Solar Power as Possible at the Point of Production to Reduce Electricity Costs
32
CORE1, 50 kW
Products
Monitoring
Automatic Replacement Service
Use Cases: Residential & Commercial Segment Focus: • Dual brands (SMA/Zeversolar) to serve solution
and value markets• Residential 1phs and 3phs inverters (PV plants
from 1kW to12kW)• Commercial 3phs inverters (PV plants from
10kW-1MW)• Optimizers for all power classes (TS4-R; selected
deployment)2
Regional Focus: • All markets, incl. JET and UL certification
Success Factors
• Increase power size to 50 kW
• Reduce number of platforms
• Increase functionality to reduce BOS3- cost and improve yield
• Component swop to reduce service costs
Improve Cost Competitiveness Higher Margin Business with Bundles
• Repowering bundle to ensure a future-proof solution for existing PV-plants
• Increase customer value by bundling products and services to solutions
+
+
1 Energy cost savings2. Only modules that require optimization are equipped with the SMA optimizer solution (Power+).
3 BoS: Balance of System
Key Global Inverter Platforms STP 6.0 with integrated MLPE-communication
10th Capital Markets Day, 2018
1

SMA’s Integrated Solutions will help to Optimize the Energy CostsAcross Sectors
33
SMA has the know-how to create integrated solutions for commercial applications.
Sunny Boy Storage 6.0
• Storage system technology for all battery types and power classes
• Energy Management Platform• Complete offering from power generation to
energy trading
• Europe, USA, Japan, Australia
Improve Margin With Storage – and Energy Management Solutions
• Expand storage portfolio for residential & commercial applications (H1/2018)
• Global roll-out of ennexOS energy management platform and introduction of additional APPs to increase customer value (H2/2018)
• Form strategic alliances for integral solutions
Segment Focus:
Regional Focus:
Success Factors
New Use Cases: Residential & Commercial
Sunny Tripower Storage 60Danfoss Cooling
10th Capital Markets Day, 2018
1
1. Energy cost savings

5. Expand into New Business

35
Smart Technologies Change the Energy Sector Quickly -Connectivity and Integrated Solutions Become the new Standard
Expand new business
Storage Integration to Enable many New Use Cases
New Services to Reduce the cost of Electricity
Data Analytics to Improve Efficiency
Strengthening core business
Excellent O&M Services, Quality due to Best-in-class Testing and Compliance
Continuous Push in all Segments and all Regions
Cost Competitiveness with New Technologies and Higher Power Classes
10th Capital Markets Day, 2018

SMA is the First Mover of its kind in the Digital Energy Solutions Business
SMA has in-depth energy economical know-how and unparalleled access to energy data to create new business models.
10th Capital Markets Day, 2018
SMA USP1
SMAUnder-standingSMAOffering
Collection/analysis of energy related data (i.e. from PV installations) to provide data-based services
• Available technology platform across sectors• Access to 300,000 PV systems provides data from >1.5 m devices, allowing to create a worldwide database and data
services as well as for integrating energy service solutions
SMA approach to digital solutions
1 Energy servicesProvision of energy-related services for private (white-label) and commercial customers
2 Energy data
Enrich ProvideDATA
1.Unique Selling Proposition
SMA Digital Solutions
Energy data
P2P Trading and Local Load Mgmt.
Energy Efficiency Improvement
Flexibility Marketing
Energy Monitoring
Cross-sectoral Energy Mgmt.
Portal-as-a-Service
Data analysis
Energy analysis
Energy trading platform
36

SMA Envisions a Transformation to a Holistic Service Offering in a Decentral, Integrated Energy World
Residential Customers
Commercial Customers
Degree of service comprehensiveness
Degree of energy integration
Energy Transparency
EnergyOptimization
Energy Management
Decentral Energy Integration
Services encompass transparency solutions for energy consumption and
composition
Services encompass targeted recommen-dations for energy
optimization and efficiency improvement options
Services encompass anautomated management
(monitoring, control, optimization) of relevant
energy source and demand components – energy
accounts are managed individually andindependently
Services encompass aholistic governance of integrated, decentral
energy prosumers and consumers – individual energy accounts are
integrated into a decentral energy market, managed by energy service
provider
1st stage 2nd stage 3rd stage 4th stage
Energy source and demand composition covered by service
Power
Power +Heat/Cooling
Stages of Energy Service Transformation
PV Power
Grid feed-in/supply
CHP
Gas supply
Battery storage
EV
Heat pumps
Thermal storage
Residential/commercial clients
3710th Capital Markets Day, 2018

38
Energy Services are a Substantial Lever of Efficiency Gains and Service Innovation for Commercial Clients
Case Study – Supermarket
• Setup of a 500kW solar carport at a supermarket branch of a leading supermarket player
• Produced solar power is used in supermarket and shopping mall, covering 15% of the overall, annual power demand
Today
• Implementing charging stations for electric vehicles of supermarket customers
• Integrated system of modules for energy sources (e.g. PV systems, combined heat and power units, heat pumps) and energy consumption (e.g. heating, air conditioning, cooling, lighting)
• Implementation of a prosumer-based, virtual power plant with other, decentralized power generation units
Tomorrow
SMA Solutions
Involved Parties
Future Parties1
Sunny Places& Portal
PV CHP EV Grid feed-in/supply
Thermal storage
Heat pumps
Battery storage
Gas supply
1. Joint Venture plannend10th Capital Markets Day, 2018
Danfoss Cooling

The Processing and Use of Energy Data is Gaining Momentum –SMA in Stellar Starting Position
10th Capital Markets Day, 2018
> Data from 100,000 monitored PV systems> 5 minute averages transmitted every 5 minutes> Aggregated to 5 digit ZIP codes
> SMA provides plausibilized and aggregated near-time data from 26,000 PV systems within the TenneT control area
> TenneT uses those data points among others for precise and geographically highly resolved PV projections and forecasts, reduced need of control reserve and congestion management
> Annually, network grows by over 60,000 additional systems globally
> International rollout to regions in Europe, North America and Australia with high PV penetration and strong SMA data coverage
> Additional data points reflecting on-site consumption and locally stored energy will further enhance quality and comprehensiveness
PV power in Germany from June 14, 2016:
Case Study Insights – TenneT TSO
Today Tomorrow
SMA Solutions
Involved Parties
SMA Data Portal>1.5 m solar inverters
Data analytics
Energy forecast
39

An Energy Service Business Could Make Potential Revenues of up to €50 m in 2020 from the Four Use Cases
40
With its current focus SMA is planning with revenues of € 15 m in 2020 from energy services thus having strong upside potential.
1. Varies by use case and country and is increasing over time2. Based on a benchmarking of EBITDA margins of digital data/platform companies10th Capital Markets Day, 2018
2018 20202019 20222021
SMA’s addressable market (top-down calculation)4 use cases only
Revenue potential (€ m)
Food retail storesNon-food retail chain storesMutil-tenant housingFamily homes
Addressable market 2018-2022€ 390 – 2,300 mMarket share1 1% –12%
4
115
210
50
20
€ 7.5-12.5 m15-25% 2
Profit Potential in 2020(€ m)
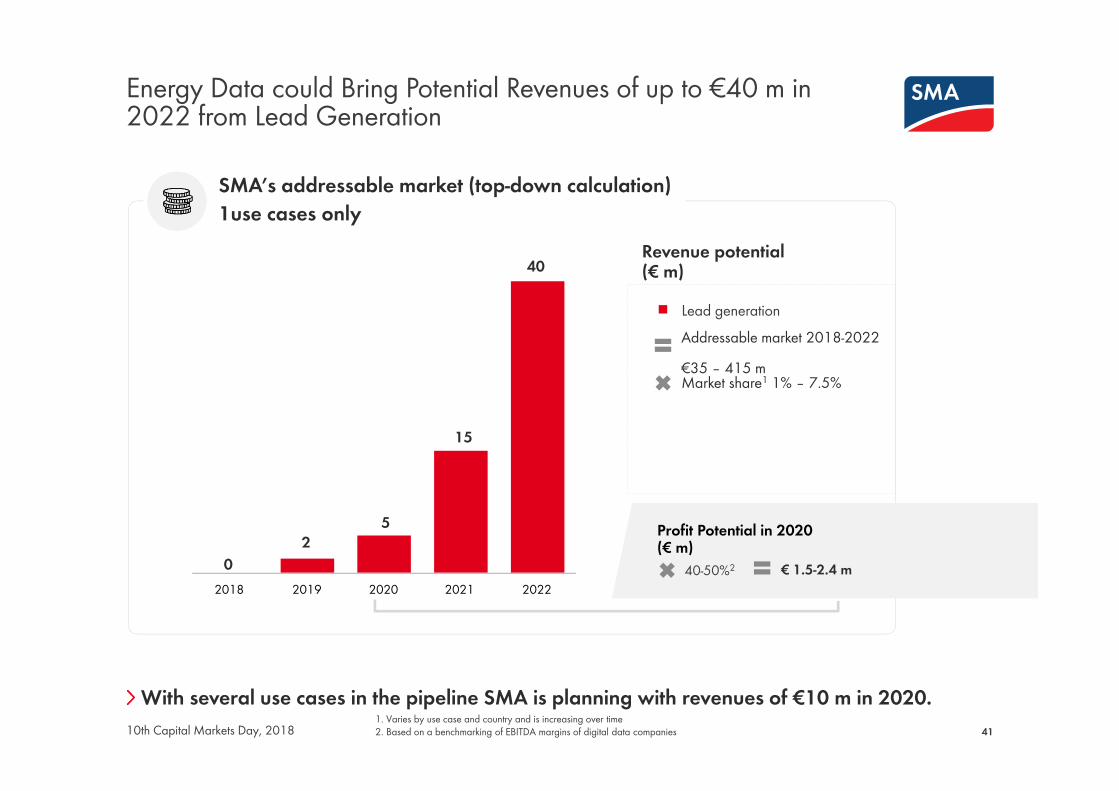
Energy Data could Bring Potential Revenues of up to €40 m in 2022 from Lead Generation
41
With several use cases in the pipeline SMA is planning with revenues of €10 m in 2020.
02
5
15
40
1. Varies by use case and country and is increasing over time2. Based on a benchmarking of EBITDA margins of digital data companies
SMA’s addressable market (top-down calculation)1use cases only
Revenue potential (€ m)
Lead generationAddressable market 2018-2022€35 – 415 mMarket share1 1% – 7.5%
2018 20202019 20222021€ 1.5-2.4 m40-50%2
Profit Potential in 2020 (€ m)
10th Capital Markets Day, 2018
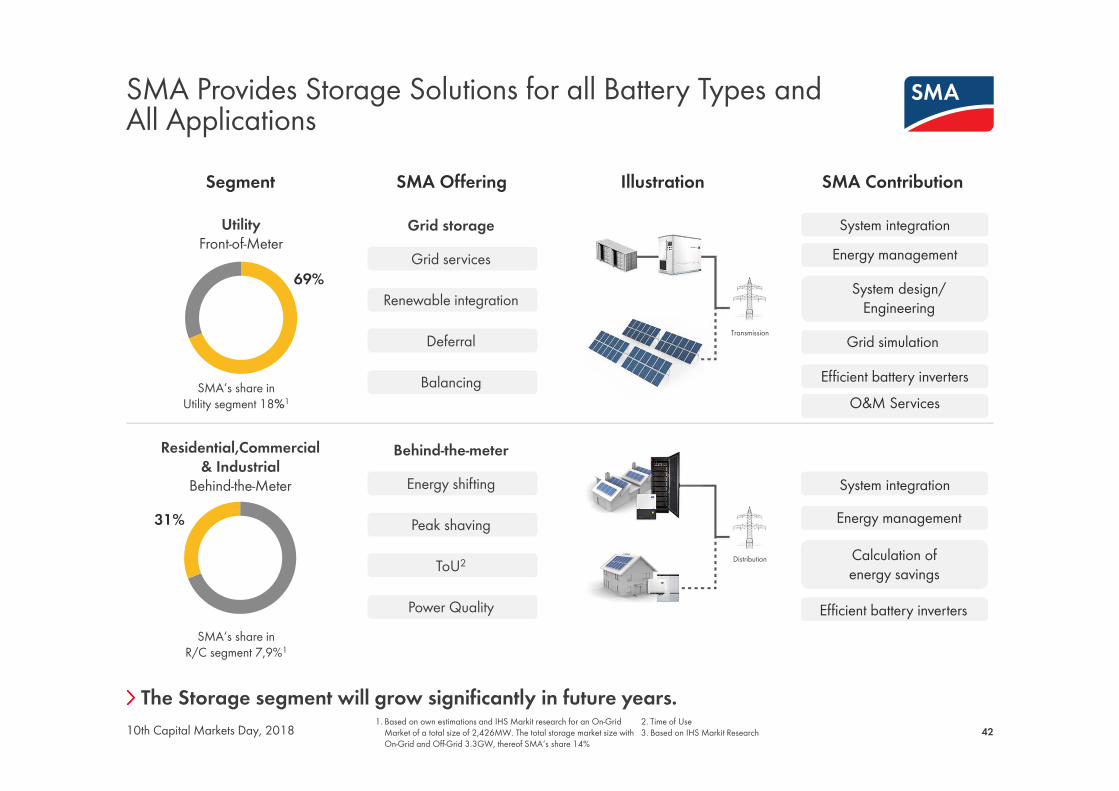
SMA Provides Storage Solutions for all Battery Types andAll Applications
42
The Storage segment will grow significantly in future years.1. Based on own estimations and IHS Markit research for an On-Grid
Market of a total size of 2,426MW. The total storage market size with On-Grid and Off-Grid 3.3GW, thereof SMA‘s share 14%
2. Time of Use3. Based on IHS Markit Research
Segment SMA Offering Illustration SMA Contribution
Residential,Commercial& Industrial
Behind-the-Meter
SMA‘s share in R/C segment 7,9%1
SMA‘s share in Utility segment 18%1
Transmission
Distribution
UtilityFront-of-Meter
69%
Grid storage
Grid services
Renewable integration
Deferral
Balancing
Behind-the-meter
Energy shifting
Peak shaving
ToU2
Power Quality
System integrationEnergy management
System design/Engineering
Grid simulation
Efficient battery inverters
System integrationEnergy management
Calculation of energy savings
Efficient battery inverters
31%
10th Capital Markets Day, 2018
O&M Services

The business case large scale storage will be accelerated by the decentralization of the enrgy sector.
Business Case Large Scale Storage:Multi-Application Sample Plant in the UK
1. Grid services -Firm Frequency Response1 (FFR) to stabilize the grid
2. Arbitrage trading -Revenue streamdepending on low electricity prices2
3. Deferral -Providing capacity3
to avoid grid extension
4. Balancing -Providing capacityto shave extremepeaks (“Triads”)4 50 MW large scale Storage Plant, UK
1. Out of FFR, yearly revenues of 6 Mio GBP will be achieved at an availability of 92 %2. In 2017, energy spot market price variability in the UK varied between -100 GBP/MWh and 3000 GBP/MWh3. Capacity is generating revenues of > 1 Mio GBP, contracted for 15 years4. Triads: Covering three days of higher mismatch of load and generation in UK in winter provide yearly revenues of > 1 Mio GBP
ROI < 3 years

Business Case Commercial Storage:Much More than Self Consumption
1. Peak Shaving -Reduce demand charge1
by supplying peakdemand from storage
2. Time of Use - TariffsMonetizing gap between different time-of-useelectricity tariffs2
3. Energy shifting -Optimizing selfconsumption3
4. Power Quality -Avoiding additional costsfor statcom, UPS
1 MW Commercial PV plant, Germany
1. In 2017, Demand charge savings in range of 60 – 120 €/kW*a in Germany2. ToU strong country/market dependent. In Germany approx. 5€cent/kWh difference between high and low tariffs3. Revenue from energy shifting strongly dependent on customer total energy consumption and his electricity price per kWh4. ROI based on calculation assuming savings of 100€/kW*a
ROI < 5 years4

6. Technology, Operations, Sales and Service

Unmatched Track Record of R&D Excellence
46
SMA has an installed base of 65 GW.
• Blackstart capability• Safety Arc Fault Circuit
Interrupter• Research network with
> 30 institutions for future trends
• Sector coupling• Research future trends• Smart grid technology
• PV plants from 1 kW to 500 MW
• All battery types and sizes
• PV penetration up to 80%
• Reliability• More than 5 million
inverters sold
• From 4,000 meter altitude to desert conditions
• Best- in-class test center
• Integration into all grids worldwide
• Inverters from module level electronics to Medium Voltage Turnkey Solutions
• All battery types and sizes
• Energy Services
• Data analytics• Predictive
maintenance• Growing share of
Software engineers and IT specialists
• Open Source approach
4,000 meter altitude
30years
950patents
500 engineers
>1.5 million inverters
ALL REGIONS ALL SEGMENTSINNOVATIONEXPERIENCE PORTAL DATA
10th Capital Markets Day, 2018

SMA Can Scale its Operations 1:2 According to Demand within one months and 1:10 within one Year
47
SMA has a production capacity of max. 20 GW, which is not capital intense.
Kassel, GERMANYProduction Site For all inverter types
Zabierzów, POLANDSMA Magnetics produce Chokes and transformers
Yangzhong, ChinaProduction Site For all inverter types
Temporary Workers
Permanent Employees Temporary
WorkersPermanent Employees
Temporary Workers
Permanent Employees
349352 274178 10666
10th Capital Markets Day, 2018
Max. production capacity 14 GW Max. production capacity 6 GW

SMA‘s 2018 Production Volume Forecast of Critical Components is Secured with Multi-Vendor Strategy
48
The general price increase of electronic components is included in SMA‘s earnings guidance.
6% 7 %6% 7 %
Sourcing Offices in China, Poland, Germany and USA to leverage spend globally
Combining resourcing volume with Danfossto ensure higher volume
Early involvement in product innovation to foster Technology Leadership driving standardization to increase our competitiveness on global markets
Sourcing volume 2017
Total Sourcing Volume 2017: €450m
Strategic Initiatives
10th Capital Markets Day, 2018
15%
29%
47%
9%
AmericasEastern EuropeEMEA w/o Eastern Europe APAC

No other competitor has a similar Specialized Sales and Service Infrastructure and Access to all Channels
49
SMA will launch an online channel to serve markets with a weak SMA presence.10th Capital Markets Day, 2018
EMEA• 50 MW storage project in Pelham, UK• 500 MW O&M contracts under management• Strategic Alliances with Audi, MVV and Danfoss Cooling
• 730 MW utility projects sold in Australia• First manufacturer with certified MLPE5 technology in
Japan/Australia• > 1GW shipped in India
APAC
• 10 GW utility inverters installed in US• 20 MW battery storage project in the Mojave desert• Sunrun as new strategic account
Americas
#3801
0.5 GW4
23%2
#83
1. Sales and Service FTE2. Market share 2017, based on revenue, incl. PV and
Storage Inverters
3. Country presence with subsidiary4. O&M under management5. MLPE: Module Level Power Electronics
#1601
0.1 GW4
15%2
#63
#1801
1.9 GW4
9%2
#53

7. Financials

SMA Successfully Managed fast Changing Market Conditions and Protected its High Net Cash Position
51
1.Preliminary figures2. Joint Venture with Danfoss cooling to offer energy management solution for Food/Retail3.Energy Management System4.MLPE: Module Level Power Electronics
• Acquisition of Zeversolar to improve sourcing and portfolio (2012)
• Strategic alliance with Danfoss to improve competitiveness and enter into new business (2014/2018)2
• Restructuring / Head-count reduction to improve breakeven (2014)
• Invest >€600m in R&D since 2012 to reduce specific costs and expand into storage and EMS3
• Invest in Tigo Energy to complete portfolio with MLPE4 (2016)
• Closure of Denver production to reduce fixed costs (2016)
• Divestment of SMA Railway (2017)• Set up digital solution business to increase
profitability (2017)
Strategic InitiativesGW
Gross margin 24% 17% 26% 22%Net cash 446 225 362 450FTE 4,800 4,665 3,118 3,006
7.2 5.1 8.2 8.5
10th Capital Markets Day, 2018
890947805
2012
1,463
172(12%)
-58(-7%)
2014
142(15%)
2016
95(11%)
2017e1
Sales in €mEBITDA in €m,(margin)

2017 was a Transitional Year due to US demand. The Shortage of Electronic Components Impacted SMA as well.
52
SMA‘s annual report will be published on March 28, 2018.
2016 2017e ChangeSales 947 890 -6%
Residential 191 208 9%Commercial 273 268 -2%Utility 397 240 -40%Service 45 77 71%Other Business 41 97 >100%
EBITDA 142 95 -33%EBIT 65 45 -30%Net income 30 30 +/- 0%Net cash 362 450 24%NWC ratio (in %) 24% 22% n.m.
• Sales decline mainly due to weak US Utility business. Strong growth in APAC and EMEA.
• Positive development in residential, service and storage business.
• Net income impacted by adjustment of deferred tax assets (US) and reserve tax accruals for Chinese entities.
• Since many years, SMA has a policy to distribute 20%-40% of its group net income to shareholders.
Preliminary Key Financials(in € million)
Comments 2017
10th Capital Markets Day, 2018

2016/12/31 2017/12/311 Change
Non-current assets 426 358 -16%Working capital 334 325 -3%Other assets 66 63 -4%Total cash 385 470 22%
Shareholder‘s equity 585 612 5%
Provisions2 177 156 -12%Trade payables 109 130 19%Financial liabilities3 23 20 -13%Other liabilities2 317 298 -6%Total 1,211 1,216
Global Full Time Employees4
SMA Slightly Increased the Number of Employees to Untap the Growth Potential in Future Years
53
SMA operates with a cash break-even point of c. €700m. With cost-improved products SMA strives to reduce the break-even in 2018. Covenants for our syn-loan were all observed.
Temporary Workers 521 697
10th Capital Markets Day, 2018
Preliminary Group Balance Sheet, reclassified (in € million)
595
427 455298279
2017
3.006
1271
613
369
2016
2.9455
1.285
359
OperationTechnologyServiceSales/MarketingAdministration/IT
1.Preliminary figures2.Not interes-tbearing
3.w/o not interest bearing derivatives: € 0,4m (2016: € 17,6m)
4.w/o temporary workers and learners5.w/o Denver
Order Backlog by Segment and Region (in € million)
Order Backlog Development (in € million)
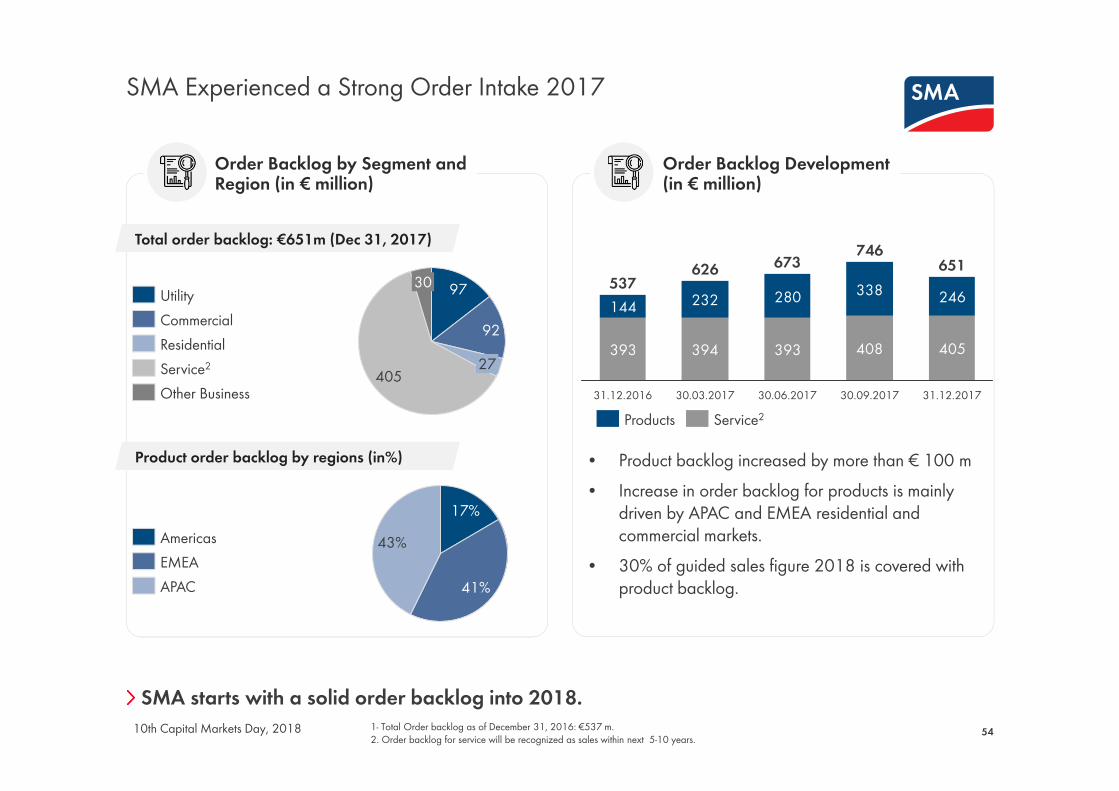
SMA Experienced a Strong Order Intake 2017
54
SMA starts with a solid order backlog into 2018.
393 394 393 408
232 280 338
405
144 246
31.12.201730.09.2017
746
30.06.2017
673
30.03.2017
626
31.12.2016
537651
Service2Products
• Product backlog increased by more than € 100 m • Increase in order backlog for products is mainly
driven by APAC and EMEA residential and commercial markets.
• 30% of guided sales figure 2018 is covered with product backlog.
Total order backlog: €651m (Dec 31, 2017)
Product order backlog by regions (in%)
10th Capital Markets Day, 2018 1- Total Order backlog as of December 31, 2016: €537 m.2. Order backlog for service will be recognized as sales within next 5-10 years.
27
97
405
30
92ResidentialCommercialUtility
Other BusinessService2
41%
43%17%
EMEAAPAC
Americas

8. Guidance, Strategy and Investment Highlights

Guidance 2018 (in € million) Management Comment
SMA‘s Management Estimates Sales and Earnings Growth in 2018
56
Earnings Guidance 2018 is impacted by expenses for new digital business. Sufficient FX-hedging is secured.
1.Preliminary figures2. Incl. c. €20m for R&D
2018Expenses for Digital Solutions >€10mNWC-Ratio 19-23%Tax Ratio c. 30%CapEx (incl R&D)2 c. €50mDepreciation / Amortization c. €50m
• SMA plans to increase market share, mainly in APAC (China, Japan, Australia).
• Strong growth in commercial and residential (incl. Optimizer) due to new products. Storage will increase significantly due to market development.
• Energy Management and digital solution business will only have limited sales contribution.
• Price pressure in utility remains high. Moderate development in all other segments.
• Supply constraints will ease starting Q2/2018.
• Acquisitions in the fields of energy management technology and O&M portfolios and additional optimizer technology are likely (total volume €50-100 m).
10th Capital Markets Day, 2018
Sales EBITDA
90-110
900-1,000>890
>95
2017e 2018

SMA is the World Market Leader for PV Inverters and aLeading Player in Storage and O&M
57
Investment Highlights
Unique positioned in the solar market / Best brand
• World market leader with 65 GW installed base• Complete portfolio to serve all PV segments• 20 subsidiaries with strong service capabilities and
access to all channels• Award-winning 20 GW production to achieve scale
Leverage PV expertise to enter into high margin business
• Strong partnerships to create a new ecosystem• Know-how & products to benefit from strong growth in the
field of battery storage• With ennexOS1, SMA has set the basis to manage the
complexity of integrated solutions• Infrastructure to expand into data-driven business models and
services
Key Financials2018
Sales€ 900 m - € 1,000 m EBITDA€ 90 m - € 110 m
10th Capital Markets Day, 2018 1.SMA’s Energy Management Platform
SMA has an experienced management team with a proven track record.
Key ProductInnovation 2018

SOCIAL MEDIAwww.SMA.de/Newsroom

SMA Solar Technology AG
BACK UP

SMA has a Sound Strategy in Place to Benefit from the Disruption in the Energy Sector
60
GLOBAL MARKET LEADER in all SegmentsWe want to be #1in the RESIDENTIAL, COMMERCIAL, UTILITY, SERVICE and OFF-GRID & STORAGE segments.
SMA is a Provider of Systems and SolutionsBy 2020, sales of non-PV inverters are expected to rise from around 20% of total sales to > 40%.
Sustainable Profitability and low Capital IntensitySMA strives for continuous efficiency improvements. If necessary, the profitability will be ensured by means of reductions in structural costs.
Development of SMA by means of Disruptive ApproachesWe want to achieve this by focusing on three disruptive initiatives. “Energy Services” and “Energy Portal” are technology-driven, data-based business models while “Energy Shop” is an end-to-end sales model to digitize our sales channel.
SMA is an ATTRACTIVE COMPANYWe live by our values and provide freedom for responsible entrepreneurial action. We stand out due to fairness, internationality and sustainability.
10th Capital Markets Day, 2018
Back up

Experienced Management Team with Proven Track Record
61
1.Deputy CEO2.Alphabetical order3.Speaker
Pierre-P. UrbonCEO/CSOborn 1970With SMA since 2005Contract :2022
Dr.-Ing. Juergen Reinert1CTO/COOborn 1968With SMA since 2011Contract 2019
Management Board
Ulrich HaddingCFOborn 1968With SMA since 2009Contract 2019
Executive Management Team2
• Jon I. Ekker, Service
• Dr.-Ing. Johannes Kneip, Technology3
• Nick Morbach, BU Residential and Commercial
• Alexander Naujoks, HR
• Thomas Pixa, Finance
• John Susa, Sales Americas/APAC
• Mike Terlinden, Operation
• Boris Wolff, BU Utility
Back up
10th Capital Markets Day, 2018

SMA’s Share Price Rallied in 2017
62
SMA has a stable shareholder structure.1.As of January25, 2018, Company Information2.As of January25, 2018
Share Price Development 01/2017 -01/2018
Shareholder Structure1
25.16%
20.00%54.84%
FreefloatDanfoss A/SSMA founders, their trusts and families
• Outstanding Shares: 34.7 m• No pre-emption rights or other restrictions• Market capitalization: €1.3 bn 2
Back up
0%20%40%60%80%
100%120%140%160%180%
SMA %TecDAX %DAX %
JAN FEB MAR JUN JUL AUG SEP OCT NOV DEC JAN
10th Capital Markets Day, 2018

Digitalization of the Energy Industry Enables Analysis and Optimization of Energy Demand and Supply
6310th Capital Markets Day, 2018
AI1-based virtual power plants for electric vehicle fleets
Data Input• Mobility demands• GPS data• Power prices• Level of charge
AI algorithm AI algorithm DSO • e-vehicle fleet functions as a virtual power plant to feed electricity back to the DSO or to absorb excess power depending on demand predictions from AI1 algorithm
• SMA collaborates with VW, Audi, Daimler
Blockchain-based peer-to-peer trading of electric power
• Blockchain technology logs peer-to-peer trades as transactions and make it available to utilities, prosumers and solution providers
• New regulatory framework required
AI1 to predict power output from solar
• AI1 provide solar power forecasts of high accuracy, which allow to integrate solar energy into the grid cheaply and reliably
• SMA provides data collected in PV plants to Tennet
The need for digital solutions is creating new, rapidly growing value pools that can build on the traditional inverter business with a key role to be played by system integrators.
Example Solution Comment
1 AI: Artificial Intelligence
Physical energy flowPeer-to-peer trade
GridOperator
Utility Y Utility XBalancing Region XBalancing Region Y
B
Back up

SOCIAL MEDIAwww.SMA.de/Newsroom