Embed Size (px)
Citation preview

Sloan Valve Employee Engagement Survey
::Age Groups::Presented by:Brian Stith Julio Garcia Dominican University
December 15, 2015
Executive Summary Job training is an area that Sloan should look into improving. Employees showed interest in education programs and work benefits. There seems to be communication errors between employees and
management. The older generation employees seemed to be less satisfied as those
of the younger generation. All of the variables contributed equally to the NPS.
Survey Objectives Identify satisfaction levels among Sloan Valve employees.
Questions included over-arching themes such as: Goal Alignment Communication Compensation Training and Development Performance Management Work Environment
Satisfaction derived by calculating the Net Promoter Score (NPS) “I would recommend Sloan to my family and friends as an employer.”

Sub-Group AnalysisBirthdate
Total Number of Participants (n=)
40’s – 50’s 151
60’s 121
70’s 92
80’s – 90’s 96

Methodology & Procedure Online survey issued to all employees. Dates: November 2 – 9, 2015
Office employees: email addresses provided by Sloan Valve. Unique URL sent to 251 office employees’ Sloan email addresses 230 completed the survey (92% completion rate) Two reminder emails sent
Production employees: no email addresses with Sloan Valve. URL set up for employees to take the survey; clock number verified their identity Employees could either take the survey at home or at work Technology room in Franklin Park dedicated 10 computers for production employees to take the survey in 30 minute
increments. 468 Production employees invited to take the survey 230 completed the survey (49%)
Total number of completed surveys: 460 Incentives: Raffle of 6 prizes in total
Choice of $350 Amazon Gift Card or Apple Watch

All groups have a consistent view and somewhat agree (5) with this statement.
Q2_1: I understand the overall goals of Sloan Valve Company.
Source: Sloan Valve Employee Engagement Survey, all respondents
40's/50's 60's 70's 80's/90's0.00
1.00
2.00
3.00
4.00
5.00
6.00
7.00
5.23 5.275.58 5.72
Q2_1: I understand the overall goals of Sloan Valve Company.

There is a significant difference between those born in the 80’s/90’s (6.23) and those born in the 60’s (5.71). Younger employees (80’s/90’s) tend to feel that Sloan understands how their work impacts the company’s goals in comparison to older employees (40’s/50’s).
Source: Sloan Valve Employee Engagement Survey, all respondents
40's/50's 60's 70's 80's/90's0.00
1.00
2.00
3.00
4.00
5.00
6.00
7.00
5.79 5.716.01
6.23
Q2_2: I understand how my work impacts the company’s goals.
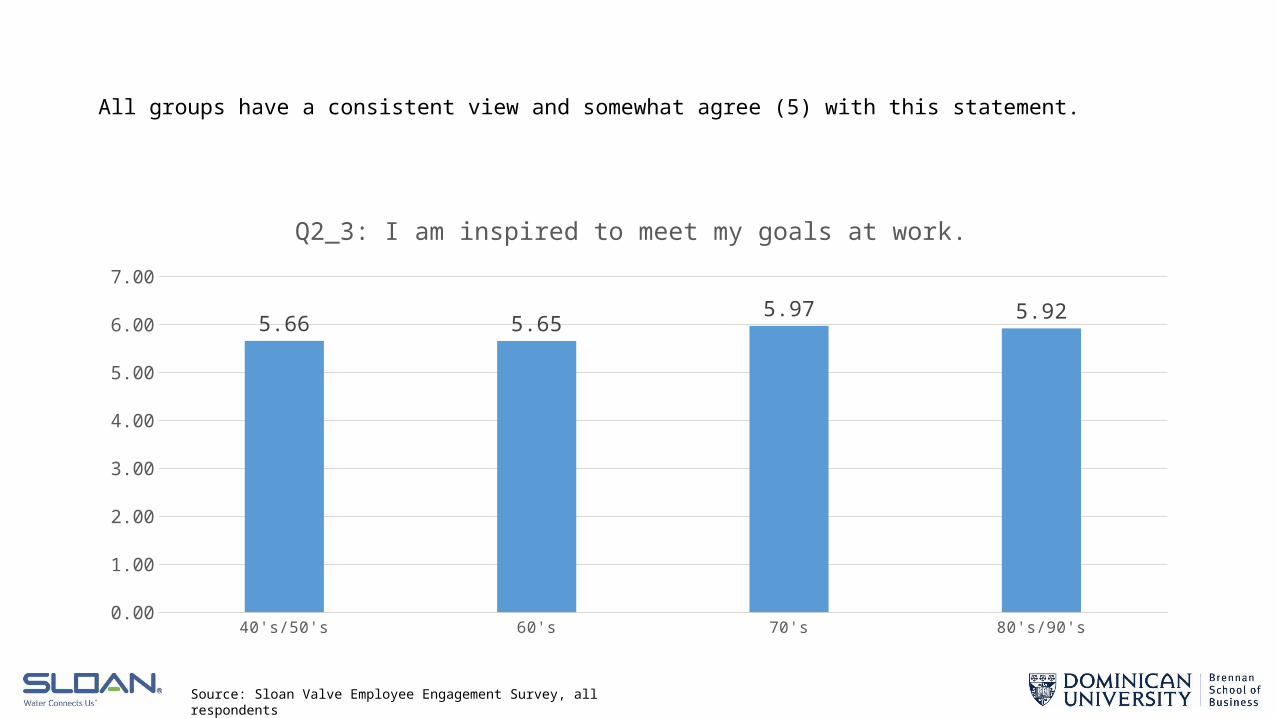
All groups have a consistent view and somewhat agree (5) with this statement.
Source: Sloan Valve Employee Engagement Survey, all respondents
40's/50's 60's 70's 80's/90's0.00
1.00
2.00
3.00
4.00
5.00
6.00
7.00
5.66 5.655.97 5.92
Q2_3: I am inspired to meet my goals at work.

All groups have a consistent view, neither agree or disagree (4).
Source: Sloan Valve Employee Engagement Survey, all respondents
40's/50's 60's 70's 80's/90's0.00
1.00
2.00
3.00
4.00
5.00
6.00
7.00
4.45 4.414.84
4.50
Q3_1: I am recognized when I do very good work.

All groups share a consistent view, neither agree or disagree (4).
Source: Sloan Valve Employee Engagement Survey, all respondents
40's/50's 60's 70's 80's/90's0.00
1.00
2.00
3.00
4.00
5.00
6.00
7.00
4.03 4.17 4.43 4.39
Q3_2: Communication between leaders and employees is good.

All groups share a similar view with this statement, neither agree or disagree (4).
Source: Sloan Valve Employee Engagement Survey, all respondents
40's/50's 60's 70's 80's/90's0.00
1.00
2.00
3.00
4.00
5.00
6.00
7.00
3.99 4.184.51 4.61
Q3_3: I feel I can speak-up without fear of negative consequences.

All groups share a consistent view with this statement, neither agree or disagree (4).
Source: Sloan Valve Employee Engagement Survey, all respondents
40's/50's 60's 70's 80's/90's0.00
1.00
2.00
3.00
4.00
5.00
6.00
7.00
4.23 4.46 4.65 4.74
Q3_4: The executive team at Sloan communicates the company goals.
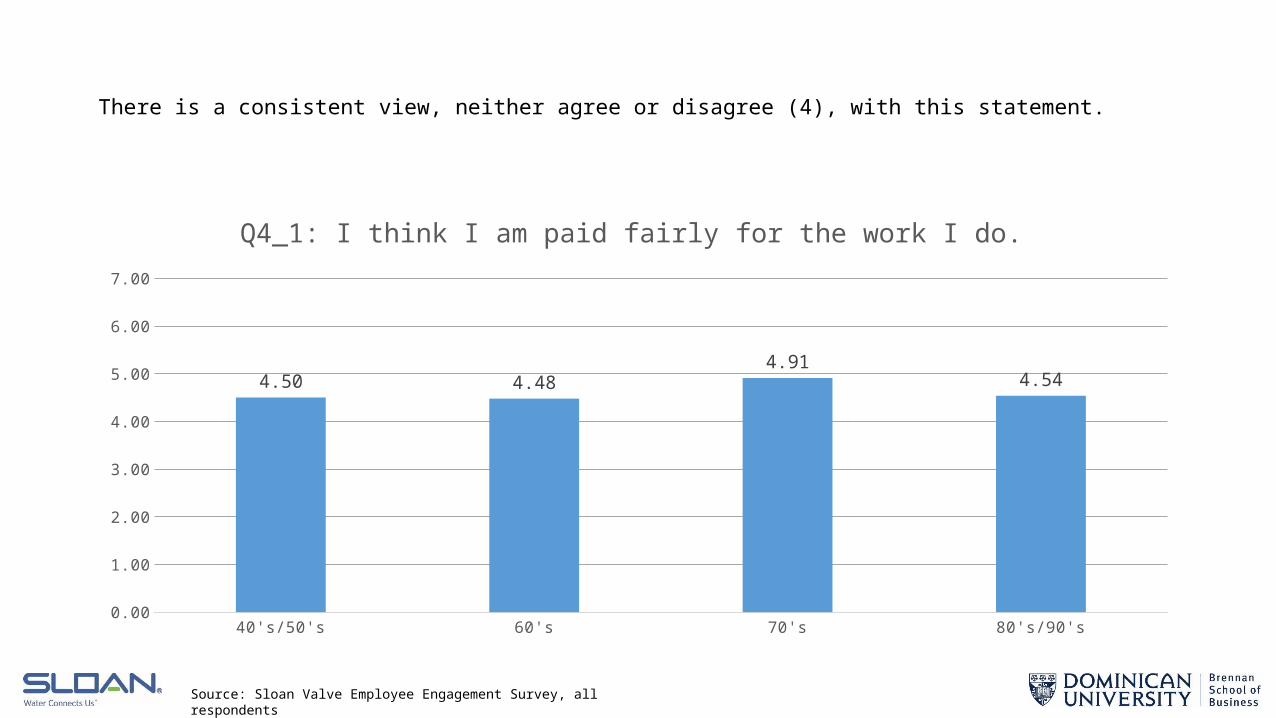
There is a consistent view, neither agree or disagree (4), with this statement.
Source: Sloan Valve Employee Engagement Survey, all respondents
40's/50's 60's 70's 80's/90's0.00
1.00
2.00
3.00
4.00
5.00
6.00
7.00
4.50 4.484.91
4.54
Q4_1: I think I am paid fairly for the work I do.

All groups share the same view with this statement, neither agree or disagree (4).
Source: Sloan Valve Employee Engagement Survey, all respondents
40's/50's 60's 70's 80's/90's0.00
1.00
2.00
3.00
4.00
5.00
6.00
7.00
4.01 4.02 4.21 4.39
Q4_2: I am satisfied with my benefit package.

Groups share an identical view with this statement, neither agree or disagree (4).
Source: Sloan Valve Employee Engagement Survey, all respondents
40's/50's 60's 70's 80's/90's0.00
1.00
2.00
3.00
4.00
5.00
6.00
7.00
4.51 4.43 4.524.75
Q5_1: I am satisfied with the job-related training for my position at Sloan.
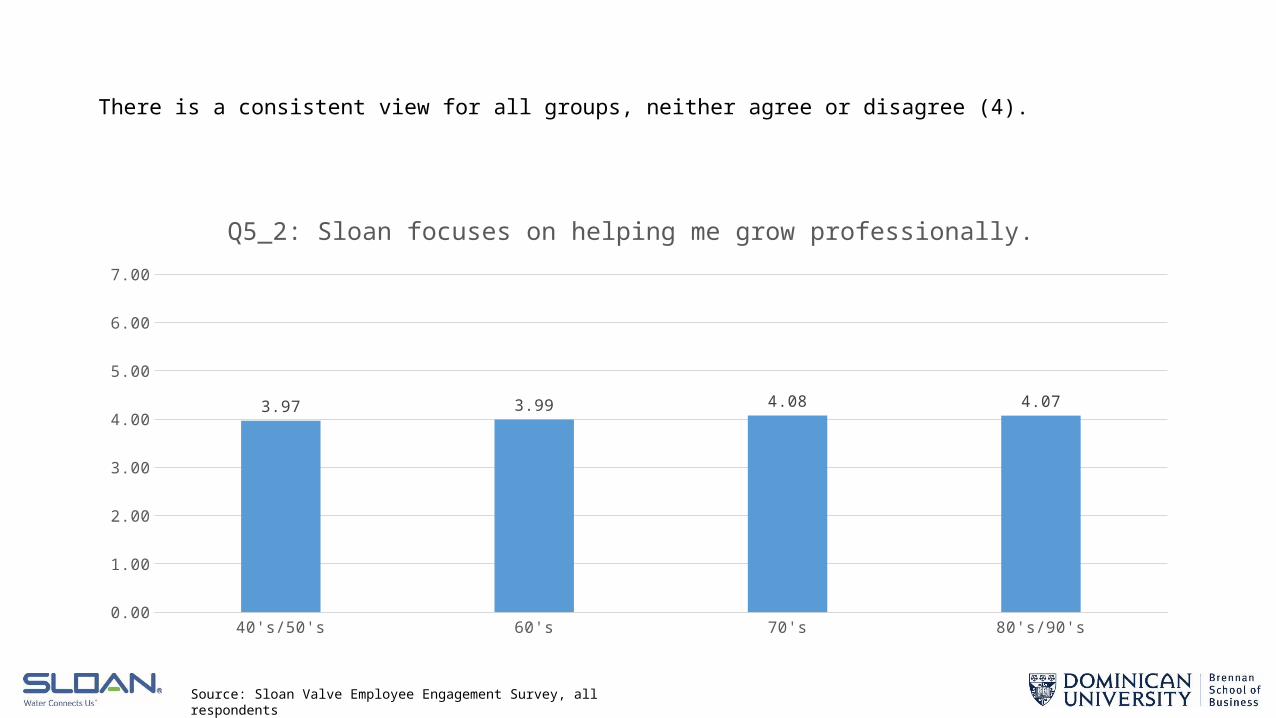
There is a consistent view for all groups, neither agree or disagree (4).
Source: Sloan Valve Employee Engagement Survey, all respondents
40's/50's 60's 70's 80's/90's0.00
1.00
2.00
3.00
4.00
5.00
6.00
7.00
3.97 3.99 4.08 4.07
Q5_2: Sloan focuses on helping me grow professionally.

There is a significant difference between those in their 40’s/50’s (3) Somewhat disagree and the other groups (4) neither agree or disagree
Source: Sloan Valve Employee Engagement Survey, all respondents
40's/50's 60's 70's 80's/90's0.00
1.00
2.00
3.00
4.00
5.00
6.00
7.00
3.83 4.03 3.90 4.00
Q5_3: I am satisfied with the investments Sloan makes in training and education.

There is a consistent view between groups, neither agree or disagree (4).
Source: Sloan Valve Employee Engagement Survey, all respondents
40's/50's 60's 70's 80's/90's0.00
1.00
2.00
3.00
4.00
5.00
6.00
7.00
4.43 4.60 4.48 4.50
Q5_4: Overall, I a m confident that I will be able to achieve my career goals.
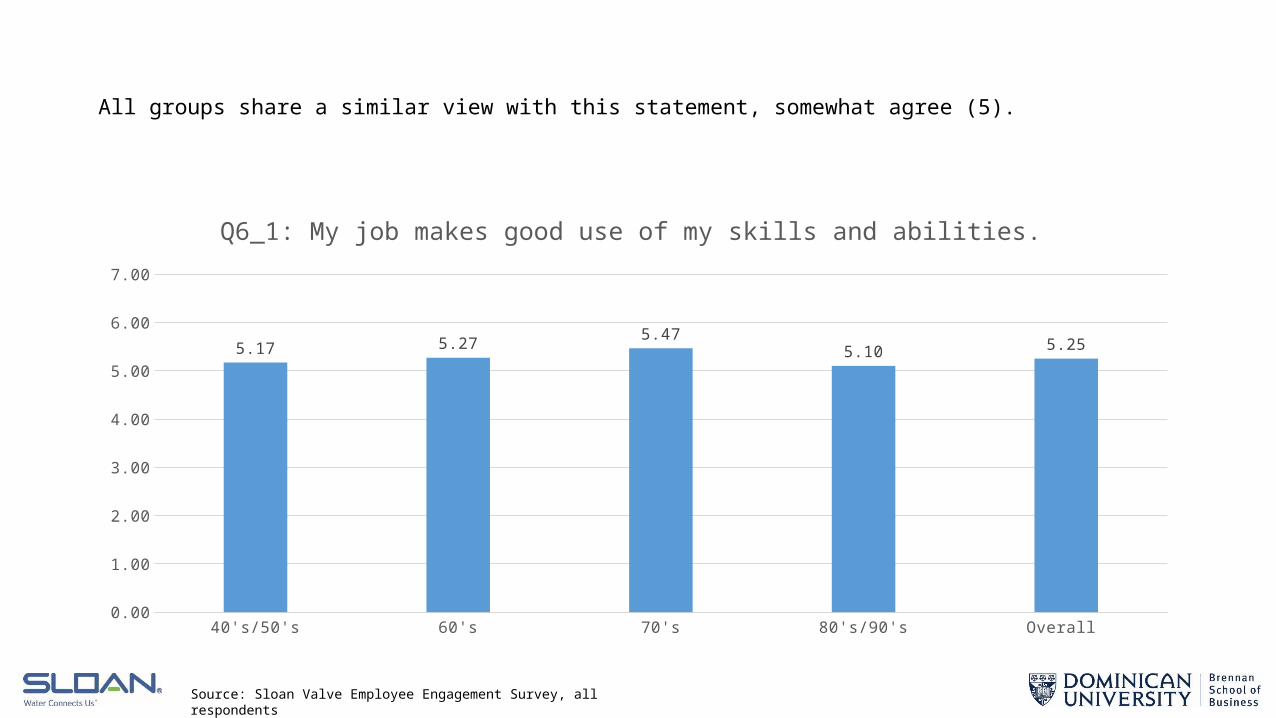
All groups share a similar view with this statement, somewhat agree (5).
Source: Sloan Valve Employee Engagement Survey, all respondents
40's/50's 60's 70's 80's/90's Overall 0.00
1.00
2.00
3.00
4.00
5.00
6.00
7.00
5.17 5.27 5.475.10 5.25
Q6_1: My job makes good use of my skills and abilities.

There is a consistent view with this statement, neither agree or disagree (4).
Source: Sloan Valve Employee Engagement Survey, all respondents
40's/50's 60's 70's 80's/90's0.00
1.00
2.00
3.00
4.00
5.00
6.00
7.00
4.44 4.554.77 4.60
Q6_2: Sloan holds people accountable for results.

Source: Sloan Valve Employee Engagement Survey, all respondents
40's/50's 60's 70's 80's/90's0.00
1.00
2.00
3.00
4.00
5.00
6.00
7.00
4.65 4.554.98
4.46
Q6_3: I feel valued for the work I do at Sloan.
All groups share a similar view with this statement, somewhat agree (5).

Source: Sloan Valve Employee Engagement Survey, all respondents
40's/50's 60's 70's 80's/90's1
2
3
4
5
6
7
5.32 5.445.85 5.94
Q7_2: The person I report to treats me fairly.
There is a statistical difference. Younger employees (80’s/90’s) agree that the person they report to treats them fairly in comparison to older employees (40’s/50’s and 60’s).
Source: Sloan Valve Employee Engagement Survey, all respondents
40's/50's 60's 70's 80's/90's1
2
3
4
5
6
7
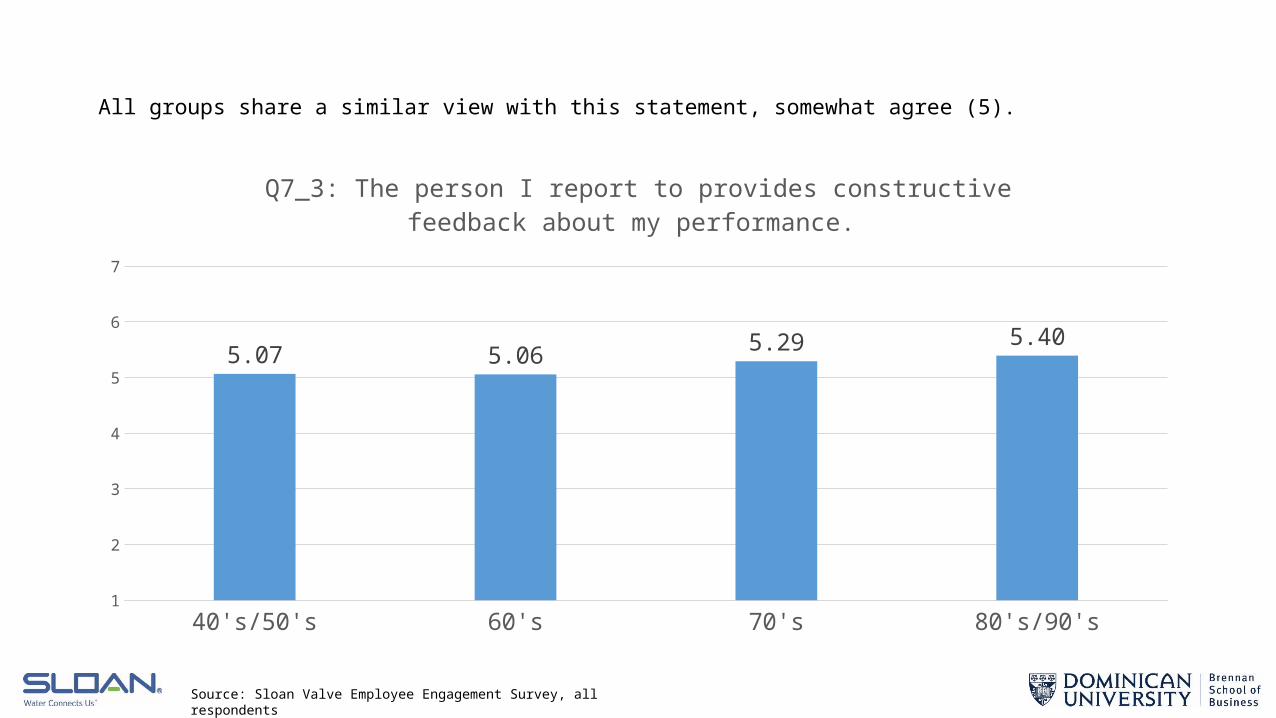
5.07 5.065.29 5.40
Q7_3: The person I report to provides constructive feedback about my performance.
All groups share a similar view with this statement, somewhat agree (5).

There seems to be a mutual feeling among the respondents that the person they report to provides positive reinforcement.
Source: Sloan Valve Employee Engagement Survey, all respondents
40's/50's 60's 70's 80's/90's1
2
3
4
5
6
7
5.03 5.21 5.35 5.26
Q7_4: The person I report to provides positive reinforcement.

The person being reported to has somewhat good communication skills according to the responses in the graph above.
Source: Sloan Valve Employee Engagement Survey, all respondents
40's/50's 60's 70's 80's/90's1
2
3
4
5
6
7
5.12 5.31 5.39 5.28
Q7_5: The person I report to has good communication skills.
Source: Sloan Valve Employee Engagement Survey, all respondents
40's/50's 60's 70's 80's/90's1
2
3
4
5
6
7
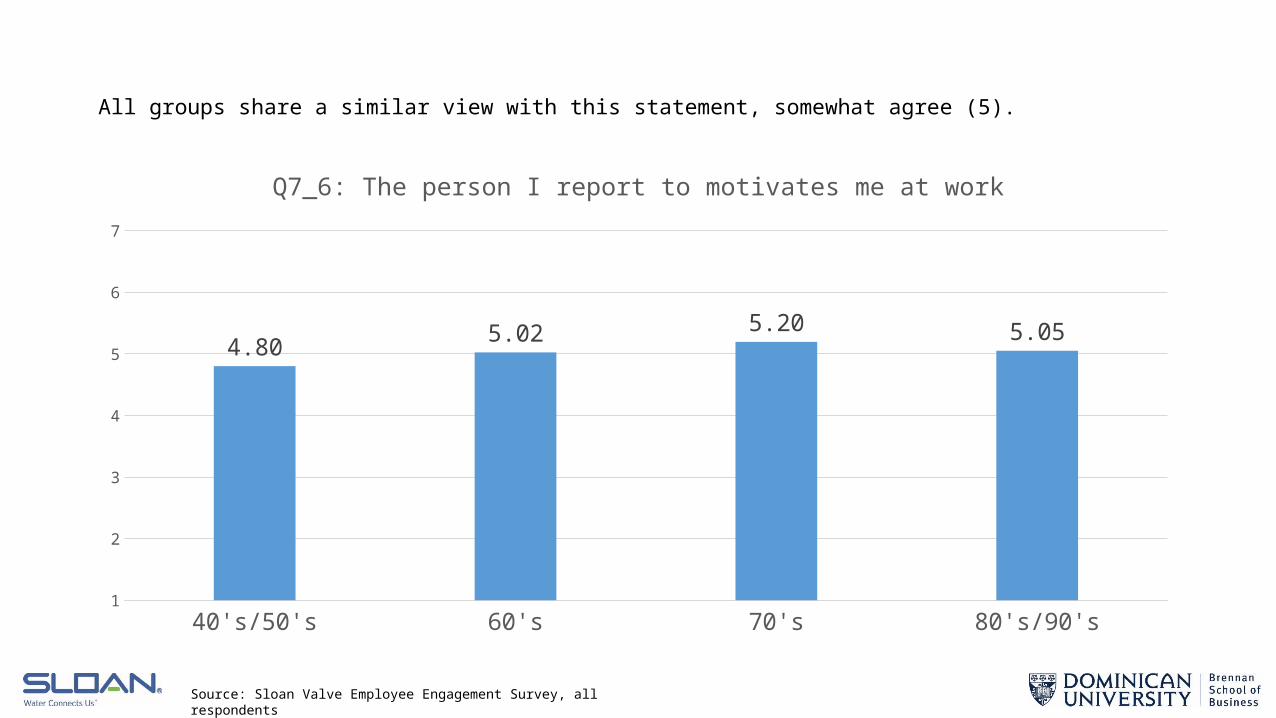
4.80 5.02 5.20 5.05
Q7_6: The person I report to motivates me at work
All groups share a similar view with this statement, somewhat agree (5).

Source: Sloan Valve Employee Engagement Survey, all respondents
40's/50's 60's 70's 80's/90's1
2
3
4
5
6
7
4.93 5.15 5.25 5.36
Q7_7: The person I report to helps me resolve conflict
All groups share a similar view with this statement, somewhat agree (5).

Source: Sloan Valve Employee Engagement Survey, all respondents
40's/50's 60's 70's 80's/90's1
2
3
4
5
6
7
5.32 5.45 5.65 5.59
Q8_1: I feel the physical environment I work in is safe.
All groups share a similar view with this statement, somewhat agree (5).

The basic feeling among the groups is that Sloan’s environment encourages each person’s best performance.
Source: Sloan Valve Employee Engagement Survey, all respondents
40's/50's 60's 70's 80's/90's1
2
3
4
5
6
7
4.74 4.895.29
5.01
Q8_2: Sloan has an environment that encourages me to perform to the best of my abil-ities.
Source: Sloan Valve Employee Engagement Survey, all respondents
40's/50's 60's 70's 80's/90's1
2
3
4
5
6
7
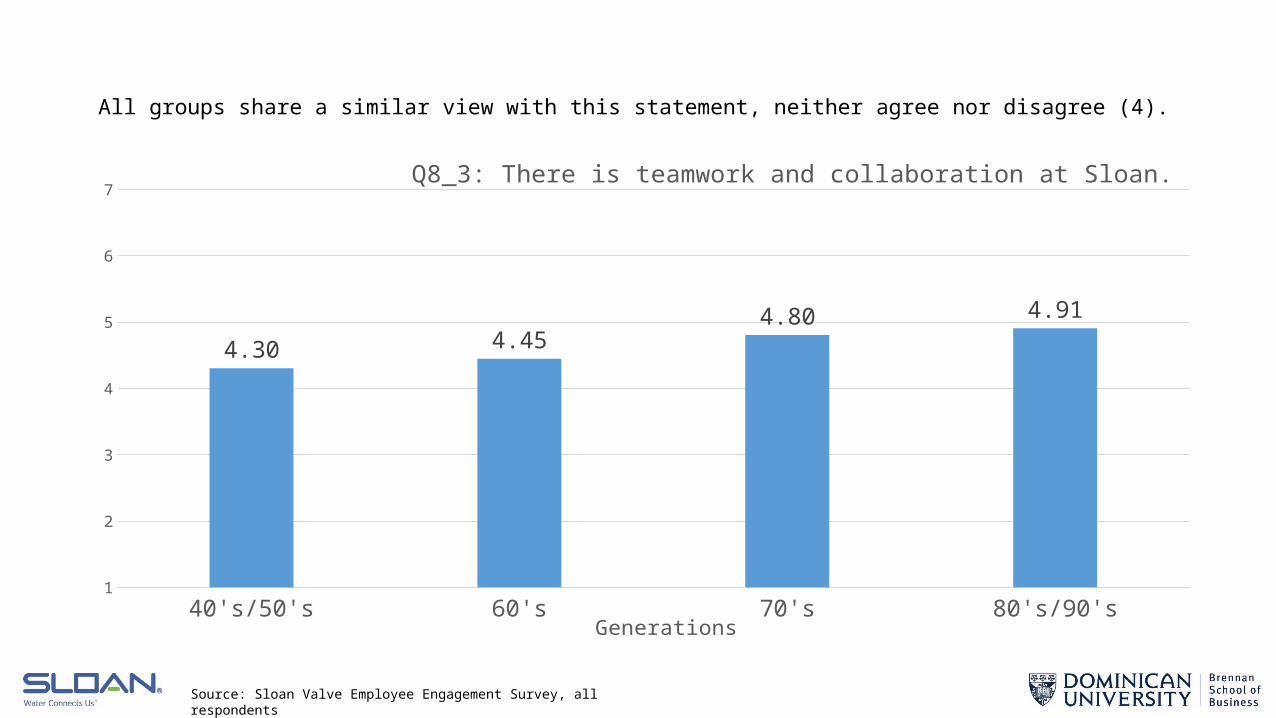
4.30 4.454.80 4.91
Q8_3: There is teamwork and collaboration at Sloan.
Generations
All groups share a similar view with this statement, neither agree nor disagree (4).

Almost all of the respondents indicated they enjoy the people they work with.
Source: Sloan Valve Employee Engagement Survey, all respondents
40's/50's 60's 70's 80's/90's1
2
3
4
5
6
7
5.80 5.595.82 5.96
Q8_4: I enjoy working with the people in my department.
Generations

There is a statistical difference. The older employees (40’s/50’s) are not as likely to agree that flexible work hours are important.
Source: Sloan Valve Employee Engagement Survey, all respondents
40's/50's 60's 70's 80's/90's1
2
3
4
5
6
7
5.335.83 5.80 5.80
Q8_5: Flexible work hours are important to me.
Generations

Source: Sloan Valve Employee Engagement Survey, all respondents
40's/50's 60's 70's 80's/90's1
2
3
4
5
6
7
4.76 4.94 4.92 4.86
Q8_6: Sloan cares about my well-being.
All groups share a similar view with this statement, somewhat agree (5).

Source: Sloan Valve Employee Engagement Survey, all respondents
40's/50's 60's 70's 80's/90's1
2
3
4
5
6
7
4.625.02 5.23 5.15
Q8_7: I would recommend Sloan to my family and friends.
All groups share a similar view with this statement, somewhat agree (5).

Themes from Additional CommentsTotal Number of Mentions
Family environment 14
No Comment 284
Procedural improvements 9
Lack of managerial communication
23
Add bonuses/rewards 12
Improve goals 7
Improve products/facility 9
Improve training/education 8
Improve teamwork/environment 64
Flexible hours 2
Fear of punishment/replacement
4
Total Number of Mentions
Honest opinion 2
Increase pay 3
Safe workplace 2
Good managerial communication
6
Good reputation 5
Good training/education 1
Advancement issues 4
Good teamwork 2
Medical Benefits 6
Great company to work for 43

ResultsStatistical Differences: Company goals- The younger employees are more likely to agree that
with the company goals than the older employees. Person I report to treats me fairly- The younger employees are more
likely to agree that that the person they report to treats them fairly. Flexible work hours- The older employees are not as likely to agree
that flexible work hours are important to them.
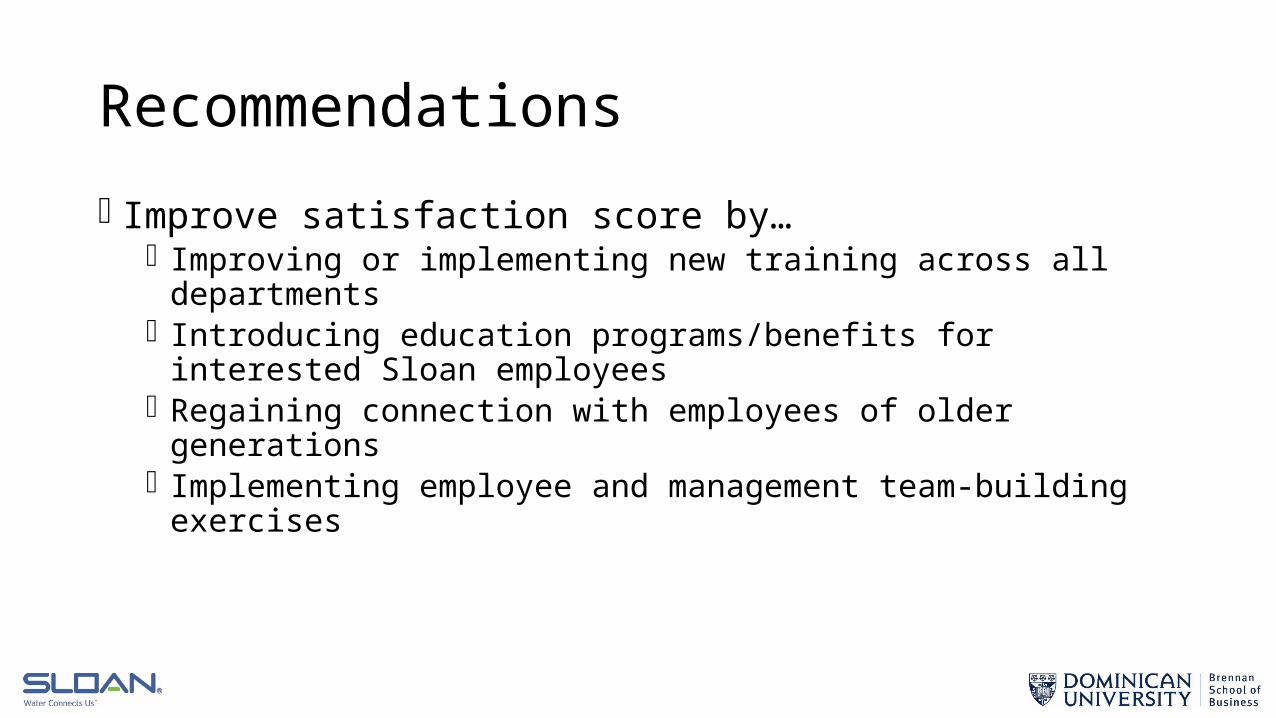
Recommendations Improve satisfaction score by…
Improving or implementing new training across all departments Introducing education programs/benefits for interested Sloan employees Regaining connection with employees of older generations Implementing employee and management team-building exercises

THANK YOU!COPYRIGHT 2015 Dominican University’s Brennan School of Business