Embed Size (px)
Citation preview
Slaap-gerelateerde ademhalingsstoornissen bij obese kinderen en adolescenten
Dr. Annelies Van Eyck
Dr. Kim van Hoorenbeeck, Dr. Luc Bruyndoncx, Prof. dr. Stijn Verhulst
Multisystem Interventions in Childhood Obesity and Sleep Apnea
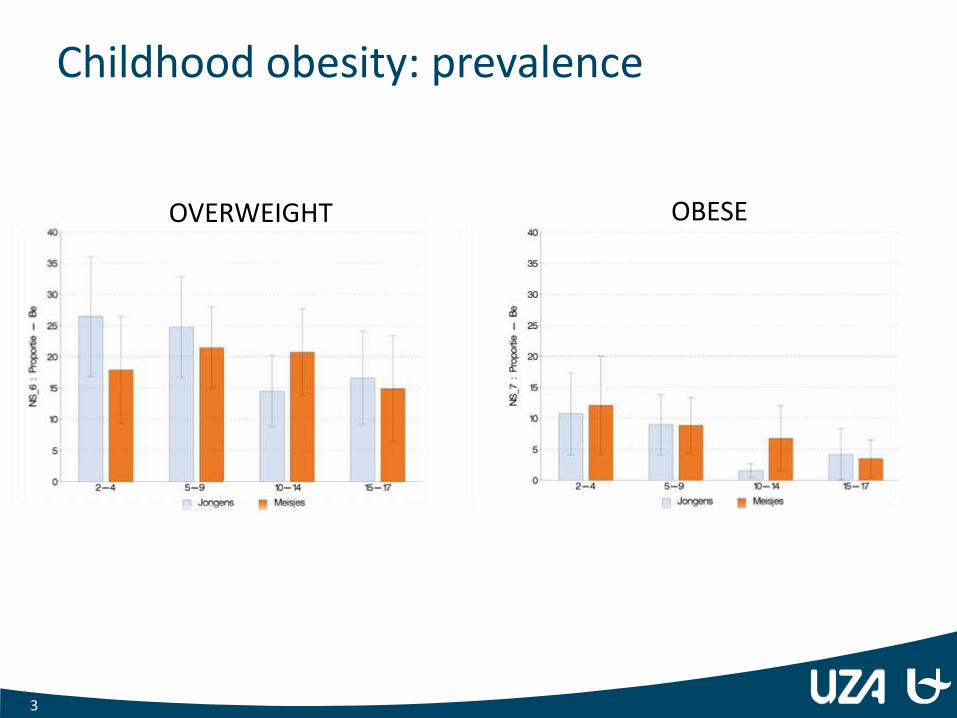
Childhood obesity: prevalence
3
OVERWEIGHT OBESE
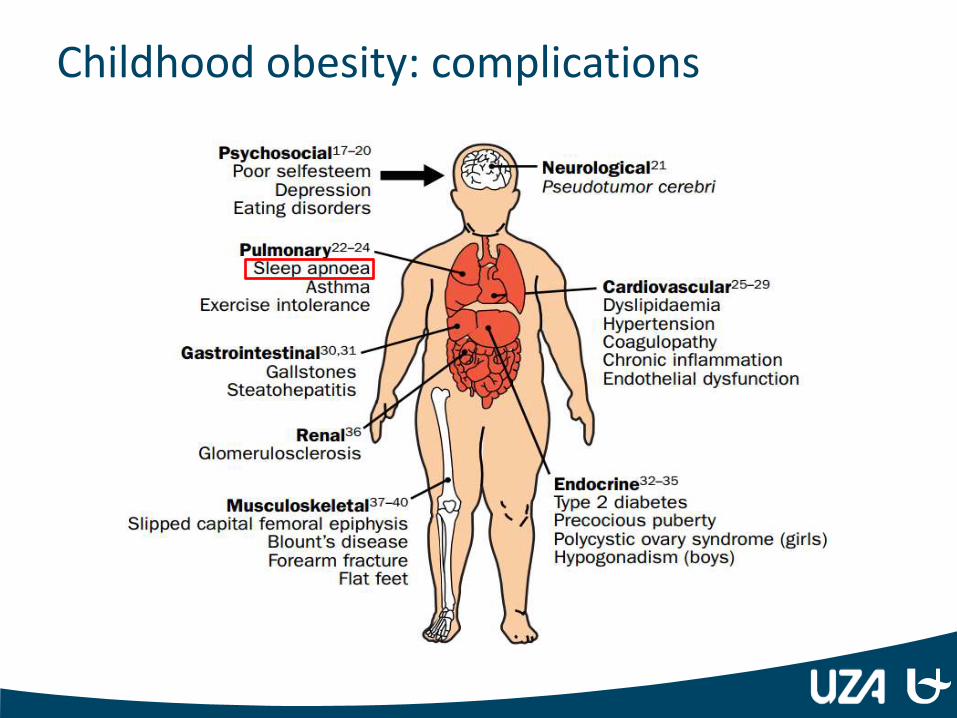
Childhood obesity: complications
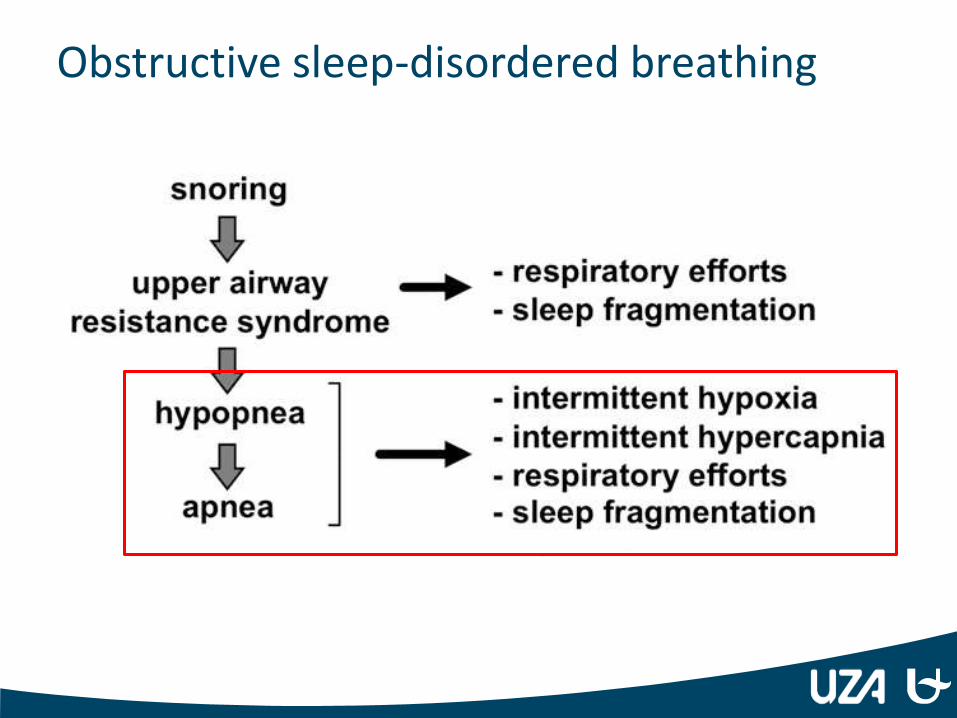
Obstructive sleep-disordered breathing
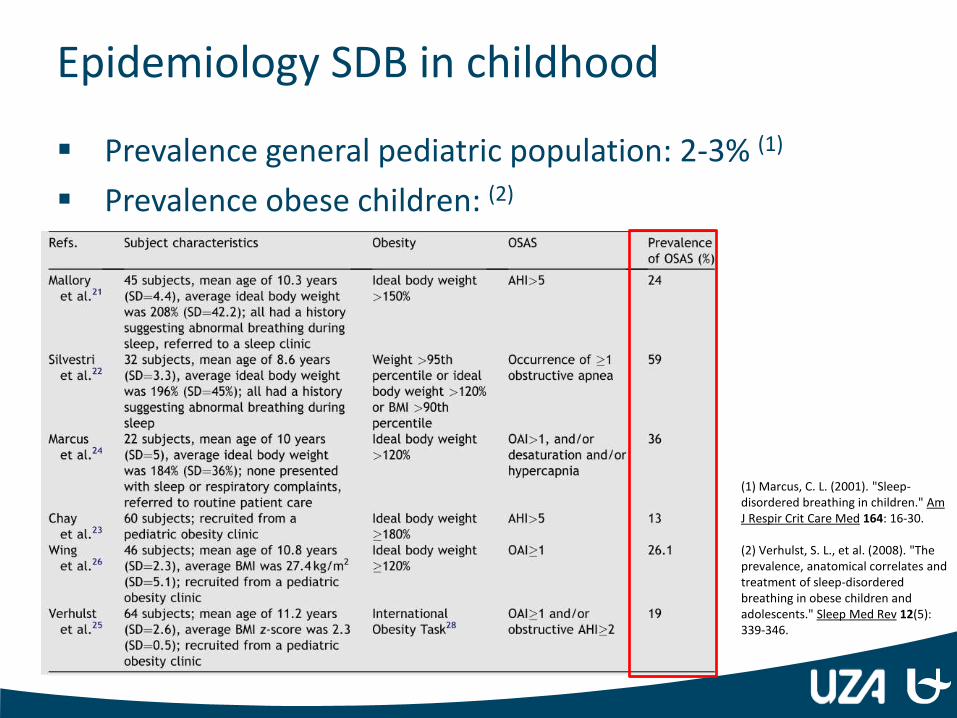
Epidemiology SDB in childhood
Prevalence general pediatric population: 2-3% (1)
Prevalence obese children: (2)
(1) Marcus, C. L. (2001). "Sleep-disordered breathing in children." Am J Respir Crit Care Med 164: 16-30. (2) Verhulst, S. L., et al. (2008). "The prevalence, anatomical correlates and treatment of sleep-disordered breathing in obese children and adolescents." Sleep Med Rev 12(5): 339-346.
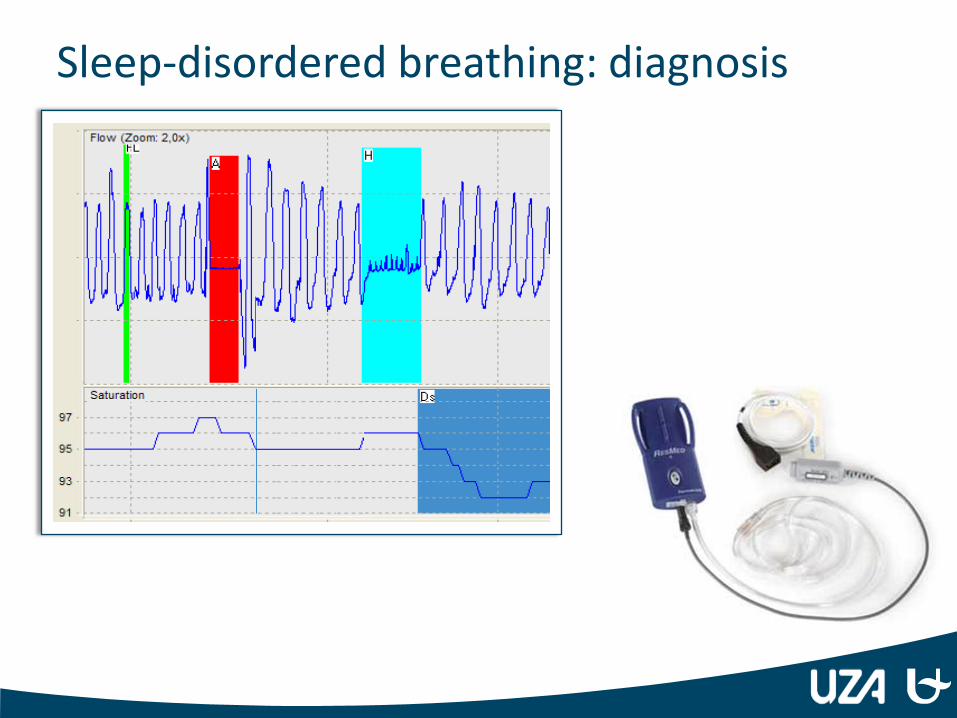
Sleep-disordered breathing: diagnosis
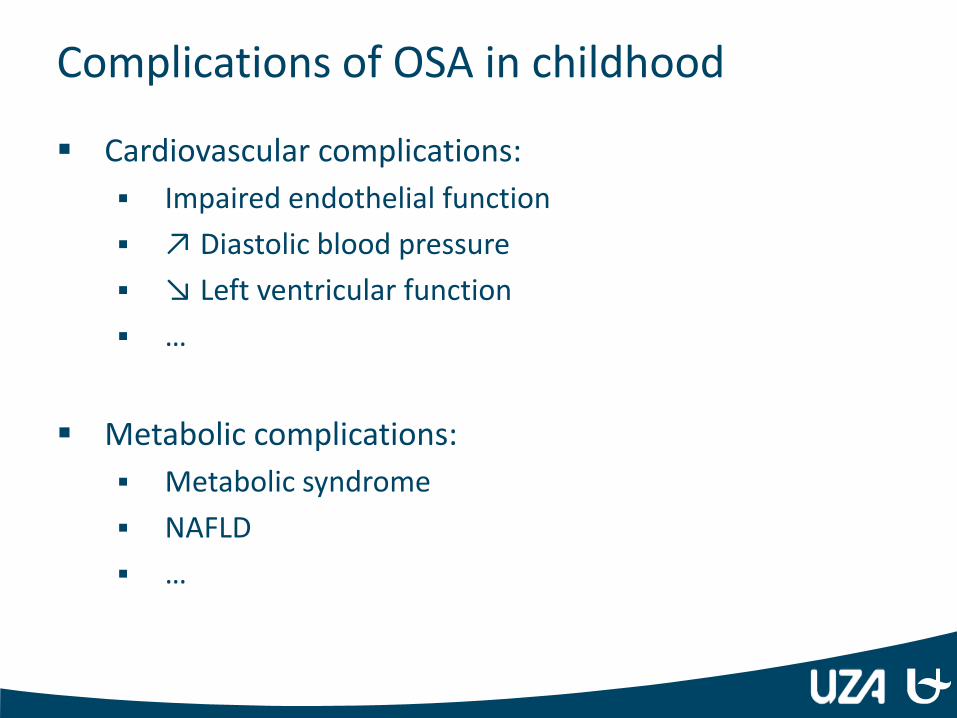
Complications of OSA in childhood
Cardiovascular complications:
Impaired endothelial function
↗ Diastolic blood pressure
↘ Left ventricular function
…
Metabolic complications:
Metabolic syndrome
NAFLD
…
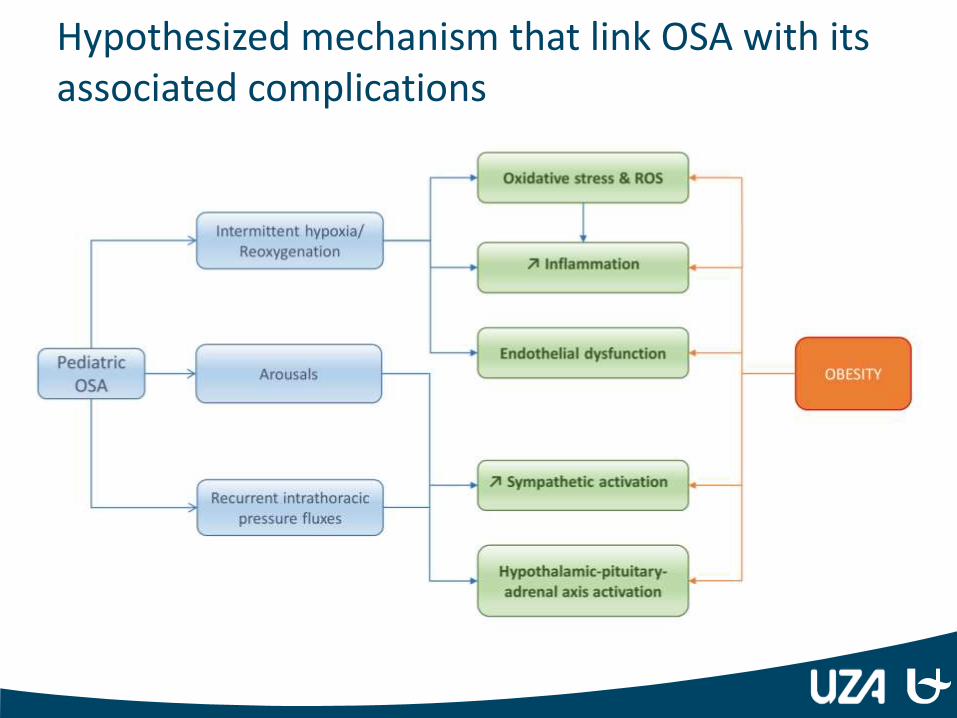
Hypothesized mechanism that link OSA with its associated complications
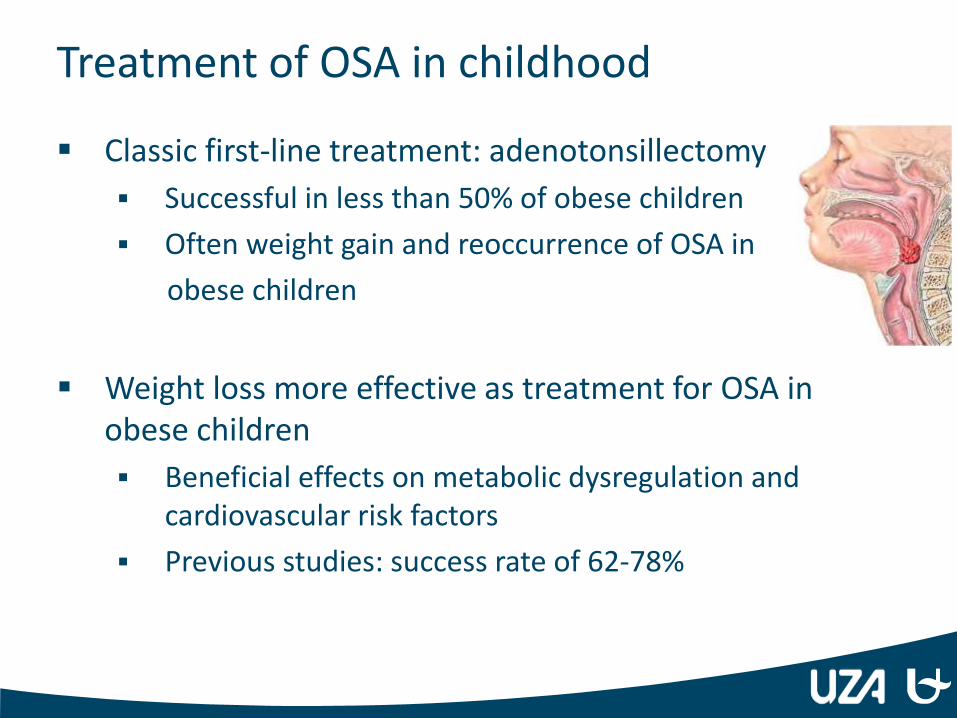
Treatment of OSA in childhood
Classic first-line treatment: adenotonsillectomy
Successful in less than 50% of obese children
Often weight gain and reoccurrence of OSA in
obese children
Weight loss more effective as treatment for OSA in obese children
Beneficial effects on metabolic dysregulation and cardiovascular risk factors
Previous studies: success rate of 62-78%
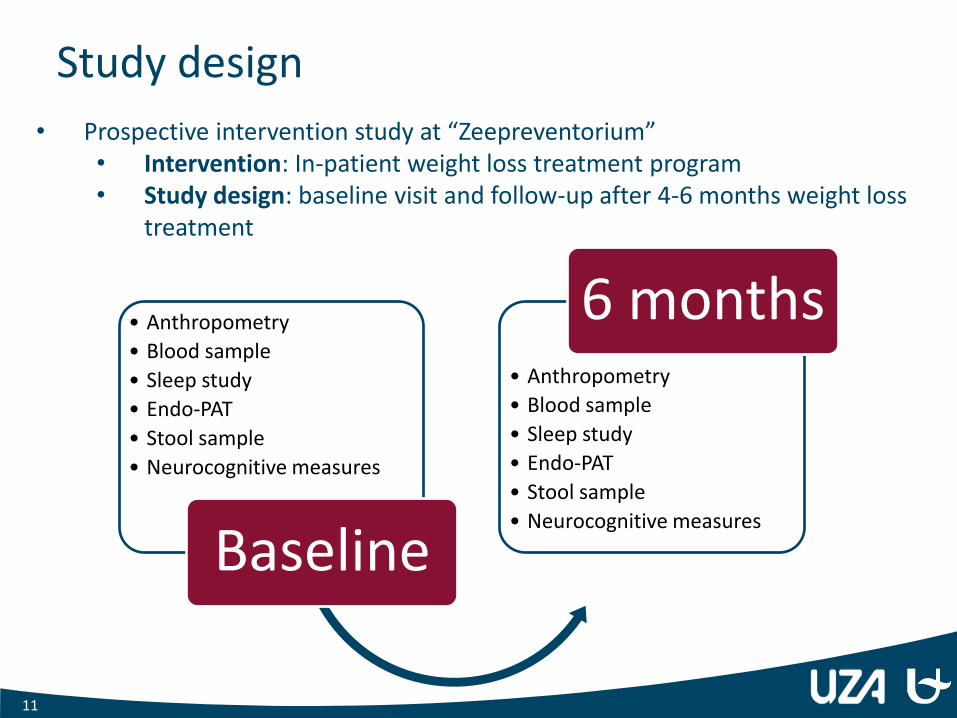
Study design
• Anthropometry
• Blood sample
• Sleep study
• Endo-PAT
• Stool sample
• Neurocognitive measures
Baseline
• Anthropometry
• Blood sample
• Sleep study
• Endo-PAT
• Stool sample
• Neurocognitive measures
6 months
11
• Prospective intervention study at “Zeepreventorium” • Intervention: In-patient weight loss treatment program • Study design: baseline visit and follow-up after 4-6 months weight loss
treatment
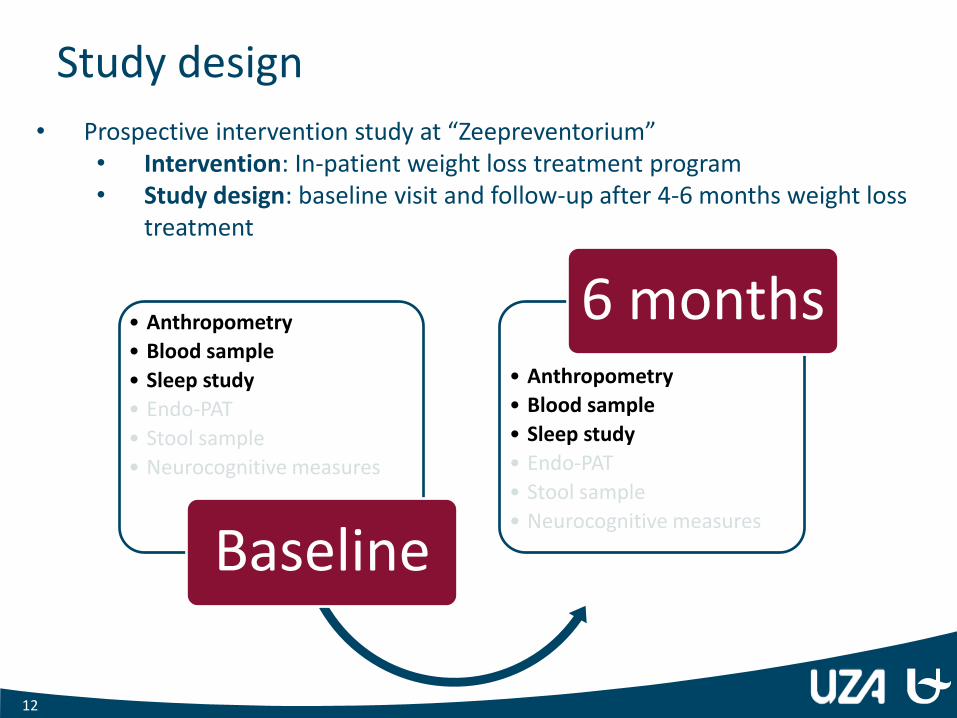
Study design
• Anthropometry
• Blood sample
• Sleep study
• Endo-PAT
• Stool sample
• Neurocognitive measures
Baseline
• Anthropometry
• Blood sample
• Sleep study
• Endo-PAT
• Stool sample
• Neurocognitive measures
6 months
12
• Prospective intervention study at “Zeepreventorium” • Intervention: In-patient weight loss treatment program • Study design: baseline visit and follow-up after 4-6 months weight loss
treatment
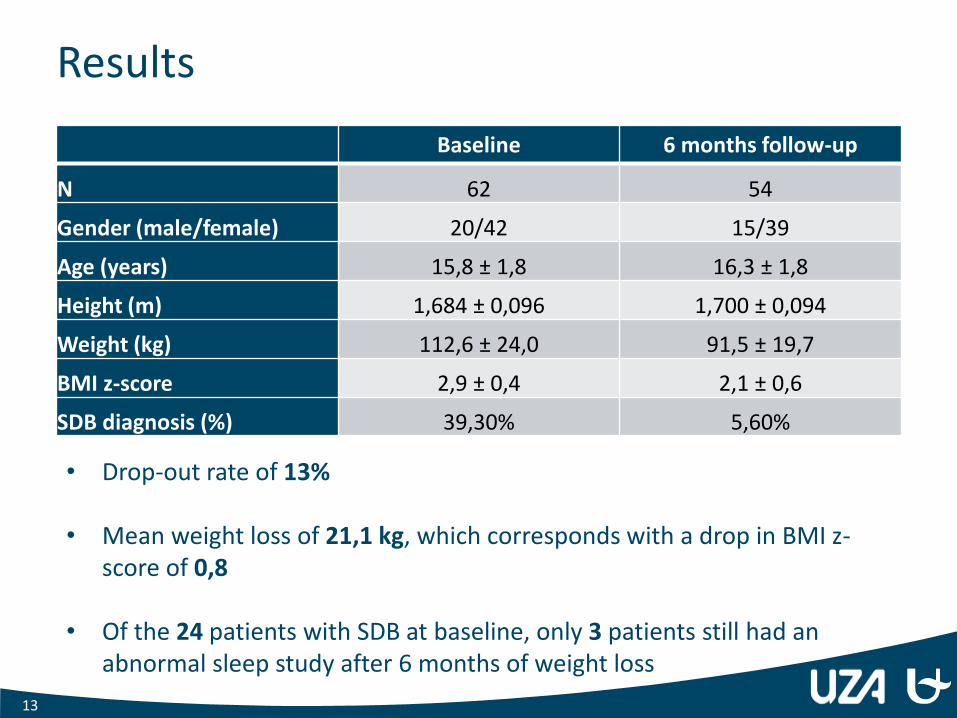
Results
Baseline 6 months follow-up
N 62 54
Gender (male/female) 20/42 15/39
Age (years) 15,8 ± 1,8 16,3 ± 1,8
Height (m) 1,684 ± 0,096 1,700 ± 0,094
Weight (kg) 112,6 ± 24,0 91,5 ± 19,7
BMI z-score 2,9 ± 0,4 2,1 ± 0,6
SDB diagnosis (%) 39,30% 5,60%
13
• Drop-out rate of 13%
• Mean weight loss of 21,1 kg, which corresponds with a drop in BMI z-score of 0,8
• Of the 24 patients with SDB at baseline, only 3 patients still had an abnormal sleep study after 6 months of weight loss
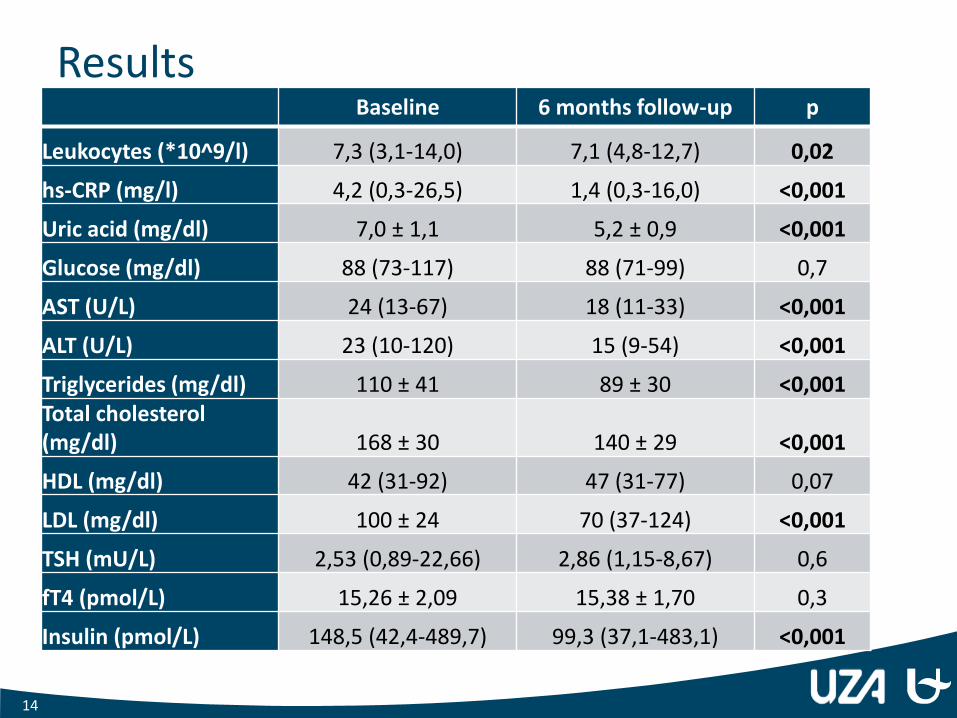
Results Baseline 6 months follow-up p
Leukocytes (*10^9/l) 7,3 (3,1-14,0) 7,1 (4,8-12,7) 0,02
hs-CRP (mg/l) 4,2 (0,3-26,5) 1,4 (0,3-16,0) <0,001
Uric acid (mg/dl) 7,0 ± 1,1 5,2 ± 0,9 <0,001
Glucose (mg/dl) 88 (73-117) 88 (71-99) 0,7
AST (U/L) 24 (13-67) 18 (11-33) <0,001
ALT (U/L) 23 (10-120) 15 (9-54) <0,001
Triglycerides (mg/dl) 110 ± 41 89 ± 30 <0,001 Total cholesterol (mg/dl) 168 ± 30 140 ± 29 <0,001
HDL (mg/dl) 42 (31-92) 47 (31-77) 0,07
LDL (mg/dl) 100 ± 24 70 (37-124) <0,001
TSH (mU/L) 2,53 (0,89-22,66) 2,86 (1,15-8,67) 0,6
fT4 (pmol/L) 15,26 ± 2,09 15,38 ± 1,70 0,3
Insulin (pmol/L) 148,5 (42,4-489,7) 99,3 (37,1-483,1) <0,001
14
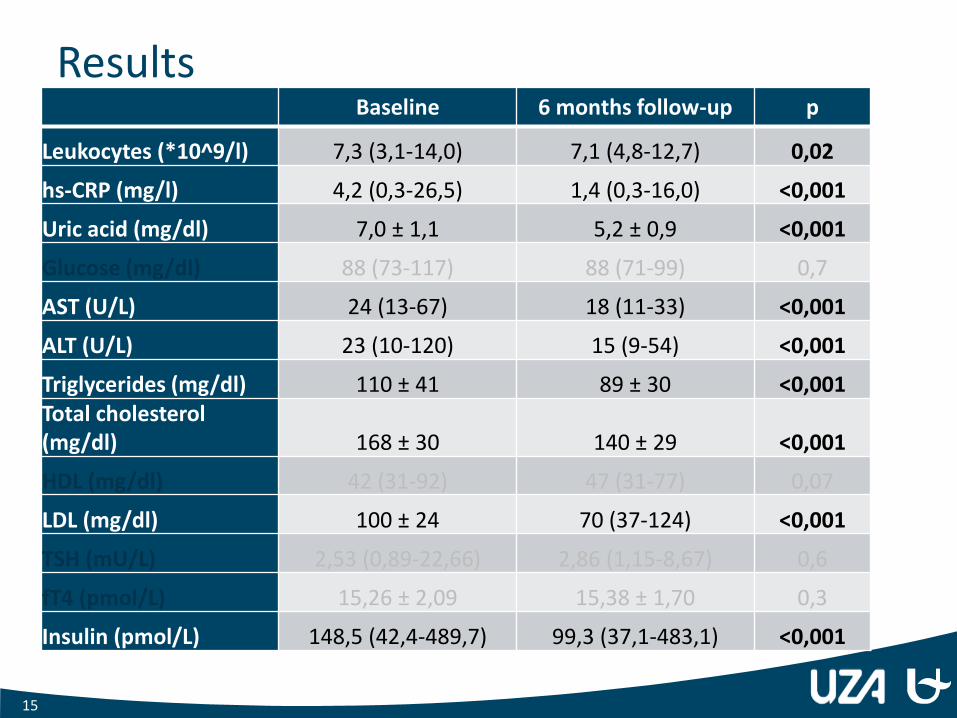
Results Baseline 6 months follow-up p
Leukocytes (*10^9/l) 7,3 (3,1-14,0) 7,1 (4,8-12,7) 0,02
hs-CRP (mg/l) 4,2 (0,3-26,5) 1,4 (0,3-16,0) <0,001
Uric acid (mg/dl) 7,0 ± 1,1 5,2 ± 0,9 <0,001
Glucose (mg/dl) 88 (73-117) 88 (71-99) 0,7
AST (U/L) 24 (13-67) 18 (11-33) <0,001
ALT (U/L) 23 (10-120) 15 (9-54) <0,001
Triglycerides (mg/dl) 110 ± 41 89 ± 30 <0,001 Total cholesterol (mg/dl) 168 ± 30 140 ± 29 <0,001
HDL (mg/dl) 42 (31-92) 47 (31-77) 0,07
LDL (mg/dl) 100 ± 24 70 (37-124) <0,001
TSH (mU/L) 2,53 (0,89-22,66) 2,86 (1,15-8,67) 0,6
fT4 (pmol/L) 15,26 ± 2,09 15,38 ± 1,70 0,3
Insulin (pmol/L) 148,5 (42,4-489,7) 99,3 (37,1-483,1) <0,001
15
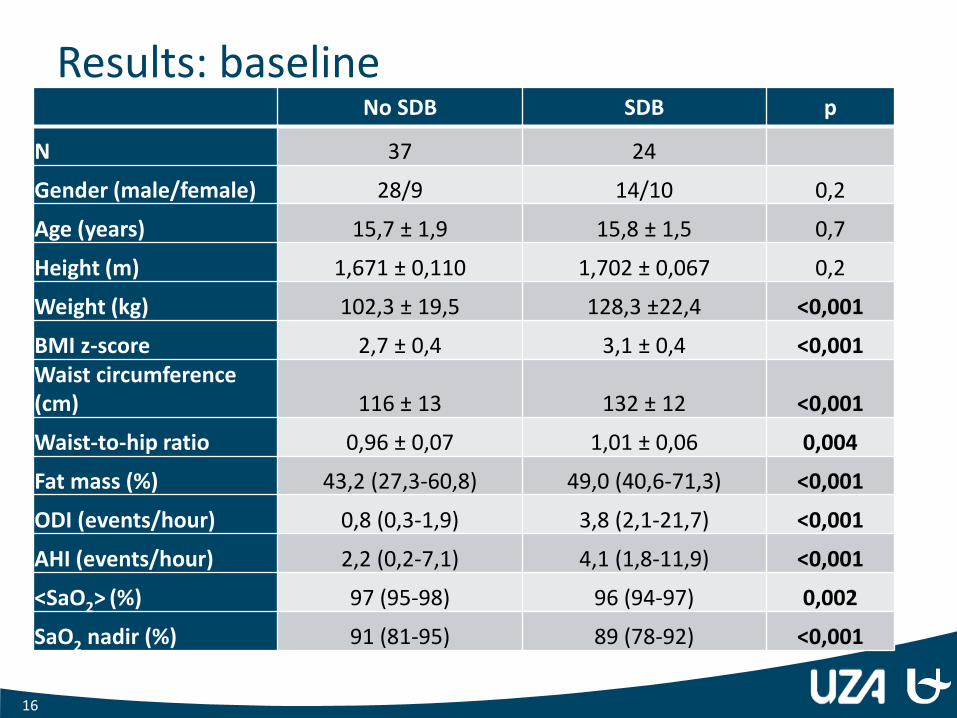
Results: baseline No SDB SDB p
N 37 24
Gender (male/female) 28/9 14/10 0,2
Age (years) 15,7 ± 1,9 15,8 ± 1,5 0,7
Height (m) 1,671 ± 0,110 1,702 ± 0,067 0,2
Weight (kg) 102,3 ± 19,5 128,3 ±22,4 <0,001
BMI z-score 2,7 ± 0,4 3,1 ± 0,4 <0,001 Waist circumference (cm) 116 ± 13 132 ± 12 <0,001
Waist-to-hip ratio 0,96 ± 0,07 1,01 ± 0,06 0,004
Fat mass (%) 43,2 (27,3-60,8) 49,0 (40,6-71,3) <0,001
ODI (events/hour) 0,8 (0,3-1,9) 3,8 (2,1-21,7) <0,001
AHI (events/hour) 2,2 (0,2-7,1) 4,1 (1,8-11,9) <0,001
<SaO2> (%) 97 (95-98) 96 (94-97) 0,002
SaO2 nadir (%) 91 (81-95) 89 (78-92) <0,001
16
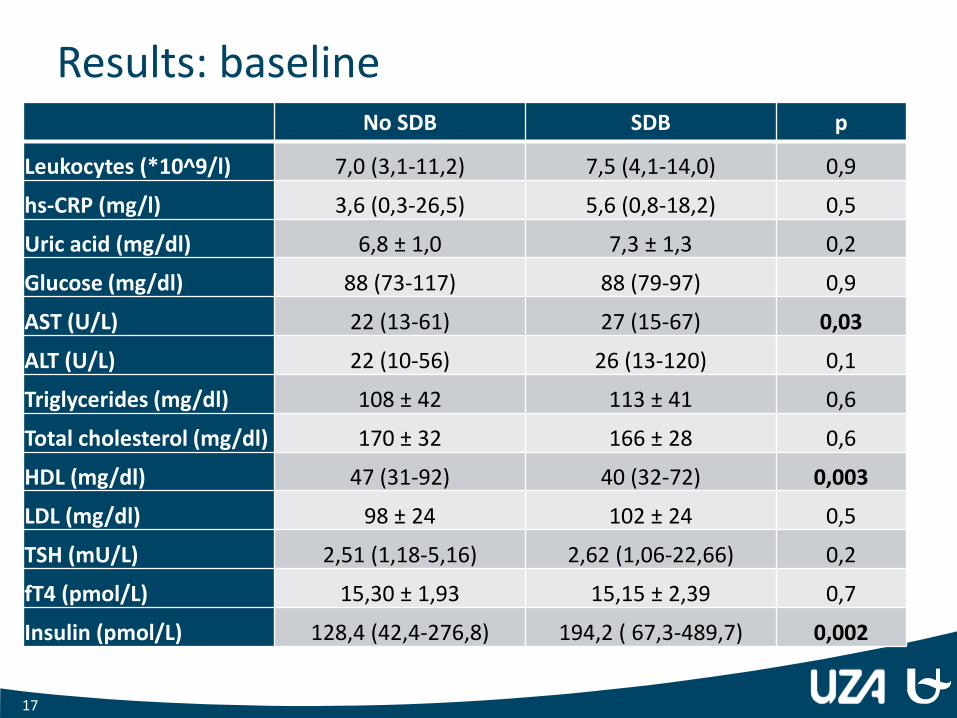
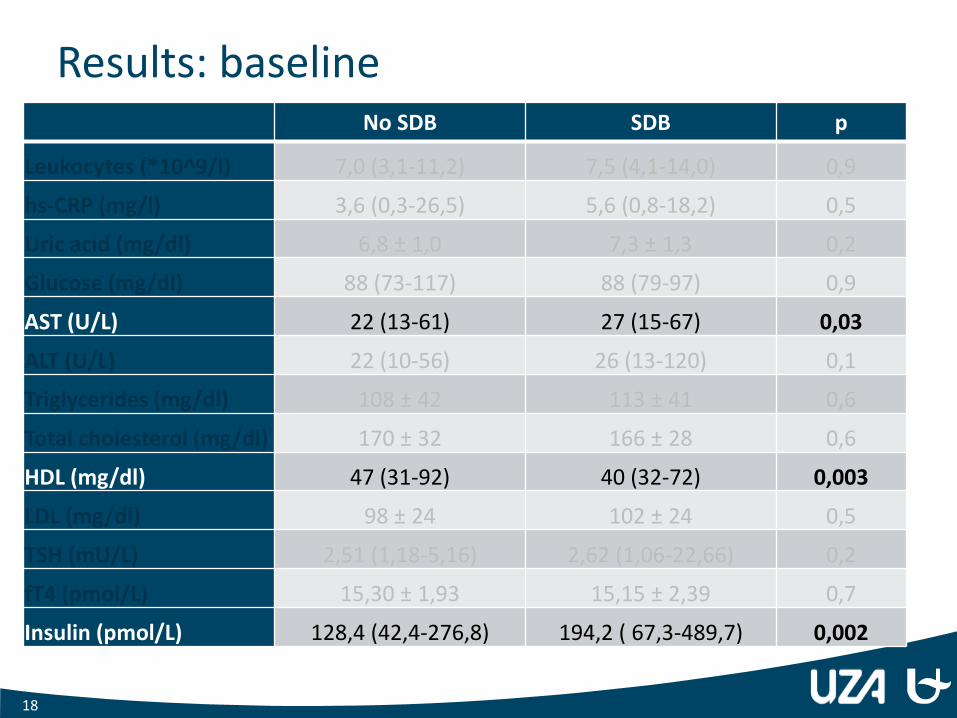
Results: baseline No SDB SDB p
Leukocytes (*10^9/l) 7,0 (3,1-11,2) 7,5 (4,1-14,0) 0,9
hs-CRP (mg/l) 3,6 (0,3-26,5) 5,6 (0,8-18,2) 0,5
Uric acid (mg/dl) 6,8 ± 1,0 7,3 ± 1,3 0,2
Glucose (mg/dl) 88 (73-117) 88 (79-97) 0,9
AST (U/L) 22 (13-61) 27 (15-67) 0,03
ALT (U/L) 22 (10-56) 26 (13-120) 0,1
Triglycerides (mg/dl) 108 ± 42 113 ± 41 0,6
Total cholesterol (mg/dl) 170 ± 32 166 ± 28 0,6
HDL (mg/dl) 47 (31-92) 40 (32-72) 0,003
LDL (mg/dl) 98 ± 24 102 ± 24 0,5
TSH (mU/L) 2,51 (1,18-5,16) 2,62 (1,06-22,66) 0,2
fT4 (pmol/L) 15,30 ± 1,93 15,15 ± 2,39 0,7
Insulin (pmol/L) 128,4 (42,4-276,8) 194,2 ( 67,3-489,7) 0,002
17
Results: baseline No SDB SDB p
Leukocytes (*10^9/l) 7,0 (3,1-11,2) 7,5 (4,1-14,0) 0,9
hs-CRP (mg/l) 3,6 (0,3-26,5) 5,6 (0,8-18,2) 0,5
Uric acid (mg/dl) 6,8 ± 1,0 7,3 ± 1,3 0,2
Glucose (mg/dl) 88 (73-117) 88 (79-97) 0,9
AST (U/L) 22 (13-61) 27 (15-67) 0,03
ALT (U/L) 22 (10-56) 26 (13-120) 0,1
Triglycerides (mg/dl) 108 ± 42 113 ± 41 0,6
Total cholesterol (mg/dl) 170 ± 32 166 ± 28 0,6
HDL (mg/dl) 47 (31-92) 40 (32-72) 0,003
LDL (mg/dl) 98 ± 24 102 ± 24 0,5
TSH (mU/L) 2,51 (1,18-5,16) 2,62 (1,06-22,66) 0,2
fT4 (pmol/L) 15,30 ± 1,93 15,15 ± 2,39 0,7
Insulin (pmol/L) 128,4 (42,4-276,8) 194,2 ( 67,3-489,7) 0,002
18
Results: 6 month follow-up
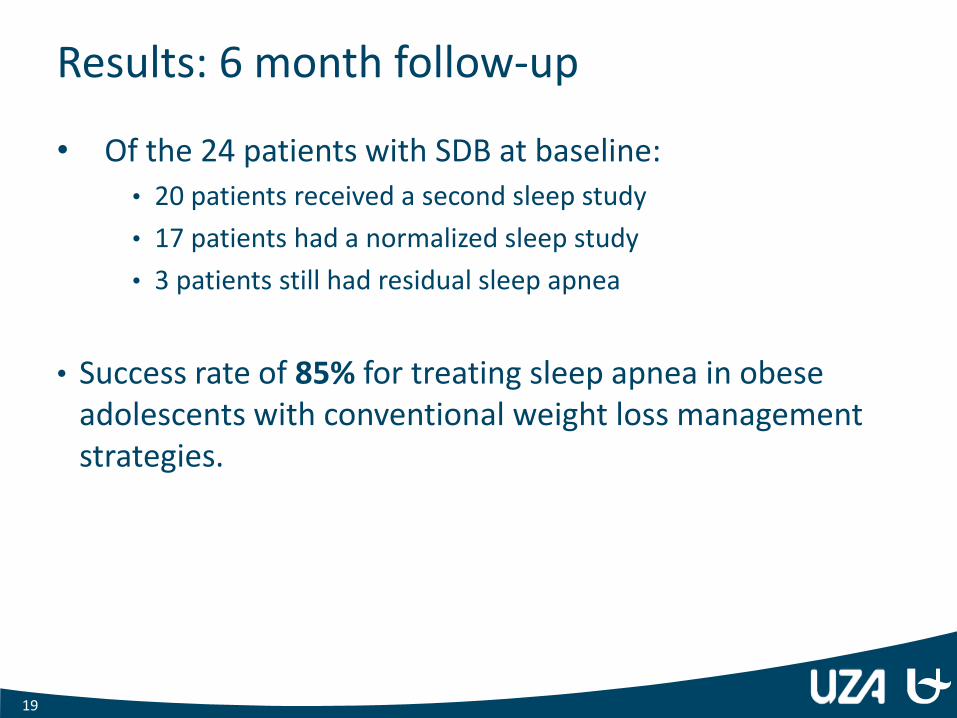
• Of the 24 patients with SDB at baseline:
• 20 patients received a second sleep study
• 17 patients had a normalized sleep study
• 3 patients still had residual sleep apnea
• Success rate of 85% for treating sleep apnea in obese adolescents with conventional weight loss management strategies.
19
Conclusion
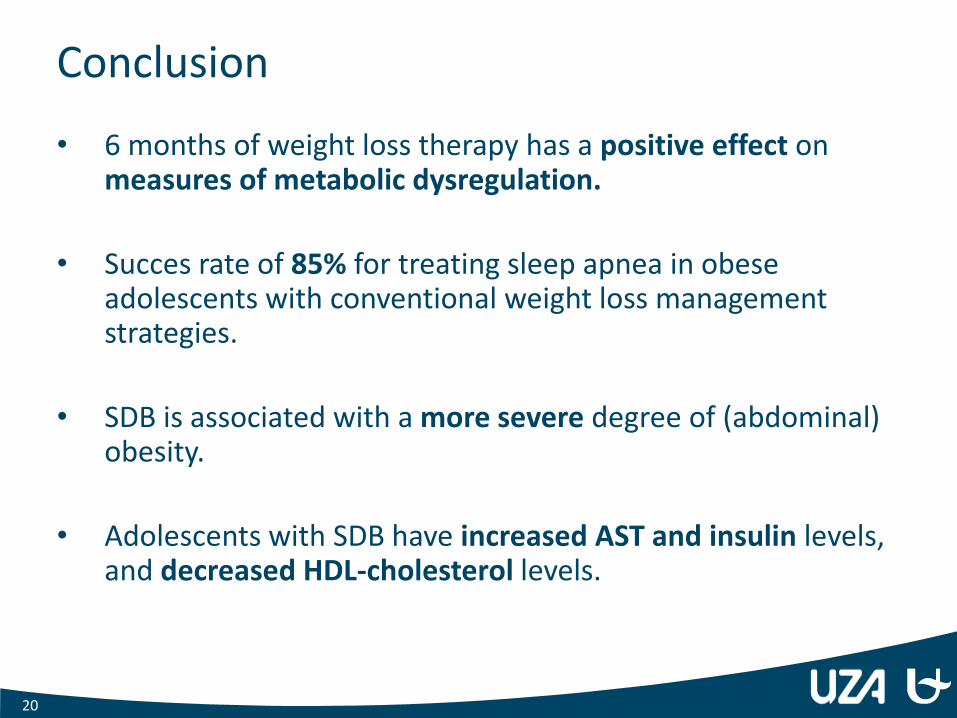
• 6 months of weight loss therapy has a positive effect on measures of metabolic dysregulation.
• Succes rate of 85% for treating sleep apnea in obese adolescents with conventional weight loss management strategies.
• SDB is associated with a more severe degree of (abdominal) obesity.
• Adolescents with SDB have increased AST and insulin levels, and decreased HDL-cholesterol levels.
20
To do
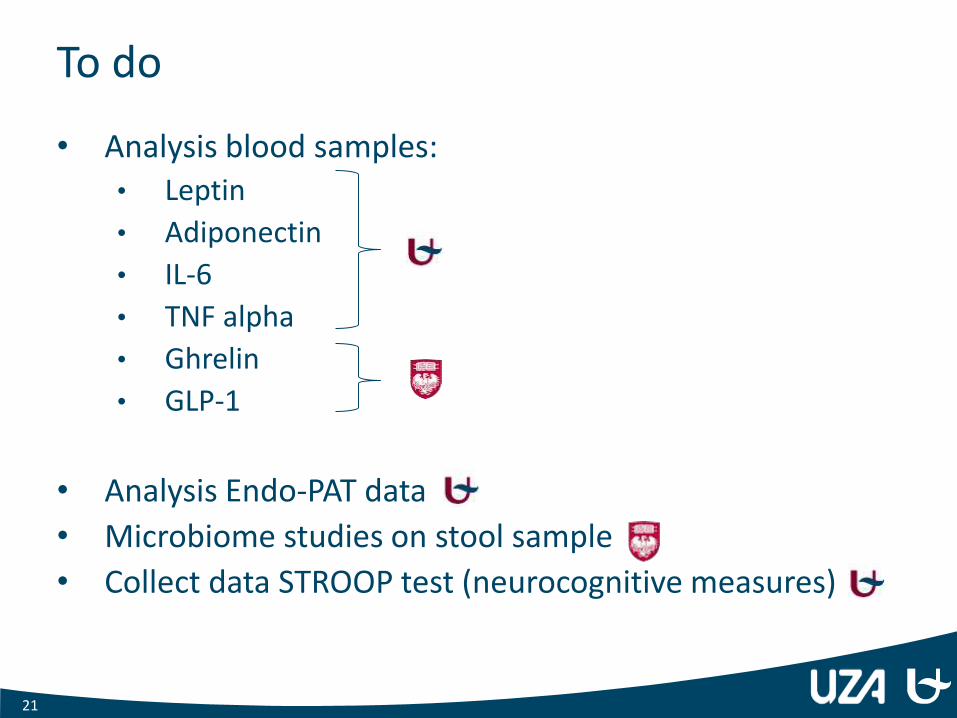
• Analysis blood samples: • Leptin
• Adiponectin
• IL-6
• TNF alpha
• Ghrelin
• GLP-1
• Analysis Endo-PAT data
• Microbiome studies on stool sample
• Collect data STROOP test (neurocognitive measures)
21

22