Embed Size (px)
Citation preview
Sky island diversification meets the multispeciescoalescent – divergence in the spruce-fir moss spider(Microhexura montivaga, Araneae, Mygalomorphae) onthe highest peaks of southern Appalachia
MARSHAL HEDIN,* DAVE CARLSON* and FRED COYLE†*Department of Biology, San Diego State University, San Diego, CA 92182, USA, †PO Box 1935, Cullowhee, NC 28723, USA
Abstract
Microhexura montivaga is a miniature tarantula-like spider endemic to the highest
peaks of the southern Appalachian mountains and is known only from six allopatric,
highly disjunct montane populations. Because of severe declines in spruce-fir forest in
the late 20th century, M. montivaga was formally listed as a US federally endangered
species in 1995. Using DNA sequence data from one mitochondrial and seven nuclear
genes, patterns of multigenic genetic divergence were assessed for six montane popula-
tions. Independent mitochondrial and nuclear discovery analyses reveal obvious
genetic fragmentation both within and among montane populations, with five to seven
primary genetic lineages recovered. Multispecies coalescent validation analyses [guide
tree and unguided Bayesian Phylogenetics and Phylogeography (BPP), Bayes factor
delimitation (BFD)] using nuclear-only data congruently recover six or seven distinct
lineages; BFD analyses using combined nuclear plus mitochondrial data favour seven
or eight lineages. In stark contrast to this clear genetic fragmentation, a survey of sec-
ondary sexual features for available males indicates morphological conservatism across
montane populations. While it is certainly possible that morphologically cryptic speci-
ation has occurred in this taxon, this system may alternatively represent a case where
extreme population genetic structuring (but not speciation) leads to an oversplitting of
lineage diversity by multispecies coalescent methods. Our results have clear conserva-
tion implications for this federally endangered taxon and illustrate a methodological
issue expected to become more common as genomic-scale data sets are gathered for
taxa found in naturally fragmented habitats.
Keywords: allopatry, Bayes factor delimitation, conservation genetics, montane speciation,
population structure, unguided Bayesian Phylogenetics and Phylogeography
Received 26 January 2015; revision received 13 May 2015; accepted 14 May 2015
Introduction
Evolutionary biologists have long been interested in
evolution on mountains. In mainland North America,
conspicuous hotspots for montane diversification
include the California Sierra Nevada (Rovito 2010; Scho-
ville & Roderick 2010; Hedin et al. 2013), ‘sky islands’
of the desert southwest (Maddison & McMahon 2000;
Derkarabetian et al. 2011) and the southern Appalachian
mountains (Hedin 1997; Weisrock & Larson 2006; Keith
& Hedin 2012). In each of these areas, mountains act as
naturally fragmented habitat islands, serve as refugia in
the face of climatic variation and/or generate strong
ecological gradients. These combinations of genetic and
geographic isolation with potential selective differences
promote the evolution of both population genetic struc-
ture (arrays of geographically distinct populations
which are genetically divergent to various degrees) and
clear species-level divergences. These naturally allopat-
ric systems also present classic difficulties for speciationCorrespondence: Marshal Hedin, Fax: +1 619 594 5676;
E-mail: [email protected]
© 2015 John Wiley & Sons Ltd
Molecular Ecology (2015) 24, 3467–3484 doi: 10.1111/mec.13248
biologists – when allopatry prevails and population
structure is ubiquitous, distinguishing population sub-
division from speciation is challenging and often ‘fuzzy’
(Leavitt et al. 2007; Bond & Stockman 2008; Keith &
Hedin 2012; Satler et al. 2013). For example, Hey (2009)
pointed out that the null hypothesis for many species
delimitation methods is a ‘no significant differentiation’
model. Because both population subdivision and specia-
tion imply differentiation (i.e. rejection of the null), such
methods can mistakenly equate these potentially differ-
ent evolutionary dynamics (see also Hey & Pinho 2012).
Modern researchers have access to many types of
data when investigating the interface between popula-
tion divergence and speciation, including data derived
from morphology, behaviour, ecology and genomes.
Assessing nuclear genomic divergence is particularly
attractive in naturally fragmented systems because such
data represent a common currency for measuring both
population genetic structure and speciation, and explicit
models are available that potentially distinguish popula-
tion structure from species-level divergence. These
include single-locus models (e.g. generalized mixed
Yule coalescent model, Pons et al. 2006; Fujisawa & Bar-
raclough 2013) and arguably more powerful multilocus
models. A plethora of multilocus species delimitation
methods have been developed over the past 10 years
(O’Meara 2010; Yang & Rannala 2010; Grummer et al.
2014). Many empirical studies have been published
using such methods (reviewed in Fujita et al. 2012; Car-
stens et al. 2013), and this remains an active area of
method development (e.g. DISSECT, Jones et al. 2014;
unguided Bayesian Phylogenetics and Phylogeography
(BPP), Yang & Rannala 2014; *BFD, Leach�e et al. 2014).
Despite this outstanding analytical progress, the
performance of multispecies coalescent methods in
highly genetically subdivided systems (e.g. taxa inhabit-
ing mountains, islands, caves) has not been extensively
explored (Camargo & Sites 2013). A central assumption
of many recently developed methods is the neutral coa-
lescent (or something analogous), where gene trees
evolve within species according to a no selection, no
recombination, panmixia model (Rannala & Yang 2003).
For example, the heuristic BROWNIE approaches devel-
oped by O’Meara (2010) simultaneously estimate spe-
cies trees and species limits by assuming unconstrained
gene flow within and a lack of gene flow between spe-
cies. Simulations incorporating population structure
tended to result in oversplitting by this method (O’Me-
ara 2010), and the empirical work of Niemiller et al.
(2012) in naturally fragmented cavefishes hinted at
oversplitting, with both allelic and individual sampling
inflating species numbers. Another popular method is
BPP (Yang & Rannala 2010, 2014; Rannala & Yang 2013)
– this method assumes panmixia within species, and
has been suggested to potentially oversplit diversity in
dispersal-limited taxa (e.g. Niemiller et al. 2012; Barley
et al. 2013; McKay et al. 2013; Satler et al. 2013). Authors
of these methods have acknowledged the inherent diffi-
culties associated with fragmented, allopatric systems
(e.g. Zhang et al. 2013).
Microhexura montivaga, the spruce-fir moss spider, is a
miniature mygalomorph spider (F. Dipluridae) endemic
to high-elevation red spruce-Fraser fir forests of the
southern Appalachian mountains (Coyle 1981, 1985).
Recent survey work (Coyle 2009) indicates that Micro-
hexura is distributed as six disjunct montane popula-
tions, occupying the Virginia Balsam Mountains
(Virginia), Roan Mountain (Tennessee/North Carolina),
Grandfather Mountain (NC), the Black Mountains (NC),
the Plott Balsam Mountains (NC) and the Great Smoky
Mountains (TN/NC) (Fig. 1). Most of these sky island
populations are found above 1800 metres and include
the highest elevations in eastern North America (e.g.
Mt. Mitchell, Black Mountains, NC). Spatial isolation
also potentially exists within mountain ranges, where
spiders build sheet webs underneath bryophyte mats
on steep, north-facing rock outcrops (Coyle 2009). These
distinct outcrops are often separated by habitats lacking
spiders (lower elevations, no spruce-fir forest, no rock
outcrops). Because of severe declines in spruce-fir forest
in the late 20th century, M. montivaga was formally
listed as a US federally endangered species in 1995 (Fri-
dell 1994, 2001). This status remains valid today, and
while recent survey work (Coyle 2009) has shown that
some montane populations include many rock outcrop
demes and show comparatively large census population
sizes (e.g. Great Smoky and Black Mountain popula-
tions), other populations are precariously small, known
only from one or a few rock outcrops within a moun-
tain range (e.g. Virginia Balsams, Plott Balsams).
The research presented here was motivated primarily
by an interest in documenting multilocus genetic struc-
ture both within and among montane Microhexura pop-
ulations, with the goal of using this information to help
inform conservation decisions for this endangered
species. There are no previous studies of Microhexura
population structure, and while it is known that other
mygalomorphs (e.g. burrow-dwelling trapdoor spiders)
display remarkable microgeographic genetic differentia-
tion (e.g. Bond & Stockman 2008; Hedin et al. 2013;
Satler et al. 2013; Castalanelli et al. 2014; Opatova &
Arnedo 2014), whether such dispersal limitation applies
in the small-bodied (adult total length <6 mm), web-
building Microhexura is currently unknown. A second
goal was to explore the use of multilocus species delim-
itation methods in this naturally fragmented system.
The southern Appalachian mountains represent a hot-
spot for speciation in both arthropods (e.g. Hedin 1997;
© 2015 John Wiley & Sons Ltd
3468 M. HEDIN ET AL.
Thomas & Hedin 2008; Marek & Bond 2009; Hedin &
Thomas 2010; Keith & Hedin 2012) and vertebrates (e.g.
Weisrock & Larson 2006; Crespi et al. 2010). Although
Coyle (1981) did not comment on morphological geo-
graphic variation in his revision of M. montivaga, it is
possible that morphologically cryptic speciation has
occurred in this taxon. Conversely, this system may
represent a case where extreme population genetic
structuring (but not speciation) leads to an oversplitting
of lineage diversity by multispecies coalescent methods.
While these alternatives are challenging to resolve in
any natural system, our results illustrate an empirical
issue expected to become increasingly common as geno-
mic-scale data sets are gathered for taxa found in natu-
rally fragmented habitats.
Materials and methods
Morphological study
The morphology of adult male pedipalps and first legs
(which possess mating spurs) is often used as a primary
character for species delimitation in mygalomorph spi-
ders, including diplurids (e.g. Coyle 1984, 1988, 1995).
To assess qualitative morphological divergence across
M. montivaga populations, all adult males from Grand-
father Mountain (n = 2) and the Great Smoky Moun-
tains (n = 8) were borrowed from the American
Museum of Natural History. Males are also known
from the Black Mountains (vicinity Mt. Mitchell, includ-
ing type specimens – Crosby & Bishop 1925; Coyle
1981), but these specimens could not be located at the
AMNH. Adult males have never been collected from
the Virginia Balsams, Roan Mountain or the Plott Bal-
sams. A subset of specimens was imaged using a
Visionary Digital BK Plus system (http://www.vision-
arydigital.com), including a Canon 5D digital camera,
Infinity Optics Long Distance Microscope, P-51 camera
controller and FX2 lighting system. Individual images
were combined into a composite image using HELICON
FOCUS V5.3 and then edited using Adobe Photoshop
CS6.
Molecular marker development, sampling, datacollection
Mitochondrial and nuclear genetic markers were devel-
oped specifically for Microhexura using comparative
transcriptomic data (Material S1, Supporting informa-
tion). Genomic DNA was extracted from nondestruc-
tively sampled leg tissues, collected under permit by F.
Coyle. Forty-seven M. montivaga specimens were sam-
pled (Fig. 1, Material S2, Supporting information), plus
a specimen of the sister species M. idahoana from the
Pacific Northwest. Transcriptome data were used to
assess whether amplified PCR products were ‘on tar-
get’, but were not used in downstream nuclear analyses
as heterozygosity could not be assessed (transcriptomes
were derived from multiple individuals, see Material
S1, Supporting information).
After multiple iterations of primer testing and preli-
minary sequencing, one mitochondrial and seven
nuclear gene regions were chosen for comprehensive
specimen sampling (Table 1; primers, PCR conditions
and transcript annotations are provided in Material S3,
Supporting information). Amplified PCR products were
purified using standard techniques, and Sanger
sequenced (29 coverage) at Macrogen USA. DNA
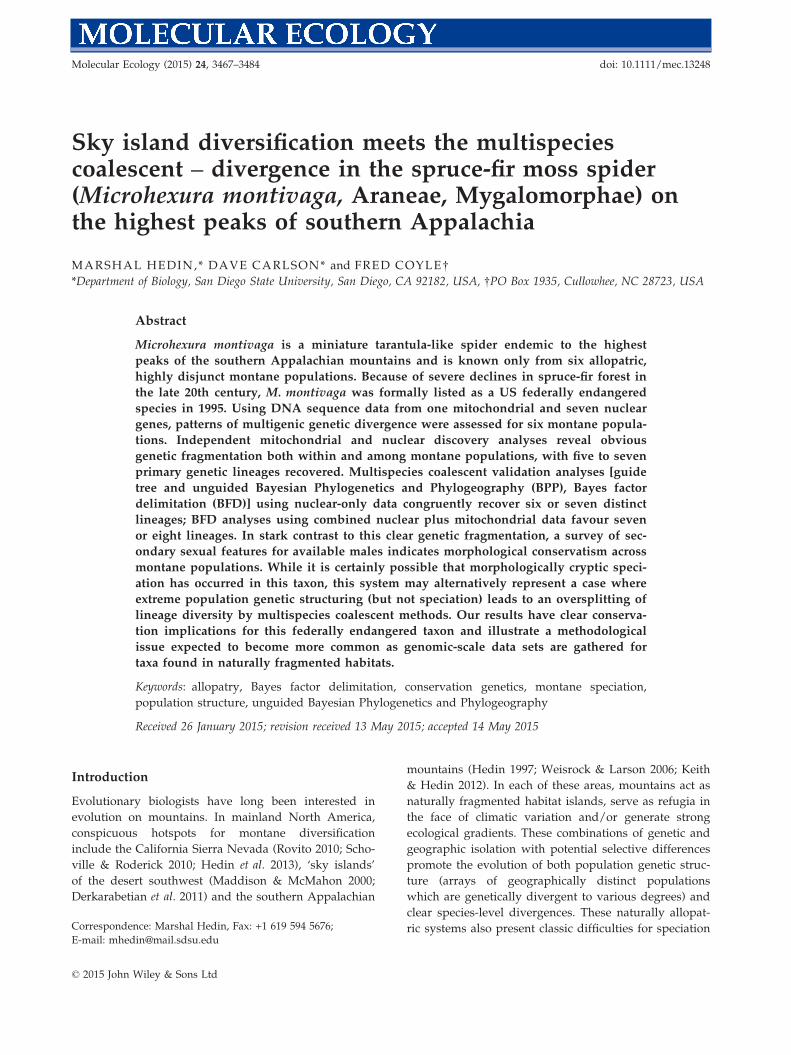
Fig. 1 Geographic distribution of sam-
pled specimens from six primary mon-
tane populations. Number of sampled
individuals and ‘demes’ (i.e. separate
rock outcrop populations within moun-
tain ranges) also indicated.
© 2015 John Wiley & Sons Ltd
SKY ISLAND SPECIES DELIMITATION 3469
sequences were edited using Geneious Pro (www.gene-
ious.com/) and trimmed to exclude primer sequences.
Minor gaps in nuclear sequences were recoded as fol-
lows (*data matrices named using arbitrary primer
names): E3_E4 matrix, 17-base pair (bp) insertion found
in Winter Star and Celo Knob, 6-bp deletion found in
Smokies and Plott Balsams each recoded as two-state
nucleotide transitions (e.g. A<>G); D11D12 matrix, 3-bp
insertion in out-group vs. in-group recoded as a two-
state nucleotide transition; B2_D3D4 matrix, 2 separate
2-bp insertions recoded as single two-state nucleotide
transitions; B2_E7E8 matrix, single bp indel recoded as
a two-state nucleotide transition. Heterozygous nuclear
sequences were bioinformatically phased to alleles
using the software program PHASE 2.1.1 (Stephens et al.
2001; Stephens & Donnelly 2003). SEQPHASE (Flot 2010)
was used to convert matrices for input into PHASE. PHASE
analyses were conducted using default settings (phase
threshold = 90%, 100 iterations, thinning interval = 1,
burn-in = 100) and were repeated multiple times to
ensure consistent results.
Analytical framework
Our analytical framework included both ‘discovery’
and ‘validation’ approaches to delimit species (Ence &
Carstens 2011; Carstens & Satler 2013). Mitochondrial
gene trees and a mitochondrial Bayesian Poisson tree
processes analysis (bPTP, Zhang et al. 2013) were used
as species ‘discovery’ methods. Nuclear-only gene trees
and nuclear-only clustering results (POFAD, STRUCTURE)
were similarly used as independent discovery methods.
These various genetic discovery results were combined
with geographic criteria (e.g. isolated montane popula-
tions as species) to formulate a set of alternative species
delimitation hypotheses, which were then statistically
compared using Bayes factor delimitation (BFD; Grum-
mer et al. 2014) and BPP (Yang & Rannala 2014) ‘valida-
tion’ analyses. Most validation analyses were based on
nuclear-only data matrices, although we also conducted
BFD analyses using combined nuclear and mitochon-
drial data.
Discovery analyses
Individual gene trees were estimated using maximum
likelihood implemented in the RAxML_GUI (Stamatakis
2006, 2014; Silvestro & Michalak 2012). Analyses
included a thorough bootstrap analysis (1000 bootstrap
replicates) followed by multiple inferences (100) on
alignments. Nuclear gene trees were estimated using an
unpartitioned GTR_Γ model; mitochondrial COI data
were partitioned by codon position, with the same
model applied to each partition.
The mitochondrial RAxML gene tree was used as
input in bPTP analyses, implemented on the bPTP ser-
ver (http://species.h-its.org/ptp/; Zhang et al. 2013).
PTP is a single-locus species delimitation method using
only nucleotide substitution information, implementing
a model assuming gene tree branch lengths generated
by two independent Poisson process classes (within-
and among-species substitution events). Available simu-
lation studies suggest that PTP outperforms GMYC
(Pons et al. 2006; Fujisawa & Barraclough 2013) for sin-
gle-locus species delimitations (Zhang et al. 2013). Two
replicate bPTP analyses were run for 100 000 MCMC
generations, with a thinning of 100 and burn-in of 0.1.
Multigenic nuclear genetic distances (uncorrected
p-distances from PAUP*, Swofford 2002) among individ-
uals were calculated using POFAD 1.05 (Joly & Bruneau
2006). To eliminate the potentially confounding influ-
ence of extreme female-based population structure,
mitochondrial data were excluded in POFAD analyses.
Also, out-group data were excluded from this analysis.
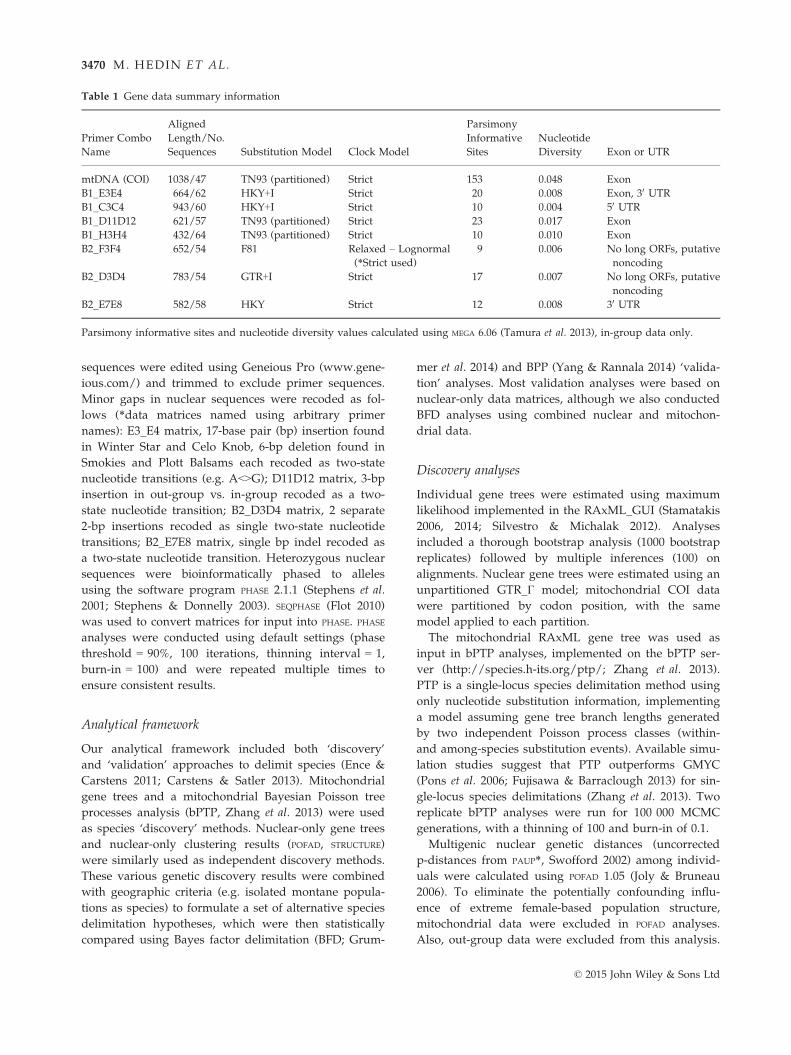
Table 1 Gene data summary information
Primer Combo
Name
Aligned
Length/No.
Sequences Substitution Model Clock Model
Parsimony
Informative
Sites
Nucleotide
Diversity Exon or UTR
mtDNA (COI) 1038/47 TN93 (partitioned) Strict 153 0.048 Exon
B1_E3E4 664/62 HKY+I Strict 20 0.008 Exon, 30 UTR
B1_C3C4 943/60 HKY+I Strict 10 0.004 50 UTR
B1_D11D12 621/57 TN93 (partitioned) Strict 23 0.017 Exon
B1_H3H4 432/64 TN93 (partitioned) Strict 10 0.010 Exon
B2_F3F4 652/54 F81 Relaxed – Lognormal
(*Strict used)9 0.006 No long ORFs, putative
noncoding
B2_D3D4 783/54 GTR+I Strict 17 0.007 No long ORFs, putative
noncoding
B2_E7E8 582/58 HKY Strict 12 0.008 30 UTR
Parsimony informative sites and nucleotide diversity values calculated using MEGA 6.06 (Tamura et al. 2013), in-group data only.
© 2015 John Wiley & Sons Ltd
3470 M. HEDIN ET AL.
Analyses were conducted using both standardized
matrices (all individual matrices given the same weight)
and nonstandardized matrices (more variable matrices
with greater weight). Summary distances were used to
reconstruct NeighborNet networks in SplitsTree4 (Hu-
son & Bryant 2006).
STRUCTURE detects population structure through the
use of allele frequencies, identifying genetically homo-
geneous clusters of individuals that are in both Hardy–Weinberg and linkage equilibrium (Pritchard et al. 2000,
2010). STRUCTURE has also been used to identify putative
independently evolving genetic lineages in many stud-
ies (e.g. Weisrock et al. 2010; Rittmeyer & Austin 2012;
Satler et al. 2013). Both mitochondrial and out-group
data were excluded in STRUCTURE analyses. SNAP Map
(Price & Carbone 2005; Aylor et al. 2006) and the Moby-
le SNAP workbench (Monacell & Cardone 2014) were
used to convert DNA sequences to numbered unique
alleles (haplotypes) for STRUCTURE input (O’Neill et al.
2012). STRUCTURE runs were conducted assuming
between 3 and 7 genetic clusters (K = 3 through K = 7),
with each K value replicated three times. Analyses used
an admixture model, with a burn-in of 1 9 105 steps
(with 1 9 106 MCMC steps after burn-in), and allele fre-
quencies considered independent among populations.
Evanno et al. (2005) used simulations to show that the
maximal value of the log probability of the data given
K (L(K)) does not necessarily provide an accurate esti-
mation of K, but sometimes overestimates K. Instead, a
statistic called DK (= rate of change in log probability of
data between successive K values) consistently provided
a more accurate estimate of K under the simulation
conditions explored. Here, both approaches were con-
sidered to identify an optimal K value – estimates from
multiple replicates for multiple K values were calcu-
lated in Structure Harvester (Earl & vonHoldt 2012).
Data were summarized using the FullSearch algorithm
of CLUMPP (Jakobsson & Rosenberg 2007) and visual-
ized with DISTRUCT (Rosenberg 2004).
Validation analyses
Bayes factor delimitation (BFD; Grummer et al. 2014) is
a recently developed approach that compares the mar-
ginal likelihoods of competing species delimitation
hypotheses using Bayes factors. Specifically, this
method compares species tree models in which
sequences are assigned to differing numbers of lineages
(e.g. five species, six species) and chooses the model
that best explains the data (Grummer et al. 2014). Based
on a combination of geography and ‘discovery’ genetic
results (see above), putative Microhexura lineages were
left separate or combined to generate eight alternative
species delimitation hypotheses (Table 2).
A *BEAST species tree (inferred using *BEAST v1.8.0,
Drummond et al. 2012) was estimated for each alterna-
tive hypothesis, using nuclear-only or nuclear plus
mitochondrial matrices, without out-groups. *BEAST
analyses were performed using 250 000 000 generations,
with data saved every 25 000 generations; the first 20%
of each run was discarded as burn-in. For each hypoth-
esis, three to five *BEAST replicates were conducted to
ensure convergence and assessed using ESS values with
TRACER v1.6 (Rambaut et al. 2014). Substitution models
for individual genes were chosen with JModeltest 2.1.6
(Guindon & Gascuel 2003; Darriba et al. 2012) using the
Table 2 Alternative species delimitation hypotheses tested using validation approaches
Hypothesis Distinct Species (total in parentheses) Motivation
H1 Plott Balsams, Smokies, Grandfather_Indian/Attic,
Grandfather_Watauga, Whitetop, Roan, Blacks, Blackstock_N (8)
Six geographic populations unique, two
distinct genetic lineages at Grandfather
Mountain and in Black Mountains
H2 Plott Balsams, Smokies, Grandfather, Whitetop, Roan,
Blacks, Blackstock_N (7)
Six geographic populations unique,
two distinct lineages in Black Mountains
H3 (Plott Balsams + Smokies), Grandfather_Indian/Attic,
Grandfather_Watauga, Whitetop, Roan, Blacks, Blackstock_N (7)
Mitochondrial bPTP
H4 (Plott Balsams + Smokies), Grandfather, Whitetop, Roan,
Blacks, Blackstock_N (6)
POFAD liberal
H5 (Plott Balsams + Smokies), (Grandfather + Whitetop),
Roan, Blacks, Blackstock_N (5)
STRUCTURE K = 5
H6 (Plott Balsams + Smokies), Grandfather, Whitetop, Roan,
(Blacks + Blackstock_N) (5)
Geographic populations unique except for
Plott Balsams + Smokies
H7 (Plott Balsams + Smokies), (Grandfather + Whitetop + Blackstock_N),
Roan, Blacks (4)
STRUCTURE K = 4
H8 (Plott Balsams + Smokies),
(Grandfather + Whitetop + Roan + Blacks + Blackstock_N) (2)
Two species on opposite sides of
Asheville Basin
Bold values represent collapsed lineages from a preceding hypothesis.
© 2015 John Wiley & Sons Ltd
SKY ISLAND SPECIES DELIMITATION 3471
AIC method (Table 1). All *BEAST analyses were con-
ducted on the CIPRES Science Gateway (www.phy-
lo.org; Miller et al. 2010). Preliminary results suggested
convergence issues when applying a relaxed clock
model to the B2_F3F4 data, so a strict clock model was
applied for all loci (Table 1). Marginal likelihoods were
estimated using path-sampling (PS, Lartillot & Philippe
2006) and stepping-stone (SS, Xie et al. 2011) methods,
with 100 path steps, a chain length of 100 000 genera-
tions and likelihoods saved every 100 generations. Mar-
ginal likelihood estimates (MLE) were averaged across
replicate runs to generate a single PS and SS value for
each hypothesis. Bayes factors were then calculated by
taking the difference between the log of the best MLE
and the log of other MLEs and multiplying each result
by two [i.e. 2*(-lnHypA – -lnHypB)]. The significance of
Bayes factor results was interpreted following Kass &
Raftery (1995), with 2lnBf >10 being considered as ‘deci-
sive’ support for a hypothesis.
Validation analyses were also performed using BPP
v3.0 (Yang & Rannala 2010, 2014). This method utilizes
a multispecies coalescent model and Bayesian statistics
to delimit species. Traditionally, BPP analyses have
relied on a user-specified guide tree to represent a spe-
cies tree under a highly split delimitation hypothesis. A
reversible-jump Markov chain Monte Carlo (rjMCMC)
algorithm is then employed to estimate the posterior
probability of different delimitation hypotheses by itera-
tively collapsing or retaining nodes found in the guide
tree (Yang & Rannala 2010). More recently, Yang &
Rannala (2014) updated BPP to allow for joint inference
of species limits and a species tree via a nearest neigh-
bour interchange (NNI) algorithm that is able to signifi-
cantly change the topology of the input guide tree.
We implemented both the traditional (rjMCMC-only)
and joint estimation methods (NNI + rjMCMC) using
in-group-only nuclear matrices.
For each BPP method, the nuclear-only *BEAST spe-
cies tree corresponding to a liberal eight-species model
(H1, Table 2) was input as a guide tree. Three combina-
tions of prior values specifying the ancestral population
size (h) and root age (s0) were used, following Leach�e &
Fujita (2010). These correspond to (i) large ancestral
population sizes and deep divergences among species
(h ~ G(1,10) and s0 ~ G(1,10)), (ii) small population sizes
and shallow divergences (h ~ G(2,2000) and s0 ~ G
(2,2000)) and (iii) large ancestral population sizes and
shallow divergences (h ~ G(1,10) and s0 ~ G(2,2000)). A
fourth combination representing small population sizes
and intermediate divergence (h ~ G(2,2000) and s0 ~ G
(2,1000)) was also tested following Niemiller et al.
(2012). For each set of prior combinations, replicate runs
were performed using different starting species trees,
using both rjMCMC algorithms (0 and 1). Each analysis
was run for 50 000 generations, with results sampled
every 5 generations; the first 1000 generations of each
run were treated as burn-in.
Results
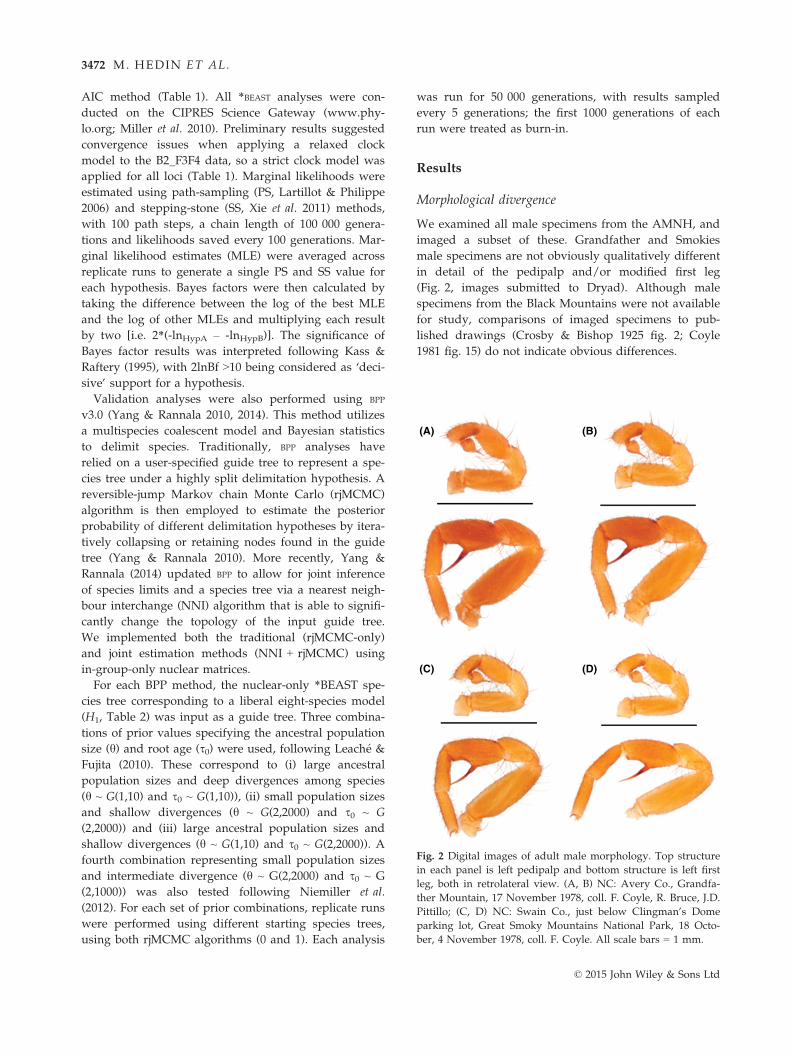
Morphological divergence
We examined all male specimens from the AMNH, and
imaged a subset of these. Grandfather and Smokies
male specimens are not obviously qualitatively different
in detail of the pedipalp and/or modified first leg
(Fig. 2, images submitted to Dryad). Although male
specimens from the Black Mountains were not available
for study, comparisons of imaged specimens to pub-
lished drawings (Crosby & Bishop 1925 fig. 2; Coyle
1981 fig. 15) do not indicate obvious differences.
(A)
(C) (D)
(B)
Fig. 2 Digital images of adult male morphology. Top structure
in each panel is left pedipalp and bottom structure is left first
leg, both in retrolateral view. (A, B) NC: Avery Co., Grandfa-
ther Mountain, 17 November 1978, coll. F. Coyle, R. Bruce, J.D.
Pittillo; (C, D) NC: Swain Co., just below Clingman’s Dome
parking lot, Great Smoky Mountains National Park, 18 Octo-
ber, 4 November 1978, coll. F. Coyle. All scale bars = 1 mm.
© 2015 John Wiley & Sons Ltd
3472 M. HEDIN ET AL.
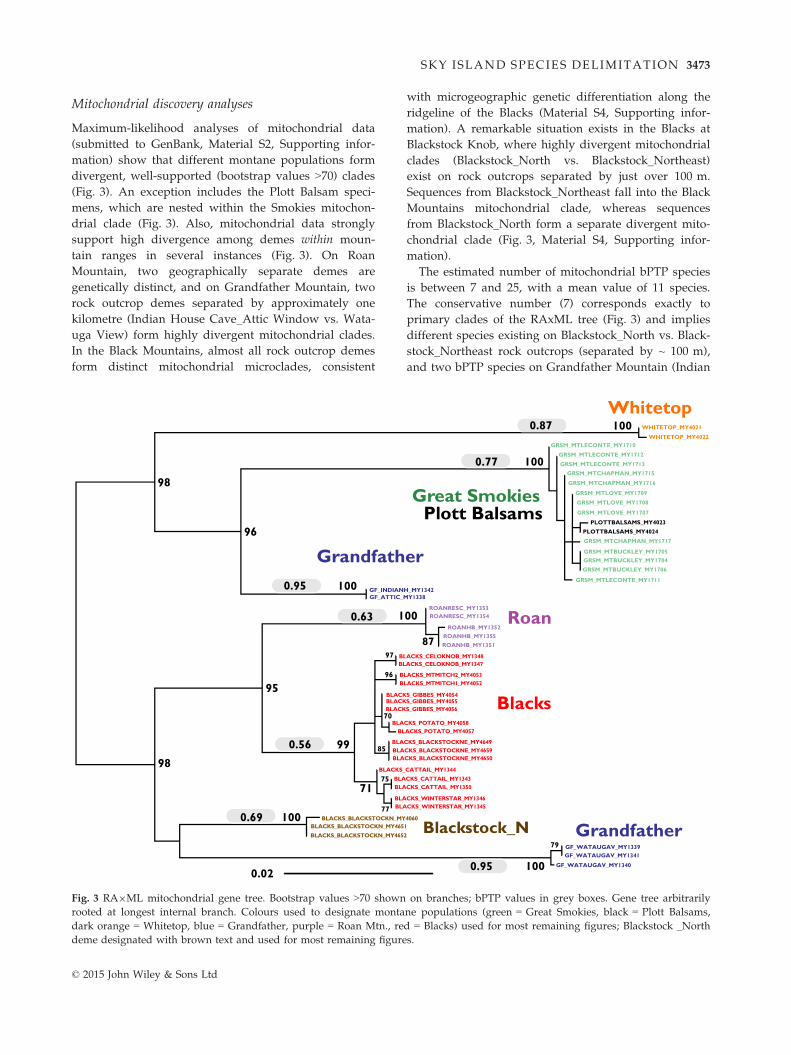
Mitochondrial discovery analyses
Maximum-likelihood analyses of mitochondrial data
(submitted to GenBank, Material S2, Supporting infor-
mation) show that different montane populations form
divergent, well-supported (bootstrap values >70) clades(Fig. 3). An exception includes the Plott Balsam speci-
mens, which are nested within the Smokies mitochon-
drial clade (Fig. 3). Also, mitochondrial data strongly
support high divergence among demes within moun-
tain ranges in several instances (Fig. 3). On Roan
Mountain, two geographically separate demes are
genetically distinct, and on Grandfather Mountain, two
rock outcrop demes separated by approximately one
kilometre (Indian House Cave_Attic Window vs. Wata-
uga View) form highly divergent mitochondrial clades.
In the Black Mountains, almost all rock outcrop demes
form distinct mitochondrial microclades, consistent
with microgeographic genetic differentiation along the
ridgeline of the Blacks (Material S4, Supporting infor-
mation). A remarkable situation exists in the Blacks at
Blackstock Knob, where highly divergent mitochondrial
clades (Blackstock_North vs. Blackstock_Northeast)
exist on rock outcrops separated by just over 100 m.
Sequences from Blackstock_Northeast fall into the Black
Mountains mitochondrial clade, whereas sequences
from Blackstock_North form a separate divergent mito-
chondrial clade (Fig. 3, Material S4, Supporting infor-
mation).
The estimated number of mitochondrial bPTP species
is between 7 and 25, with a mean value of 11 species.
The conservative number (7) corresponds exactly to
primary clades of the RAxML tree (Fig. 3) and implies
different species existing on Blackstock_North vs. Black-
stock_Northeast rock outcrops (separated by ~ 100 m),
and two bPTP species on Grandfather Mountain (Indian
WHITETOP_MY4021
WHITETOP_MY4022
BLACKS_CELOKNOB_MY1347
BLACKS_BLACKSTOCKNE_MY4649
BLACKS_GIBBES_MY4054
BLACKS_CATTAIL_MY1350
BLACKS_POTATO_MY4057
BLACKS_GIBBES_MY4056
BLACKS_MTMITCH2_MY4053
BLACKS_GIBBES_MY4055
BLACKS_CATTAIL_MY1344
BLACKS_CATTAIL_MY1343
BLACKS_BLACKSTOCKN_MY4652
BLACKS_BLACKSTOCKN_MY4651BLACKS_BLACKSTOCKN_MY4060
GF_ATTIC_MY1338GF_INDIANH_MY1342
ROANHB_MY1355
ROANRESC_MY1353
GRSM_MTLOVE_MY1709
GRSM_MTLECONTE_MY1710
GRSM_MTBUCKLEY_MY1704
BLACKS_CELOKNOB_MY1348
GRSM_MTCHAPMAN_MY1715
ROANRESC_MY1354
ROANHB_MY1352
ROANHB_MY1351
PLOTTBALSAMS_MY4024
BLACKS_WINTERSTAR_MY1346BLACKS_WINTERSTAR_MY1345
98
95
98
96
100
100
87
100
100
GRSM_MTLECONTE_MY1712
GRSM_MTLECONTE_MY1713
GRSM_MTCHAPMAN_MY1716
GRSM_MTLOVE_MY1708
GRSM_MTLOVE_MY1707
PLOTTBALSAMS_MY4023
GRSM_MTCHAPMAN_MY1717
GRSM_MTLECONTE_MY1711
GRSM_MTBUCKLEY_MY1705
GRSM_MTBUCKLEY_MY1706
99
7175
77100
85
96
97
BLACKS_BLACKSTOCKNE_MY4659BLACKS_BLACKSTOCKNE_MY4650
BLACKS_POTATO_MY4058
BLACKS_MTMITCH1_MY4052
GF_WATAUGAV_MY133979
100 GF_WATAUGAV_MY1340
GF_WATAUGAV_MY1341
0.02
70
Great Smokies Plott Balsams
Blacks
Grandfather
Roan
Whitetop
Grandfather Blackstock_N
0.87
0.77
0.95
0.63
0.56
0.69
0.95
Fig. 3 RA9ML mitochondrial gene tree. Bootstrap values >70 shown on branches; bPTP values in grey boxes. Gene tree arbitrarily
rooted at longest internal branch. Colours used to designate montane populations (green = Great Smokies, black = Plott Balsams,
dark orange = Whitetop, blue = Grandfather, purple = Roan Mtn., red = Blacks) used for most remaining figures; Blackstock _North
deme designated with brown text and used for most remaining figures.
© 2015 John Wiley & Sons Ltd
SKY ISLAND SPECIES DELIMITATION 3473
House Cave_Attic Window vs. Watauga View, demes
separated by ~ 1 km). The bPTP posterior probability of
Plott Balsams separate from Great Smokies is zero.
Nuclear discovery analyses
Data were collected and phased for seven nuclear
regions (Material S2, Supporting information), with a
total aligned length of 4677 bp (Table 1). Nuclear PCR-
amplified Sanger data match transcriptome data (i.e.
PCR primers amplified the correct target gene region),
and nuclear matrices include minimal missing data (7
nuclear gene matrices 9 47 in-group individuals per
matrix – 3 total missing sequences, all in the B2_D3_D4
matrix, see Material S2, Supporting information). As
expected, each nuclear gene tree is topologically unique
(Material S5, Supporting information). Despite this
expected gene tree heterogeneity, there is clear phyloge-
netic signal in the nuclear data (Table 1), and several
generalizable patterns are apparent. All nuclear gene
trees include Plott Balsam alleles nested within a Smok-
ies clade, with Plott Balsam sequences identical to cer-
tain Smokies sequences for all genes. The southwestern
Plott Balsam plus Smokies clade is distinct from north-
eastern populations in most gene trees. Roan Mountain
alleles form a clade in 4 of 7 gene trees, Whitetop
Mountain alleles form a clade in 4 of 7 gene trees, and
Grandfather Mountain alleles from a clade in 2 of 7
gene trees. The genetic relationship between Black-
stock_North vs. all other Black Mountains demes
(including Blackstock_Northeast) varies from gene to
gene, but there is evidence for nuclear genetic
divergence of Blackstock_North in several gene trees.
Out-group sequences were only available for 3 nuclear
genes, and in-group root placement using out-group
information varies from gene to gene (Material S5, Sup-
porting information).
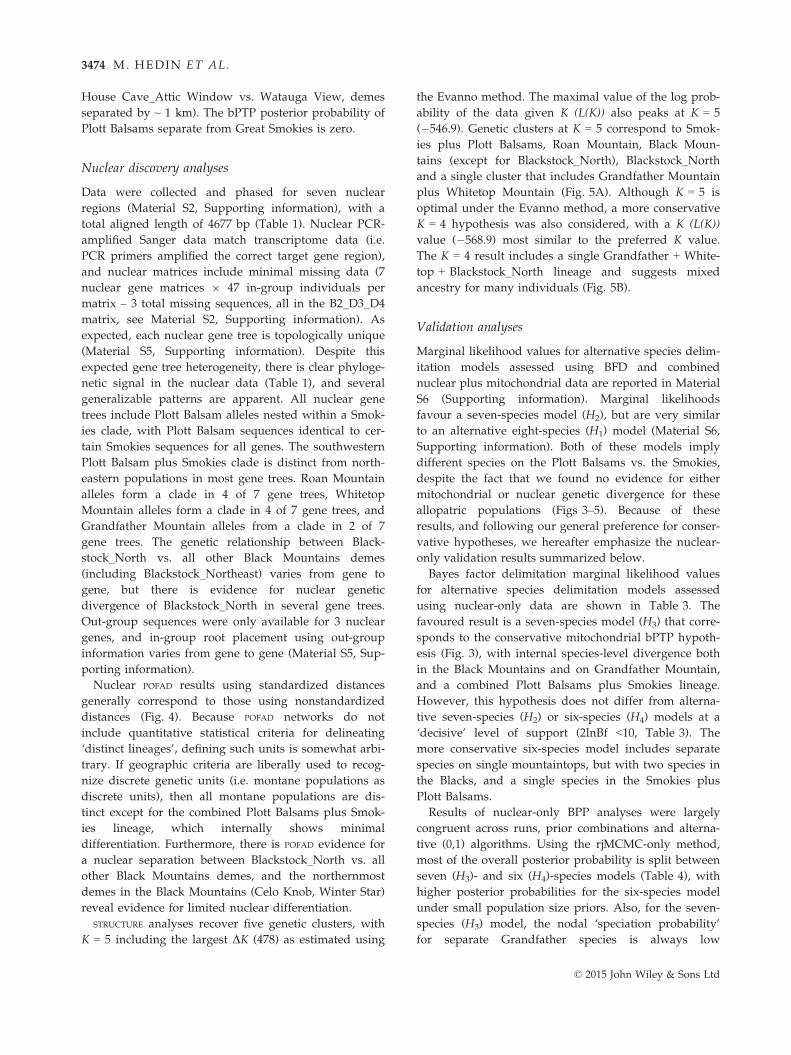
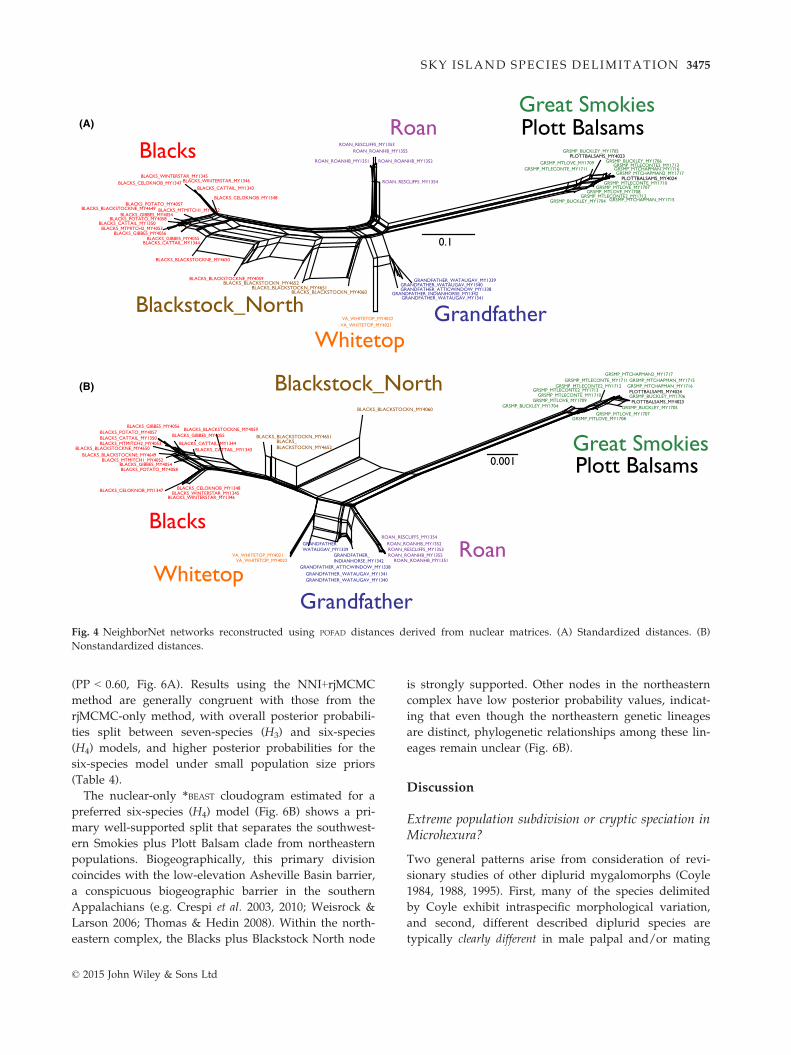
Nuclear POFAD results using standardized distances
generally correspond to those using nonstandardized
distances (Fig. 4). Because POFAD networks do not
include quantitative statistical criteria for delineating
‘distinct lineages’, defining such units is somewhat arbi-
trary. If geographic criteria are liberally used to recog-
nize discrete genetic units (i.e. montane populations as
discrete units), then all montane populations are dis-
tinct except for the combined Plott Balsams plus Smok-
ies lineage, which internally shows minimal
differentiation. Furthermore, there is POFAD evidence for
a nuclear separation between Blackstock_North vs. all
other Black Mountains demes, and the northernmost
demes in the Black Mountains (Celo Knob, Winter Star)
reveal evidence for limited nuclear differentiation.
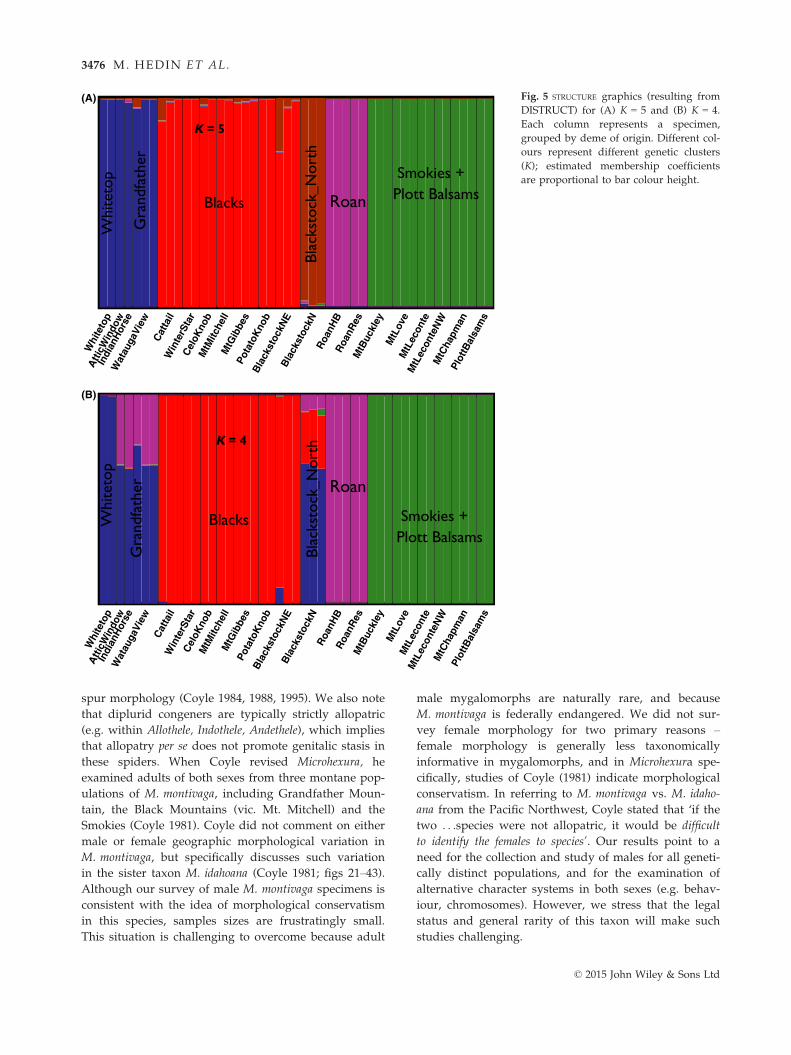
STRUCTURE analyses recover five genetic clusters, with
K = 5 including the largest DK (478) as estimated using
the Evanno method. The maximal value of the log prob-
ability of the data given K (L(K)) also peaks at K = 5
(�546.9). Genetic clusters at K = 5 correspond to Smok-
ies plus Plott Balsams, Roan Mountain, Black Moun-
tains (except for Blackstock_North), Blackstock_North
and a single cluster that includes Grandfather Mountain
plus Whitetop Mountain (Fig. 5A). Although K = 5 is
optimal under the Evanno method, a more conservative
K = 4 hypothesis was also considered, with a K (L(K))
value (�568.9) most similar to the preferred K value.
The K = 4 result includes a single Grandfather + White-
top + Blackstock_North lineage and suggests mixed
ancestry for many individuals (Fig. 5B).
Validation analyses
Marginal likelihood values for alternative species delim-
itation models assessed using BFD and combined
nuclear plus mitochondrial data are reported in Material
S6 (Supporting information). Marginal likelihoods
favour a seven-species model (H2), but are very similar
to an alternative eight-species (H1) model (Material S6,
Supporting information). Both of these models imply
different species on the Plott Balsams vs. the Smokies,
despite the fact that we found no evidence for either
mitochondrial or nuclear genetic divergence for these
allopatric populations (Figs 3–5). Because of these
results, and following our general preference for conser-
vative hypotheses, we hereafter emphasize the nuclear-
only validation results summarized below.
Bayes factor delimitation marginal likelihood values
for alternative species delimitation models assessed
using nuclear-only data are shown in Table 3. The
favoured result is a seven-species model (H3) that corre-
sponds to the conservative mitochondrial bPTP hypoth-
esis (Fig. 3), with internal species-level divergence both
in the Black Mountains and on Grandfather Mountain,
and a combined Plott Balsams plus Smokies lineage.
However, this hypothesis does not differ from alterna-
tive seven-species (H2) or six-species (H4) models at a
‘decisive’ level of support (2lnBf <10, Table 3). The
more conservative six-species model includes separate
species on single mountaintops, but with two species in
the Blacks, and a single species in the Smokies plus
Plott Balsams.
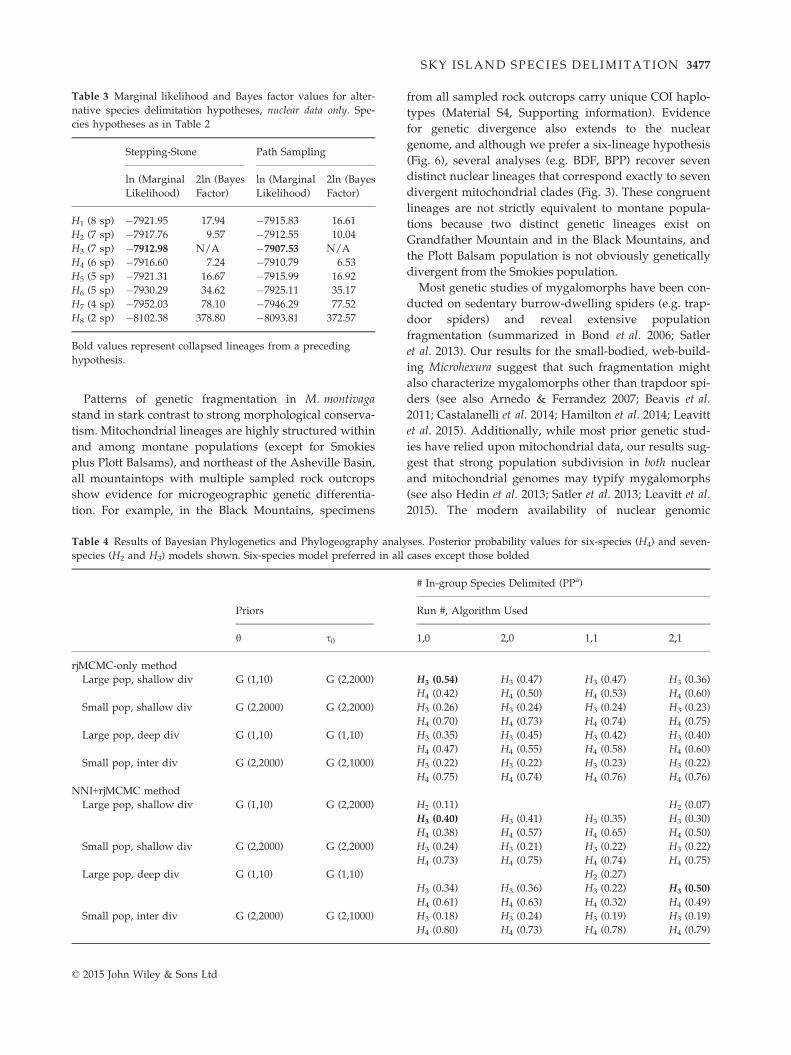
Results of nuclear-only BPP analyses were largely
congruent across runs, prior combinations and alterna-
tive (0,1) algorithms. Using the rjMCMC-only method,
most of the overall posterior probability is split between
seven (H3)- and six (H4)-species models (Table 4), with
higher posterior probabilities for the six-species model
under small population size priors. Also, for the seven-
species (H3) model, the nodal ‘speciation probability’
for separate Grandfather species is always low
© 2015 John Wiley & Sons Ltd
3474 M. HEDIN ET AL.
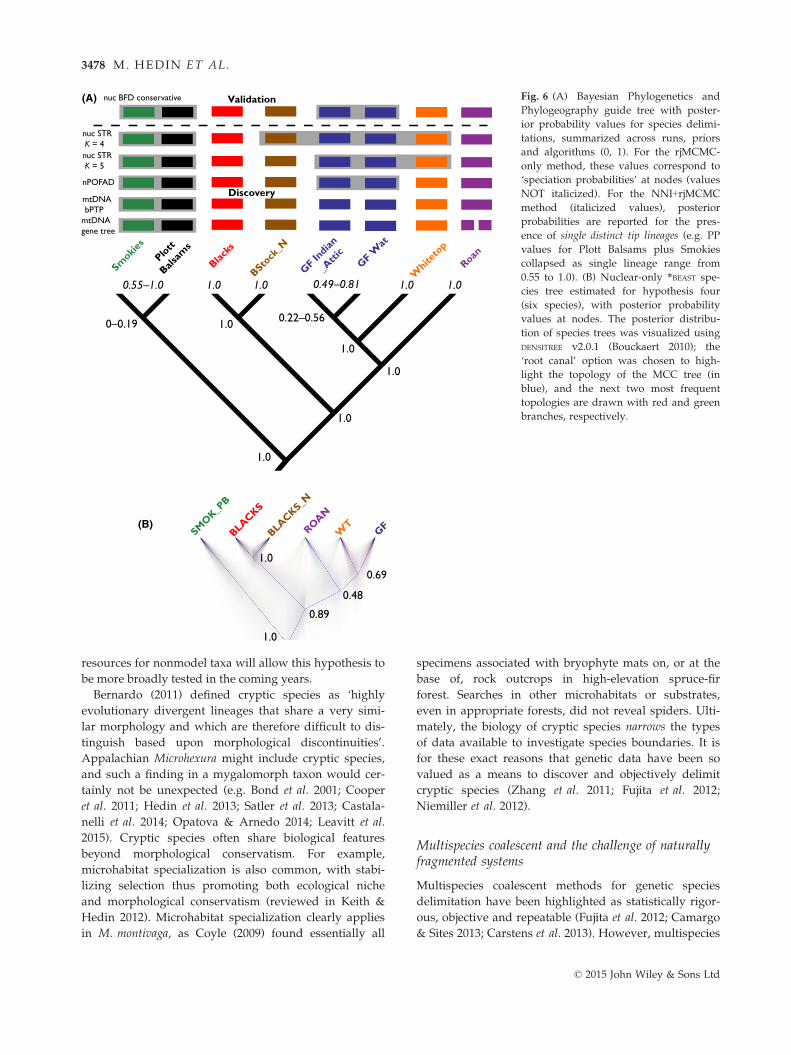
(PP < 0.60, Fig. 6A). Results using the NNI+rjMCMC
method are generally congruent with those from the
rjMCMC-only method, with overall posterior probabili-
ties split between seven-species (H3) and six-species
(H4) models, and higher posterior probabilities for the
six-species model under small population size priors
(Table 4).
The nuclear-only *BEAST cloudogram estimated for a
preferred six-species (H4) model (Fig. 6B) shows a pri-
mary well-supported split that separates the southwest-
ern Smokies plus Plott Balsam clade from northeastern
populations. Biogeographically, this primary division
coincides with the low-elevation Asheville Basin barrier,
a conspicuous biogeographic barrier in the southern
Appalachians (e.g. Crespi et al. 2003, 2010; Weisrock &
Larson 2006; Thomas & Hedin 2008). Within the north-
eastern complex, the Blacks plus Blackstock North node
is strongly supported. Other nodes in the northeastern
complex have low posterior probability values, indicat-
ing that even though the northeastern genetic lineages
are distinct, phylogenetic relationships among these lin-
eages remain unclear (Fig. 6B).
Discussion
Extreme population subdivision or cryptic speciation inMicrohexura?
Two general patterns arise from consideration of revi-
sionary studies of other diplurid mygalomorphs (Coyle
1984, 1988, 1995). First, many of the species delimited
by Coyle exhibit intraspecific morphological variation,
and second, different described diplurid species are
typically clearly different in male palpal and/or mating
VA_WHITETOP_MY4021VA_WHITETOP_MY4022
BLACKS_BLACKSTOCKN_MY4652
BLACKS_BLACKSTOCKN_MY4060
BLACKS_BLACKSTOCKNE_MY4059
BLACKS_GIBBES_MY4054BLACKS_POTATO_MY4058
BLACKS_GIBBES_MY4056
BLACKS_MTMITCH2_MY4053 BLACKS_CATTAIL_MY1344
BLACKS_GIBBES_MY4055
BLACKS_BLACKSTOCKNE_MY4650BLACKS_BLACKSTOCKNE_MY4649
BLACKS_CELOKNOB_MY1347
ROAN_RESCLIFFS_MY1354GRANDFATHERWATAUGAV_MY1339
GRANDFATHER_INDIANHORSE_MY1342
GRSMP_MTLOVE_MY1709
GRSMP_MTLECONTE2_MY1712
PLOTTBALSAMS_MY4023
GRSMP_MTLECONTE2_MY1713GRSMP_MTCHAPMAN_MY1716
GRSMP_MTLOVE_MY1707GRSMP_MTLOVE_MY1708
GRSMP_BUCKLEY_MY1704
GRSMP_MTCHAPMAN_MY1715
GRSMP_BUCKLEY_MY1706
ROAN_ROANHB_MY1351
BLACKS_WINTERSTAR_MY1346
BLACKS_CELOKNOB_MY1348
GRSMP_MTLECONTE_MY1711
PLOTTBALSAMS_MY4024
BLACKS_MTMITCH1_MY4052
BLACKS_WINTERSTAR_MY1345
ROAN_ROANHB_MY1355ROAN_RESCLIFFS_MY1353
GRANDFATHER_WATAUGAV_MY1340
BLACKS_BLACKSTOCKN_MY4651
BLACKS_CATTAIL_MY1343
BLACKS_POTATO_MY4057BLACKS_CATTAIL_MY1350
ROAN_ROANHB_MY1352
GRANDFATHER_WATAUGAV_MY1341GRANDFATHER_ATTICWINDOW_MY1338
GRSMP_BUCKLEY_MY1705
GRSMP_MTLECONTE_MY1710
VA_WHITETOP_MY4021
BLACKS_BLACKSTOCKN_MY4652BLACKS_BLACKSTOCKNE_MY4059
BLACKS_BLACKSTOCKNE_MY4650
BLACKS_CATTAIL_MY1344BLACKS_GIBBES_MY4055
BLACKS_MTMITCH2_MY4053BLACKS_GIBBES_MY4056
BLACKS_CATTAIL_MY1350BLACKS_POTATO_MY4058
BLACKS_GIBBES_MY4054BLACKS_BLACKSTOCKNE_MY4649
BLACKS_CELOKNOB_MY1347 BLACKS_WINTERSTAR_MY1346
BLACKS_CELOKNOB_MY1348
BLACKS_CATTAIL_MY1343
ROAN_ROANHB_MY1351
ROAN_RESCLIFFS_MY1353ROAN_ROANHB_MY1355
GRSMP_BUCKLEY_MY1704
GRSMP_MTLOVE_MY1708GRSMP_MTLOVE_MY1707
GRSMP_MTLECONTE_MY1711 GRSMP_MTCHAPMAN_MY1716GRSMP_MTLECONTE2_MY1713
PLOTTBALSAMS_MY4024GRSMP_MTLECONTE_MY1710
GRSMP_MTLECONTE2_MY1712
GRSMP_BUCKLEY_MY1705
GRSMP_MTLOVE_MY1709
GRANDFATHER_WATAUGAV_MY1339GRANDFATHER_WATAUGAV_MY1340GRANDFATHER_ATTICWINDOW_MY1338
GRANDFATHER_INDIANHORSE_MY1342
VA_WHITETOP_MY4022
PLOTTBALSAMS_MY4023
BLACKS_MTMITCH1_MY4052
ROAN_RESCLIFFS_MY1354
BLACKS_POTATO_MY4057
GRSMP_BUCKLEY_MY1706
GRSMP_MTCHAPMAN2_MY1717
BLACKS_BLACKSTOCKN_MY4060BLACKS_BLACKSTOCKN_MY4651
BLACKS_WINTERSTAR_MY1345
ROAN_ROANHB_MY1352
GRSMP_MTCHAPMAN_MY1715
GRANDFATHER_WATAUGAV_MY1341
Great Smokies Plott Balsams
Grandfather
RoanWhitetop
Blacks
Blackstock_NorthGRSMP_MTCHAPMAN2_MY1717
Great Smokies Plott Balsams
Grandfather
Roan
Whitetop
Blacks
Blackstock_North
0.1
0.001
(A)
(B)
Fig. 4 NeighborNet networks reconstructed using POFAD distances derived from nuclear matrices. (A) Standardized distances. (B)
Nonstandardized distances.
© 2015 John Wiley & Sons Ltd
SKY ISLAND SPECIES DELIMITATION 3475
spur morphology (Coyle 1984, 1988, 1995). We also note
that diplurid congeners are typically strictly allopatric
(e.g. within Allothele, Indothele, Andethele), which implies
that allopatry per se does not promote genitalic stasis in
these spiders. When Coyle revised Microhexura, he
examined adults of both sexes from three montane pop-
ulations of M. montivaga, including Grandfather Moun-
tain, the Black Mountains (vic. Mt. Mitchell) and the
Smokies (Coyle 1981). Coyle did not comment on either
male or female geographic morphological variation in
M. montivaga, but specifically discusses such variation
in the sister taxon M. idahoana (Coyle 1981; figs 21–43).Although our survey of male M. montivaga specimens is
consistent with the idea of morphological conservatism
in this species, samples sizes are frustratingly small.
This situation is challenging to overcome because adult
male mygalomorphs are naturally rare, and because
M. montivaga is federally endangered. We did not sur-
vey female morphology for two primary reasons –female morphology is generally less taxonomically
informative in mygalomorphs, and in Microhexura spe-
cifically, studies of Coyle (1981) indicate morphological
conservatism. In referring to M. montivaga vs. M. idaho-
ana from the Pacific Northwest, Coyle stated that ‘if the
two . . .species were not allopatric, it would be difficult
to identify the females to species’. Our results point to a
need for the collection and study of males for all geneti-
cally distinct populations, and for the examination of
alternative character systems in both sexes (e.g. behav-
iour, chromosomes). However, we stress that the legal
status and general rarity of this taxon will make such
studies challenging.
Whi
teto
pA
tticW
indo
w
Indi
anH
orse
Wat
auga
View
Cat
tail
Win
terS
tar
Cel
oKno
bM
tMitc
hell
MtG
ibbe
sPo
tato
Kno
bB
lack
stoc
kNE
Bla
ckst
ockN
Roa
nHB
Roa
nRes
MtB
uckl
eyM
tLov
eM
tLec
onte
MtL
econ
teN
WM
tCha
pman
Plot
tBal
sam
s
Whi
teto
p
Gra
ndfa
ther
Blacks
= 5
Blac
ksto
ck_N
orth
Roan
Smokies + Plott Balsams
Whi
teto
pA
tticW
indo
w
Indi
anH
orse
Wat
auga
View
Cat
tail
Win
terS
tar
Cel
oKno
bM
tMitc
hell
MtG
ibbe
sPo
tato
Kno
bB
lack
stoc
kNE
Bla
ckst
ockN
Roa
nHB
Roa
nRes
MtB
uckl
eyM
tLov
eM
tLec
onte
MtL
econ
teN
WM
tCha
pman
Plot
tBal
sam
s
Whi
teto
p
Gra
ndfa
ther
Blacks
= 4
Blac
ksto
ck_N
orth
Roan
Smokies + Plott Balsams
K
K
(A)
(B)
Fig. 5 STRUCTURE graphics (resulting from
DISTRUCT) for (A) K = 5 and (B) K = 4.
Each column represents a specimen,
grouped by deme of origin. Different col-
ours represent different genetic clusters
(K); estimated membership coefficients
are proportional to bar colour height.
© 2015 John Wiley & Sons Ltd
3476 M. HEDIN ET AL.
Patterns of genetic fragmentation in M. montivaga
stand in stark contrast to strong morphological conserva-
tism. Mitochondrial lineages are highly structured within
and among montane populations (except for Smokies
plus Plott Balsams), and northeast of the Asheville Basin,
all mountaintops with multiple sampled rock outcrops
show evidence for microgeographic genetic differentia-
tion. For example, in the Black Mountains, specimens
from all sampled rock outcrops carry unique COI haplo-
types (Material S4, Supporting information). Evidence
for genetic divergence also extends to the nuclear
genome, and although we prefer a six-lineage hypothesis
(Fig. 6), several analyses (e.g. BDF, BPP) recover seven
distinct nuclear lineages that correspond exactly to seven
divergent mitochondrial clades (Fig. 3). These congruent
lineages are not strictly equivalent to montane popula-
tions because two distinct genetic lineages exist on
Grandfather Mountain and in the Black Mountains, and
the Plott Balsam population is not obviously genetically
divergent from the Smokies population.
Most genetic studies of mygalomorphs have been con-
ducted on sedentary burrow-dwelling spiders (e.g. trap-
door spiders) and reveal extensive population
fragmentation (summarized in Bond et al. 2006; Satler
et al. 2013). Our results for the small-bodied, web-build-
ing Microhexura suggest that such fragmentation might
also characterize mygalomorphs other than trapdoor spi-
ders (see also Arnedo & Ferrandez 2007; Beavis et al.
2011; Castalanelli et al. 2014; Hamilton et al. 2014; Leavitt
et al. 2015). Additionally, while most prior genetic stud-
ies have relied upon mitochondrial data, our results sug-
gest that strong population subdivision in both nuclear
and mitochondrial genomes may typify mygalomorphs
(see also Hedin et al. 2013; Satler et al. 2013; Leavitt et al.
2015). The modern availability of nuclear genomic
Table 4 Results of Bayesian Phylogenetics and Phylogeography analyses. Posterior probability values for six-species (H4) and seven-
species (H2 and H3) models shown. Six-species model preferred in all cases except those bolded
Priors
# In-group Species Delimited (PPa)
Run #, Algorithm Used
h s0 1,0 2,0 1,1 2,1
rjMCMC-only method
Large pop, shallow div G (1,10) G (2,2000) H3 (0.54) H3 (0.47) H3 (0.47) H3 (0.36)
H4 (0.42) H4 (0.50) H4 (0.53) H4 (0.60)
Small pop, shallow div G (2,2000) G (2,2000) H3 (0.26) H3 (0.24) H3 (0.24) H3 (0.23)
H4 (0.70) H4 (0.73) H4 (0.74) H4 (0.75)
Large pop, deep div G (1,10) G (1,10) H3 (0.35) H3 (0.45) H3 (0.42) H3 (0.40)
H4 (0.47) H4 (0.55) H4 (0.58) H4 (0.60)
Small pop, inter div G (2,2000) G (2,1000) H3 (0.22) H3 (0.22) H3 (0.23) H3 (0.22)
H4 (0.75) H4 (0.74) H4 (0.76) H4 (0.76)
NNI+rjMCMC method
Large pop, shallow div G (1,10) G (2,2000) H2 (0.11) H2 (0.07)
H3 (0.40) H3 (0.41) H3 (0.35) H3 (0.30)
H4 (0.38) H4 (0.57) H4 (0.65) H4 (0.50)
Small pop, shallow div G (2,2000) G (2,2000) H3 (0.24) H3 (0.21) H3 (0.22) H3 (0.22)
H4 (0.73) H4 (0.75) H4 (0.74) H4 (0.75)
Large pop, deep div G (1,10) G (1,10) H2 (0.27)
H3 (0.34) H3 (0.36) H3 (0.22) H3 (0.50)
H4 (0.61) H4 (0.63) H4 (0.32) H4 (0.49)
Small pop, inter div G (2,2000) G (2,1000) H3 (0.18) H3 (0.24) H3 (0.19) H3 (0.19)
H4 (0.80) H4 (0.73) H4 (0.78) H4 (0.79)
Table 3 Marginal likelihood and Bayes factor values for alter-
native species delimitation hypotheses, nuclear data only. Spe-
cies hypotheses as in Table 2
Stepping-Stone Path Sampling
ln (Marginal
Likelihood)
2ln (Bayes
Factor)
ln (Marginal
Likelihood)
2ln (Bayes
Factor)
H1 (8 sp) �7921.95 17.94 �7915.83 16.61
H2 (7 sp) �7917.76 9.57 �7912.55 10.04
H3 (7 sp) �7912.98 N/A �7907.53 N/A
H4 (6 sp) �7916.60 7.24 �7910.79 6.53
H5 (5 sp) �7921.31 16.67 �7915.99 16.92
H6 (5 sp) �7930.29 34.62 �7925.11 35.17
H7 (4 sp) �7952.03 78.10 �7946.29 77.52
H8 (2 sp) �8102.38 378.80 �8093.81 372.57
Bold values represent collapsed lineages from a preceding
hypothesis.
© 2015 John Wiley & Sons Ltd
SKY ISLAND SPECIES DELIMITATION 3477
resources for nonmodel taxa will allow this hypothesis to
be more broadly tested in the coming years.
Bernardo (2011) defined cryptic species as ‘highly
evolutionary divergent lineages that share a very simi-
lar morphology and which are therefore difficult to dis-
tinguish based upon morphological discontinuities’.
Appalachian Microhexura might include cryptic species,
and such a finding in a mygalomorph taxon would cer-
tainly not be unexpected (e.g. Bond et al. 2001; Cooper
et al. 2011; Hedin et al. 2013; Satler et al. 2013; Castala-
nelli et al. 2014; Opatova & Arnedo 2014; Leavitt et al.
2015). Cryptic species often share biological features
beyond morphological conservatism. For example,
microhabitat specialization is also common, with stabi-
lizing selection thus promoting both ecological niche
and morphological conservatism (reviewed in Keith &
Hedin 2012). Microhabitat specialization clearly applies
in M. montivaga, as Coyle (2009) found essentially all
specimens associated with bryophyte mats on, or at the
base of, rock outcrops in high-elevation spruce-fir
forest. Searches in other microhabitats or substrates,
even in appropriate forests, did not reveal spiders. Ulti-
mately, the biology of cryptic species narrows the types
of data available to investigate species boundaries. It is
for these exact reasons that genetic data have been so
valued as a means to discover and objectively delimit
cryptic species (Zhang et al. 2011; Fujita et al. 2012;
Niemiller et al. 2012).
Multispecies coalescent and the challenge of naturallyfragmented systems
Multispecies coalescent methods for genetic species
delimitation have been highlighted as statistically rigor-
ous, objective and repeatable (Fujita et al. 2012; Camargo
& Sites 2013; Carstens et al. 2013). However, multispecies
Smokie
s
Plo
tt
Balsam
s
GF Indi
an
_
Attic
R
oan
W
hite
top
Blac
ks
BStock
_N
0–0.19
1.0
mtDNA gene tree
mtDNA bPTP
nuc STR K = 5
nuc STR K = 4
nPOFAD
nuc BFD conservative
Discovery
Validation
GF Wat
1.0
1.0
1.0
1.0
0.22–0.56
SMO
K_PB
R
OAN
W
T
BLACKS
BLACKS_N
GF
1.0
0.89
1.0
0.48
0.69
0.55–1.0 0.49–0.81 0.10.10.10.1
(A)
(B)
Fig. 6 (A) Bayesian Phylogenetics and
Phylogeography guide tree with poster-
ior probability values for species delimi-
tations, summarized across runs, priors
and algorithms (0, 1). For the rjMCMC-
only method, these values correspond to
‘speciation probabilities’ at nodes (values
NOT italicized). For the NNI+rjMCMC
method (italicized values), posterior
probabilities are reported for the pres-
ence of single distinct tip lineages (e.g. PP
values for Plott Balsams plus Smokies
collapsed as single lineage range from
0.55 to 1.0). (B) Nuclear-only *BEAST spe-
cies tree estimated for hypothesis four
(six species), with posterior probability
values at nodes. The posterior distribu-
tion of species trees was visualized using
DENSITREE v2.0.1 (Bouckaert 2010); the
‘root canal’ option was chosen to high-
light the topology of the MCC tree (in
blue), and the next two most frequent
topologies are drawn with red and green
branches, respectively.
© 2015 John Wiley & Sons Ltd
3478 M. HEDIN ET AL.
coalescent methods (and genetics-only methods more
generally) can fail under certain speciation scenarios, for
example if speciation is very recent, or involves strong
selection in a small fraction of the genome, with gene
flow over the rest of the genome (Fujita et al. 2012;
Sousa & Hey 2013). These are largely ‘too much gene
flow’ scenarios. As such, authors have recently devel-
oped methods that formally integrate multiple lines of
evidence in a multispecies coalescent framework (e.g.
iBPP, Sol�ıs-Lemus et al. 2015), consistent with principles
of integrative taxonomy (Dayrat 2005; Schlick-Steiner
et al. 2010; Derkarabetian & Hedin 2014). However,
because of the ‘data narrowing’ problem discussed
above, speciation biologists working on cryptic species
often are forced to rely on genetics-only delimitations.
If such delimitations are biased to mistake population
structure for species-level divergence, then ‘too little
gene flow’ also becomes a problem area for multispe-
cies coalescent methods (O’Meara 2010; Niemiller et al.
2012; Barley et al. 2013; McKay et al. 2013).
Hey (2009) argued that many genetic species delimi-
tation approaches are biased towards oversplitting
because they confound population structure with speci-
ation. Evidence for this can be seen in the single-locus
results presented here (e.g. mean value of 11 bPTP
species), and other studies have convincingly shown
oversplitting in single-locus GMYC analyses (e.g. Lohse
2009; Keith & Hedin 2012; Miralles & Vences 2013;
Satler et al. 2013). Multispecies coalescent methods are
not immune to oversplitting, for reasons well summa-
rized by Niemiller et al. (2012). Low gene flow impacts
the coalescent process, as genetic lineages sampled
from the same geographic location are more likely to
coalesce locally than with lineages from other locations,
resulting in more congruence across independent gene
trees than is expected under the neutral coalescent
(Kuo & Avise 2005). To assess the possibility of false
positives (oversplitting), extensive simulations have
been conducted for guided BPP (Zhang et al. 2011).
The most relevant simulations included a linear step-
ping-stone model with four populations of equal size,
with symmetrical migration at variable levels (number
of migrants per generation M = 0.001–100) constrained
to occur among adjacent populations. Under these sim-
ulation conditions, two species were inferred (at pos-
terior probability >0.80) only when M values were <1(using 10 loci). Because the authors essentially equate
such low M values with ‘speciation’ (see below), the
authors claim that ‘Bayesian inference may be quite
robust to complex population structures’. Alternatively,
BPP has been suggested to potentially oversplit in
complex, low-geneflow empirical systems, including
trapdoor spiders (Satler et al. 2013), birds (McKay et al.
(2013), lizards (Barley et al. 2013; Miralles & Vences
2013) and plants (Carstens & Satler 2013). These sug-
gestions follow from comparison of BPP results to
other lines of evidence and with results from other
genetic analyses. False-positive rates have also been
assessed via simulation for BFD (Grummer et al. 2014),
and although oversplitting rates were found to be neg-
ligible, these simulations did not explicitly include
internal population structure as in Zhang et al. (2011).
Because BFD is founded on the multispecies coalescent
model of *BEAST, which again assumes the neutral coa-
lescent, poor model fit resulting from population struc-
ture (see Reid et al. 2014) could potentially impact BFD
results.
While it remains unclear how many species exist in
the Microhexura montivaga ‘complex’, this taxon clearly
illustrates an empirical issue that requires additional
methodological attention. The multispecies coalescent
BPP method has been claimed to delimit biological spe-
cies, but Zhang et al. (2011) acknowledge that ‘the
method does not take into account whether the . . . low
migration rate is due to geographical barriers or to
intrinsic reproductive isolation’ and that ‘two allopatric
populations that diverge due to neutral drift without
establishment of reproductive barriers may be inferred to
be two species. . .’. Of course, this is not a problem with
the method per se, as the method effectively recognizes
a low-geneflow threshold (i.e. M = Nm � 1). In many
empirical systems, measuring highly reduced gene flow,
in the light of additional data, would indeed provide
strong evidence for species status. However, in frag-
mented systems with naturally constrained gene flow,
isolated populations and species are potentially equiva-
lent under this model. Naturally fragmented systems
with viscous gene flow are common in nature, and
modern access to genomic-scale data sets makes popu-
lation differentiation ever easier to measure. Unless
biologists are willing to recognize all genetically diver-
gent populations as species, there is a clear need to
allow and incorporate population structure as a param-
eter in multispecies coalescent methods (Camargo et al.
2012; Niemiller et al. 2012; Camargo & Sites 2013;
Carstens et al. 2013; Leach�e et al. 2014).
Regional biogeography
Both paleobotanical and genetic data indicate that the
current sky island distribution of spruce-fir forests in the
southern Appalachians is an evolutionarily recent phe-
nomenon (Delcourt & Delcourt 1984; Potter et al. 2008).
At the last glacial maximum (LGM) and at multiple gla-
cial maxima earlier in the Pleistocene, these forests
existed more expansively and continuously at lower ele-
vations (up to 1000 metres lower), with mostly treeless
tundra at the highest elevations (Delcourt & Delcourt
© 2015 John Wiley & Sons Ltd
SKY ISLAND SPECIES DELIMITATION 3479
1984). Only recently (8000–4000 years ago) have these
forests become restricted to the highest southern Appala-
chian peaks. Animals restricted to southern Appalachian
sky islands, presuming ecological niche conservation
through time, are expected to show similar ‘recent frag-
mentation’ biogeographic patterns. Although many mod-
ern studies have considered regional biogeography (e.g.
Weisrock & Larson 2006; Thomas & Hedin 2008; Hedin &
Thomas 2010; Keith & Hedin 2012), few have focused on
high-elevation spruce-fir specialists. Two notable animal
exceptions include pygmy salamanders (Desmognathus
wrighti, Crespi et al. 2003, 2010) and smoky shrews (Sorex
fumeus, Sipe & Browne 2004). In Sorex fumeus, mitochon-
drial data indicate reduced gene flow across the low-ele-
vation Asheville Basin barrier and between individual
northeastern montane populations (e.g. Blacks, Roan
Mtn., Grandfather Mtn., Whitetop Mtn.). Although for-
mal dating analyses were not conducted, Sipe & Browne
(2004) hypothesized a post-LGM fragmentation model
for this taxon.
Genetic patterns in Desmognathus are geographically
similar to both Sorex and Microhexura, with populations
on opposite sides of the Asheville Basin, and genetically
distinct northeastern populations restricted to the Black,
Roan, Grandfather and Virginia Balsam mountains
(Crespi et al. 2003). In this taxon, independent molecu-
lar clock analyses of both mitochondrial and nuclear al-
lozyme data suggest Pliocene ages for the primary
southwest–northeast Asheville Basin divergence, and
more recent studies of ecology, morphology and genet-
ics support the elevation of a distinct species (D. organi)
northeast of the Asheville Basin (Crespi et al. 2010).
Genetic data indicate that D. organi populations are
more isolated and smaller in size compared to south-
western D. wrighti populations, and although diver-
gence time estimates for these populations include wide
confidence intervals, these estimates appear inconsistent
with a post-LGM fragmentation model (mean of 1 mil-
lion years; Crespi et al. 2003). We hypothesize that
Microhexura divergence times follow a Pliocene/Early
Pleistocene model as found in pygmy salamanders. An
intriguing implication of this model is that Microhexura
populations lack complete historical niche conservation,
with possible recent (e.g. LGM) habitat occupation at
elevations above spruce-fir forests, despite the fact that
all modern populations are restricted to these forests
(Coyle 2009). We intend to explore these hypotheses
further in a separate manuscript.
Conservation recommendations for a federallyendangered species complex
The data presented here have important conservation
implications, showing that the federally endangered
species M. montivaga is actually a complex of mostly
allopatric, highly distinctive genetic lineages (Fig. 6).
Most of these lineages are microendemic, restricted to a
single mountain range or even a single rock outcrop.
Even if these lineages do not constitute cryptic species,
the level of evolutionary independence measured makes
them clear candidates for lineage-specific conservation
decisions (i.e. as ‘management units’ or ‘evolutionary
significant units’). Conservation recommendations for
the preferred six-lineage hypothesis are made below.
Virginia Balsams (Whitetop) – This geographically
isolated population carries unique genetic diversity in
both mitochondrial and nuclear genomes (Fig. 6). Coyle
(2009) estimated 13 hectares of suitable habitat on
Whitetop Mountain (in pure Spruce forest) and found
very low relative spider abundances. Pine Mountain,
also part of the Virginia Balsams, includes a spider pop-
ulation that was not sampled in this study. Continued
close monitoring is needed at both locations, as loss of
the Virginia Balsams population would constitute a con-
siderable loss of unique genetic diversity. Grandfather
Mountain – Multiple rock outcrop demes exist on
Grandfather Mountain (Coyle 2009). The two demes
sampled constitute divergent mitochondrial lineages
and show weak evidence for nuclear differentiation in
BFD and BPP analyses (Fig. 6). Sampling of additional
rock outcrop demes might uncover additional genetic
lineages on Grandfather Mountain, and management to
maintain all genetically diverse demes within this range
should be a priority. Roan Mountain – This allopatric
population carries unique genetic diversity in both
mitochondrial and nuclear genomes (Fig. 6). Multiple
rock outcrop demes exist on Roan Mountain (Coyle
2009); the two sampled demes differ slightly for mito-
chondrial genes, but are similar in their nuclear
genomes. Black Mountains – Multiple rock outcrop
demes exist in the Blacks (Coyle 2009). Most of these
demes carry unique mitochondrial lineages, consistent
with microgeographic genetic differentiation along the
ridgeline of the Blacks (Material S4, Supporting infor-
mation). Management to maintain all genetically diverse
demes within this range should be a priority. Black-
stock_North – This distinct genetic lineage (Fig. 6) is
not strictly geographically isolated, but instead occupies
a single rock outcrop at the southwestern edge of the
Black Mountains system (Figs 1 and 3). Because the
Blackstock_North genetic lineage is only found on a sin-
gle rock outcrop, this deme should be monitored very
closely, and additional rock outcrops in the vicinity
should be sampled for this lineage. Again, loss of this
single deme would constitute a considerable loss of
unique genetic diversity. Great Smokies plus Plott
Balsams – This distinct genetic lineage (Fig. 6) occurs
southwest of the low-elevation Asheville Basin barrier
© 2015 John Wiley & Sons Ltd
3480 M. HEDIN ET AL.
and is therefore arguably the most geographically
isolated of all lineages. Multiple rock outcrop demes
exist in the Smokies (Coyle 2009), but the sampled de-
mes are relatively genetically homogeneous. The geo-
graphically isolated Plott Balsams population is
essentially genetically identical to the Smokies popula-
tion. From a genetics perspective, translocation of speci-
mens from the Great Smokies to the Plott Balsams
would be justified, which may be required given the
very low relative spider abundances and limited habitat
(estimated 3 hectares) in the Plott Balsams (Coyle 2009).
Acknowledgements
Sue Cameron has provided tremendous support for this project
and deserves special thanks. Sue Cameron, John Fridell and Bill
Commins assisted in the permitting process. Jason Bond, Bill
Shear and Sue Cameron helped to collect specimens. Kristen
Emata provided laboratory assistance, with help from David
Zezoff; James Starrett and Nicole Garrison extracted RNA; Sha-
han Derkarabetian helped in the transcriptome assembly pro-
cess. Isabella Niewiadomski helped to image specimens. Lou
Sorkin and Lorenzo Prendini facilitated the specimen loan from
the AMNH. Comments from Shahan Derkarabetian, Jared
Grummer, Dean Leavitt, Jordan Satler and Jim Starrett
improved the manuscript. This research was funded by the US
Fish & Wildlife Service, contract #F12AP00739.
References
Arnedo MA, Ferrandez M (2007) Mitochondrial markers reveal
deep population subdivision in the European protected spi-
der Macrothele calpeiana (Walckenaer, 1805) (Araneae, Hexa-
thelidae). Conservation Genetics, 8, 1147–1162.Aylor DL, Price EW, Carbone I (2006) SNAP: Combine and
Map modules for multilocus population genetic analysis. Bio-
informatics, 22, 1399–1401.Barley AJ, White J, Diesmos AC, Brown RM (2013) The chal-
lenge of species delimitation at the extremes: Diversification
without morphological change in Philippine sun skinks. Evo-
lution, 67, 3556–3572.Beavis AS, Sunnucks P, Rowell DM (2011) Microhabitat prefer-
ences drive phylogeographic disparities in tow Australian
funnel web spiders. Biological Journal of the Linnean Society,
104, 805–819.Bernardo J (2011) A critical appraisal of the meaning and diag-
nosability of cryptic evolutionary diversity, and its implica-
tions for conservation in the face of climate change. In:
Climate Change, Ecology and Systematics (eds Hodkinson TR,
Jones MB, Waldren S, Parnell JAN), pp. 380–438. Cambridge
University Press, Cambridge, UK.
Bond JE, Stockman AK (2008) An integrative method for
delimiting cohesion species: Finding the population-species
interface in a group of Californian trapdoor spiders with
extreme genetic divergence and geographic structuring. Sys-
tematic Biology, 57, 628–646.Bond JE, Hedin MC, Ramirez MG, Opell BD (2001) Deep
molecular divergence in the absence of morphological and
ecological change in the Californian coastal dune endemic
trapdoor spider Aptostichus simus. Molecular Ecology, 10, 899–910.
Bond JE, Beamer DA, Lamb T, Hedin MC (2006) Combining
genetic and geospatial analyses to infer population extinction
in mygalomorph spiders endemic to the Los Angeles region.
Animal Conservation, 9, 145–157.Bouckaert RR (2010) DensiTree: making sense of sets of phylo-
genetic trees. Bioinformatics, 26, 1372–1373.Camargo A, Sites J Jr (2013) Species delimitation: a decade after
the renaissance. In: The Species Problem - Ongoing Issues (ed.
Pavlinov I), pp. 225–247. InTech, New York.
Camargo A, Morando M, Avila LJ, Sites JW Jr (2012) Species
delimitation with ABC and other coalescent-based methods
in lizards of the Liolaemus darwinii complex (Squamata: Liola-
emidae). Evolution, 66, 2834–2849.Carstens BC, Satler JD (2013) The carnivorous plant described
as Sarracenia alata contains two cryptic species. Biological Jour-
nal of the Linnean Society, 4, 737–746.Carstens BC, Pelletier TA, Reid NM, Satler JD (2013) How to
fail at species delimitation. Molecular Ecology, 22, 4369–4383.Castalanelli MA, Teale R, Rix MG, Kennington WJ, Harvey MS
(2014) Barcoding of mygalomorph spiders (Araneae: Mygalo-
morphae) in the Pilbara bioregion of Western Australia
reveals a highly diverse biota. Invertebrate Systematics, 28,
375–385.Cooper SJB, Harvey MS, Saint KM, Main BY (2011) Deep phy-
logeographic structuring of populations of the trapdoor spi-
der Moggridgea tingle (Migidae) from southwestern Australia:
evidence for long-term refugia within refugia. Molecular Ecol-
ogy, 20, 3219–3236.Coyle FA (1981) The mygalomorph spider genus Microhexura
(Araneae, Dipluridae). Bulletin American Museum of Natural
History, 170, 64–75.Coyle FA (1984) A revision of the African mygalomorph spider
genus Allothele (Araneae, Dipluridae). American Museum Nov-
itates, 2794, 1–20.Coyle FA (1985) Observations on the mating behaviour of the
tiny mygalomorph spider, Microhexura montivaga Crosby &
Bishop (Araneae, Dipluridae). Bulletin British Arachnological
Society, 6, 328–330.Coyle FA (1988) A revision of the American funnel-web my-
galomorph spider genus Euagrus (Araneae, Dipluridae). Bul-
letin American Museum of Natural History, 187, 203–292.Coyle FA (1995) A revision of the funnelweb mygalomorph
spider subfamily Ischnothelinae (Araneae, Dipluridae). Bulle-
tin American Museum of Natural History, 226, 1–133.Coyle FA (2009) Status survey of the spruce-fir moss spider, Mi-
crohexura montivaga. Report to the US Fish & Wildlife Service.
Crespi EJ, Rissler LJ, Browne RA (2003) Testing Pleistocene
refugia theory: phylogeographical analysis of Desmognathus
wright, a high-elevation salamander in the southern Appala-
chians. Molecular Ecology, 12, 969–984.Crespi EJ, Browne RA, Rissler LJ (2010) Taxonomic revision of
Desmognathus wrighti (Caudata: Plethodontidae). Herpetolog-
ica, 66, 283–295.Crosby CR, Bishop SC (1925) Two new spiders from the Blue
Ridge mountains of North Carolina (Araneina). Entomological
News, 36, 142–146.Darriba D, Taboada GL, Doallo R, Posada D (2012) jModelTest
2: more models, new heuristics and parallel computing. Nat-
ure Methods, 9, 772.
© 2015 John Wiley & Sons Ltd
SKY ISLAND SPECIES DELIMITATION 3481
Dayrat B (2005) Towards integrative taxonomy. Biological Jour-
nal of the Linnean Society, 85, 407–415.Delcourt H, Delcourt P (1984) Late quaternary history of the
spruce-fir ecosystem in the southern Appalachian Mountain
region. In: The Southern Appalachian Spruce-Fir Ecosystem: Its
Biology and Threats (ed. White PS), pp. 22–35. National Park
Service, Southeast Region, Research/Resource Management
Report SER-71, Gatlinburg, Tennessee, USA.
Derkarabetian S, Hedin M (2014) Integrative taxonomy and
species delimitation in harvestmen: a revision of the western
North American genus Sclerobunus (Opiliones: Laniatores:
Travunioidea). PLoS ONE, 9, e104982.
Derkarabetian S, Ledford J, Hedin M (2011) Genetic diversifica-
tion without obvious genitalic morphological divergence in
harvestmen (Opiliones, Laniatores, Sclerobunus robustus) from
montane sky islands of western North America. Molecular
Phylogenetics and Evolution, 61, 844–853.Drummond AJ, Suchard MA, Xie D, Rambaut A (2012) Bayes-
ian phylogenetics with BEAUti and the BEAST 1.7. Molecular
Biology & Evolution, 29, 1969–1973.Earl DA, vonHoldt BM (2012) STRUCTURE HARVESTER: a
website and program for visualizing STRUCTURE output
and implementing the Evanno method. Conservation Genetic
Resources, 4, 359–361.Ence DD, Carstens BC (2011) SpedeSTEM: a rapid and accurate
method for species delimitation. Molecular Ecology Resources,
11, 473–480.Evanno G, Regnaut S, Goudet J (2005) Detecting the number of
clusters of individuals using the software STRUCTURE: a
simulation study. Molecular Ecology, 14, 2611–2620.Flot JF (2010) SeqPHASE: a web tool for interconverting
PHASE input/output files and FASTA sequence alignments.
Molecular Ecology Resources, 10, 162–166.Fridell JA (1994) Endangered and threatened wildlife and
plants; proposal to list the spruce-fir moss spider as an
endangered species. Federal Register, 59, 3825–3829.Fridell JA (2001) Endangered and threatened wildlife and
plants; reopening of public comment period and notice of
availability of draft economic analysis for proposed critical
habitat determination for the spruce-fir moss spider. Federal
Register, 66, 9806–9808.Fujisawa T, Barraclough TG (2013) Delimiting species using
single-locus data and the Generalized Mixed Yule Coalescent
approach: a revised method and evaluation on simulated
data sets. Systematic Biology, 62, 707–724.Fujita MK, Leach�e AD, Burbrink FT, McGuire JA, Moritz C
(2012) Coalescent-based species delimitation in an integrative
taxonomy. Trends in Ecology & Evolution, 27, 480–488.Grummer JA, Bryson RW Jr, Reeder TW (2014) Species delimi-
tation using Bayes factors: simulations and application to the
Sceloporus scalaris species group (Squamata: Phrynosomati-
dae). Systematic Biology, 63, 119–133.Guindon S, Gascuel O (2003) A simple, fast and accurate
method to estimate large phylogenies by maximum-likeli-
hood”. Systematic Biology, 52, 696–704.Hamilton CA, Hendrixson BE, Brewer MS, Bond JE (2014)
An evaluation of sampling effects on multiple DNA
barcoding methods leads to an integrative approach for
delimiting species: a case study of the North American
tarantula genus Aphonopelma (Araneae, Mygalomorphae,
Theraphosidae). Molecular Phylogenetics and Evolution, 71, 79–93.
Hedin M (1997) Speciational history in a diverse clade of
habitat-specialized spiders (Araneae: Nesticidae: Nesticus):
inferences from geographic-based sampling. Evolution, 51,
1929–1945.Hedin M, Thomas SM (2010) Molecular systematics of east-
ern North American Phalangodidae (Arachnida: Opiliones:
Laniatores), demonstrating convergent morphological evo-
lution in caves. Molecular Phylogenetics and Evolution, 54,
107–121.Hedin M, Starrett J, Hayashi C (2013) Crossing the uncrossable:
novel trans-valley biogeographic patterns revealed in the
genetic history of low-dispersal mygalomorph spiders (An-
trodiaetidae, Antrodiaetus) from California. Molecular Ecology,
22, 508–526.Hey J (2009) On the arbitrary identification of real species. In:
Speciation and Patterns of Diversity (eds Butlin RK, Bridle JR,
Schluter D), pp. 15–28. Cambridge University Press, Cam-
bridge, UK.
Hey J, Pinho C (2012) Population genetics and objectivity in
species diagnosis. Evolution, 66, 1413–1429.Huson DH, Bryant D (2006) Application of phylogenetic net-
works in evolutionary studies. Molecular Biology & Evolution,
23, 254–267.Jakobsson M, Rosenberg NA (2007) CLUMPP: a cluster match-
ing and permutation program for dealing with label switch-
ing and multimodality in analysis of population structure.
Bioinformatics, 23, 1801–1806.Joly S, Bruneau A (2006) Incorporating allelic variation for
reconstructing the evolutionary history of organisms from
multiple genes: an example from Rosa in North America.
Systematic Biology, 55, 623–636.Jones G, Aydin Z, Oxelman B (2014) DISSECT: an assignment-
free Bayesian discovery method for species delimitation
under the multispecies coalescent. Bioinformatics, 31, 991–998.Kass RE, Raftery AE (1995) Bayes factors. Journal of the Ameri-
can Statistical Association, 90, 773–795.Keith RM, Hedin M (2012) Extreme mitochondrial population
subdivision in southern Appalachian paleoendemic spiders
(Araneae, Hypochilidae, Hypochilus), with implications for
species delimitation. Journal of Arachnology, 40, 167–181.Kuo CH, Avise JC (2005) Phylogeographic breaks in low-dis-
persal species: the emergence of concordance across gene
trees. Genetica, 124, 179–186.Lartillot N, Philippe H (2006) Computing Bayes factors using
thermodynamic integration. Systematic Biology, 55, 195–207.Leach�e AD, Fujita MK (2010) Bayesian species delimitation in
West African forest geckos (Hemidactylus fasciatus). Proceed-
ings of the Royal Society B: Biological Sciences, 277, 3071–3077.Leach�e AD, Fujita MK, Minin VN, Bouckaert RR (2014) Species
delimitation using genome-wide SNP data. Systematic Biol-
ogy, 63, 534–542.Leavitt DH, Bezy RL, Crandall KA, Sites JW Jr (2007) Multi-
locus DNA sequence data reveal a history of deep cryptic
vicariance and habitat-driven convergence in the desert night
lizard Xantusia vigilis species complex (Squamata: Xantusii-
dae). Molecular Ecology, 16, 4455–4481.Leavitt DH, Starrett J, Westphal M, Hedin M (2015) Multilocus
sequence data reveal dozens of putative cryptic species in a
© 2015 John Wiley & Sons Ltd
3482 M. HEDIN ET AL.
radiation of endemic Californian mygalomorph spiders (Ara-
neae, Mygalomorphae, Nemesiidae). Molecular Phylogenetics
& Evolution, doi: 10.1016/j.ympev.2015.05.016.
Lohse K (2009) Can mtDNA barcodes be used to delimit spe-
cies? A response to Pons et al. (2006). Systematic Biology, 58,
439–442.Maddison WP, McMahon MM (2000) Divergence and reticu-
lation among montane populations of the jumping spider
Habronattus pugillis Griswold. Systematic Biology, 49, 400–421.
Marek PE, Bond JE (2009) A M€ullerian mimicry ring in Appa-
lachian millipedes. Proceedings of the National Academy of Sci-
ences, USA, 106, 9755–9760.McKay BD, Mays HL Jr, Wu Y et al. (2013) An empirical com-
parison of character-based and coalescent-based approaches
to species delimitation in a young avian complex. Molecular
Ecology, 22, 4943–4957.Miller MA, Pfeiffer W, Schwartz T (2010). Creating the CIPRES
science gateway for inference of large phylogenetic trees.
Proceedings of the Gateway Computing Environments
Workshop (GCE), New Orleans, 2010, 1-8.
Miralles A, Vences M (2013) New metrics for comparison of
taxonomies reveal striking discrepancies among species
delimitation methods in Madascincus lizards. PLoS ONE, 8(7),
e68242.
Monacell JT, Cardone I (2014) Mobyle SNAP Workbench: a
web-based analysis portal for population genetics and evolu-
tionary genomics. Bioinformatics, 30, 1488–1490.Niemiller ML, Near TJ, Fitzpatrick BM (2012) Delimiting spe-
cies using multilocus data: diagnosing cryptic diversity in
the southern cavefish, Typhlichthys subterraneus (Teleostei:
Amblyopsidae). Evolution, 66, 846–866.O’Meara BC (2010) New heuristic methods for joint species delim-
itation and species tree inference. Systematic Biology, 59, 59–73.O’Neill EM, Schwartz R, Bullock CT et al. (2012) Parallel
tagged amplicon sequencing reveals major lineages and phy-
logenetic structure in the North American tiger salamander
(Ambystoma tigrinum) species complex. Molecular Ecology, 22,
111–129.Opatova V, Arnedo MA (2014) Spiders on a hot volcanic roof:
colonisation pathways and phylogeography of the Canary
Island endemic trap-door spider Titanidiops canariensis (Ara-
neae, Idiopidae). PLoS ONE, 9, e115078.
Pons J, Barraclough TG, Gomez-Zurita J et al. (2006) Sequence-
based species delimitation for DNA taxonomy of unde-
scribed insects. Systematic Biology, 55, 595–609.Potter KM, Frampton J, Josserand SA, Nelson CD (2008)
Genetic variation and population structure in Fraser fir
(Abies fraseri): a microsatellite assessment of young trees.
Canadian Journal of Forest Research, 38, 2128–2137.Price EW, Carbone I (2005) SNAP. Workbench management
tool for evolutionary population genetic analysis. Bioinformat-
ics Applications Note, 21, 402–404.Pritchard JK, Stephens M, Donnelly P (2000) Inference of popu-
lation structure using multilocus genotype data. Genetics,
155, 945–959.Pritchard JK, Wen X, Falush D (2010) Documentation for Struc-
ture software: Version 2.3. Available from http://
pritch.bsd.uchicago.edu/structure.html. 1-38.
Rambaut A, Suchard MA, Xie D, Drummond AJ (2014) Tracer
v1.6. Available from http://beast.bio.ed.ac.uk/Tracer
Rannala B, Yang Z (2003) Bayes estimation of species diver-
gence times and ancestral population sizes using DNA
sequences from multiple loci. Genetics, 164, 1645–1656.Rannala B, Yang Z (2013) Improved reversible jump algorithms
for Bayesian species delimitation. Genetics, 194, 245–253.Reid NM, Brown JM, Satler JD et al. (2014) Poor fit to the
multi-species coalescent model is widely detectable in empir-
ical data. Systematic Biology, 63, 322–333.Rittmeyer EN, Austin CC (2012) The effects of sampling on
delimiting species from multi-locus sequence data. Molecular
Phylogenetics & Evolution, 65, 451–463.Rosenberg NA (2004)Distruct: a program for the graphical display
of population structure.Molecular Ecology Notes, 4, 137–138.Rovito SM (2010) Lineage divergence and speciation in the
web-toed salamanders (Plethodontidae: Hydromantes) of the
Sierra Nevada, California. Molecular Ecology, 19, 4554–4571.Satler JD, Carstens BC, Hedin M (2013) Multilocus species
delimitation in a complex of morphologically conserved trap-
door spiders (Mygalomorphae, Antrodiaetidae, Aliatypus).
Systematic Biology, 62, 805–823.Schlick-Steiner BC, Steiner FM, Seifert B, Stauffer C, Christian
E, Crozier RH (2010) Integrative taxonomy: a multisource
approach to exploring biodiversity. Annual Review of Entomol-
ogy, 55, 421–438.Schoville SD, Roderick GK (2010) Evolutionary diversification
of cryophilic Grylloblatta species (Grylloblattodea: Grylloblat-
tidae) in alpine habitats of California. BMC Evolutionary Biol-
ogy, 10, 163.
Silvestro D, Michalak I (2012) raxmlGUI: a graphical front-end
for RAxML. Organisms Diversity & Evolution, 12, 335–337.Sipe TW, Browne RA (2004) Phylogeography of masked (Sorex
cinereus) and smoky shrews (Sorex fumeus) in the southern
Appalachians. Journal of Mammalogy, 85, 874–885.Sol�ıs-Lemus C, Knowles LL, An�e C (2015) Bayesian species
delimitation combining multiple genes and traits in a unified
framework. Evolution, 69, 492–507.Sousa V, Hey J (2013) Understanding the origin of species with
genome-scale data: modelling gene flow. Nature Review
Genetics, 14, 404–414.Stamatakis A (2006) RAxML-VI-HPC: maximum likelihood-
based phylogenetic analyses with thousands of taxa and
mixed models. Bioinformatics, 22, 2688–2690.Stamatakis A (2014) RAxML version 8: a tool for phylogenetic
analysis and post-analysis of large phylogenies. Bioinformat-
ics, 30, 1312–1313.Stephens M, Donnelly P (2003) A comparison of Bayesian
methods for haplotype reconstruction from population
genotype data. American Journal of Human Genetics, 73, 1162–1169.
Stephens M, Smith N, Donnelly P (2001) A new statistical
method for haplotype reconstruction from population data.
American Journal of Human Genetics, 68, 978–989.Swofford DL (2002) PAUP*: Phylogenetic Analysis Using Parsi-
mony (*and Other Methods). Version 4. Sinauer Associates,
Sunderland, Massachusetts.
Tamura K, Stecher G, Peterson D, Filipski A, Kumar S (2013)
MEGA6: molecular evolutionary genetics analysis version
6.0. Molecular Biology & Evolution, 30, 2725–2729.Thomas SM, Hedin M (2008) Multigenic phylogeographic
divergence in the paleoendemic southern Appalachian opi-
lionids Fumontana deprehendor Shear (Opiliones, Laniatores,
© 2015 John Wiley & Sons Ltd
SKY ISLAND SPECIES DELIMITATION 3483
Triaenonychidae). Molecular Phylogenetics and Evolution, 46,
645–658.Weisrock DW, Larson A (2006) Testing hypotheses of specia-
tion in the Plethodon jordani species complex with allozymes
and mitochondrial DNA sequences. Biological Journal of the
Linnean Society, 89, 25–51.Weisrock DW, Rasoloarison RM, Fiorentino I et al. (2010)
Delimiting species without nuclear monophyly in Madagas-
car’s mouse lemurs. PLoS ONE, 5, e9883.
Xie WG, Lewis PO, Fan Y, Kuo L, Chen MH (2011) Improving
marginal likelihood estimation for Bayesian phylogenetic
model selection. Systematic Biology, 60, 150–160.Yang Z, Rannala B (2010) Bayesian species delimitation using
multilocus sequence data. Proceedings National Academy of Sci-
ences USA, 107, 9264–9269.Yang Z, Rannala B (2014) Unguided species delimitation using
DNA sequence data from multiple loci. Molecular Biology &
Evolution, 31, 3125–3135.Zhang C, Zhang D-X, Zhu T, Yang Z (2011) Evaluation of a
Bayesian coalescent method of species delimitation. System-
atic Biology, 60, 747–761.Zhang J, Kapli P, Pavlidis P, Stamatakis A (2013) A general
species delimitation method with applications to phyloge-
netic placements. Bioinformatics, 29, 2869–2876.
M.H. implemented the study design, directed data col-
lection, conducted analyses and helped in writing the
manuscript. D.C. conducted analyses and contributed to
writing the manuscript. F.C. collected specimens,
assisted in study design and contributed to writing the
manuscript.
Data accessibility
Unphased DNA sequences: GenBank Accession nos
KR607601–KR607977.Phased DNA sequence alignments, RAxML.tre files,
morphology JPG files, POFAD matrices, STRUCTURE files,
transcriptome assemblies: Dryad doi:10.5061/
dryad.r87k3.
Illumina data submitted to NCBI Short Read Archive
– Mt. Gibbes (SRX652506), Mt. Buckley (SRX1004559).
Marker development information, voucher data, PCR
conditions and nuclear gene trees uploaded as online
Supporting Information.
Supporting information
Additional supporting information may be found in the online ver-
sion of this article.
Material S1. Development of Nuclear Markers.
Material S2. Voucher number, location and GenBank informa-
tion.
Material S3. Primers and gene annotations
Material S4. Figure illustrating microgeographic mitochondrial
structuring in the Black Mountains.
Material S5. RAxML maximum likelihood nuclear gene trees.
Material S6. Marginal likelihood and Bayes Factor values for
alternative species delimitation hypotheses, based on combined
mitochondrial and nuclear data.
© 2015 John Wiley & Sons Ltd
3484 M. HEDIN ET AL.


![13 Hedin Equations, GW, GW+DMFT, and All That · PDF fileresults [i.e., the Hedin equations] are well known to the Green function people”. And indeed, what is known as the Hedin](https://img.dokumen.tips/doc/110x75/5a7ec9197f8b9a66798ecb2a/13-hedin-equations-gw-gwdmft-and-all-that-ie-the-hedin-equations-are-well.jpg)


![Finale 2005 - [CAVALGADA] · PDF fileroberto carlos arr. manoel ferreira & & & & & & & & & & & & & &?????](https://img.dokumen.tips/doc/110x75/5a72754e7f8b9a9d538d9075/finale-2005-cavalgadawww2secultcegovbrrecursospublicwebbancopdf.jpg)