Embed Size (px)
Citation preview
© 2017 BIA/Kelsey. All Rights Reserved
Sizing the Opportunity for Measuring & Monetizing Local TV Audiences
August 2017
Sizing the Opportunity for Measuring & Monetizing Local TV Audiences
© 2017 BIA/Kelsey. All Rights Reserved i
Contents
Executive Summary ................................................................................................................................... 1
The Media Audience Value Pyramid Starts with Accurate Measurement ........................................ 3
The Advertising Outlook for Local TV Investment and Activation ...................................................... 5
Local TV's Broadcast vs. Digital Revenue Mix .................................................................................... 5
Three Market Case Studies: Los Angeles, CA; Kansas City, KS-MO and Madison, WI ..................... 7
Social Ratings: Local TV is Missing the Boat on Monetizing Social Audiences ............................. 7
TV Ratings: Local Market TV Stations Monetization of Broadcast Audiences .............................. 9
Los Angeles, CA ...................................................................................................................................... 9
Kansas City, KS-MO ............................................................................................................................. 10
Madison, WI .......................................................................................................................................... 11
Conclusion and Recommendations ...................................................................................................... 12
About the Authors ................................................................................................................................... 13
About BIA/Kelsey ..................................................................................................................................... 14
Figures
Figure 1 - The Balancing Act of Matching Audience Data to Big Data ............................................... 4
Figure 2 - Broadcast and Digital Revenue Forecast for Local TV Stations ......................................... 6
Figure 3 - TV Station Social Monetization Opportunity ........................................................................ 8
Figure 4 - Los Angeles: Monetization of Broadcast Audiences $000s ............................................... 9
Figure 5 - Kansas City: Monetization of Broadcast Audiences $000s .............................................. 10
Figure 6 - Madison, WI: Monetization of Broadcast Audiences $000s ............................................ 11
Sizing the Opportunity for Measuring & Monetizing Local TV Audiences
© 2017 BIA/Kelsey. All Rights Reserved 1
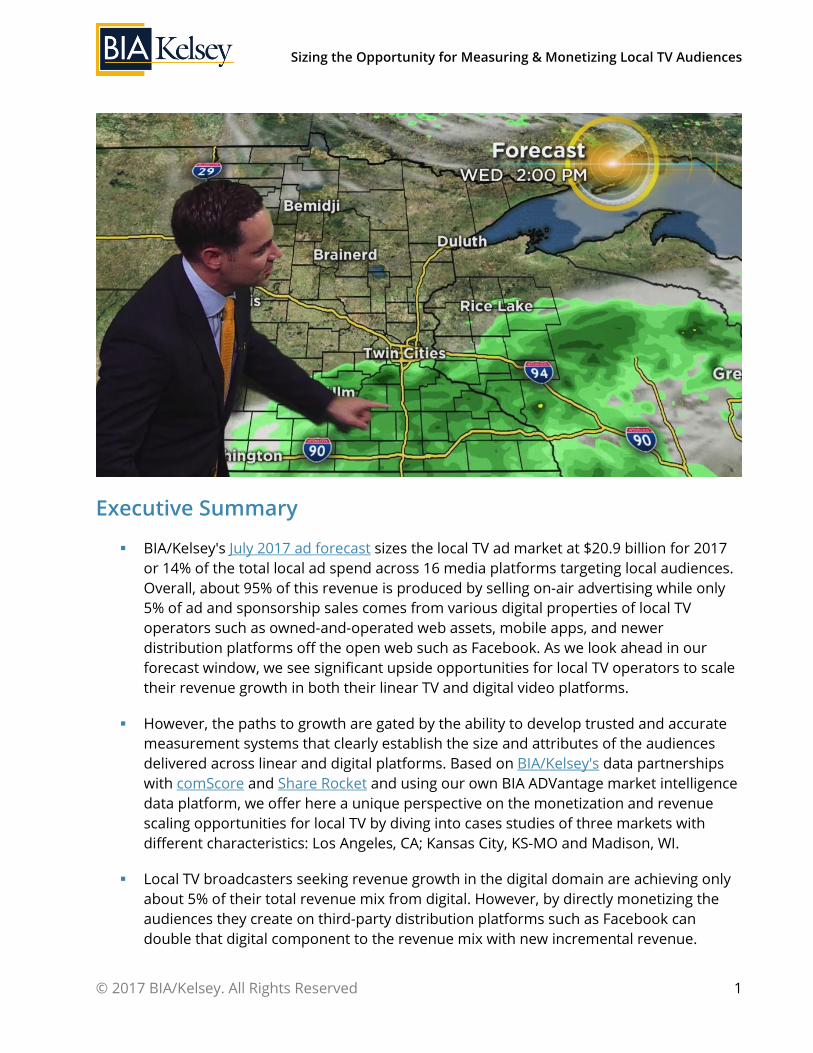
Executive Summary
BIA/Kelsey's July 2017 ad forecast sizes the local TV ad market at $20.9 billion for 2017
or 14% of the total local ad spend across 16 media platforms targeting local audiences.
Overall, about 95% of this revenue is produced by selling on-air advertising while only
5% of ad and sponsorship sales comes from various digital properties of local TV
operators such as owned-and-operated web assets, mobile apps, and newer
distribution platforms off the open web such as Facebook. As we look ahead in our
forecast window, we see significant upside opportunities for local TV operators to scale
their revenue growth in both their linear TV and digital video platforms.
However, the paths to growth are gated by the ability to develop trusted and accurate
measurement systems that clearly establish the size and attributes of the audiences
delivered across linear and digital platforms. Based on BIA/Kelsey's data partnerships
with comScore and Share Rocket and using our own BIA ADVantage market intelligence
data platform, we offer here a unique perspective on the monetization and revenue
scaling opportunities for local TV by diving into cases studies of three markets with
different characteristics: Los Angeles, CA; Kansas City, KS-MO and Madison, WI.
Local TV broadcasters seeking revenue growth in the digital domain are achieving only
about 5% of their total revenue mix from digital. However, by directly monetizing the
audiences they create on third-party distribution platforms such as Facebook can
double that digital component to the revenue mix with new incremental revenue.
Sizing the Opportunity for Measuring & Monetizing Local TV Audiences
© 2017 BIA/Kelsey. All Rights Reserved 2
Working with Share Rocket, we size the opportunity for monetizing local TV stations'
earned audiences just with Facebook Native and Facebook LIVE video to be $67.1
million for Los Angeles, CA; $10.7 million for Kansas City, KS-MO and $2.35 million for
Madison, WI.
An essential point to see here is that local TV operators have a path to doubling their
digital revenue growth simply by monetizing the audiences they already have created on
Facebook.
From the advertisers' perspective, the social audience segments local TV stations create
with their premium video product while highly valuable are not currently exposed to
them so they don't even have the chance to buy this inventory to hit their campaign
goals.
Given the trendline for local TV's revenue mix as heavily dependent on monetizing local
broadcast audiences, about 5% of their total revenue, the accuracy of audience
measurement is critical. For example, each rating point is worth $12.8 million in Los
Angeles, CA; $1.12 million in Kansas City, KS-MO and $496,350 in Madison, WI.
This means for example that in Los Angeles if a ratings estimate is off by just half a
point, $6.4 million could be misspent by advertisers.
Accurate measurement, the ability to add "big data" to audience estimates to develop
data-driven audience and consumer segment matches and monetizing social audiences
already created are critical growth paths.
Sizing the Opportunity for Measuring & Monetizing Local TV Audiences
© 2017 BIA/Kelsey. All Rights Reserved 3
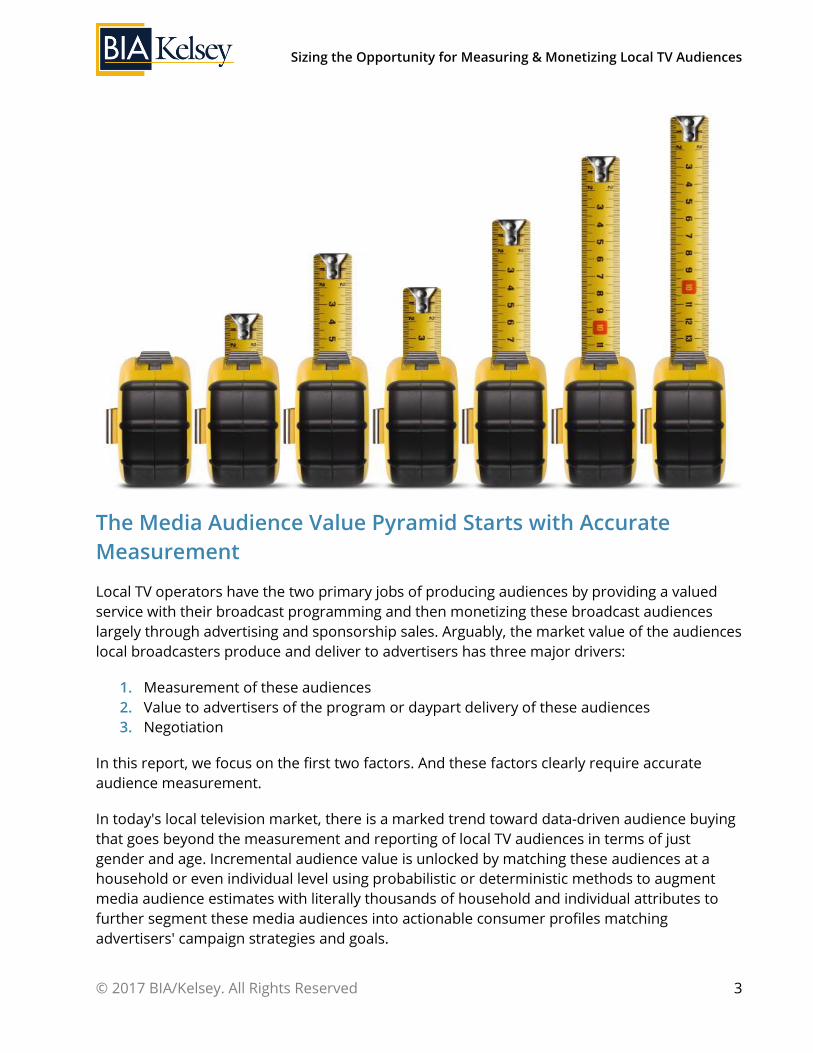
The Media Audience Value Pyramid Starts with Accurate
Measurement
Local TV operators have the two primary jobs of producing audiences by providing a valued
service with their broadcast programming and then monetizing these broadcast audiences
largely through advertising and sponsorship sales. Arguably, the market value of the audiences
local broadcasters produce and deliver to advertisers has three major drivers:
1. Measurement of these audiences
2. Value to advertisers of the program or daypart delivery of these audiences
3. Negotiation
In this report, we focus on the first two factors. And these factors clearly require accurate
audience measurement.
In today's local television market, there is a marked trend toward data-driven audience buying
that goes beyond the measurement and reporting of local TV audiences in terms of just
gender and age. Incremental audience value is unlocked by matching these audiences at a
household or even individual level using probabilistic or deterministic methods to augment
media audience estimates with literally thousands of household and individual attributes to
further segment these media audiences into actionable consumer profiles matching
advertisers' campaign strategies and goals.
Sizing the Opportunity for Measuring & Monetizing Local TV Audiences
© 2017 BIA/Kelsey. All Rights Reserved 4
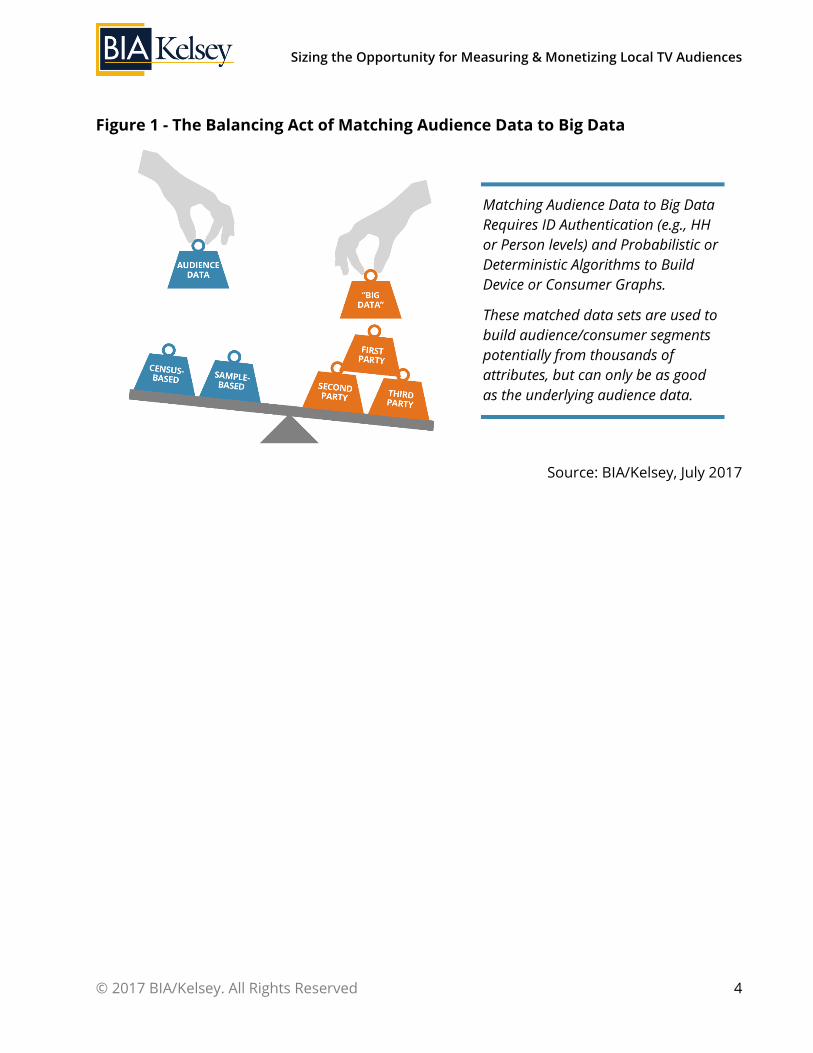
Figure 1 - The Balancing Act of Matching Audience Data to Big Data
Source: BIA/Kelsey, July 2017
Matching Audience Data to Big Data
Requires ID Authentication (e.g., HH
or Person levels) and Probabilistic or
Deterministic Algorithms to Build
Device or Consumer Graphs.
These matched data sets are used to
build audience/consumer segments
potentially from thousands of
attributes, but can only be as good
as the underlying audience data.

Sizing the Opportunity for Measuring & Monetizing Local TV Audiences
© 2017 BIA/Kelsey. All Rights Reserved 5
The Advertising Outlook for Local TV Investment and
Activation
Local TV's Broadcast vs. Digital Revenue Mix
For local TV, we see two significant revenue growth paths. First, increasing the value of the
broadcast audience with better measurement and audience index-based selling by
augmenting audience data with attributes from other data sets. If these developments occur,
local TV broadcasters will become more competitive with digital pure play platforms and would
see greater revenue growth in better monetizing their broadcast audiences. Second, scaling
and monetizing audiences on digital properties whether owned and operated or on other
distribution platforms such as Facebook. By this we mean not just scaling impressions from
earned media that may correlate to higher broadcast ratings, but selling those impressions for
incremental revenue growth beyond the broadcast product.
BIA/Kelsey's U.S. Local Advertising Forecast 2017 is a five-year forecast that delivers an
overview of total U.S. spending targeting local audiences across all major media platforms.
BIA/Kelsey defines "local advertising" as all advertising platforms that target access to local
audiences for national, regional, and local marketers.
For 2017, we forecast total local ad spend to be $147.9 billion, of which $21.6 billion will go to
local TV. While digital ad spending is the fastest growing part of the overall ad economy, for
Sizing the Opportunity for Measuring & Monetizing Local TV Audiences
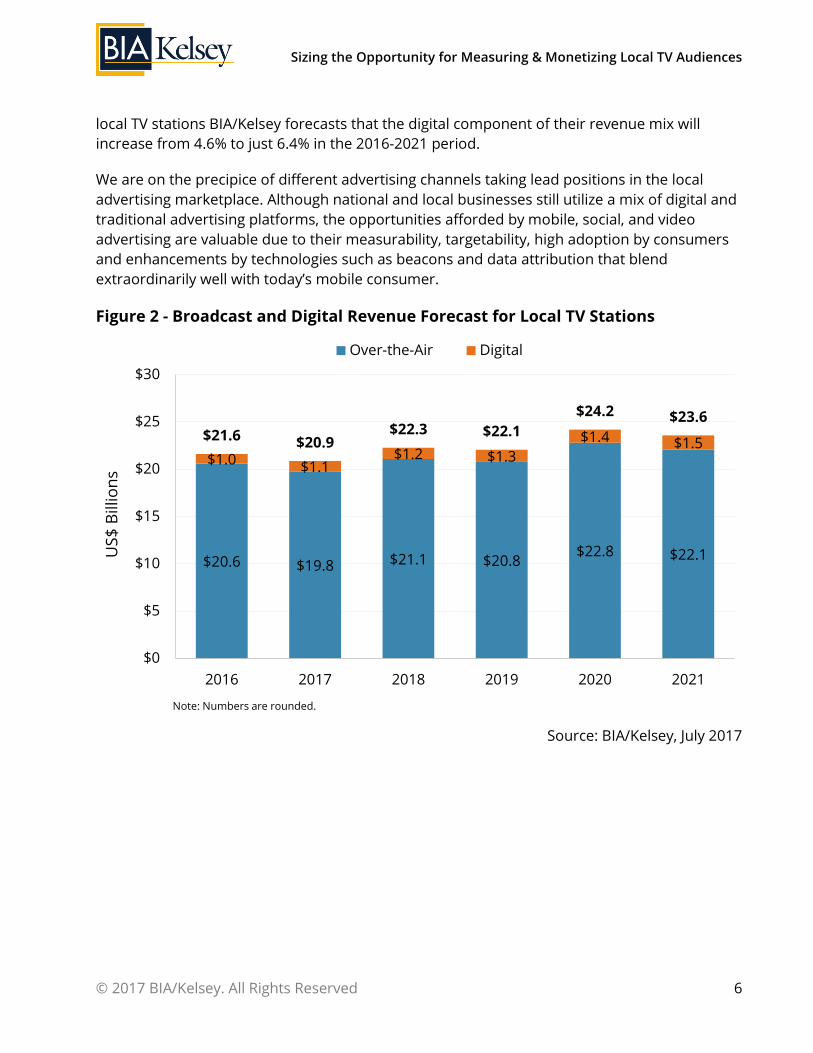
© 2017 BIA/Kelsey. All Rights Reserved 6
local TV stations BIA/Kelsey forecasts that the digital component of their revenue mix will
increase from 4.6% to just 6.4% in the 2016-2021 period.
We are on the precipice of different advertising channels taking lead positions in the local
advertising marketplace. Although national and local businesses still utilize a mix of digital and
traditional advertising platforms, the opportunities afforded by mobile, social, and video
advertising are valuable due to their measurability, targetability, high adoption by consumers
and enhancements by technologies such as beacons and data attribution that blend
extraordinarily well with today’s mobile consumer.
Figure 2 - Broadcast and Digital Revenue Forecast for Local TV Stations
Source: BIA/Kelsey, July 2017
$20.6 $19.8 $21.1 $20.8$22.8 $22.1
$1.0$1.1
$1.2 $1.3
$1.4 $1.5$21.6 $20.9
$22.3 $22.1
$24.2 $23.6
$0
$5
$10
$15
$20
$25
$30
2016 2017 2018 2019 2020 2021
Over-the-Air Digital
US
$ B
illio
ns
Note: Numbers are rounded.
Sizing the Opportunity for Measuring & Monetizing Local TV Audiences
© 2017 BIA/Kelsey. All Rights Reserved 7
Three Market Case Studies: Los Angeles, CA; Kansas City, KS-
MO and Madison, WI
In this section, we'll highlight case studies from three different types of TV markets to explore
how well local TV stations are monetizing both their broadcast and social audiences.
Social Ratings: Local TV is Missing the Boat on Monetizing Social Audiences
We see lots of evidence that local TV stations get that engaged social audiences are valuable in
terms of driving on-air viewership that can be monetized by higher ratings. For example, a
recent TVNewsCheck article cites the case of WTTG (Washington, DC) and its use of social media
to help them with their on-air ratings. “Our focus on social engagement, I believe has had a
cumulative positive impact on our current growth and success,” said Paolini.”
As we know, broadcasters are keenly interested in growing topline revenue across traditional
and digital platforms. We noted earlier that only about 5% of total local station revenue comes
from digital platforms. Are local broadcasters leaving money on the digital table by producing
digital audiences that they are not currently monetizing? For our look at social, we'll focus on
Facebook audience creation as that is the most significant component of third-party platform
audience creation for many local TV broadcasters.
To address this question of monetizing social audiences, we collaborated with Share Rocket to
build on our own database and analytics of Facebook and revenue data to create a deeper
understanding of the audience-revenue relationship potential.
Sizing the Opportunity for Measuring & Monetizing Local TV Audiences
© 2017 BIA/Kelsey. All Rights Reserved 8
The revenue goals of local TV stations are to produce and monetize audiences on both their
linear and digital platforms. It is simple and straightforward in concept but tougher to
accomplish in execution. Starting with an accepted audience measurement currency, additional
audience attributes can be grafted onto the underlying media estimates to create transactable
new audience segments that can be of great value to marketers, and programmers for that
matter.
One type of audience that local TV stations consistently under-monetize are the earned
audiences they create on social platforms.
Still, the social audiences can be directly monetized by selling the digital impressions not just
looking for ratings boosts to the on-air signal. To size this opportunity, we developed a data
sharing partnership with Share Rocket the leading provider of social ratings currency data for
local TV.
Working with Share Rocket, we developed estimates of social audience impressions and their
relative value in our case study markets. These numbers represent estimates based on Share
Rocket data collected for a 12-month period beginning July 1, 2016 and ending July 1,
2017. Using Facebook audience and engagement data analyzed for that period, we have
estimated the total revenue opportunity for Facebook Native Video and Facebook LIVE
video. This estimate is based on the new Share Rocket Monetize currency that values the reach,
impressions, video views and engagements of Facebook Native and Facebook LIVE video posts.
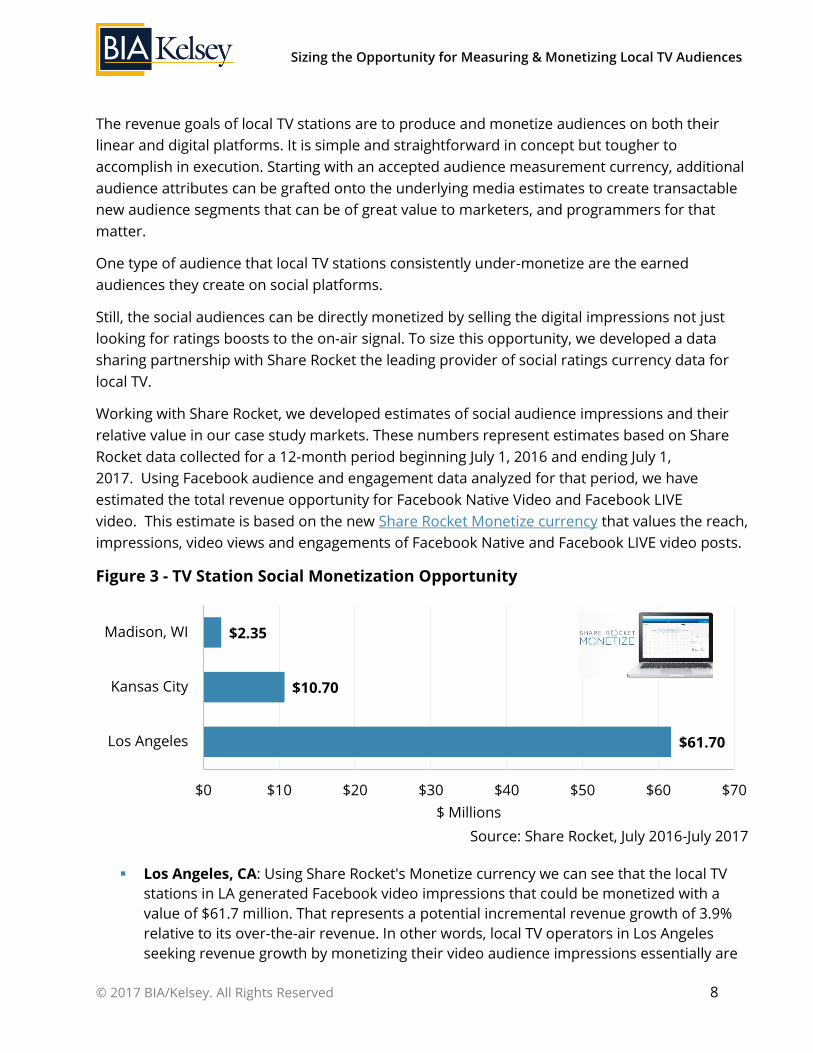
Figure 3 - TV Station Social Monetization Opportunity
Source: Share Rocket, July 2016-July 2017
Los Angeles, CA: Using Share Rocket's Monetize currency we can see that the local TV
stations in LA generated Facebook video impressions that could be monetized with a
value of $61.7 million. That represents a potential incremental revenue growth of 3.9%
relative to its over-the-air revenue. In other words, local TV operators in Los Angeles
seeking revenue growth by monetizing their video audience impressions essentially are
$61.70
$10.70
$2.35
$0 $10 $20 $30 $40 $50 $60 $70
Los Angeles
Kansas City
Madison, WI
$ Millions
Sizing the Opportunity for Measuring & Monetizing Local TV Audiences
© 2017 BIA/Kelsey. All Rights Reserved 9
walking over from at least some of this growth component.
Kansas City, KS-MO: Share Rocket's Monetize currency estimates a total value of
Facebook video impressions created by local TV stations equals $10.7 million. In this
case, it appears broadcasters are doing a much more effective job at engaging their
audiences via Facebook. What's less clear is how well these broadcasters are monetizing
these impressions. If fully monetized, these Facebook impressions represent a revenue
growth potential of 6.7% of the over-the-air revenue currently generated by stations.
Madison, WI: Even in a smaller market like this one, social audiences have a value of up
to $2.35 million or another 3.8% of the over-the-air sales that could be added on top for
incremental growth just by monetizing audiences already created by the stations.
TV Ratings: Local Market TV Stations Monetization of Broadcast Audiences
BIA/Kelsey and comScore have a data partnership to help build better analytics and insights
into the value of local market TV audiences. Based on data analytics from comScore's
StationView Essentials and BIA/Kelsey ADVantage data platforms, we produced estimates of
audience monetization efficiency in terms of Rating Points and Average Audience Minutes.
These analytics provide a top-level index of the ability of TV stations in local markets to
monetize their broadcast audiences. For this analysis, we keep it at the market and station
levels for Adults 25-54, All Day, All Week for the calendar year 2016.
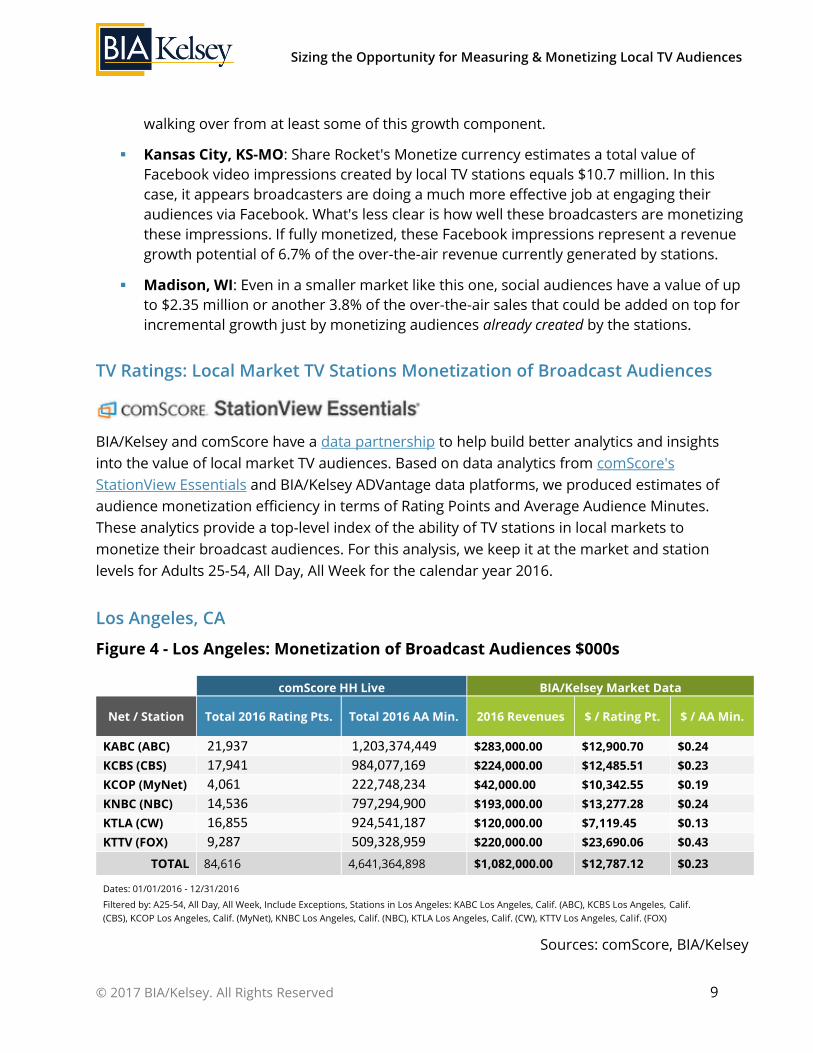
Los Angeles, CA
Figure 4 - Los Angeles: Monetization of Broadcast Audiences $000s
comScore HH Live BIA/Kelsey Market Data
Net / Station Total 2016 Rating Pts. Total 2016 AA Min. 2016 Revenues $ / Rating Pt. $ / AA Min.
KABC (ABC) 21,937 1,203,374,449 $283,000.00 $12,900.70 $0.24
KCBS (CBS) 17,941 984,077,169 $224,000.00 $12,485.51 $0.23
KCOP (MyNet) 4,061 222,748,234 $42,000.00 $10,342.55 $0.19
KNBC (NBC) 14,536 797,294,900 $193,000.00 $13,277.28 $0.24
KTLA (CW) 16,855 924,541,187 $120,000.00 $7,119.45 $0.13
KTTV (FOX) 9,287 509,328,959 $220,000.00 $23,690.06 $0.43
TOTAL 84,616 4,641,364,898 $1,082,000.00 $12,787.12 $0.23
Dates: 01/01/2016 - 12/31/2016
Filtered by: A25-54, All Day, All Week, Include Exceptions, Stations in Los Angeles: KABC Los Angeles, Calif. (ABC), KCBS Los Angeles, Calif.
(CBS), KCOP Los Angeles, Calif. (MyNet), KNBC Los Angeles, Calif. (NBC), KTLA Los Angeles, Calif. (CW), KTTV Los Angeles, Calif. (FOX)
Sources: comScore, BIA/Kelsey
Sizing the Opportunity for Measuring & Monetizing Local TV Audiences
© 2017 BIA/Kelsey. All Rights Reserved 10
Local TV ad revenue totaled $1.08 billion in Los Angeles in 2016. Overall, the local TV stations
generated 84,616 rating points and 4.6 billion Average Audience Minutes. Building on these
comScore metrics by using data from BIA ADVantage, we can estimate the audience
monetization efficiency of local TV stations in this market. Overall, each Los Angeles Rating
Point is worth $12.79 million and the Average Audience Minute is worth $0.23.
Ratings Monetization: $12.8 million is produced for each rating point generated by Los
Angeles TV stations. This ranges from a low of $7.1 million for KTLA to a high of $23.7
million for KTTV.
Average Audience Minutes Monetization: Each AA minute generated by Los Angeles TV
stations yields $0.23 on average. This ranges from a low of $0.13 for KTLA to a high of
$0.43 for KTTV.
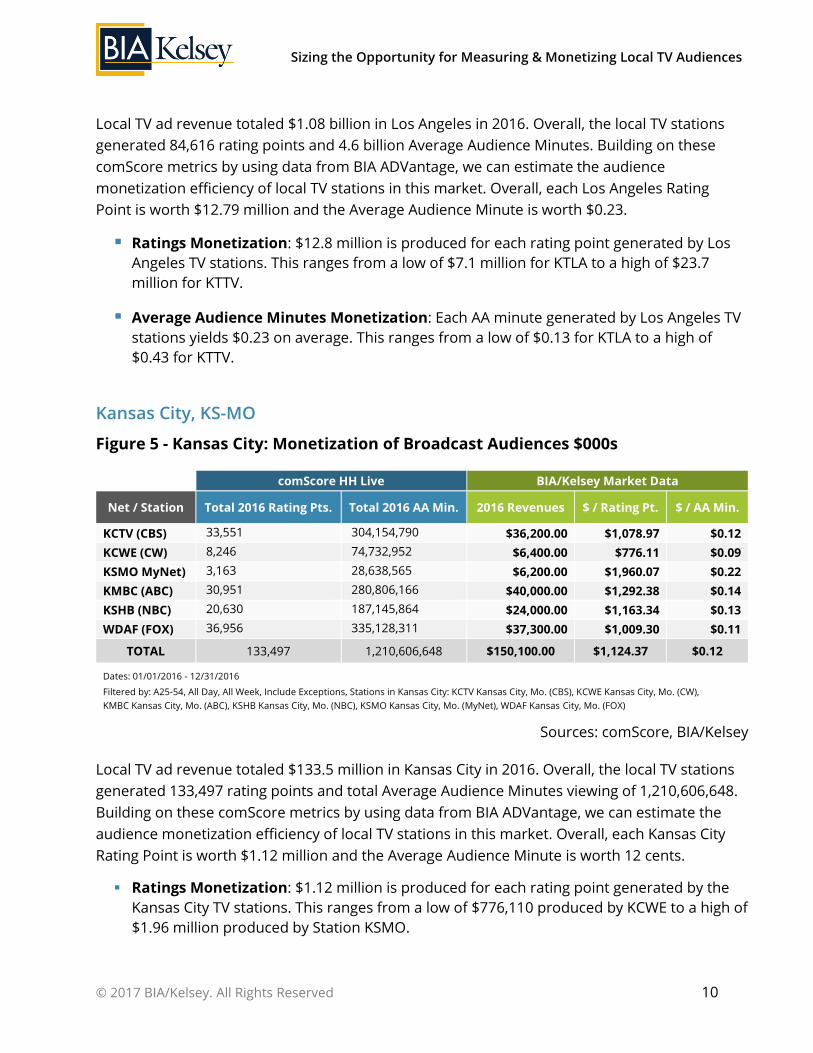
Kansas City, KS-MO
Figure 5 - Kansas City: Monetization of Broadcast Audiences $000s
comScore HH Live BIA/Kelsey Market Data
Net / Station Total 2016 Rating Pts. Total 2016 AA Min. 2016 Revenues $ / Rating Pt. $ / AA Min.
KCTV (CBS) 33,551 304,154,790 $36,200.00 $1,078.97 $0.12
KCWE (CW) 8,246 74,732,952 $6,400.00 $776.11 $0.09
KSMO MyNet) 3,163 28,638,565 $6,200.00 $1,960.07 $0.22
KMBC (ABC) 30,951 280,806,166 $40,000.00 $1,292.38 $0.14
KSHB (NBC) 20,630 187,145,864 $24,000.00 $1,163.34 $0.13
WDAF (FOX) 36,956 335,128,311 $37,300.00 $1,009.30 $0.11
TOTAL 133,497 1,210,606,648 $150,100.00 $1,124.37 $0.12
Dates: 01/01/2016 - 12/31/2016
Filtered by: A25-54, All Day, All Week, Include Exceptions, Stations in Kansas City: KCTV Kansas City, Mo. (CBS), KCWE Kansas City, Mo. (CW),
KMBC Kansas City, Mo. (ABC), KSHB Kansas City, Mo. (NBC), KSMO Kansas City, Mo. (MyNet), WDAF Kansas City, Mo. (FOX)
Sources: comScore, BIA/Kelsey
Local TV ad revenue totaled $133.5 million in Kansas City in 2016. Overall, the local TV stations
generated 133,497 rating points and total Average Audience Minutes viewing of 1,210,606,648.
Building on these comScore metrics by using data from BIA ADVantage, we can estimate the
audience monetization efficiency of local TV stations in this market. Overall, each Kansas City
Rating Point is worth $1.12 million and the Average Audience Minute is worth 12 cents.
Ratings Monetization: $1.12 million is produced for each rating point generated by the
Kansas City TV stations. This ranges from a low of $776,110 produced by KCWE to a high of
$1.96 million produced by Station KSMO.

Sizing the Opportunity for Measuring & Monetizing Local TV Audiences
© 2017 BIA/Kelsey. All Rights Reserved 11
Average Audience Minutes Monetization: Each AA minute generated by the Kansas City
TV stations yields $0.12. This ranges from a low of $0.11 for WDAF to a high of $0.22 for
KSMO.
Madison, WI
Figure 6 - Madison, WI: Monetization of Broadcast Audiences $000s
comScore HH Live BIA/Kelsey Market Data
Net / Station Total 2016 Rating Pts. Total 2016 AA Min. 2016 Revenues $ / Rating Pt. $ / AA Min.
TVW (MyNet) 2,297 8,654,735
WBUW (CW -
1/1/16 - 9/11/16) 2,493 9,360,484 $1,525.00 $611.65 $0.16
WISC (CBS) 35,326 133,545,308 $16,400.00 $464.25 $0.12
WKOW (ABC) 25,390 95,929,419 $13,000.00 $512.02 $0.14
WMSN (FOX) 18,816 71,227,246 $10,950.00 $581.96 $0.15
WMTV (NBC) 36,157 136,790,211 $17,925.00 $495.75 $0.13
TOTAL 120,479 455,507,403 $59,800.00 $496.35 $0.13
Dates: 01/01/2016 - 12/31/2016
Filtered by: A25-54, All Day, All Week, Include Exceptions, Stations in Madison: TVW Madison, Wis. (MyNet) [WISC2], WISC Madison, Wis.
(CBS), WKOW Madison, Wis. (ABC), WMSN Madison, Wis. (FOX), WMTV Madison, Wis. (NBC)
Sources: comScore, BIA/Kelsey
Local TV ad revenue totaled $59.7 million in Madison, WI in 2016. Overall, the local TV stations
generated 120,479 rating points and 455,507,403 Average Audience Minutes. Building on these
comScore metrics by using data from BIA ADVantage, we can estimate the audience
monetization efficiency of local TV stations in this market. Overall, each Madison Rating Point is
worth $496,350 and the Average Audience Minute is worth 13 cents.
Ratings Monetization: $496,350 is produced for each rating point generated by the
Madison TV stations. This ranges from a low of $464,250 for WISC to a high of $611,650 for
WBUW.
Average Audience Minutes Monetization: Each AA minute generated by Madison TV
stations yields an average of $0.13. This ranges from a low of $0.12 for WISC to a high of
$0.16 for WBUW.

Sizing the Opportunity for Measuring & Monetizing Local TV Audiences
© 2017 BIA/Kelsey. All Rights Reserved 12
Conclusion and Recommendations
Local TV is a valued advertising platform for its premium video inventory and locally activated,
engaged audiences that can be targeted by marketers. Both local TV operators and marketers
have a personal stake in accurate audience measurement and reporting for both broadcast and
social audiences created by this premium video programming. The ability to match broadcast
audience data to third party "big data" and addressable targeting from set-top boxes adds
substantially to the local TV value proposition.
Local TV's social audiences are an undervalued asset in the local market – by both TV operators
and marketers. An essential point to see is that local TV operators have a path to doubling their
digital revenue growth simply by monetizing the audiences they already create on Facebook.
From the advertisers' perspective, marketers get access to premium video inventory that is
currently undersold. Local TV stations create with their premium video product while highly
valuable are not currently exposed to them so they don't even have the chance to buy this
inventory to hit their campaign goals.
Given the trendline for local TV's revenue mix as heavily dependent on monetizing local
broadcast audiences, about 5% of their total revenue, the accuracy of audience measurement is
critical. For example, each rating point is worth $12.8 million in Los Angeles, $1.12 million in
Kansas City and $496,350 in Madison, WI. This means for example that in Los Angeles if a
ratings estimate is off by just half a point, $6.4 million could be misspent by advertisers.
Accurate measurement, the ability to add "big data" to audience estimates to develop data-
driven audience and consumer segment matches and monetizing social audiences already
created are critical growth paths for fully realizing the monetization potential of local TV in the
forms of incremental revenue for TV operators and more engagement and sales for marketers.
Sizing the Opportunity for Measuring & Monetizing Local TV Audiences
© 2017 BIA/Kelsey. All Rights Reserved 13
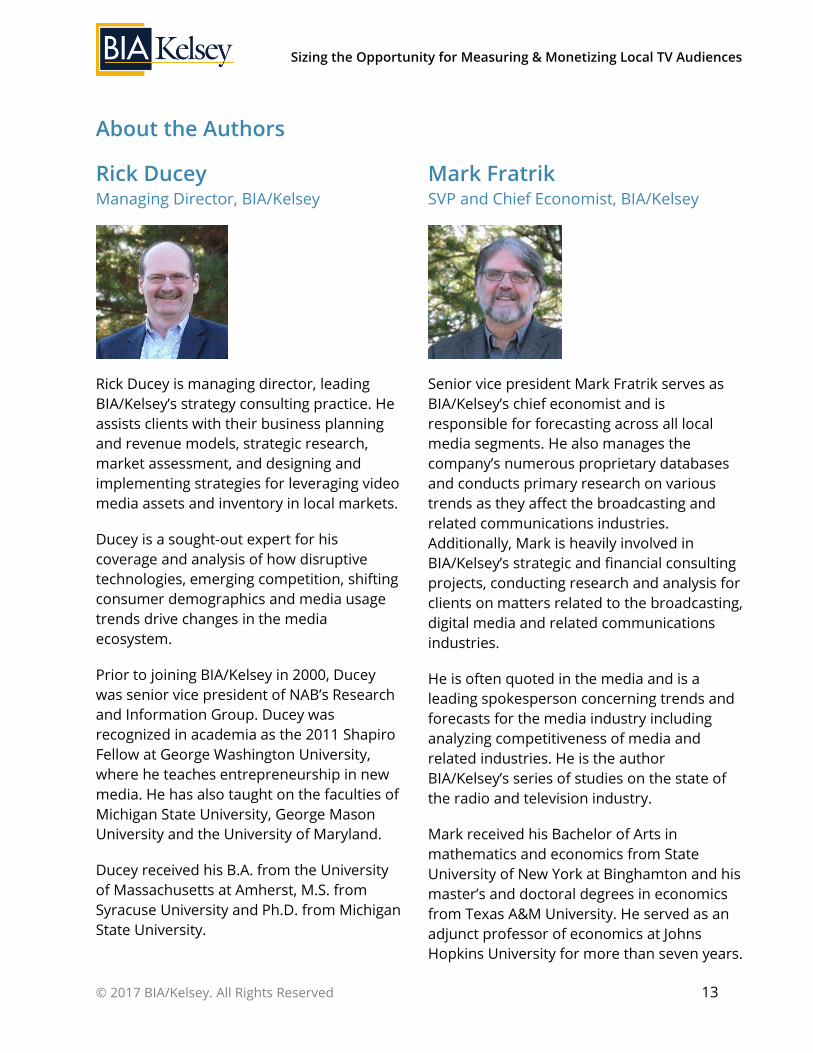
About the Authors
Rick Ducey Managing Director, BIA/Kelsey
Rick Ducey is managing director, leading
BIA/Kelsey’s strategy consulting practice. He
assists clients with their business planning
and revenue models, strategic research,
market assessment, and designing and
implementing strategies for leveraging video
media assets and inventory in local markets.
Ducey is a sought-out expert for his
coverage and analysis of how disruptive
technologies, emerging competition, shifting
consumer demographics and media usage
trends drive changes in the media
ecosystem.
Prior to joining BIA/Kelsey in 2000, Ducey
was senior vice president of NAB’s Research
and Information Group. Ducey was
recognized in academia as the 2011 Shapiro
Fellow at George Washington University,
where he teaches entrepreneurship in new
media. He has also taught on the faculties of
Michigan State University, George Mason
University and the University of Maryland.
Ducey received his B.A. from the University
of Massachusetts at Amherst, M.S. from
Syracuse University and Ph.D. from Michigan
State University.
Mark Fratrik SVP and Chief Economist, BIA/Kelsey
Senior vice president Mark Fratrik serves as
BIA/Kelsey’s chief economist and is
responsible for forecasting across all local
media segments. He also manages the
company’s numerous proprietary databases
and conducts primary research on various
trends as they affect the broadcasting and
related communications industries.
Additionally, Mark is heavily involved in
BIA/Kelsey’s strategic and financial consulting
projects, conducting research and analysis for
clients on matters related to the broadcasting,
digital media and related communications
industries.
He is often quoted in the media and is a
leading spokesperson concerning trends and
forecasts for the media industry including
analyzing competitiveness of media and
related industries. He is the author
BIA/Kelsey’s series of studies on the state of
the radio and television industry.
Mark received his Bachelor of Arts in
mathematics and economics from State
University of New York at Binghamton and his
master’s and doctoral degrees in economics
from Texas A&M University. He served as an
adjunct professor of economics at Johns
Hopkins University for more than seven years.
Sizing the Opportunity for Measuring & Monetizing Local TV Audiences
© 2017 BIA/Kelsey. All Rights Reserved 14
About BIA/Kelsey
Local media is one of the fastest moving
industries of our time. And BIA/Kelsey has
been at the center of it for more than 30 years.
BIA/Kelsey is the leading research and advisory
firm focused on the advertising and marketing
marketplace. We have proven advisory
services and consulting methods that put our
clients in the best possible position to compete
and stand out in today’s multiplatform,
interactive world.
Our research, forecasts, industry analysis,
competitive intelligence and industry-leading
analyst team propel our clients’ success
forward. Put yourself in the best possible
position to compete and win — turn to
BIA/Kelsey.
We are pleased to announce our new
Programmatic Program that features a series
of papers and webinars that will help our
clients understand the potential of
programmatic. Contact us today for more
details: [email protected].
Connect with BIA/Kelsey:
www.biakelsey.com
Local Media Watch blog
www.twitter.com/BIAKelsey
www.facebook.com/biakelsey
BIA/Kelsey’s daily newsletter