Embed Size (px)
Citation preview

Sistema JSFC Financial Results 1Q 2016 Mikhail Shamolin President of Sistema JSFC Vsevolod Rozanov Senior Vice President, Chief Financial Officer of Sistema JSFC

2
DISCLAIMER
Certain statements in this presentation may contain assumptions or forecasts in respect to forthcoming events within JSFC Sistema. The words “expect”, “estimate”, “intend”, “will”, “could” and similar expressions identify forward-looking statements. We wish to caution you that these statements are only predictions and that actual events or results may differ materially. We do not intend to update these statements to reflect events and circumstances occurring after the above-mentioned date or to reflect the occurrence of unanticipated events. Many factors could cause Sistema’s actual results to differ materially from those contained in our projections or forward-looking statements, including, among others, deteriorating economic and credit conditions, our competitive environment, risks associated with operating in Russia, rapid technological and market change in our industries, as well as many other risks specifically related to Sistema and its operations.

3
KEY HIGHLIGHTS
168
173
1Q 2015
1Q 2016
+3.3% -0.1%
ADJUSTED NET INCOME, RUB bln
-
-3
2
1Q 2015
1Q 2016
MTS 62%
Detsky Mir 9%
Segezha Group
7%
RTI 5%
Targin 4%
MTS Bank 3%
Other 10%
REVENUE BREAKDOWN BY ASSETS
RUB 173 bln
NET DEBT AT CORP CENTRE*, RUB bln
66
77
4Q 2015
1Q 2016
• Strong results of portfolio assets: 10 of Sistema’s 13 key assets** increased revenues YoY
• Share of non-public subsidiaries in consolidated
revenues and OIBDA amounted to 38% and 9%, respectively
• Detsky Mir and Segezha Group remain Sistema’s key
growth drivers with revenue up 35% and 40% YoY, respectively
• Continued success in building a major agricultural holding with the acquisition of c. 110k ha of land in the Rostov region and Stavropol Krai
• Increase in the Corporate Centre’s net debt mainly due to funds transfer to complete debt repayment at SSTL, Sistema’s Indian telecom subsidiary
• New progressive dividend policy approved: the dividend for each reporting year will be, at a minimum, the higher of either an amount equivalent to a dividend yield of 4% or RUB 0.67 per share
44
44
1Q 2015
1Q 2016
* Excluding liabilities under put options agreements, in particular the agreement related to SSTL **MTS, Detsky Mir, Segezha Group, Targin, RTI, BPGC, Medsi, MTS Bank, agricultural assets, Intourist, SSTL, Binnopharm, real estate segment
CONSOLIDATED REVENUE, RUB bln ADJUSTED OIBDA, RUB bln IFRS, RUB bln

4
FINANCIAL REVIEW
167.7 173.3 5.4 4.3 3.2 2.1 -9.4
Revenue1Q 2015
MTS revenuegrowth*
Detsky Mirrevenue growth
Segezha Grouprevenue growth
Other RTI revenuedecrease*
Revenue1Q 2016
168
193
173
1Q 2015
4Q 2015
1Q 2016
44
36
44
1Q 2015
4Q 2015
1Q 2016
44.3 44.3 1.3 0.8 1.0 -1.1
-2.0
OIBDA1Q 2015
SSTL OIBDAgrowth
MTS BankOIBDA growth
Detsky Mir,Segezha, Medsi,
Targin OIBDAgrowth
KronshtadtOIBDA decrease
OIBDA decreaseat Corp Centre
and other assets
OIBDA1Q 2016
IFRS, RUB bln
• MTS: increase in retail sales of goods and higher consumption of data services
• Detsky Mir: successful implementation of the strategy to expand market share and the chain of retail stores
• Segezha Group: increase in production and consolidation of Lesosibirsk LDK No. 1
• RTI: disposal of the ICT business unit and recognition of revenue from a large government contract in 1Q 2015
*Excluding the impact of Nvision (ICT BU in RTI ), consolidated by MTS (deconsolidated by RTI) in 2015
• SSTL became OIBDA positive in 1Q 2016
• МТS Bank: OIBDA improvement due to decreased provision charges
• Detsky Mir, Segezha, Medsi and Targin demonstrated moderate OIBDA growth YoY
• OIBDA loss of Kronshtadt Group (consolidated in 4Q 2015) is in line with budget and is mainly attributable to a seasonal decrease in revenues as well as investments into new projects
CONSOLIDATED REVENUE ANALYSIS, RUB bln
ADJUSTED OIBDA ANALYSIS, RUB bln

5
KEY HIGHLIGHTS IN 1Q 2016 AND BEYOND
Corporate Centre
Corporate Centre’s SG&A under control with 7.3% YoY growth in costs (lower than inflation)
New dividend policy approved: the dividend for each reporting year will be, at a minimum, the higher of either an amount equivalent to a dividend yield of 4% or RUB 0.67 per share
Portfolio performance
МТS: The highest revenue growth rate among top competitors (+7.9% YoY), active subscriber base increased by 3.8% YoY
Detsky Mir: 35.1% YoY revenue growth, continued expansion of chain of retail stores
Segezha Group: 39.8% YoY growth in revenues thanks to increased production in key business segments and consolidation of Lesosibirsk LDK No. 1
SSTL: 10.9% YoY revenue growth, break even at OIBDA level in 1Q 2016. Sistema continues to work towards merger of SSTL’s telecom business with RCom. The transaction is subject to final approvals from the Rajasthan and Bombay High Courts, as well as the Department of Telecommunications of India.
Targin: 17.6% YoY revenue growth and an OIBDA margin of 12.6%
New acquisitions
Agricultural business: In May 2016, Sistema entered into legally binding agreements to purchase c. 110 thsd ha of land in the Rostov and Stavropol regions, almost doubling its land bank. The acquired assets offer significant growth potential in terms of crop yield, OIBDA and market value

6
AGRICULTURE: SUBSTANTIAL GROWTH OF LAND BANK
Sistema is well on track to building Russia’s leading agroholding with a land bank of at least 500 thsd ha
Sistema’s focus is the land with average or high crop yields and strong growth potential in terms of value
4.1 6.8
3.3 2.3
RZ Argo
WHEAT YIELD OF SISTEMA LAND BANK
Unique asset by the size of land bank in Southern European of Russia
Proximity to sea and river grain transportation terminals
Attractive acquisition cost
Potential to significantly increase production and OIBDA through crop rotation, enriching the soil, plowing pasture land and adopting advanced agricultural techniques
Investment
Agro entities with a total land bank of 110 thsd ha
Investor
Agroholding Steppe (Sistema’s 100% subsidiary)
Time of investment
May 2016*
Geography
Rostov region, Stavropol Krai
99 247
≥ 500 +38
+110
2012-2013 2014-2015 2016
Land bank at June 2016
2018 target
BUILDING SISTEMA’S LAND BANK
INVESTMENTS IN THE WHEAT AND OTHER CROPS SEGMENT: PROJECT REVIEW
*Closing of all the transaction is expected during 2016
Thsd ha Tonnes / ha
JV RZ Agro
Agroholding Steppe
New acquisitions
Agroholding Steppe
New acquisitions
Russia’s average

7
33.8
50.6
26.7 -23.8
-3.7 -4.5
-5.1 -4.8
-1.6
December 31,2015*
March 31, 2016*
CASH FLOWS AT THE CORPORATE CENTRE Management accounts, RUB bln
Portion of proceeds from Ural-Invest
Debt repayments at Corp Centre
Transfer of funds to complete SSTL debt repayment (incl. interest)
Costs of Corp Centre (1Q’16 and 4Q’15)
Corporate Centre’s cash position was impacted by the transfer of funds to facilitate repayment of SSTL’s dollar-denominated debt
As of 1Q 2016, Sistema’s cash position amounted to RUB 33.8 bln excluding RUB 12.9 bln of term deposits
Corporate Centre’s costs include cash outflows related to expenses accrued in 4Q 2015
* Including highly liquid deposits
Other investments
МТS Bank capitalisation
Taxes and interest expenses at Corp Centre

8
SG&A AND CAPEX
GROUP’s SG&A, RUB bln CORPORATE CENTRE’S SG&A, RUB bln
1.6 1.7
1.0% 1.0%
1Q'15 1Q'16
SG&A at Corporate Centre
Corporate SG&A/Group's revenue
• Corporate Centre’s SG&A increased at a below inflation rate of 7.3% YoY
• Corporate SG&A/Revenue ratio was stable at 1% of the Group’s revenues in 1Q 2016
32.5 20.9
5.2
6.0
37.7
26.9
1Q 2015 1Q 2016
MTS Other assets
GROUP’s CAPEX, RUB bln
• The Group’s CAPEX decreased YoY and QoQ by 29% and 28% accordingly
• МТS guidance for 2016 – reduction of CAPEX to RUB 85 bln
IFRS, RUB bln
20.7 22.0
3.0 1.6 1.6 1.7 3.7 4.7 1.2 1.8 4.2
5.6
1Q 2015 1Q 2016
MTS RTI Corporate Centre
Detsky Mir Segezha Other
37.4 34.4
• Group’s SG&A increased YoY mainly due to costs growth at MTS and Segezha Group in particular driven by consolidation of new assets.
• Improvements include decreased ratio SGA/Revenue ratio YoY at subsidiaries:
- MTS: from 20.7% to 20.3% - Detsky Mir: from 30.1% to 28.4% - Medsi: from 23.7% to 17.8%

9
CONSOLIDATED DEBT
329 344 315
37 40 36
33 21 20
68 117
111 25
35 39
492 557
521
1Q 2015 4Q 2015 1Q 2016
MTS RTI SSTL Corporate Centre Other
134
107
75 77
127
2017 2018 2019 2020 2021 andthereafter
- 6.4%
CONSOLIDATED DEBT AND MATURITY PROFILE, RUB bln
37% 40% 38%
58% 58% 59%
5% 2% 3%
1Q'15 4Q'15 1Q'16
USD RUB Other
82% 74% 74%
18% 26% 26%
1Q'15 4Q'15 1Q'16
Long-term Short-term
Bank loans and other
69%
Rouble bonds 12%
Eurobonds 19%
CONSOLIDATED DEBT STRUCTURE
Management accounts

10
CORPORATE CENTRE’S DEBT
39 66 77
30
51 34 69
117 111
1Q 2015 4Q 2015 1Q 2016
Net Debt Cash position
25 24 19
32
10
2017 2018 2019 2020 2021 and thereafter
-5.3%
CORPORATE CENTRE’S DEBT AND MATURITY PROFILE*, RUB bln
43% 39% 37% 28%
57% 61% 63% 72%
1Q'15 4Q'15 1Q'16 1Q'16 incl. FХ hedge
USD RUB
88% 78% 77%
12% 22% 23%
1Q'15 4Q'15 1Q'16
Long-term Short-term
Bank loans and other
39%
Rouble bonds 35%
Eurobonds 26%
CORPORATE CENTRE’S DEBT STRUCTURE*
* Corporate Centre’s debt does not include liabilities under put options agreements, in particular the agreement related to SSTL
Management accounts

11
Assets Overview

12
Assets Overview[1]
*Here and thereafter net income is presented in Sistema’s share.
RUB bln 1Q’16 4Q’15 1Q’15 QoQ YoY
Revenue 108.1 113.3 100.2 -4.6% 7.9% Adj.OIBDA 40.5 41.5 41.3 -2.5% -2.0% OIBDA margin 37.4% 36.6% 41.2% 0.8 p.p. -3.8 p.p. Net income* 7.8 3.8 5.8 103.3% 33.3% Net debt 270.2 310.9 285.6 -13.1% -5.4% CAPEX 20.9 26.4 32.5 -20.8% -35.5%
Subscribers, mln
MTS RUB bln 1Q’16 4Q’15 1Q’15 QoQ YoY
Revenue 16.4 20.6 12.2 -20.2% 35.1% Adj.OIBDA 0.8 3.2 0.7 -75.2% 16.9% OIBDA margin 4.9% 8.8% 5.7% -3.9 p.p. -0.8 p.p. Net income 0.1 0.3 0.02 -76.0% 4х Net debt 12.5 16.4 11.3 -24.1% 10.7% SGA/revenue 28.4% 28.8% 30.1% -0.4 p.p. -1.7 p.p. Like-for-like growth 13.1% 9.2% 13.2% 3.9 p.p. -1.1 p.p. Traffic growth 0.9% 1.5% 4.0% -0.6 p.p. -3.1 p.p. Average ticket growth 12.1% 7.6% 9.0% 4.5 p.p. 3.1 p.p.
CAPEX 0.3 1.0 1.0 -72.3% -72.2%
Detsky mir
> MTS continues to demonstrate the highest revenue growth rate among its top peers. The main drivers of YoY revenue growth include 71% increase in sales of goods, higher consumption of data services and growth of the active subscriber base.
> Adjusted OIBDA substantially stable YoY despite higher sales volumes of lower margin handsets and increased investment to grow the retail network amid stiffer competition.
> Net income growth YoY was driven primarily by a non-cash FX gain.
> In 2Q 2016 MTS’s Board of Directors set a dividend policy for 2016-2018 that implies a target payout of RUB 25.0-26.0 per ordinary share per year, with a minimum payout of RUB 20.0 per share.
> In April 2016, MTS entered the tower infrastructure market, with towers and antenna support structures initially available for lease.
104.2 107.8 108.2 74.5 77.3 77.3
1Q'15 4Q'15 1Q'16Total Russia
> Strong increase in Detsky Mir’s revenues YoY came mainly from 13.1% rise in like-for-like sales and increased traffic at existing stores.
> Detsky Mir’s adjusted OIBDA increased as the company implemented a competitive pricing policy aimed at increasing its market share in Russia.
> SGA as a percentage of revenues continued to decline as costs remained strictly controlled, including through increased automation of business processes, headcount optimisation and the reduction of leasing rates for retail facilities.
> In 1Q 2016, Detsky Mir opened 4 new stores, bringing its total number of stores to 428. The company plans to open at least 50 new stores this year.
399 491 494
330 425 428
1Q'15 4Q'15 1Q'16
Retail space Stores
+0.4% Retail space (‘000 m2) and stores

13 *Information and Communications Technologies BU disposed in 2015. ** Share of debt related to state defence contracts (with effectively zero interest rate).
RTI
Assets Overview[2]
RUB bln 1Q’16 4Q’15 1Q’15 QoQ YoY
Revenue without ICT business unit*
8.7 16.9 18.1 -47.3% -51.8%
Revenue 8.7 20.8 21.8 -58.1% -60.1%
OIBDA 0.8 2.1 0.9 -61.1% -7.4% OIBDA margin 9.3% 10.0% 4.0% -0.7 p.p. 5.3 p.p. Net loss -0.7 -0.3 -1.2 n/a n/a Net debt 29.0 26.7 13.4 8.3% 2х Share of debt related to state defence contracts**
32% 43% 46% -11 p.p. -14 p.p.
Segezha Group Financials in RUB bln 1Q’16 4Q’15 1Q’15 QoQ YoY
Revenue 11.4 8.7 8.1 31.5% 39.8%
OIBDA 2.4 1.5 2.2 57.8% 7.8%
OIBDA margin 21.5% 17.7% 27.4% 4.8p.p (5.9p.p)
Net income 1.0 1.2 0.7 -15.4% 40.6%
Net debt 10.8 0.7 0.02 16X n/a
CAPEX 2.4 1.5 0.7 62.1% 3x
Share of FХ-denom. revenues 69% 69% 70% - -1%
Own forestry consumption 68% 66% 53% 2% 15%
Total forestry, ‘000 m3 1070.2 684.4 930.0 56.6% 15.1%
64.3%
12.8%
18.4%
4.4% Paper & Paper bags
Plywood
Wood processing
Forestry
Revenue by business segments
˃ Robust revenues growth YoY resulted from increased sales of paper, plywood and lumber, changes to the FX rate and the consolidation of Lesosibirsk LDK No. 1 (LLDK No. 1).
˃ The YoY contraction in OIBDA margin was mainly due to increased cost of chemicals and other materials starting from 2H 2015. OIBDA margin was supported by the optimisation of production costs and an increase in the share of Segezha’s own logging in volumes of raw wood consumed to 68% from 53% in 1Q 2015.
˃ CAPEX in 1Q 2016 was mainly to complete construction of a paper packaging plant in the Rostov region, where the first production line began operations in March 2016. Over the course of 2016, priorities of Segezha's investment programme include modernisation of paper and sack production, construction of a sawmill at Segezha Pulp & Paper Plant, and construction of a plywood factory in Kirov.
˃ Segezha’s debt increased in 1Q 2016 as the result of Russian banks loans raising to finance CAPEX as well as the consolidation of LLDK No. 1.
> RTI’s revenues declined YoY primarily due to disposal of the Information and Communication Technologies (ICT) business unit (BU) as well as recognition of considerable amount of revenue from a large government contract in 1Q 2015. Microelectronics BU’s revenues increased by 23.1% YoY thanks to increased delivery of microchips and radio-frequency identification (RFID) tags designed and manufactured by RTI.
> The OIBDA margin increased YoY as a result of increased profitability at the Microelectronics BU and disposal of the ICT BU.
> SGA expenses decreased 45.0% YoY mainly due to the disposal of the ICT BU.
> RTI’s increase in net debt in 1Q 2016 and for 12 months ending 31 March 2016 was due to reduction of cash on the company’s balance sheet (in 1Q 2015 RTI received advance payment on a large government contract).
Results by key business segments
5.5
2.3
15% 12%
Defence solutions Microelectronics
Revenue RUB bln Margin OIBDA

14
Assets Overview[3]
Мedsi RUB bln 1Q’16 4Q’15 1Q’15 QoQ YoY
Revenue 2.3 2.3 1.9 -1.8% 16.3% OIBDA 0.04 0.4 -0.3 -88.6% n/a OIBDA margin 1.9% 16.4% n/a -14.5 p.p. n/a Net loss/(income) -0.2 0.2 -0.4 n/a n/a Net cash -1.2 -0.2 -0.3 n/a n/a Patient visits, thousands 1 763 2 043 1 679 -13.7% 5.0% Services provided, ‘000 2 796 3 183 2 719 -12.2% 2.8%
Revenue by clients Revenue by assets
Corporate 6%
Insurance 59%
Private 35%
CDC at Belorusskaya 22%
Clinics 42%
Hospitals 7%
Others 12%
Children’s clinics 16%
RUB bln 1Q’16 4Q’15 1Q’15 QoQ YoY
Revenue 4.1 4.2 4.0 -2.8% 3.4% OIBDA 1.5 0.6 1.4 2х 4.2% OIBDA margin 36.3% 15.1% 35.9% 21.2 p.p. 0.4 p.p. Net income 0.7 0.1 0.8 6х -13.9% CAPEX 0.7 1.6 0.6 -60% 11.3% New connections, ‘000 5 461 6 775 3 699 -19.4% 47.6% Connected power, MVt 86 127 98 -32.3% -12.2%
Losses on distribution and transmission grids
BPGC
> Revenues grew YoY as a result of increased traffic from patients covered by insurance and growth of the client base driven by successful marketing campaigns. The number of unique clients paying out-of-pocket increased by 12% YoY. The seasonal decline in the number of visits QoQ was largely offset by the average spend per visit.
> Medsi became OIBDA positive in 1Q 2016 despite seasonality.
> Medsi’s largest asset, the clinical-diagnostic centre at Belorusskaya in Moscow (22% of revenues in 1Q 2016, total space of 11,400 sq m) increased revenues by 10% YoY. The clinical-diagnostic centre at Krasnaya Presnya (22,800 sq m), which opened in late 2015, delivered an utilisation ratio ahead of its target.
> BPGC’s revenue and OIBDA increased YoY due to indexation of tariffs from 1 July 2015 and non-material growth of total productive electricity output and capacity.
> The number of consumers connected to distribution grids increased 47.6% YoY.
> Net income declined YoY due to higher amortisation charges resulting from commissioning of fixed assets, and also due to lower interest income.
> BPGC's priority for 2016 remains implementation of Smart Grid technology to the Ufa city network.
1.51% 1.48% 1.39%
10.32% 10.32% 10.04%
1Q'15 4Q'15 1Q'16Transmission Distribution

15
Targin RUB bln 1Q’16 4Q’15 1Q’15 QoQ YoY
Revenue 5.4 5.3 7.1 2.3% -24.3% Net loss -0.1 -8.8 -1.0 n/a n/a Interest income 4.6 4.6 5.5 0.7% -15.3 Commission income 0.7 0.9 0.8 -20.4% -4.1% Net assets 24.6 21.6 30.3 13.9% -19.0% Capital Adequacy Ratio (N1) 20.2% 18.5% 17.3% 1.7 p.p. 2.9 p.p.
Loan portfolio of MTS Bank*
MTS Bank RUB bln 1Q’16 4Q’15 1Q’15 QoQ YoY
Revenue 6.8 6.9 5.8 -1.2% 17.6% OIBDA 0.9 1.0 0.5 -9.2% 58.9% OIBDA margin 12.7% 13.8% 9.3% -1.1 p.p. 3.4 p.p. Net income/(loss) 0.1 0.3 -0.05 -62.8% n/a Net debt 4.3 3.0 2.6 42.1% 64.0% CAPEX 1.3 0.8 0.5 67.9% 3x
Results of the drilling business segment
Assets Overview[4]
*On a standalone basis
> Revenues increased YoY thanks to a 2% increase in drilling volumes, a 4% increase in capital-repair and ongoing well-maintenance services, and a 3% increase in transportation services.
> OIBDA margin increased YoY due to an increase of high-margin services in revenues.
> CAPEX increased YoY primarily as a result of the acquisition of two 320-tonne capacity drilling rigs and other equipment.
> Targin is implementing an investment programme to expand its offering in key business segments and develop new technologies. The programme is financed through RUB bank loans. As of the end of 1Q 2016 Targin’s net debt to LTM OIBDA ratio was 1.1x.
˃ MTS Bank’s interest income and total revenues increased QoQ thanks to a stabilisation in performing assets as well as resumption of retail lending in 2015.
˃ Net loss declined YoY and QoQ as a result of decreased provision charges and improvement of the risk profile of its loans to individuals.
˃ The majority of retail loans issued in the quarter are represented by consumer credit for the purchase of mobile phones and other merchandise at MTS retail outlets. Most corporate loans were extended to medium-sized businesses or Sistema Group companies.
˃ MTS Bank’s aims for 2016 are to continue establishing a high-quality loan book, reducing expenses and maintaining its capital adequacy ratios.
117 112 119
52 66 47
1Q'15 4Q'15 1Q'16
Drilled, '000 m Well comissioning
121
110 109 58% 54% 54%
1Q'15 4Q'15 1Q'16
Loan portfolio Share of loans to individuals
16
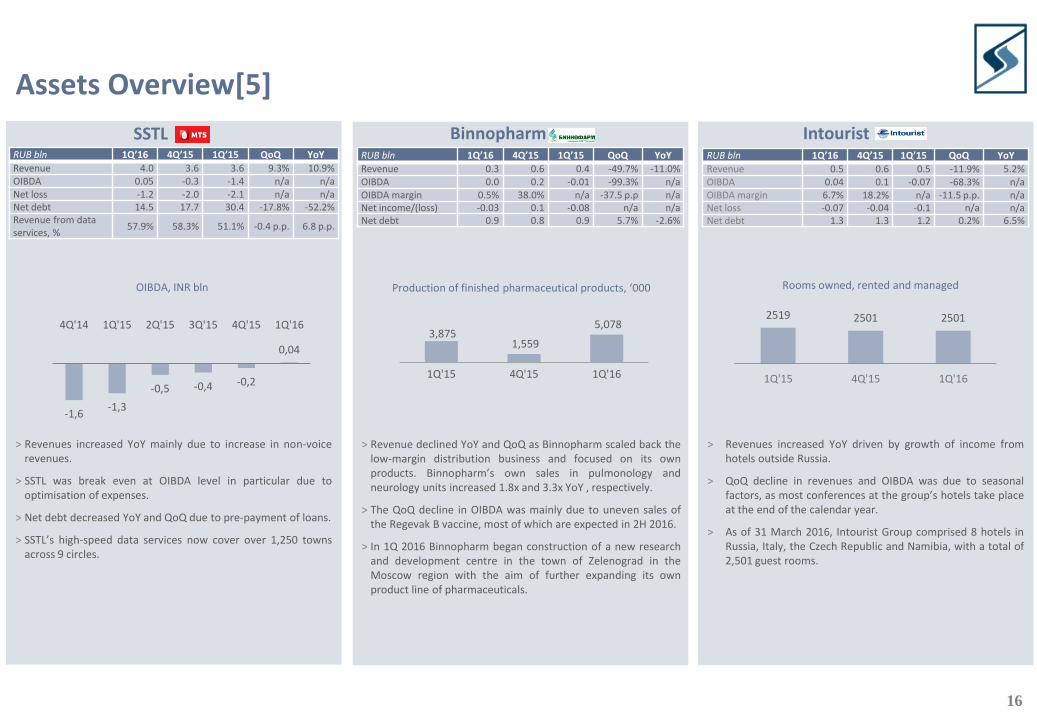
Assets Overview[5]
SSTL RUB bln 1Q’16 4Q’15 1Q’15 QoQ YoY
Revenue 4.0 3.6 3.6 9.3% 10.9% OIBDA 0.05 -0.3 -1.4 n/a n/a Net loss -1.2 -2.0 -2.1 n/a n/a Net debt 14.5 17.7 30.4 -17.8% -52.2% Revenue from data services, %
57.9% 58.3% 51.1% -0.4 p.p. 6.8 p.p.
OIBDA, INR bln
0,04
-0,2 -0,4 -0,5
-1,3 -1,6
1Q'164Q'153Q'152Q'151Q'154Q'14
Binnopharm RUB bln 1Q’16 4Q’15 1Q’15 QoQ YoY
Revenue 0.3 0.6 0.4 -49.7% -11.0% OIBDA 0.0 0.2 -0.01 -99.3% n/a OIBDA margin 0.5% 38.0% n/a -37.5 p.p n/a Net income/(loss) -0.03 0.1 -0.08 n/a n/a Net debt 0.9 0.8 0.9 5.7% -2.6%
Production of finished pharmaceutical products, ‘000
3,875 1,559
5,078
1Q'15 4Q'15 1Q'16
> Revenue declined YoY and QoQ as Binnopharm scaled back the low-margin distribution business and focused on its own products. Binnopharm’s own sales in pulmonology and neurology units increased 1.8x and 3.3x YoY , respectively.
> The QoQ decline in OIBDA was mainly due to uneven sales of the Regevak B vaccine, most of which are expected in 2H 2016.
> In 1Q 2016 Binnopharm began construction of a new research and development centre in the town of Zelenograd in the Moscow region with the aim of further expanding its own product line of pharmaceuticals.
Intourist RUB bln 1Q’16 4Q’15 1Q’15 QoQ YoY
Revenue 0.5 0.6 0.5 -11.9% 5.2% OIBDA 0.04 0.1 -0.07 -68.3% n/a OIBDA margin 6.7% 18.2% n/a -11.5 p.p. n/a Net loss -0.07 -0.04 -0.1 n/a n/a Net debt 1.3 1.3 1.2 0.2% 6.5%
Rooms owned, rented and managed
2519 2501 2501
1Q'15 4Q'15 1Q'16
> Revenues increased YoY driven by growth of income from hotels outside Russia.
> QoQ decline in revenues and OIBDA was due to seasonal factors, as most conferences at the group’s hotels take place at the end of the calendar year.
> As of 31 March 2016, Intourist Group comprised 8 hotels in Russia, Italy, the Czech Republic and Namibia, with a total of 2,501 guest rooms.
> Revenues increased YoY mainly due to increase in non-voice revenues.
> SSTL was break even at OIBDA level in particular due to optimisation of expenses.
> Net debt decreased YoY and QoQ due to pre-payment of loans.
> SSTL’s high-speed data services now cover over 1,250 towns across 9 circles.

17
IR Department Tel. +7 (495) 692 22 88
www.sistema.ru


![FY2013 1Q Financial Results [PDF: 497KB]](https://img.dokumen.tips/doc/110x75/58a031621a28abd04d8bc560/fy2013-1q-financial-results-pdf-497kb.jpg)


