Embed Size (px)
Citation preview

Nustad and Bales–Sim
ulation of Conservative-Constituent Transport in the Red River of the North B
asin, North D
akota and M
innesota, 2003-04–Scientific Investigations Report 2005–5273
In cooperation with the Bureau of Reclamation
Simulation of Conservative-Constituent Transport in the Red River of the North Basin, North Dakota and Minnesota, 2003-04
Scientific Investigations Report 2005–5273
U.S. Department of the InteriorU.S. Geological SurveyPrinted on recycled paper
Otter Tail River
Bois de Sioux River
Near Cooperstown
At Lisbon
At Valley City
Lake Ashtabula
Above Harvey Near Warwick
Near Kindred
At Emerson
At Drayton
MANITOBACANADA
UNITED STATESMINNESOTANORTH DAKOTA
At Oslo
At Grand Forks
Near Thompson
At Halstad
At confluence with Sheyenne River
At Fargo
At Hickson
At Wahpeton
At North DakotaHighway 30near Maddock
Sand Hill River
Marsh River
Wild Rice River
Buffalo River
Turtle River
Forest River
Park River
Pembina River
Two Rivers
Snake River
Red Lake RiverAt PetersonCoulee
Below Baldhill Dam
Above Sheyenne Riverdiversion near Horace
At Brooktree Park
Into Lake Ashtabula
SHEYENN
E
RIVE
RO
FTH
EN
ORT
HRE
D
RIVER
Goose River
Wild Rice River
SCHEMATIC DIAGRAM
Simulation of Conservative-Constituent Transport in the Red River of the North Basin, North Dakota and Minnesota, 2003-04
By Rochelle A. Nustad and Jerad D. Bales
U.S. Department of the Interior U.S. Geological Survey
In cooperation with the Bureau of Reclamation
Scientific Investigations Report 2005–5273
par Inter No ry
olock L Dire
logi ston, V
.S. G rmation enve0225
rmat nd its pr-888-
Web: /
U.S. DeGale A.
U.S. GeP. Patri
U.S. Geo
For sale by UBox 25286, DDenver, CO 8
For more infoTelephone: 1World Wide
Any use of trade, endorsement by th
Although this reporeproduce any cop
tment of the rton, Secreta
gical Surveyeahy, Acting
cal Survey, Re
eological Survey, Infor Federal Center
ion about the USGS aASK-USGS http://www.usgs.gov
product, or firm names in this e U.S. Government.
rt is in the public domain, peryrighted materials contained
ior
ctor
irginia: 2005
Services
oducts:
publication is for descriptive purposes only and does not imply
mission must be secured from the individual copyright owners to within this report.
iii
Contents
Abstract. . . . . . . . . . . . . . . . . . . . . . . . . . . . . . . . . . . . . . . . . . . . . . . . . . . . . . . . . . . . . . . . . . . . . . . . . . . . . . . . . . . . . . . . . . . . . . . . . . . . . 1Introduction
PurposStudy A
Methods . . . Data-CWater-WithdrChannDescri
Streamflow aSimulation of
ModelCS
ModelSW
ModelModel
S
SModel LimitaSummary. . . References.
Figures
1. Ma2. Gra3. Gra
Oc4. Gra
Se5. Gra
caSe
. . . . . . . . . . . . . . . . . . . . . . . . . . . . . . . . . . . . . . . . . . . . . . . . . . . . . . . . . . . . . . . . . . . . . . . . . . . . . . . . . . . . . . . . . . . . . . . . . 1e and Scope . . . . . . . . . . . . . . . . . . . . . . . . . . . . . . . . . . . . . . . . . . . . . . . . . . . . . . . . . . . . . . . . . . . . . . . . . . . . . . . . . . . 2rea. . . . . . . . . . . . . . . . . . . . . . . . . . . . . . . . . . . . . . . . . . . . . . . . . . . . . . . . . . . . . . . . . . . . . . . . . . . . . . . . . . . . . . . . . . . . 2
. . . . . . . . . . . . . . . . . . . . . . . . . . . . . . . . . . . . . . . . . . . . . . . . . . . . . . . . . . . . . . . . . . . . . . . . . . . . . . . . . . . . . . . . . . . . . . . . . 3ollection Network. . . . . . . . . . . . . . . . . . . . . . . . . . . . . . . . . . . . . . . . . . . . . . . . . . . . . . . . . . . . . . . . . . . . . . . . . . . . . . 3Quality Sample Collection and Analysis. . . . . . . . . . . . . . . . . . . . . . . . . . . . . . . . . . . . . . . . . . . . . . . . . . . . . . . . . 3awal and Return-Flow Data . . . . . . . . . . . . . . . . . . . . . . . . . . . . . . . . . . . . . . . . . . . . . . . . . . . . . . . . . . . . . . . . . . . . 3el-Geometry Data . . . . . . . . . . . . . . . . . . . . . . . . . . . . . . . . . . . . . . . . . . . . . . . . . . . . . . . . . . . . . . . . . . . . . . . . . . . . . . 3ption of HEC-5 and HEC-5Q Models. . . . . . . . . . . . . . . . . . . . . . . . . . . . . . . . . . . . . . . . . . . . . . . . . . . . . . . . . . . . . 7nd Water-Quality Conditions. . . . . . . . . . . . . . . . . . . . . . . . . . . . . . . . . . . . . . . . . . . . . . . . . . . . . . . . . . . . . . . . . . . 7 Conservative-Constituent Transport . . . . . . . . . . . . . . . . . . . . . . . . . . . . . . . . . . . . . . . . . . . . . . . . . . . . . . . . . . 14 Implementation . . . . . . . . . . . . . . . . . . . . . . . . . . . . . . . . . . . . . . . . . . . . . . . . . . . . . . . . . . . . . . . . . . . . . . . . . . . . . . . 14omputational Grid . . . . . . . . . . . . . . . . . . . . . . . . . . . . . . . . . . . . . . . . . . . . . . . . . . . . . . . . . . . . . . . . . . . . . . . . . . . . . 14treamflow and Water-Quality Boundary Conditions. . . . . . . . . . . . . . . . . . . . . . . . . . . . . . . . . . . . . . . . . . . . 14 Calibration . . . . . . . . . . . . . . . . . . . . . . . . . . . . . . . . . . . . . . . . . . . . . . . . . . . . . . . . . . . . . . . . . . . . . . . . . . . . . . . . . . . . 21treamflow. . . . . . . . . . . . . . . . . . . . . . . . . . . . . . . . . . . . . . . . . . . . . . . . . . . . . . . . . . . . . . . . . . . . . . . . . . . . . . . . . . . . . 21ater Quality. . . . . . . . . . . . . . . . . . . . . . . . . . . . . . . . . . . . . . . . . . . . . . . . . . . . . . . . . . . . . . . . . . . . . . . . . . . . . . . . . . . 21
Performance Testing. . . . . . . . . . . . . . . . . . . . . . . . . . . . . . . . . . . . . . . . . . . . . . . . . . . . . . . . . . . . . . . . . . . . . . . . . . 23 Applications . . . . . . . . . . . . . . . . . . . . . . . . . . . . . . . . . . . . . . . . . . . . . . . . . . . . . . . . . . . . . . . . . . . . . . . . . . . . . . . . . . 24imulations with September 2003 Streamflows . . . . . . . . . . . . . . . . . . . . . . . . . . . . . . . . . . . . . . . . . . . . . . . . . 24
Total Dissolved Solids . . . . . . . . . . . . . . . . . . . . . . . . . . . . . . . . . . . . . . . . . . . . . . . . . . . . . . . . . . . . . . . . . . . . . 24Sulfate. . . . . . . . . . . . . . . . . . . . . . . . . . . . . . . . . . . . . . . . . . . . . . . . . . . . . . . . . . . . . . . . . . . . . . . . . . . . . . . . . . . . 29Chloride. . . . . . . . . . . . . . . . . . . . . . . . . . . . . . . . . . . . . . . . . . . . . . . . . . . . . . . . . . . . . . . . . . . . . . . . . . . . . . . . . . . 29Uncertainty of Simulation Results . . . . . . . . . . . . . . . . . . . . . . . . . . . . . . . . . . . . . . . . . . . . . . . . . . . . . . . . . 29
imulations with Reduced Streamflows . . . . . . . . . . . . . . . . . . . . . . . . . . . . . . . . . . . . . . . . . . . . . . . . . . . . . . . . 29tions . . . . . . . . . . . . . . . . . . . . . . . . . . . . . . . . . . . . . . . . . . . . . . . . . . . . . . . . . . . . . . . . . . . . . . . . . . . . . . . . . . . . . . . . . . 31. . . . . . . . . . . . . . . . . . . . . . . . . . . . . . . . . . . . . . . . . . . . . . . . . . . . . . . . . . . . . . . . . . . . . . . . . . . . . . . . . . . . . . . . . . . . . . . . 31
. . . . . . . . . . . . . . . . . . . . . . . . . . . . . . . . . . . . . . . . . . . . . . . . . . . . . . . . . . . . . . . . . . . . . . . . . . . . . . . . . . . . . . . . . . . . . . . . 36p showing locations of sites used in study. . . . . . . . . . . . . . . . . . . . . . . . . . . . . . . . . . . . . . . . . . . . . . . . . . . . . .39ph showing streamflows and flow duration curves for selected sites. . . . . . . . . . . . . . . . . . . . . . . . . . 40phs showing streamflows for selected sites for August 15 through
tober 31, 2003, and April 15 through June 30, 2004 . . . . . . . . . . . . . . . . . . . . . . . . . . . . . . . . . . . . . . . . . . . . . . 41phs showing measured total dissolved-solids concentrations for
ptember 2003 and May 2004 sampling periods . . . . . . . . . . . . . . . . . . . . . . . . . . . . . . . . . . . . . . . . . . . . . . . . . 43phs showing measured calcium, magnesium, sodium, bicarbonate,
rbonate, sulfate, and chloride concentrations for selected sites for ptember 2003 and May 2004 sampling periods . . . . . . . . . . . . . . . . . . . . . . . . . . . . . . . . . . . . . . . . . . . . . . . . . 46
iv
Figures, Continued
6. Graphs showing measured nitrite plus nitrate as nitrogen, ammonia as nitrogen, and organic nitrogen concentrations for selected sites for September 2003 and May 2004 sampling periods . . . . . . . . . . . . . . . . . . . . . . . . . . . . . . . . . . . . . . . . . . . . . . . . . . . . . . . . . . . . . 48
7. Graph showing measured total phosphorus concentrations for selected sites for September 2003 and May 2004 sampling periods . . . . . . . . . . . . . . . . . . . . . . . . . . . . . . . . . . . . . . . . . . . . . . 50
8. Diagram showing schematic of Red River water-quality model . . . . . . . . . . . . . . . . . . . . . . . . . . . . . . . . . . . .519. Graphs showing measured and simulated streamflows for selected
Red River water-quality model control points for September 15, 2003. . . . . . . . . . . . . . . . . . . . . . . . . . . . . . 5210. Graphs showing measured and simulated total dissolved-solids
concentrations for Red River water-quality model calibration points for September 15, 2003. . . . . . . . . . . . . . . . . . . . . . . . . . . . . . . . . . . . . . . . . . . . . . . . . . . . . . . . . . . . . . . . . . . . . . . . . . . . . . . 54
11. Graphs showing measured and simulated sulfate concentrations for Red River water-quality model calibration points for September 15, 2003 . . . . . . . . . . . . . . . . . . . . . . . . . . 56
12. Graphs showing measured and simulated chloride concentrations for Red River water-quality model calibration points for September 15, 2003 . . . . . . . . . . . . . . . . . . . . . . . . . . 58
13. Graphs showing measured and simulated streamflows for selected Red River water-quality model control points for May 10, 2004. . . . . . . . . . . . . . . . . . . . . . . . . . . . . . . . . . . . . 60
14. Graphs showing measured and simulated total dissolved-solids concentrations for Red River water-quality model calibration points for May 10, 2004. . . . . . . . . . . . . . . . . . . . . . . . . . . . . . . . . . . . . . . . . . . . . . . . . . . . . . . . . . . . . . . . . . . . . . . . . . . . . . . . . . . . . . 62
15. Graphs showing measured and simulated sulfate concentrations for Red River water-quality model calibration points for May 10, 2004. . . . . . . . . . . . . . . . . . . . . . . . . . . . . . . . . 64
16. Graphs showing measured and simulated chloride concentrations for Red River water-quality model calibration points for May 10, 2004. . . . . . . . . . . . . . . . . . . . . . . . . . . . . . . . . 66
17. Graphs showing simulated streamflows for water-supply alternatives for the Red River of the North and the Sheyenne River for September 15, 2003. . . . . . . . . . . . . . . . . . . . . . . . 68
18. Graphs showing simulated total dissolved-solids concentrations for water- supply alternatives for the Red River of the North and the Sheyenne River for September 15, 2003. . . . . . . . . . . . . . . . . . . . . . . . . . . . . . . . . . . . . . . . . . . . . . . . . . . . . . . . . . . . . . . . . . . . . . . . . . . . . . . 70
19. Graphs showing simulated sulfate concentrations for water-supply alternatives for the Red River of the North and the Sheyenne River for September 15, 2003. . . . . . . . . . . . . . . . . . . . . . . . . . . . . . . . . . . . . . . . . . . . . . . . . . . . . . . . . . . . . . . . . . . . . . . . . . . . . . . 74
20. Graphs showing simulated chloride concentrations for water-supply alternatives for the Red River of the North and the Sheyenne River for September 15, 2003. . . . . . . . . . . . . . . . . . . . . . . . . . . . . . . . . . . . . . . . . . . . . . . . . . . . . . . . . . . . . . . . . . . . . . . . . . . . . . . 78
Tables
1. Data-collection network. . . . . . . . . . . . . . . . . . . . . . . . . . . . . . . . . . . . . . . . . . . . . . . . . . . . . . . . . . . . . . . . . . . . . . . . . . . .42. Water-quality properties and constituents for which samples were
analyzed. . . . . . . . . . . . . . . . . . . . . . . . . . . . . . . . . . . . . . . . . . . . . . . . . . . . . . . . . . . . . . . . . . . . . . . . . . . . . . . . . . . . . . . . . . . .53. Withdrawals from and return flows to the Red River of the North at Fargo,
North Dakota, Grand Forks, North Dakota, and Moorhead, Minnesota, during September 2003 and May 2004 . . . . . . . . . . . . . . . . . . . . . . . . . . . . . . . . . . . . . . . . . . . . . . . . . . . . . . . . . . . . . .6
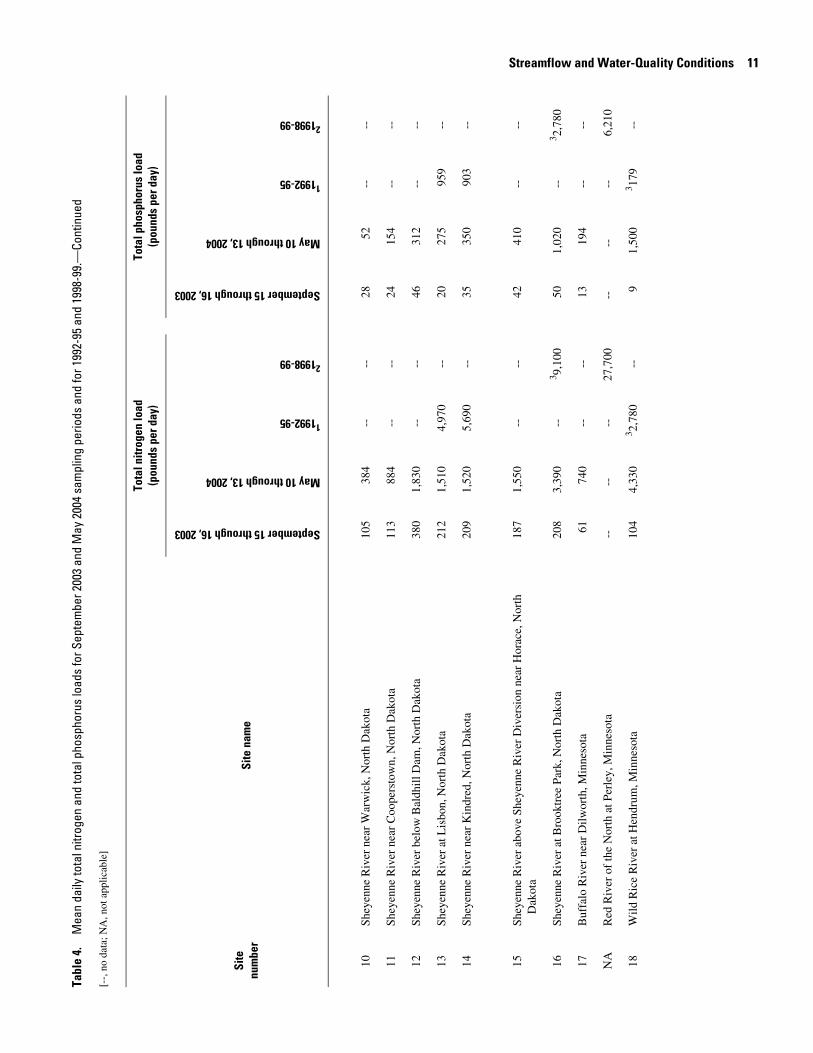
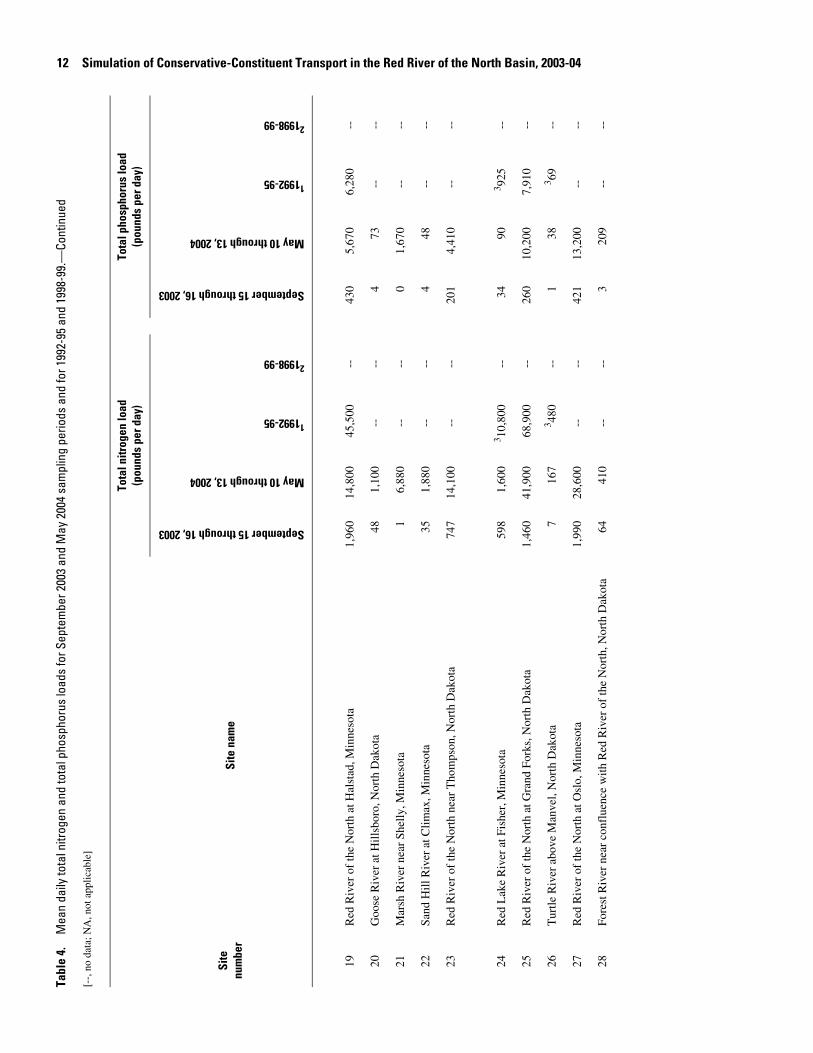
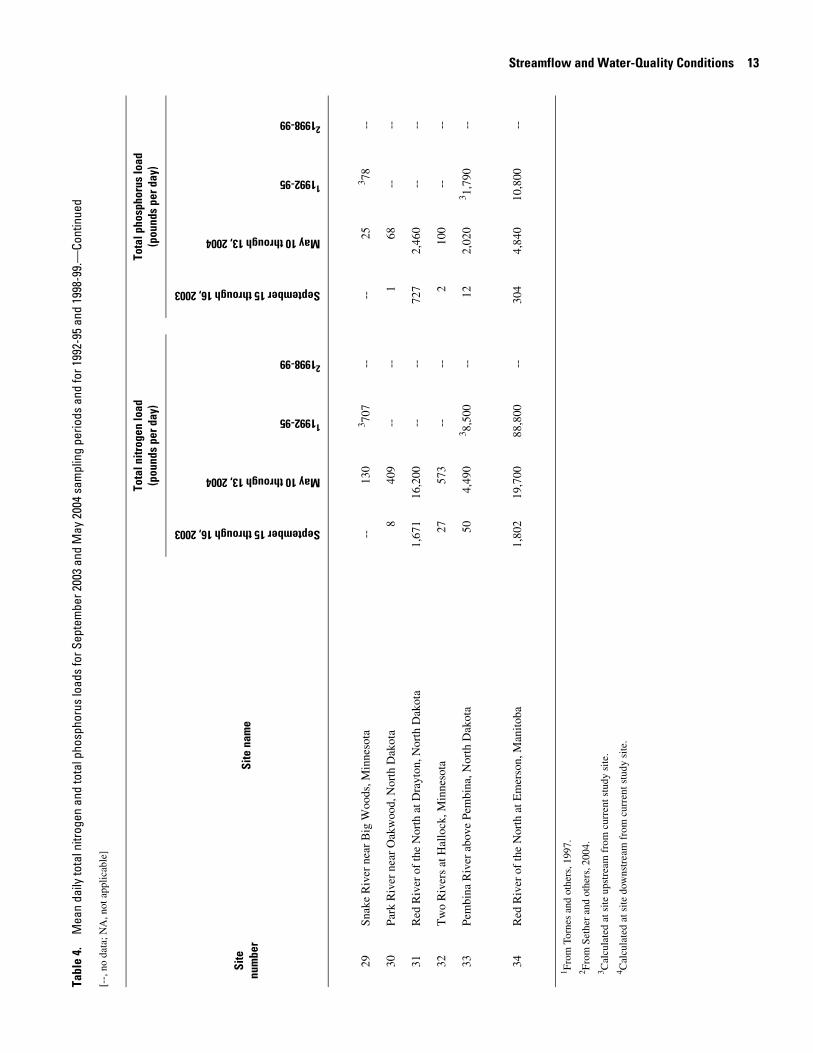
4. Mean daily total nitrogen and total phosphorus loads for September 2003 and May 2004 sampling periods and for 1992-95 and 1998-99. . . . . . . . . . . . . . . . . . . . . . . . . . . . . . . . . . . . . . 10
5. Streamflow boundary conditions for September 2003 sampling period. . . . . . . . . . . . . . . . . . . . . . . . . . . . .15
v
Tables, Continued
6. Streamflow boundary conditions for May 2004 sampling period. . . . . . . . . . . . . . . . . . . . . . . . . . . . . . . . . . . .177. Water-quality boundary conditions for September 2003 and May 2004
sam8. Mo
tra9. Me
betsul
10. DePro
11. Prototalte
12. Mebet(th
13. Re14. Ab
bestr
15. Abbetan
16. Abbean
pling periods . . . . . . . . . . . . . . . . . . . . . . . . . . . . . . . . . . . . . . . . . . . . . . . . . . . . . . . . . . . . . . . . . . . . . . . . . . . . . . . . . 19del calibration points used for simulation of conservative-constituent
nsport in the Red River of the North Basin. . . . . . . . . . . . . . . . . . . . . . . . . . . . . . . . . . . . . . . . . . . . . . . . . . . . . . 22an calibration errors and maximum and minimum absolute differences ween measured (September 2003) and simulated total dissolved-solids, fate, and chloride concentrations. . . . . . . . . . . . . . . . . . . . . . . . . . . . . . . . . . . . . . . . . . . . . . . . . . . . . . . . . . . . . . 23scription of water-supply alternatives for Red River Valley Water Supply ject . . . . . . . . . . . . . . . . . . . . . . . . . . . . . . . . . . . . . . . . . . . . . . . . . . . . . . . . . . . . . . . . . . . . . . . . . . . . . . . . . . . . . . . . . . . 25jected return flows, imported flows, and withdrawals and estimated
al dissolved-solids, sulfate, and chloride concentrations for water-supply rnatives. . . . . . . . . . . . . . . . . . . . . . . . . . . . . . . . . . . . . . . . . . . . . . . . . . . . . . . . . . . . . . . . . . . . . . . . . . . . . . . . . . . . . . . 26an simulated concentrations for water-supply alternatives and difference ween concentration for alternative and concentration for alternative 1 e no-action alternative) . . . . . . . . . . . . . . . . . . . . . . . . . . . . . . . . . . . . . . . . . . . . . . . . . . . . . . . . . . . . . . . . . . . . . . . . 30duced streamflows used in Red River water-quality model. . . . . . . . . . . . . . . . . . . . . . . . . . . . . . . . . . . . . 32solute mean differences and maximum and minimum absolute differences tween total dissolved-solids concentrations simulated with September 2003 eamflows and those simulated with reduced streamflows . . . . . . . . . . . . . . . . . . . . . . . . . . . . . . . . . . . . . 33solute mean differences and maximum and minimum absolute differences ween sulfate concentrations simulated with September 2003 streamflows
d those simulated with reduced streamflows. . . . . . . . . . . . . . . . . . . . . . . . . . . . . . . . . . . . . . . . . . . . . . . . . . . 34solute mean differences and maximum and minimum absolute differences tween chloride concentrations simulated with September 2003 streamflows d those simulated with reduced streamflows. . . . . . . . . . . . . . . . . . . . . . . . . . . . . . . . . . . . . . . . . . . . . . . . . . . .35
vi
Conversion Factors and Datum
Multiply By To obtain
Length
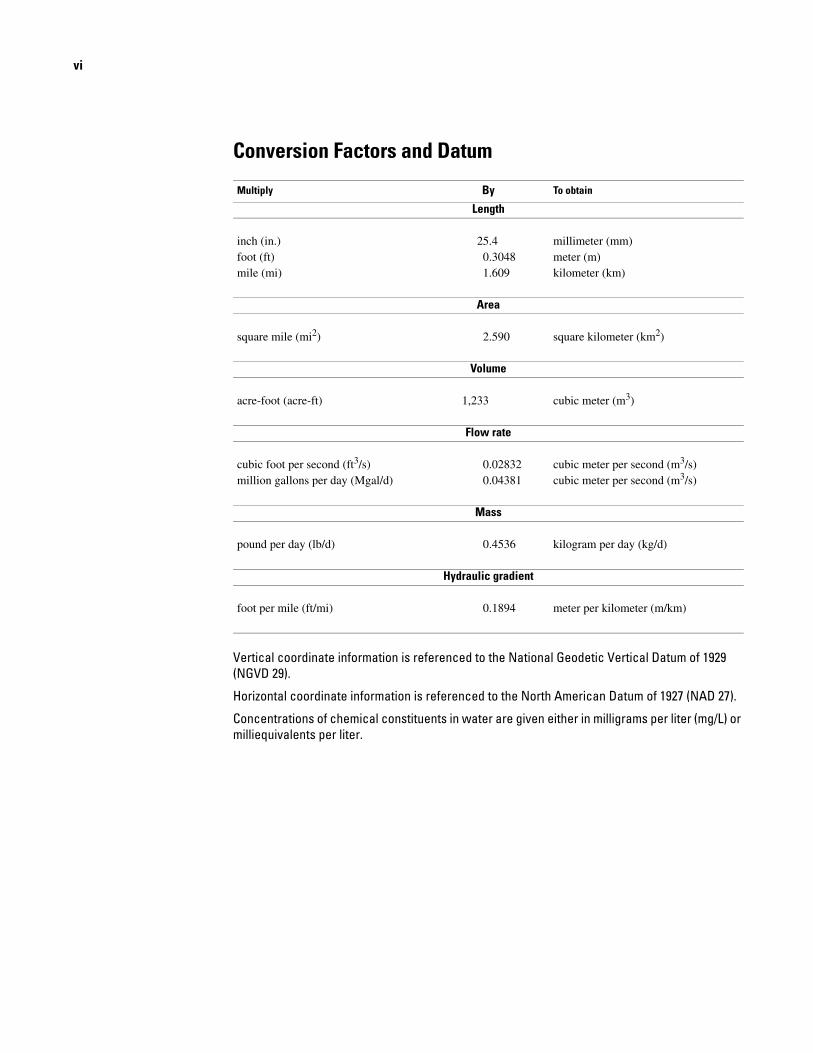
inch (in.) 25.4 millimeter (mm)foot (ft) 0.3048 meter (m)mile (mi) 1.609 kilometer (km)
Area
square mile (mi2) 2.590 square kilometer (km2)
Volume
acre-foot (acre-ft) 1,233 cubic meter (m3)
Flow rate
cubic foot per second (ft3/s) 0.02832 cubic meter per second (m3/s)million gallons per day (Mgal/d) 0.04381 cubic meter per second (m3/s)
Mass
pound per day (lb/d) 0.4536 kilogram per day (kg/d)
Hydraulic gradient
Vertical coordinate information is referenced to the National Geodetic Vertical Datum of 1929 (NGVD 29).
Horizontal coordinate information is referenced to the North American Datum of 1927 (NAD 27).
Concentrations of chemical constituents in water are given either in milligrams per liter (mg/L) or milliequivalents per liter.
foot per mile (ft/mi) 0.1894 meter per kilometer (m/km)
Simu rvin the eand M -0
By Roche ale
Abstrac
Popula futurthe Red Riv n wiincreasing n hereresult of the 200of Reclama alte(including a ure wthe basin. B siblealternatives andRiver and in ureation needs t ct stdescribes th f eaTo provide impthe U.S. Ge ith Reclamatio nd aquality mod ed quality mod e Shto simulate t in Basin. The a onsional, stea for stituents in Rivesimulates th olvefate, and ch ons.model domthe Bois deEmerson, Mvey, N. Dak
The Rtested usingthrough 16,quality samtions from Sunsteady-flsimulated ttrations gencentrations
lation of Conse Red River of thinnesota, 2003
lle A. Nustad and Jerad D. B
t
tion growth along with possible er of the North (Red River) Basieed for reliable water supplies. T Dakota Water Resources Act oftion identified eight water-supply no-action alternative) to meet futecause of concerns about the pos on water quality in the Red River Lake Winnipeg, Manitoba, the Bo prepare an environmental impae specific environmental effects oinformation for the environmentalological Survey, in cooperation wn, conducted a study to develop ael, hereinafter referred to as the Rel, to part of the Red River and th
conservative-constituent transporRed River water-quality model isdy-state flow and transport modelthe Red River and the Sheyenne e flow and transport of total dissloride during steady-state conditi
ain includes the Red River from the c Sioux and Otter Tail Rivers to the Reanitoba, and the Sheyenne River from., to the confluence with the Red Rived River water-quality model was cal data collected at 34 sites from Septe 2003, and from May 10 through 13, ples were collected during low, steadeptember 15 through 16, 2003, and du
ow conditions from May 10 through 1otal dissolved-solids, sulfate, and chloerally were within 5 percent of the m
.
ative-Constituent Transport North Basin, North Dakota 4
s
e droughts in ll create an fore, as a
0, the Bureau rnatives ater needs in
effects of the the Sheyenne u of Reclama-atement that ch alternative. act statement, the Bureau of pply a water-River water-eyenne River
the Red River e-dimen-selected con-r. The model d solids, sul- The physical
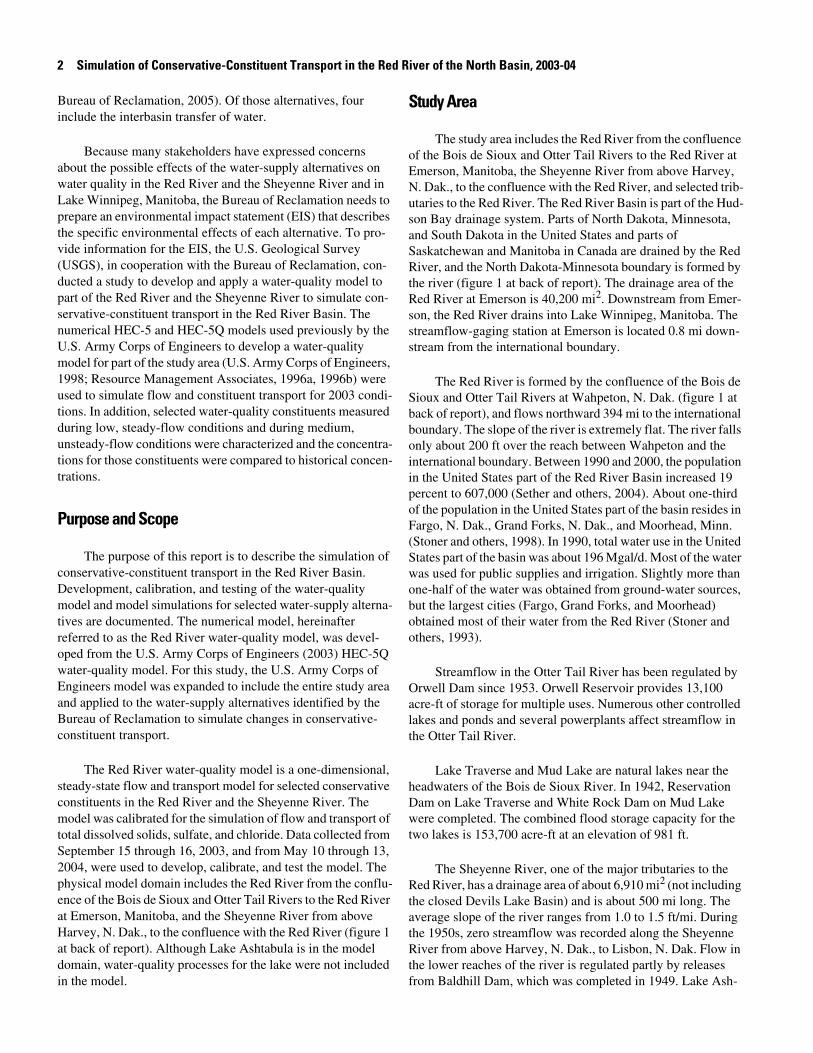
The Red River water-quality model was used to simulate conservative-constituent transport in the Red River and the Sheyenne River for the eight water-supply alternatives identi-fied by the Bureau of Reclamation. For the first set of eight sim-ulations, September 2003 streamflows were used with projected 2050 return flows and withdrawals. For the second set of eight simulations, the September 2003 streamflows were reduced by 25 percent. The simulated concentrations for three of the alter-natives generally were lower than for the no-action alternative. Of those alternatives, one would result in a decrease in concen-trations for two constituents, one would result in a decrease in concentrations for all three constituents, and one would result in a decrease in concentrations for one constituent and an increase in concentrations for another constituent. For four of the alter-natives, the differences between the mean simulated concentra-tions were less than calibration errors, indicating the effects of those alternatives on water quality in the rivers is uncertain. The effects of reduced streamflow on simulated total dissolved-sol-ids, sulfate, and chloride concentrations were greatest for alter-native 2. Reduced streamflow probably has an effect on simu-lated total dissolved-solids concentrations for alternatives 2, 3, 5, and 7 and on simulated sulfate concentrations for alternatives 2 and 5. Except for alternative 2, reduced streamflow had little effect on simulated chloride concentrations.
onfluence of d River at above Har-
er.
ibrated and mber 15 2004. Water-y-flow condi-ring medium, 3, 2004. The ride concen-easured con-
Introduction
Population growth along with possible future droughts in the Red River of the North (Red River) Basin (figure 1 at back of report) in North Dakota, Minnesota, and South Dakota will create an increasing need for reliable water supplies. Therefore, the Dakota Water Resources Act passed by the U.S. Congress on December 15, 2000, authorized the Secretary of the Interior to conduct a comprehensive study of the future water needs in the basin in North Dakota and of possible options to meet those water needs. As part of the comprehensive study, the Bureau of Reclamation identified eight water-supply alternatives (includ-ing a no-action alternative) for the Red River Valley Water Sup-ply Project (RRVWSP) (U.S. Department of the Interior,
2 S
Bureainclu
aboutwaterLakeprepathe spvide i(USGductepart oservanumeU.S. mode1998used tions.durinunstetions tratio
Purp
conseDevemodetives referroped waterEnginand aBureaconst
steadconstmodetotal dSepte2004physience at EmHarvat bacdomain the
imulation of Conservative-Constituent Transport in the Red River of the North Basin, 2003-04
u of Reclamation, 2005). Of those alternatives, four de the interbasin transfer of water.
Because many stakeholders have expressed concerns the possible effects of the water-supply alternatives on quality in the Red River and the Sheyenne River and in Winnipeg, Manitoba, the Bureau of Reclamation needs to re an environmental impact statement (EIS) that describes ecific environmental effects of each alternative. To pro-nformation for the EIS, the U.S. Geological Survey S), in cooperation with the Bureau of Reclamation, con-d a study to develop and apply a water-quality model to f the Red River and the Sheyenne River to simulate con-tive-constituent transport in the Red River Basin. The rical HEC-5 and HEC-5Q models used previously by the Army Corps of Engineers to develop a water-quality l for part of the study area (U.S. Army Corps of Engineers, ; Resource Management Associates, 1996a, 1996b) were to simulate flow and constituent transport for 2003 condi- In addition, selected water-quality constituents measured g low, steady-flow conditions and during medium, ady-flow conditions were characterized and the concentra-for those constituents were compared to historical concen-ns.
ose and Scope
The purpose of this report is to describe the simulation of rvative-constituent transport in the Red River Basin. lopment, calibration, and testing of the water-quality l and model simulations for selected water-supply alterna-are documented. The numerical model, hereinafter ed to as the Red River water-quality model, was devel-from the U.S. Army Corps of Engineers (2003) HEC-5Q -quality model. For this study, the U.S. Army Corps of eers model was expanded to include the entire study area
pplied to the water-supply alternatives identified by the u of Reclamation to simulate changes in conservative-
ituent transport.
Study Area
The study area includes the Red River from the confluence of the Bois de Sioux and Otter Tail Rivers to the Red River at Emerson, Manitoba, the Sheyenne River from above Harvey, N. Dak., to the confluence with the Red River, and selected trib-utaries to the Red River. The Red River Basin is part of the Hud-son Bay drainage system. Parts of North Dakota, Minnesota, and South Dakota in the United States and parts of Saskatchewan and Manitoba in Canada are drained by the Red River, and the North Dakota-Minnesota boundary is formed by the river (figure 1 at back of report). The drainage area of the Red River at Emerson is 40,200 mi2. Downstream from Emer-son, the Red River drains into Lake Winnipeg, Manitoba. The streamflow-gaging station at Emerson is located 0.8 mi down-stream from the international boundary.
The Red River is formed by the confluence of the Bois de Sioux and Otter Tail Rivers at Wahpeton, N. Dak. (figure 1 at back of report), and flows northward 394 mi to the international boundary. The slope of the river is extremely flat. The river falls only about 200 ft over the reach between Wahpeton and the international boundary. Between 1990 and 2000, the population in the United States part of the Red River Basin increased 19 percent to 607,000 (Sether and others, 2004). About one-third of the population in the United States part of the basin resides in Fargo, N. Dak., Grand Forks, N. Dak., and Moorhead, Minn. (Stoner and others, 1998). In 1990, total water use in the United States part of the basin was about 196 Mgal/d. Most of the water was used for public supplies and irrigation. Slightly more than one-half of the water was obtained from ground-water sources, but the largest cities (Fargo, Grand Forks, and Moorhead) obtained most of their water from the Red River (Stoner and others, 1993).
Streamflow in the Otter Tail River has been regulated by Orwell Dam since 1953. Orwell Reservoir provides 13,100 acre-ft of storage for multiple uses. Numerous other controlled lakes and ponds and several powerplants affect streamflow in the Otter Tail River.
The Red River water-quality model is a one-dimensional, y-state flow and transport model for selected conservative ituents in the Red River and the Sheyenne River. The l was calibrated for the simulation of flow and transport of issolved solids, sulfate, and chloride. Data collected from
mber 15 through 16, 2003, and from May 10 through 13, , were used to develop, calibrate, and test the model. The cal model domain includes the Red River from the conflu-of the Bois de Sioux and Otter Tail Rivers to the Red River erson, Manitoba, and the Sheyenne River from above
ey, N. Dak., to the confluence with the Red River (figure 1 k of report). Although Lake Ashtabula is in the model in, water-quality processes for the lake were not included model.
Lake Traverse and Mud Lake are natural lakes near the headwaters of the Bois de Sioux River. In 1942, Reservation Dam on Lake Traverse and White Rock Dam on Mud Lake were completed. The combined flood storage capacity for the two lakes is 153,700 acre-ft at an elevation of 981 ft.
The Sheyenne River, one of the major tributaries to the Red River, has a drainage area of about 6,910 mi2 (not including the closed Devils Lake Basin) and is about 500 mi long. The average slope of the river ranges from 1.0 to 1.5 ft/mi. During the 1950s, zero streamflow was recorded along the Sheyenne River from above Harvey, N. Dak., to Lisbon, N. Dak. Flow in the lower reaches of the river is regulated partly by releases from Baldhill Dam, which was completed in 1949. Lake Ash-
tab69noimLasu
anitsRiaqchlanHama
M
waetrmaincanmeWodFimoen
Da
Ri(talocremRiRiShgatar
W
floing13sitwe
Methods 3
ula, which is formed by Baldhill Dam, has a capacity of ,100 acre-ft between the invert of the outlet conduit and the rmal pool elevation and a capacity of 157,500 acre-ft at max-um pool elevation (U.S. Army Corps of Engineers, 2003). ke Ashtabula is operated for flood control, municipal water pply, recreation, and stream-pollution abatement.
Ground water in the Red River Basin is primarily in sand d gravel aquifers near land surface or in buried glacial depos- throughout the basin. Ground water moves toward the Red ver through a regional system of bedrock and glacial-drift uifers (Sether and others, 2004). Saline ground-water dis-arge from the bedrock aquifers is known to collect in wet-ds that drain into tributaries of the Red River (Strobel and ffield, 1995). The Turtle, Forest, and Park Rivers are the jor contributors of salinity to the Red River.
ethods
The Red River water-quality model requires streamflow, ter-quality, withdrawal and return-flow, and channel-geom-y data. Methods used to collect or compile the data are sum-rized in this section. The data-collection network, which luded locations where water-quality samples were collected
d streamflow measurements were made, is presented, and thods used to collect water-quality samples are described.
ithdrawal and return-flow data used for the model and meth-s used to estimate channel-geometry data are described. nally, a brief overview is given of the HEC-5 and HEC-5Q dels, which were used to simulate streamflow and constitu-
t transport, respectively, in the study area.
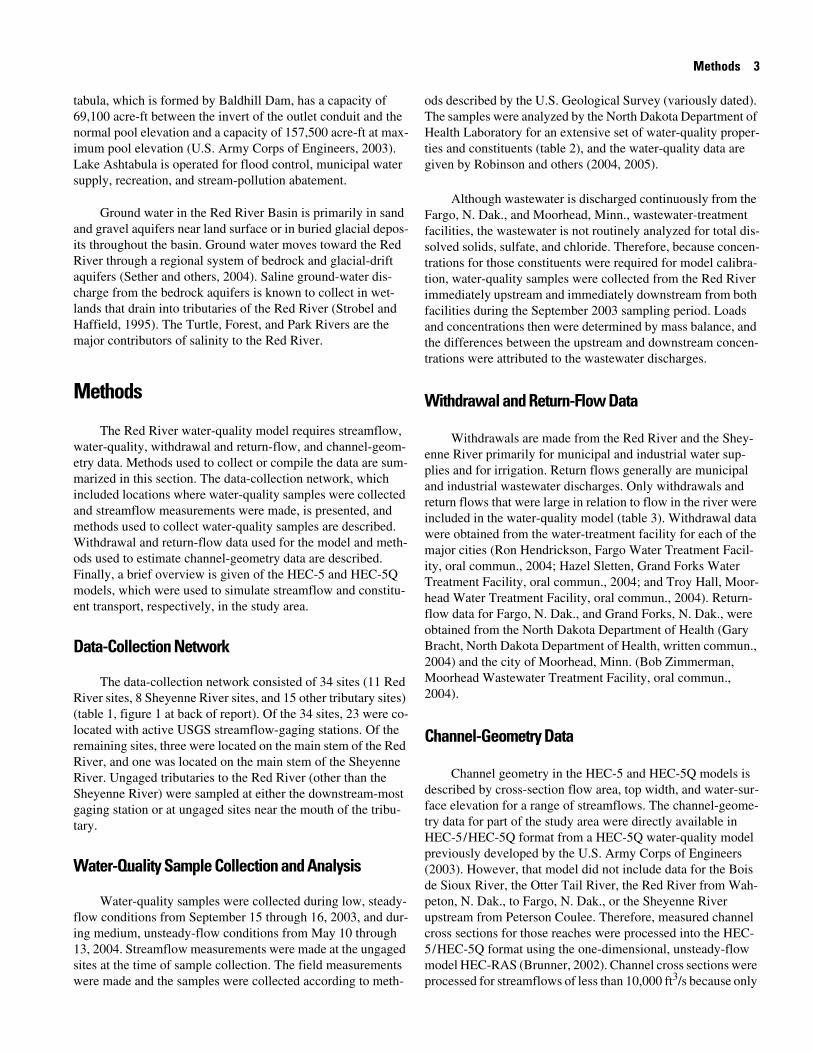
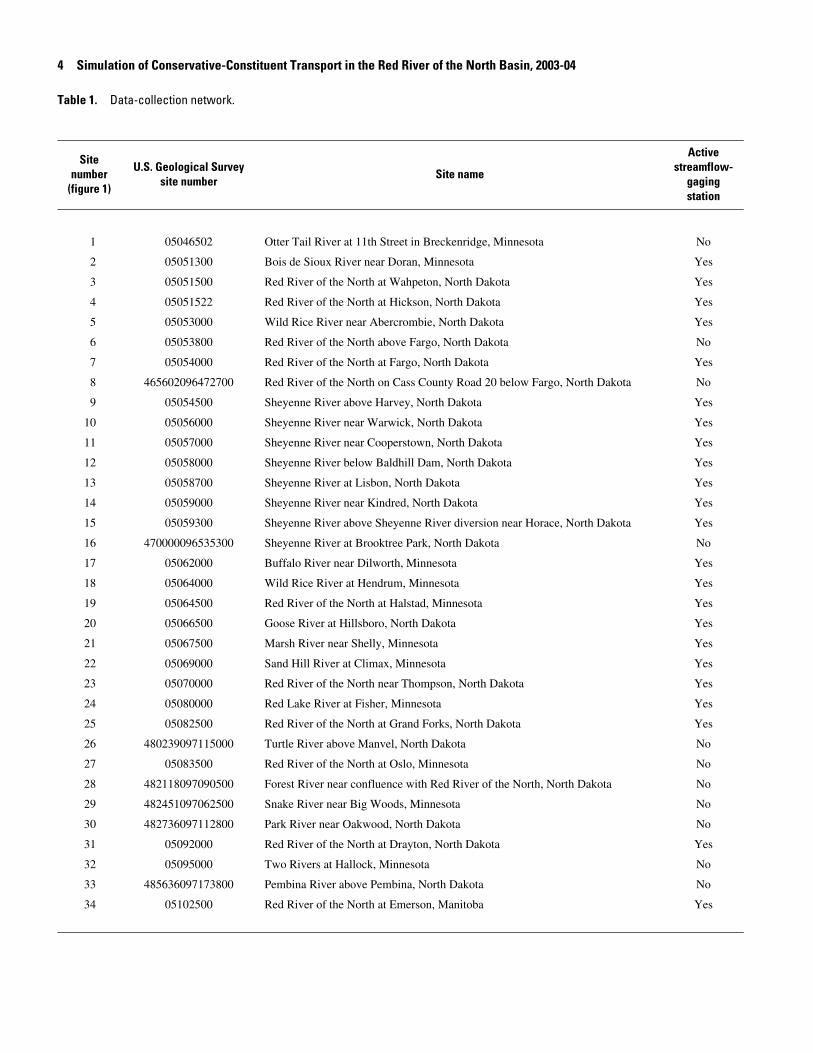
ta-Collection Network
The data-collection network consisted of 34 sites (11 Red ver sites, 8 Sheyenne River sites, and 15 other tributary sites) ble 1, figure 1 at back of report). Of the 34 sites, 23 were co-ated with active USGS streamflow-gaging stations. Of the aining sites, three were located on the main stem of the Red
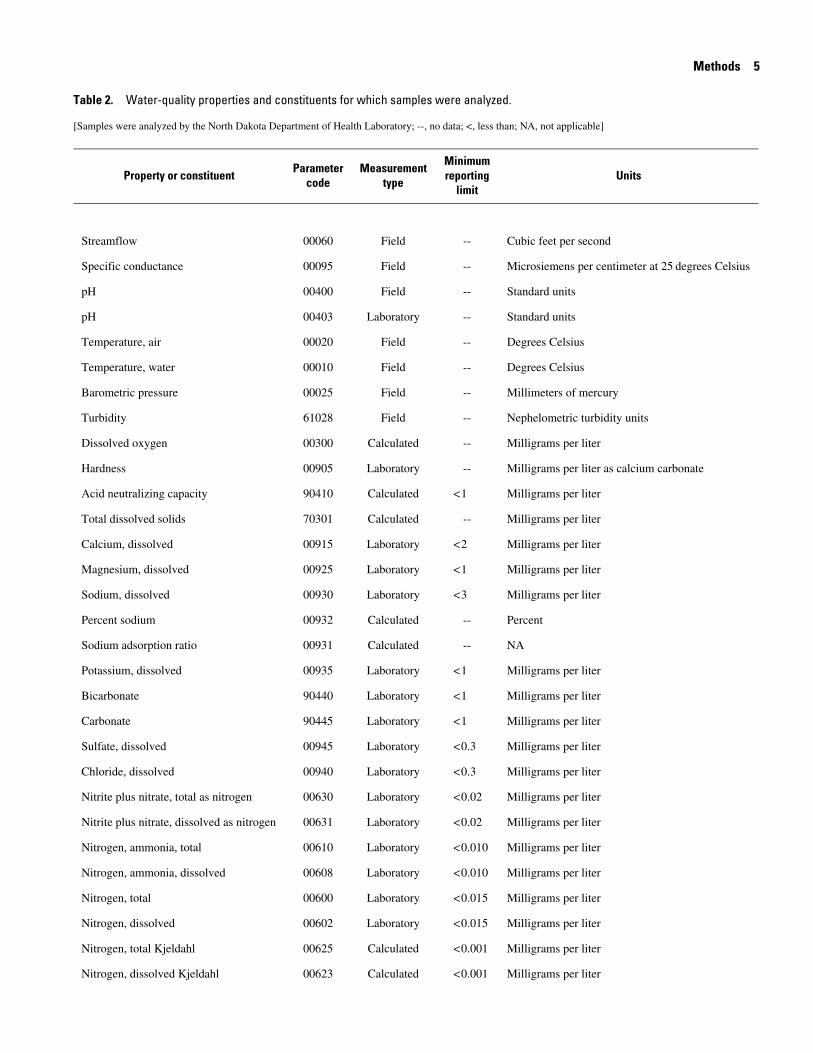
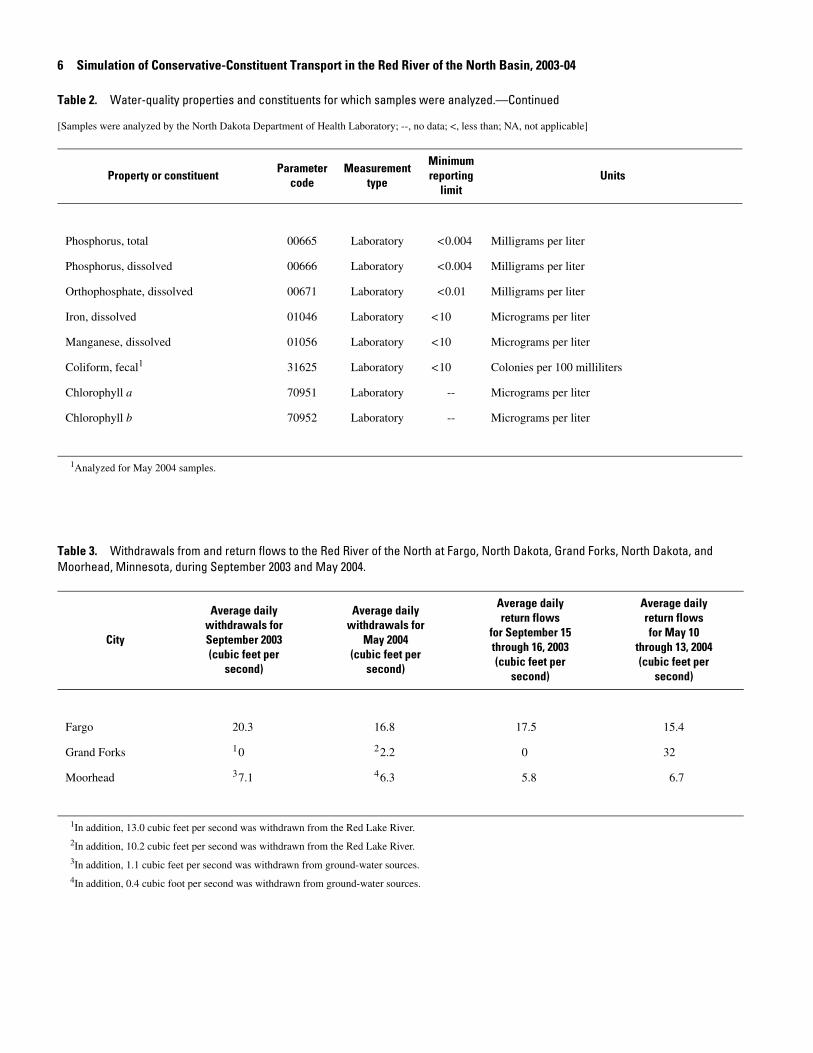
ods described by the U.S. Geological Survey (variously dated). The samples were analyzed by the North Dakota Department of Health Laboratory for an extensive set of water-quality proper-ties and constituents (table 2), and the water-quality data are given by Robinson and others (2004, 2005).
Although wastewater is discharged continuously from the Fargo, N. Dak., and Moorhead, Minn., wastewater-treatment facilities, the wastewater is not routinely analyzed for total dis-solved solids, sulfate, and chloride. Therefore, because concen-trations for those constituents were required for model calibra-tion, water-quality samples were collected from the Red River immediately upstream and immediately downstream from both facilities during the September 2003 sampling period. Loads and concentrations then were determined by mass balance, and the differences between the upstream and downstream concen-trations were attributed to the wastewater discharges.
Withdrawal and Return-Flow Data
Withdrawals are made from the Red River and the Shey-enne River primarily for municipal and industrial water sup-plies and for irrigation. Return flows generally are municipal and industrial wastewater discharges. Only withdrawals and return flows that were large in relation to flow in the river were included in the water-quality model (table 3). Withdrawal data were obtained from the water-treatment facility for each of the major cities (Ron Hendrickson, Fargo Water Treatment Facil-ity, oral commun., 2004; Hazel Sletten, Grand Forks Water Treatment Facility, oral commun., 2004; and Troy Hall, Moor-head Water Treatment Facility, oral commun., 2004). Return-flow data for Fargo, N. Dak., and Grand Forks, N. Dak., were obtained from the North Dakota Department of Health (Gary Bracht, North Dakota Department of Health, written commun., 2004) and the city of Moorhead, Minn. (Bob Zimmerman, Moorhead Wastewater Treatment Facility, oral commun., 2004).
Channel-Geometry Data
ver, and one was located on the main stem of the Sheyenne ver. Ungaged tributaries to the Red River (other than the eyenne River) were sampled at either the downstream-most ging station or at ungaged sites near the mouth of the tribu-y.ater-Quality Sample Collection and Analysis
Water-quality samples were collected during low, steady-w conditions from September 15 through 16, 2003, and dur- medium, unsteady-flow conditions from May 10 through
, 2004. Streamflow measurements were made at the ungaged es at the time of sample collection. The field measurements re made and the samples were collected according to meth-
Channel geometry in the HEC-5 and HEC-5Q models is described by cross-section flow area, top width, and water-sur-face elevation for a range of streamflows. The channel-geome-try data for part of the study area were directly available in HEC-5 / HEC-5Q format from a HEC-5Q water-quality model previously developed by the U.S. Army Corps of Engineers (2003). However, that model did not include data for the Bois de Sioux River, the Otter Tail River, the Red River from Wah-peton, N. Dak., to Fargo, N. Dak., or the Sheyenne River upstream from Peterson Coulee. Therefore, measured channel cross sections for those reaches were processed into the HEC-5 / HEC-5Q format using the one-dimensional, unsteady-flow model HEC-RAS (Brunner, 2002). Channel cross sections were processed for streamflows of less than 10,000 ft3/s because only
4 S
Table
Snum
(figu
imulation of Conservative-Constituent Transport in the Red River of the North Basin, 2003-04
1. Data-collection network.
iteberre 1)
U.S. Geological Surveysite number
Site name
Activestreamflow-
gagingstation
1 05046502 Otter Tail River at 11th Street in Breckenridge, Minnesota No
2 05051300 Bois de Sioux River near Doran, Minnesota Yes
3 05051500 Red River of the North at Wahpeton, North Dakota Yes
4 05051522 Red River of the North at Hickson, North Dakota Yes
5 05053000 Wild Rice River near Abercrombie, North Dakota Yes
6 05053800 Red River of the North above Fargo, North Dakota No
7 05054000 Red River of the North at Fargo, North Dakota Yes
8 465602096472700 Red River of the North on Cass County Road 20 below Fargo, North Dakota No
9 05054500 Sheyenne River above Harvey, North Dakota Yes
10 05056000 Sheyenne River near Warwick, North Dakota Yes
11 05057000 Sheyenne River near Cooperstown, North Dakota Yes
12 05058000 Sheyenne River below Baldhill Dam, North Dakota Yes
13 05058700 Sheyenne River at Lisbon, North Dakota Yes
14 05059000 Sheyenne River near Kindred, North Dakota Yes
15 05059300 Sheyenne River above Sheyenne River diversion near Horace, North Dakota Yes
16 470000096535300 Sheyenne River at Brooktree Park, North Dakota No
17 05062000 Buffalo River near Dilworth, Minnesota Yes
18 05064000 Wild Rice River at Hendrum, Minnesota Yes
19 05064500 Red River of the North at Halstad, Minnesota Yes
20 05066500 Goose River at Hillsboro, North Dakota Yes
21 05067500 Marsh River near Shelly, Minnesota Yes
22 05069000 Sand Hill River at Climax, Minnesota Yes
23 05070000 Red River of the North near Thompson, North Dakota Yes
24 05080000 Red Lake River at Fisher, Minnesota Yes
25 05082500 Red River of the North at Grand Forks, North Dakota Yes
26 480239097115000 Turtle River above Manvel, North Dakota No
27 05083500 Red River of the North at Oslo, Minnesota No
28 482118097090500 Forest River near confluence with Red River of the North, North Dakota No
29 482451097062500 Snake River near Big Woods, Minnesota No
30 482736097112800 Park River near Oakwood, North Dakota No
31 05092000 Red River of the North at Drayton, North Dakota Yes
32 05095000 Two Rivers at Hallock, Minnesota No
33 485636097173800 Pembina River above Pembina, North Dakota No
34 05102500 Red River of the North at Emerson, Manitoba Yes
Ta
[Sa
S
S
p
p
T
T
B
T
D
H
A
T
C
M
S
P
S
P
B
C
S
C
N
N
N
N
N
N
N
N
Methods 5
ble 2. Water-quality properties and constituents for which samples were analyzed.
mples were analyzed by the North Dakota Department of Health Laboratory; --, no data; <, less than; NA, not applicable]
Property or constituentParameter
codeMeasurement
type
Minimumreporting
limitUnits
treamflow 00060 Field -- Cubic feet per second
pecific conductance 00095 Field -- Microsiemens per centimeter at 25 degrees Celsius
H 00400 Field -- Standard units
H 00403 Laboratory -- Standard units
emperature, air 00020 Field -- Degrees Celsius
emperature, water 00010 Field -- Degrees Celsius
arometric pressure 00025 Field -- Millimeters of mercury
urbidity 61028 Field -- Nephelometric turbidity units
issolved oxygen 00300 Calculated -- Milligrams per liter
ardness 00905 Laboratory -- Milligrams per liter as calcium carbonate
cid neutralizing capacity 90410 Calculated < 1 Milligrams per liter
otal dissolved solids 70301 Calculated -- Milligrams per liter
alcium, dissolved 00915 Laboratory < 2 Milligrams per liter
agnesium, dissolved 00925 Laboratory < 1 Milligrams per liter
odium, dissolved 00930 Laboratory < 3 Milligrams per liter
ercent sodium 00932 Calculated -- Percent
odium adsorption ratio 00931 Calculated -- NA
otassium, dissolved 00935 Laboratory < 1 Milligrams per liter
icarbonate 90440 Laboratory < 1 Milligrams per liter
arbonate 90445 Laboratory < 1 Milligrams per liter
ulfate, dissolved 00945 Laboratory < 0.3 Milligrams per liter
hloride, dissolved 00940 Laboratory < 0.3 Milligrams per liter
itrite plus nitrate, total as nitrogen 00630 Laboratory < 0.02 Milligrams per liter
itrite plus nitrate, dissolved as nitrogen 00631 Laboratory < 0.02 Milligrams per liter
itrogen, ammonia, total 00610 Laboratory < 0.010 Milligrams per liter
itrogen, ammonia, dissolved 00608 Laboratory < 0.010 Milligrams per liter
itrogen, total 00600 Laboratory < 0.015 Milligrams per liter
itrogen, dissolved 00602 Laboratory < 0.015 Milligrams per liter
itrogen, total Kjeldahl 00625 Calculated < 0.001 Milligrams per liter
itrogen, dissolved Kjeldahl 00623 Calculated < 0.001 Milligrams per liter
6 S
Pho
Pho
Orth
Iron
Man
Coli
Chlo
Chlo
1An
TableMoor
Farg
Gran
Moo
1In 2In 3In 4In
Table
[Samp
imulation of Conservative-Constituent Transport in the Red River of the North Basin, 2003-04
sphorus, total 00665 Laboratory < 0.004 Milligrams per liter
sphorus, dissolved 00666 Laboratory < 0.004 Milligrams per liter
ophosphate, dissolved 00671 Laboratory < 0.01 Milligrams per liter
, dissolved 01046 Laboratory < 10 Micrograms per liter
ganese, dissolved 01056 Laboratory < 10 Micrograms per liter
form, fecal1 31625 Laboratory < 10 Colonies per 100 milliliters
rophyll a 70951 Laboratory -- Micrograms per liter
rophyll b 70952 Laboratory -- Micrograms per liter
alyzed for May 2004 samples.
3. Withdrawals from and return flows to the Red River of the North at Fargo, North Dakota, Grand Forks, North Dakota, and head, Minnesota, during September 2003 and May 2004.
City
Average dailywithdrawals forSeptember 2003(cubic feet per
second)
Average dailywithdrawals for
May 2004(cubic feet per
second)
Average dailyreturn flows
for September 15through 16, 2003(cubic feet per
second)
Average dailyreturn flowsfor May 10
through 13, 2004(cubic feet per
second)
o 20.3 16.8 17.5 15.4
d Forks 1 0 2 2.2 0 32
2. Water-quality properties and constituents for which samples were analyzed.—Continued
les were analyzed by the North Dakota Department of Health Laboratory; --, no data; <, less than; NA, not applicable]
Property or constituentParameter
codeMeasurement
type
Minimumreporting
limitUnits
rhead 3 7.1 4 6.3 5.8 6.7
addition, 13.0 cubic feet per second was withdrawn from the Red Lake River.
addition, 10.2 cubic feet per second was withdrawn from the Red Lake River.
addition, 1.1 cubic feet per second was withdrawn from ground-water sources.
addition, 0.4 cubic foot per second was withdrawn from ground-water sources.
6 pat an
De
is chrattrovousHyfersoboHEing(UU.HuCoCoDiRe(Ga w
19resdyenvoseincnitapwaApMArram
casestrobateplomainf
Streamflow and Water-Quality Conditions 7
ercent of the mean daily streamflows for site 25 (Red River Grand Forks, N. Dak.) exceeded 10,000 ft3/s between 1904 d 2004.
scription of HEC-5 and HEC-5Q Models
The HEC-5 model (U.S. Army Corps of Engineers, 1998) designed to simulate unsteady flows through a system of annels and reservoirs that have a branched network configu-ion. The model can be used to evaluate different flood-con-l scenarios as well as to size reservoirs and their flood-control lumes. One-dimensional channel routing is performed by ing one of seven available hydrologic-routing techniques. drologic routing (for example, the Muskingum method) dif-s from hydraulic routing in that hydrologic routing is based lely on conservation of mass. Hydraulic routing is based on th conservation of mass and conservation of momentum. The C-5 model has been applied to many managed rivers, includ- the Sacramento River (Willey, 1987), the Big Sandy River .S. Army Corps of Engineers, unpub. data, 1996, on file at S. Army Corps of Engineers Hydrologic Engineering Center, ntington District), and the Monongahela River (U.S. Army rps of Engineers, unpub. data, 1987, on file at U.S. Army rps of Engineers Hydrologic Engineering Center, Pittsburgh strict). A more recent version of the model, known as HEC-sSim (Klipsch, 2003), includes a graphical user interface UI) to build model input files but does not include linkage to ater-quality model as was required for this study.
The HEC-5Q model (Resource Management Associates, 96a, 1996b), a companion to the HEC-5 model, is a river and ervoir water-quality model that can be used to simulate namic interactions of multiple, nonlinearly coupled constitu-ts in rivers and in longitudinally or vertically stratified reser-irs. The model can be used to simulate the transport of con-rvative and nonconservative properties and constituents, luding temperature, dissolved oxygen, alkalinity, chloride, rate, ammonia, orthophosphorus, and phytoplankton. Recent plications of the HEC-5Q model include the simulation of
The HEC-5 model was used by the U.S. Army Corps of Engineers (2003) to simulate streamflow, and the HEC-5Q model was used to simulate constituent transport in the Shey-enne River from the confluence of Peterson Coulee with the Sheyenne River, through Lake Ashtabula, to the confluence of the Sheyenne River with the Red River, and down the Red River to Emerson, Manitoba. The HEC-5Q water-quality model included Lake Ashtabula but did not include the Red River from Wahpeton, N. Dak., to Fargo, N. Dak., or the Sheyenne River upstream from Peterson Coulee. The model was applied to aid in the analysis of potential environmental effects of a proposed Devils Lake outlet and underwent extensive peer review prior to publication. Documentation of the model is given in appen-dix A of the Devils Lake EIS (U.S. Army Corps of Engineers, 2003).
Streamflow and Water-Quality Conditions
Streamflow and water-quality conditions are discussed in this section to place the conditions that occurred during the Sep-tember 2003 and May 2004 sampling periods into a historical perspective. In addition to data for total dissolved solids, sul-fate, and chloride, data for selected ions (calcium, magnesium, sodium, and bicarbonate) and nutrients (nitrogen and phospho-rus) are discussed to provide a perspective on overall water-quality characteristics. Nitrogen and phosphorus loads calcu-lated from data collected during this study are compared to his-torical nitrogen and phosphorus loads.
Streamflows during the September 2003 sampling period were low (figure 2 at back of report). For example, streamflows for the Red Lake River at the mouth and site 34 (Red River at Emerson, Manitoba) are historically lower than streamflows measured on September 15, 2003, for site 24 (Red Lake River at Fisher, Minn.) and site 34, respectively, about 16 percent of the time (figure 2 at back of report). Streamflows for the Otter Tail River at the mouth and the Sheyenne River at the mouth are historically lower than streamflows measured on September 16, 2003, for site 1 (Otter Tail River at 11th Street in Breckenridge,
ter quality in the complex Alabama-Coosa-Tallapoosa and alachicola-Chattahoochee-Flint River Basins (Resource
anagement Associates, unpub. data, 1999, on file at U.S. my Corps of Engineers Hydrologic Engineering Center, Sac-
ento District and Mobile District).
A post-processing GUI for the HEC-5 / HEC-5Q models n be used to view model-generated results through time-ries plots and animated longitudinal and vertical profiles of eamflows and constituent concentrations. Measurements tained from data files can be plotted with the model-gener-d results for calibration exercises. The results are selected for tting by using a map-based interface that displays a sche-tic of the model configuration along with various geographic ormation system map layers.
Minn.) and site 16 (Sheyenne River at Brooktree Park, N. Dak.), respectively, about 30 percent of the time. Streamflows in the study area were generally decreasing before sample collection but were generally steady during the sampling period (figure 3a at back of report). Flow duration calculations were based on naturalized monthly streamflows for 1931-2001 [see Emerson (2005) for details of the calculations].
On May 11 and 12, 2004, during the middle of the May 2004 sampling period, widespread rainfall occurred throughout much of the Red River Basin. On May 11, rainfall amounts in the area east of the Red River and north of Fargo, N. Dak., were higher than those in the upper part of the Red and Sheyenne River Basins and ranged from 1.59 in. at Warren, Minn., to 2.21 in. at Perley, Minn. (North Dakota Agricultural Weather Net-
8 S
workShey0.6 in(Nort
2004less sexcep3b at Emerplingincrebasinoccurstreamthe pedurinsite (fRiversuredMinnTail RmeasStreecontrstreampercethe mMay N. DarepordurinrunofMay
Rivertion Amg/Lincreing thwere streamtotal betwethe RSiouxreporfigureof themg/LRiverreporwith tions
imulation of Conservative-Constituent Transport in the Red River of the North Basin, 2003-04
, 2005). Rainfall amounts in the upper part of the Red and enne River Basins on May 11 ranged from about 0.35 to . On May 12, rainfall amounts ranged from 0.2 to 0.5 in. h Dakota Agricultural Weather Network, 2005).
As a result of the widespread rainfall on May 11 and 12, , streamflows during the May 2004 sampling period were teady than during the September 2003 sampling period t in the Red River upstream from Fargo, N. Dak. (figure back of report). Streamflow for site 34 (Red River at son, Manitoba) increased about 50 percent during the sam- period. However, streamflows in the Sheyenne River ased only slightly because of less rainfall in that part of the than in other parts of the basin. In contrast to what red during the September 2003 sampling period when flows were consistently low throughout the study area, rcentage of time streamflow was equaled or exceeded
g the May 2004 sampling period varied widely from site to igure 2 at back of report). Streamflow for the Red Lake at the mouth is historically lower than streamflow mea- on May 11, 2004, for site 24 (Red Lake River at Fisher, .) about 30 percent of the time. Streamflow for the Otter iver at the mouth is historically lower than streamflow
ured on May 11, 2004, for site 1 (Otter Tail River at 11th t in Breckenridge, Minn.) about 55 percent of the time. In ast, streamflow for site 34 is historically lower than
flow measured on May 10, 2004, for that site about 70 nt of the time, and streamflow for the Sheyenne River at outh is historically lower than streamflow measured on 12, 2004, for site 16 (Sheyenne River at Brooktree Park, k.) about 85 percent of the time (figure 2 at back of
t). The unsteady flows and the collection of some samples g low-flow conditions and other samples during storm-f conditions complicated application of the model to the 2004 sampling period.
Measured total dissolved-solids concentrations for the Red generally were less than the U.S. Environmental Protec-gency (2005) secondary water-quality standard of 500
(figure 4a at back of report). The concentrations, which ased in a downstream direction, generally were higher dur-e September 2003 sampling period, when streamflows
the Bois de Sioux River (figure 4c at back of report) generally were greater than 500 mg/L and the concentrations elsewhere in the Red River upstream from Fargo, N. Dak., generally were less than 500 mg/L.
The long-term median total dissolved-solids concentration for site 34 (Red River at Emerson, Manitoba) during 1970-2001 was 438 mg/L (Tornes, 2005). The measured concentration for that site during the September 2003 sampling period was 640 mg/L, and the measured concentration during the May 2004 sampling period was 464 mg/L (figure 4a at back of report). Both of those concentrations are greater than the long-term median concentration.
During the September 2003 sampling period, all measured total dissolved-solids concentrations for the Sheyenne River were greater than 500 mg/L (figure 4b at back of report). The highest concentrations were for the upstream part of the Shey-enne River Basin. The concentrations were fairly uniform for all sites from Lisbon, N. Dak., downstream during both sampling periods. Concentrations for several tributaries to the Red River were fairly large (figure 4c at back of report), but streamflows in those tributaries were less than 12 ft3/s during the September 2003 sampling period. Thus, total dissolved-solids loads from those tributaries to the Red River were small.
Calcium and magnesium were present in approximately equal amounts for any given site (figure 5a at back of report) throughout the Red River Basin. Sodium was elevated in rela-tion to calcium and magnesium for sites in the upper part of the Sheyenne River Basin and lower in relation to calcium and magnesium for most sites on the Red River. Most of the sodium in the Sheyenne River was likely present as sodium sulfate and sodium bicarbonate.
Bicarbonate was the predominant anion in the Red River and the Sheyenne River (figure 5b at back of report). Sulfate was much lower than bicarbonate in the upper Red River but only slightly lower downstream from the confluence of the Red and Sheyenne Rivers. Carbonate made up a small percentage of the total anions at all sites, and chloride was low in relation to the other anions except near Fargo, N. Dak., and at the down-
low, than during the May 2004 sampling period, when flows were moderate. Sether and others (2004) measured
dissolved-solids concentrations during 1997-99 at 11 sites en the Otter Tail River above Breckenridge, Minn., and
ed River at Perley, Minn., which is between the Bois de River near Doran, Minn. (site 2, figure 1 at back of t), and the Wild Rice River at Hendrum, Minn. (site 18, 1 at back of report). The median concentration for each 11 sites, based on about 20 samples, was less than 500 except for the Bois de Sioux River and the Sheyenne at Harwood, N. Dak. (near site 16, figure 1 at back of t). The results from this study generally are in agreement those from Sether and others (2004) in that the concentra-for the Sheyenne River (figure 4b at back of report) and
stream end of the study reach. According to Tornes and others (1997), the ionic distribution was similar for streams that drain the same physiographic area of the Red River Basin.
During the September 2003 and May 2004 sampling peri-ods, most of the nitrogen in the Red River and the Sheyenne River was present as organic nitrogen (figures 6a and 6b at back of report). However, for site 8 (Red River below Fargo, N. Dak.) during both sampling periods and for most sites during the May 2004 sampling period, most of the nitrogen was present as nitrite plus nitrate as nitrogen, which can be derived from runoff of fertilizers or animal waste (figures 6a and 6b at back of report). Site 8 is affected by wastewater discharge from Fargo, N. Dak. Ammonia as nitrogen was present in small
amthesapecoabfigabcoingmeboorsit
RiRisapecesitoningfotimthewa
tercethestr7 arepHiRiwacesa
cuwelitingda(Tco
pebetranit
Streamflow and Water-Quality Conditions 9
ounts at most sites during both sampling periods although concentrations were slightly higher during the May 2004
mpling period than during the September 2003 sampling riod. Sether and others (2004) reported median total nitrogen ncentrations for 21 samples collected during 1997-99 were out 0.7 mg/L for the Red River at Hickson, N. Dak. (site 4, ure 1 at back of report), and about 0.9 mg/L for the Red River ove Fargo, N. Dak. (site 6, figure 1 at back of report). Those ncentrations are higher than the concentrations measured dur- the September 2003 and May 2004 sampling periods. The dian organic nitrogen concentration was about 0.6 mg/L for th sites during 1997-99, indicating that, during 1997-99, ganic nitrogen made up most of the total nitrogen for those es.
Total nitrogen concentrations for most sites on the Red ver downstream from Halstad, Minn., and on the Sheyenne ver were about 40 to 100 percent higher during the May 2004 mpling period than during the September 2003 sampling riod, indicating the high streamflows increased nitrogen con-ntrations in the rivers. The total nitrogen concentration for e 8 (Red River below Fargo, N. Dak.), however, was about e-third lower during the May 2004 sampling period than dur- the September 2003 sampling period. Because streamflows
r site 8 during the May 2004 sampling period were about three es higher than during the September 2003 sampling period, high streamflows for that site likely diluted the effects of the stewater discharge from Fargo, N. Dak.
Total phosphorus concentrations followed the same pat-n as total nitrogen concentrations, with typically higher con-ntrations during the May 2004 sampling period than during September 2003 sampling period in the Red River down-eam from Halstad, Minn., and in the Sheyenne River (figure t back of report). The median total phosphorus concentration orted by Sether and others (2004) for both the Red River at
ckson, N. Dak. (site 4, figure 1 at back of report), and the Red ver above Fargo, N. Dak. (site 6, figure 1 at back of report), s about 0.2 mg/L. That concentration is similar to the con-
ntrations measured during the September 2003 and May 2004 mpling periods.
downstream from site 12 (Sheyenne River below Baldhill Dam, N. Dak.). Loads between site 12 and site 15 (Sheyenne River above Sheyenne River diversion near Horace, N. Dak.) (a dis-tance of about 230 river miles) were generally steady during both sampling periods, but a large increase occurred between site 15 and site 16 (Sheyenne River at Brooktree Park, N. Dak.) during the May 2004 sampling period. The increase was primarily the result of an increase in streamflow from 306 to 538 ft3/s.
Total nitrogen and total phosphorus loads increased about three to eight times between site 7 (Red River at Fargo, N. Dak.) and site 8 (Red River below Fargo, N. Dak.) during both sam-pling periods. The increases probably were a result of loads from wastewater-treatment discharges. Nitrogen and phospho-rus likely were transformed quickly downstream from Fargo, N. Dak., during low-flow conditions. Compared to the loads at Fargo, the loads of both nutrients were lower by as much as half at all Red River sites downstream from Fargo during the Sep-tember 2003 sampling period. This pattern was not evident dur-ing the May 2004 sampling period because of the complicating effects of storm runoff.
Calculated loads for the three downstream-most Red River sites generally were lower than those for the upstream sites dur-ing the May 2004 sampling period because of the sampling pat-tern. The downstream Red River sites were sampled early in the sampling period before the widespread rains began and before storm runoff reached those sites. For example, streamflow for site 25 (Red River at Grand Forks, N. Dak.) on the date of sam-ple collection was 8,130 ft3/s, but streamflow for site 34 (Red River at Emerson, Manitoba) on the date of sample collection was 3,460 ft3/s.
Site 18 (Wild Rice River at Hendrum, Minn.), site 21 (Marsh River near Shelly, Minn.), and site 33 (Pembina River above Pembina, N. Dak.) all contributed high loads of nitrogen
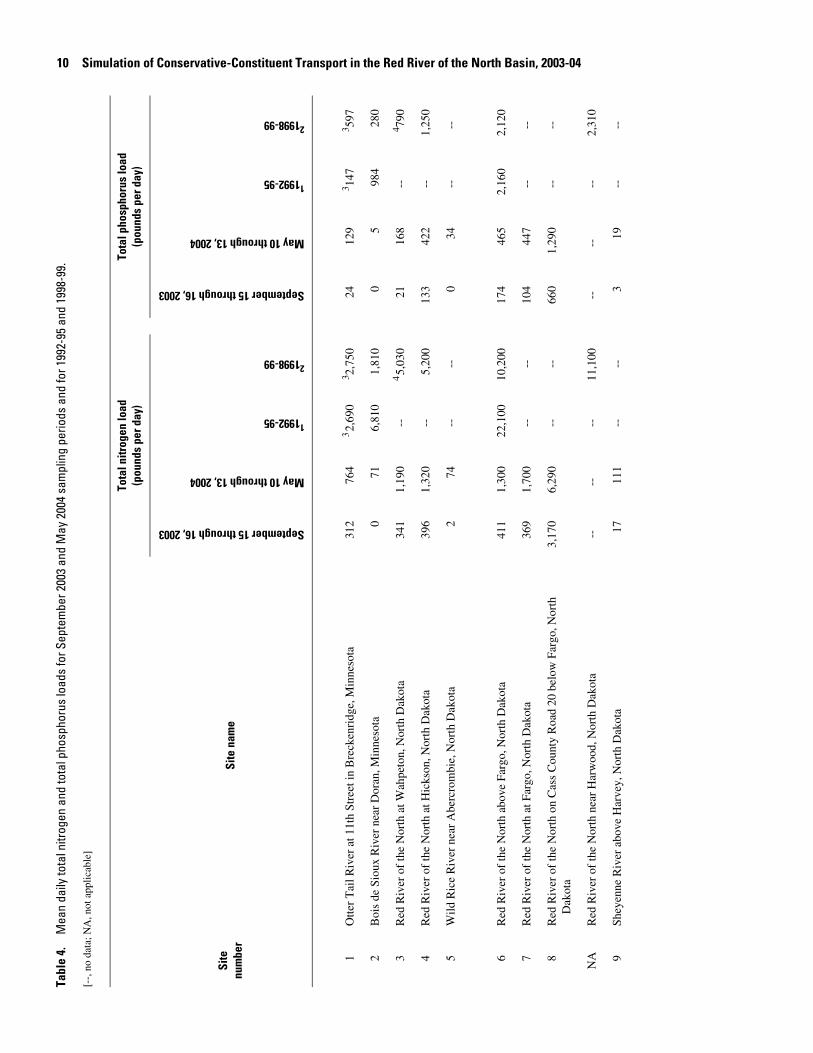
Mean daily total nitrogen and total phosphorus loads cal-lated from a single sample are given in table 4. The loads re calculated by multiplying concentration, in milligrams per
er, by streamflow, in cubic feet per second, and then multiply- the coefficient by a conversion factor of 5.38. The mean
ily loads calculated from multiyear data-collection efforts ornes and others, 1997; Sether and others, 2004) are given for mparison.
Loads were much higher during the May 2004 sampling riod than during the September 2003 sampling period cause of the higher streamflows and generally higher concen-tions during May 2004. For the Sheyenne River, the total rogen and total phosphorus loads increased substantially
and phosphorus to the Red River during the May 2004 sampling period. Loads from the Marsh River represented about 40 to 50 percent of the loads measured for site 23 (Red River near Thompson, N. Dak.). That site is the nearest Red River site downstream from the confluence of the Marsh and Red Rivers.
In general, the loads measured during this study were lower than the loads calculated from multiyear data-collection efforts (table 4). Tornes and others (1997) noted that much of the annual total nitrogen load in the Red River occurs immedi-ately after the spring thaw and during snowmelt when nitrogen is released from thawing soils. The highest phosphorus loads, in contrast, occur after runoff events during the summer when soils are not frozen.
10 Simulation of Conservative-Constituent Transport in the Red River of the North Basin, 2003-04ho
spho
rus
load
s fo
r Sep
tem
ber 2
003
and
May
200
4 sa
mpl
ing
perio
ds a
nd fo
r 199
2-95
and
199
8-99
.
Tota
l nitr
ogen
load
(pou
nds
per d
ay)
Tota
l pho
spho
rus
load
(pou
nds
per d
ay)
nam
e
September 15 through 16, 2003
May 10 through 13, 2004
11992-95
21998-99
September 15 through 16, 2003
May 10 through 13, 2004
11992-95
21998-99
cken
ridg
e, M
inne
sota
312
764
3 2,6
903 2,
750
2412
93 14
73 59
7
neso
ta0
716,
810
1,81
00
598
428
0
, Nor
th D
akot
a34
11,
190
--4 5
,030
2116
8--
4 790
orth
Dak
ota
396
1,32
0--
5,20
013
342
2--
1,25
0
Nor
th D
akot
a2
74--
--0
34--
--
Nor
th D
akot
a41
11,
300
22,1
0010
,200
174
465
2,16
02,
120
rth
Dak
ota
369
1,70
0--
--10
444
7--
--
nty
Roa
d 20
bel
ow F
argo
, Nor
th
3,17
06,
290
----
660
1,29
0--
--
d, N
orth
Dak
ota
----
--11
,100
----
--2,
310
h D
akot
a17
111
----
319
----
Tabl
e 4.
M
ean
daily
tota
l nitr
ogen
and
tota
l p
[--,
no
data
; NA
, not
app
licab
le]
Site
num
ber
Site
1O
tter
Tai
l Riv
er a
t 11t
h St
reet
in B
re
2B
ois
de S
ioux
Riv
er n
ear
Dor
an, M
in
3R
ed R
iver
of
the
Nor
th a
t Wah
peto
n
4R
ed R
iver
of
the
Nor
th a
t Hic
kson
, N
5W
ild R
ice
Riv
er n
ear
Abe
rcro
mbi
e,
6R
ed R
iver
of
the
Nor
th a
bove
Far
go,
7R
ed R
iver
of
the
Nor
th a
t Far
go, N
o
8R
ed R
iver
of
the
Nor
th o
n C
ass
Cou
Dak
ota
NA
Red
Riv
er o
f th
e N
orth
nea
r H
arw
oo
9Sh
eyen
ne R
iver
abo
ve H
arve
y, N
ort
Streamflow and Water-Quality Conditions 11
orth
Dak
ota
105
384
----
2852
----
n, N
orth
Dak
ota
113
884
----
2415
4--
--
am, N
orth
Dak
ota
380
1,83
0--
--46
312
----
Dak
ota
212
1,51
04,
970
--20
275
959
--
rth
Dak
ota
209
1,52
05,
690
--35
350
903
--
Riv
er D
iver
sion
nea
r H
orac
e, N
orth
18
71,
550
----
4241
0--
--
k, N
orth
Dak
ota
208
3,39
0--
3 9,10
050
1,02
0--
3 2,78
0
neso
ta61
740
----
1319
4--
--
Min
neso
ta--
----
27,7
00--
----
6,21
0
nnes
ota
104
4,33
03 2,
780
--9
1,50
03 17
9--
l pho
spho
rus
load
s fo
r Sep
tem
ber 2
003
and
May
200
4 sa
mpl
ing
perio
ds a
nd fo
r 199
2-95
and
199
8-99
.—Co
ntin
ued
Tota
l nitr
ogen
load
(pou
nds
per d
ay)
Tota
l pho
spho
rus
load
(pou
nds
per d
ay)
ite n
ame
September 15 through 16, 2003
May 10 through 13, 2004
11992-95
21998-99
September 15 through 16, 2003
May 10 through 13, 2004
11992-95
21998-99
10Sh
eyen
ne R
iver
nea
r W
arw
ick,
N
11Sh
eyen
ne R
iver
nea
r C
oope
rsto
w
12Sh
eyen
ne R
iver
bel
ow B
aldh
ill D
13Sh
eyen
ne R
iver
at L
isbo
n, N
orth
14Sh
eyen
ne R
iver
nea
r K
indr
ed, N
o
15Sh
eyen
ne R
iver
abo
ve S
heye
nne
Dak
ota
16Sh
eyen
ne R
iver
at B
rook
tree
Par
17B
uffa
lo R
iver
nea
r D
ilwor
th, M
in
NA
Red
Riv
er o
f th
e N
orth
at P
erle
y,
18W
ild R
ice
Riv
er a
t Hen
drum
, Mi
Tabl
e 4.
M
ean
daily
tota
l nitr
ogen
and
tota
[--,
no
data
; NA
, not
app
licab
le]
Site
num
ber
S
12 Simulation of Conservative-Constituent Transport in the Red River of the North Basin, 2003-04
inne
sota
1,96
014
,800
45,5
00--
430
5,67
06,
280
--
ota
481,
100
----
473
----
16,
880
----
01,
670
----
a35
1,88
0--
--4
48--
--
on, N
orth
Dak
ota
747
14,1
00--
--20
14,
410
----
598
1,60
03 10
,800
--34
903 92
5--
ks, N
orth
Dak
ota
1,46
041
,900
68,9
00--
260
10,2
007,
910
--
akot
a7
167
3 480
--1
383 69
--
neso
ta1,
990
28,6
00--
--42
113
,200
----
ed R
iver
of
the
Nor
th, N
orth
Dak
ota
6441
0--
--3
209
----
hosp
horu
s lo
ads
for S
epte
mbe
r 200
3 an
d M
ay 2
004
sam
plin
g pe
riods
and
for 1
992-
95 a
nd 1
998-
99.—
Cont
inue
d
Tota
l nitr
ogen
load
(pou
nds
per d
ay)
Tota
l pho
spho
rus
load
(pou
nds
per d
ay)
nam
e
September 15 through 16, 2003
May 10 through 13, 2004
11992-95
21998-99
September 15 through 16, 2003
May 10 through 13, 2004
11992-95
21998-99
19R
ed R
iver
of
the
Nor
th a
t Hal
stad
, M
20G
oose
Riv
er a
t Hill
sbor
o, N
orth
Dak
21M
arsh
Riv
er n
ear
Shel
ly, M
inne
sota
22Sa
nd H
ill R
iver
at C
limax
, Min
neso
t
23R
ed R
iver
of
the
Nor
th n
ear
Tho
mps
24R
ed L
ake
Riv
er a
t Fis
her,
Min
neso
ta
25R
ed R
iver
of
the
Nor
th a
t Gra
nd F
or
26T
urtle
Riv
er a
bove
Man
vel,
Nor
th D
27R
ed R
iver
of
the
Nor
th a
t Osl
o, M
in
28Fo
rest
Riv
er n
ear
conf
luen
ce w
ith R
Tabl
e 4.
M
ean
daily
tota
l nitr
ogen
and
tota
l p
[--,
no
data
; NA
, not
app
licab
le]
Site
num
ber
Site
Streamflow and Water-Quality Conditions 13
nnes
ota
--13
03 70
7--
--25
3 78--
Dak
ota
840
9--
--1
68--
--
n, N
orth
Dak
ota
1,67
116
,200
----
727
2,46
0--
--
a27
573
----
210
0--
--
orth
Dak
ota
504,
490
3 8,50
0--
122,
020
3 1,79
0--
n, M
anito
ba1,
802
19,7
0088
,800
--30
44,
840
10,8
00--
ite.
y si
te.
l pho
spho
rus
load
s fo
r Sep
tem
ber 2
003
and
May
200
4 sa
mpl
ing
perio
ds a
nd fo
r 199
2-95
and
199
8-99
.—Co
ntin
ued
Tota
l nitr
ogen
load
(pou
nds
per d
ay)
Tota
l pho
spho
rus
load
(pou
nds
per d
ay)
ite n
ame
September 15 through 16, 2003
May 10 through 13, 2004
11992-95
21998-99
September 15 through 16, 2003
May 10 through 13, 2004
11992-95
21998-99
29Sn
ake
Riv
er n
ear
Big
Woo
ds, M
i
30Pa
rk R
iver
nea
r O
akw
ood,
Nor
th
31R
ed R
iver
of
the
Nor
th a
t Dra
yto
32T
wo
Riv
ers
at H
allo
ck, M
inne
sot
33Pe
mbi
na R
iver
abo
ve P
embi
na, N
34R
ed R
iver
of
the
Nor
th a
t Em
erso
1 Fro
m T
orne
s an
d ot
hers
, 199
7.2 F
rom
Set
her
and
othe
rs, 2
004.
3 Cal
cula
ted
at s
ite u
pstr
eam
fro
m c
urre
nt s
tudy
s4 C
alcu
late
d at
site
dow
nstr
eam
fro
m c
urre
nt s
tud
Tabl
e 4.
M
ean
daily
tota
l nitr
ogen
and
tota
[--,
no
data
; NA
, not
app
licab
le]
Site
num
ber
S
14 S
SimTran
tested2003the flchlorconsiSulfaU.S. mode
Mod
qualicompBounwater
Com
incluand Oand thconflmodeinclutributment
by comust brancwhichIncreremostreamgainschargals). Rvirtuaon thSiouxHarvstream
addedreach
imulation of Conservative-Constituent Transport in the Red River of the North Basin, 2003-04
ulation of Conservative-Constituent sport
The Red River water-quality model was calibrated and using data collected from September 15 through 16,
, and from May 10 through 13, 2004. The model simulates ow and transport of total dissolved solids, sulfate, and ide during steady-state conditions. Those constituents are dered to be conservative constituents for this application. te also was simulated as a conservative constituent in the Army Corps of Engineers (2003) HEC-5Q water-quality l.
el Implementation
The U.S. Army Corps of Engineers (2003) HEC-5Q water-ty model was modified for this study by (1) extending the utational grid and (2) specifying boundary conditions. dary conditions included natural inflows and outflows of and constituents and withdrawals and return flows.
putational Grid
The physical domain of the Red River water-quality model des the Red River from the confluence of the Bois de Sioux tter Tail Rivers to the Red River at Emerson, Manitoba, e Sheyenne River from above Harvey, N. Dak., to the
uence with the Red River (figure 8 at back of report). The l domain is represented by a computational grid that des 2 main branches, 21 control points, 4 reservoirs, 15 aries (other than the Sheyenne River), and 331 stream ele-s.
The computational grid in the HEC-5 model is represented ntrol points and reservoirs. The downstream-most location be a control point, and the upstream-most location on each h must be a reservoir. Control points are locations at incremental flow is added to or removed from a river.
mental flow, which is the streamflow that is added to or
Stream elements are reaches in which water-quality conditions are fairly uniform. Tributaries are used to add constituent mass as a proportion of incremental flow, and more than one tributary can be located between two control points [for example, three tributaries are located between the Red River at Halstad, Minn., and the Red River near Thompson, N. Dak. (figure 8 at back of report)]. Tributary streamflow is treated as part of the incremen-tal flow between control points so that the total tributary stream-flow between two control points is equal to the incremental flow, minus any withdrawals, for that reach. For the Red River water-quality model, the reaches were divided into 331 stream elements that ranged in length from 1.5 to 6 mi.
Streamflow and Water-Quality Boundary Conditions
A time series of streamflow must be specified for each control point within the HEC-5 model. For this study, only a single streamflow value was required because streamflow was assumed to be steady. Streamflow boundary conditions for the September 2003 sampling period (table 5) were computed by using a moving average of measured daily mean streamflows for 3 to 5 days (September 11 through 17, 2003), and stream-flow boundary conditions for the May 2004 sampling period (table 6) were computed by using a moving average of mea-sured daily mean streamflows for 7 days (May 9 through 23, 2004). A longer averaging period was used for the May 2004 sampling period than for the September 2003 sampling period because of the highly unsteady streamflows during May 2004.
Incremental flow for a reach was determined by calculat-ing the difference between streamflow at the upstream control point and streamflow at the downstream control point of the reach (tables 5 and 6). For this study, streamflows were mea-sured for many of the reaches. If the difference between the accumulated upstream streamflows (the sum of the streamflow measured at the upstream control point and the streamflow mea-sured for the tributaries) and the downstream streamflow was near zero, most of the inflows to the reach probably were mea-
ved from a river at a control point, accounts for changes in flow that occur between control points (for example,
from tributaries, point sources, and ground-water dis-e and losses from ground-water recharge and withdraw-eservoirs can be actual reservoirs (Lake Ashtabula) or
l reservoirs. For this study, virtual reservoirs were created e Otter Tail River in Breckenridge, Minn., the Bois de River near Doran, Minn., and the Sheyenne River above
ey, N. Dak. For virtual reservoirs, outflow is equal to flow.
In the HEC-5Q model, stream elements and tributaries are to the computational grid of the HEC-5 model and the between control points is divided into stream elements.
sured (tables 5 and 6). If the difference was large in relation to the streamflow in the river, streamflows for several fairly large tributaries in the reach probably were not measured or ground-water discharge in the reach was high.
Water-quality boundary conditions were specified for the upstream-most points on each branch (the Sheyenne River above Harvey, N. Dak., the Otter Tail River at 11th Street in Breckenridge, Minn., and the Bois de Sioux River near Doran, Minn.); the mouth of each of the 15 tributaries; the incremental flows in reaches for which tributary streamflow was not mea-sured; and the Sheyenne River below Baldhill Dam, N. Dak. (table 7). September 2003 data for Lake Ashtabula (U. S. Army

Ta
[ft3
S
S
S
S
S
I
S
S
S
S
S
S
R
R
R
Simulation of Conservative-Constituent Transport 15
ble 5. Streamflow boundary conditions for September 2003 sampling period.
/s, cubic feet per second; --, no data; shading indicates control point location]
Location
Streamflowmeasuredat control
point(ft3/s)
Streamflowmeasured
for tributary(ft3/s)
Differencebetween
accumulatedupstream
streamflows anddownstreamstreamflow
(ft3/s)
Incremental flow
(ft3/s)
Percent ofstreamflowmeasuredat control
point
Sheyenne River
heyenne River above Harvey, North Dakota 2.5 -- -- -- --
heyenne River at North Dakota Highway 30 near Maddock, North Dakota1
2 10.8 -- 8.3 8.3 77
heyenne River at Peterson Coulee, North Dakota1 211.6 -- 0.8 0.8 7
heyenne River near Warwick, North Dakota 15 -- 3.4 3.4 23
heyenne River near Cooperstown, North Dakota 20 -- 5 5 25
nto Lake Ashtabula1 220.7 -- 0.7 0.7 3
heyenne River below Baldhill Dam, North Dakota 37 -- -- -- --
heyenne River at Valley City, North Dakota 238 -- 1 1 3
heyenne River at Lisbon, North Dakota 41 -- 3 3 7
heyenne River near Kindred, North Dakota 69 -- 28 28 41
heyenne River above Sheyenne River diversion near Horace, North Dakota
71 -- 2 2 3
heyenne River at Brooktree Park, North Dakota 80 -- 9 9 11
Red River of the North and tributaries
Otter Tail River at 11th Street in Breckenridge, Minnesota -- 114 -- -- --
Bois de Sioux River near Doran, Minnesota -- 0 -- -- --
ed River of the North at Wahpeton, North Dakota 110 -- - 4 - 4 4
ed River of the North at Hickson, North Dakota 119 -- 9 9 8
Wild Rice River near Abercrombie, North Dakota -- 0.3 -- -- --
Fargo, North Dakota, and Moorhead, Minnesota, wastewater-treatment facilities withdrawals
-- - 28 -- -- --
ed River of the North at Fargo, North Dakota 104 -- 12.7 - 15.0 14
Fargo, North Dakota, and Moorhead, Minnesota, wastewater-treatment facilities return flows
-- 23.3 -- -- --
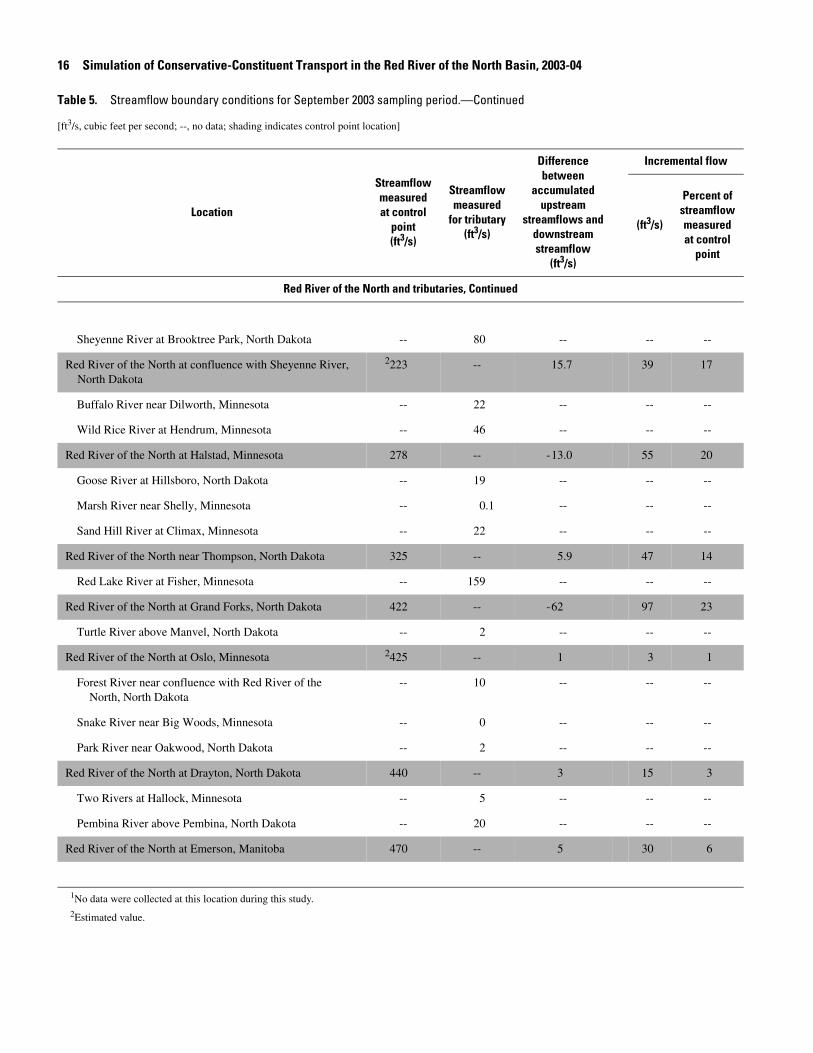
16 S
Sh
RedN
B
W
Red
G
M
Sa
Red
R
Red
T
Red
Fo
Sn
Pa
Red
T
Pe
Red
1No2Es
Table
[ft3/s,
imulation of Conservative-Constituent Transport in the Red River of the North Basin, 2003-04
Red River of the North and tributaries, Continued
eyenne River at Brooktree Park, North Dakota -- 80 -- -- --
River of the North at confluence with Sheyenne River, orth Dakota
2223 -- 15.7 39 17
uffalo River near Dilworth, Minnesota -- 22 -- -- --
ild Rice River at Hendrum, Minnesota -- 46 -- -- --
River of the North at Halstad, Minnesota 278 -- - 13.0 55 20
oose River at Hillsboro, North Dakota -- 19 -- -- --
arsh River near Shelly, Minnesota -- 0.1 -- -- --
nd Hill River at Climax, Minnesota -- 22 -- -- --
River of the North near Thompson, North Dakota 325 -- 5.9 47 14
ed Lake River at Fisher, Minnesota -- 159 -- -- --
River of the North at Grand Forks, North Dakota 422 -- - 62 97 23
urtle River above Manvel, North Dakota -- 2 -- -- --
River of the North at Oslo, Minnesota 2425 -- 1 3 1
rest River near confluence with Red River of the North, North Dakota
-- 10 -- -- --
ake River near Big Woods, Minnesota -- 0 -- -- --
rk River near Oakwood, North Dakota -- 2 -- -- --
5. Streamflow boundary conditions for September 2003 sampling period.—Continued
cubic feet per second; --, no data; shading indicates control point location]
Location
Streamflowmeasuredat control
point(ft3/s)
Streamflowmeasured
for tributary(ft3/s)
Differencebetween
accumulatedupstream
streamflows anddownstreamstreamflow
(ft3/s)
Incremental flow
(ft3/s)
Percent ofstreamflowmeasuredat control
point
River of the North at Drayton, North Dakota 440 -- 3 15 3
wo Rivers at Hallock, Minnesota -- 5 -- -- --
mbina River above Pembina, North Dakota -- 20 -- -- --
River of the North at Emerson, Manitoba 470 -- 5 30 6
data were collected at this location during this study.
timated value.
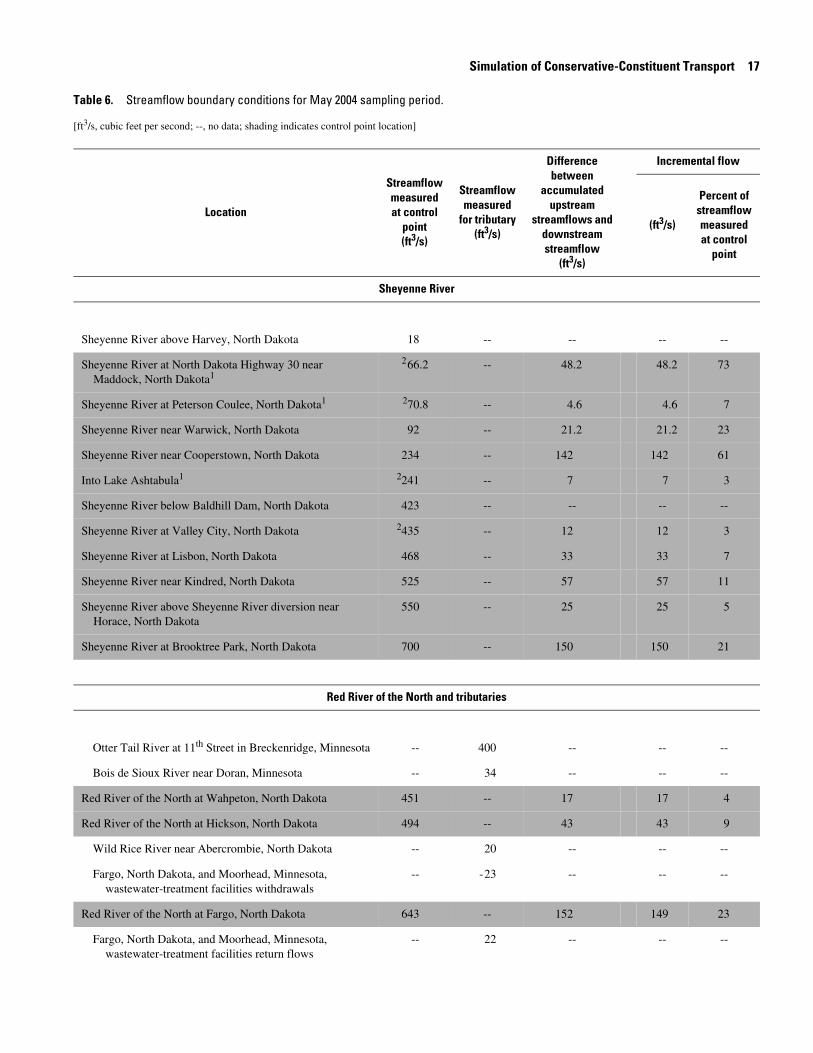
Ta
[ft3
S
S
S
S
S
I
S
S
S
S
S
S
R
R
R
Simulation of Conservative-Constituent Transport 17
ble 6. Streamflow boundary conditions for May 2004 sampling period.
/s, cubic feet per second; --, no data; shading indicates control point location]
Location
Streamflowmeasuredat control
point(ft3/s)
Streamflowmeasured
for tributary(ft3/s)
Differencebetween
accumulatedupstream
streamflows anddownstreamstreamflow
(ft3/s)
Incremental flow
(ft3/s)
Percent ofstreamflowmeasuredat control
point
Sheyenne River
heyenne River above Harvey, North Dakota 18 -- -- -- --
heyenne River at North Dakota Highway 30 near Maddock, North Dakota1
2 66.2 -- 48.2 48.2 73
heyenne River at Peterson Coulee, North Dakota1 270.8 -- 4.6 4.6 7
heyenne River near Warwick, North Dakota 92 -- 21.2 21.2 23
heyenne River near Cooperstown, North Dakota 234 -- 142 142 61
nto Lake Ashtabula1 2241 -- 7 7 3
heyenne River below Baldhill Dam, North Dakota 423 -- -- -- --
heyenne River at Valley City, North Dakota 2435 -- 12 12 3
heyenne River at Lisbon, North Dakota 468 -- 33 33 7
heyenne River near Kindred, North Dakota 525 -- 57 57 11
heyenne River above Sheyenne River diversion near Horace, North Dakota
550 -- 25 25 5
heyenne River at Brooktree Park, North Dakota 700 -- 150 150 21
Red River of the North and tributaries
Otter Tail River at 11th Street in Breckenridge, Minnesota -- 400 -- -- --
Bois de Sioux River near Doran, Minnesota -- 34 -- -- --
ed River of the North at Wahpeton, North Dakota 451 -- 17 17 4
ed River of the North at Hickson, North Dakota 494 -- 43 43 9
Wild Rice River near Abercrombie, North Dakota -- 20 -- -- --
Fargo, North Dakota, and Moorhead, Minnesota, wastewater-treatment facilities withdrawals
-- - 23 -- -- --
ed River of the North at Fargo, North Dakota 643 -- 152 149 23
Fargo, North Dakota, and Moorhead, Minnesota, wastewater-treatment facilities return flows
-- 22 -- -- --
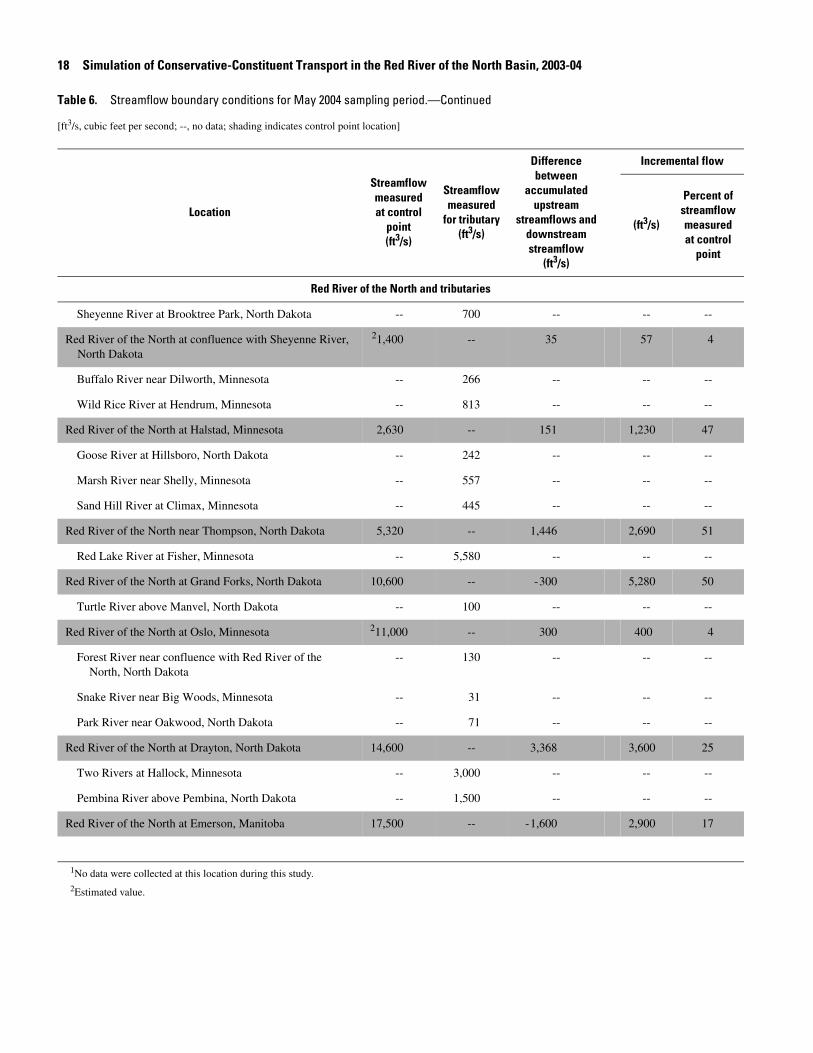
18 S
Sh
RedN
B
W
Red
G
M
Sa
Red
R
Red
T
Red
Fo
Sn
Pa
Red
T
Pe
Red
1No2Es
Table
[ft3/s,
imulation of Conservative-Constituent Transport in the Red River of the North Basin, 2003-04
Red River of the North and tributaries
eyenne River at Brooktree Park, North Dakota -- 700 -- -- --
River of the North at confluence with Sheyenne River, orth Dakota
21,400 -- 35 57 4
uffalo River near Dilworth, Minnesota -- 266 -- -- --
ild Rice River at Hendrum, Minnesota -- 813 -- -- --
River of the North at Halstad, Minnesota 2,630 -- 151 1,230 47
oose River at Hillsboro, North Dakota -- 242 -- -- --
arsh River near Shelly, Minnesota -- 557 -- -- --
nd Hill River at Climax, Minnesota -- 445 -- -- --
River of the North near Thompson, North Dakota 5,320 -- 1,446 2,690 51
ed Lake River at Fisher, Minnesota -- 5,580 -- -- --
River of the North at Grand Forks, North Dakota 10,600 -- - 300 5,280 50
urtle River above Manvel, North Dakota -- 100 -- -- --
River of the North at Oslo, Minnesota 211,000 -- 300 400 4
rest River near confluence with Red River of the North, North Dakota
-- 130 -- -- --
ake River near Big Woods, Minnesota -- 31 -- -- --
rk River near Oakwood, North Dakota -- 71 -- -- --
River of the North at Drayton, North Dakota 14,600 -- 3,368 3,600 25
6. Streamflow boundary conditions for May 2004 sampling period.—Continued
cubic feet per second; --, no data; shading indicates control point location]
Location
Streamflowmeasuredat control
point(ft3/s)
Streamflowmeasured
for tributary(ft3/s)
Differencebetween
accumulatedupstream
streamflows anddownstreamstreamflow
(ft3/s)
Incremental flow
(ft3/s)
Percent ofstreamflowmeasuredat control
point
wo Rivers at Hallock, Minnesota -- 3,000 -- -- --
mbina River above Pembina, North Dakota -- 1,500 -- -- --
River of the North at Emerson, Manitoba 17,500 -- - 1,600 2,900 17
data were collected at this location during this study.
timated value.
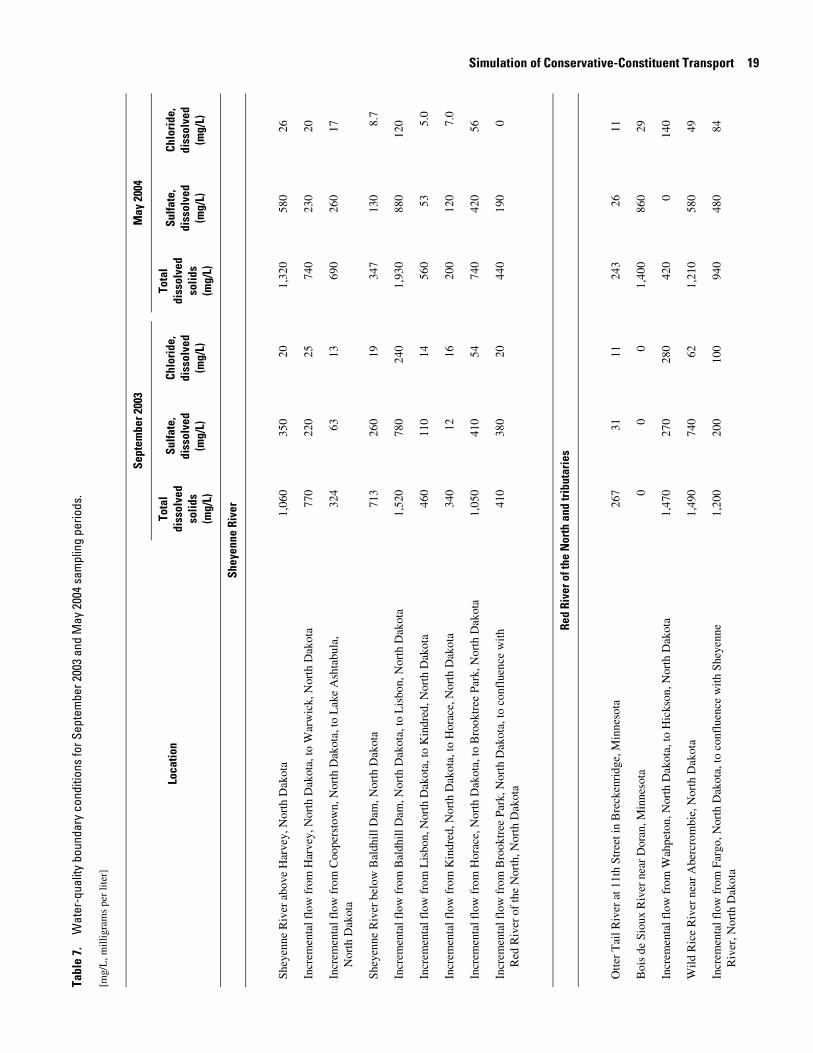
Simulation of Conservative-Constituent Transport 19s
for S
epte
mbe
r 200
3 an
d M
ay 2
004
sam
plin
g pe
riods
.
atio
n
Sept
embe
r 200
3M
ay 2
004
Tota
ldi
ssol
ved
solid
s(m
g/L)
Sulfa
te,
diss
olve
d(m
g/L)
Chlo
ride
,di
ssol
ved
(mg/
L)
Tota
ldi
ssol
ved
solid
s(m
g/L)
Sulfa
te,
diss
olve
d(m
g/L)
Chlo
ride
,di
ssol
ved
(mg/
L)
Shey
enne
Riv
er
a1,
060
350
201,
320
580
26
a, to
War
wic
k, N
orth
Dak
ota
770
220
2574
023
020
Dak
ota,
to L
ake
Ash
tabu
la,
324
6313
690
260
17
Dak
ota
713
260
1934
713
08.
7
Dak
ota,
to L
isbo
n, N
orth
Dak
ota
1,52
078
024
01,
930
880
120
a, to
Kin
dred
, Nor
th D
akot
a46
011
014
560
535.
0
ta, t
o H
orac
e, N
orth
Dak
ota
340
1216
200
120
7.0
a, to
Bro
oktr
ee P
ark,
Nor
th D
akot
a1,
050
410
5474
042
056
h D
akot
a, to
con
flue
nce
with
41
038
020
440
190
0
Red
Rive
r of t
he N
orth
and
trib
utar
ies
ge, M
inne
sota
267
3111
243
2611
00
01,
400
860
29
kota
, to
Hic
kson
, Nor
th D
akot
a1,
470
270
280
420
014
0
akot
a1,
490
740
621,
210
580
49
, to
conf
luen
ce w
ith S
heye
nne
1,20
020
010
094
048
084
Tabl
e 7.
W
ater
-qua
lity
boun
dary
con
ditio
n
[mg/
L, m
illig
ram
s pe
r lit
er]
Loc
Shey
enne
Riv
er a
bove
Har
vey,
Nor
th D
akot
Incr
emen
tal f
low
fro
m H
arve
y, N
orth
Dak
ot
Incr
emen
tal f
low
fro
m C
oope
rsto
wn,
Nor
th
Nor
th D
akot
a
Shey
enne
Riv
er b
elow
Bal
dhill
Dam
, Nor
th
Incr
emen
tal f
low
fro
m B
aldh
ill D
am, N
orth
Incr
emen
tal f
low
fro
m L
isbo
n, N
orth
Dak
ot
Incr
emen
tal f
low
fro
m K
indr
ed, N
orth
Dak
o
Incr
emen
tal f
low
fro
m H
orac
e, N
orth
Dak
ot
Incr
emen
tal f
low
fro
m B
rook
tree
Par
k, N
ort
Red
Riv
er o
f th
e N
orth
, Nor
th D
akot
a
Otte
r T
ail R
iver
at 1
1th
Stre
et in
Bre
cken
rid
Boi
s de
Sio
ux R
iver
nea
r D
oran
, Min
neso
ta
Incr
emen
tal f
low
fro
m W
ahpe
ton,
Nor
th D
a
Wild
Ric
e R
iver
nea
r A
berc
rom
bie,
Nor
th D
Incr
emen
tal f
low
fro
m F
argo
, Nor
th D
akot
aR
iver
, Nor
th D
akot
a
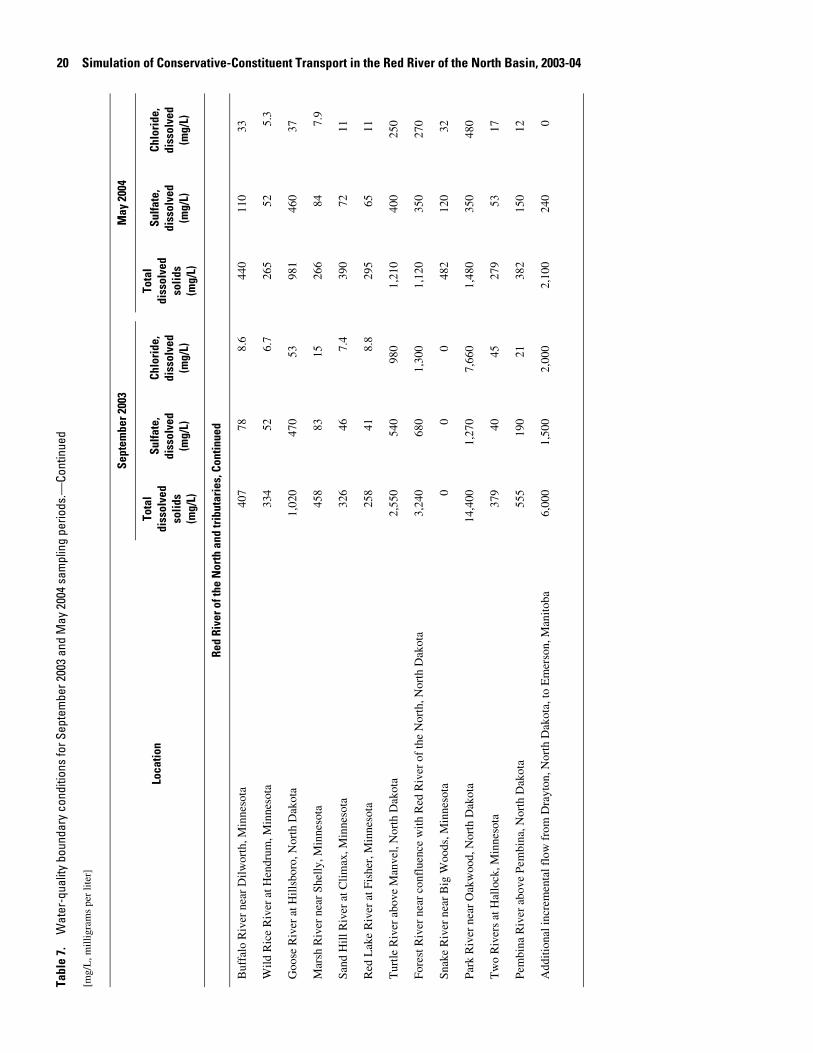
20 Simulation of Conservative-Constituent Transport in the Red River of the North Basin, 2003-04
Red
Rive
r of t
he N
orth
and
trib
utar
ies,
Con
tinue
d
407
788.
644
011
033
334
526.
726
552
5.3
1,02
047
053
981
460
37
458
8315
266
847.
9
326
467.
439
072
11
258
418.
829
565
11
2,55
054
098
01,
210
400
250
the
Nor
th, N
orth
Dak
ota
3,24
068
01,
300
1,12
035
027
0
00
048
212
032
14,4
001,
270
7,66
01,
480
350
480
379
4045
279
5317
555
190
2138
215
012
th D
akot
a, to
Em
erso
n, M
anito
ba6,
000
1,50
02,
000
2,10
024
00
or S
epte
mbe
r 200
3 an
d M
ay 2
004
sam
plin
g pe
riods
.—Co
ntin
ued
n
Sept
embe
r 200
3M
ay 2
004
Tota
ldi
ssol
ved
solid
s(m
g/L)
Sulfa
te,
diss
olve
d(m
g/L)
Chlo
ride
,di
ssol
ved
(mg/
L)
Tota
ldi
ssol
ved
solid
s(m
g/L)
Sulfa
te,
diss
olve
d(m
g/L)
Chlo
ride
,di
ssol
ved
(mg/
L)
Buf
falo
Riv
er n
ear
Dilw
orth
, Min
neso
ta
Wild
Ric
e R
iver
at H
endr
um, M
inne
sota
Goo
se R
iver
at H
illsb
oro,
Nor
th D
akot
a
Mar
sh R
iver
nea
r Sh
elly
, Min
neso
ta
Sand
Hill
Riv
er a
t Clim
ax, M
inne
sota
Red
Lak
e R
iver
at F
ishe
r, M
inne
sota
Tur
tle R
iver
abo
ve M
anve
l, N
orth
Dak
ota
Fore
st R
iver
nea
r co
nflu
ence
with
Red
Riv
er o
f
Snak
e R
iver
nea
r B
ig W
oods
, Min
neso
ta
Park
Riv
er n
ear
Oak
woo
d, N
orth
Dak
ota
Tw
o R
iver
s at
Hal
lock
, Min
neso
ta
Pem
bina
Riv
er a
bove
Pem
bina
, Nor
th D
akot
a
Add
ition
al in
crem
enta
l flo
w f
rom
Dra
yton
, Nor
Tabl
e 7.
W
ater
-qua
lity
boun
dary
con
ditio
ns f
[mg/
L, m
illig
ram
s pe
r lit
er]
Loca
tio
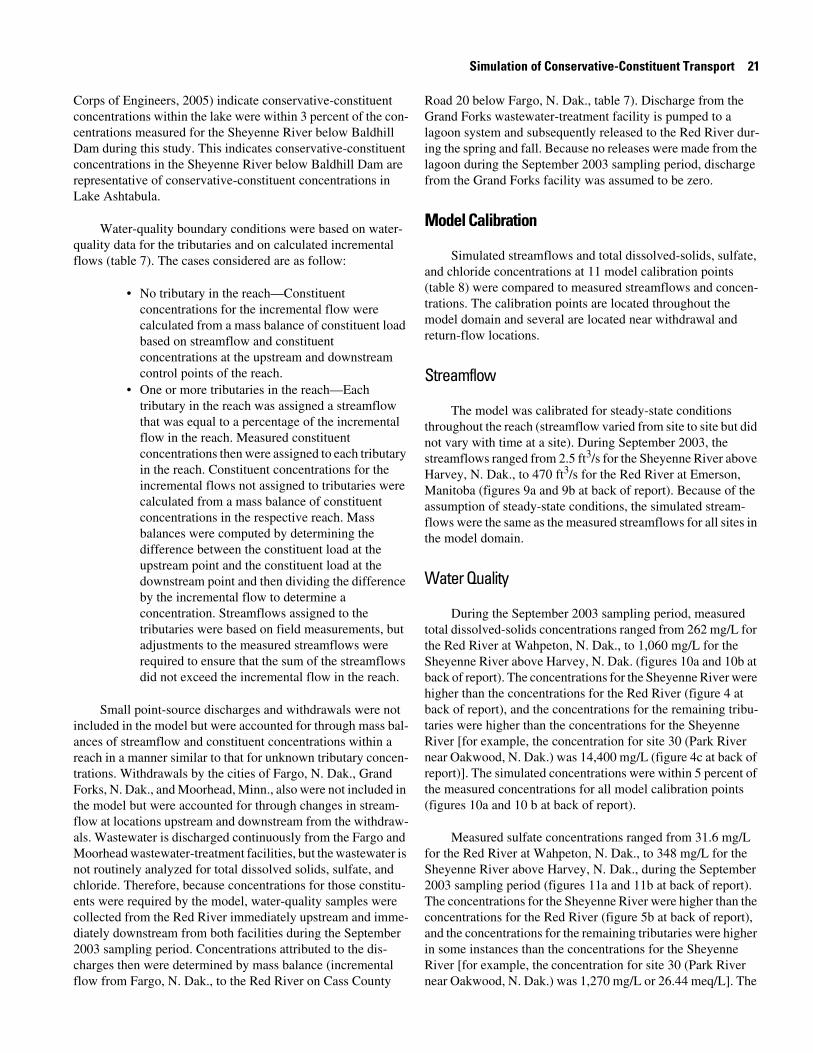
CococeDacorepLa
quflo
incanreatraFothefloalsMnochencodia20chflo
Simulation of Conservative-Constituent Transport 21
rps of Engineers, 2005) indicate conservative-constituent ncentrations within the lake were within 3 percent of the con-ntrations measured for the Sheyenne River below Baldhill m during this study. This indicates conservative-constituent ncentrations in the Sheyenne River below Baldhill Dam are resentative of conservative-constituent concentrations in ke Ashtabula.
Water-quality boundary conditions were based on water-ality data for the tributaries and on calculated incremental ws (table 7). The cases considered are as follow:
• No tributary in the reach—Constituent concentrations for the incremental flow were calculated from a mass balance of constituent load based on streamflow and constituent concentrations at the upstream and downstream control points of the reach.
• One or more tributaries in the reach—Each tributary in the reach was assigned a streamflow that was equal to a percentage of the incremental flow in the reach. Measured constituent concentrations then were assigned to each tributary in the reach. Constituent concentrations for the incremental flows not assigned to tributaries were calculated from a mass balance of constituent concentrations in the respective reach. Mass balances were computed by determining the difference between the constituent load at the upstream point and the constituent load at the downstream point and then dividing the difference by the incremental flow to determine a concentration. Streamflows assigned to the tributaries were based on field measurements, but adjustments to the measured streamflows were required to ensure that the sum of the streamflows did not exceed the incremental flow in the reach.
Small point-source discharges and withdrawals were not luded in the model but were accounted for through mass bal-
ces of streamflow and constituent concentrations within a
Road 20 below Fargo, N. Dak., table 7). Discharge from the Grand Forks wastewater-treatment facility is pumped to a lagoon system and subsequently released to the Red River dur-ing the spring and fall. Because no releases were made from the lagoon during the September 2003 sampling period, discharge from the Grand Forks facility was assumed to be zero.
Model Calibration
Simulated streamflows and total dissolved-solids, sulfate, and chloride concentrations at 11 model calibration points (table 8) were compared to measured streamflows and concen-trations. The calibration points are located throughout the model domain and several are located near withdrawal and return-flow locations.
Streamflow
The model was calibrated for steady-state conditions throughout the reach (streamflow varied from site to site but did not vary with time at a site). During September 2003, the streamflows ranged from 2.5 ft3/s for the Sheyenne River above Harvey, N. Dak., to 470 ft3/s for the Red River at Emerson, Manitoba (figures 9a and 9b at back of report). Because of the assumption of steady-state conditions, the simulated stream-flows were the same as the measured streamflows for all sites in the model domain.
Water Quality
During the September 2003 sampling period, measured total dissolved-solids concentrations ranged from 262 mg/L for the Red River at Wahpeton, N. Dak., to 1,060 mg/L for the Sheyenne River above Harvey, N. Dak. (figures 10a and 10b at back of report). The concentrations for the Sheyenne River were higher than the concentrations for the Red River (figure 4 at back of report), and the concentrations for the remaining tribu-taries were higher than the concentrations for the Sheyenne River [for example, the concentration for site 30 (Park River
ch in a manner similar to that for unknown tributary concen-tions. Withdrawals by the cities of Fargo, N. Dak., Grand rks, N. Dak., and Moorhead, Minn., also were not included in model but were accounted for through changes in stream-w at locations upstream and downstream from the withdraw-. Wastewater is discharged continuously from the Fargo and oorhead wastewater-treatment facilities, but the wastewater is t routinely analyzed for total dissolved solids, sulfate, and loride. Therefore, because concentrations for those constitu-ts were required by the model, water-quality samples were llected from the Red River immediately upstream and imme-tely downstream from both facilities during the September 03 sampling period. Concentrations attributed to the dis-arges then were determined by mass balance (incremental w from Fargo, N. Dak., to the Red River on Cass County
near Oakwood, N. Dak.) was 14,400 mg/L (figure 4c at back of report)]. The simulated concentrations were within 5 percent of the measured concentrations for all model calibration points (figures 10a and 10 b at back of report).
Measured sulfate concentrations ranged from 31.6 mg/L for the Red River at Wahpeton, N. Dak., to 348 mg/L for the Sheyenne River above Harvey, N. Dak., during the September 2003 sampling period (figures 11a and 11b at back of report). The concentrations for the Sheyenne River were higher than the concentrations for the Red River (figure 5b at back of report), and the concentrations for the remaining tributaries were higher in some instances than the concentrations for the Sheyenne River [for example, the concentration for site 30 (Park River near Oakwood, N. Dak.) was 1,270 mg/L or 26.44 meq/L]. The
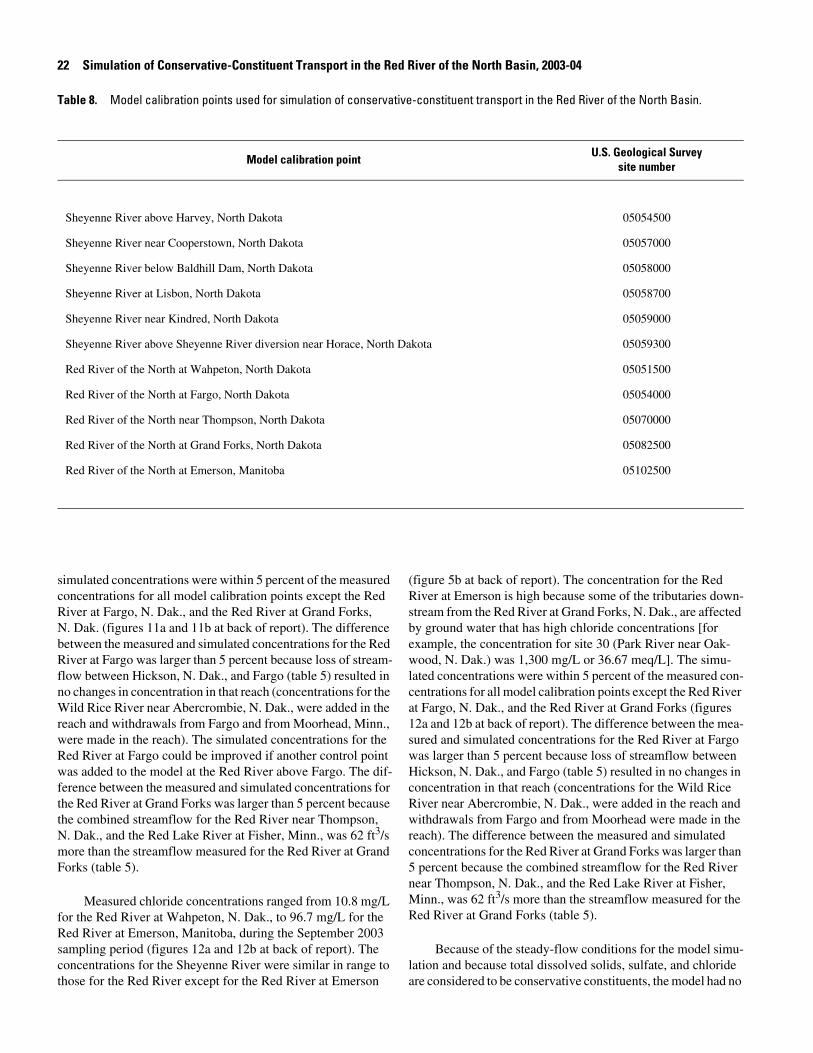
22 S
simulconceRiverN. DabetweRiverflow no chWildreachwere Red Rwas aferenthe Rthe coN. DamoreForks
for thRed Rsampconcethose
Table
Shey
Shey
Shey
Shey
Shey
Shey
Red
Red
Red
Red
Red
imulation of Conservative-Constituent Transport in the Red River of the North Basin, 2003-04
ated concentrations were within 5 percent of the measured ntrations for all model calibration points except the Red at Fargo, N. Dak., and the Red River at Grand Forks, k. (figures 11a and 11b at back of report). The difference en the measured and simulated concentrations for the Red at Fargo was larger than 5 percent because loss of stream-between Hickson, N. Dak., and Fargo (table 5) resulted in anges in concentration in that reach (concentrations for the Rice River near Abercrombie, N. Dak., were added in the and withdrawals from Fargo and from Moorhead, Minn., made in the reach). The simulated concentrations for the iver at Fargo could be improved if another control point
(figure 5b at back of report). The concentration for the Red River at Emerson is high because some of the tributaries down-stream from the Red River at Grand Forks, N. Dak., are affected by ground water that has high chloride concentrations [for example, the concentration for site 30 (Park River near Oak-wood, N. Dak.) was 1,300 mg/L or 36.67 meq/L]. The simu-lated concentrations were within 5 percent of the measured con-centrations for all model calibration points except the Red River at Fargo, N. Dak., and the Red River at Grand Forks (figures 12a and 12b at back of report). The difference between the mea-sured and simulated concentrations for the Red River at Fargo was larger than 5 percent because loss of streamflow between
8. Model calibration points used for simulation of conservative-constituent transport in the Red River of the North Basin.
Model calibration pointU.S. Geological Survey
site number
enne River above Harvey, North Dakota 05054500
enne River near Cooperstown, North Dakota 05057000
enne River below Baldhill Dam, North Dakota 05058000
enne River at Lisbon, North Dakota 05058700
enne River near Kindred, North Dakota 05059000
enne River above Sheyenne River diversion near Horace, North Dakota 05059300
River of the North at Wahpeton, North Dakota 05051500
River of the North at Fargo, North Dakota 05054000
River of the North near Thompson, North Dakota 05070000
River of the North at Grand Forks, North Dakota 05082500
River of the North at Emerson, Manitoba 05102500
dded to the model at the Red River above Fargo. The dif-ce between the measured and simulated concentrations for ed River at Grand Forks was larger than 5 percent because mbined streamflow for the Red River near Thompson, k., and the Red Lake River at Fisher, Minn., was 62 ft3/s
than the streamflow measured for the Red River at Grand (table 5).
Measured chloride concentrations ranged from 10.8 mg/L e Red River at Wahpeton, N. Dak., to 96.7 mg/L for the iver at Emerson, Manitoba, during the September 2003
ling period (figures 12a and 12b at back of report). The ntrations for the Sheyenne River were similar in range to for the Red River except for the Red River at Emerson
Hickson, N. Dak., and Fargo (table 5) resulted in no changes in concentration in that reach (concentrations for the Wild Rice River near Abercrombie, N. Dak., were added in the reach and withdrawals from Fargo and from Moorhead were made in the reach). The difference between the measured and simulated concentrations for the Red River at Grand Forks was larger than 5 percent because the combined streamflow for the Red River near Thompson, N. Dak., and the Red Lake River at Fisher, Minn., was 62 ft3/s more than the streamflow measured for the Red River at Grand Forks (table 5).
Because of the steady-flow conditions for the model simu-lation and because total dissolved solids, sulfate, and chloride are considered to be conservative constituents, the model had no
kinibrmaensope
the1.3thefosoerr
M
cothestrba
Tatot
[Thpo
T
S
C
Simulation of Conservative-Constituent Transport 23
etic or transport parameters to adjust. Therefore, model cal-ation was accomplished by making small adjustments to esti-ted loads from unmeasured sources. Generally, the differ-
ces between the measured and simulated total dissolved-lids, sulfate, and chloride concentrations were less than 5 rcent of the measured concentrations.
To determine the mean calibration error for the model domain, the absolute difference between the measured and sim-ulated concentrations was calculated for the 11 model calibra-tion points. The absolute difference was averaged and the aver-age difference was considered to be the mean calibration error. The mean calibration error, which is shown in table 9 along with
maximum and minimum absolute differences, ranged from Measured and simulated total dissolved-solids, sulfate,
ble 9. Mean calibration errors and maximum and minimum absolute differences between measured (September 2003) and simulated al dissolved-solids, sulfate, and chloride concentrations.
e mean calibration error was determined by averaging the absolute difference between the measured and simulated concentrations for the 11 model calibration ints; the location for which the maximum or minimum difference occurred is indicated in parentheses]
ConstituentMean calibration error
(milligrams per liter)Maximum absolute difference
(milligrams per liter)Minimum absolute difference
(milligrams per liter)
otal dissolved solids
13 27(Sheyenne River above Sheyenne Riverdiversion near Horace, North Dakota)
8(Red River of the North at
Emerson, Manitoba)
ulfate 4.4 20(Red River of the North at
Grand Forks, North Dakota)
0(Sheyenne River at Lisbon,
North Dakota)
hloride 1.3 5.9(Red River of the North at
Fargo, North Dakota)
0.4(Sheyenne River near Kindred, NorthDakota, and Sheyenne River above
Sheyenne River diversion nearHorace, North Dakota)
mg/L for chloride to 13 mg/L for total dissolved solids. If mean calibration error is expressed as a percentage, the error
r each of the three constituents is similar. For total dissolved lids and sulfate, the error is 2 percent, and for chloride, the or is 4 percent.
odel Performance Testing
The Red River water-quality model was tested using data llected from May 10 through 13, 2004. The unsteadiness in measured streamflows was smoothed using a 7-day average eamflow (May 9 through 23, 2004) (figures 13a and 13b at ck of report).
and chloride concentrations for the Sheyenne River were in agreement (figures 14a, 15a, and 16a at back of report), prima-rily because streamflows in the Sheyenne River during the May 2004 sampling period were fairly steady and instream water-quality conditions were not affected by storm runoff. Measured and simulated concentrations for the Red River were not in agreement (figures 14b, 15b, and 16b at back of report) because streamflows in the Red River were unsteady and samples were collected during differing flow conditions. The measured and simulated concentrations for the Red River at Fargo, N. Dak., and the Red River at Emerson, Manitoba, differed by as much as 194 percent. The large difference probably resulted from unmeasured and unknown loads from storm runoff during the sampling period. Concentrations in the runoff could have been estimated by mass balance, but the model then would apply
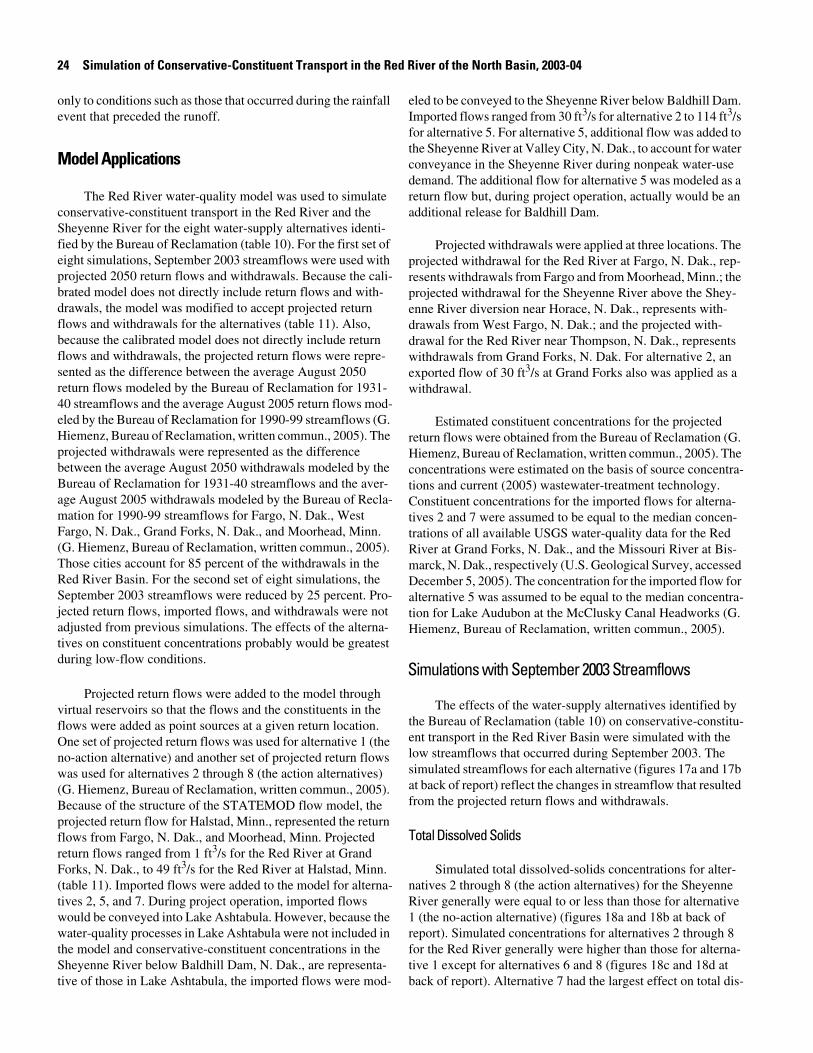
24 S
only tevent
Mod
conseSheyfied beightprojebratedrawflowsbecauflowssentereturn40 streled bHiemprojebetweBureaage AmatioFargo(G. HThosRed RSeptejectedadjustives durin
virtuaflowsOne sno-acwas u(G. HBecaprojeflowsreturnForks(tabletives woulwaterthe mSheytive o
imulation of Conservative-Constituent Transport in the Red River of the North Basin, 2003-04
o conditions such as those that occurred during the rainfall that preceded the runoff.
el Applications
The Red River water-quality model was used to simulate rvative-constituent transport in the Red River and the
enne River for the eight water-supply alternatives identi-y the Bureau of Reclamation (table 10). For the first set of
simulations, September 2003 streamflows were used with cted 2050 return flows and withdrawals. Because the cali-d model does not directly include return flows and with-als, the model was modified to accept projected return and withdrawals for the alternatives (table 11). Also, se the calibrated model does not directly include return and withdrawals, the projected return flows were repre-d as the difference between the average August 2050 flows modeled by the Bureau of Reclamation for 1931-eamflows and the average August 2005 return flows mod-y the Bureau of Reclamation for 1990-99 streamflows (G. enz, Bureau of Reclamation, written commun., 2005). The cted withdrawals were represented as the difference en the average August 2050 withdrawals modeled by the u of Reclamation for 1931-40 streamflows and the aver-ugust 2005 withdrawals modeled by the Bureau of Recla-n for 1990-99 streamflows for Fargo, N. Dak., West , N. Dak., Grand Forks, N. Dak., and Moorhead, Minn. iemenz, Bureau of Reclamation, written commun., 2005). e cities account for 85 percent of the withdrawals in the
iver Basin. For the second set of eight simulations, the mber 2003 streamflows were reduced by 25 percent. Pro- return flows, imported flows, and withdrawals were not
ted from previous simulations. The effects of the alterna-on constituent concentrations probably would be greatest g low-flow conditions.
Projected return flows were added to the model through l reservoirs so that the flows and the constituents in the were added as point sources at a given return location. et of projected return flows was used for alternative 1 (the tion alternative) and another set of projected return flows
eled to be conveyed to the Sheyenne River below Baldhill Dam. Imported flows ranged from 30 ft3/s for alternative 2 to 114 ft3/s for alternative 5. For alternative 5, additional flow was added to the Sheyenne River at Valley City, N. Dak., to account for water conveyance in the Sheyenne River during nonpeak water-use demand. The additional flow for alternative 5 was modeled as a return flow but, during project operation, actually would be an additional release for Baldhill Dam.
Projected withdrawals were applied at three locations. The projected withdrawal for the Red River at Fargo, N. Dak., rep-resents withdrawals from Fargo and from Moorhead, Minn.; the projected withdrawal for the Sheyenne River above the Shey-enne River diversion near Horace, N. Dak., represents with-drawals from West Fargo, N. Dak.; and the projected with-drawal for the Red River near Thompson, N. Dak., represents withdrawals from Grand Forks, N. Dak. For alternative 2, an exported flow of 30 ft3/s at Grand Forks also was applied as a withdrawal.
Estimated constituent concentrations for the projected return flows were obtained from the Bureau of Reclamation (G. Hiemenz, Bureau of Reclamation, written commun., 2005). The concentrations were estimated on the basis of source concentra-tions and current (2005) wastewater-treatment technology. Constituent concentrations for the imported flows for alterna-tives 2 and 7 were assumed to be equal to the median concen-trations of all available USGS water-quality data for the Red River at Grand Forks, N. Dak., and the Missouri River at Bis-marck, N. Dak., respectively (U.S. Geological Survey, accessed December 5, 2005). The concentration for the imported flow for alternative 5 was assumed to be equal to the median concentra-tion for Lake Audubon at the McClusky Canal Headworks (G. Hiemenz, Bureau of Reclamation, written commun., 2005).
Simulations with September 2003 Streamflows
The effects of the water-supply alternatives identified by the Bureau of Reclamation (table 10) on conservative-constitu-ent transport in the Red River Basin were simulated with the low streamflows that occurred during September 2003. The
sed for alternatives 2 through 8 (the action alternatives) iemenz, Bureau of Reclamation, written commun., 2005). use of the structure of the STATEMOD flow model, the cted return flow for Halstad, Minn., represented the return from Fargo, N. Dak., and Moorhead, Minn. Projected flows ranged from 1 ft3/s for the Red River at Grand , N. Dak., to 49 ft3/s for the Red River at Halstad, Minn. 11). Imported flows were added to the model for alterna-2, 5, and 7. During project operation, imported flows d be conveyed into Lake Ashtabula. However, because the -quality processes in Lake Ashtabula were not included in odel and conservative-constituent concentrations in the
enne River below Baldhill Dam, N. Dak., are representa-f those in Lake Ashtabula, the imported flows were mod-
simulated streamflows for each alternative (figures 17a and 17b at back of report) reflect the changes in streamflow that resulted from the projected return flows and withdrawals.
Total Dissolved Solids
Simulated total dissolved-solids concentrations for alter-natives 2 through 8 (the action alternatives) for the Sheyenne River generally were equal to or less than those for alternative 1 (the no-action alternative) (figures 18a and 18b at back of report). Simulated concentrations for alternatives 2 through 8 for the Red River generally were higher than those for alterna-tive 1 except for alternatives 6 and 8 (figures 18c and 18d at back of report). Alternative 7 had the largest effect on total dis-
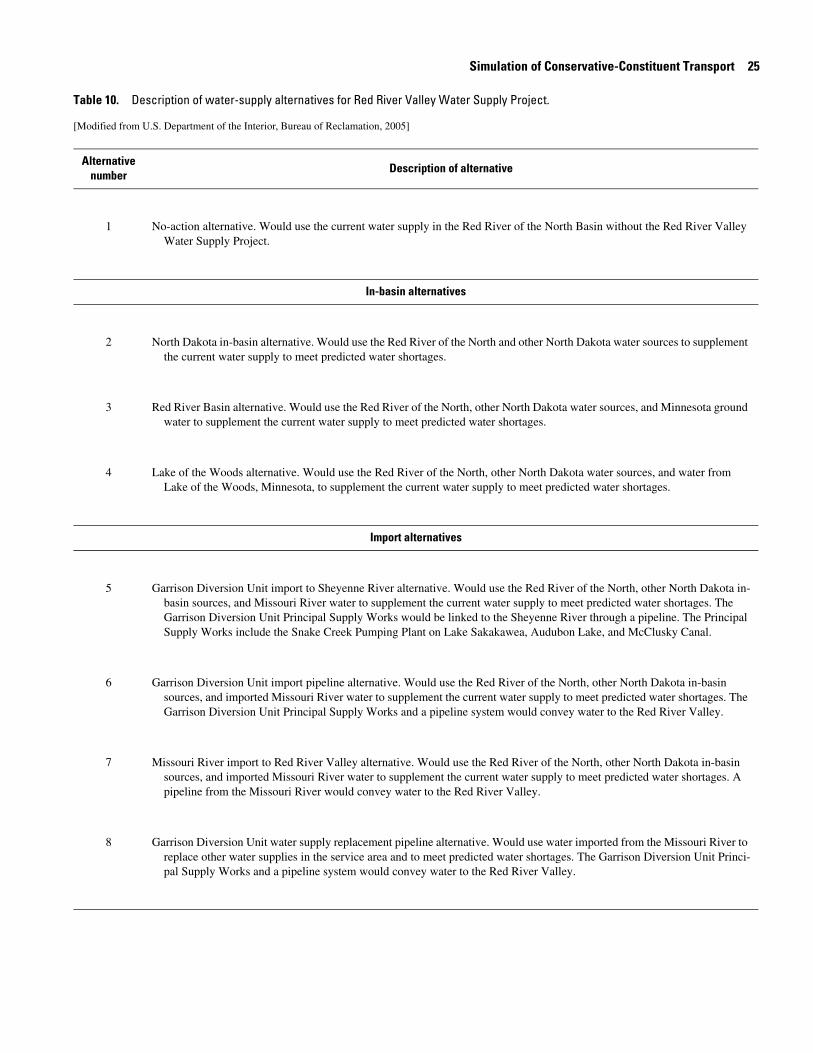
Ta
[M
A
Simulation of Conservative-Constituent Transport 25
ble 10. Description of water-supply alternatives for Red River Valley Water Supply Project.
odified from U.S. Department of the Interior, Bureau of Reclamation, 2005]
lternativenumber
Description of alternative
1 No-action alternative. Would use the current water supply in the Red River of the North Basin without the Red River Valley Water Supply Project.
In-basin alternatives
2 North Dakota in-basin alternative. Would use the Red River of the North and other North Dakota water sources to supplement the current water supply to meet predicted water shortages.
3 Red River Basin alternative. Would use the Red River of the North, other North Dakota water sources, and Minnesota ground water to supplement the current water supply to meet predicted water shortages.
4 Lake of the Woods alternative. Would use the Red River of the North, other North Dakota water sources, and water from Lake of the Woods, Minnesota, to supplement the current water supply to meet predicted water shortages.
Import alternatives
5 Garrison Diversion Unit import to Sheyenne River alternative. Would use the Red River of the North, other North Dakota in-basin sources, and Missouri River water to supplement the current water supply to meet predicted water shortages. The Garrison Diversion Unit Principal Supply Works would be linked to the Sheyenne River through a pipeline. The Principal Supply Works include the Snake Creek Pumping Plant on Lake Sakakawea, Audubon Lake, and McClusky Canal.
6 Garrison Diversion Unit import pipeline alternative. Would use the Red River of the North, other North Dakota in-basin sources, and imported Missouri River water to supplement the current water supply to meet predicted water shortages. The Garrison Diversion Unit Principal Supply Works and a pipeline system would convey water to the Red River Valley.
7 Missouri River import to Red River Valley alternative. Would use the Red River of the North, other North Dakota in-basin sources, and imported Missouri River water to supplement the current water supply to meet predicted water shortages. A pipeline from the Missouri River would convey water to the Red River Valley.
8 Garrison Diversion Unit water supply replacement pipeline alternative. Would use water imported from the Missouri River to replace other water supplies in the service area and to meet predicted water shortages. The Garrison Diversion Unit Princi-pal Supply Works and a pipeline system would convey water to the Red River Valley.
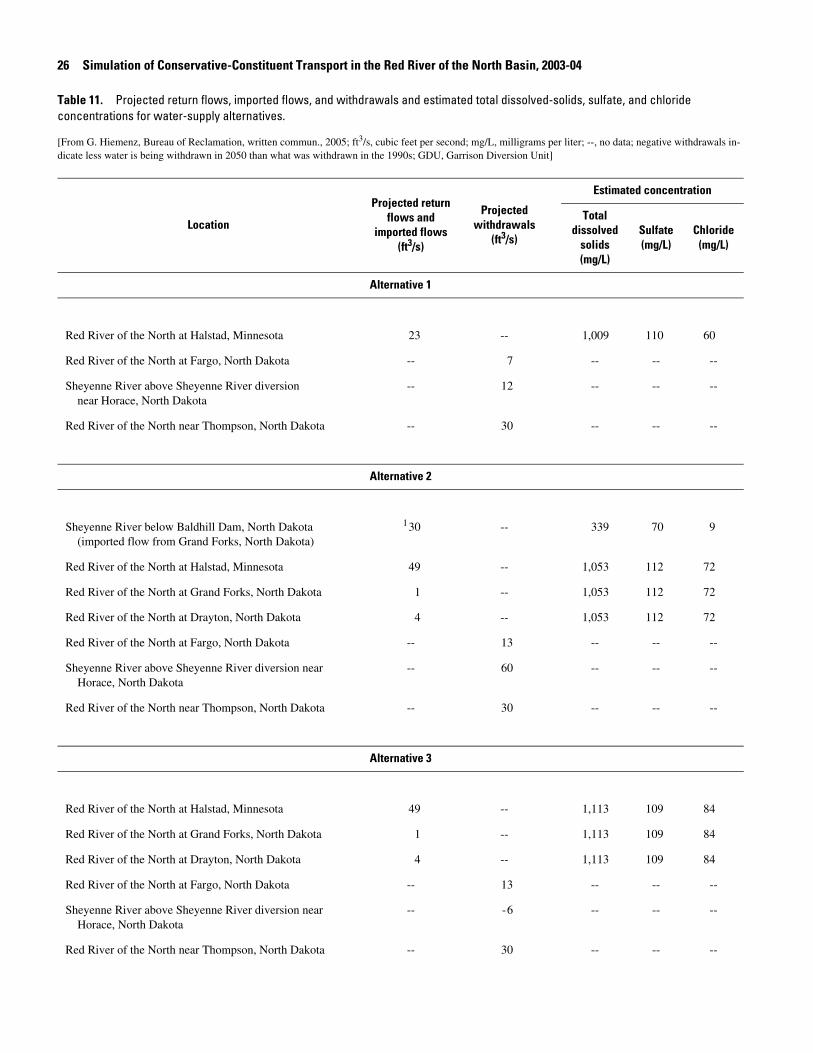
26 S
Tableconce
[Fromdicate
Red
Red
Sheyne
Red
Shey(i
Red
Red
Red
Red
SheyH
Red
Red
Red
Red
Red
SheyH
Red
imulation of Conservative-Constituent Transport in the Red River of the North Basin, 2003-04
11. Projected return flows, imported flows, and withdrawals and estimated total dissolved-solids, sulfate, and chloride ntrations for water-supply alternatives.
G. Hiemenz, Bureau of Reclamation, written commun., 2005; ft3/s, cubic feet per second; mg/L, milligrams per liter; --, no data; negative withdrawals in-less water is being withdrawn in 2050 than what was withdrawn in the 1990s; GDU, Garrison Diversion Unit]
Location
Projected returnflows and
imported flows(ft3/s)
Projectedwithdrawals
(ft3/s)
Estimated concentration
Totaldissolved
solids(mg/L)
Sulfate(mg/L)
Chloride(mg/L)
Alternative 1
River of the North at Halstad, Minnesota 23 -- 1,009 110 60
River of the North at Fargo, North Dakota -- 7 -- -- --
enne River above Sheyenne River diversion ar Horace, North Dakota
-- 12 -- -- --
River of the North near Thompson, North Dakota -- 30 -- -- --
Alternative 2
enne River below Baldhill Dam, North Dakota mported flow from Grand Forks, North Dakota)
1 30 -- 339 70 9
River of the North at Halstad, Minnesota 49 -- 1,053 112 72
River of the North at Grand Forks, North Dakota 1 -- 1,053 112 72
River of the North at Drayton, North Dakota 4 -- 1,053 112 72
River of the North at Fargo, North Dakota -- 13 -- -- --
enne River above Sheyenne River diversion near orace, North Dakota
-- 60 -- -- --
River of the North near Thompson, North Dakota -- 30 -- -- --
Alternative 3
River of the North at Halstad, Minnesota 49 -- 1,113 109 84
River of the North at Grand Forks, North Dakota 1 -- 1,113 109 84
River of the North at Drayton, North Dakota 4 -- 1,113 109 84
River of the North at Fargo, North Dakota -- 13 -- -- --
enne River above Sheyenne River diversion near orace, North Dakota
-- - 6 -- -- --
River of the North near Thompson, North Dakota -- 30 -- -- --
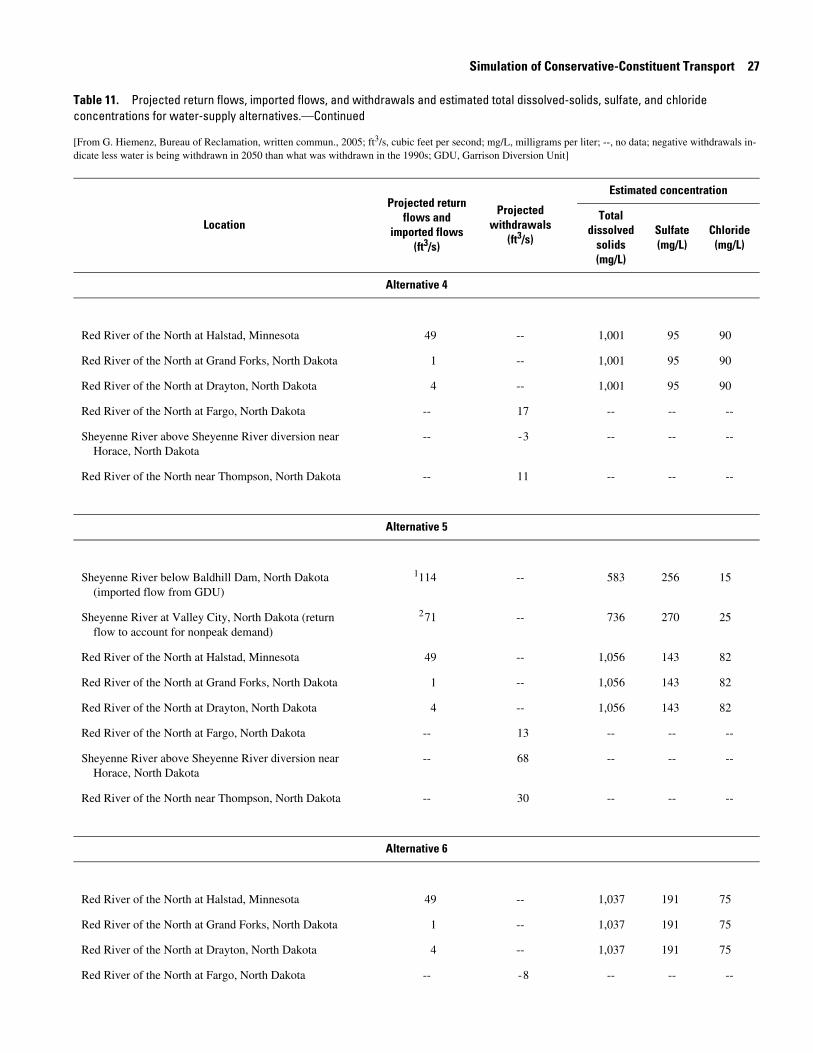
R
R
R
R
S
R
S
S
R
R
R
R
S
R
R
R
R
R
Taco
[Frdic
Simulation of Conservative-Constituent Transport 27
Alternative 4
ed River of the North at Halstad, Minnesota 49 -- 1,001 95 90
ed River of the North at Grand Forks, North Dakota 1 -- 1,001 95 90
ed River of the North at Drayton, North Dakota 4 -- 1,001 95 90
ed River of the North at Fargo, North Dakota -- 17 -- -- --
heyenne River above Sheyenne River diversion near Horace, North Dakota
-- - 3 -- -- --
ed River of the North near Thompson, North Dakota -- 11 -- -- --
Alternative 5
heyenne River below Baldhill Dam, North Dakota (imported flow from GDU)
1114 -- 583 256 15
heyenne River at Valley City, North Dakota (return flow to account for nonpeak demand)
2 71 -- 736 270 25
ed River of the North at Halstad, Minnesota 49 -- 1,056 143 82
ed River of the North at Grand Forks, North Dakota 1 -- 1,056 143 82
ed River of the North at Drayton, North Dakota 4 -- 1,056 143 82
ed River of the North at Fargo, North Dakota -- 13 -- -- --
ble 11. Projected return flows, imported flows, and withdrawals and estimated total dissolved-solids, sulfate, and chloride ncentrations for water-supply alternatives.—Continued
om G. Hiemenz, Bureau of Reclamation, written commun., 2005; ft3/s, cubic feet per second; mg/L, milligrams per liter; --, no data; negative withdrawals in-ate less water is being withdrawn in 2050 than what was withdrawn in the 1990s; GDU, Garrison Diversion Unit]
Location
Projected returnflows and
imported flows(ft3/s)
Projectedwithdrawals
(ft3/s)
Estimated concentration
Totaldissolved
solids(mg/L)
Sulfate(mg/L)
Chloride(mg/L)
heyenne River above Sheyenne River diversion near Horace, North Dakota
-- 68 -- -- --
ed River of the North near Thompson, North Dakota -- 30 -- -- --
Alternative 6
ed River of the North at Halstad, Minnesota 49 -- 1,037 191 75
ed River of the North at Grand Forks, North Dakota 1 -- 1,037 191 75
ed River of the North at Drayton, North Dakota 4 -- 1,037 191 75
ed River of the North at Fargo, North Dakota -- - 8 -- -- --
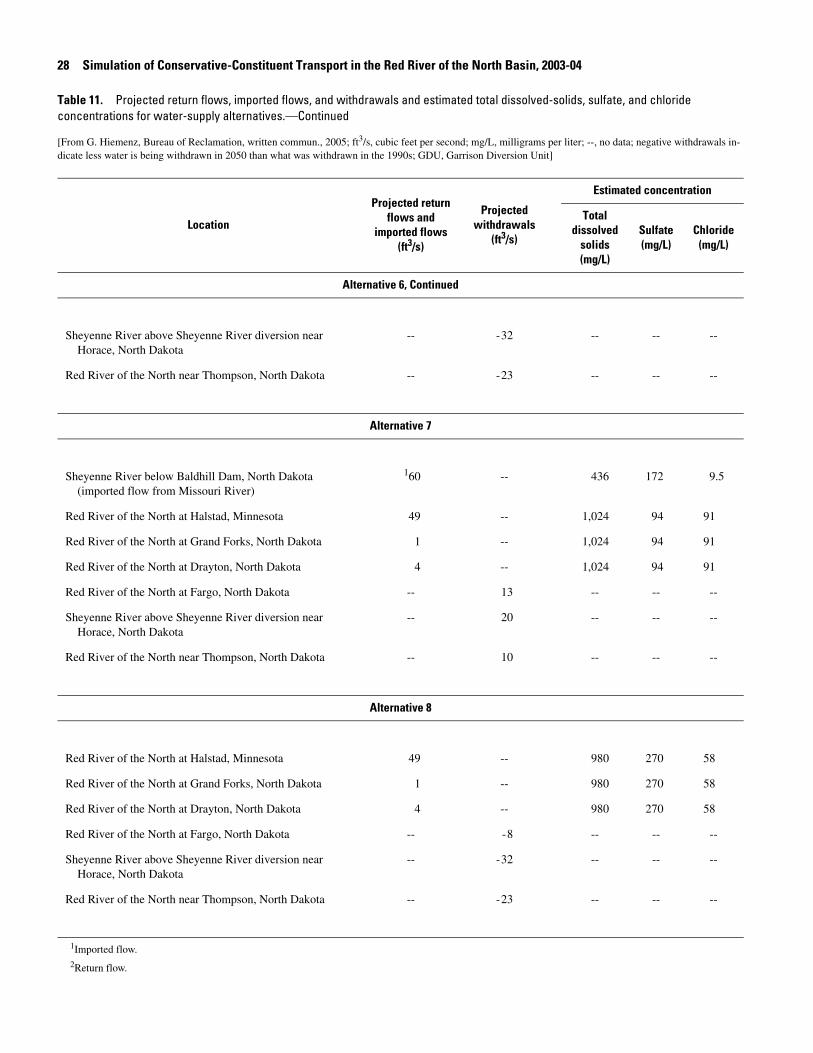
28 S
SheyH
Red
Shey(i
Red
Red
Red
Red
SheyH
Red
Red
Red
Red
Red
SheyH
Red
1Im2Re
Tableconce
[Fromdicate
imulation of Conservative-Constituent Transport in the Red River of the North Basin, 2003-04
Alternative 6, Continued
enne River above Sheyenne River diversion near orace, North Dakota
-- - 32 -- -- --
River of the North near Thompson, North Dakota -- - 23 -- -- --
Alternative 7
enne River below Baldhill Dam, North Dakota mported flow from Missouri River)
160 -- 436 172 9.5
River of the North at Halstad, Minnesota 49 -- 1,024 94 91
River of the North at Grand Forks, North Dakota 1 -- 1,024 94 91
River of the North at Drayton, North Dakota 4 -- 1,024 94 91
River of the North at Fargo, North Dakota -- 13 -- -- --
enne River above Sheyenne River diversion near orace, North Dakota
-- 20 -- -- --
River of the North near Thompson, North Dakota -- 10 -- -- --
Alternative 8
River of the North at Halstad, Minnesota 49 -- 980 270 58
11. Projected return flows, imported flows, and withdrawals and estimated total dissolved-solids, sulfate, and chloride ntrations for water-supply alternatives.—Continued
G. Hiemenz, Bureau of Reclamation, written commun., 2005; ft3/s, cubic feet per second; mg/L, milligrams per liter; --, no data; negative withdrawals in-less water is being withdrawn in 2050 than what was withdrawn in the 1990s; GDU, Garrison Diversion Unit]
Location
Projected returnflows and
imported flows(ft3/s)
Projectedwithdrawals
(ft3/s)
Estimated concentration
Totaldissolved
solids(mg/L)
Sulfate(mg/L)
Chloride(mg/L)
River of the North at Grand Forks, North Dakota 1 -- 980 270 58
River of the North at Drayton, North Dakota 4 -- 980 270 58
River of the North at Fargo, North Dakota -- - 8 -- -- --
enne River above Sheyenne River diversion near orace, North Dakota
-- - 32 -- -- --
River of the North near Thompson, North Dakota -- - 23 -- -- --
ported flow.
turn flow.
so18thaimenfrocosocealtmgFocoba
Su
8 (orexSiRe19effurfoimN.(fiGrtrafroN.(fifloenrel(taadco
Ch
threraaculaRianon20thaim
Simulation of Conservative-Constituent Transport 29
lved solids in the Sheyenne River at Lisbon, N. Dak. (figure a at back of report). The concentrations for alternative 7 for t site decreased from 792 mg/L to 581 mg/L as a result of an ported flow of 60 ft3/s from the Missouri River to the Shey-ne River below Baldhill Dam, N. Dak. (table 11). The water m the Missouri River had a fairly low total dissolved-solids ncentration. Alternative 2 had the largest effect on total dis-lved solids in the Red River at Emerson, Manitoba. The con-ntrations for alternative 2 increased in relation to those for ernative 1. The concentrations increased from 709 to 798 /L as a result of low streamflow in the reach between Grand rks, N. Dak., and Emerson and high total dissolved-solids ncentrations in tributary flows to that reach (figure 18c at ck of report).
lfate
Simulated sulfate concentrations for alternatives 2 through the action alternatives) for the Sheyenne River were equal to less than those for alternative 1 (the no-action alternative) cept for alternative 5 (figures 19a and 19b at back of report). mulated concentrations for alternatives 2 through 8 for the d River varied in relation to those for alternative 1 (figures c and 19d at back of report). Alternative 2 had the largest ect on sulfate in the Sheyenne River at Lisbon, N. Dak. (fig-
e 19a at back of report). The concentrations for alternative 2 r that site decreased from 306 to 207 mg/L as a result of an ported flow of 30 ft3/s from the Red River at Grand Forks, Dak., to the Sheyenne River below Baldhill Dam, N. Dak. gure 19a at back of report). The water from the Red River at and Forks had a fairly low sulfate concentration. The concen-tions for alternative 5 for the Sheyenne River downstream m Lisbon and for the Red River downstream from Fargo, Dak., were consistently higher than those for alternative 1 gures 19b and 19d at back of report) as a result of an imported w of 114 ft3/s from the Garrison Diversion Unit to the Shey-ne River below Baldhill Dam, N. Dak., and an additional ease of 71 ft3/s to the Sheyenne River at Valley City, N. Dak. ble 11). The water from the Garrison Diversion Unit and the ditional release from Baldhill Dam had fairly high sulfate
The water from the Missouri River had a fairly low chloride concentration. The concentrations for alternative 2 for the Red River at Emerson, Manitoba, increased in relation to those for alternative 1 (figure 20c at back of report). The concentrations increased from 103 to 112 mg/L as a result of low streamflow in the reach between Grand Forks, N. Dak., and Emerson and high chloride concentrations in tributary flows to that reach.
Uncertainty of Simulation Results
Simulation results obtained with the September 2003 streamflows contain some uncertainty as reflected in the mean calibration errors give in table 9. This uncertainty is a result of uncertainty in the data, limiting assumptions in the model framework, and uncertainty about constituent loads from all sources. If the difference between the simulated concentration for alternative 1 (the no-action alternative) and the simulated concentration for an action alternative exceeds the mean cali-bration error for a particular constituent, the proposed alterna-tive may have some effect on water quality. If, however, the dif-ference is less than the mean calibration error, the effect of the proposed alternative on water quality is uncertain.
To determine the effects of the water-supply alternatives on water quality in the Red River and the Sheyenne River, mean simulated total dissolved-solids, sulfate, and chloride concen-trations for each of the alternatives were calculated from con-centrations at the 11 model calibration points (table 8). The mean simulated concentration for each action alternative then was subtracted from the mean simulated concentration for alter-native 1 (the no-action alternative) (table 12). Results indicate total dissolved-solids concentrations may decrease for alterna-tives 2 and 7, sulfate concentrations may decrease for alterna-tives 2 and 7 and increase for alternative 5, and chloride concen-trations may decrease for alternatives 5, 7, and 8. The differences between the mean simulated concentrations for alternatives 3, 4, 6, and 8 were less than calibration errors, indi-cating the effects of those alternatives on water quality in the rivers is uncertain.
ncentrations.
loride
Simulated chloride concentrations for alternatives 2 ough 8 (the action alternatives) for the Sheyenne River gen-lly were equal to or less than those for alternative 1 (the no-
tion alternative) (figures 20a and 20b at back of report). Sim-ted concentrations for alternatives 2 through 8 for the Red
ver varied in relation to those for alternative 1 (figures 20c d 20d at back of report). Alternative 7 had the largest effect chloride in the Sheyenne River at Lisbon, N. Dak. (figure b at back of report). The concentrations for alternative 7 for t site decreased from 40.4 to 22.0 mg/L as a result of an ported flow of 60 ft3/s from the Missouri River (table 11).
Simulations with Reduced Streamflows
The effects of the water-supply alternatives identified by the Bureau of Reclamation (table 10) on conservative-constitu-ent transport in the Red River Basin also were simulated with reduced streamflows. For this set of simulations, the stream-flows that occurred during September 2003 were reduced by 25 percent (table 13). The mean differences between the total dis-solved-solids, sulfate, and chloride concentrations simulated with the September 2003 streamflows and those simulated with the reduced streamflows then were computed for each of the 11 model calibration points. The absolute mean differences are given in tables 14 through 16 along with the maximum and min-imum absolute differences for each calibration point.

30 S
Tableconce
[--, no
A
imulation of Conservative-Constituent Transport in the Red River of the North Basin, 2003-04
12. Mean simulated concentrations for water-supply alternatives and difference between concentration for alternative and ntration for alternative 1 (the no-action alternative).
data]
lternativenumber
Mean simulated concentration(milligrams per liter)
Difference betweenconcentration for alternative
and concentration foralternative 1
(milligrams per liter)
Mean calibration error(milligrams per liter)
Total dissolved solids
1 635 -- --
2 615 - 20 13
3 644 9 13
4 642 7 13
5 636 1 13
6 634 - 1 13
7 600 - 35 13
8 632 - 3 13
Sulfate
1 189 -- 4.4
2 172 - 17 4.4
3 189 0 4.4
4 189 0 4.4
5 200 11 4.4
6 190 1 4.4
7 178 - 11 4.4
8 192 3 4.4
Chloride
1 33.1 -- 1.3
2 32.2 - 0.9 1.3
3 33.7 0.6 1.3
4 33.9 0.8 1.3
5 28.7 - 4.4 1.3
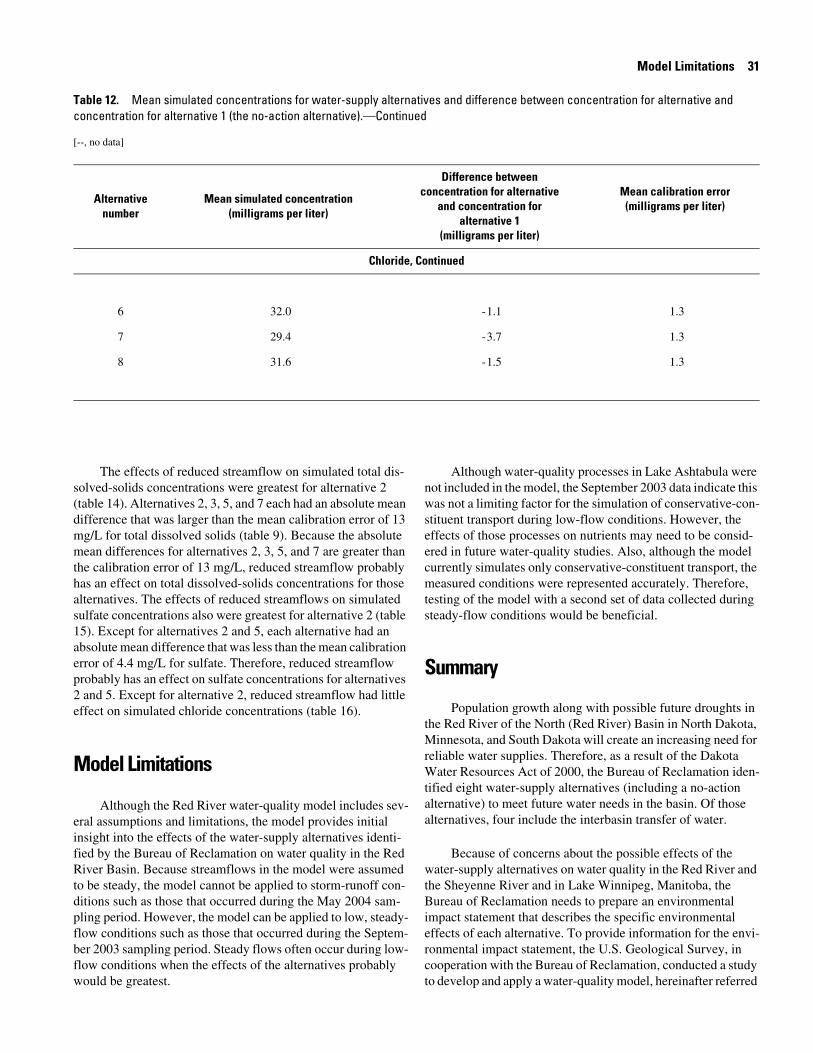
so(tadifmgmethehaaltsu15aberrpr2 aeff
M
erainsfieRito ditpliflobeflowo
Taco
[--
Model Limitations 31
The effects of reduced streamflow on simulated total dis-lved-solids concentrations were greatest for alternative 2 ble 14). Alternatives 2, 3, 5, and 7 each had an absolute mean ference that was larger than the mean calibration error of 13 /L for total dissolved solids (table 9). Because the absolute an differences for alternatives 2, 3, 5, and 7 are greater than calibration error of 13 mg/L, reduced streamflow probably
s an effect on total dissolved-solids concentrations for those ernatives. The effects of reduced streamflows on simulated lfate concentrations also were greatest for alternative 2 (table ). Except for alternatives 2 and 5, each alternative had an solute mean difference that was less than the mean calibration or of 4.4 mg/L for sulfate. Therefore, reduced streamflow
obably has an effect on sulfate concentrations for alternatives nd 5. Except for alternative 2, reduced streamflow had little ect on simulated chloride concentrations (table 16).
Although water-quality processes in Lake Ashtabula were not included in the model, the September 2003 data indicate this was not a limiting factor for the simulation of conservative-con-stituent transport during low-flow conditions. However, the effects of those processes on nutrients may need to be consid-ered in future water-quality studies. Also, although the model currently simulates only conservative-constituent transport, the measured conditions were represented accurately. Therefore, testing of the model with a second set of data collected during steady-flow conditions would be beneficial.
Summary
Population growth along with possible future droughts in the Red River of the North (Red River) Basin in North Dakota, Minnesota, and South Dakota will create an increasing need for
Chloride, Continued
6 32.0 - 1.1 1.3
7 29.4 - 3.7 1.3
8 31.6 - 1.5 1.3
ble 12. Mean simulated concentrations for water-supply alternatives and difference between concentration for alternative and ncentration for alternative 1 (the no-action alternative).—Continued
, no data]
Alternativenumber
Mean simulated concentration(milligrams per liter)
Difference betweenconcentration for alternative
and concentration foralternative 1
(milligrams per liter)
Mean calibration error(milligrams per liter)
odel Limitations
Although the Red River water-quality model includes sev-l assumptions and limitations, the model provides initial ight into the effects of the water-supply alternatives identi-d by the Bureau of Reclamation on water quality in the Red ver Basin. Because streamflows in the model were assumed be steady, the model cannot be applied to storm-runoff con-ions such as those that occurred during the May 2004 sam-ng period. However, the model can be applied to low, steady-w conditions such as those that occurred during the Septem-r 2003 sampling period. Steady flows often occur during low-w conditions when the effects of the alternatives probably uld be greatest.
reliable water supplies. Therefore, as a result of the Dakota Water Resources Act of 2000, the Bureau of Reclamation iden-tified eight water-supply alternatives (including a no-action alternative) to meet future water needs in the basin. Of those alternatives, four include the interbasin transfer of water.
Because of concerns about the possible effects of the water-supply alternatives on water quality in the Red River and the Sheyenne River and in Lake Winnipeg, Manitoba, the Bureau of Reclamation needs to prepare an environmental impact statement that describes the specific environmental effects of each alternative. To provide information for the envi-ronmental impact statement, the U.S. Geological Survey, in cooperation with the Bureau of Reclamation, conducted a study to develop and apply a water-quality model, hereinafter referred
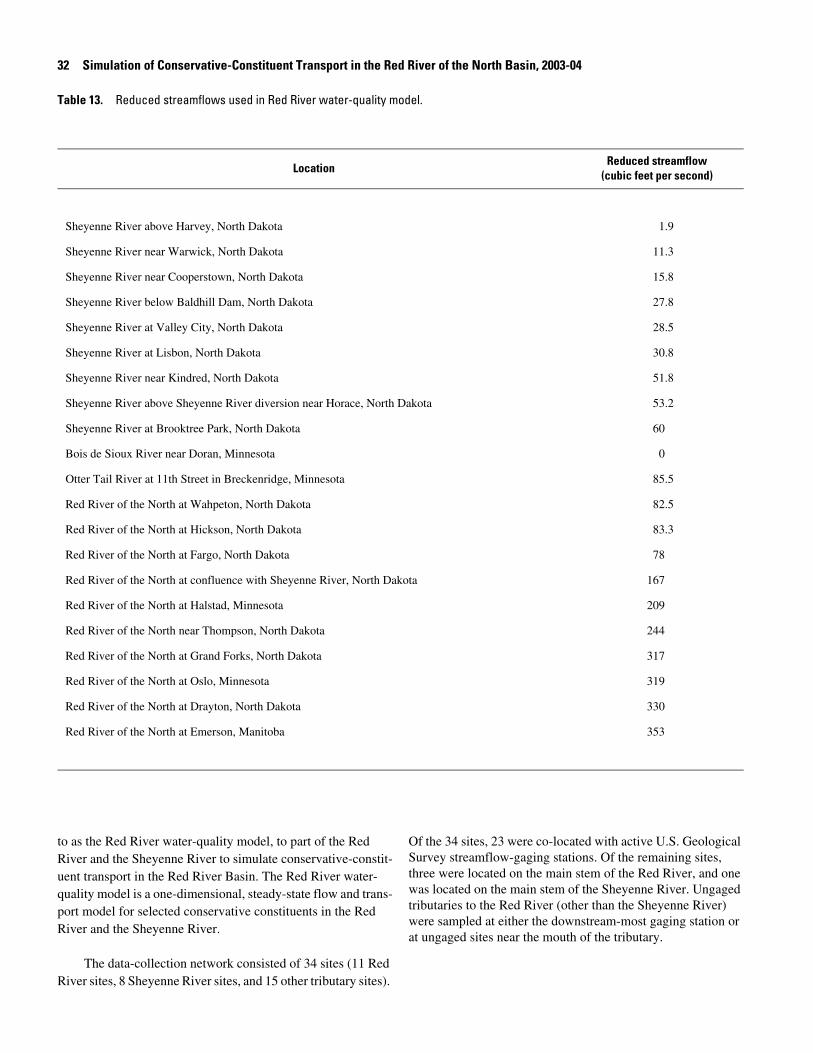
32 S
to as Riveruent tqualiport mRiver
River
Table
Shey
Shey
Shey
Shey
Shey
Shey
Shey
Shey
Shey
Bois
Otte
Red
Red
Red
Red
Red
Red
Red
Red
Red
Red
imulation of Conservative-Constituent Transport in the Red River of the North Basin, 2003-04
13. Reduced streamflows used in Red River water-quality model.
LocationReduced streamflow
(cubic feet per second)
enne River above Harvey, North Dakota 1.9
enne River near Warwick, North Dakota 11.3
enne River near Cooperstown, North Dakota 15.8
enne River below Baldhill Dam, North Dakota 27.8
enne River at Valley City, North Dakota 28.5
enne River at Lisbon, North Dakota 30.8
enne River near Kindred, North Dakota 51.8
enne River above Sheyenne River diversion near Horace, North Dakota 53.2
enne River at Brooktree Park, North Dakota 60
de Sioux River near Doran, Minnesota 0
r Tail River at 11th Street in Breckenridge, Minnesota 85.5
River of the North at Wahpeton, North Dakota 82.5
River of the North at Hickson, North Dakota 83.3
River of the North at Fargo, North Dakota 78
River of the North at confluence with Sheyenne River, North Dakota 167
River of the North at Halstad, Minnesota 209
River of the North near Thompson, North Dakota 244
River of the North at Grand Forks, North Dakota 317
River of the North at Oslo, Minnesota 319
River of the North at Drayton, North Dakota 330
River of the North at Emerson, Manitoba 353
the Red River water-quality model, to part of the Red and the Sheyenne River to simulate conservative-constit-ransport in the Red River Basin. The Red River water-
ty model is a one-dimensional, steady-state flow and trans-odel for selected conservative constituents in the Red
and the Sheyenne River.
The data-collection network consisted of 34 sites (11 Red sites, 8 Sheyenne River sites, and 15 other tributary sites).
Of the 34 sites, 23 were co-located with active U.S. Geological Survey streamflow-gaging stations. Of the remaining sites, three were located on the main stem of the Red River, and one was located on the main stem of the Sheyenne River. Ungaged tributaries to the Red River (other than the Sheyenne River) were sampled at either the downstream-most gaging station or at ungaged sites near the mouth of the tributary.
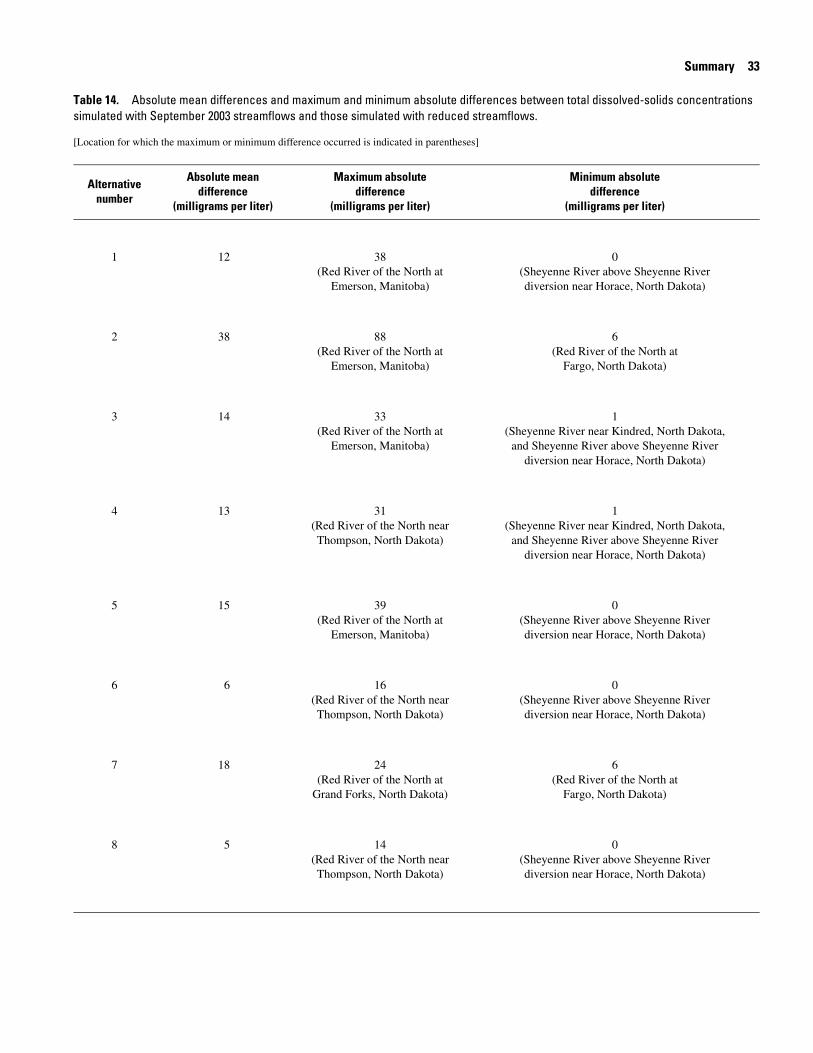
Tasim
[Lo
Summary 33
ble 14. Absolute mean differences and maximum and minimum absolute differences between total dissolved-solids concentrations ulated with September 2003 streamflows and those simulated with reduced streamflows.
cation for which the maximum or minimum difference occurred is indicated in parentheses]
Alternativenumber
Absolute meandifference
(milligrams per liter)
Maximum absolutedifference
(milligrams per liter)
Minimum absolutedifference
(milligrams per liter)
1 12 38(Red River of the North at
Emerson, Manitoba)
0(Sheyenne River above Sheyenne Riverdiversion near Horace, North Dakota)
2 38 88(Red River of the North at
Emerson, Manitoba)
6(Red River of the North at
Fargo, North Dakota)
3 14 33(Red River of the North at
Emerson, Manitoba)
1(Sheyenne River near Kindred, North Dakota,
and Sheyenne River above Sheyenne Riverdiversion near Horace, North Dakota)
4 13 31(Red River of the North nearThompson, North Dakota)
1(Sheyenne River near Kindred, North Dakota,
and Sheyenne River above Sheyenne Riverdiversion near Horace, North Dakota)
5 15 39(Red River of the North at
Emerson, Manitoba)
0(Sheyenne River above Sheyenne Riverdiversion near Horace, North Dakota)
6 6 16(Red River of the North nearThompson, North Dakota)
0(Sheyenne River above Sheyenne Riverdiversion near Horace, North Dakota)
7 18 24(Red River of the North at
Grand Forks, North Dakota)
6(Red River of the North at
Fargo, North Dakota)
8 5 14(Red River of the North nearThompson, North Dakota)
0(Sheyenne River above Sheyenne Riverdiversion near Horace, North Dakota)
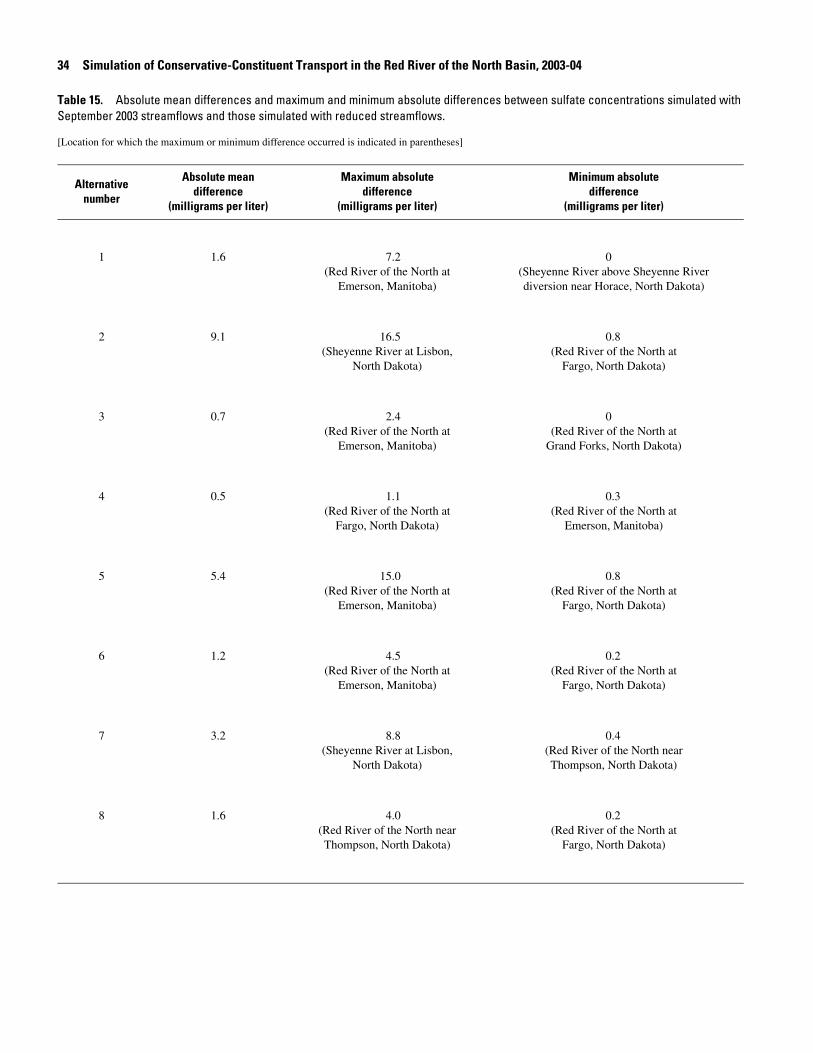
34 S
TableSepte
[Locat
Aln
imulation of Conservative-Constituent Transport in the Red River of the North Basin, 2003-04
15. Absolute mean differences and maximum and minimum absolute differences between sulfate concentrations simulated with mber 2003 streamflows and those simulated with reduced streamflows.
ion for which the maximum or minimum difference occurred is indicated in parentheses]
ternativeumber
Absolute meandifference
(milligrams per liter)
Maximum absolutedifference
(milligrams per liter)
Minimum absolutedifference
(milligrams per liter)
1 1.6 7.2(Red River of the North at
Emerson, Manitoba)
0(Sheyenne River above Sheyenne Riverdiversion near Horace, North Dakota)
2 9.1 16.5(Sheyenne River at Lisbon,
North Dakota)
0.8(Red River of the North at
Fargo, North Dakota)
3 0.7 2.4(Red River of the North at
Emerson, Manitoba)
0(Red River of the North at
Grand Forks, North Dakota)
4 0.5 1.1(Red River of the North at
Fargo, North Dakota)
0.3(Red River of the North at
Emerson, Manitoba)
5 5.4 15.0(Red River of the North at
Emerson, Manitoba)
0.8(Red River of the North at
Fargo, North Dakota)
6 1.2 4.5(Red River of the North at
Emerson, Manitoba)
0.2(Red River of the North at
Fargo, North Dakota)
7 3.2 8.8(Sheyenne River at Lisbon,
North Dakota)
0.4(Red River of the North nearThompson, North Dakota)
8 1.6 4.0(Red River of the North nearThompson, North Dakota)
0.2(Red River of the North at
Fargo, North Dakota)
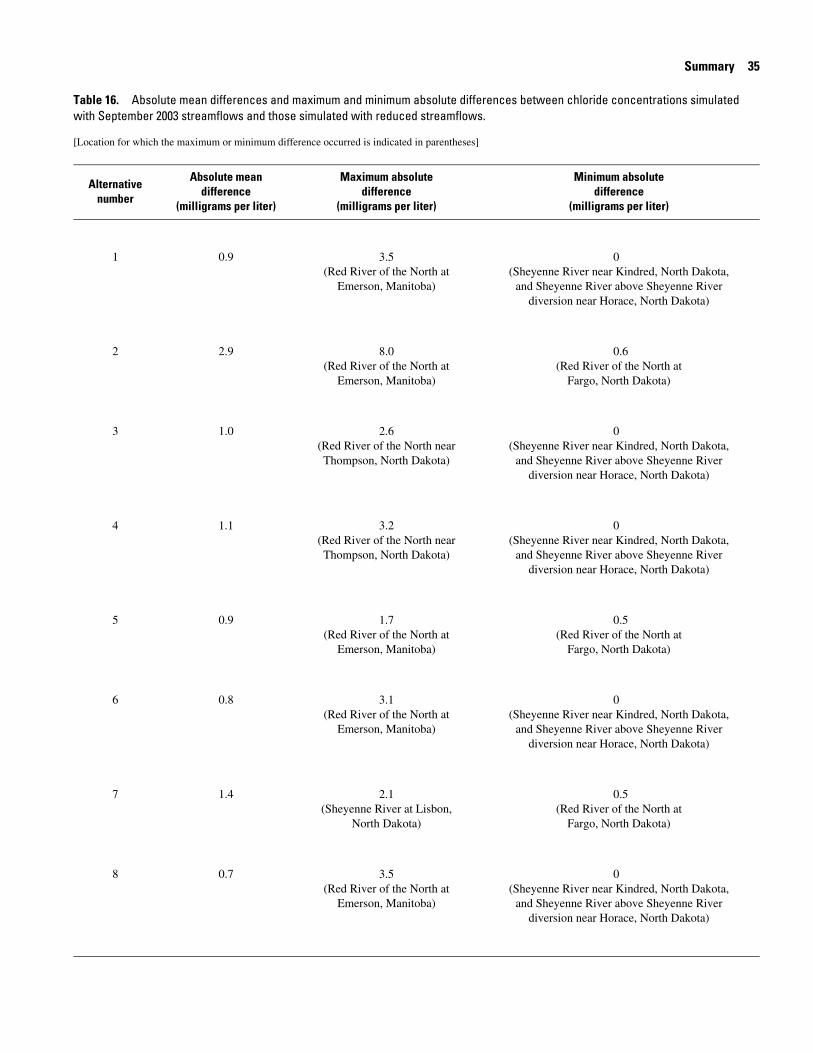
Tawi
[Lo
Summary 35
ble 16. Absolute mean differences and maximum and minimum absolute differences between chloride concentrations simulated th September 2003 streamflows and those simulated with reduced streamflows.
cation for which the maximum or minimum difference occurred is indicated in parentheses]
Alternativenumber
Absolute meandifference
(milligrams per liter)
Maximum absolutedifference
(milligrams per liter)
Minimum absolutedifference
(milligrams per liter)
1 0.9 3.5(Red River of the North at
Emerson, Manitoba)
0(Sheyenne River near Kindred, North Dakota,
and Sheyenne River above Sheyenne Riverdiversion near Horace, North Dakota)
2 2.9 8.0(Red River of the North at
Emerson, Manitoba)
0.6(Red River of the North at
Fargo, North Dakota)
3 1.0 2.6(Red River of the North nearThompson, North Dakota)
0(Sheyenne River near Kindred, North Dakota,
and Sheyenne River above Sheyenne Riverdiversion near Horace, North Dakota)
4 1.1 3.2(Red River of the North nearThompson, North Dakota)
0(Sheyenne River near Kindred, North Dakota,
and Sheyenne River above Sheyenne Riverdiversion near Horace, North Dakota)
5 0.9 1.7(Red River of the North at
Emerson, Manitoba)
0.5(Red River of the North at
Fargo, North Dakota)
6 0.8 3.1(Red River of the North at
Emerson, Manitoba)
0(Sheyenne River near Kindred, North Dakota,
and Sheyenne River above Sheyenne Riverdiversion near Horace, North Dakota)
7 1.4 2.1(Sheyenne River at Lisbon,
North Dakota)
0.5(Red River of the North at
Fargo, North Dakota)
8 0.7 3.5(Red River of the North at
Emerson, Manitoba)
0(Sheyenne River near Kindred, North Dakota,
and Sheyenne River above Sheyenne Riverdiversion near Horace, North Dakota)
36 S
flow ing m13, 2qualiupstrN. DaLoadance,streamchargrelatimode
were the mically2003Riverthe tithe SstreamTail Renne percethe sa
2004muchthe arhigheRiverflowsthan dRed RRed Rdurinenne part owhat whenarea, exceefrom mout11, 20cent omout11, 20Minnthe Rstreampercethe m
imulation of Conservative-Constituent Transport in the Red River of the North Basin, 2003-04
Water-quality samples were collected during low, steady-conditions from September 15 through 16, 2003, and dur-edium, unsteady-flow conditions from May 10 through
004. During the September 2003 sampling period, water-ty samples were collected from the Red River immediately eam and immediately downstream from the Fargo, k., and Moorhead, Minn., wastewater-treatment facilities.
s and concentrations then were determined by mass bal- and the differences between the upstream and down-
concentrations were attributed to the wastewater dis-es. Only withdrawals and return flows that were large in on to flow in the river were included in the water-quality l.
Streamflows during the September 2003 sampling period low. For example, streamflows for the Red Lake River at outh and the Red River at Emerson, Manitoba, are histor- lower than streamflows measured on September 15, , for the Red Lake River at Fisher, Minn., and the Red at Emerson, Manitoba, respectively, about 16 percent of me. Streamflows for the Otter Tail River at the mouth and heyenne River at the mouth are historically lower than
flows measured on September 16, 2003, for the Otter iver at 11th Street in Breckenridge, Minn., and the Shey-
River at Brooktree Park, N. Dak., respectively, about 30 nt of the time. Streamflows were generally steady during mpling period.
On May 11 and 12, 2004, during the middle of the May sampling period, widespread rainfall occurred throughout of the Red River Basin. On May 11, rainfall amounts in ea east of the Red River and north of Fargo, N. Dak., were r than those in the upper part of the Red and Sheyenne Basins. As a result of the widespread rainfall, stream- during the May 2004 sampling period were less steady uring the September 2003 sampling period except in the iver upstream from Fargo, N. Dak. Streamflow for the iver at Emerson, Manitoba, increased about 50 percent
g the sampling period. However, streamflows in the Shey-River increased only slightly because of less rainfall in that f the basin than in other parts of the basin. In contrast to occurred during the September 2003 sampling period
May 12, 2004, for the Sheyenne River at Brooktree Park, N. Dak., about 85 percent of the time. The unsteady flows and the collection of some samples during low-flow conditions and other samples during storm-runoff conditions complicated application of the model to the May 2004 sampling period.
Measured total dissolved-solids concentrations for the Red River generally were less than the U.S. Environmental Protec-tion Agency secondary water-quality standard of 500 milli-grams per liter. During the September 2003 sampling period, concentrations for the Sheyenne River were greater than 500 milligrams per liter. The highest concentrations were for the upstream part of the Sheyenne River Basin. Concentrations for several tributaries to the Red River were fairly large, but streamflows in those tributaries were less than 12 cubic feet per second during the September 2003 sampling period. Thus, total dissolved-solids loads from those tributaries to the Red River were small.
The Red River water-quality model was calibrated and tested using data collected from September 15 through 16, 2003, and from May 10 through 13, 2004. The model simulates flow and transport of total dissolved solids, sulfate, and chloride during steady-state conditions. The U.S. Army Corps of Engi-neers HEC-5Q water-quality model was modified for this study by (1) extending the computational grid and (2) specifying boundary conditions. Boundary conditions included natural inflows and outflows of water and constituents and withdrawals and return flows. The physical domain of the Red River water-quality model included the Red River from the confluence of the Bois de Sioux and Otter Tail Rivers to the Red River at Emerson, Manitoba, and the Sheyenne River from above Har-vey, N. Dak., to the confluence with the Red River.
Small point-source discharges and withdrawals were not included in the model but were accounted for through mass bal-ances of streamflow and constituent concentrations within a reach. Withdrawals by the cities of Fargo, N. Dak., Grand Forks, N. Dak., and Moorhead, Minn., also were not included in the model but were accounted for through changes in stream-flow at locations upstream and downstream from the withdraw-als.
streamflows were consistently low throughout the study the percentage of time streamflow was equaled or ded during the May 2004 sampling period varied widely site to site. Streamflow for the Red Lake River at the h is historically lower than streamflow measured on May 04, for the Red Lake River at Fisher, Minn., about 30 per-f the time. Streamflow for the Otter Tail River at the
h is historically lower than streamflow measured on May 04, for the Otter Tail River at 11th Street in Breckenridge,
., about 55 percent of the time. In contrast, streamflow for ed River at Emerson, Manitoba, is historically lower than
flow measured on May 10, 2004, for that site about 70 nt of the time, and streamflow for the Sheyenne River at outh is historically lower than streamflow measured on
Simulated streamflows and total dissolved-solids, sulfate, and chloride concentrations at 11 model calibration points were compared to measured streamflows and concentrations. The calibration points are located throughout the model domain and several are located near withdrawal and return-flow locations. The simulated total dissolved-solids concentrations were within 5 percent of the measured concentrations for all model calibra-tion points. The simulated sulfate and chloride concentrations were within 5 percent of the measured concentrations for all model calibration points except the Red River at Fargo, N. Dak., and the Red River at Grand Forks, N. Dak. The differences for those locations were larger than 5 percent because of loss of streamflow or a combined tributary streamflow that was more
thatio
coShfieula20sim25dreffbly
tratraaltaltthelownalattheun
sofosim2, naha
erainsqumoto theapocfloof
nowastiefferecume
References 37
n the streamflow measured for the next downstream loca-n.
The Red River water-quality model was used to simulate nservative-constituent transport in the Red River and the eyenne River for the eight water-supply alternatives identi-d by the Bureau of Reclamation. For the first set of eight sim-tions, September 2003 streamflows were used with projected 50 return flows and withdrawals. For the second set of eight ulations, the September 2003 streamflows were reduced by
percent. Projected return flows, imported flows, and with-awals were not adjusted from previous simulations. The ects of the alternatives on constituent concentrations proba- would be greatest during low-flow conditions.
Simulation results indicate total dissolved-solids concen-tions may decrease for alternatives 2 and 7, sulfate concen-tions may decrease for alternatives 2 and 7 and increase for ernative 5, and chloride concentrations may decrease for ernatives 5, 7, and 8. Other than for sulfate for alternative 5, concentrations for alternatives 2, 5, and 7 generally were er than for alternative 1 (the no-action alternative). For alter-
tives 3, 4, 6 and 8, the differences between the mean simu-ed concentrations were less than calibration errors, indicating effects of those alternatives on water quality in the rivers is certain.
The effects of reduced streamflow on simulated total dis-lved-solids, sulfate, and chloride concentrations were greatest r alternative 2. Reduced streamflow probably has an effect on
ulated total dissolved-solids concentrations for alternatives 3, 5, and 7 and on simulated sulfate concentrations for alter-tives 2 and 5. Except for alternative 2, reduced streamflow d little effect on simulated chloride concentrations.
Although the Red River water-quality model includes sev-l assumptions and limitations, the model provides initial ight into the effects of the water-supply alternatives on water ality in the Red River Basin. Because streamflows in the del were assumed to be steady, the model cannot be applied
testing of the model with a second set of data collected during steady-flow conditions would be beneficial.
References
Brunner, G.W., 2002, HEC-RAS, River analysis system user’s manual, version 3.1: Davis, California, U.S. Army Corps of Engineers Hydrologic Engineering Center, Report CPD-68, variously paginated.
Emerson, D.G., 2005, Historic and naturalized monthly stream-flow for selected sites in the Red River of the North Basin in North Dakota, Minnesota, and South Dakota, 1931-2001: U.S. Geological Survey Scientific Investigations Report 2005-5092, 228 p.
Klipsch, J.D., 2003, HEC-ResSim, Reservoir simulation system user’s manual, version 2.0: Davis, California, U.S. Army Corps of Engineers Hydrologic Engineering Center, Report CPD-82, 426 p.
North Dakota Agricultural Weather Network, 2005, NDAWN station locations (2005-06-08): accessed June 9, 2005, at http://ndawn.ndsu.nodak.edu/.
Resource Management Associates, 1996a, HEC-5 users man-ual, Simulation of flood control and conservation systems, Appendix on water quality analysis: Suisun City, California, Prepared for the U.S. Army Corps of Engineers, 84 p.
Resource Management Associates, 1996b, Water quality mod-eling of reservoir system operations using HEC-5Q: Suisun City, California, Training document prepared for the U.S. Army Corps of Engineers, 99 p.
Robinson, S.M., Lundgren, R.F., Sether, B.A., Norbeck, S.W., and Lambrecht, J.M., 2004, Water resources data—North Dakota, Water year 2003, Volume 1, Surface water: U.S. Geological Survey Water-Data Report ND-03-1, 583 p.
Robinson, S.M., Lundgren, R.F., Sether, B.A., Norbeck, S.W., and Lambrecht, J.M., 2005, Water resources data—North Dakota, Water year 2004, Volume 1, Surface water: U.S. Geological Survey Water-Data Report ND-04-1, 621 p.
storm-runoff conditions such as those that occurred during May 2004 sampling period. However, the model can be
plied to low, steady-flow conditions such as those that curred during the September 2003 sampling period. Steady ws often occur during low-flow conditions when the effects
the alternatives probably would be greatest.
Although water-quality processes in Lake Ashtabula were t included in the model, the September 2003 data indicate this s not a limiting factor for the simulation of conservative-con-tuent transport during low-flow conditions. However, the ects of those processes on nutrients may need to be consid-d in future water-quality studies. Also, although the model
rrently simulates only conservative-constituent transport, the asured conditions were represented accurately. Therefore,
Sether, B.A., Berkas,W.R., and Vecchia, A.V., 2004, Constitu-ent loads and flow-weighted average concentrations for major subbasins of the upper Red River of the North Basin, 1997-99: U.S. Geological Survey Scientific Investigations Report 2004-5200, 62 p.
Stoner, J.D., Lorenz, D.L., Goldstein, R.M., Brigham, M.E., and Cowdery, T.K., 1998, Water quality in the Red River of the North Basin, Minnesota, North Dakota, and South Dakota, 1992-95: U.S. Geological Survey Circular 1169, 33 p.
Stoner, J.D., Lorenz, D.L., Wiche, G.J., and Goldstein, R.M., 1993, Red River of the North Basin, Minnesota, North Dakota, and South Dakota: Water Resources Bulletin, v. 29, no. 4, p. 575-614.
38 S
StrobwaDatio
Torneof Datig
TorneentReSoRe
U.S. flosioRe
U.S. Dasta
U.S. Ba
imulation of Conservative-Constituent Transport in the Red River of the North Basin, 2003-04
el, M.L., and Haffield, N.D., 1995, Salinity in surface ter in the Red River of the North Basin, northeastern North kota: U.S. Geological Survey Water-Resources Investiga-ns Report 95-4082, 14 p.
s, L.H., 2005, Water quality of streams in the Red River the North Basin, Minnesota, North Dakota, and South kota, 1970-2001: U.S. Geological Survey Scientific Inves-ations Report 2005-5095, 81 p.
s, L.H., Brigham, M.E., and Lorenz, D.L., 1997, Nutri-s, suspended sediment, and pesticides in streams in the d River of the North Basin, Minnesota, North Dakota, and uth Dakota, 1993-95: U.S. Geological Survey Water-sources Investigations Report 97-4053, 70 p.
Army Corps of Engineers, 1998, HEC-5, Simulation of od control and conservation systems user’s manual, ver-n 8.0: Davis, California, Hydrologic Engineering Center, port CPD-5, various pagination.
Army Corps of Engineers, 2003, Final Devils Lake, North kota, integrated planning report and environmental impact tement: St. Paul, Minnesota, various pagination.
Army Corps of Engineers, 2005, Water quality data, ldhill Reservoir above Valley City, ND: accessed June 27,
2005, at http://www.mvp-wc.usace.army.mil/cgi-bin/wq/wq_init.plx?site=baldhill
U.S. Department of the Interior, Bureau of Reclamation, 2005, Reclamation, Managing water in the west--Executive sum-mary, Draft report on Red River Valley water needs and options: 24 p.
U.S. Environmental Protection Agency, 2005, List of drinking water contaminants and MCLs: accessed November 1, 2005, at URL http://www.epa.gov/safewater/mcl.html
U.S. Geological Survey, 2005, Water quality data for North Dakota: accessed December 5, 2005, at http://water-data.usgs.gov/nd/nwis/qw
U.S. Geological Survey, variously dated, National field manual for the collection of water-quality data: U.S. Geological Survey Techniques of Water-Resources Investigations, book 9, chaps. A1-A9, available online at http://pubs.water.usgs.gov/twri9A
Willey, R.G., 1987, Water quality modeling of reservoir system operations using HEC-5: Davis, California, U.S. Army Corps of Engineers Hydrologic Engineering Center, Training docu-ment 24, various pagination.
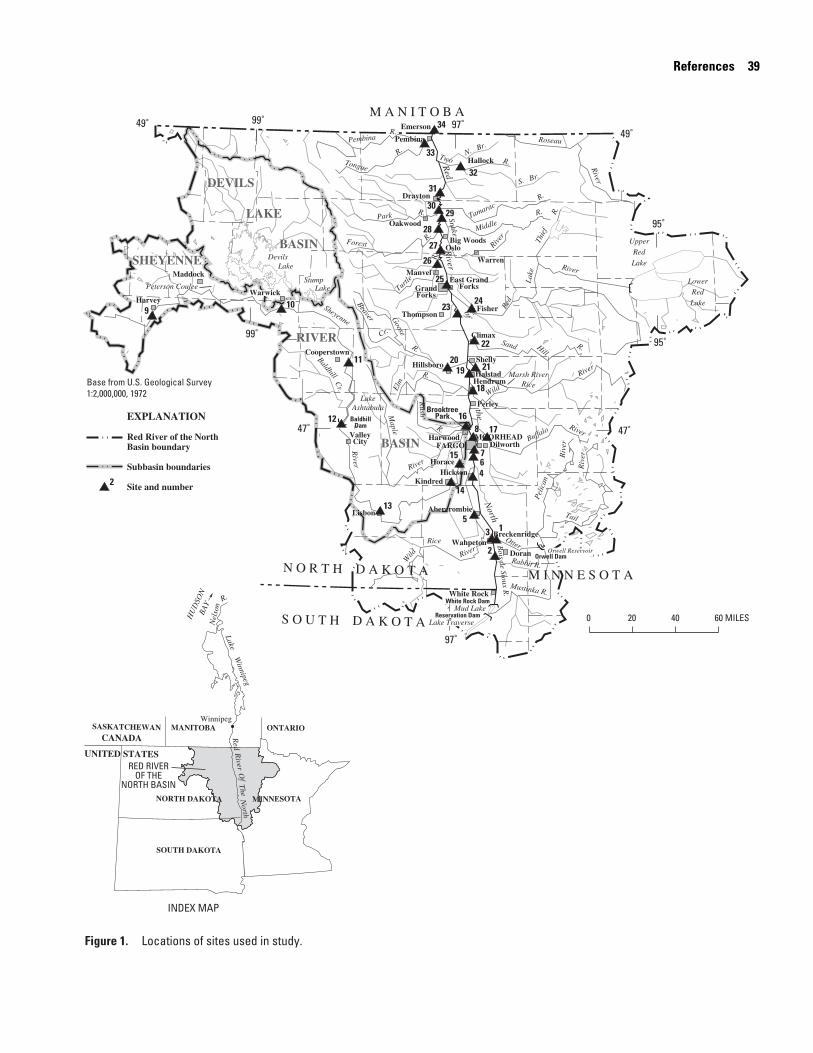
References 39
Red
River
ofthe
North
N O R T H D A K O T A M I N N E S O T A
M A N I T O B A
S O U T H D A K O T A
99˚ 97˚
95˚
95˚
49˚
47˚ 47˚
49˚
97˚
99˚
Base from U.S. Geological Survey1:2,000,000, 1972
0 20 40 60 MILES
9
11
12
13
14
16
15
4
7
8
6
53
2
1
2019 21
18
22
2423
25
26
17
27
28
BaldhillDam
Orwell Dam
EXPLANATION
Red River of the NorthBasin boundary
Subbasin boundaries
Site and number2
3029
31
32
33
34
10
GrandForks
Oslo
Warren
Hallock
Manvel
Drayton
Oakwood
Pembina
Emerson
FARGOHarwood MOORHEAD
Dilworth
HendrumHalstad
Shelly
Perley
Climax
FisherThompson
Lisbon
ValleyCity
Harvey
Maddock
Cooperstown
Hillsboro
Abercrombie
WahpetonDoran
Breckenridge
KindredHickson
Horace
East GrandForks
Warwick
SASKATCHEWAN MANITOBACANADA
ONTARIO
White Rock
Lake Traverse
Mud LakeWhite Rock Dam
Reservation Dam
SHEYENNE
RIVER
BASIN
DEVILS
LAKE
BASIN Big Woods
BrooktreePark
Winnipeg
Nel
son
R.
Red
Lake Winnipeg
HU
DSO
NB
AY
Upper
Red
LakeDevils
Lake
Sheyenne
River
River
River
Wild
Rice
River
Riv
erRiv
erRabbit R.
Mustinka R.
Pel
ican
Tail
OtterOrwell Reservoir
River
River
R.R
.
R.
R.
Tongue
Pembina
R.R
iver
R.
S. Br.
N. Br.
Roseau
R.
Two
River
R.
R.
MiddleTamarac
Thie
f
Red
Lake
Snake
Forest
Turtle
Park
RiceMarsh River
R.Sand Hill
Wild
BuffaloR.
R.
R.
Elm
Goose
Maple
Rush
Bois de Sioux R
.
Stump Lake
LakeAshtabula
Beaver
Baldhill
Cr.
Cr.
Lower
Red
Lake
Peterson Coulee
Figure 1. Locations of sites used in study.
INDEX MAP
RED RIVEROF THE
NORTH BASIN
UNITED STATES River
Of
TheN
orth
NORTH DAKOTA
SOUTH DAKOTA
MINNESOTA
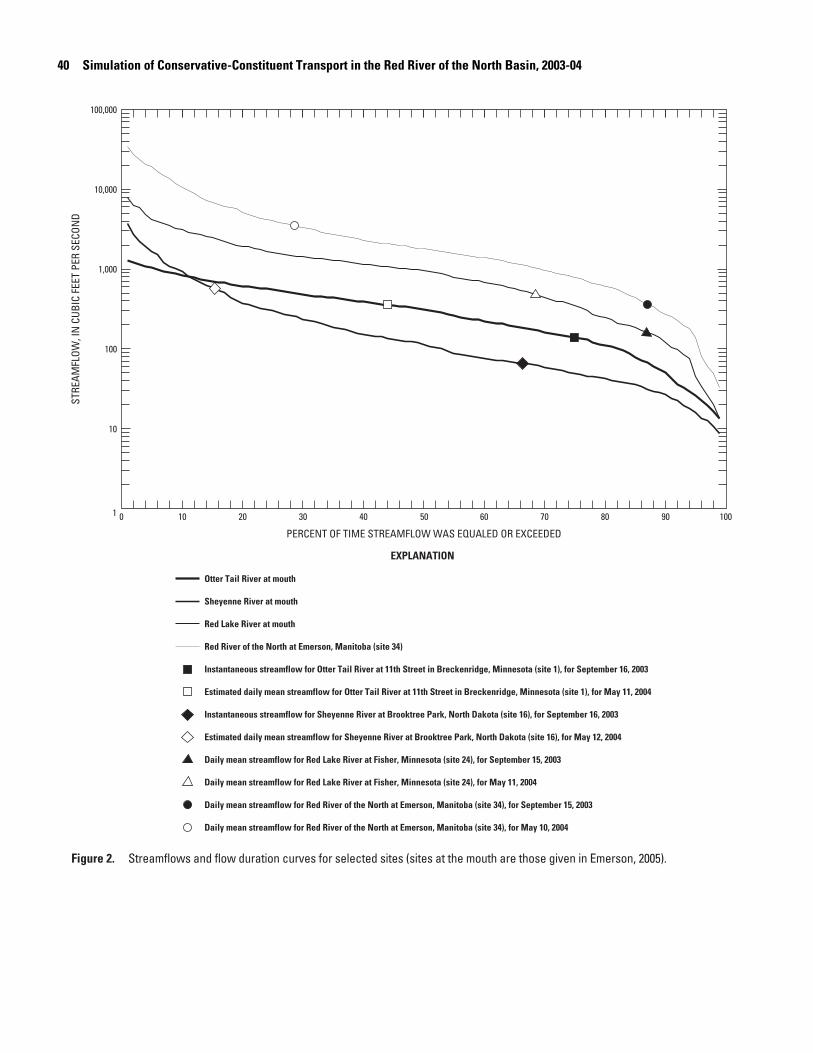
40 SST
REAM
FLOW
, IN
CUB
IC F
EET
PER
SECO
ND
Fig
imulation of Conservative-Constituent Transport in the Red River of the North Basin, 2003-04
1
10
100
1,000
10,000
100,000
0 10 20 30 40 50 60 70 80 90 100
PERCENT OF TIME STREAMFLOW WAS EQUALED OR EXCEEDED
EXPLANATION
Otter Tail River at mouth
Sheyenne River at mouth
Red Lake River at mouth
Red River of the North at Emerson, Manitoba (site 34)
Instantaneous streamflow for Otter Tail River at 11th Street in Breckenridge, Minnesota (site 1), for September 16, 2003
Estimated daily mean streamflow for Otter Tail River at 11th Street in Breckenridge, Minnesota (site 1), for May 11, 2004
Instantaneous streamflow for Sheyenne River at Brooktree Park, North Dakota (site 16), for September 16, 2003
Estimated daily mean streamflow for Sheyenne River at Brooktree Park, North Dakota (site 16), for May 12, 2004
Daily mean streamflow for Red Lake River at Fisher, Minnesota (site 24), for September 15, 2003
Daily mean streamflow for Red Lake River at Fisher, Minnesota (site 24), for May 11, 2004
Daily mean streamflow for Red River of the North at Emerson, Manitoba (site 34), for September 15, 2003
Daily mean streamflow for Red River of the North at Emerson, Manitoba (site 34), for May 10, 2004
ure 2. Streamflows and flow duration curves for selected sites (sites at the mouth are those given in Emerson, 2005).
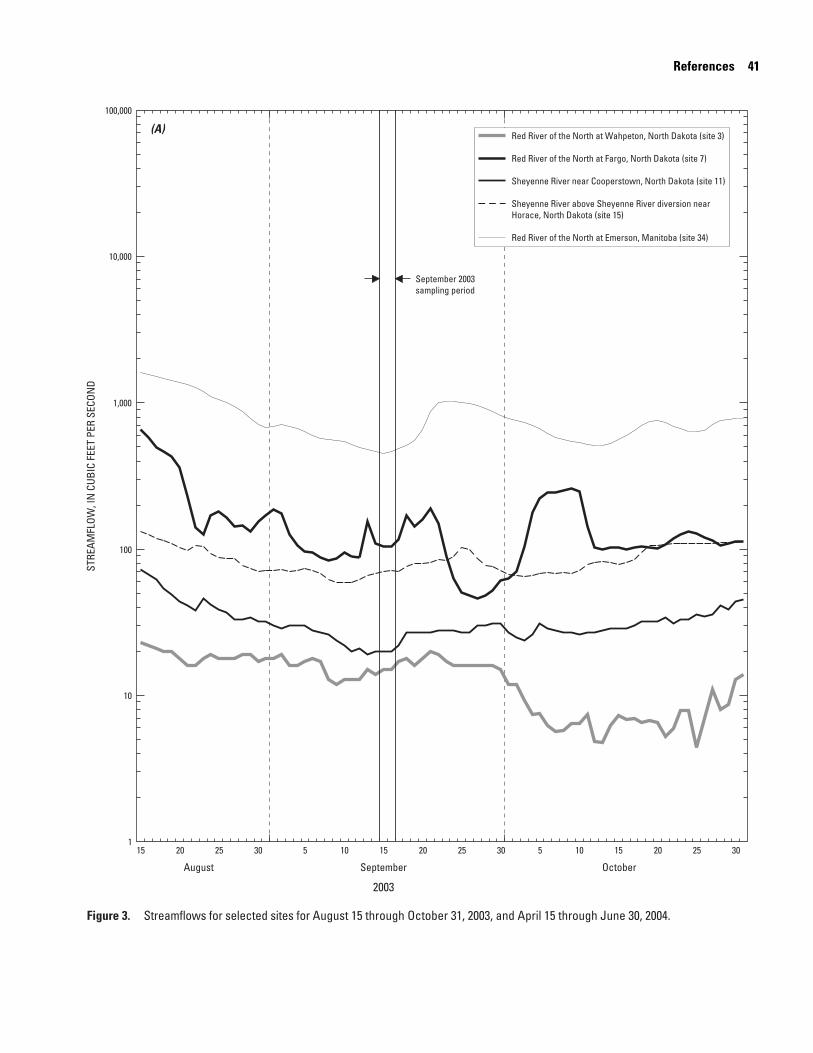
References 41
September 2003sampling period
100,000
10,000
1,000
100
10
STRE
AMFL
OW, I
N C
UBIC
FEE
T PE
R SE
CON
D
Red River of the North at Wahpeton, North Dakota (site 3)
Red River of the North at Fargo, North Dakota (site 7)
Sheyenne River near Cooperstown, North Dakota (site 11)
Sheyenne River above Sheyenne River diversion nearHorace, North Dakota (site 15)
Red River of the North at Emerson, Manitoba (site 34)
(A)
30252015 30252015105 30252015105
Figure 3. Streamflows for selected sites for August 15 through October 31, 2003, and April 15 through June 30, 2004.
August September
2003
October
1
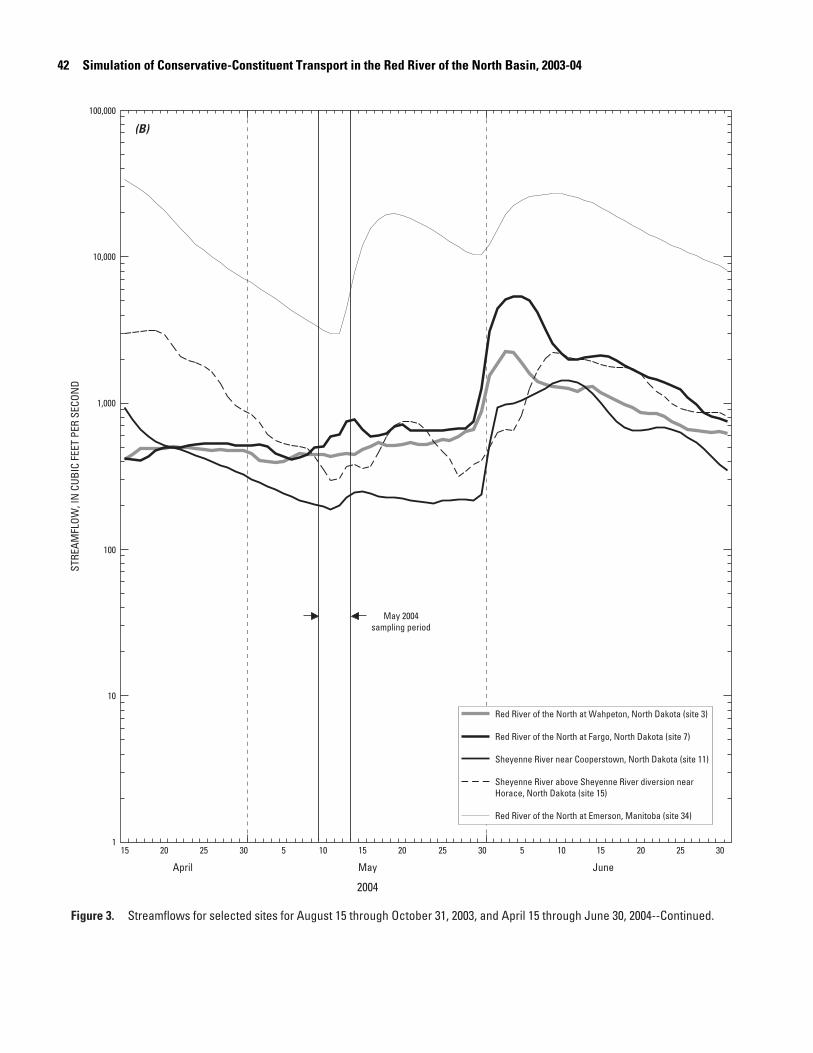
42 SST
REAM
FLOW
, IN
CUB
IC F
EET
PER
SECO
ND
Fig
imulation of Conservative-Constituent Transport in the Red River of the North Basin, 2003-04
100,000
10,000
1,000
100
10
May 2004sampling period
Red River of the North at Wahpeton, North Dakota (site 3)
Red River of the North at Fargo, North Dakota (site 7)
Sheyenne River near Cooperstown, North Dakota (site 11)
(B)
30252015 30252015105 302520151051
April May June
ure 3. Streamflows for selected sites for August 15 through October 31, 2003, and April 15 through June 30, 2004--Continued.
2004
Sheyenne River above Sheyenne River diversion nearHorace, North Dakota (site 15)
Red River of the North at Emerson, Manitoba (site 34)
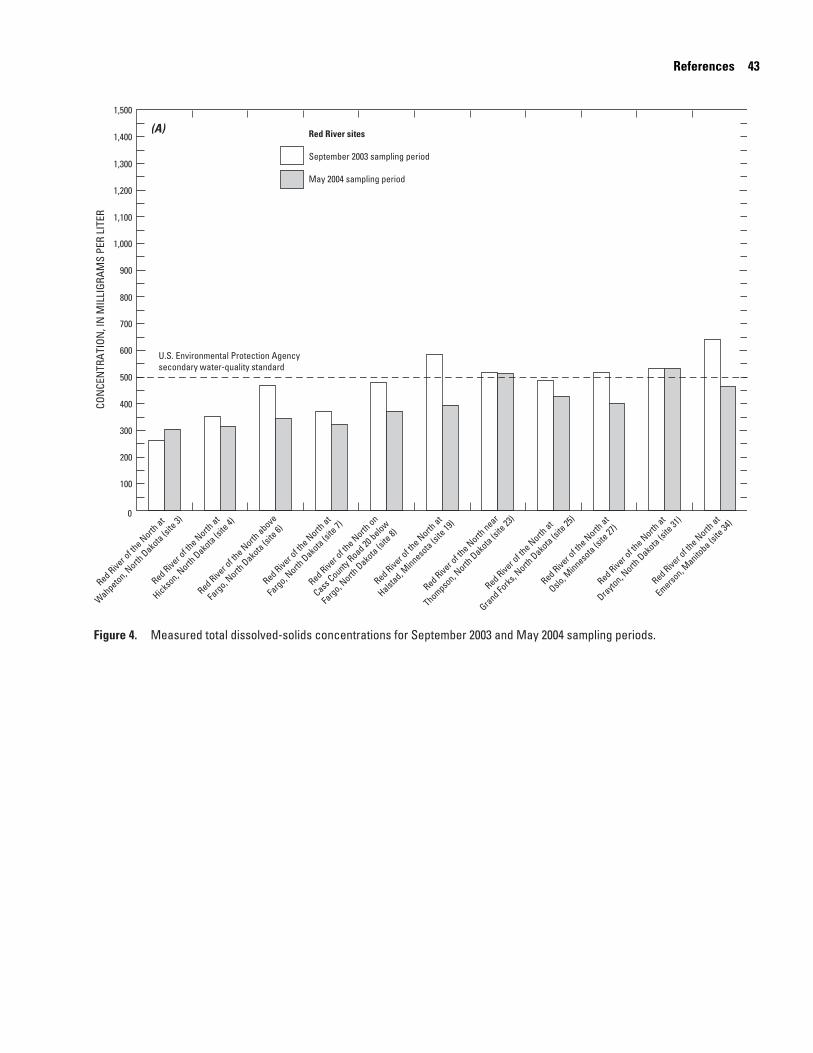
References 43
0
600
900
300
700
800
400
500
200
100
1,200
1,300
1,400
1,100
1,000
1,500CO
NCE
NTR
ATIO
N, I
N M
ILLI
GRAM
S PE
R LI
TER
Figure 4. Measured total dissolved-solids concentrations for September 2003 and May 2004 sampling periods.
Red River o
f the N
orth at
Emerson, M
anitoba (s
ite 34
)
Red River o
f the N
orth at
Wahpeton, North
Dakota (s
ite 3)
Red River o
f the N
orth at
Hickson, N
orth Dako
ta (site
4)
Red River o
f the N
orth at
Fargo, N
orth Dako
ta (site
7)
Red River o
f the N
orth above
Fargo, N
orth Dako
ta (site
6)
Red River o
f the N
orth on
Cass County
Road 20 below
Fargo, N
orth Dako
ta (site
8)
Red River o
f the N
orth at
Halstad, M
innesota (s
ite 19
)
Red River o
f the N
orth at
Oslo, M
innesota (s
ite 27
)
Red River o
f the N
orth at
Drayton, N
orth Dako
ta (site
31)
Red River o
f the N
orth near
Thompson, N
orth Dako
ta (site
23)
Red River o
f the N
orth at
Grand Forks
, North
Dakota (s
ite 25
)
Red River sites
September 2003 sampling period
May 2004 sampling period
U.S. Environmental Protection Agencysecondary water-quality standard
(A)

44 SCO
NCE
NTR
ATIO
N, I
N M
ILLI
GRAM
S PE
R LI
TER
Fi
imulation of Conservative-Constituent Transport in the Red River of the North Basin, 2003-04
Sheyenne Rive
r above
Harvey, N
orth Dako
ta
(site 9)
Sheyenne Rive
r near
Warwick,
North Dako
ta
(site 10
)
Sheyenne Rive
r below
Baldhill Dam, N
orth Dako
ta
(site 12
)
Sheyenne Rive
r near
Cooperstown, N
orth Dako
ta
(site 11
)
Sheyenne Rive
r near
Kindred, North
Dakota
(site 14
)
Sheyenne Rive
r at
Lisbon, N
orth Dako
ta
(site 13
)
Sheyenne Rive
r above
Sheyenne Rive
r dive
rsion near
Horace, North
Dakota
(site 15
)
Sheyenne Rive
r at
Brooktree Park,
North
Dakota
(site 16
)
0
600
900
300
700
800
400
500
200
100
1,200
1,300
1,400
1,100
1,000
1,500
Sheyenne River sites
September 2003 sampling period
May 2004 sampling period
U.S. Environmental Protection Agencysecondary water-quality standard
gure 4. Measured total dissolved-solids concentrations for September 2003 and May 2004 sampling periods--Continued.
(B)
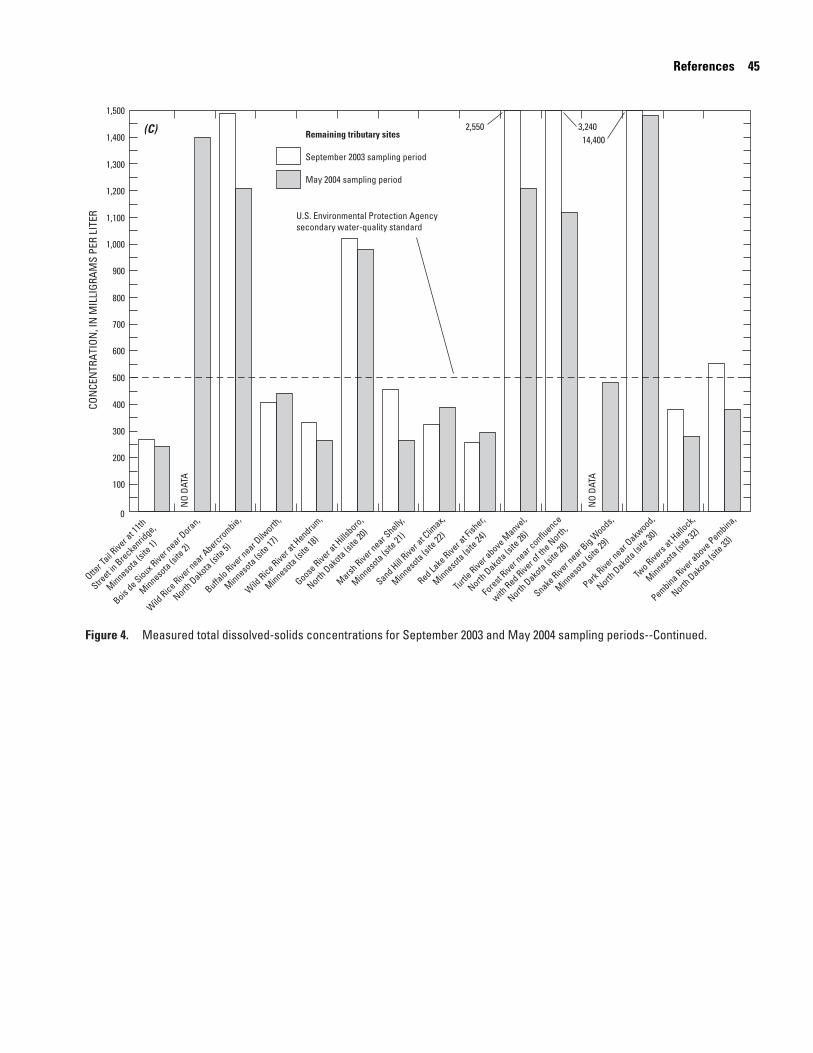
References 45
0
600
900
300
700
800
400
500
200
100
1,200
1,300
1,400
1,100
1,000
1,500
CON
CEN
TRAT
ION
, IN
MIL
LIGR
AMS
PER
LITE
R
Bois de Sioux R
iver n
ear Doran,
Minnesota (s
ite 2)
Pembina River a
bove Pembina,
North Dako
ta (site
33)
Red Lake
River a
t Fish
er,
Minnesota (s
ite 24
)
Turtle
River a
bove M
anvel,
North Dako
ta (site
26)
Forest
River n
ear conflu
ence
with Red Rive
r of th
e North
,
North Dako
ta (site
28)
Otter T
ail Rive
r at 1
1th
Street in
Breckenrid
ge,
Minnesota (s
ite 1)
Wild
Rice River n
ear Abercrombie,
North Dako
ta (site
5)
Park Rive
r near O
akwood,
North Dako
ta (site
30)
Goose Rive
r at H
illsboro,
North Dako
ta (site
20)
Marsh Rive
r near S
helly,
Minnesota (s
ite 21
)
Sand Hill Rive
r at C
limax,
Minnesota (s
ite 22
)
Wild
Rice River a
t Hendrum,
Minnesota (s
ite 18
)
Snake Rive
r near B
ig Woods,
Minnesota (s
ite 29
)
Buffalo Rive
r near D
ilworth
,
Minnesota (s
ite 17
)
Two Rive
rs at H
allock,
Minnesota (s
ite 32
)
NO
DATA
NO
DATA
14,4003,2402,550
Remaining tributary sites
September 2003 sampling period
May 2004 sampling period
U.S. Environmental Protection Agencysecondary water-quality standard
Figure 4. Measured total dissolved-solids concentrations for September 2003 and May 2004 sampling periods--Continued.
(C)
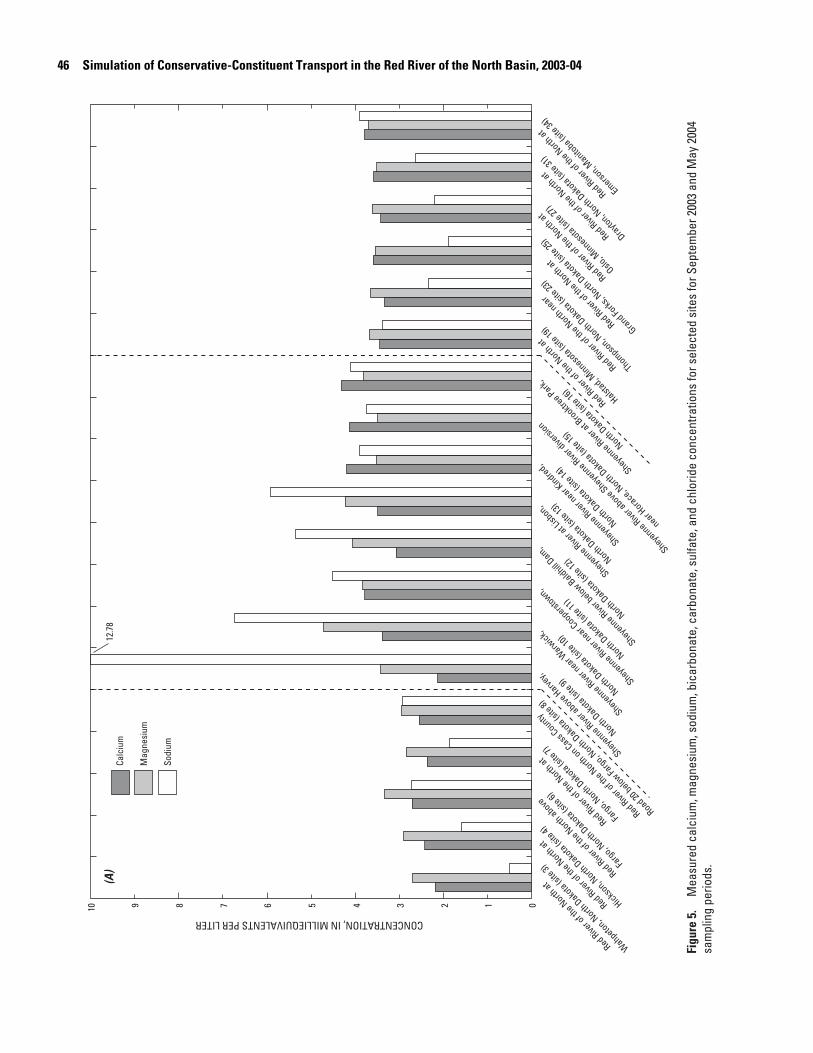
46 S
imulation of Conservative-Constituent Transport in the Red River of the North Basin, 2003-04esiu
m, s
odiu
m, b
icar
bona
te, c
arbo
nate
, sul
fate
, and
chl
orid
e co
ncen
tratio
ns fo
r sel
ecte
d si
tes
for S
epte
mbe
r 200
3 an
d M
ay 2
004
Calc
ium
Mag
nesi
um
Sodi
um
12.7
8
h at
a (site
7) Sheyenne Rive
r above
Harvey,
North Dako
ta (site
9)
Sheyenne Rive
r near W
arwick,
North Dako
ta (site
10) Sheye
nne River b
elow Baldhill Dam,
North Dako
ta (site
12)
Sheyenne Rive
r near C
ooperstown,
North Dako
ta (site
11)
Sheyenne Rive
r near K
indred,
North Dako
ta (site
14)
Sheyenne Rive
r at L
isbon,
North Dako
ta (site
13)
Sheyenne Rive
r above
Sheyenne Rive
r dive
rsion
near Horace, N
orth Dako
ta (site
15)
Sheyenne Rive
r at B
rooktree Park,
North Dako
ta (site
16)
Red River o
f the N
orth at
Emerson, M
anitoba (s
ite 34
)
Red River o
f the N
orth at
Halstad, M
innesota (s
ite 19
)
Red River o
f the N
orth at
Oslo, M
innesota (s
ite 27
)
Red River o
f the N
orth at
Drayton, N
orth Dako
ta (site
31)
Red River o
f the N
orth near
Thompson, N
orth Dako
ta (site
23)
Red River o
f the N
orth at
Grand Forks
, North
Dakota (s
ite 25
)
orth on Cass
County
rgo, North
Dakota (s
ite 8)
CONCENTRATION, IN MILLIEQUIVALENTS PER LITER
Figu
re 5
.
Mea
sure
d ca
lciu
m, m
agn
sam
plin
g pe
riods
.
10 9 8 7 6 5 4 3 2 1 0
Red River o
f the N
orth at
Wahpeton, North
Dakota (s
ite 3)
Red River o
f the N
orth at
Hickson, N
orth Dako
ta (site
4)
Red River o
f the N
ort
Fargo, N
orth Dako
t
Red River o
f the N
orth above
Fargo, N
orth Dako
ta (site
6)
(A)
Red River o
f the N
Road 20 below Fa
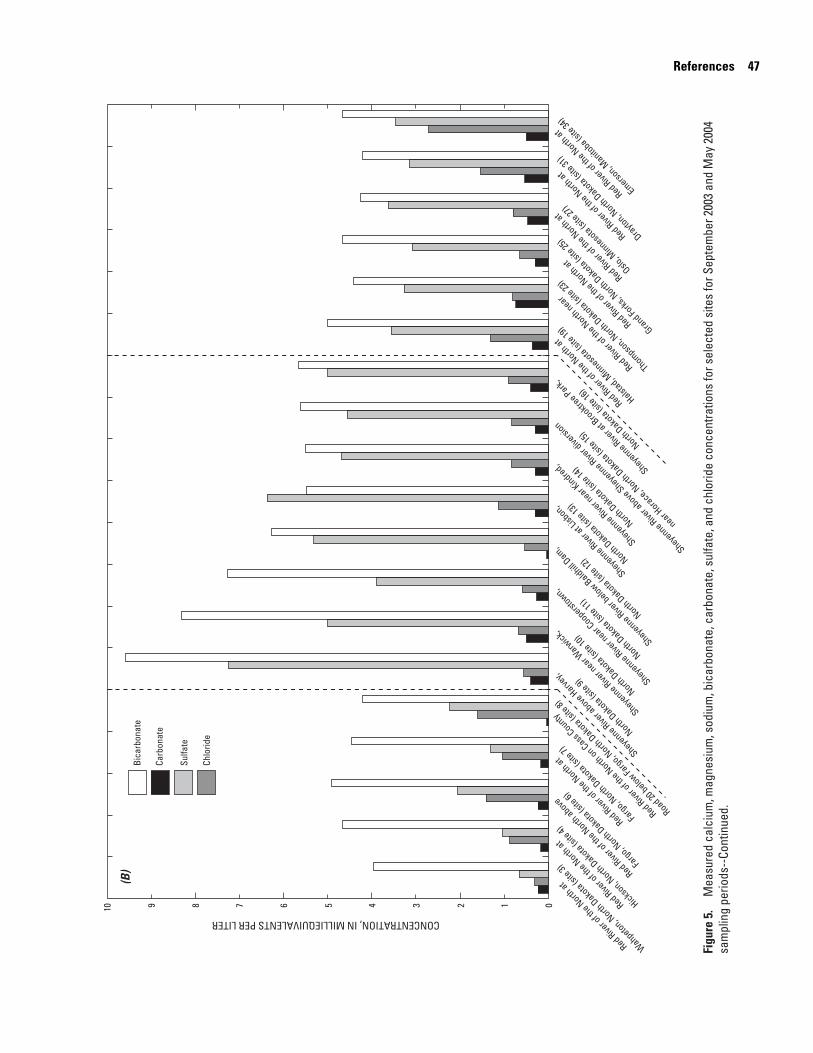
References 47
ateon
ate
ride
rbon
ate
m, s
odiu
m, b
icar
bona
te, c
arbo
nate
, sul
fate
, and
chl
orid
e co
ncen
tratio
ns fo
r sel
ecte
d si
tes
for S
epte
mbe
r 200
3 an
d M
ay 2
004
7) heyenne Rive
r above
Harvey,
North Dako
ta (site
9)
Sheyenne Rive
r near W
arwick,
North Dako
ta (site
10) Sheye
nne River b
elow Baldhill Dam,
North Dako
ta (site
12)
Sheyenne Rive
r near C
ooperstown,
North Dako
ta (site
11)
Sheyenne Rive
r near K
indred,
North Dako
ta (site
14)
Sheyenne Rive
r at L
isbon,
North Dako
ta (site
13)
Sheyenne Rive
r above
Sheyenne Rive
r dive
rsion
near Horace, N
orth Dako
ta (site
15)
Sheyenne Rive
r at B
rooktree Park,
North Dako
ta (site
16)
Red River o
f the N
orth at
Emerson, M
anitoba (s
ite 34
)
Red River o
f the N
orth at
Halstad, M
innesota (s
ite 19
)
Red River o
f the N
orth at
Oslo, M
innesota (s
ite 27
)
Red River o
f the N
orth at
Drayton, N
orth Dako
ta (site
31)
Red River o
f the N
orth near
Thompson, N
orth Dako
ta (site
23)
Red River o
f the N
orth at
Grand Forks
, North
Dakota (s
ite 25
)
n Cass County
orth Dako
ta (site
8)
CONCENTRATION, IN MILLIEQUIVALENTS PER LITER
Sulf
10 9 8 7 6 5 4 3 2 1 0
Carb
Chlo
Bica
Figu
re 5
.
Mea
sure
d ca
lciu
m, m
agne
siu
sam
plin
g pe
riods
--Co
ntin
ued.
Red River o
f the N
orth at
Wahpeton, North
Dakota (s
ite 3)
Red River o
f the N
orth at
Hickson, N
orth Dako
ta (site
4)
Red River o
f the N
orth at
Fargo, N
orth Dako
ta (site
Red River o
f the N
orth above
Fargo, N
orth Dako
ta (site
6)
S
(B)
Red River o
f the N
orth o
Road 20 below Fa
rgo, N
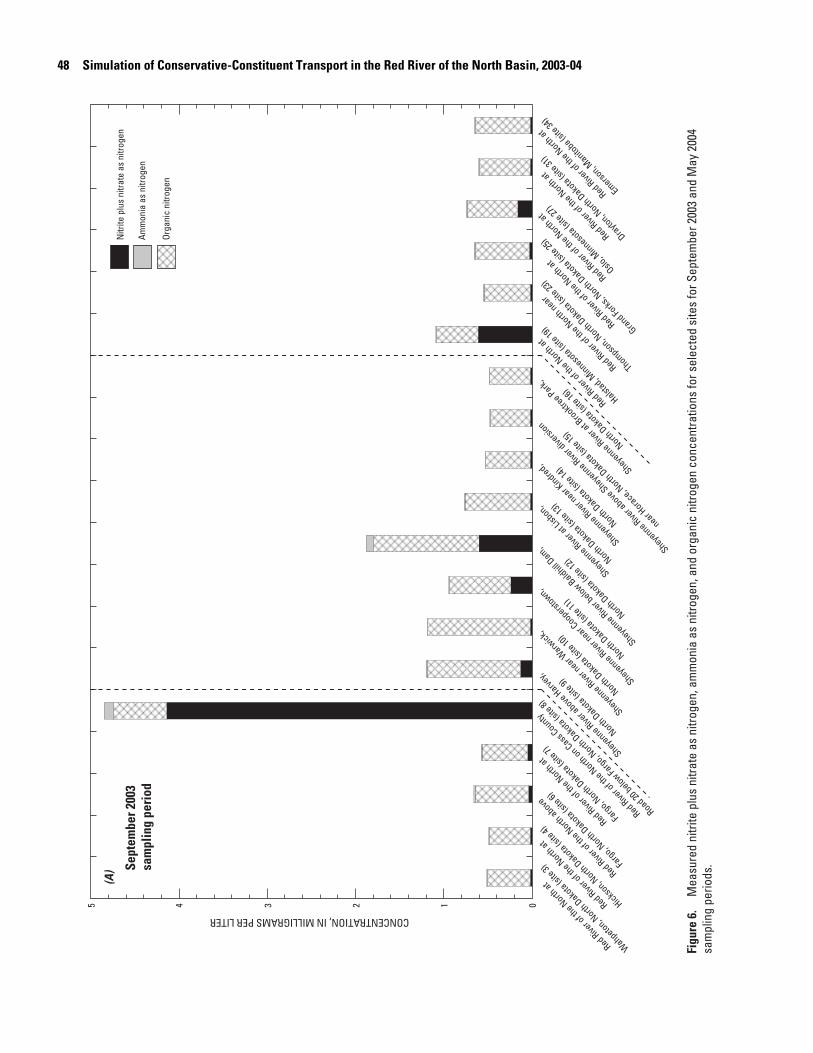
48 S
imulation of Conservative-Constituent Transport in the Red River of the North Basin, 2003-04te a
s ni
troge
n, a
mm
onia
as
nitro
gen,
and
org
anic
nitr
ogen
con
cent
ratio
ns fo
r sel
ecte
d si
tes
for S
epte
mbe
r 200
3 an
d M
ay 2
004
Amm
onia
as
nitro
gen
Orga
nic
nitro
gen
Nitr
ite p
lus
nitra
te a
s ni
troge
n
h at
a (site
7) Sheyenne Rive
r above
Harvey,
North Dako
ta (site
9)
Sheyenne Rive
r near W
arwick,
North Dako
ta (site
10) Sheye
nne River b
elow Baldhill Dam,
North Dako
ta (site
12)
Sheyenne Rive
r near C
ooperstown,
North Dako
ta (site
11)
Sheyenne Rive
r near K
indred,
North Dako
ta (site
14)
Sheyenne Rive
r at L
isbon,
North Dako
ta (site
13)
Sheyenne Rive
r above
Sheyenne Rive
r dive
rsion
near Horace, N
orth Dako
ta (site
15)
Sheyenne Rive
r at B
rooktree Park,
North Dako
ta (site
16)
Red River o
f the N
orth at
Emerson, M
anitoba (s
ite 34
)
Red River o
f the N
orth at
Halstad, M
innesota (s
ite 19
)
Red River o
f the N
orth at
Oslo, M
innesota (s
ite 27
)
Red River o
f the N
orth at
Drayton, N
orth Dako
ta (site
31)
Red River o
f the N
orth near
Thompson, N
orth Dako
ta (site
23)
Red River o
f the N
orth at
Grand Forks
, North
Dakota (s
ite 25
)
orth on Cass
County
rgo, North
Dakota (s
ite 8)
CONCENTRATION, IN MILLIGRAMS PER LITER
Figu
re 6
.
Mea
sure
d ni
trite
plu
s ni
trasa
mpl
ing
perio
ds.Se
ptem
ber 2
003
sam
plin
g pe
riod
5 4 3 2 1 0
Red River o
f the N
orth at
Wahpeton, North
Dakota (s
ite 3)
Red River o
f the N
orth at
Hickson, N
orth Dako
ta (site
4)
Red River o
f the N
ort
Fargo, N
orth Dako
t
Red River o
f the N
orth above
Fargo, N
orth Dako
ta (site
6)
(A)
Red River o
f the N
Road 20 below Fa
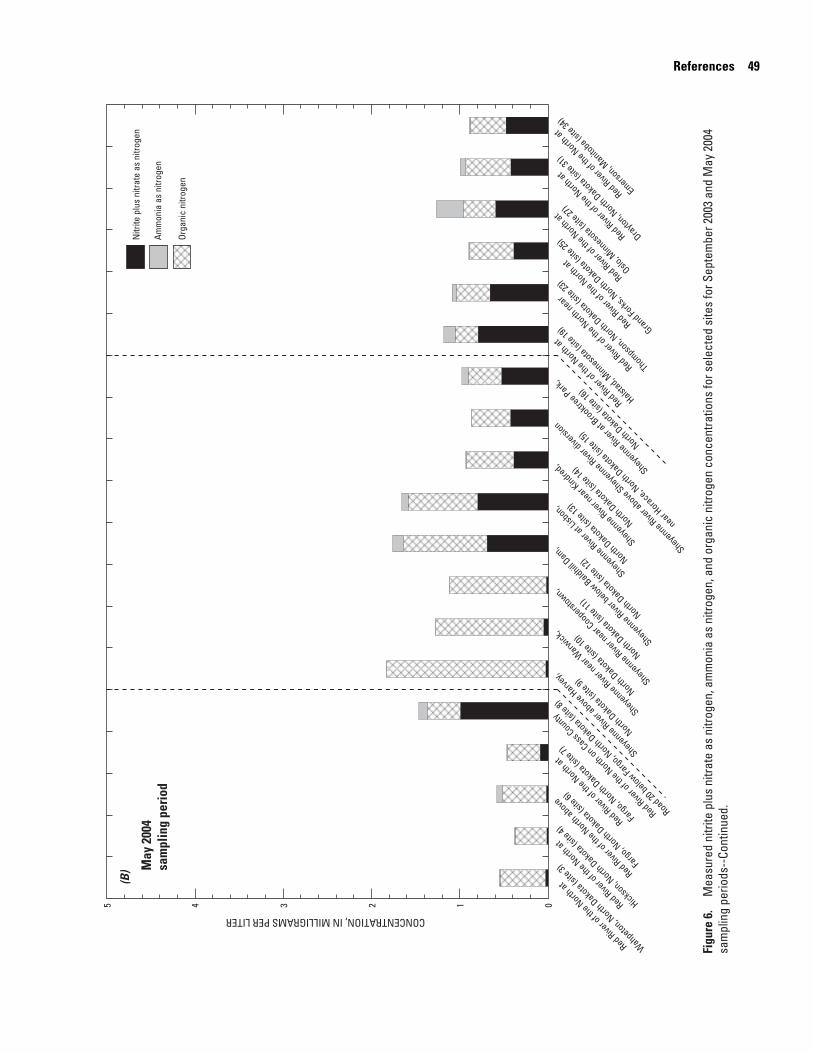
References 49
as n
itrog
en, a
mm
onia
as
nitro
gen,
and
org
anic
nitr
ogen
con
cent
ratio
ns fo
r sel
ecte
d si
tes
for S
epte
mbe
r 200
3 an
d M
ay 2
004
Amm
onia
as
nitro
gen
Orga
nic
nitro
gen
Nitr
ite p
lus
nitra
te a
s ni
troge
n
7) heyenne Rive
r above
Harvey,
North Dako
ta (site
9)
Sheyenne Rive
r near W
arwick,
North Dako
ta (site
10) Sheye
nne River b
elow Baldhill Dam,
North Dako
ta (site
12)
Sheyenne Rive
r near C
ooperstown,
North Dako
ta (site
11)
Sheyenne Rive
r near K
indred,
North Dako
ta (site
14)
Sheyenne Rive
r at L
isbon,
North Dako
ta (site
13)
Sheyenne Rive
r above
Sheyenne Rive
r dive
rsion
near Horace, N
orth Dako
ta (site
15)
Sheyenne Rive
r at B
rooktree Park,
North Dako
ta (site
16)
Red River o
f the N
orth at
Emerson, M
anitoba (s
ite 34
)
Red River o
f the N
orth at
Halstad, M
innesota (s
ite 19
)
Red River o
f the N
orth at
Oslo, M
innesota (s
ite 27
)
Red River o
f the N
orth at
Drayton, N
orth Dako
ta (site
31)
Red River o
f the N
orth near
Thompson, N
orth Dako
ta (site
23)
Red River o
f the N
orth at
Grand Forks
, North
Dakota (s
ite 25
)
n Cass County
orth Dako
ta (site
8)
CONCENTRATION, IN MILLIGRAMS PER LITER
May
200
4sa
mpl
ing
peri
od
5 4 3 2 1 0
Figu
re 6
.
Mea
sure
d ni
trite
plu
s ni
trate
sa
mpl
ing
perio
ds--
Cont
inue
d.
Red River o
f the N
orth at
Wahpeton, North
Dakota (s
ite 3)
Red River o
f the N
orth at
Hickson, N
orth Dako
ta (site
4)
Red River o
f the N
orth at
Fargo, N
orth Dako
ta (site
Red River o
f the N
orth above
Fargo, N
orth Dako
ta (site
6)
S
(B)
Red River o
f the N
orth o
Road 20 below Fa
rgo, N
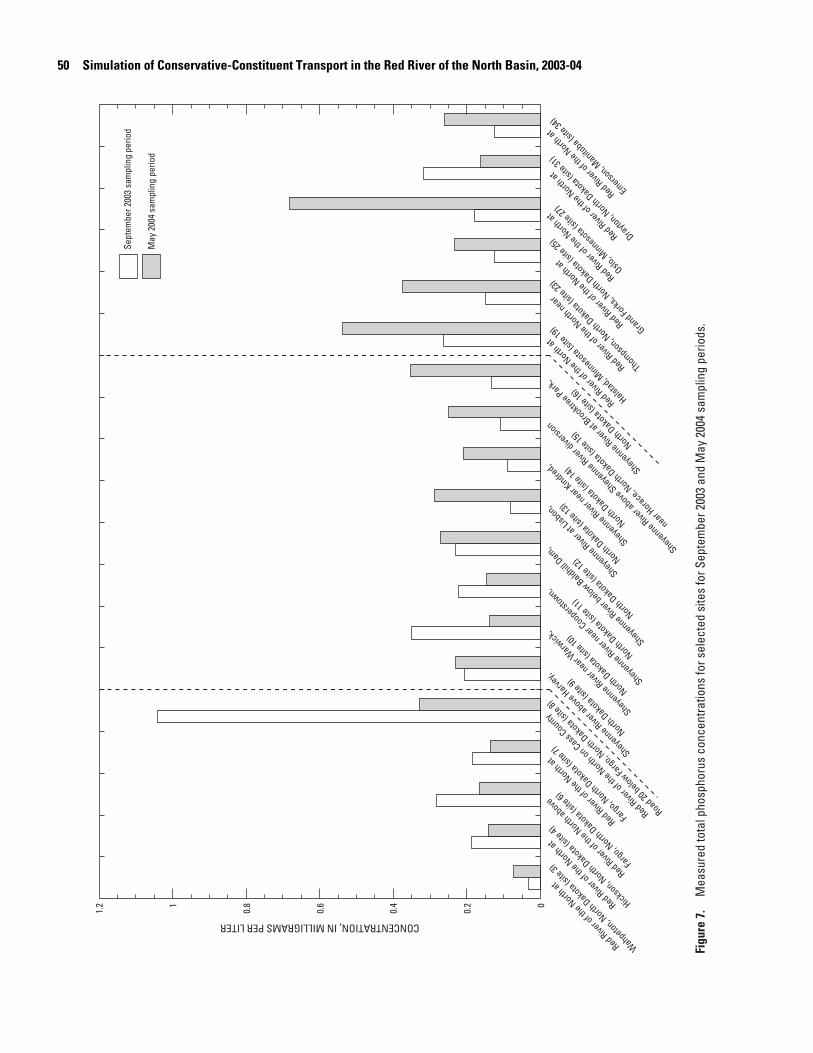
50 S
imulation of Conservative-Constituent Transport in the Red River of the North Basin, 2003-04s co
ncen
tratio
ns fo
r sel
ecte
d si
tes
for S
epte
mbe
r 200
3 an
d M
ay 2
004
sam
plin
g pe
riods
.
Sept
embe
r 200
3 sa
mpl
ing
perio
d
May
200
4 sa
mpl
ing
perio
d
h at
a (site
7) Sheyenne Rive
r above
Harvey,
North Dako
ta (site
9)
Sheyenne Rive
r near W
arwick,
North Dako
ta (site
10) Sheye
nne River b
elow Baldhill Dam,
North Dako
ta (site
12)
Sheyenne Rive
r near C
ooperstown,
North Dako
ta (site
11)
Sheyenne Rive
r near K
indred,
North Dako
ta (site
14)
Sheyenne Rive
r at L
isbon,
North Dako
ta (site
13)
Sheyenne Rive
r above
Sheyenne Rive
r dive
rsion
near Horace, N
orth Dako
ta (site
15)
Sheyenne Rive
r at B
rooktree Park,
North Dako
ta (site
16)
Red River o
f the N
orth at
Emerson, M
anitoba (s
ite 34
)
Red River o
f the N
orth at
Halstad, M
innesota (s
ite 19
)
Red River o
f the N
orth at
Oslo, M
innesota (s
ite 27
)
Red River o
f the N
orth at
Drayton, N
orth Dako
ta (site
31)
Red River o
f the N
orth near
Thompson, N
orth Dako
ta (site
23)
Red River o
f the N
orth at
Grand Forks
, North
Dakota (s
ite 25
)
orth on Cass
County
rgo, North
Dakota (s
ite 8)
CONCENTRATION, IN MILLIGRAMS PER LITER
Figu
re 7
.
Mea
sure
d to
tal p
hosp
horu
1
1.2
0.2
0.4
0.6
0.8 0
Red River o
f the N
orth at
Wahpeton, North
Dakota (s
ite 3)
Red River o
f the N
orth at
Hickson, N
orth Dako
ta (site
4)
Red River o
f the N
ort
Fargo, N
orth Dako
t
Red River o
f the N
orth above
Fargo, N
orth Dako
ta (site
6)
Red River o
f the N
Road 20 below Fa
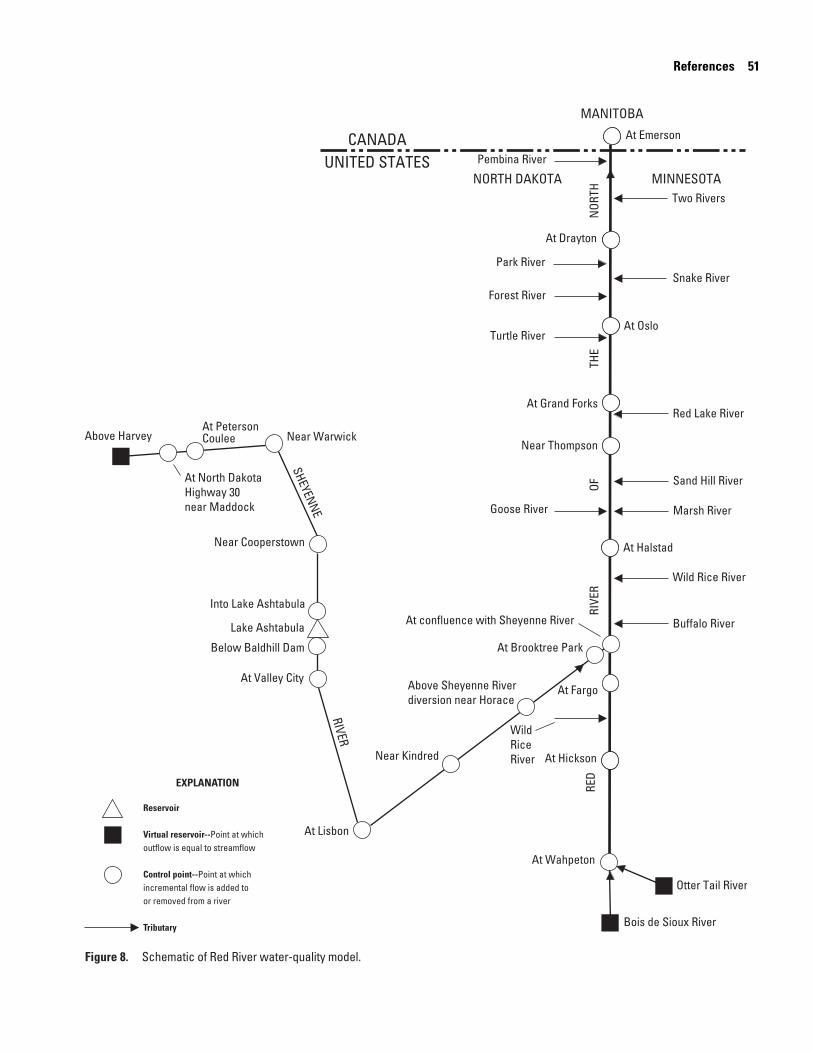
References 51
Near Cooperstown
At Valley City
Lake Ashtabula
Above Harvey Near Warwick
At Emerson
At Drayton
MANITOBA
CANADAUNITED STATES
MINNESOTANORTH DAKOTA
At Oslo
At Grand Forks
Near Thompson
At Halstad
At confluence with Sheyenne River
At Fargo
At North DakotaHighway 30near Maddock
Sand Hill River
Marsh River
Wild Rice River
Buffalo River
Turtle River
Forest River
Park River
Pembina River
Two Rivers
Snake River
Red Lake RiverAt PetersonCoulee
Below Baldhill Dam
Above Sheyenne Riverdiversion near Horace
At Brooktree Park
Into Lake Ashtabula
SHEYENNE
RIVE
ROF
THE
NOR
TH
RIVER
Goose River
WildRice
Figure 8. Schematic of Red River water-quality model.
Otter Tail River
Bois de Sioux River
At Lisbon
Near Kindred At Hickson
At Wahpeton
RED
River
EXPLANATION
Reservoir
Virtual reservoir--Point at whichoutflow is equal to streamflow
Control point--Point at whichincremental flow is added toor removed from a river
Tributary
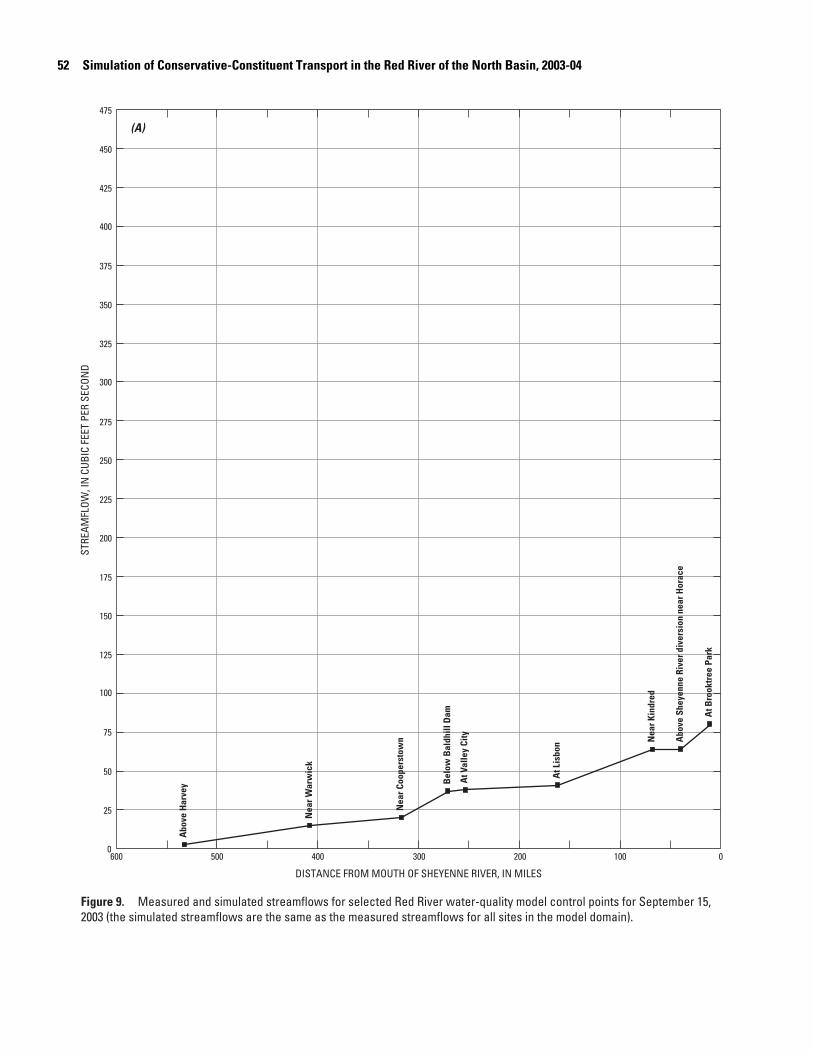
52 S
F2
imulation of Conservative-Constituent Transport in the Red River of the North Basin, 2003-04
475
400
450
425
300
325
350
375
200
225
250
275
100
150
125
175
75
STRE
AMFL
OW, I
N C
UBIC
FEE
T PE
R SE
CON
D
w B
aldh
ill D
am
Lisb
on
Nea
r Kin
dred
Abo
ve S
heye
nne
Rive
r div
ersi
on n
ear H
orac
e
rsto
wn
k alle
y Ci
ty
At B
rook
tree
Par
k
(A)
0
50
25
600 500 400 300 200 0100
DISTANCE FROM MOUTH OF SHEYENNE RIVER, IN MILES
igure 9. Measured and simulated streamflows for selected Red River water-quality model control points for September 15,003 (the simulated streamflows are the same as the measured streamflows for all sites in the model domain).
Bel
o
At
Nea
r Coo
pe
Nea
r War
wic
At V
Abo
ve H
arve
y
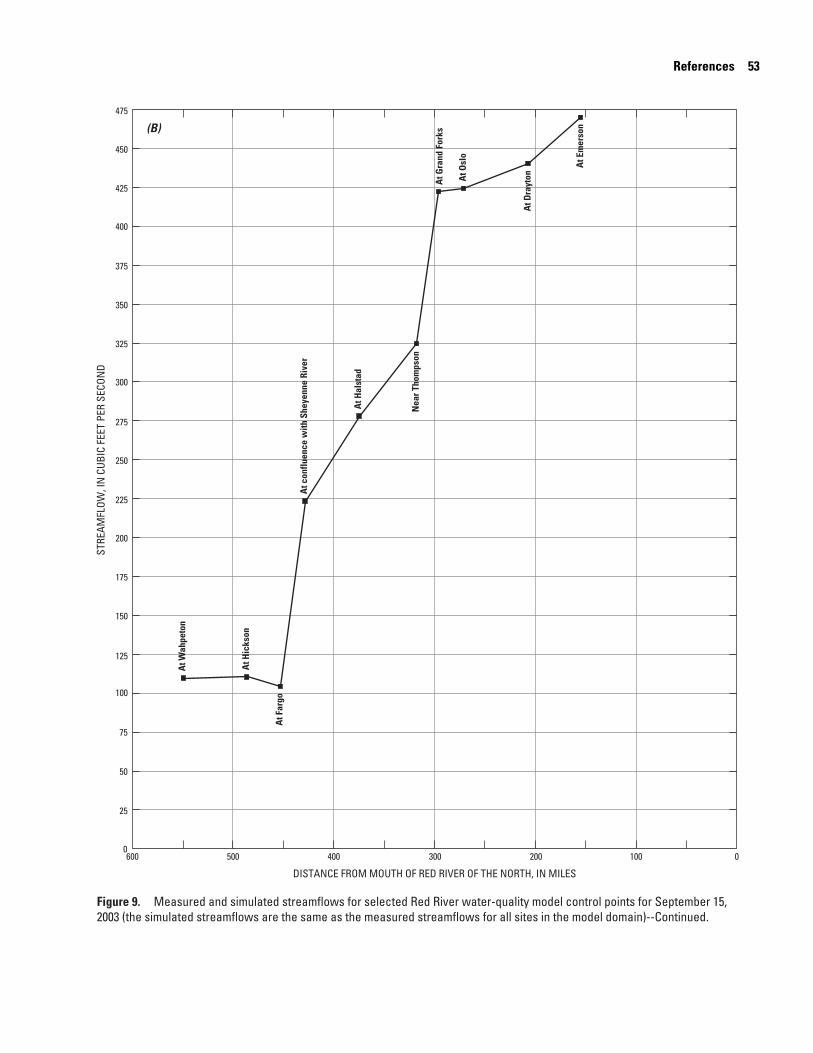
References 53
475
400
450
425
300
325
350
375
200
250
225
275
100
150
175
125
75
STRE
AMFL
OW, I
N C
UBIC
FEE
T PE
R SE
CON
D
At W
ahpe
ton
At F
argo
Nea
r Tho
mps
on
At E
mer
son
At G
rand
For
ks
At c
onflu
ence
with
She
yenn
e Ri
ver
At H
icks
on
At H
alst
ad
At O
slo
At D
rayt
on
(B)
0
50
25
600 500 400 300 200 0100
DISTANCE FROM MOUTH OF RED RIVER OF THE NORTH, IN MILES
Figure 9. Measured and simulated streamflows for selected Red River water-quality model control points for September 15,2003 (the simulated streamflows are the same as the measured streamflows for all sites in the model domain)--Continued.
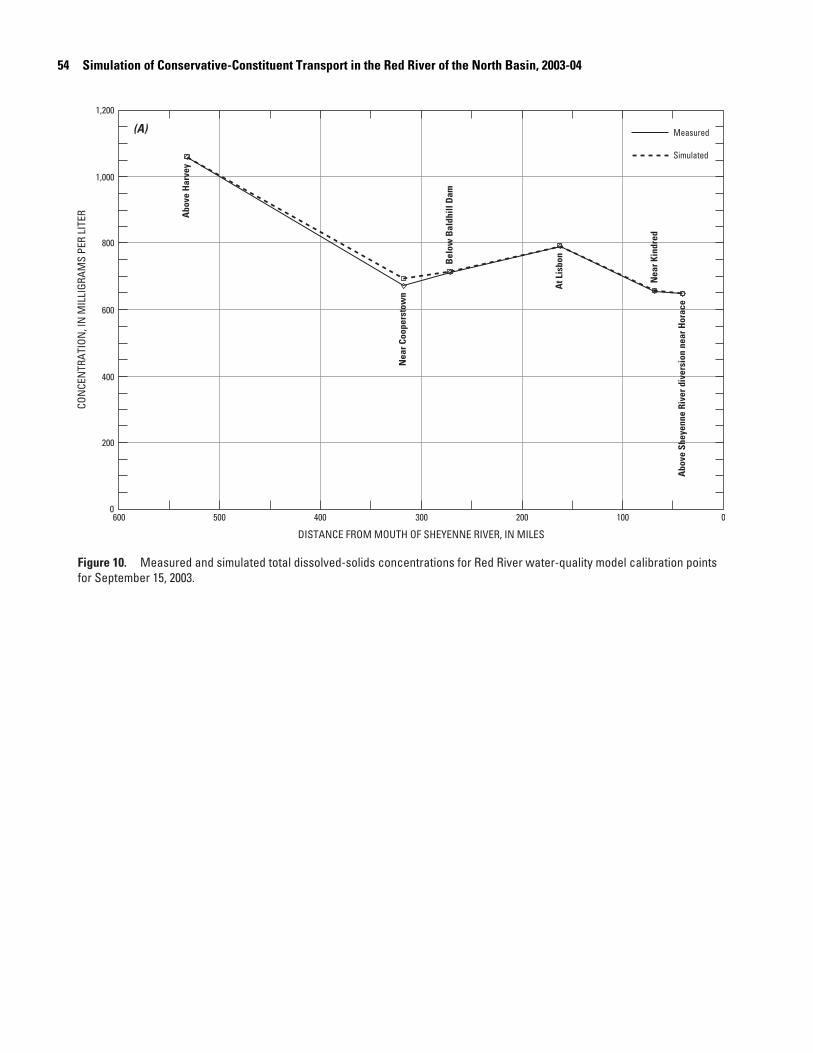
54 S
Fifo
imulation of Conservative-Constituent Transport in the Red River of the North Basin, 2003-04
0
800
600
400
200
1,200
1,000
600 500 400 300 200 100 0
DISTANCE FROM MOUTH OF SHEYENNE RIVER, IN MILES
CON
CEN
TRAT
ION
, IN
MIL
LIGR
AMS
PER
LITE
R
gure 10. Measured and simulated total dissolved-solids concentrations for Red River water-quality model calibration pointsr September 15, 2003.
Measured
Simulated
Bel
ow B
aldh
ill D
am
At L
isbo
n
Nea
r Kin
dred
Abo
ve S
heye
nne
Rive
r div
ersi
on n
ear H
orac
e
Nea
r Coo
pers
tow
n
Abo
ve H
arve
y
(A)
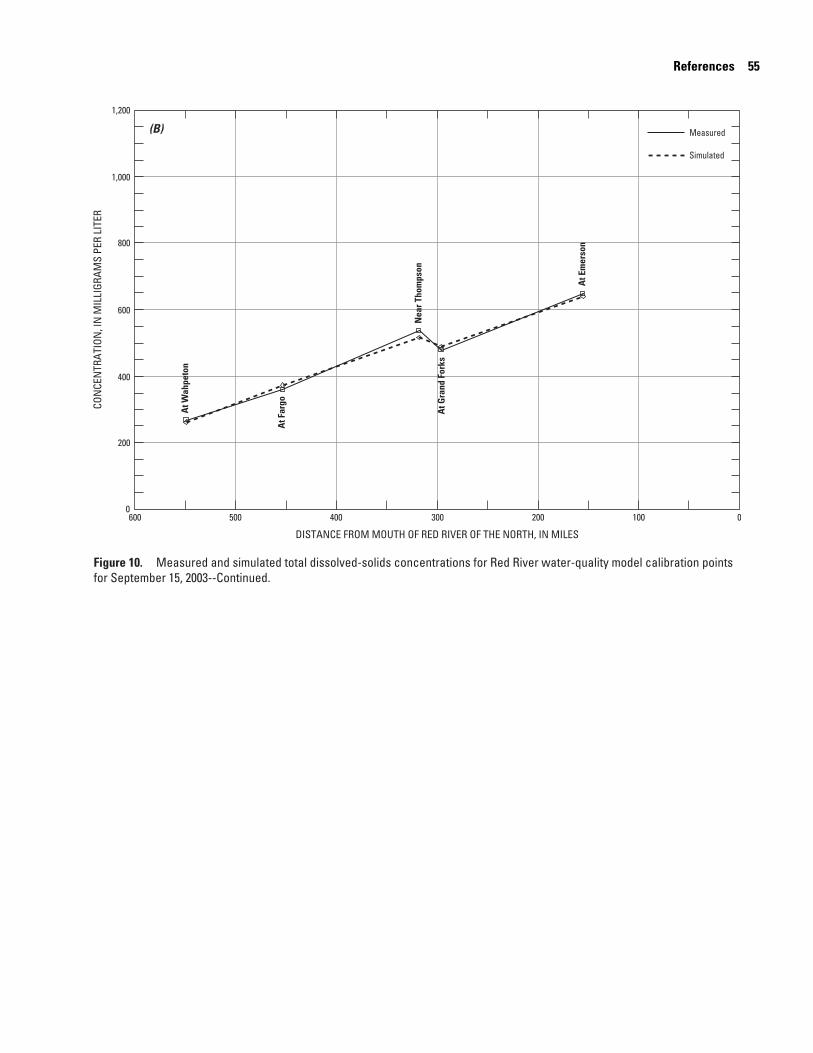
References 55
0
800
600
400
200
1,200
1,000
600 500 400 300 200 100 0
DISTANCE FROM MOUTH OF RED RIVER OF THE NORTH, IN MILES
CON
CEN
TRAT
ION
, IN
MIL
LIGR
AMS
PER
LITE
R
Figure 10. Measured and simulated total dissolved-solids concentrations for Red River water-quality model calibration pointsfor September 15, 2003--Continued.
Measured
Simulated
At W
ahpe
ton
At F
argo
Nea
r Tho
mps
on
At E
mer
son
At G
rand
For
ks
(B)
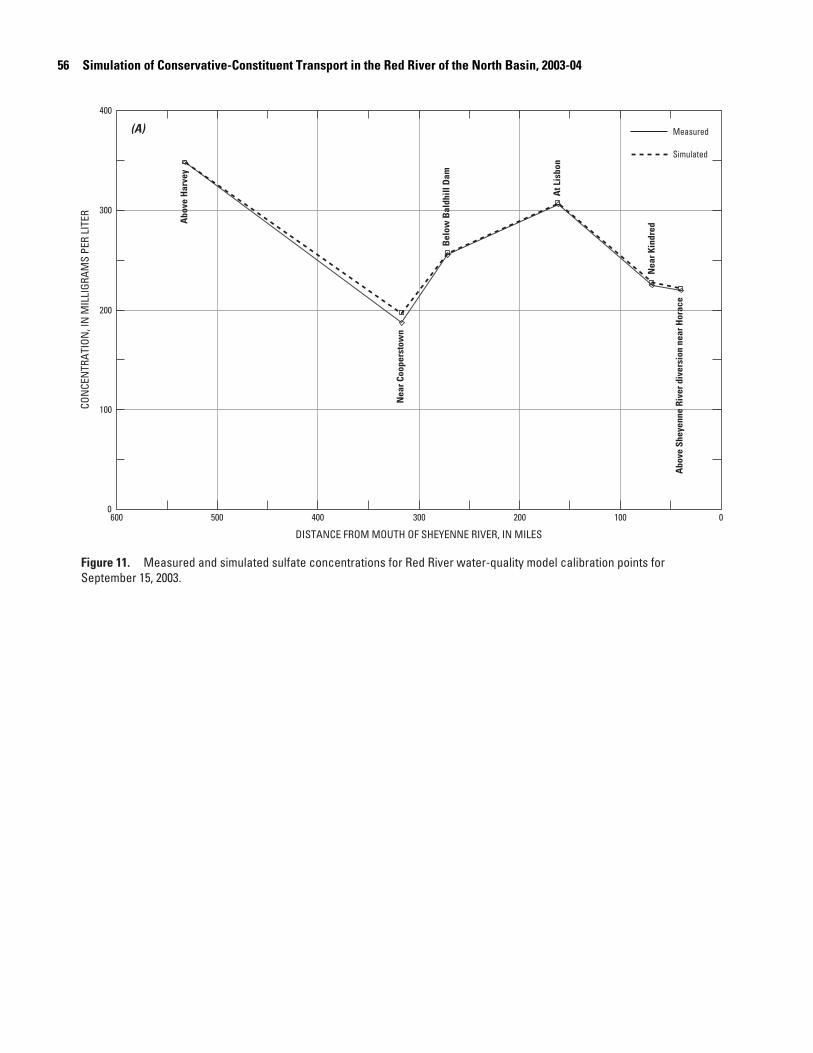
56 S
FS
imulation of Conservative-Constituent Transport in the Red River of the North Basin, 2003-04
0
400
300
200
100
600 500 400 300 200 100 0
DISTANCE FROM MOUTH OF SHEYENNE RIVER, IN MILES
CON
CEN
TRAT
ION
, IN
MIL
LIGR
AMS
PER
LITE
R
igure 11. Measured and simulated sulfate concentrations for Red River water-quality model calibration points foreptember 15, 2003.
Bel
ow B
aldh
ill D
am
At L
isbo
n
Nea
r Kin
dred
Abo
ve S
heye
nne
Rive
r div
ersi
on n
ear H
orac
e
Nea
r Coo
pers
tow
n
Abo
ve H
arve
y
Measured
Simulated
(A)
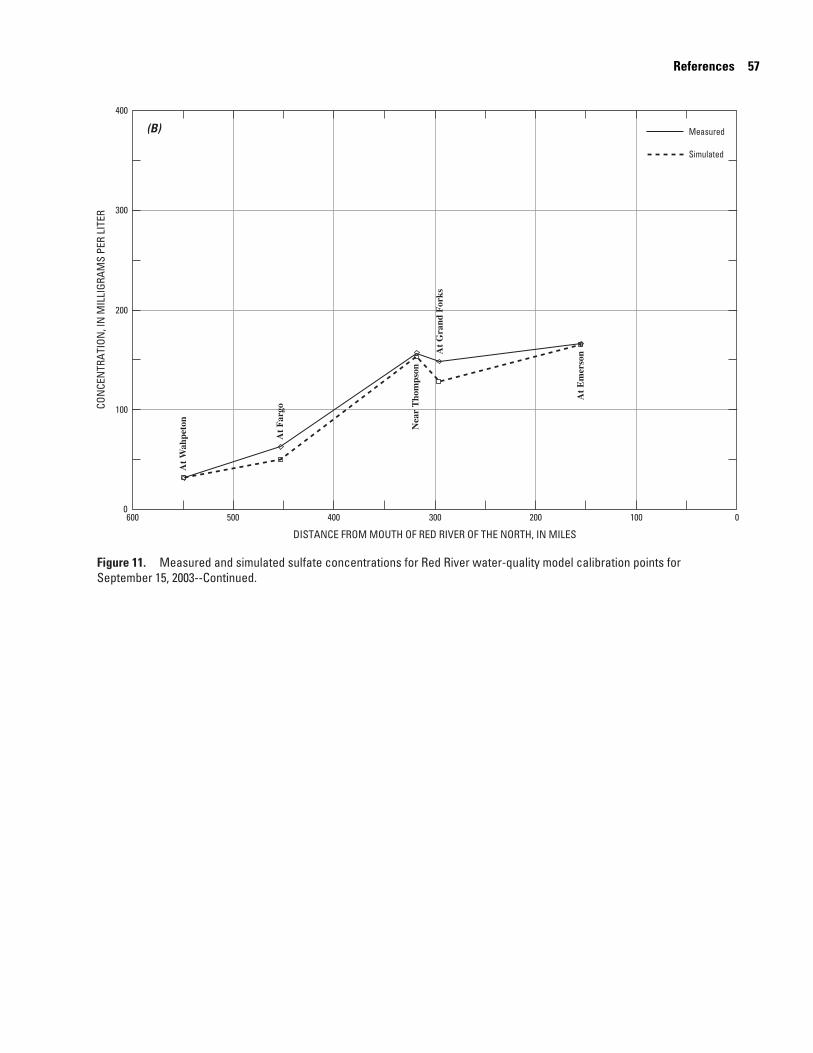
References 57
0
400
300
200
100
600 500 400 300 200 100 0
DISTANCE FROM MOUTH OF RED RIVER OF THE NORTH, IN MILES
CON
CEN
TRAT
ION
, IN
MIL
LIGR
AMS
PER
LITE
R
Figure 11. Measured and simulated sulfate concentrations for Red River water-quality model calibration points forSeptember 15, 2003--Continued.
Measured
Simulated
At
Wah
peto
n
At
Far
go
Nea
r T
hom
pson
At
Em
erso
nAt
Gra
nd F
orks
(B)
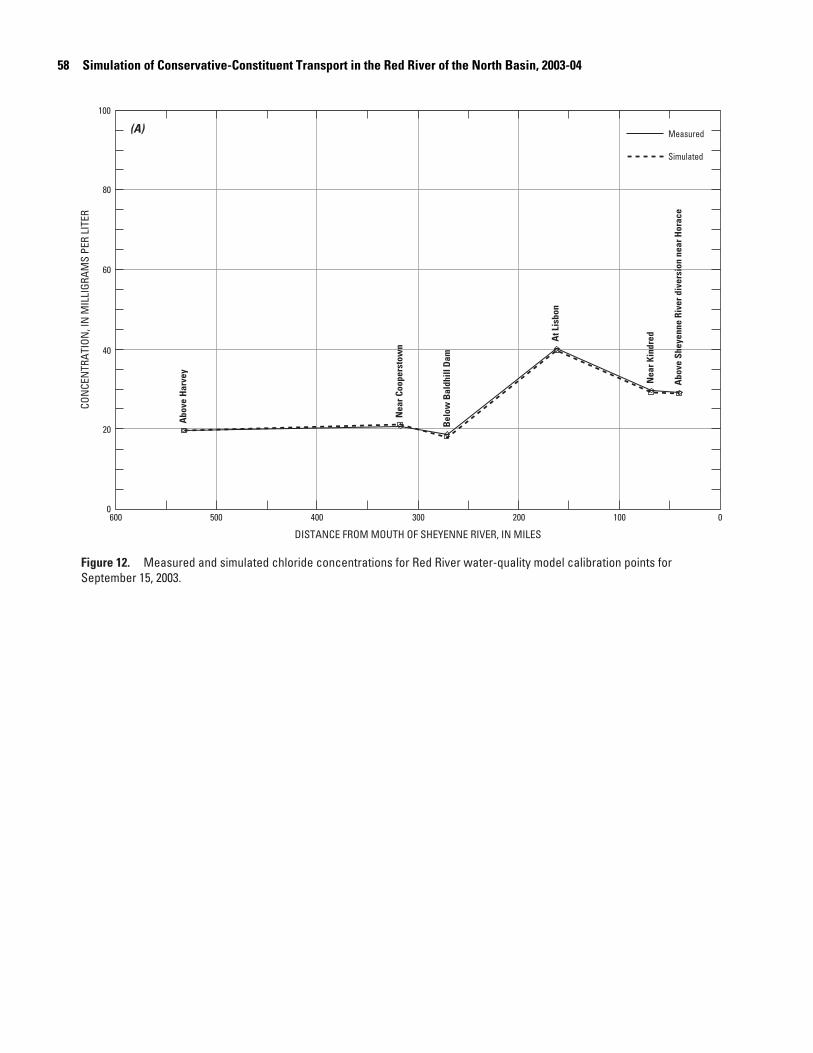
58 S
FS
imulation of Conservative-Constituent Transport in the Red River of the North Basin, 2003-04
0
80
60
40
20
100
600 500 400 300 200 100 0
DISTANCE FROM MOUTH OF SHEYENNE RIVER, IN MILES
CON
CEN
TRAT
ION
, IN
MIL
LIGR
AMS
PER
LITE
R
igure 12. Measured and simulated chloride concentrations for Red River water-quality model calibration points foreptember 15, 2003.
Bel
ow B
aldh
ill D
am
At L
isbo
n
Nea
r Kin
dred
Abo
ve S
heye
nne
Rive
r div
ersi
on n
ear H
orac
e
Nea
r Coo
pers
tow
n
Abo
ve H
arve
y
Measured
Simulated
(A)
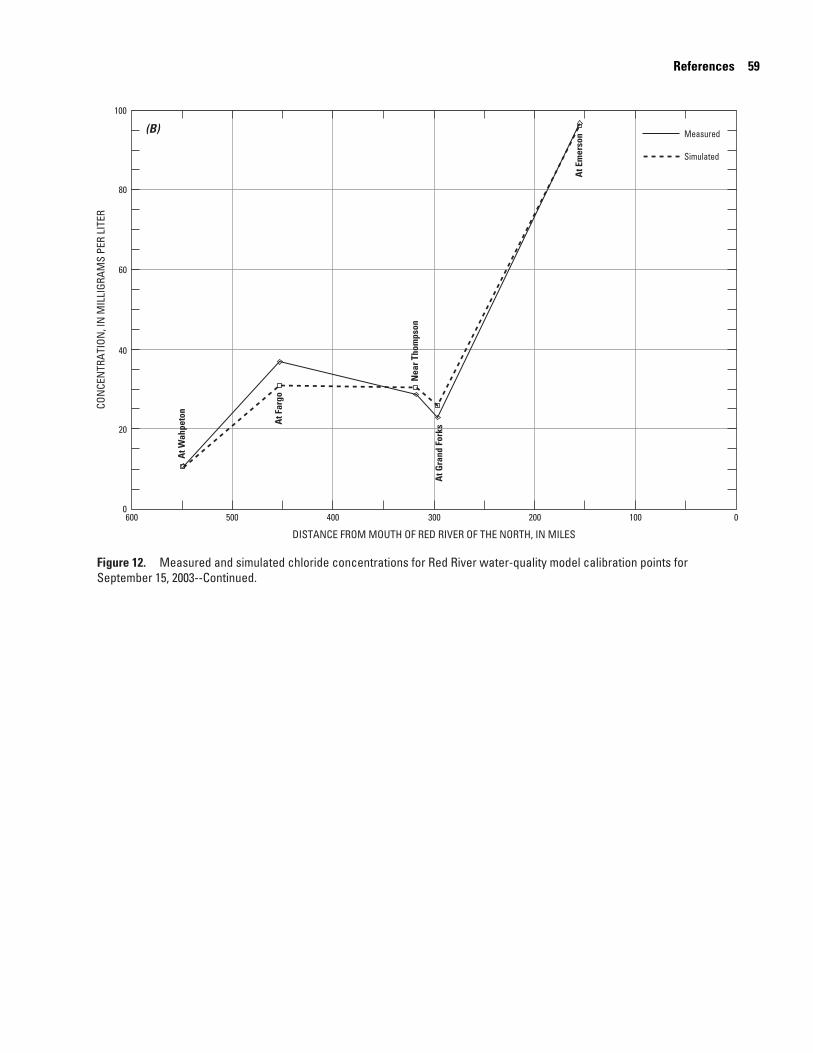
References 59
0
80
60
40
20
100
600 500 400 300 200 100 0
CON
CEN
TRAT
ION
, IN
MIL
LIGR
AMS
PER
LITE
R
Figure 12. Measured and simulated chloride concentrations for Red River water-quality model calibration points forSeptember 15, 2003--Continued.
Measured
Simulated
DISTANCE FROM MOUTH OF RED RIVER OF THE NORTH, IN MILES
At W
ahpe
ton
At F
argo
Nea
r Tho
mps
on
At E
mer
son
At G
rand
For
ks
(B)
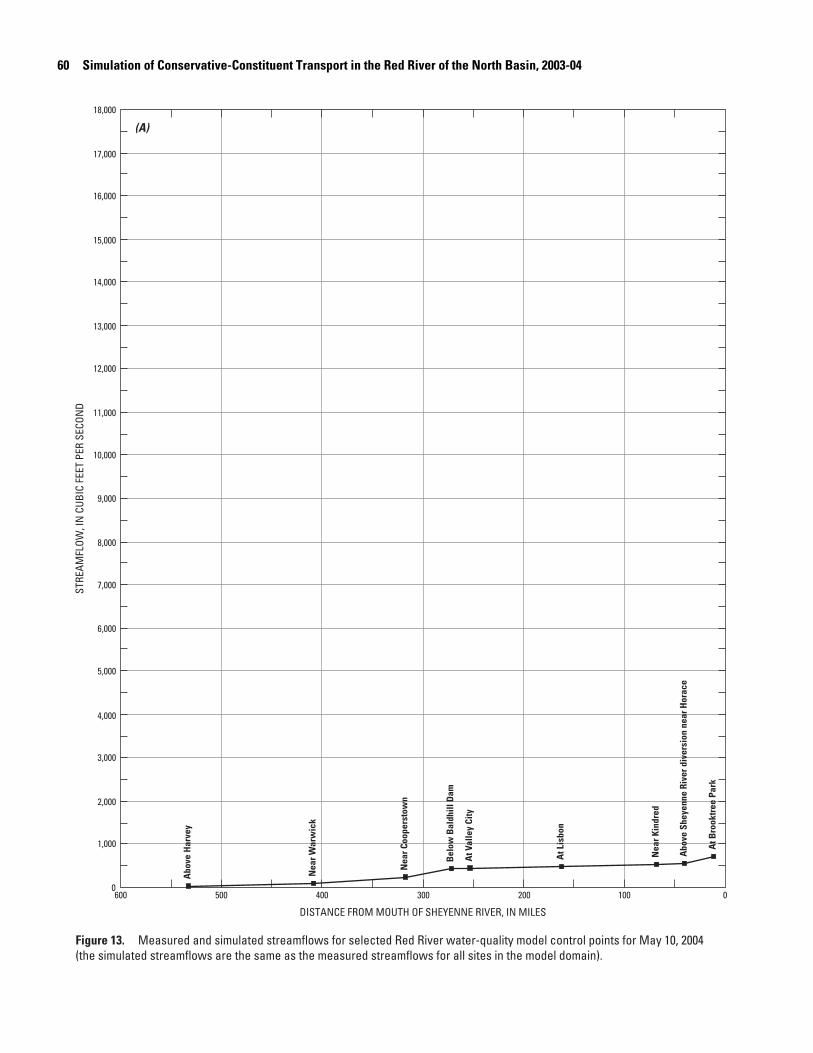
60 SST
REAM
FLOW
, IN
CUB
IC F
EET
PER
SECO
ND
Fi(th
imulation of Conservative-Constituent Transport in the Red River of the North Basin, 2003-04
18,000
14,000
13,000
12,000
10,000
11,000
9,000
8,000
6,000
5,000
4,000
3,000
7,000
17,000
16,000
15,000
dive
rsio
n ne
ar H
orac
e
(A)
0
2,000
1,000
600 500 400 300 200 0100
DISTANCE FROM MOUTH OF SHEYENNE RIVER, IN MILES
gure 13. Measured and simulated streamflows for selected Red River water-quality model control points for May 10, 2004e simulated streamflows are the same as the measured streamflows for all sites in the model domain).
Bel
ow B
aldh
ill D
am
At L
isbo
n
Nea
r Kin
dred
Abo
ve S
heye
nne
Rive
r
Nea
r Coo
pers
tow
n
Nea
r War
wic
k
At V
alle
y Ci
ty
Abo
ve H
arve
y
At B
rook
tree
Par
k
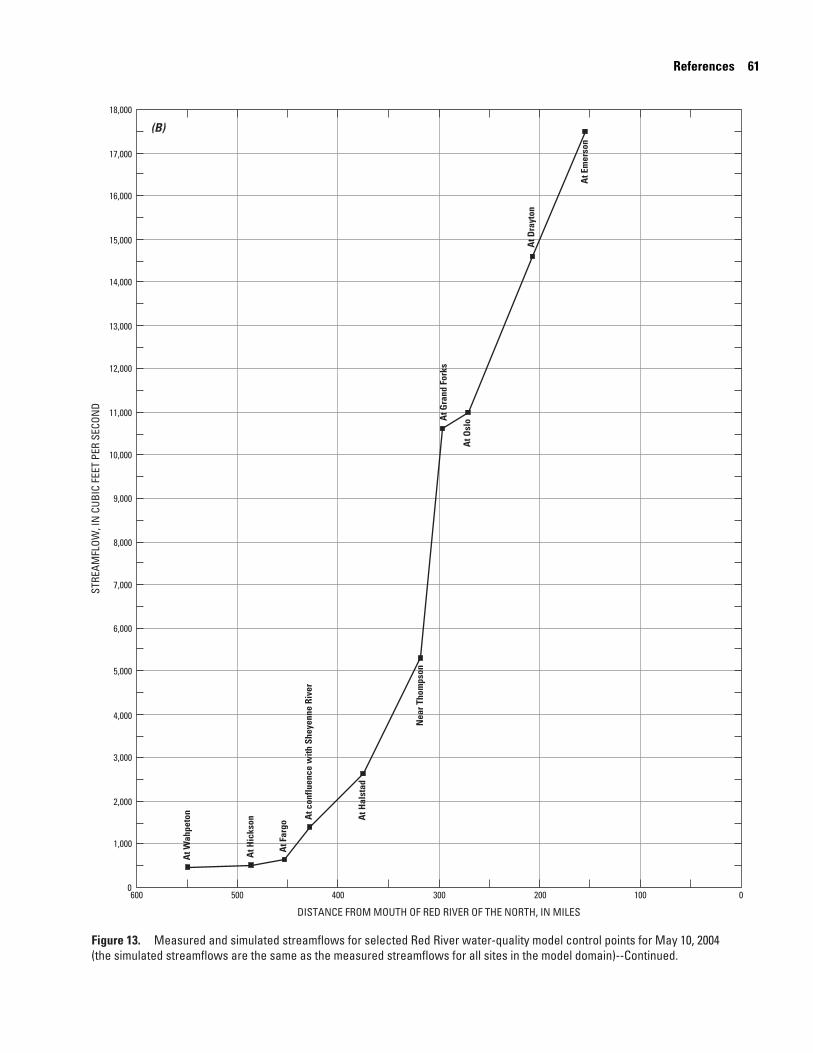
References 61
18,000
14,000
13,000
12,000
10,000
11,000
9,000
8,000
6,000
5,000
4,000
7,000
17,000
16,000
15,000
STRE
AMFL
OW, I
N C
UBIC
FEE
T PE
R SE
CON
D
Nea
r Tho
mps
on
At E
mer
son
At G
rand
For
ks
h Sh
eyen
ne R
iver
At O
slo
At D
rayt
on
(B)
0
3,000
2,000
1,000
600 500 400 300 200 0100
DISTANCE FROM MOUTH OF RED RIVER OF THE NORTH, IN MILES
Figure 13. Measured and simulated streamflows for selected Red River water-quality model control points for May 10, 2004(the simulated streamflows are the same as the measured streamflows for all sites in the model domain)--Continued.
At W
ahpe
ton
At F
argo
At c
onflu
ence
wit
At H
icks
on At H
alst
ad

62 S
Fifo
imulation of Conservative-Constituent Transport in the Red River of the North Basin, 2003-04
0
800
600
400
200
1,400
1,200
1,000
600 500 400 300 200 100 0
DISTANCE FROM MOUTH OF SHEYENNE RIVER, IN MILES
CON
CEN
TRAT
ION
, IN
MIL
LIGR
AMS
PER
LITE
R
gure 14. Measured and simulated total dissolved-solids concentrations for Red River water-quality model calibration pointsr May 10, 2004.
Belo
w B
aldh
ill D
am
Measured
Simulated
At L
isbo
n
Nea
r Kin
dred
Abo
ve S
heye
nne
Rive
r div
ersi
on n
ear H
orac
e
Nea
r Coo
pers
tow
n
Abo
ve H
arve
y
(A)
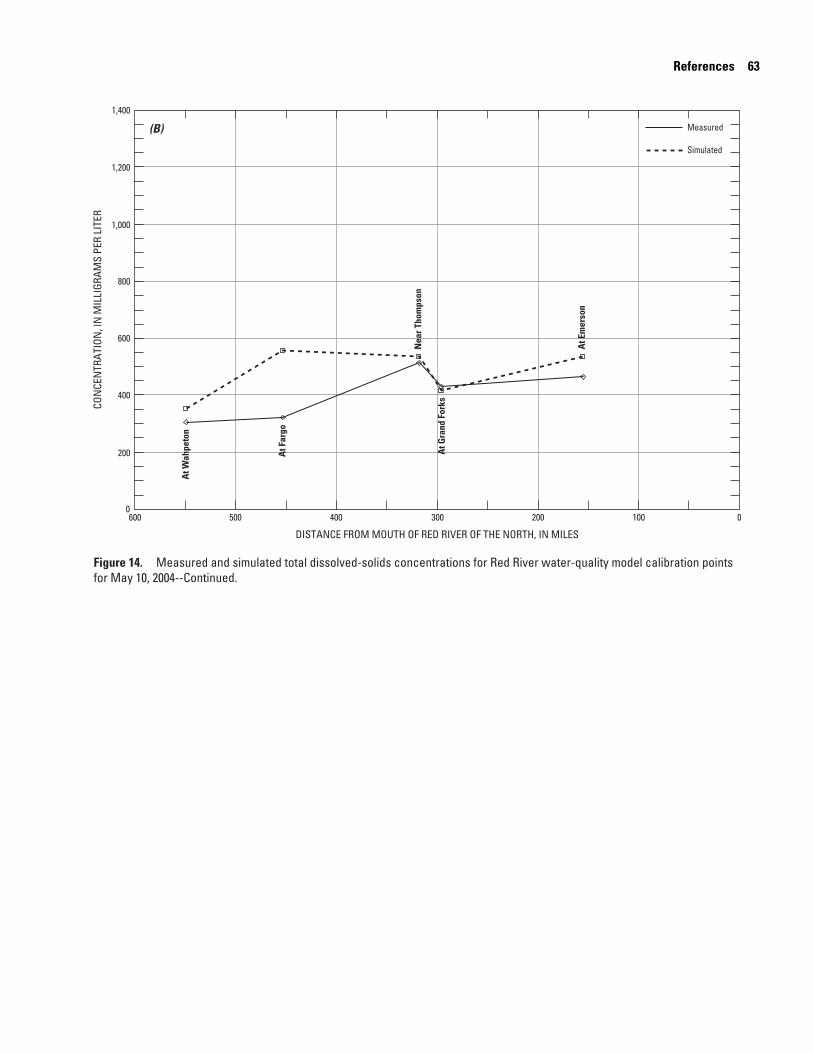
References 63
0
800
600
400
200
1,400
1,200
1,000
600 500 400 300 200 100 0
DISTANCE FROM MOUTH OF RED RIVER OF THE NORTH, IN MILES
CON
CEN
TRAT
ION
, IN
MIL
LIGR
AMS
PER
LITE
R
Measured
Simulated
At W
ahpe
ton
At F
argo
Nea
r Tho
mps
on
At E
mer
son
At G
rand
For
ks
Figure 14. Measured and simulated total dissolved-solids concentrations for Red River water-quality model calibration pointsfor May 10, 2004--Continued.
(B)
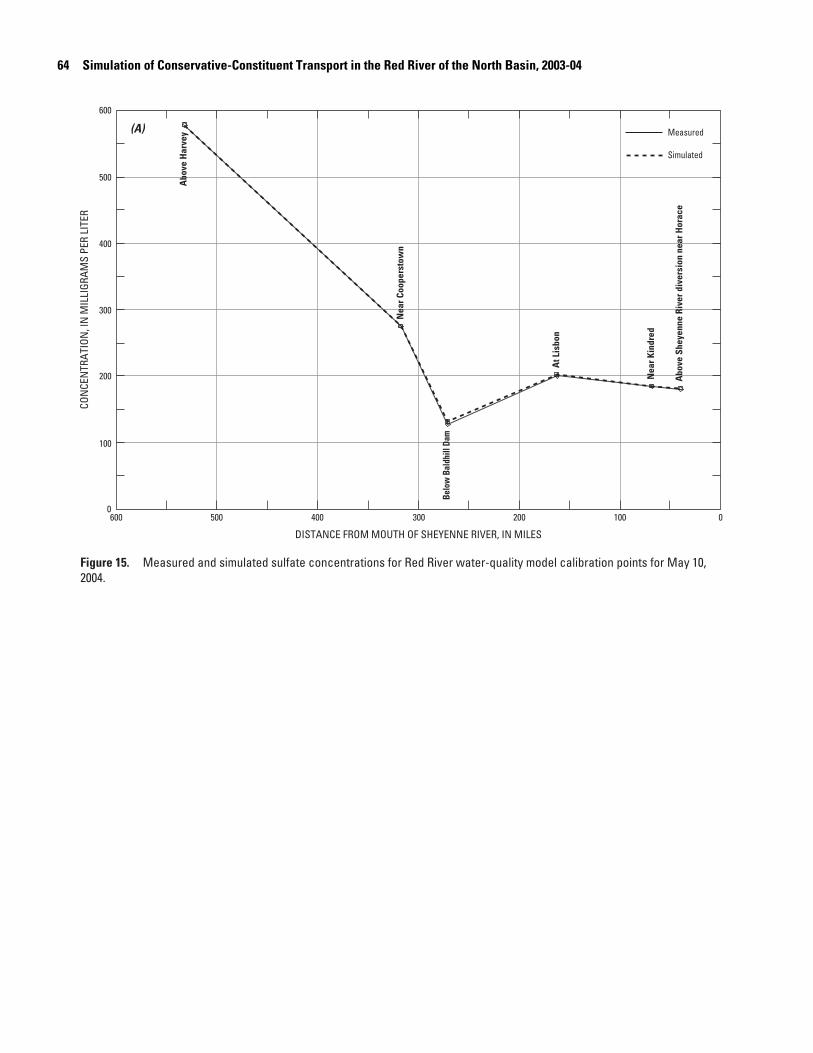
64 S
F2
imulation of Conservative-Constituent Transport in the Red River of the North Basin, 2003-04
0
400
500
600
300
200
100
600 500 400 300 200 100 0
DISTANCE FROM MOUTH OF SHEYENNE RIVER, IN MILES
CON
CEN
TRAT
ION
, IN
MIL
LIGR
AMS
PER
LITE
R
igure 15. Measured and simulated sulfate concentrations for Red River water-quality model calibration points for May 10,004.
Belo
w B
aldh
ill D
am
Measured
Simulated
At L
isbo
n
Nea
r Kin
dred
Abo
ve S
heye
nne
Rive
r div
ersi
on n
ear H
orac
e
Nea
r Coo
pers
tow
n
Abo
ve H
arve
y(A)
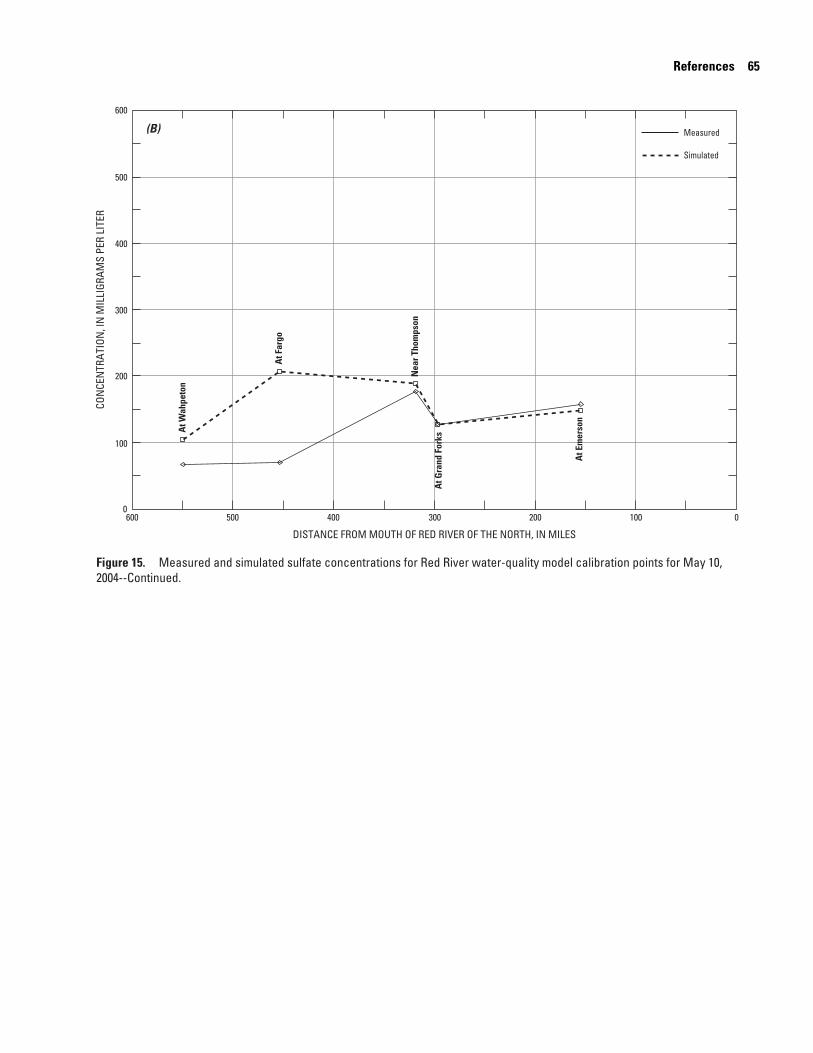
References 65
0
400
500
600
300
200
100
600 500 400 300 200 100 0
DISTANCE FROM MOUTH OF RED RIVER OF THE NORTH, IN MILES
CON
CEN
TRAT
ION
, IN
MIL
LIGR
AMS
PER
LITE
R
Measured
Simulated
At W
ahpe
ton
At F
argo
Nea
r Tho
mps
on
At E
mer
son
At G
rand
For
ks
Figure 15. Measured and simulated sulfate concentrations for Red River water-quality model calibration points for May 10,2004--Continued.
(B)

66 S
F2
imulation of Conservative-Constituent Transport in the Red River of the North Basin, 2003-04
0
100
80
60
40
20
600 500 400 300 200 100 0
DISTANCE FROM MOUTH OF SHEYENNE RIVER, IN MILES
CON
CEN
TRAT
ION
, IN
MIL
LIGR
AMS
PER
LITE
R
igure 16. Measured and simulated chloride concentrations for Red River water-quality model calibration points for May 10,004.
Belo
w B
aldh
ill D
am
Measured
Simulated
At L
isbo
n
Nea
r Kin
dred
Abo
ve S
heye
nne
Rive
r div
ersi
on n
ear H
orac
e
Nea
r Coo
pers
tow
n
Abo
ve H
arve
y
(A)
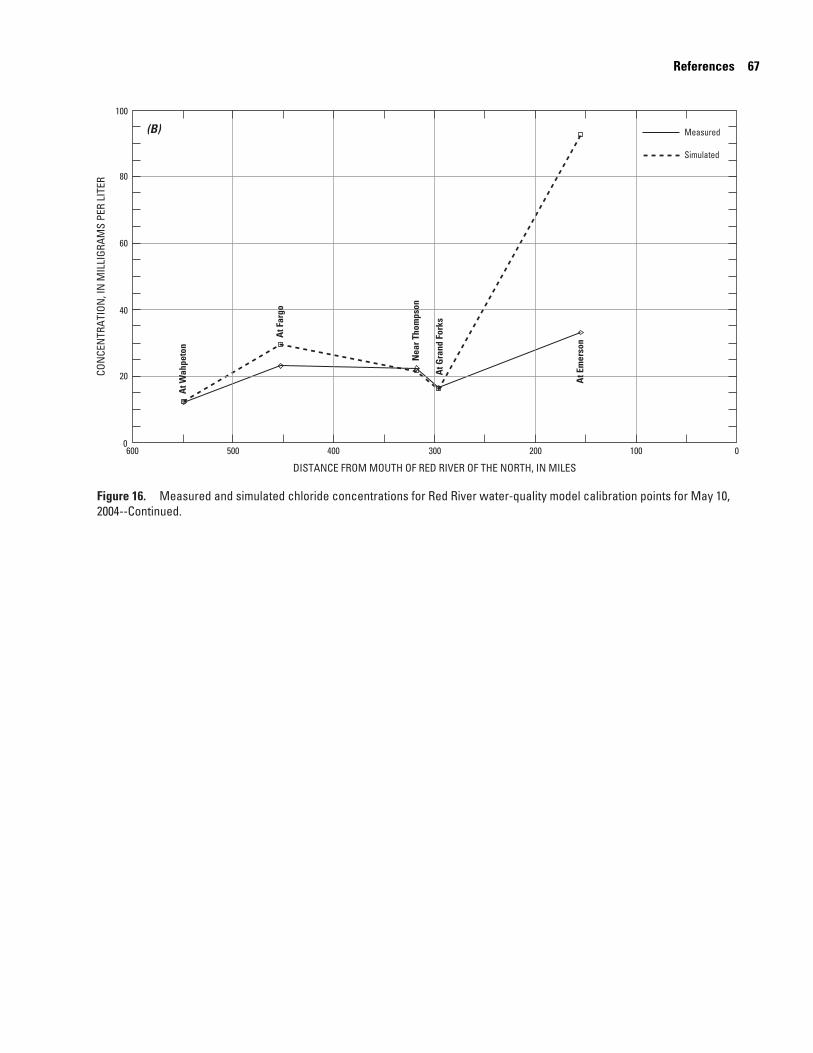
References 67
0
100
20
40
60
80
600 500 400 300 200 0100
DISTANCE FROM MOUTH OF RED RIVER OF THE NORTH, IN MILES
CON
CEN
TRAT
ION
, IN
MIL
LIGR
AMS
PER
LITE
R
Measured
Simulated
At W
ahpe
ton
At F
argo
Nea
r Tho
mps
on
At E
mer
son
At G
rand
For
ks
Figure 16. Measured and simulated chloride concentrations for Red River water-quality model calibration points for May 10,2004--Continued.
(B)
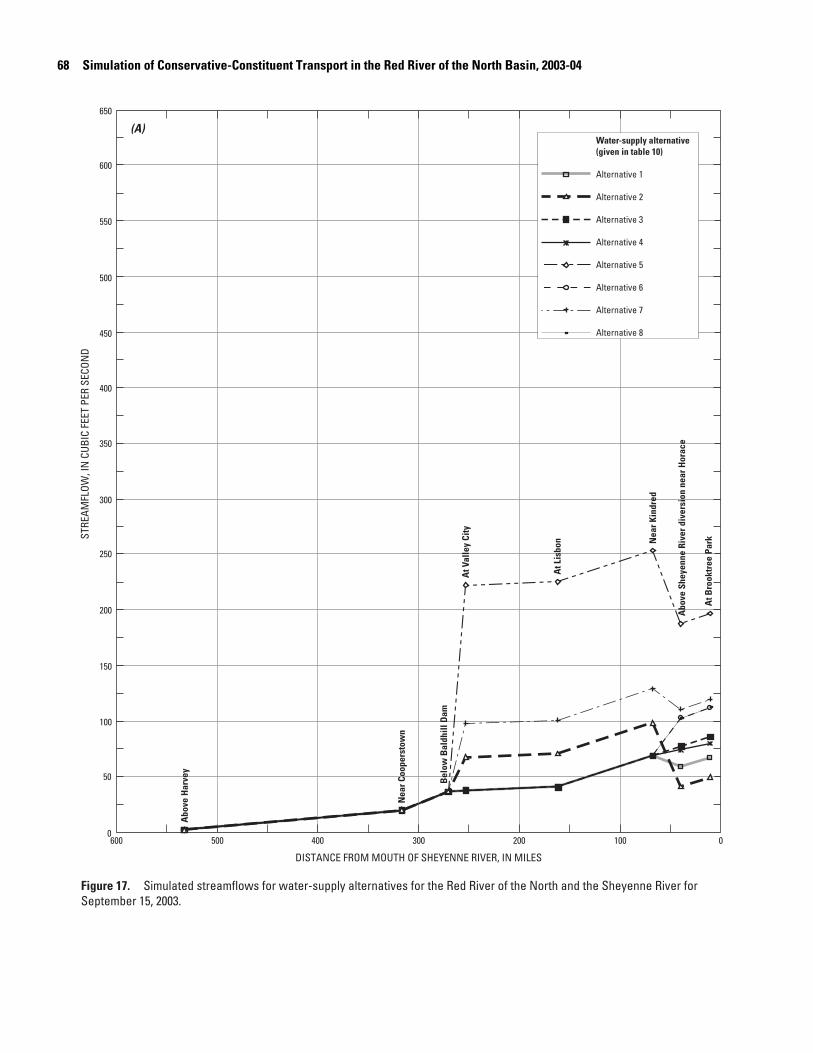
68 S
FS
imulation of Conservative-Constituent Transport in the Red River of the North Basin, 2003-04
600
650
500
550
400
450
300
350
200
250
100
150
STRE
AMFL
OW, I
N C
UBIC
FEE
T PE
R SE
CON
D
w B
aldh
ill D
am
Water-supply alternative(given in table 10)
Alternative 1
Alternative 2
Alternative 3
Alternative 4
Alternative 5
Alternative 6
Alternative 7
Alternative 8
At L
isbo
n Nea
r Kin
dred
Abo
ve S
heye
nne
Rive
r div
ersi
on n
ear H
orac
e
pers
tow
n
At V
alle
y Ci
ty
At B
rook
tree
Par
k
(A)
0
50
600 500 400 300 200 0100
DISTANCE FROM MOUTH OF SHEYENNE RIVER, IN MILES
igure 17. Simulated streamflows for water-supply alternatives for the Red River of the North and the Sheyenne River foreptember 15, 2003.
Bel
o
Nea
r Coo
Abo
ve H
arve
y
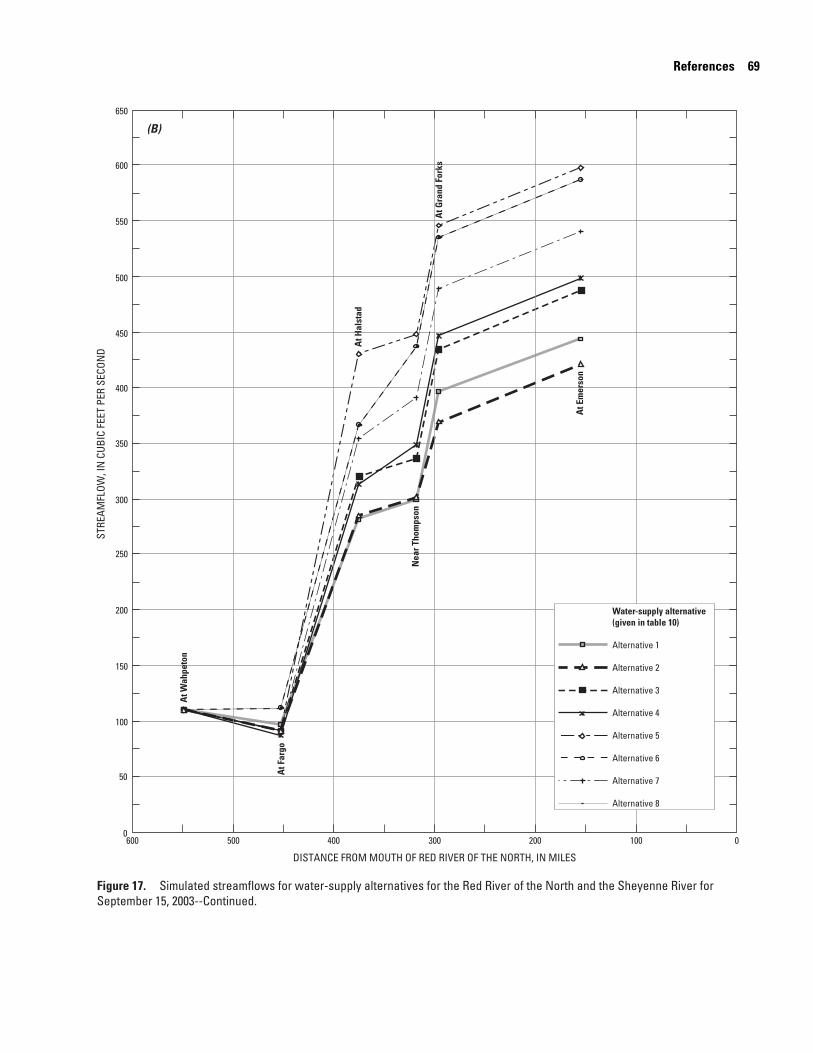
References 69
600
650
500
550
400
450
300
350
200
250
100
150
STRE
AMFL
OW, I
N C
UBIC
FEE
T PE
R SE
CON
D
Water-supply alternative(given in table 10)
Alternative 1
Alternative 2
Alternative 3
Alternative 4
Alternative 5
At W
ahpe
ton
go
Nea
r Tho
mps
on
At E
mer
son
At G
rand
For
ks
At H
alst
ad
(B)
0
50
600 500 400 300 200 0100
DISTANCE FROM MOUTH OF RED RIVER OF THE NORTH, IN MILES
Alternative 6
Alternative 7
Alternative 8
Figure 17. Simulated streamflows for water-supply alternatives for the Red River of the North and the Sheyenne River forSeptember 15, 2003--Continued.
At F
ar
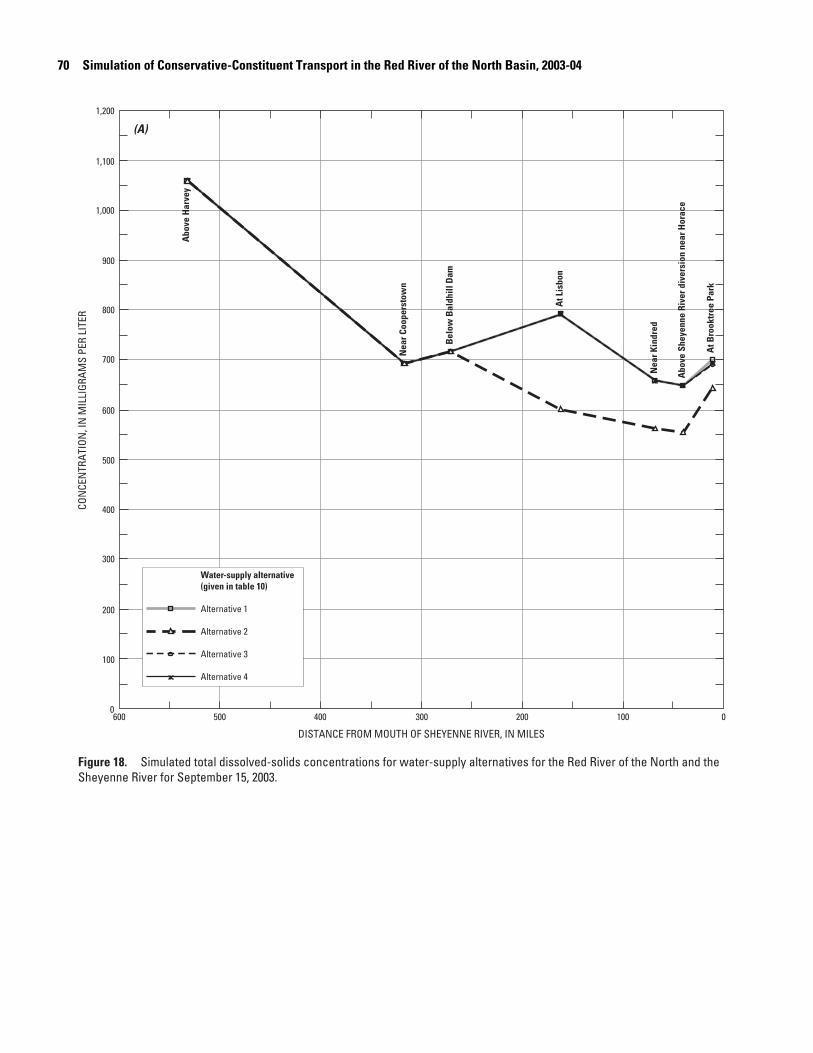
70 S
FiS
imulation of Conservative-Constituent Transport in the Red River of the North Basin, 2003-04
0
800
900
1,200
1,100
1,000
700
600
500
400
300
200
100
600 500 400 300 200 100 0
DISTANCE FROM MOUTH OF SHEYENNE RIVER, IN MILES
CON
CEN
TRAT
ION
, IN
MIL
LIGR
AMS
PER
LITE
R
Bel
ow B
aldh
ill D
am
Water-supply alternative(given in table 10)
Alternative 1
Alternative 2
Alternative 3
Alternative 4
At L
isbo
n
Nea
r Kin
dred
Abo
ve S
heye
nne
Rive
r div
ersi
on n
ear H
orac
e
Nea
r Coo
pers
tow
n
Abo
ve H
arve
y
At B
rook
tree
Par
k
gure 18. Simulated total dissolved-solids concentrations for water-supply alternatives for the Red River of the North and the
(A)
heyenne River for September 15, 2003.
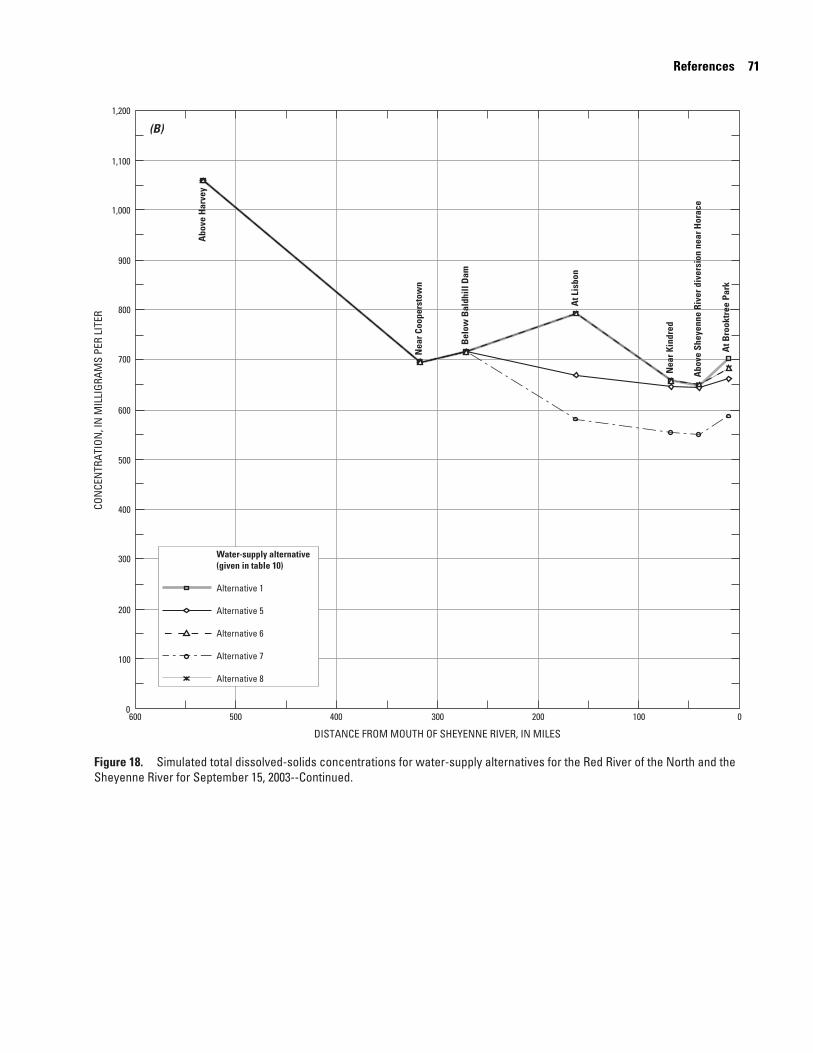
References 71
0
800
900
1,200
1,100
1,000
700
600
500
400
300
200
100
600 500 400 300 200 100 0
DISTANCE FROM MOUTH OF SHEYENNE RIVER, IN MILES
CON
CEN
TRAT
ION
, IN
MIL
LIGR
AMS
PER
LITE
R
Bel
ow B
aldh
ill D
am
Water-supply alternative(given in table 10)
Alternative 1
Alternative 5
Alternative 6
Alternative 7
Alternative 8
At L
isbo
n
Nea
r Kin
dred
Abo
ve S
heye
nne
Rive
r div
ersi
on n
ear H
orac
e
Nea
r Coo
pers
tow
n
Abo
ve H
arve
y
At B
rook
tree
Par
k
(B)
Figure 18. Simulated total dissolved-solids concentrations for water-supply alternatives for the Red River of the North and theSheyenne River for September 15, 2003--Continued.
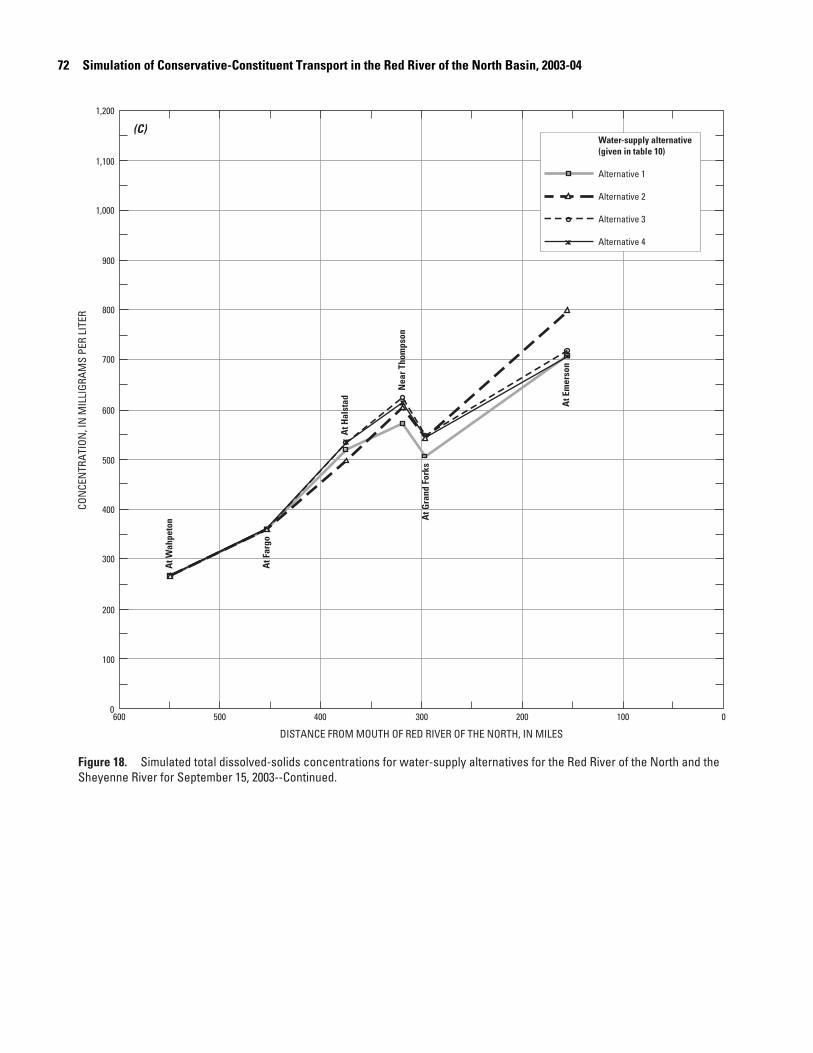
72 S
FiS
imulation of Conservative-Constituent Transport in the Red River of the North Basin, 2003-04
0
800
900
1,200
1,100
1,000
700
600
500
400
300
200
100
600 500 400 300 200 100 0
DISTANCE FROM MOUTH OF RED RIVER OF THE NORTH, IN MILES
CON
CEN
TRAT
ION
, IN
MIL
LIGR
AMS
PER
LITE
R
gure 18. Simulated total dissolved-solids concentrations for water-supply alternatives for the Red River of the North and the
Water-supply alternative(given in table 10)
Alternative 1
Alternative 2
Alternative 3
Alternative 4
At W
ahpe
ton
At F
argo
Nea
r Tho
mps
on
At E
mer
son
At G
rand
For
ks
At H
alst
ad
(C)
heyenne River for September 15, 2003--Continued.
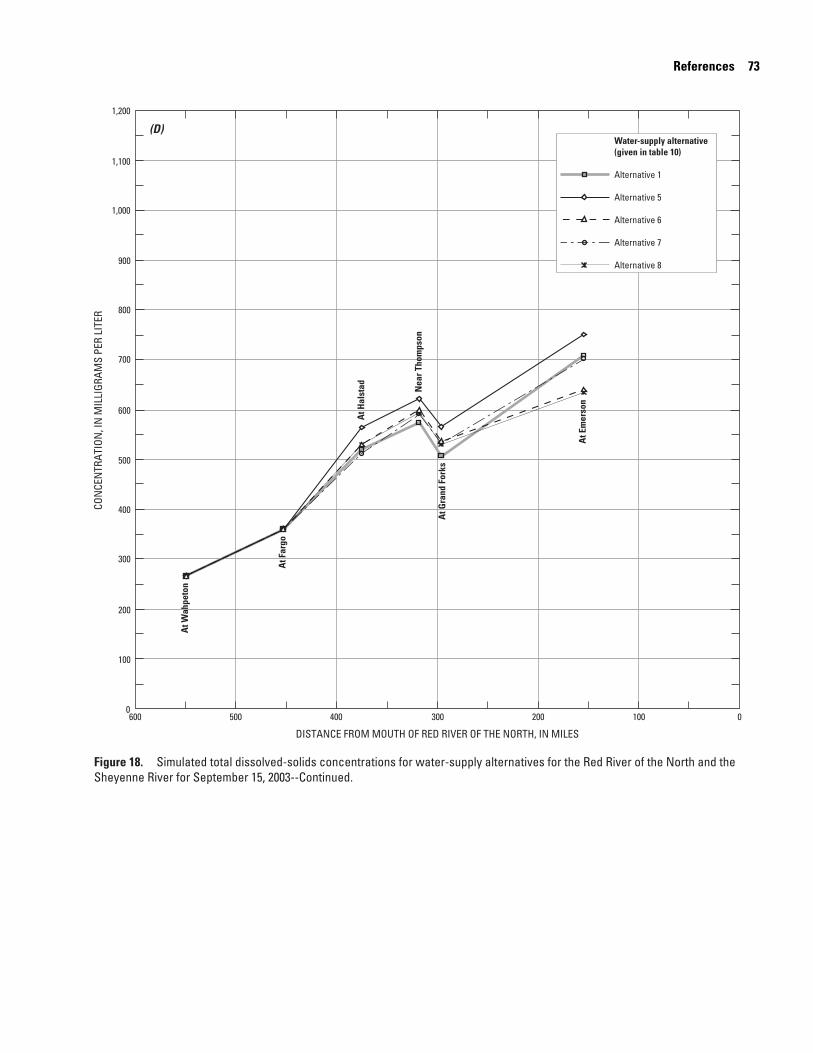
References 73
0
800
900
1,200
1,100
1,000
700
600
500
400
300
200
100
600 500 400 300 200 100 0
DISTANCE FROM MOUTH OF RED RIVER OF THE NORTH, IN MILES
CON
CEN
TRAT
ION
, IN
MIL
LIGR
AMS
PER
LITE
R
Water-supply alternative(given in table 10)
Alternative 1
Alternative 5
Alternative 6
Alternative 7
Alternative 8
At W
ahpe
ton
At F
argo
Nea
r Tho
mps
on
At E
mer
son
At G
rand
For
ks
At H
alst
ad
(D)
Figure 18. Simulated total dissolved-solids concentrations for water-supply alternatives for the Red River of the North and theSheyenne River for September 15, 2003--Continued.
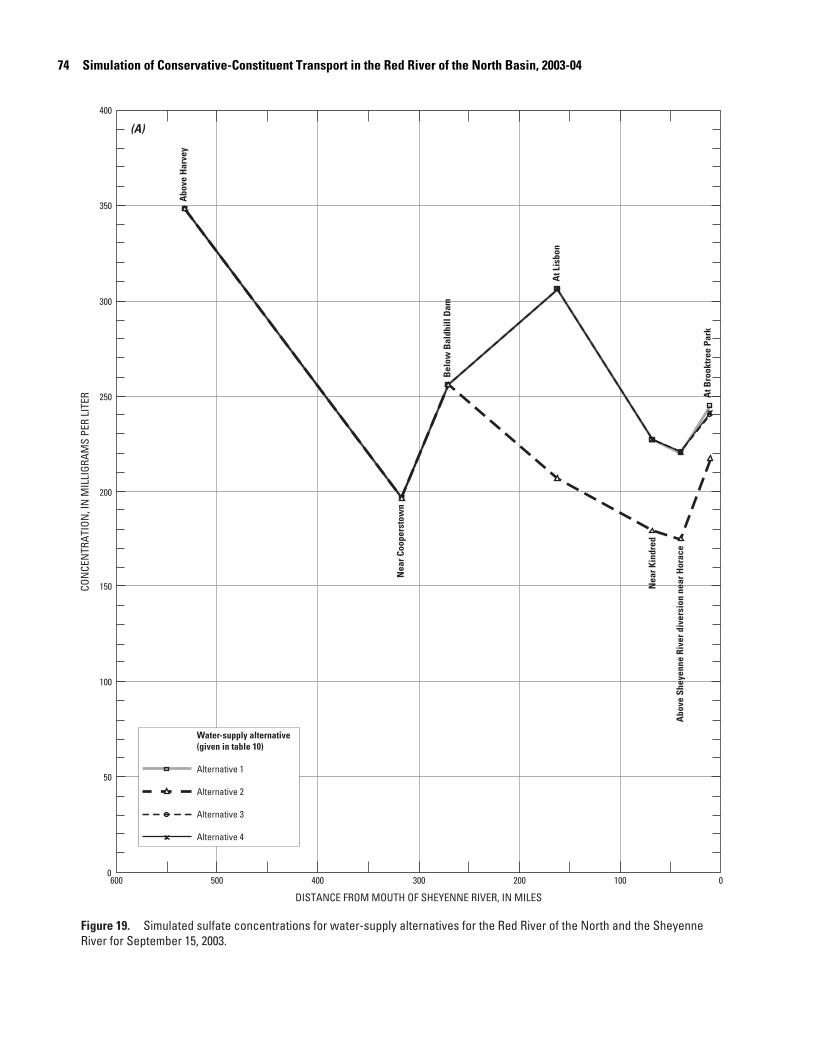
74 S
FR
imulation of Conservative-Constituent Transport in the Red River of the North Basin, 2003-04
400
350
300
150
100
250
200
CON
CEN
TRAT
ION
, IN
MIL
LIGR
AMS
PER
LITE
R
Bel
ow B
aldh
ill D
am
Water-supply alternative(given in table 10)
At L
isbo
n
Nea
r Kin
dred
Abo
ve S
heye
nne
Rive
r div
ersi
on n
ear H
orac
e
Nea
r Coo
pers
tow
n
Abo
ve H
arve
y
At B
rook
tree
Par
k
(A)
0
50
600 500 400 300 200 100 0
DISTANCE FROM MOUTH OF SHEYENNE RIVER, IN MILES
igure 19. Simulated sulfate concentrations for water-supply alternatives for the Red River of the North and the Sheyenneiver for September 15, 2003.
Alternative 1
Alternative 2
Alternative 3
Alternative 4
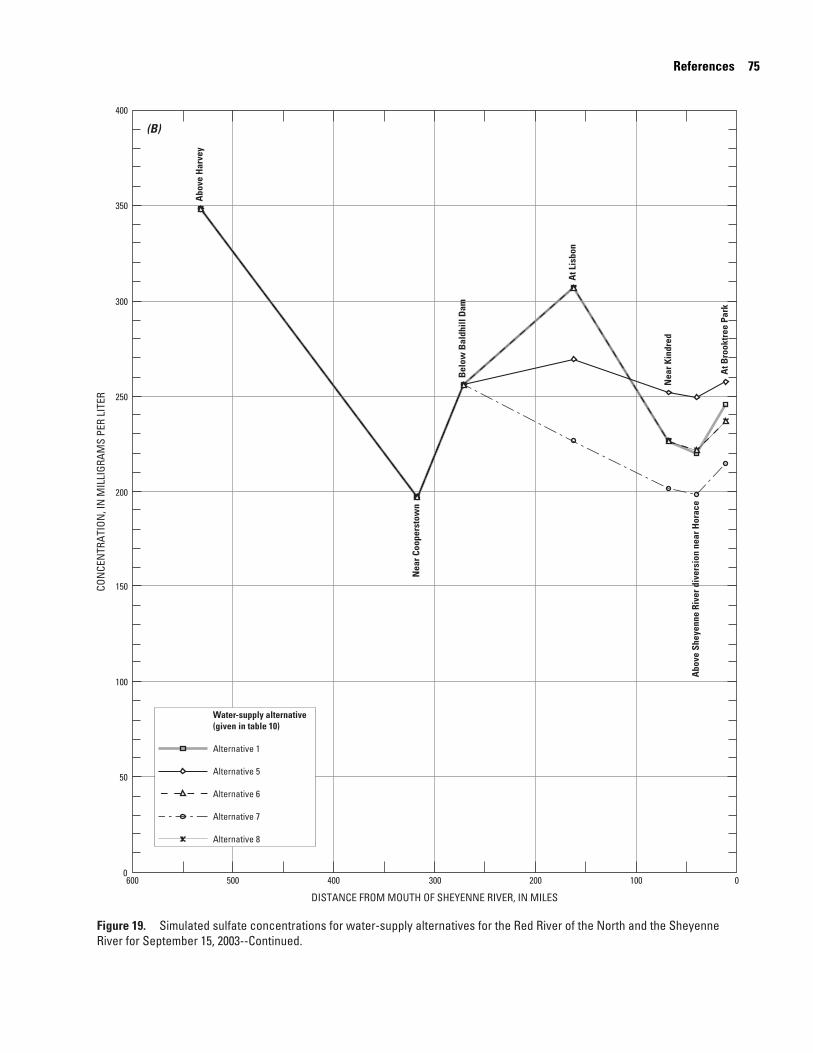
References 75
400
350
300
150
100
250
200
CON
CEN
TRAT
ION
, IN
MIL
LIGR
AMS
PER
LITE
R
Water-supply alternative(given in table 10)
Alternative 1
Bel
ow B
aldh
ill D
am
At L
isbo
n
Nea
r Kin
dred
Abo
ve S
heye
nne
Rive
r div
ersi
on n
ear H
orac
e
Nea
r Coo
pers
tow
n
Abo
ve H
arve
y
At B
rook
tree
Par
k
(B)
0
50
600 500 400 300 200 100 0
DISTANCE FROM MOUTH OF SHEYENNE RIVER, IN MILES
Alternative 5
Alternative 6
Alternative 7
Alternative 8
Figure 19. Simulated sulfate concentrations for water-supply alternatives for the Red River of the North and the SheyenneRiver for September 15, 2003--Continued.
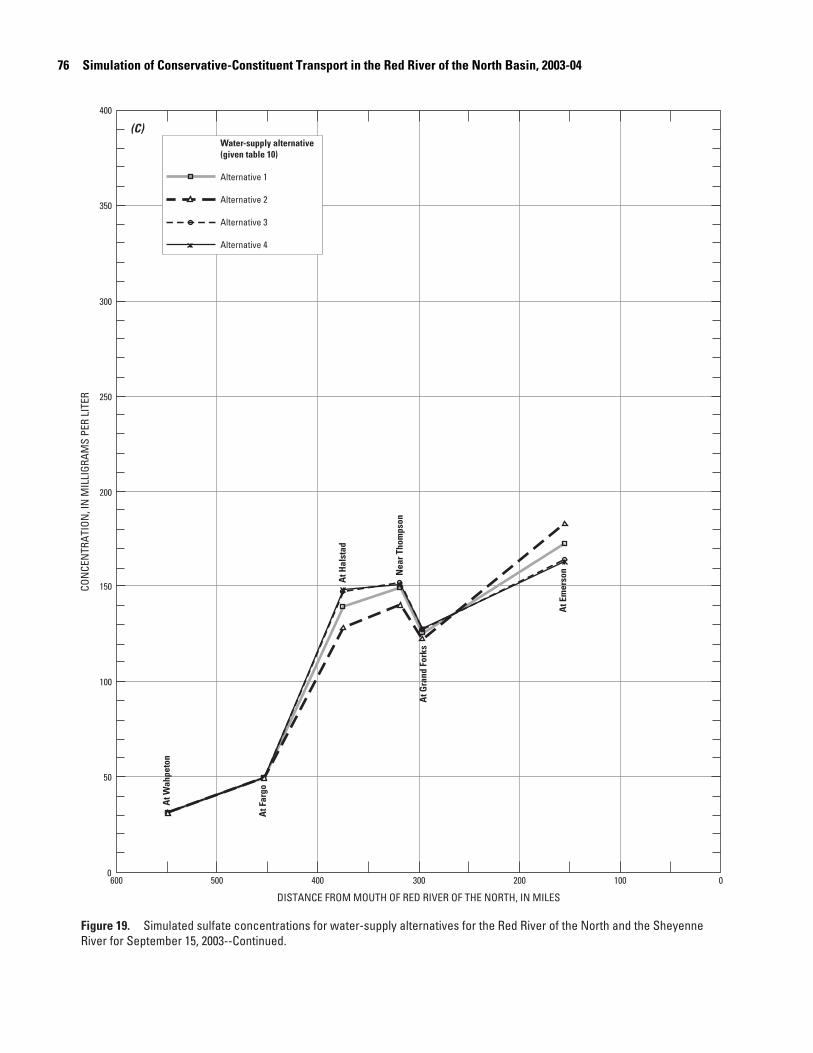
76 S
FR
imulation of Conservative-Constituent Transport in the Red River of the North Basin, 2003-04
400
350
300
150
100
250
200
CON
CEN
TRAT
ION
, IN
MIL
LIGR
AMS
PER
LITE
R
Water-supply alternative(given table 10)
Alternative 1
Alternative 2
Alternative 3
Alternative 4
ton
Nea
r Tho
mps
on
At E
mer
son
At G
rand
For
ks
At H
alst
ad
(C)
0
50
600 500 400 300 200 100 0
DISTANCE FROM MOUTH OF RED RIVER OF THE NORTH, IN MILES
igure 19. Simulated sulfate concentrations for water-supply alternatives for the Red River of the North and the Sheyenneiver for September 15, 2003--Continued.
At W
ahpe
At F
argo
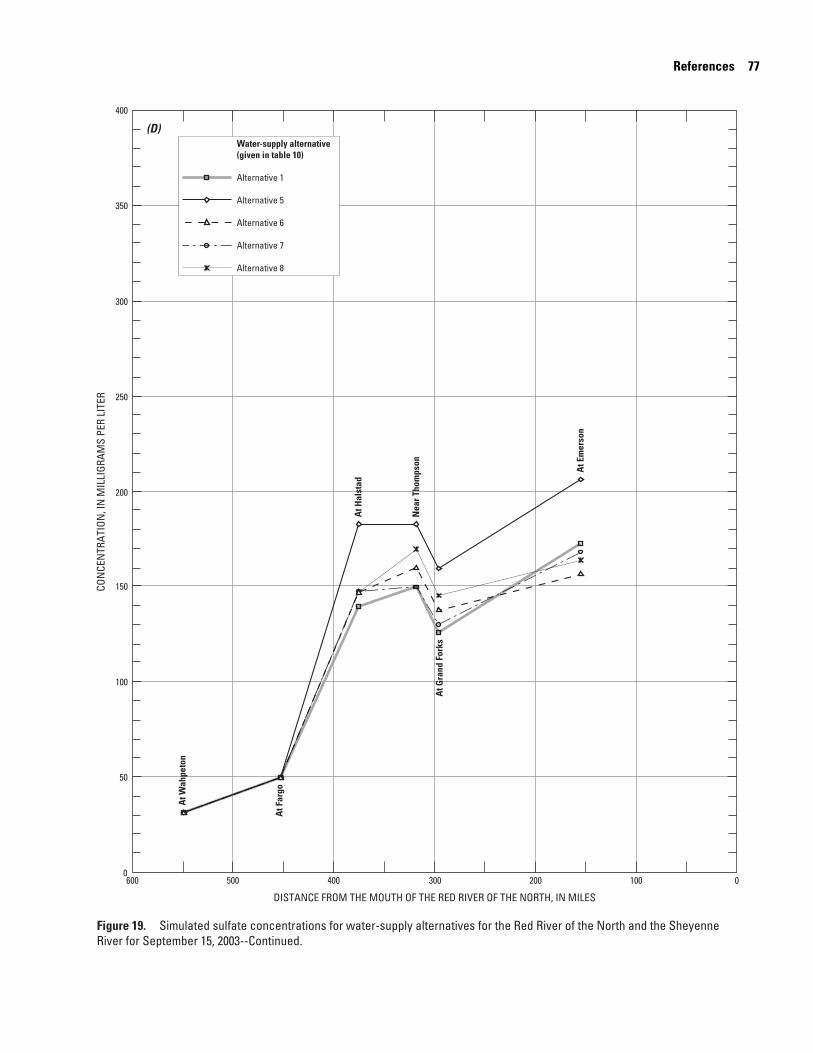
References 77
400
350
300
150
100
250
200
CON
CEN
TRAT
ION
, IN
MIL
LIGR
AMS
PER
LITE
R
Water-supply alternative(given in table 10)
Alternative 1
Alternative 5
Alternative 6
Alternative 7
Alternative 8
Nea
r Tho
mps
on
At E
mer
son
At G
rand
For
ks
At H
alst
ad
(D)
0
50
600 500 400 300 200 100 0
DISTANCE FROM THE MOUTH OF THE RED RIVER OF THE NORTH, IN MILES
At W
ahpe
ton
At F
argo
Figure 19. Simulated sulfate concentrations for water-supply alternatives for the Red River of the North and the SheyenneRiver for September 15, 2003--Continued.
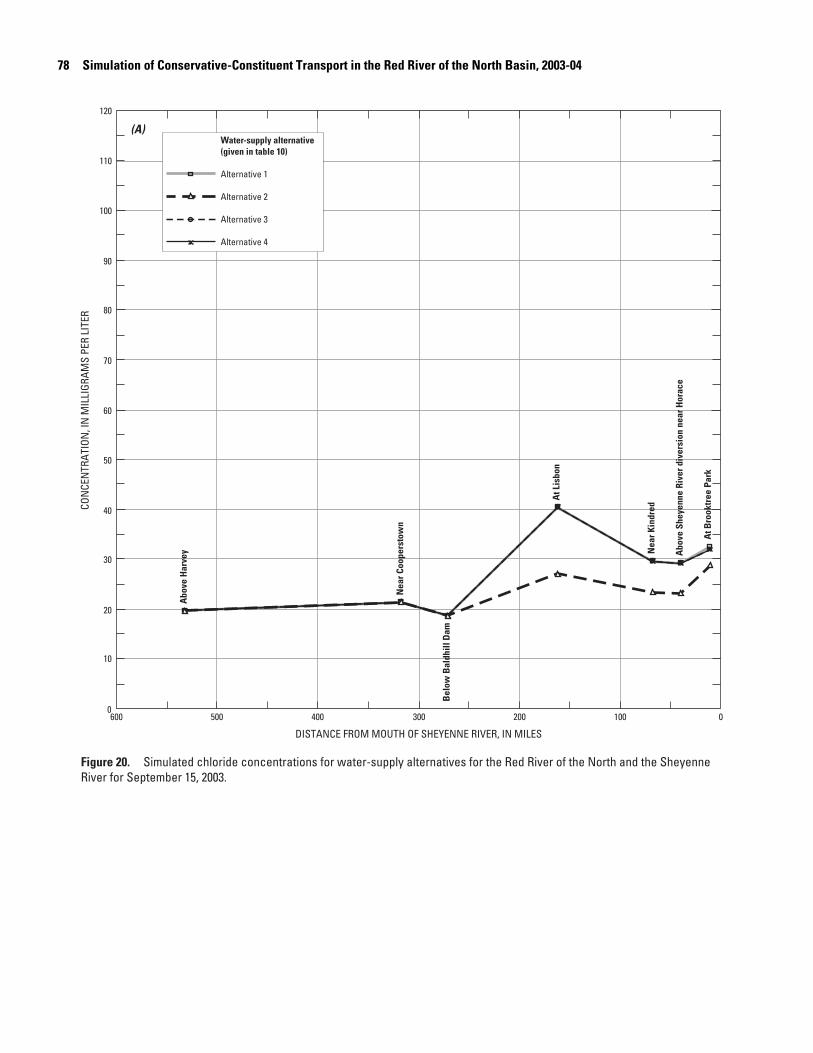
78 S
FR
imulation of Conservative-Constituent Transport in the Red River of the North Basin, 2003-04
0
20
30
10
40
50
60
70
80
90
120
110
100
600 500 400 300 200 100 0
DISTANCE FROM MOUTH OF SHEYENNE RIVER, IN MILES
CON
CEN
TRAT
ION
, IN
MIL
LIGR
AMS
PER
LITE
R
igure 20. Simulated chloride concentrations for water-supply alternatives for the Red River of the North and the Sheyenne
Bel
ow B
aldh
ill D
am
Water-supply alternative(given in table 10)
Alternative 1
Alternative 2
Alternative 3
Alternative 4
At L
isbo
n
Nea
r Kin
dred
Abo
ve S
heye
nne
Rive
r div
ersi
on n
ear H
orac
e
Nea
r Coo
pers
tow
n
Abo
ve H
arve
y
At B
rook
tree
Par
k
(A)
iver for September 15, 2003.
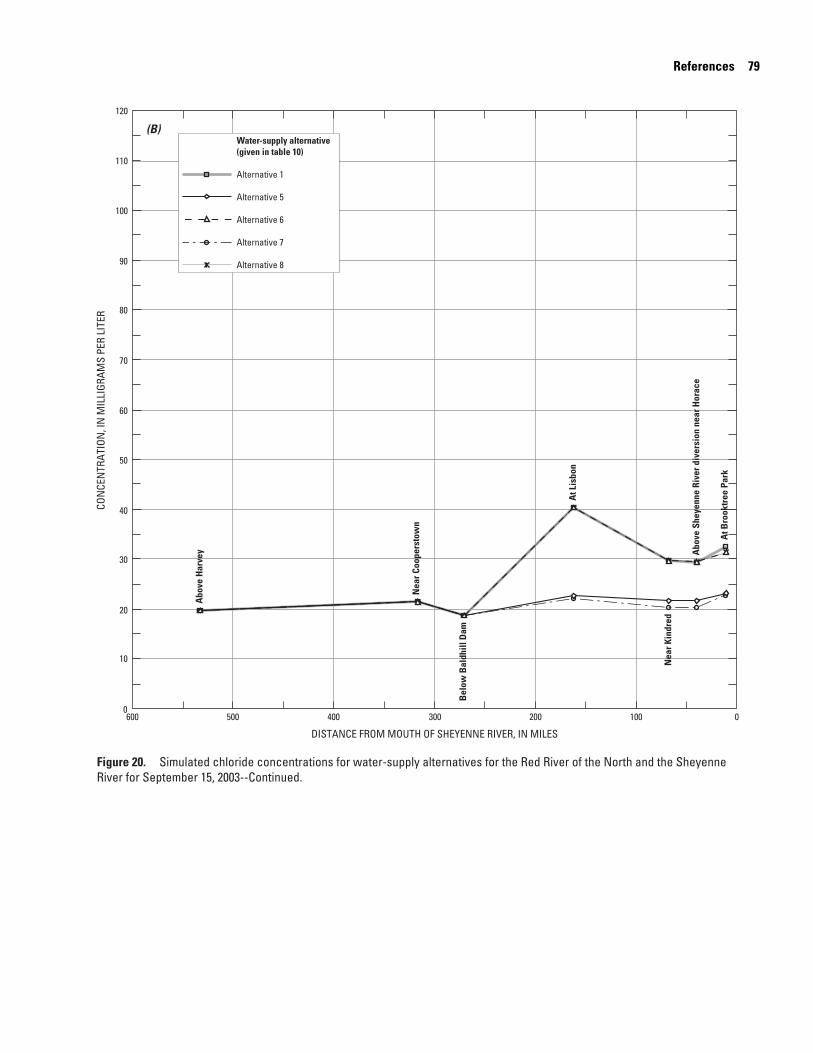
References 79
0
20
30
10
40
50
60
70
80
90
120
110
100
600 500 400 300 200 100 0
DISTANCE FROM MOUTH OF SHEYENNE RIVER, IN MILES
CON
CEN
TRAT
ION
, IN
MIL
LIGR
AMS
PER
LITE
R
Bel
ow B
aldh
ill D
am
Water-supply alternative(given in table 10)
Alternative 1
Alternative 5
Alternative 6
Alternative 7
Alternative 8
At L
isbo
n
Nea
r Kin
dred
Abo
ve S
heye
nne
Rive
r div
ersi
on n
ear H
orac
e
Nea
r Coo
pers
tow
n
Abo
ve H
arve
y
At B
rook
tree
Par
k
(B)
Figure 20. Simulated chloride concentrations for water-supply alternatives for the Red River of the North and the SheyenneRiver for September 15, 2003--Continued.
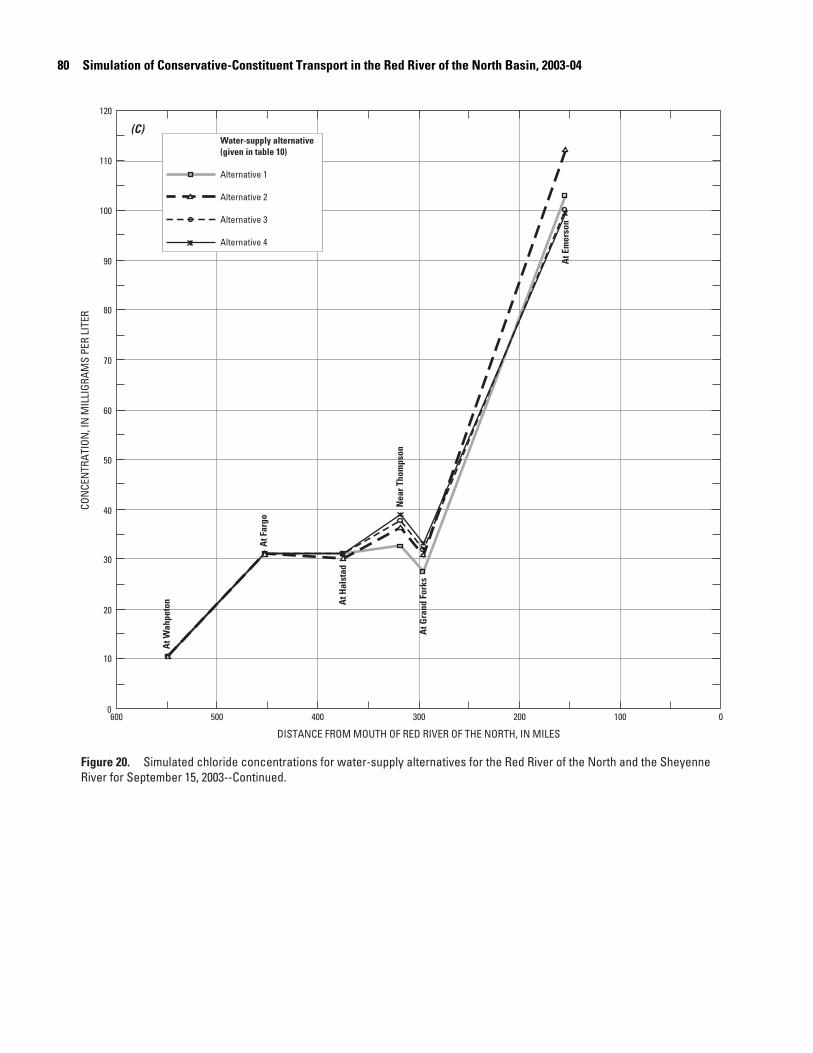
80 S
FR
imulation of Conservative-Constituent Transport in the Red River of the North Basin, 2003-04
0
20
30
10
40
50
60
70
80
90
120
110
100
600 500 400 300 200 100 0
DISTANCE FROM MOUTH OF RED RIVER OF THE NORTH, IN MILES
CON
CEN
TRAT
ION
, IN
MIL
LIGR
AMS
PER
LITE
R
Water-supply alternative(given in table 10)
Alternative 1
Alternative 2
Alternative 3
Alternative 4
igure 20. Simulated chloride concentrations for water-supply alternatives for the Red River of the North and the Sheyenne
At W
ahpe
ton
At F
argo
Nea
r Tho
mps
on
At E
mer
son
At G
rand
For
ks
At H
alst
ad
(C)
iver for September 15, 2003--Continued.
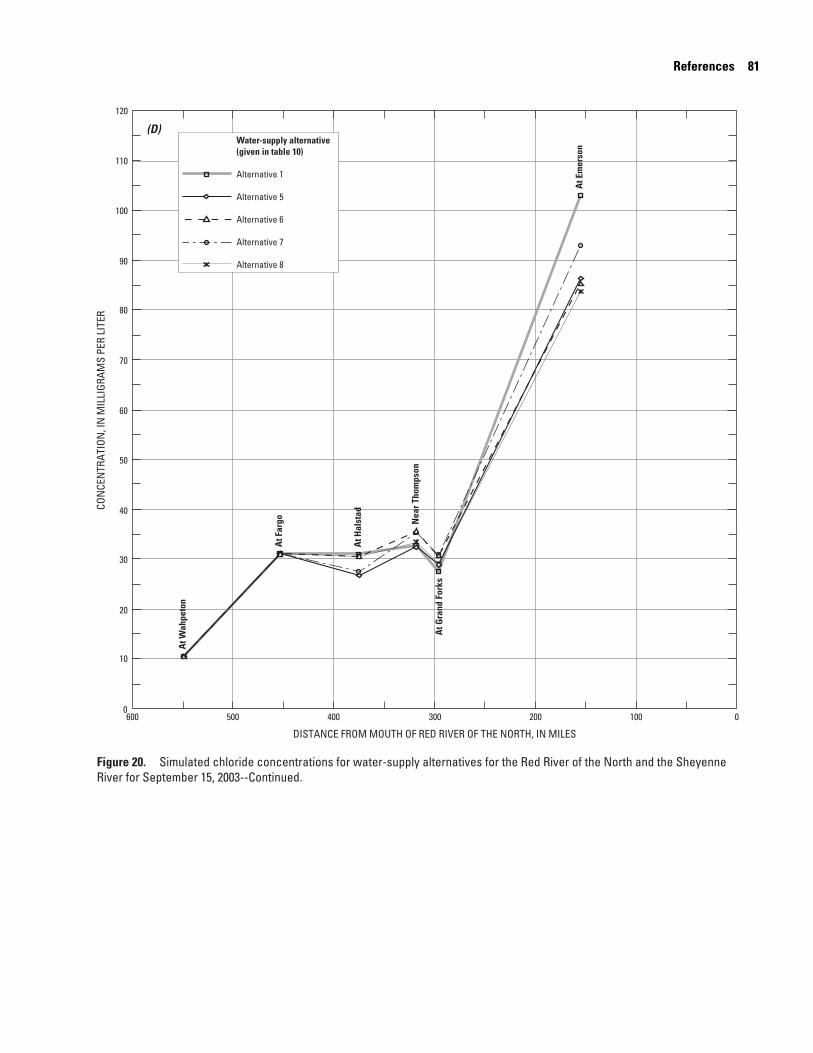
References 81
0
20
30
10
40
50
60
70
80
90
120
110
100
600 500 400 300 200 100 0
DISTANCE FROM MOUTH OF RED RIVER OF THE NORTH, IN MILES
CON
CEN
TRAT
ION
, IN
MIL
LIGR
AMS
PER
LITE
R
Water-supply alternative(given in table 10)
Alternative 1
Alternative 5
Alternative 6
Alternative 7
Alternative 8
At W
ahpe
ton
At F
argo N
ear T
hom
pson
At E
mer
son
At G
rand
For
ks
At H
alst
ad
(D)
Figure 20. Simulated chloride concentrations for water-supply alternatives for the Red River of the North and the SheyenneRiver for September 15, 2003--Continued.
Nustad and Bales–Sim
ulation of Conservative-Constituent Transport in the Red River of the North B
asin, North D
akota and M
innesota, 2003-04–Scientific Investigations Report 2005–5273
In cooperation with the Bureau of Reclamation
Simulation of Conservative-Constituent Transport in the Red River of the North Basin, North Dakota and Minnesota, 2003-04
Scientific Investigations Report 2005–5273
U.S. Department of the InteriorU.S. Geological SurveyPrinted on recycled paper
Otter Tail River
Bois de Sioux River
Near Cooperstown
At Lisbon
At Valley City
Lake Ashtabula
Above Harvey Near Warwick
Near Kindred
At Emerson
At Drayton
MANITOBACANADA
UNITED STATESMINNESOTANORTH DAKOTA
At Oslo
At Grand Forks
Near Thompson
At Halstad
At confluence with Sheyenne River
At Fargo
At Hickson
At Wahpeton
At North DakotaHighway 30near Maddock
Sand Hill River
Marsh River
Wild Rice River
Buffalo River
Turtle River
Forest River
Park River
Pembina River
Two Rivers
Snake River
Red Lake RiverAt PetersonCoulee
Below Baldhill Dam
Above Sheyenne Riverdiversion near Horace
At Brooktree Park
Into Lake Ashtabula
SHEYENN
E
RIVE
RO
FTH
EN
ORT
HRE
D
RIVER
Goose River
Wild Rice River
SCHEMATIC DIAGRAM