Embed Size (px)
Citation preview
INTERNATIONAL JOURNAL OF SCIENTIFIC & TECHNOLOGY RESEARCH VOLUME 1, ISSUE 9, OCTOBER 2012 ISSN 2277-8616
1 IJSTR©2012 www.ijstr.org
Simulating Power Distribution Network In Nigeria – The Ikpoba-Hill District Network As A Case Study
G. I. Ighalo, A. A. Williams
ABSTRACT:- The difficulty encountered by the Power Holding Company of Nigeria (PHCN) in the distribution of the insufficient electrical energy generated, has led to this research. Ikpoba-hill network is one of the busiest and high demand networks in Nigeria. It is a 33/11 KV substation which experiences blackout especially with the many industries within its area of jurisdiction. The non availability of proper location as well as details about the transmission lines, poles and transformers calls for concern. To simulate the power distribution network, the Geographical information system (GIS) and the Global positioning system (GPS) techniques were used. Through the use of the GIS, consumer indexing (CI) can effectively be made to manage information on distribution of electricity to consumers and information describing the attributes of each consumer such as location, consumption pattern, the various circuit connections, feeders, etc. Both the geometric data and attribute data collected are entered into the system through MS Excel and later exported into Arc View. Results of the study, show how low loss reduction strategy can be formulated for the Ikpoba-hill network and hence for Nigeria. Keywords:- data, distribution, GIS, GPS, map, network. 1. INTRODUCTION Electricity generation in Nigeria is generally regarded to be below the demand. This has therefore resulted in energy supply crisis which the PHCN and government are trying to resolve. This situation is worsened by the network distribution problems which are due to the absence of up to date information about the facilities of the PHCN. Distribution systems network carries electricity from the transmission system and delivers it to the consumer. Such network would include medium voltage power lines, substations, pole monitored transformers and low voltage (less than 1 KV) distribution wiring meters. All modern distribution systems starts as the primary circuit leaves the substation and ends as the secondary services enter the consumers meter sockets. Initially energy leaves the substation in a primary circuit usually with all three phases [1]. Since the pre-independence era, most Nigerian power supply through the few towns that had electricity saw poles at long distances that carried electrical energy through forest/villages or without proper protection and connections which were made both legally and illegally. There was no functional geo-database of the available facilities. The injection substations, transformers and even the poles were not properly documented. At times some facilities could be dumped and not even documented. In cases where such facilities were documented, access to the areas was difficult to locate. Problems of identification of amenities in the feeders were also very difficult if not impossible to locate. Issues of broken down facilities which were not known to the PHCN also affected distribution.[2] Currently with the privatization in the power sector, some towns and cities can get power though majority of the towns still have epileptic power supply which are still due to the mode of distribution. The Ikpoba Hill 33/11KV substation which is part of Benin City in Edo State has four feeders namely, Asaba road feeder, (public) Federal Housing estate feeder (public), BDPA (Bendel Development Property Authority) feeder (public) and the new Auchi road feeder (public). From this 33/11 KV substation consumers can directly take electricity through the transmission network system. To improve on this distribution performance, this write-up tends to discuss the result of its simulation using the GIS and the GPS [3] systems and hence to formulate a possible policy for electricity distribution.
2. MATERIALS AND METHODS The GIS technique (which is a computerized tool for capturing, storing, checking, integrating, manipulating, analysing and displaying geographical information) and the GPS device ( which has the capability to calculate both latitudes and longitudes of locations thereby showing available paths, roads or paths leading to utilities) work hand in hand. While one locates, the other integrates such information on the events [4]. This simulation process includes the following stages:-
- Collecting information of the existing electrical distribution network
- Creating of an electrical network using the GPS data
- Using existing GIS packages for customizing of electrical network application
- Understanding the business process flow of power distribution network
- Design of a database to minimize the data redundancy and effective functioning of the application
- Customization of the software to fulfil the application needs.
With the values of the tables for the various feeders as indicated, the study concentrated into three areas to summarise the process of simulation. First geometric and attribute data for the various feeders, transformers, electric poles, cables etc were captured with the help of the Garmin 76S map GPS in differential mode. A participatory approach was used in the GIS mapping with the PHCN lines men involved as they were better informed in identifying the properties. Guidelines and assistance from the surveyors were strictly adhered to as the instruments are controlled and used only by them. The next stage involved the development or generation of network (point and line) using the GIS software. After this important stage, an application programme was developed using Visual Basic and Map objects. This involved the planning stage, which is segmented into five phases:
- a) data acquisition - b) data processing - c) database design and formulation - d) database implementation - e) information presentation
INTERNATIONAL JOURNAL OF SCIENTIFIC & TECHNOLOGY RESEARCH VOLUME 1, ISSUE 9, OCTOBER 2012 ISSN 2277-8616
2 IJSTR©2012 www.ijstr.org
In summary, placing the GPS instrument at the bottom of each electric pole, the coordinates was obtained. This was done street by street in relation to the transformer that served them. Similarly the coordinates for the transformer as well as the feeders were found and documented. During the geometric data acquisition, the attribute data of each entity in each of the feeders (Poles, cables, transformers injection substation, etc) were captured. To achieve the purpose of this work, the relational data structure was used. The data are stored on a simple manner such as tables. Each table contain items called fields about a particular object. The data structures were executed using Arc view 3.2a In this case the entities identified are: i) Low tension electric poles, ii) High tension electric poles, iii) Low and High Tension (dual) electric poles, iv) High Tension cables, v) Low Tension cables, vi) High and Low tension cables, vii) Underground cable, viii) Transformers, ix) Feeders. When a relation database was formed in Arc view 3.2a the following was achieved:-
LT Poles (Pole _ ID, Easting (m), Northing (m), Location, Type, Status, Cable Size, Remark) HT Cable (Street name, Cable Size (mm), Length _ meters) Dual Cable (Street Name, Cable size (mm), Length _ meters) LT Cable (Street Name, Cable Size (mm), Substation Attached, Length _ meters) Transformer (Trans _ ID, Easting (m), Northing (m), Substation Name, Location, Make, Year Made, Impedance, Capacity, Remarks) Injection Station (Name, Location, Make, Capacity, Year _ Installed, Max. Load)
3.0 RESULTS From the simulation, the results obtained are always displayed in form of reports, queries, charts etc. These are provided by the customer information services through an established electrical call centre (ECC). However the overall information using Arc view 3.2a is shown in Fig 3.1 where entities are organized into themes. The spatial space operation during this simulation was carried out through query generation. By this, information stored in the data base was retrieved pertaining defined attributes to answer spatial related questions using structured query Language (SQL). One of such queries was on the determination of concrete Electric poles carrying High Tension Cable. Query Type of analysis:- Database Extraction Syntax Model: ([Type] = “concrete”) and ([Cable_ Type ] = “HT”) Result to Query Total no. of RMU,S = 0 Total no. of HT concrete poles = 226 Total no. of HT wooden poles = 6 Total no. of dual concrete poles = 122 Total no. of dual wooden poles = 4 Total no. of LT concrete poles = 629 Total no. of LT wooden poles = 497 Total no. of Transformers – Public = 227 Total = 42 Total length of Cables
Total length of HT cable = 7156.255 m Total length of LV cable = 32594.161 m Total length of HT + LV cable = 4412.525 m Where: HT – High Tension
LT – Low tension LV – Low voltage

INTERNATIONAL JOURNAL OF SCIENTIFIC & TECHNOLOGY RESEARCH VOLUME 1, ISSUE 9, OCTOBER 2012 ISSN 2277-8616
3 IJSTR©2012 www.ijstr.org
Fig.3.1: Output of electricity distribution in Ikpoba Hill business district.

INTERNATIONAL JOURNAL OF SCIENTIFIC & TECHNOLOGY RESEARCH VOLUME 1, ISSUE 9, OCTOBER 2012 ISSN 2277-8616
4 IJSTR©2012 www.ijstr.org
PHCN – BENIN DISTRIBUTION ZONE
TRANSFORMER LOAD READING DISTRICT: IKPOBA HILL
S/NO NAME OF SUBSTATION/CAPACITY
LOAD READINGS TRANSFORMER MAXIMUM LOAD
PERCENTAGE LOADING REMARKS
R Y B N
1 Zico 300kva 005 119 174 144 278.24 52.95% *
2 Aduwawa I 500kva 425 508 307 106 659.60 64.50% *
3 Ojo 300kva 96 96 92 23 417.36 247.52%
4 Survey 300kva 337 216 198 101 417.36 68.05% *
5 Ivav 500kva 155 143 140 23 695.60 22.09%
6 N S O 500kva 245 262 352 93 69560 45.62% *
7 Igbinosun 500kva 502 248 379 195 695.60 63.45% *
8 Big Joe 500kva 432 691 382 152 695.60 79.40% *
9 Ahanor 500kva 233 149 280 102 695.60 36.61 *
10 Evbuomodu 300kva 327 319 211 126 417.36 78.51% *
11 Aduwawa II 500kva 366 228 420 204 695.60 56.93% *
12 Adima 300kva 168 221 160 065 417.36 49.04% *
13 Omogiate 300kva 138 145 053 093 417.36 34.26% *
14 Urora I 500kva 427 315 345 100 695.60 56.88% *
15 Urora II 500kva 407 516 472 072 695.60 70.01% *
16 Imosuen 500kva 241 285 170 084 695.60 37.38% *
17 Okpagha I 300kva 479 333 392 052 417.36 106.54% *
18 Okpagha II 300kva 320 247 249 052 417.36 69.32% *
19 P I S H S 200kva 008 012 000 011 278.24 3.715 *
20 Cattle market 300kva 567 489 583 091 417.36 138.17% *
21 Enoguie palace 200kva 004 133 000 146 278.24 33.90% *
22 Pipeline 300kva 252 269 154 111 417.36 62.78% *
23 Sunny my son 500kva 122 115 381 245 695.60 41.365 *
24 2 + 2 500kva 307 336 559 207 695.60 67.52% *
25 Urora III 300kva 164 202 116 066 417.36 43.77% *
26 Azogba 300kva(331.415) 001 028 022 020 417.36 5.67% *
27 Idokpa 200kva(331.415) 082 016 135 040 278.24 41.09% *
28 Ayen 300kva(331.415) 000 000 070 070 417.36 65.01% *
29 Army Signal I 300kva 273 296 128 117 417.36 45.44% *
30 Army Signal II 300kva 246 144 057 122 417.36 45.44% *
31 Hollow Block 300kva 93 78 50 63 417.36 22.68% *
32 Omoruyi 300kva 087 337 202 171 417.36 63.65% *
33 Erhamwen 300kva 027 025 024 028 417.36 10.46%
34 nabteb i 500kva 292 250 283 042 695.60 41.55% *

INTERNATIONAL JOURNAL OF SCIENTIFIC & TECHNOLOGY RESEARCH VOLUME 1, ISSUE 9, OCTOBER 2012 ISSN 2277-8616
5 IJSTR©2012 www.ijstr.org
TABLE 1: ASABA ROAD FEEDER (PUBLIC)
PHCH – BENIN DISTRIBUTION ZONE TRANSFORMER LOADS READING
S/N NAME OF SUBSTATATION /CAPACITY
LOAD READINGS TRANSFORMER MAXIMUM LOAD
PERCENTAGE LOADING REMARK
R Y B N
1 Aduwaika 300KVA 199 241 198 036 417 - 36 53.83% * 2 Owie 500kva 190 314 280 130 695.60 44.23% * 3 Palace 500kva 325 314 326 051 695.60 49.55% *
4 Agbowoii 500kva 183 155 088 070 695.60 24.20% *
5 Agbowoi 500kva 1800 238 200 048 695.60 31.91% *
6 Sonowe 300kva 321 300 168 099 417.36 63.73% * 7 Pipeline 500kva 103 011 071 085 695.6. 12.94% * 8 Philova junction300kva 103 026 090 090 417.36 24.68% * 9 D.A.E 100kva 079 096 017 071 139.12 63.02% * 10 Phiova 500kva 196 484 489 695.60 59.90% *
11 Liberty 500kva 695.60
12 Igbinidu 50kva 055 056 077 026 695.60 10.25%
13 Ebikade 500kva 422 524 346 097 695.60 66.56% * 14 Ugokpolor 500kva 267 239 288 042 695.60 37.19% *
15 Unity200kva 085 1321 166 030 278.24 43.49% *
16 Adune200kva 152 122 172 052 278.27 59.66% * 17 Iyobosa 500kva 263 215 224 076 695.60 37.28% *
18 Goldeoc 500kva 130 174 173 016 695.60 23.62% *
19 Bulkeve500kva 217 212 182 032 695.60 30.81% *
20 GT Plaza 300kva 100 065 122 045 417.60 26.52% * 21 Osasumulen 200kva 158 084 082 064 248.24 46.60% * 22 Ifosuyi 300kva 186 171 210 050 412.36 49.28% * 23 Asowata 315kva 331 224 226 060 438.23 62.45% * 24 Ihase500kva 110 101 125 018 695.60 16.96% *
25 Airhunmwunde 300kva 336 306 218 125 417.36 78.67% *
26 Evbadoloyi 300kva 225 197 260 065 417.36 59.66% *
27 Uwanai 500kva 369 620 507 130 695.60 77.92% *- 28 Ugbozigue 500kva 319 340 290 085 695.60 50.99% * 29 Ikhuenirei 500kva 135 165 131 065 695.60 23.77% * 30 Ikhueniro II 500kva 135 037 096 094 695.60 17.35% * 31 Nepacord I 500kva 037 033 034 007 695.60 5.75% *
32 Nepacord II 300kva 007 023 000 018 417.36 3.83% *
33 Iguomon I 500kva 204 129 123 051 695.60 24.30% *
34 Iguomon II 500kva 116 004 010 104 695.60 11.21% * 35 Amufi 300kva 072 062 015 043 417.36 15.33% * 36 Uyigue 500kva 296 269 362 067 695.60 47.63% * 37 Eikhame 300kva 382 162 175 199 417.36 73.32% *

INTERNATIONAL JOURNAL OF SCIENTIFIC & TECHNOLOGY RESEARCH VOLUME 1, ISSUE 9, OCTOBER 2012 ISSN 2277-8616
6 IJSTR©2012 www.ijstr.org
Table 2: Federal Housing Estate Feeder (Public)
PHCN-BENIN DISTRIBUTION-ZONE TRANSFORMER LOAD READING
S/ON. Name of substations/capacity
LOAD READINGS TRANSFORMER MAXIMUM LOAD
PERCENTAGE LOADING REMARKS
R Y B N
1 Worker’s village 300kv& 053 095 055 044. 404.36 19.73% *
2 Street 33 500kv& 463 323 254 152. 695.60 57.12% *
3 Street 24 500kv& 153 146 111 039. 695.60 21.52% *
4 Street 21 500kv& 233 216 257 044 695.60 35.94% *
5 Street 3 300kv& 221 283 165 092. 417.36 60.79% *
6 500kv& 298 275 128 127. 695.60 39.68% *
7 300kv& 432 524 271 157. 417.36 110.54% *
8 500kva 777 700 312 338. 695.60 101.93% *
9 Street 49 500kva 283 222 338 053. 695.60 46.29% *
10 Integrated 200kva 186 163 055 109. 278.24 61.46% *
11 Chorale -
12 Uteh I -
13 Uteh 11 -
14 Barrack 11 500kva 501 389 399 105. 695.60 66.80% *
15 Barrack 1 300kva 192 250 50 178. 417.36 53.51% *
16 Palace 315kv a 104 095 103 012. 438.23 23.89% *
17 St Jude 300KVA 392 200 262 077. 417.36 70.36% *
18 Street 2 500kva 417 345 314 039. 695.60 53.43% *
19 Golden 300kva 211 252 279 074. 417.36 65.17% *
20 Ogieoba 300kva 223 171 201 047 417.36 51.27% *
INTERNATIONAL JOURNAL OF SCIENTIFIC & TECHNOLOGY RESEARCH VOLUME 1, ISSUE 9, OCTOBER 2012 ISSN 2277-8616
7 IJSTR©2012 www.ijstr.org
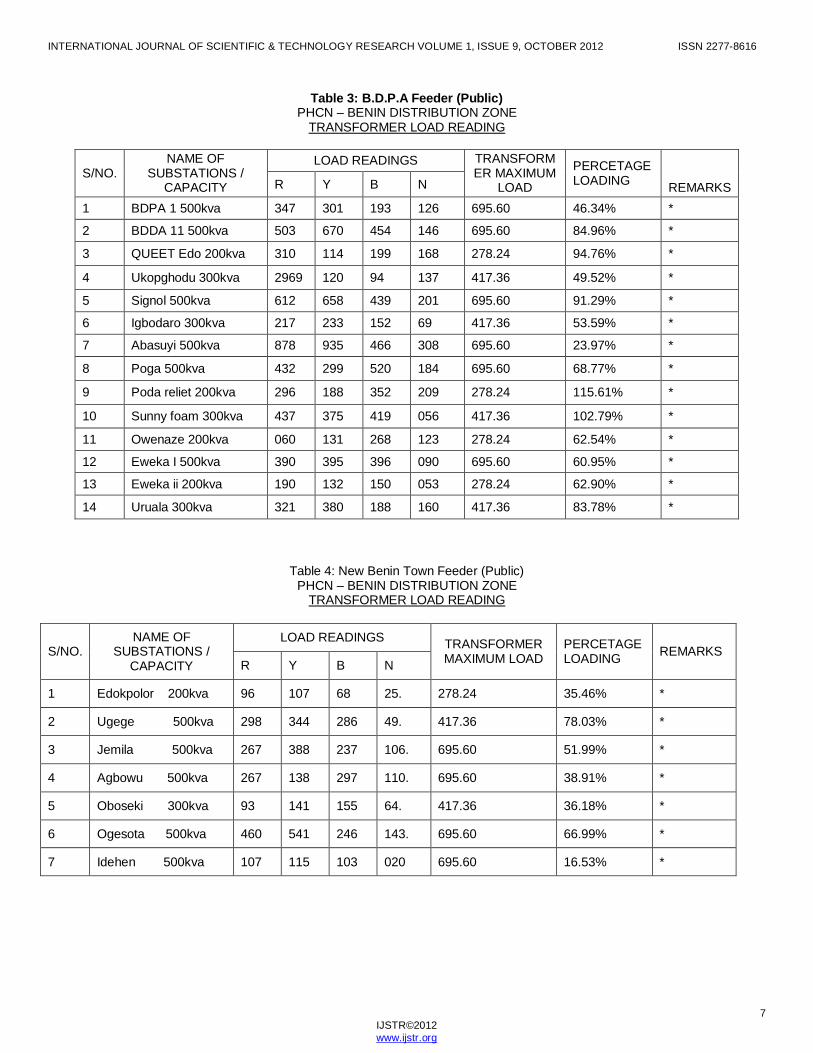
Table 3: B.D.P.A Feeder (Public)
PHCN – BENIN DISTRIBUTION ZONE TRANSFORMER LOAD READING
S/NO. NAME OF
SUBSTATIONS / CAPACITY
LOAD READINGS TRANSFORMER MAXIMUM
LOAD
PERCETAGE LOADING
REMARKS R Y B N
1 BDPA 1 500kva 347 301 193 126 695.60 46.34% *
2 BDDA 11 500kva 503 670 454 146 695.60 84.96% *
3 QUEET Edo 200kva 310 114 199 168 278.24 94.76% *
4 Ukopghodu 300kva 2969 120 94 137 417.36 49.52% *
5 Signol 500kva 612 658 439 201 695.60 91.29% *
6 Igbodaro 300kva 217 233 152 69 417.36 53.59% *
7 Abasuyi 500kva 878 935 466 308 695.60 23.97% *
8 Poga 500kva 432 299 520 184 695.60 68.77% *
9 Poda reliet 200kva 296 188 352 209 278.24 115.61% *
10 Sunny foam 300kva 437 375 419 056 417.36 102.79% *
11 Owenaze 200kva 060 131 268 123 278.24 62.54% *
12 Eweka I 500kva 390 395 396 090 695.60 60.95% *
13 Eweka ii 200kva 190 132 150 053 278.24 62.90% *
14 Uruala 300kva 321 380 188 160 417.36 83.78% *
Table 4: New Benin Town Feeder (Public) PHCN – BENIN DISTRIBUTION ZONE
TRANSFORMER LOAD READING
S/NO. NAME OF
SUBSTATIONS / CAPACITY
LOAD READINGS TRANSFORMER MAXIMUM LOAD
PERCETAGE LOADING REMARKS
R Y B N
1 Edokpolor 200kva 96 107 68 25. 278.24 35.46% *
2 Ugege 500kva 298 344 286 49. 417.36 78.03% *
3 Jemila 500kva 267 388 237 106. 695.60 51.99% *
4 Agbowu 500kva 267 138 297 110. 695.60 38.91% *
5 Oboseki 300kva 93 141 155 64. 417.36 36.18% *
6 Ogesota 500kva 460 541 246 143. 695.60 66.99% *
7 Idehen 500kva 107 115 103 020 695.60 16.53% *

INTERNATIONAL JOURNAL OF SCIENTIFIC & TECHNOLOGY RESEARCH VOLUME 1, ISSUE 9, OCTOBER 2012 ISSN 2277-8616
8 IJSTR©2012 www.ijstr.org
Discussions From the results shown it is very evident that the company in charge of power distribution in Ikpoba-Hill which is the PHCN and other available companies would be able to monitor the status of the facilities on the ground. Similarly they will be able to account for the total length of cable in each of the feeders. Cost of replacing can be properly calculated for. There will be proper prioritization of facility replacement based in available information. Up to date information about the facilities will be known. Electricity call centres will be able to do proper documentation of problems in the feeders and as such provide solutions when needed. Since cables run across the road, they can also serve as street guide in the absence of a street map. 4.0 CONCLUSION From the simulation carried it has been found that complete information system for the distribution of electrical energy, can be used to improve planning, maintenance and management standards. This on the other hand can improve on the distribution of the insufficient energy generated. From observed results it shows that a low loss reduction system has been developed for the PHCN. The use of the GIS and the GPS techniques are very important to development. This new approach to Nigeria will provide accountability and erase sharp practices as everything will be accounted for. If a GIS department is established in all zones or district offices of the PHCN then the country will be able to manage all she is generating. REFERENCES
[1] Coppock, J. T., and D. W. Rhind, (1991). The history of GIS. Geographical Information Systems: principles and applications. Ed. David J. Maguire, Michael F. Good child and David W. Rhind. Essex: Longman Scientific & Technical, 1991. 1: 21-43."The history of GIS.". http://scholar.google.com/scholar?cluster=13820827634229141183&hl=en&as_sdt=10000000000000. Retrieved 2010-09-17.
[2] Cowen 1988 "GIS VERSUS CAD VERSUS DBMS: WHAT ARE THE DIFFERENCES ?" PHOTOGRAMMETRIC ENGINEERING & REMOTE SENSING Vol. 54, No.11, November 1988, pp. 1551-1555. http://funk.on.br/esantos/doutorado/GEO/igce/DBMS.pdf last retrieved 9/17/2010.
[3] ESRI (2001): Electricity Distribution ArcGIS Data Model
[4] Fitzgerald, Joseph H.. "Map Printing Methods".
Archived from the original on 2007-06-04. http://web.archive.org/web/20070604194024/http://www.broward.org/library/bienes/lii14009.htm. Retrieved 2007-06-09.
[5] Fu, P., and J. Sun. 2010. Web GIS: Principles and Applications. ESRI Press. Redlands, CA. ISBN 158948245X.
[6] Gao, Shan. Paynter, John. & David Sundaram,
(2004) "Flexible Support for Spatial Decision-Making" Proc. of the 37th Hawaii International Conference on System Sciences 5-8 pp. 10
[7] "GIS Hall of Fame - Roger Tomlinson". URISA.
http://www.urisa.org/node/395. Retrieved 2007-06-09.
[8] NEPA (1998): Fact of the matter, NEPA checking
the odds, Pp1-7, Public Relation
[9] "Open-Source GIS History OSGeo Wiki Editors". http://wiki.osgeo.org/wiki/Open_Source_GIS_History. Retrieved 2009-03-21.
[10] Wikipedia (2008). The Free Encyclopaedia, 2008.