Embed Size (px)
Citation preview
Simplified Hyperspectral Imaging for Improved Geologic Mapping of Mine Slopes
Edward L. McHugh*, Jami M. Girard*,
* National Institute for Occupational Safety and Health, Spokane, WA
and Louis J. Denes**
** Carnegie Mellon Research Institute, Pittsburgh, PA
Abstract A prototype portable hyperspectral imager that operates in the visible and near-infrared ranges of the electromagnetic spectrum was field tested at an open-pit mine. The tests were sponsored by the Spokane Research Laboratory, National Institute for Occupational Safety and Health, as part of an investigation of remote sensing technologies for use in detecting and monitoring conditions in surface mines that could lead to catastrophic slope failure. The spectro-polarimetric imager, built at the Carnegie Mellon Research Institute, employs an acousto-optical tunable filter (AOTF) to control wavelength, a phase retarder to measure polarization signatures, and a digital camera and computer to capture data. The spectral range of the instrument is 450 to 1000 nm at 10-nm intervals. High-resolution hyperspectral images of highwalls, outcrops, hand samples, and drill core were collected in the field. Spectra from the images closely matched those of specific minerals present and were used to classify the images. The field tests were designed to examine the feasibility of using spectral imaging to assist in compiling objective geologic maps of mine highwalls and other hazardous slopes. Results illustrate the capability of the method to discriminate materials within the image, validating the concept of simplified spectral imaging. A contributing factor in many slope failures is the presence and distribution of mechanically incompetent, clay-rich altered rock in slope faces. Spectral features of clays and other minerals are more distinctive in the short-wave and mid-infrared part of the spectrum; the capabilities of the instrument need to be extended into this range to apply the AOTF-based technology to common geologic materials. A field-portable hyperspectral imager could find broad application in remotely identifying diverse materials from solids and coatings to gases.
Introduction As part of its work to improve the safety of miners, the Spokane Research Laboratory (SRL) of the National Institute for Occupational Safety and Health (NIOSH) is engaged in research to improve means of detecting conditions in open-pit mines that could lead to catastrophic slope failure. Since 1995, 33 miners have died in slope failure accidents at surface mines in the United States. A contributing factor in many of these failures is the presence and distribution of mechanically incompetent, clay-rich, altered rock in pit highwalls. The use of imaging spectrometers may assist in recognizing these weakened, altered rocks. In this paper, the results of testing one of these instruments by SRL and its potential for detecting imminent slope failures are described. Most alteration minerals have diagnostic spectral absorption features in the short wave and mid-infrared light they reflect that allow their identification. Field instruments are commercially available that can analyze light reflected from a single point within a scene; an imaging system can record spectral reflectance data for an entire scene, adding a spatial dimension to the data. High-resolution spectral imagery can assist in compiling objective geologic maps of mine highwalls and other hazardous slopes remotely. Spectral Imaging Every material on or off the earth’s surface reflects light in a characteristic pattern; the manner in which light of different wavelengths is reflected or absorbed from each material is known as its reflectance spectrum. By filtering reflected light to specific wavelengths of the electromagnetic spectrum (or color for the visible part of the spectrum) images can be created that enhance our ability to differentiate materials. Multispectral imaging makes use of a few broad wavelength bands within and outside the visible part of the spectrum Hyperspectral imaging refers to obtaining reflectance spectra for the region being imaged over a large number of discrete, contiguous spectral bands.
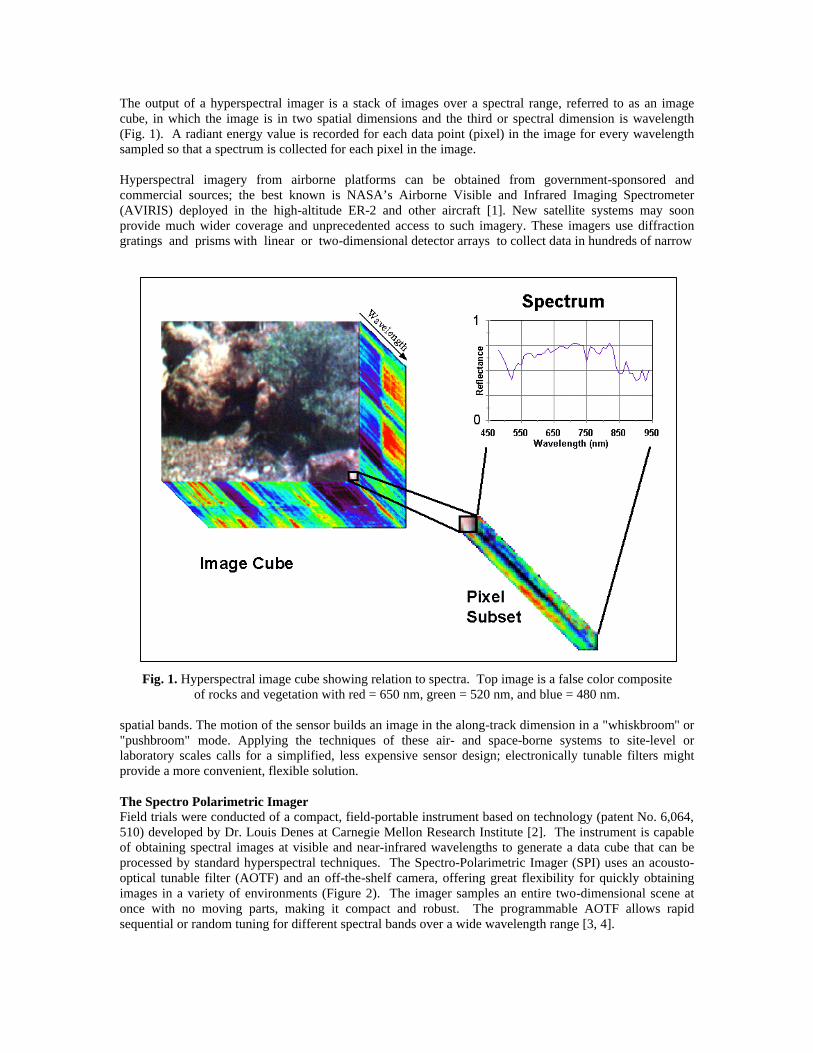
The output of a hyperspectral imager is a stack of images over a spectral range, referred to as an image cube, in which the image is in two spatial dimensions and the third or spectral dimension is wavelength (Fig. 1).
Fig. 1. Hyperspectral image cube showing relation to spectra. Top image is a false color composite
of rocks and vegetation with red = 650 nm, green = 520 nm, and blue = 480 nm.
A radiant energy value is recorded for each data point (pixel) in the image for every wavelength sampled so that a spectrum is collected for each pixel in the image.
Hyperspectral imagery from airborne platforms can be obtained from government-sponsored and commercial sources; the best known is NASA’s Airborne Visible and Infrared Imaging Spectrometer (AVIRIS) deployed in the high-altitude ER-2 and other aircraft [1]. New satellite systems may soon provide much wider coverage and unprecedented access to such imagery. These imagers use diffraction gratings and prisms with linear or two-dimensional detector arrays to collect data in hundreds of narrow
spatial bands. The motion of the sensor builds an image in the along-track dimension in a "whiskbroom" or "pushbroom" mode. Applying the techniques of these air- and space-borne systems to site-level or laboratory scales calls for a simplified, less expensive sensor design; electronically tunable filters might provide a more convenient, flexible solution. The Spectro Polarimetric Imager Field trials were conducted of a compact, field-portable instrument based on technology (patent No. 6,064, 510) developed by Dr. Louis Denes at Carnegie Mellon Research Institute [2]. The instrument is capable of obtaining spectral images at visible and near-infrared wavelengths to generate a data cube that can be processed by standard hyperspectral techniques. The Spectro-Polarimetric Imager (SPI) uses an acoustooptical tunable filter (AOTF) and an off-the-shelf camera, offering great flexibility for quickly obtaining images in a variety of environments (Figure 2). The imager samples an entire two-dimensional scene at once with no moving parts, making it compact and robust. The programmable AOTF allows rapid sequential or random tuning for different spectral bands over a wide wavelength range [3, 4].
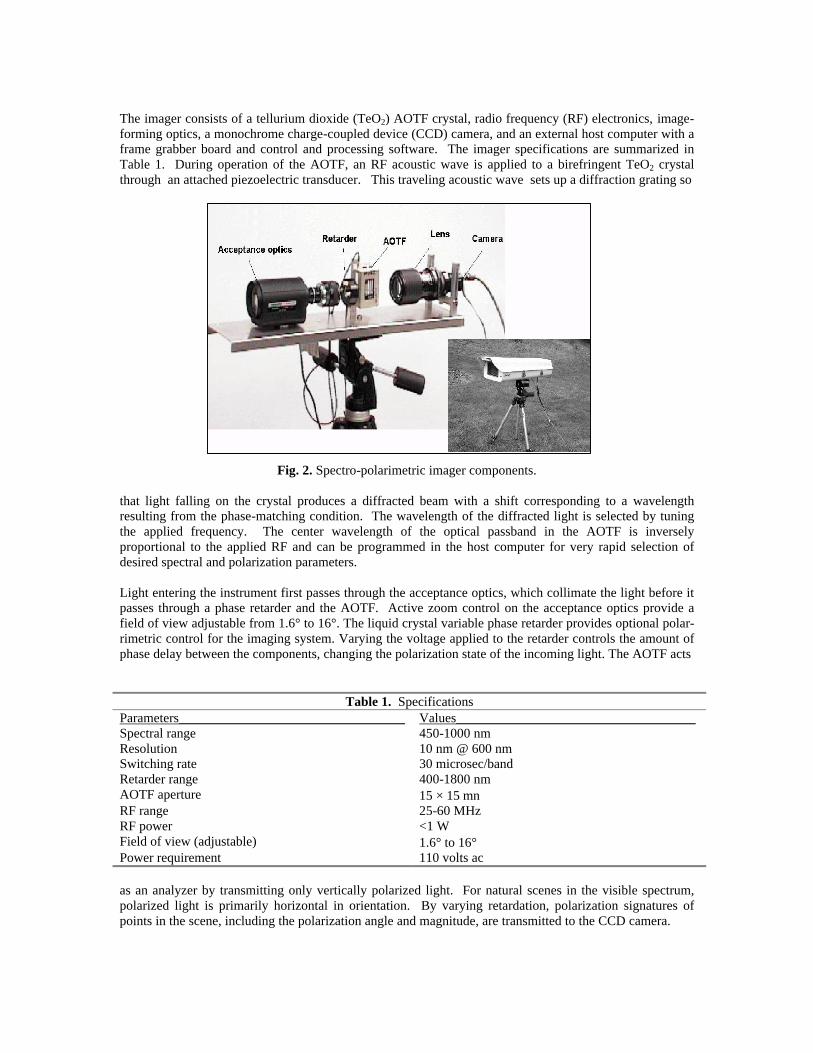
Fig. 2. Spectro-polarimetric imager components.
The imager consists of a tellurium dioxide (TeO2) AOTF crystal, radio frequency (RF) electronics, image-forming optics, a monochrome charge-coupled device (CCD) camera, and an external host computer with a frame grabber board and control and processing software. The imager specifications are summarized in Table 1.
Table 1. Specifications
Parameters__________________________________ Values____________________________________ Spectral range 450-1000 nm
Resolution 10 nm @ 600 nm Switching rate 30 microsec/band
Retarder range 400-1800 nm AOTF aperture 15 · 15 mn
RF range 25-60 MHz RF power <1 W
Field of view (adjustable) 1.6° to 16° Power requirement 110 volts ac
During operation of the AOTF, an RF acoustic wave is applied to a birefringent TeO2 crystal through an attached piezoelectric transducer. This traveling acoustic wave sets up a diffraction grating so
that light falling on the crystal produces a diffracted beam with a shift corresponding to a wavelength resulting from the phase-matching condition. The wavelength of the diffracted light is selected by tuning the applied frequency. The center wavelength of the optical passband in the AOTF is inversely proportional to the applied RF and can be programmed in the host computer for very rapid selection of desired spectral and polarization parameters. Light entering the instrument first passes through the acceptance optics, which collimate the light before it passes through a phase retarder and the AOTF. Active zoom control on the acceptance optics provide a field of view adjustable from 1.6° to 16°. The liquid crystal variable phase retarder provides optional polar rimetric control for the imaging system. Varying the voltage applied to the retarder controls the amount of phase delay between the components, changing the polarization state of the incoming light. The AOTF acts
as an analyzer by transmitting only vertically polarized light. For natural scenes in the visible spectrum, polarized light is primarily horizontal in orientation. By varying retardation, polarization signatures of points in the scene, including the polarization angle and magnitude, are transmitted to the CCD camera.
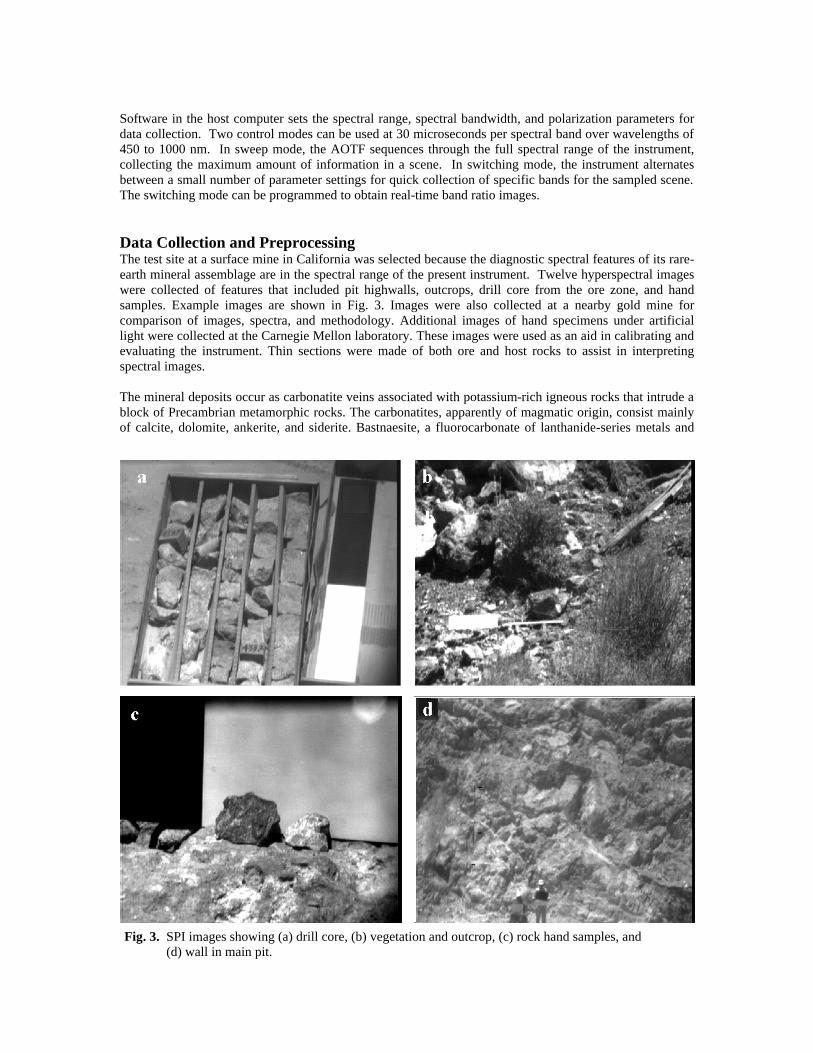
Software in the host computer sets the spectral range, spectral bandwidth, and polarization parameters for data collection. Two control modes can be used at 30 microseconds per spectral band over wavelengths of 450 to 1000 nm. In sweep mode, the AOTF sequences through the full spectral range of the instrument, collecting the maximum amount of information in a scene. In switching mode, the instrument alternates between a small number of parameter settings for quick collection of specific bands for the sampled scene. The switching mode can be programmed to obtain real-time band ratio images. Data Collection and Preprocessing The test site at a surface mine in California was selected because the diagnostic spectral features of its rare-earth mineral assemblage are in the spectral range of the present instrument. Twelve hyperspectral images were collected of features that included pit highwalls, outcrops, drill core from the ore zone, and hand samples. Example images are shown in Fig. 3.
Parameter Value Spectral range 450 1000 nm Resolution 10 nm @ 600 nm Switching rate 30 microsec/band Retarder range 400 1800 nm AOTF aperture 15H15 mm RF range 25 60 MHz RF power <1 W Field of view (adjustable) 1.6E to 16E Power requirement 110 volts ac
-
-
-
Fig. 3. SPI images showing (a) drill core, (b) vegetation and outcrop, (c) rock hand samples, and (d) wall in main pit.
Images were also collected at a nearby gold mine for comparison of images, spectra, and methodology. Additional images of hand specimens under artificial light were collected at the Carnegie Mellon laboratory. These images were used as an aid in calibrating and evaluating the instrument. Thin sections were made of both ore and host rocks to assist in interpreting spectral images. The mineral deposits occur as carbonatite veins associated with potassium-rich igneous rocks that intrude a block of Precambrian metamorphic rocks. The carbonatites, apparently of magmatic origin, consist mainly of calcite, dolomite, ankerite, and siderite. Bastnaesite, a fluorocarbonate of lanthanide-series metals and
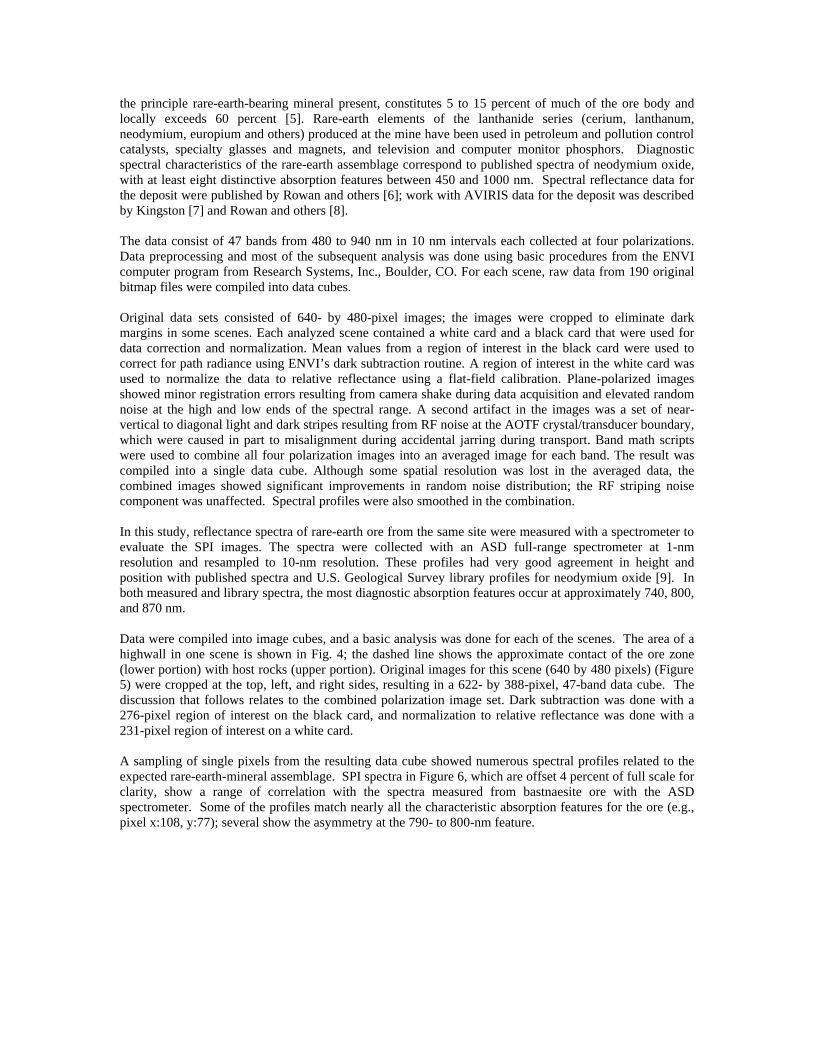
the principle rare-earth-bearing mineral present, constitutes 5 to 15 percent of much of the ore body and locally exceeds 60 percent [5]. Rare-earth elements of the lanthanide series (cerium, lanthanum, neodymium, europium and others) produced at the mine have been used in petroleum and pollution control catalysts, specialty glasses and magnets, and television and computer monitor phosphors. Diagnostic spectral characteristics of the rare-earth assemblage correspond to published spectra of neodymium oxide, with at least eight distinctive absorption features between 450 and 1000 nm. Spectral reflectance data for the deposit were published by Rowan and others [6]; work with AVIRIS data for the deposit was described by Kingston [7] and Rowan and others [8]. The data consist of 47 bands from 480 to 940 nm in 10 nm intervals each collected at four polarizations. Data preprocessing and most of the subsequent analysis was done using basic procedures from the ENVI computer program from Research Systems, Inc., Boulder, CO. For each scene, raw data from 190 original bitmap files were compiled into data cubes. Original data sets consisted of 640- by 480-pixel images; the images were cropped to eliminate dark margins in some scenes. Each analyzed scene contained a white card and a black card that were used for data correction and normalization. Mean values from a region of interest in the black card were used to correct for path radiance using ENVI’s dark subtraction routine. A region of interest in the white card was used to normalize the data to relative reflectance using a flat-field calibration. Plane-polarized images showed minor registration errors resulting from camera shake during data acquisition and elevated random noise at the high and low ends of the spectral range. A second artifact in the images was a set of near-vertical to diagonal light and dark stripes resulting from RF noise at the AOTF crystal/transducer boundary, which were caused in part to misalignment during accidental jarring during transport. Band math scripts were used to combine all four polarization images into an averaged image for each band. The result was compiled into a single data cube. Although some spatial resolution was lost in the averaged data, the combined images showed significant improvements in random noise distribution; the RF striping noise component was unaffected. Spectral profiles were also smoothed in the combination. In this study, reflectance spectra of rare-earth ore from the same site were measured with a spectrometer to evaluate the SPI images. The spectra were collected with an ASD full-range spectrometer at 1-nm resolution and resampled to 10-nm resolution. These profiles had very good agreement in height and position with published spectra and U.S. Geological Survey library profiles for neodymium oxide [9]. In both measured and library spectra, the most diagnostic absorption features occur at approximately 740, 800, and 870 nm. Data were compiled into image cubes, and a basic analysis was done for each of the scenes. The area of a highwall in one scene is shown in Fig. 4; the dashed line shows the approximate contact of the ore zone (lower portion) with host rocks (upper portion). Original images for this scene (640 by 480 pixels) (Figure 5) were cropped at the top, left, and right sides, resulting in a 622- by 388-pixel, 47-band data cube. The discussion that follows relates to the combined polarization image set. Dark subtraction was done with a 276-pixel region of interest on the black card, and normalization to relative reflectance was done with a 231-pixel region of interest on a white card. A sampling of single pixels from the resulting data cube showed numerous spectral profiles related to the expected rare-earth-mineral assemblage. SPI spectra in Figure 6, which are offset 4 percent of full scale for clarity, show a range of correlation with the spectra measured from bastnaesite ore with the ASD spectrometer. Some of the profiles match nearly all the characteristic absorption features for the ore (e.g., pixel x:108, y:77); several show the asymmetry at the 790- to 800-nm feature.
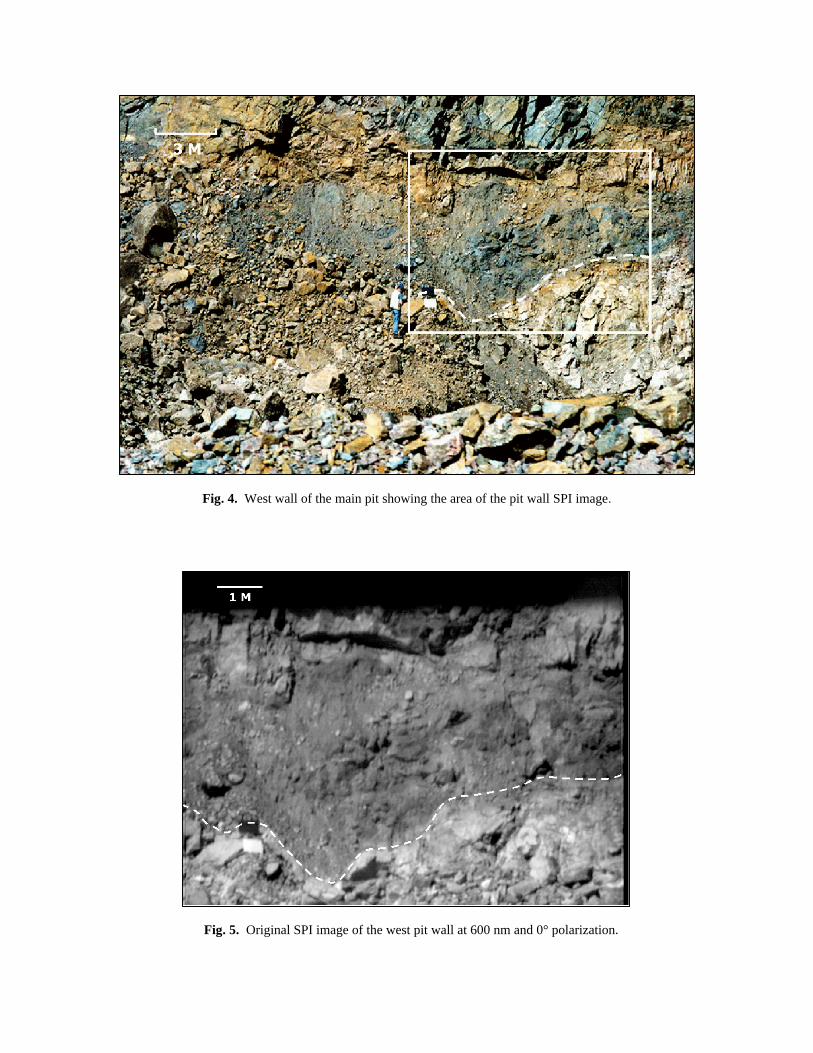
Fig. 4. West wall of the main pit showing the area of the pit wall SPI image.
Fig. 5. Original SPI image of the west pit wall at 600 nm and 0° polarization.
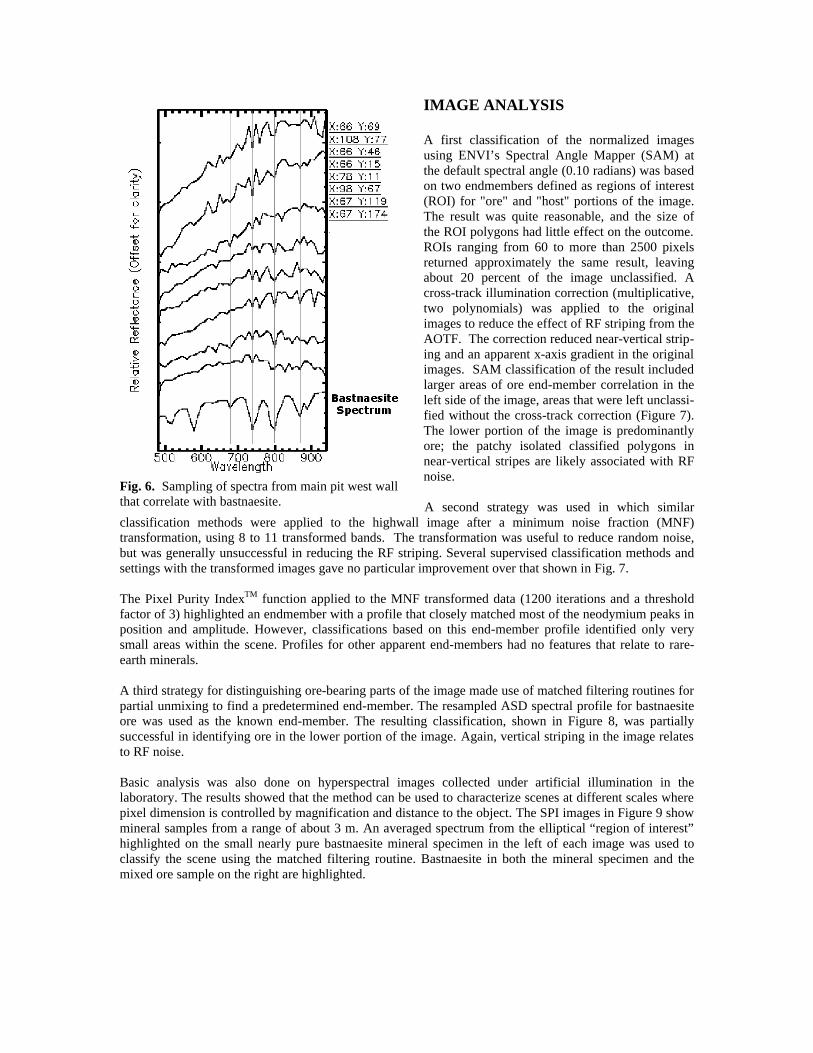
Fig. 6. Sampling of spectra from main pit west wall that correlate with bastnaesite.
IMAGE ANALYSIS
A first classification of the normalized images using ENVI’s Spectral Angle Mapper (SAM) at the default spectral angle (0.10 radians) was based on two endmembers defined as regions of interest (ROI) for "ore" and "host" portions of the image. The result was quite reasonable, and the size of the ROI polygons had little effect on the outcome. ROIs ranging from 60 to more than 2500 pixels returned approximately the same result, leaving about 20 percent of the image unclassified. A cross-track illumination correction (multiplicative, two polynomials) was applied to the original images to reduce the effect of RF striping from the AOTF. The correction reduced near-vertical striping and an apparent x-axis gradient in the original images. SAM classification of the result included larger areas of ore end-member correlation in the left side of the image, areas that were left unclassified without the cross-track correction (Figure 7). The lower portion of the image is predominantly ore; the patchy isolated classified polygons in near-vertical stripes are likely associated with RF noise. A second strategy was used in which similar
classification methods were applied to the highwall image after a minimum noise fraction (MNF) transformation, using 8 to 11 transformed bands. The transformation was useful to reduce random noise, but was generally unsuccessful in reducing the RF striping. Several supervised classification methods and settings with the transformed images gave no particular improvement over that shown in Fig. 7. The Pixel Purity IndexTM function applied to the MNF transformed data (1200 iterations and a threshold factor of 3) highlighted an endmember with a profile that closely matched most of the neodymium peaks in position and amplitude. However, classifications based on this end-member profile identified only very small areas within the scene. Profiles for other apparent end-members had no features that relate to rare-earth minerals. A third strategy for distinguishing ore-bearing parts of the image made use of matched filtering routines for partial unmixing to find a predetermined end-member. The resampled ASD spectral profile for bastnaesite ore was used as the known end-member. The resulting classification, shown in Figure 8, was partially successful in identifying ore in the lower portion of the image. Again, vertical striping in the image relates to RF noise. Basic analysis was also done on hyperspectral images collected under artificial illumination in the laboratory. The results showed that the method can be used to characterize scenes at different scales where pixel dimension is controlled by magnification and distance to the object. The SPI images in Figure 9 show mineral samples from a range of about 3 m. An averaged spectrum from the elliptical “region of interest” highlighted on the small nearly pure bastnaesite mineral specimen in the left of each image was used to classify the scene using the matched filtering routine. Bastnaesite in both the mineral specimen and the mixed ore sample on the right are highlighted.
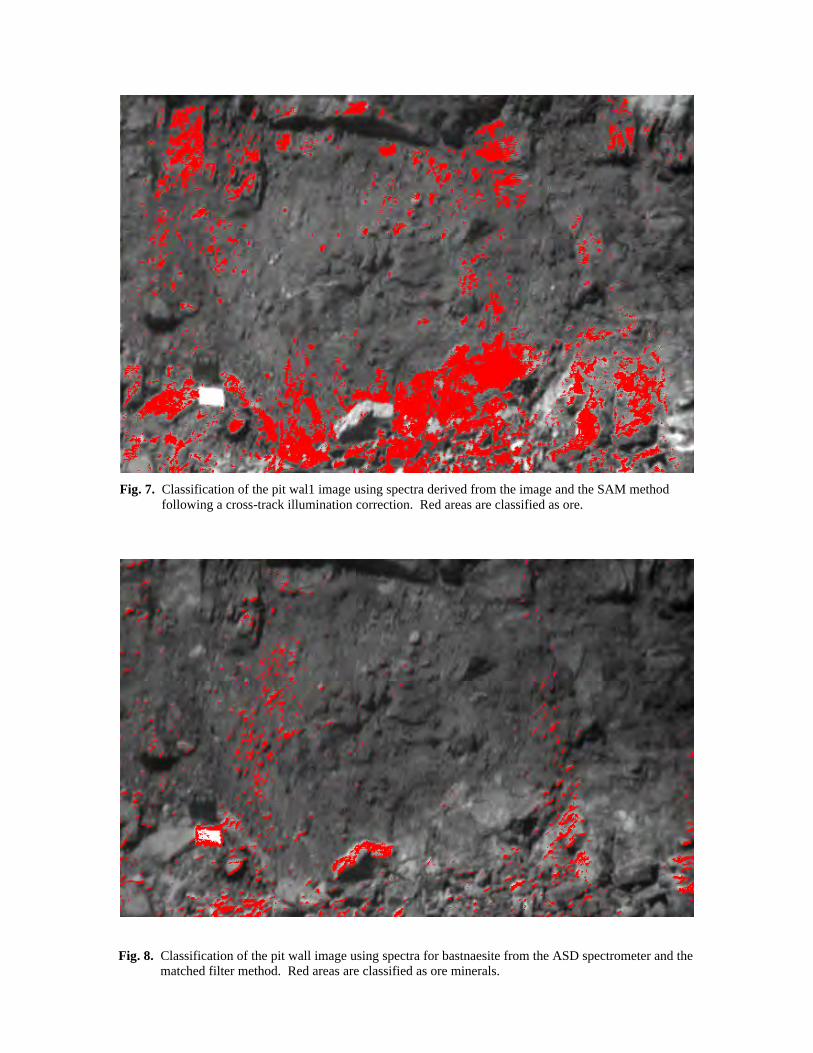
Fig. 7. Classification of the pit wal1 image using spectra derived from the image and the SAM method
following a cross-track illumination correction. Red areas are classified as ore.
Fig. 8. Classification of the pit wall image using spectra for bastnaesite from the ASD spectrometer and the
matched filter method. Red areas are classified as ore minerals.
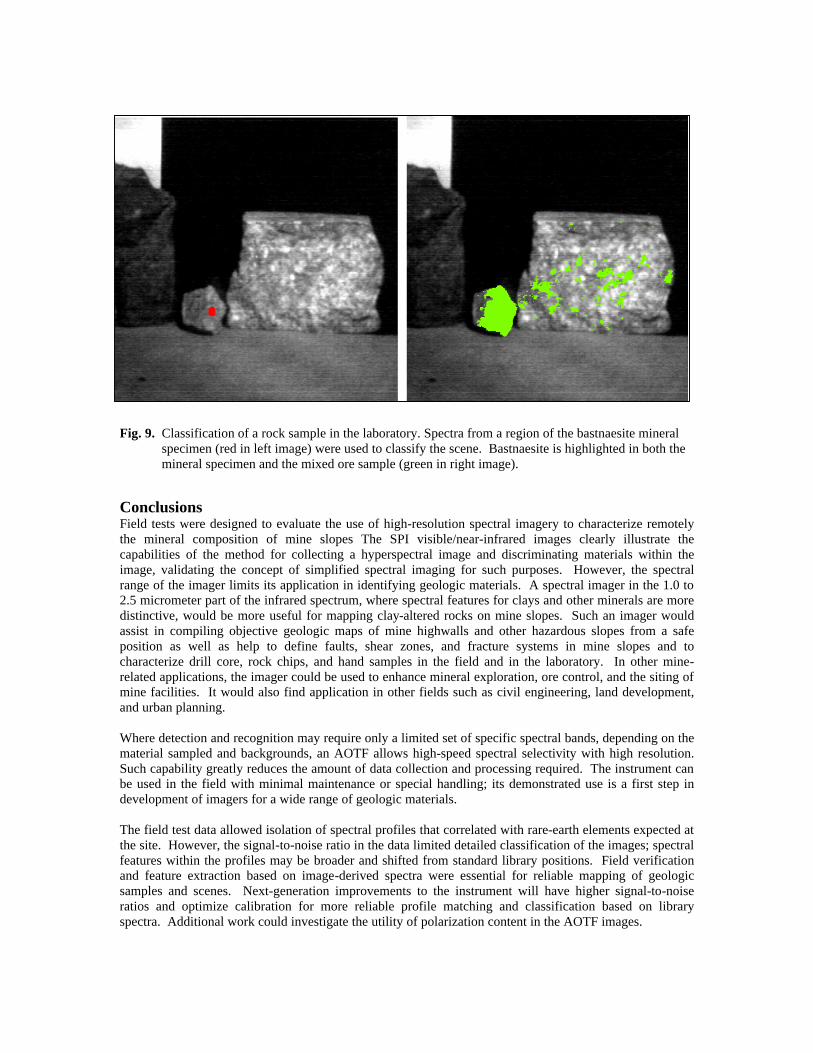
Fig. 9. Classification of a rock sample in the laboratory. Spectra from a region of the bastnaesite mineral specimen (red in left image) were used to classify the scene. Bastnaesite is highlighted in both the mineral specimen and the mixed ore sample (green in right image).
Conclusions Field tests were designed to evaluate the use of high-resolution spectral imagery to characterize remotely the mineral composition of mine slopes The SPI visible/near-infrared images clearly illustrate the capabilities of the method for collecting a hyperspectral image and discriminating materials within the image, validating the concept of simplified spectral imaging for such purposes. However, the spectral range of the imager limits its application in identifying geologic materials. A spectral imager in the 1.0 to 2.5 micrometer part of the infrared spectrum, where spectral features for clays and other minerals are more distinctive, would be more useful for mapping clay-altered rocks on mine slopes. Such an imager would assist in compiling objective geologic maps of mine highwalls and other hazardous slopes from a safe position as well as help to define faults, shear zones, and fracture systems in mine slopes and to characterize drill core, rock chips, and hand samples in the field and in the laboratory. In other mine-related applications, the imager could be used to enhance mineral exploration, ore control, and the siting of mine facilities. It would also find application in other fields such as civil engineering, land development, and urban planning. Where detection and recognition may require only a limited set of specific spectral bands, depending on the material sampled and backgrounds, an AOTF allows high-speed spectral selectivity with high resolution. Such capability greatly reduces the amount of data collection and processing required. The instrument can be used in the field with minimal maintenance or special handling; its demonstrated use is a first step in development of imagers for a wide range of geologic materials. The field test data allowed isolation of spectral profiles that correlated with rare-earth elements expected at the site. However, the signal-to-noise ratio in the data limited detailed classification of the images; spectral features within the profiles may be broader and shifted from standard library positions. Field verification and feature extraction based on image-derived spectra were essential for reliable mapping of geologic samples and scenes. Next-generation improvements to the instrument will have higher signal-to-noise ratios and optimize calibration for more reliable profile matching and classification based on library spectra. Additional work could investigate the utility of polarization content in the AOTF images.

In summary, a portable, ground-based spectral imager in the 1-2.5-micrometer range could provide—
• Objective information to assist in the inherently subjective process of geologic identification and mapping,
• An alternative to expensive airborne and satellite spectral imagery that provide few options in
scale and require considerable lead times,
• More capability than the nonimaging (point-by-point) spectrometers currently being used to augment mapping.
References 1. W.M. Porter H.T. Enmark, 1987. A system overview of the airborne visible/infrared imaging
spectrometer. JPL Publication 87-38, pp. 3–12. 2. L.J. Denes, M. Gottlieb, B. Kaminsky, 1998. Acousto-optic tunable filters in imaging applications.
Optic Eng. 37:1262–1267. 3. N. Gupta, R. Dahmani, M. Gottlieb, L. Denes, B. Kaminsky, P. Metes, 1999. Hyperspectral imaging
using acousto-optical tunable filters. In Proceedings of SPIE, v. 3718, 10. 4. C. Sabine, L.J. Denes, M. Gottlieb, B. Kaminsky, P. Metes, R.T. Mayerle, J.M. Girard, 1999. A portable
spectro-polarimetric imager: Potential mine safety and geologic applications. in Proc. 13th International Conference on Applied Geologic Remote Sensing, Vancouver, B.C., 1, I-190-194.
5. J.C. Olson, D.R. Shawe, L.C. Pray, W.N. Sharp, 1954. Rare-earth mineral deposits of the Mountain Pass District, San Bernardino County, California. U.S. Geological Survey Prof. Paper 261, 75.
6. L.C. Rowan, M.J. Kingston, J.K. Crowley, 1986. Spectral reflectance of carbonatites and related alkalic igneous rocks: Selected samples from four North American localities. Economic Geology 81:857-871.
7. M.J. Kingston, 1993. Evaluation of AVIRIS data for mineral mapping at Mountain Pass, the East Mohave Desert, California. In Proceedings of the Ninth Thematic Conference on Geologic Remote Sensing, Pasadena, CA, 181-182.
8. L.C. Rowan, R.N. Clark, R.O. Green, 1996. Mapping minerals in the Mountain Pass, California, area using the airborne visible/infrared imaging spectrometer (AVIRIS). in Proc. 11th Thematic Conference and Workshops on Applied Geologic Remote Sensing , Las Vegas, NV, 175-176.
9. R.N. Clark, G.A. Swayze, A.J. Gallagher, T.V.V. King, W.M. Calvin, 1993. Digital spectral library: version 1: 0.2 to 3.0 microns. U.S. Geological Survey Open File Report 93-592, 1340. http://speclab.cr.usgs.gov.