Embed Size (px)
Citation preview
•23
NATIONAL A E R O N A U T I C S A N D SPACE A D M I N I S T R A T I O N
Technical Memorandum 33-697
Revision 1
Simplified Cut Core Inductor Design
(NASA-CR-1U9241) SIMPLIFIER CUT CORE N77-12292INDUCTOR DESIGN (Jet Propulsion Lab.) 83 pHC A05/MF A01 CSCL 09A
Unclas' G3/33 55817
REPRODUCED BY
NATIONAL TECHNICALINFORMATION SERVICE
U. S. DEPARTMENT OF COMMERC1
SPRINGFIELD. VA. 22161
J E T P R O P U L S I O N L A B O R A T 0.
CALIFORNIA INSTITUTE OF TECHNOLOGY;?
PASADENA, CAL IFORNIA 77":'
November 1, 1976 ,,
https://ntrs.nasa.gov/search.jsp?R=19770005349 2018-07-04T21:37:13+00:00Z
N A T I O N A L A E R O N A U T I C S A N D S P A C E A D M I N I S T R A T I O N
Technical Memorandum 33-697
Revision 1
Simplified Cut Core Inductor Design
Colonel W. T. McLyman
J E T P R O P U L S I O N L A B O R A T O R Y
C A L I F O R N I A INSTITUTE OF T E C H N O L O G Y
P A S A D E N A , C A L I F O R N I A
November 1, 1976
33-697, Rev. 1
PREFACE
The work described in this report was performed by the Guidance
and Control Division of the Jet Propulsion Laboratory.
111
33-697, Rev. 1
ACKNOW LEDGMENT
The author wishes to express his thanks to Dr. G. W. Wester
for support in gathering data and his technical aid.
IV
33-697, Rev. 1
CONTENTS
I. Introduction 1
II. Fundamental Consideration 5
III. Design Example 11
References 72
APPENDIXES
A. Linear Reactor Design With an Iron Core 17
B. Inductor Current Density 21
C. Relationship of A to Control of Temperature Rise . . . . 23
D. Inductor Weight 30
E. Inductor Volume 33
F. Window Utilization Factor 35
G. C-Core Characteristics 41
TABLES
1. Magnetic material 6
Fl. Wire table 37
Gl. C-core characteristics 41
G2. "C" Core AL-2 44
G3. "C" Core AL-3 . 45
G4. "C" Core AL-5 46
G5. "C" Core AL-6 47
G6. "C" Core AL-124 48
G7. "C" Core AL-8 . . 49
G8. "C" Core AL-9 50
G9. "C" Core AL-10 51
G10. "C" Core AL-12 52
Gil. "C" Core AL-135 53
33-697, Rev. 1
G12. "C" Core AL.-78 54
G13. "C" Core AL-18 55
G14. "C" Core AL-15 56
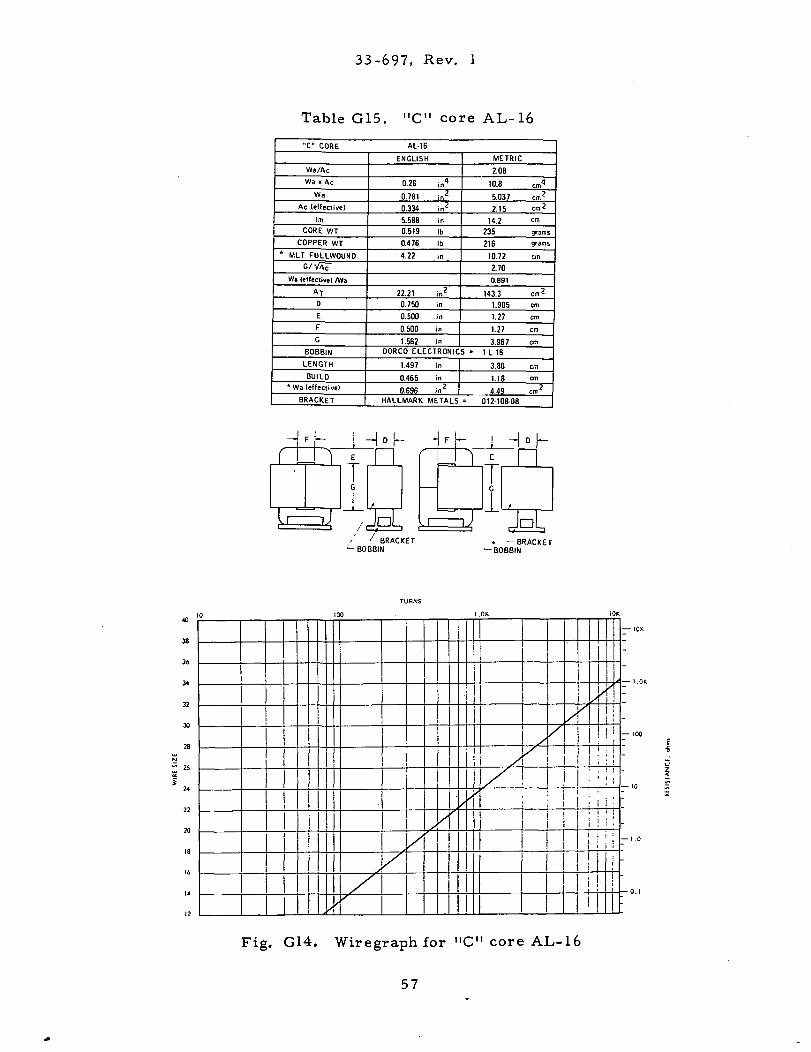
G15. "C" Core AL-16 57
G16. "C" Core AL-17 58
G17. "C" CoreAL-19 59
G18. "C" Core AL-20 60
G19. "C" Core AL-22 61
G20. "C" Core AL-23 62
G21. "C" Core AL-24 63
G22. Conversion factors 65
G23. Calculated and measured inductance using variousgap lengths 68
FIGURES
1. Inductance vs dc bias 2
2. Outline form C-core inductor 4
3. Flux density versus I, + AI 6
4. Increase of reactor inductance with flux fringingat the gap 8
5. Effective permeability of cut core vs permeabilityof the material 9
6. Minimum design permeability 10
Bl. Current density vs area product A for a 25 ° Cand 50°C rise P. 21
Cl. Temperature rise vs surface dissipation 25
C2. Surface area vs area product A 27
C3. Surface area of a C-core 28
C4. Surface area vs total watt loss for a 25° Cand 50° C rise 29
vi
33-697, Rev. 1
Dl. Inductor total W vs area product A 30
El. C-core volume 33
EZ. Inductor volume vs area product A 34P
Fl. Resistance correction factor ( t , , zeta) for wiretemperature between -50° and 100°C 38
Gl. Wiregraph for "C" core AL-2 44
G2. Wiregraph for "C" core AL-3 45
G3. Wiregraph for "C" core AL-5 46
G4. Wiregraph for "C" core AL-6 . . 47
G5. Wiregraph for "C" core AL-124 48
G6. Wiregraph for "C" core AL-8 49
G7. Wiregraph for "C" core AL-9 50
G8. Wiregraph for "C" core AL-10 . . . • 51
G9. Wiregraph for "C" core AL-12 52
G10. Wiregraph for "C" core AL-135 53
Gil. Wiregraph for "C" core AL-78 54
G12. Wiregraph for "C" core AL-18 55
G13. Wiregraph for "C" core AL-15 56
G14. Wiregraph for "C" core AL-16 57
G15. Wiregraph for "C" core AL,-17 58
G16. Wiregraph for "C" core AL-19 59
G17. Wiregraph for "C" core AL-20 60
G18, Wiregraph for "C" core AL-22 61
G19, Wiregraph for "C" core AL-23 - 62
G20. Wiregraph for "C" core AL-24 63
G21. Computation of mean turn length 64
G22. Common waveshapes RMS values 67
vn
33-697, Rev. 1
G23. Graph for inductance, capacitance, and reactance £,9
G24. Design curves showing maximum core loss for2 mil silicon "C" cores 70
G25. Area product vs energy LI 712
Vlll
33-697, Rev. 1
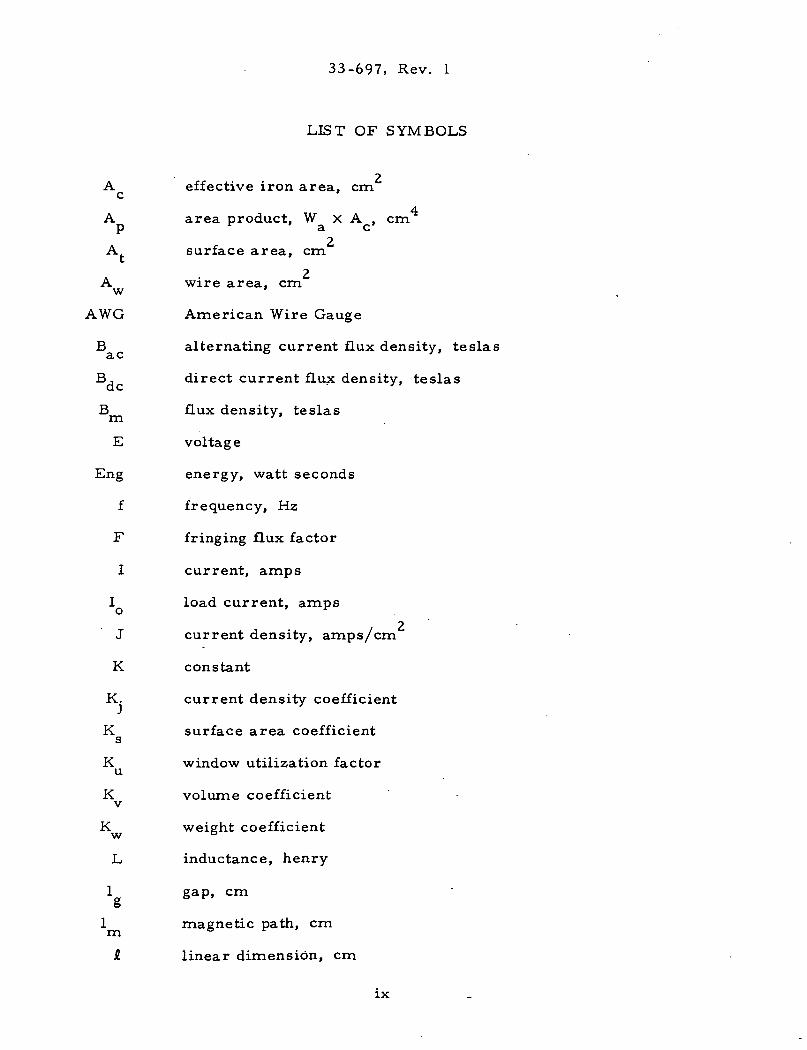
LIST OF SYMBOLS
A effective iron area, cm
A area product, W X A , cm
A surface area, cm
A wire area, cm
AWG American Wire Gauge
B alternating current flux density, teslas3L C
B , direct current flux density, teslas
B flux density, teslas
E voltage
Eng energy, watt seconds
f frequency, Hz
F fringing flux factor
I current, amps
I load current, amps
J current density, amps/cm
K constant
K. current density coefficient
K surface area coefficients
K window utilization factor
K volume coefficientv
K weight coefficient
L inductance, henry
1 gap, cmO
1 magnetic path, cm
S. linear dimension, cm
IX
33-697, Rev. 1
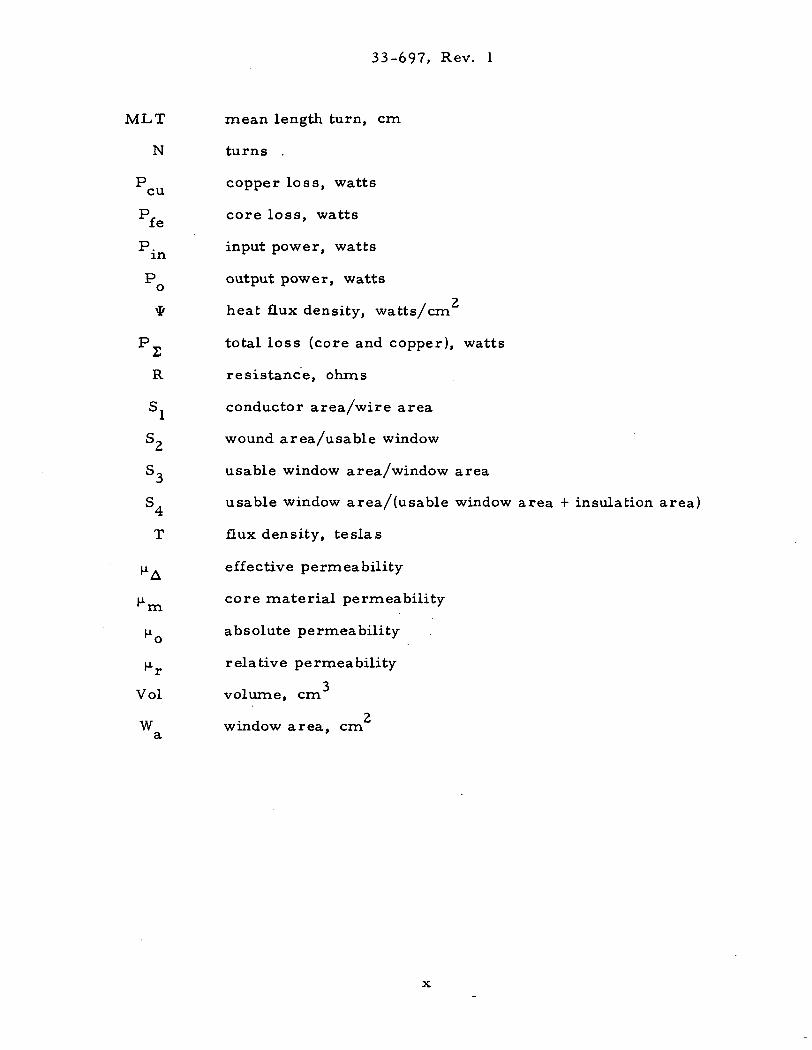
MLT mean length turn, cm
N turns .
P copper loss, watts
P, core loss, watts
P. input power, watts
P output power, watts
ty heat flux density, watts/cm
P total loss (core and copper), watts
R resistance, ohms
S. conductor area/wire area
S? wound area/usable window
S, usable window area/window area
S . usable window area/(usable window area + insulation area)
T flux density, teslas
u. A effective permeabilityA
JJL core material permeability
IJL absolute permeability
p. relative permeability
Vol volume, cm
W window area, cm
33-697, Rev. 1
ABSTRACT
Although filter inductor designers have routinely tended to specify moly
permalloy powder cores for use in high frequency power converters and pulse-
width modulated switching regulators, there are significant advantages in
specifying C cores and cut toroids fabricated from grain oriented silicon steels
which should not be overlooked. Such steel cores can develop flux densities of
1. 6 tesla, with useful linearity to 1. 2 tesla, whereas moly permalloy cores
carrying d. c. current have useful flux density capabilities only to about 0. 3
tesla. The use of silicon steel cores thus makes it possible to design more
compact cores, and therefore inductors of reduced volume, or conversely to
provide greater load capacity in inductors of a given volume.
For years manufacturers have rated their cores with a number that repre-
sents its relative energy-handling ability. This method assigns to each core a
number which is the product of its window and core cross-section area, and is
called "Area Product Ap. " The author has developed a correlation between
the A numbers and current density J for a given temperature rise. Also, the
author has developed straight-line relationships for A and Volume, Ap and
surface area A and, A and weight. These relationships can now be used asc pnew tools to simplify and standardize the process of inductor design. They
also make it possible to design inductors of small bulk and volume or to optimize
efficiency.
The adoption by NASA of the metric system for dimensioning to replace
the long-used English units imposes a requirement on the U.S. transformer
designer to convert from the familiar units to the less familiar metric equiva-
lents. Material is presented to assist in that transition in the field of trans-
former design and fabrication.
XI
33-697, Rev. 1
I. INTRODUCTION
Designers have routinely tended to specify moly permalloy
powder cores for filters inductors used in high frequency power con-
verters and pulse-width modulated (PWM) switched regulators
because of the convenient availability (in the literature of the manu-
facturers of such core materials) of tables, graphs and examples
which simplify the design task. Such solutions do not necessarily
result in inductors optimized for size and weight.
There are significant advantages in effecting such optimization
by use of C core and cut toroids fabricated from grain-oriented sili-
con steel, despite such disadvantages as the need for banding and
gapping materials and the use of bonding tools, mounting brackets
and winding mandrels. Grain-oriented silicon steels provide greater
flexibility in the design of high frequency inductors because the air
gap can be adjusted to any desired width and because the relative
permeability is high even at high dc flux density. Such steels can
develop flux densities of 1. 6 tesla, with useful linearity to 1. 2 tesla.
Moly permalloy''~ cores carrying dc current have useful flux density
capabilities only to about 0. 3 tesla.
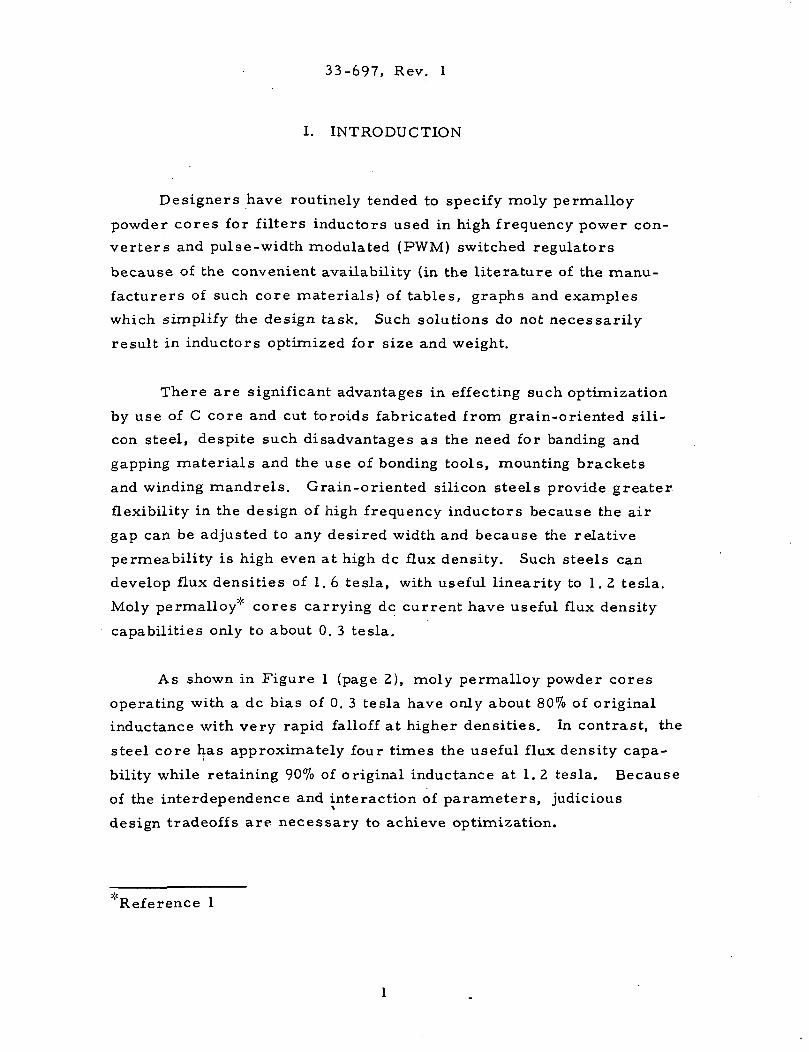
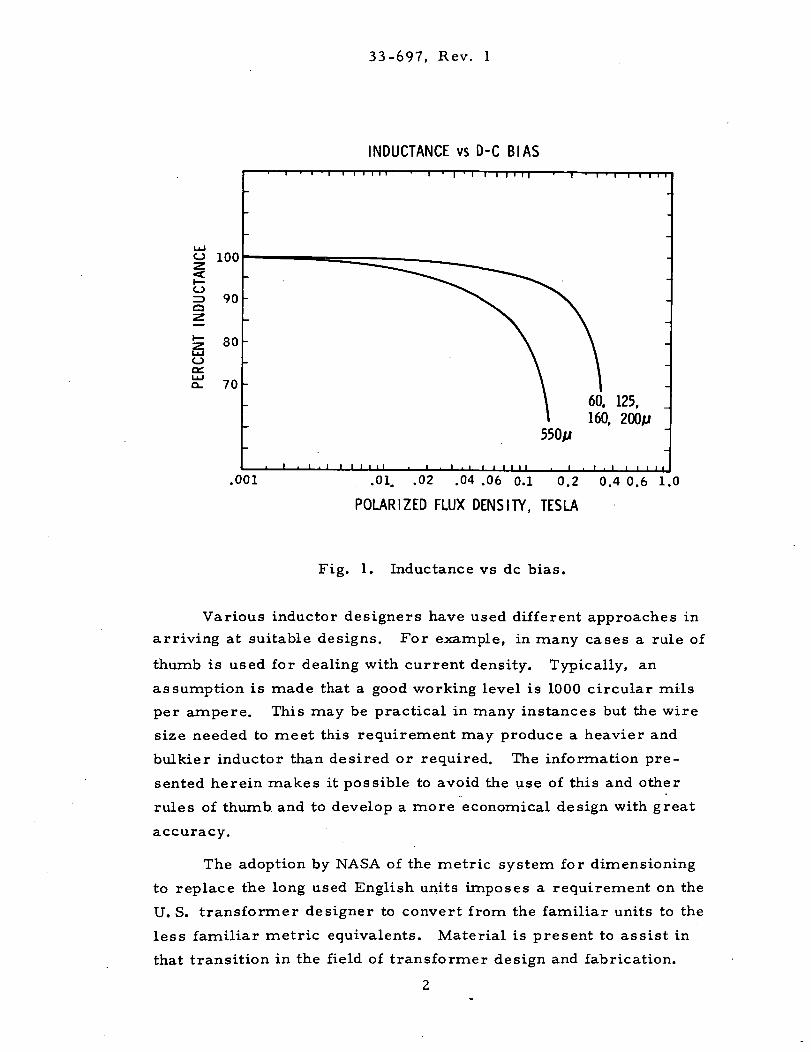
As shown in Figure 1 (page 2), moly permalloy powder cores
operating with a dc bias of 0. 3 tesla have only about 80% of original
inductance with very rapid falloff at higher densities. In contrast, the
steel core has approximately four times the useful flux density capa-
bility while retaining 90% of original inductance at 1.2 tesla. Because
of the interdependence and interaction of parameters, judicious
design tradeoffs are necessary to achieve optimization.
'""Reference 1
33-697, Rev. 1
INDUCTANCE vs D-C BIAS
o 100
90
UJO
80
70
550/1
60. 125.160, 200/ir
.001 .01. .02 .04 .06 0.1 0.2 0.4 0.6 1.0
POUR I ZED FLUX DENSITY, TESLA
Fig. 1. Inductance vs dc bias.
Various inductor designers have used different approaches in
arriving at suitable designs. For example, in many cases a rule of
thumb is used for dealing with current density. Typically, an
assumption is made that a good working level is 1000 circular mils
per ampere. This may be practical in many instances but the wire
size needed to meet this requirement may produce a heavier and
bulkier inductor than desired or required. The information pre-
sented herein makes it possible to avoid the use of this and other
rules of thumb and to develop a more economical design with great
accuracy.
The adoption by NASA of the metric system for dimensioning
to replace the long used English units imposes a requirement on the
U. S. transformer designer to convert from the familiar units to the
less familiar metric equivalents. Material is present to assist in
that transition in the field of transformer design and fabrication.
2
33-697, Rev. 1
Manufacturers have for years assigned numeric codes to their
cores which represent the relative energy handling ability. This
method assigns to each core a number which is the product of its
window area and core cross section area and is called "Area
Product", A .P
Over the last few months, the author became aware of unique
relationships between the "Area Product", A , characteristic num-
ber for inductor cores and several other important parameters
which must be considered in inductor design. These numbers were
developed by core suppliers to summarize dimensional and electrical
properties of C-cores and are listed in their catalogs. Such numbers
are available for more than 200 different C-core sizes and
configurations.
The author has developed relationships between the A numbers
and current density J for a given temperature rise. The area pro-4
duct A is a dimension to the fourth power S. , whereas volume is aP 3
dimension to the third power £ and surface area A is a dimension to2
the second power H . Straight-line relationships have been developed
for A and volume, A and surface area A^, and A and weight.P P • . * P
These relationships can now be used as new tools to simplify
and standardize the process of inductor design. They make it possible
to design inductors of smaller bulk and volume or to optimize
efficiency. While developed specifically for aerospace applications,
the information has wider utility and can be used for the design of
non-aerospace inductors as well.
Because of its significance, area product, A , is treated
extensively. Additionally a great deal of information is presented for
the convenience of the designer. Much of the material is in graphical
or tabula.r form to assist the designer in making the tradeoffs best
suited for his particular application in a minimum amount of time.
33-697, Rev. 1
THE AREA PRODUCT
The A * of a C-type core is the product of the available window area (W )P 2 a
of the core in square centimeters (cm ) multiplied by the effective cross-
sectional area (A ) in square centimeters (cm ) which may be stated as:
A = W Ap a c [cm4] (1)
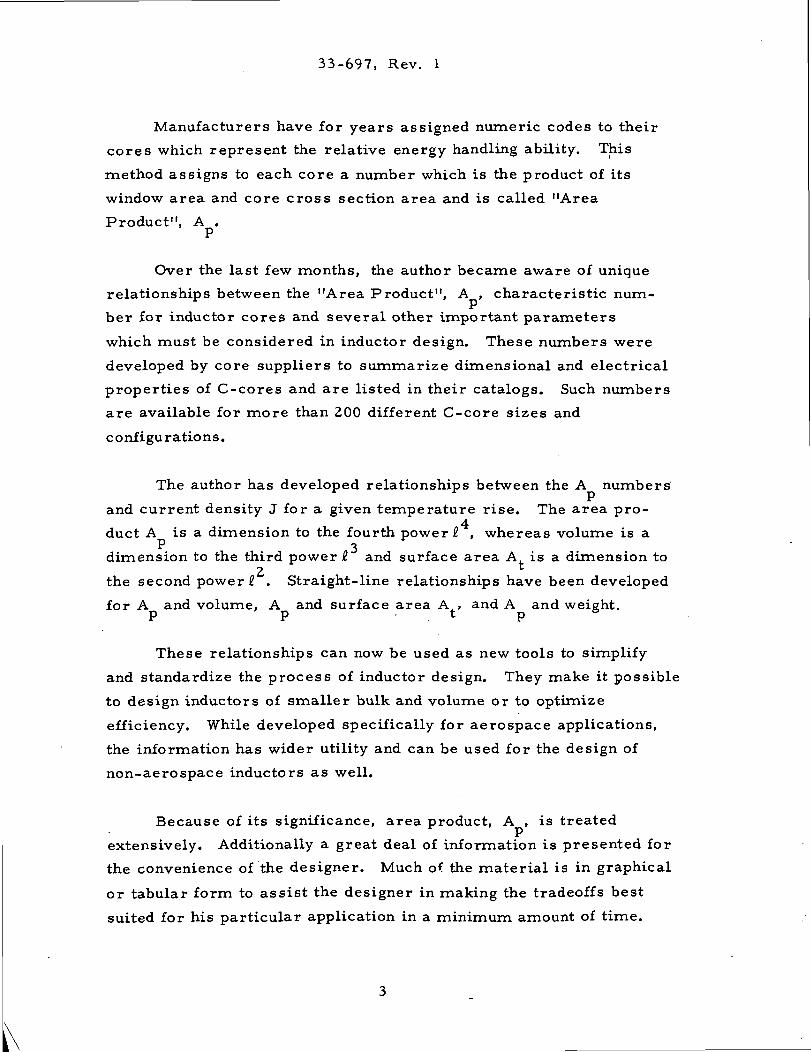
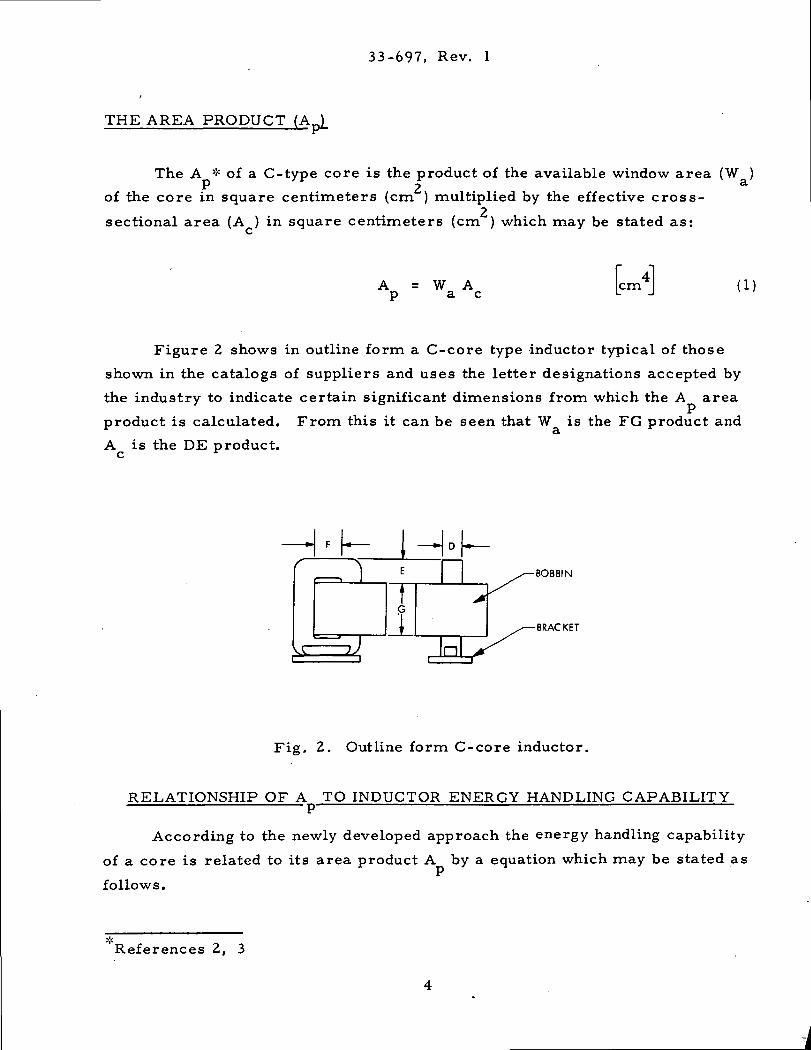
Figure 2 shows in outline form a C-core type inductor typical of those
shown in the catalogs of suppliers and uses the letter designations accepted by
the industry to indicate certain significant dimensions from which the A area
product is calculated. From this it can be seen that W is the FG product andct
A is the DE product.
f
r } l
i\£~ JJ
G>
l n X
-BOBBIN
-BRACKET
Fig. 2. Outline form C-core inductor.
RELATIONSHIP OF A TO INDUCTOR ENERGY HANDLING CAPABILITYp
According to the newly developed approach the energy handling capability
of a core is related to its area product A by a equation which may be stated as
follows.
References 2, 3
33-697, Rev. 1
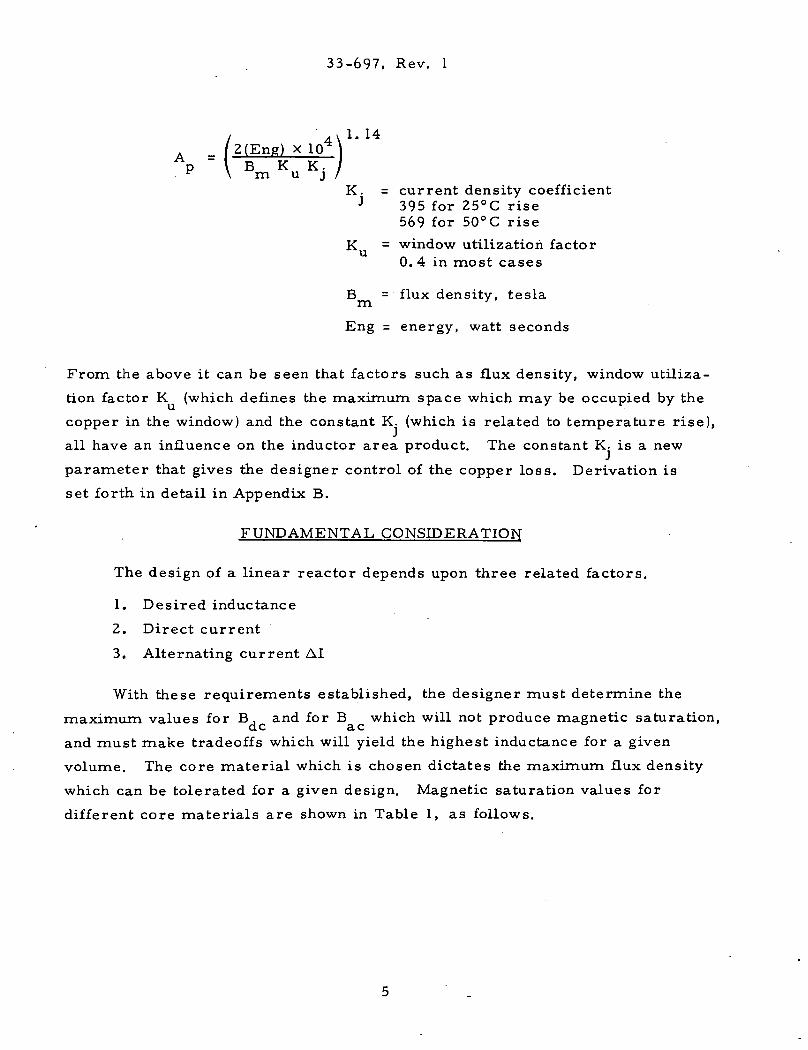
1. 14_ / 2(Eng) X
P " \ Bm Ku -jK. = current density coefficient
J 395 for 25°C rise569 for 50°C rise
K = window utilization factor0. 4 in most cases
B = flux density, teslam *
Eng = energy, watt seconds
From the above it can be seen that factors such as flux density, window utiliza-
tion factor K (which defines the maximum space which may be occupied by the
copper in the window) and the constant K. (which is related to temperature rise),
all have an influence on the inductor area product. The constant K. is a new
parameter that gives the designer control of the copper loss. Derivation is
set forth in detail in Appendix B.
FUNDAMENTAL. CONSIDERATION
The design of a linear reactor depends upon three related factors.
1. Desired inductance
2. Direct current
3. Alternating current AI
With these requirements established, the designer must determine the
maximum values for B, and for B which will not produce magnetic saturation,CL G EL C
and must make tradeoffs which will yield the highest inductance for a given
volume. The core material which is chosen dictates the maximum flux density
which can be tolerated for a given design. Magnetic saturation values for
different core materials are shown in Table 1, as follows.
33-697, Rev. 1
Table 1. Magnetic material
Material Type
Magnesil
Orthonal
48 Alloy
Permalloy
3% Si, 97% Fe
50% Ni, 50% Fe
48% Ni, 50% Fe
79% Ni, 17% Fe, 4% Mo
Flux Density(tesla)
1.6
1.5
1.2
0.75
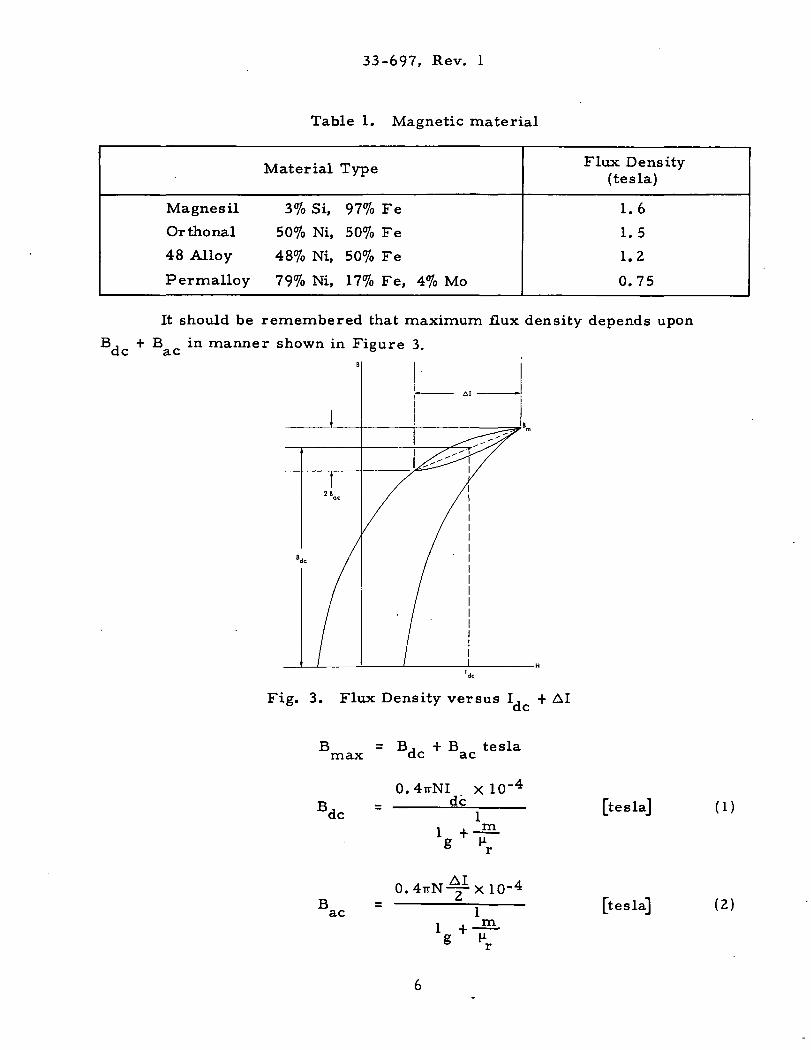
It should be remembered that maximum flux density depends upon
B, + B in manner shown in Figure 3.Q.C £L C
Fig. 3. Flux Density versus I, + AI
J = B, + B teslamax dc ac
0.4irNI x 10'4dc
1i i m
[teslaj (1)
ac1 + m
[tesla] (2)
33-697, Rev. 1 %
combining Eqs. (1) and (2)
0.4TTNI, X 10"4 0 . 4 T r N - X 10~4
B = - - + - —, - [tesla] (3)max 1 *
1 | rn i , mg Hr g Kr
The inductance of an iron-core inductor carrying dc and having an air gap
may be expressed as:
0.4TrN2A X 10"8
L - £_ [henry] (4)
1 +J?Lg Kr
Inductance is dependent on the effective length of the magnetic path which
sum of the air ga
relative permeability (1
is the sum of the air gap length (1 ) and the ratio of the core mean length too
m
When the core air gap (1 ) is large compared to relative permeability
(1 /|ir), because of the high relative permeability ( \± r ) variations in fj.r do not
substantially effect the total effective magnetic path length or the inductance.
The inductance equation then reduces to:
0.4irN2A X 10"8
L = f [henry] (5)g
Final determination of the air gap requires consideration of the effect of
fringing flux which is a function of gap dimension, the shape of the pole faces
and the shape, size and location of the winding. Its net effect is to shorten the
air gap.
Fringing flux decreases the total reluctance of the magnetic path and
therefore increases the inductance by a factor F to a value greater than that
33-697, Rev. 1
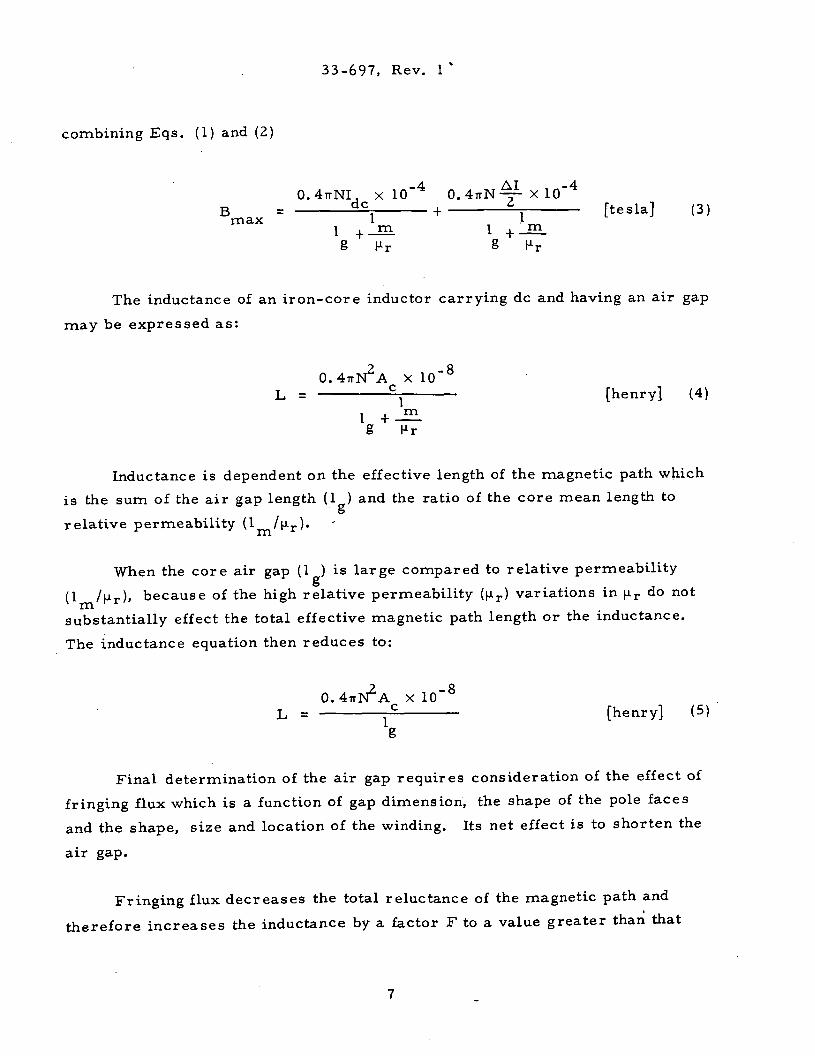
calculated from equation (5). Fringing flux"1" is a larger percentage of the total
for larger gaps. The fringing flux factor is:
F . (6)
where G is a dimension defined in Figure 2. (This equation is also valid for
laminations. )
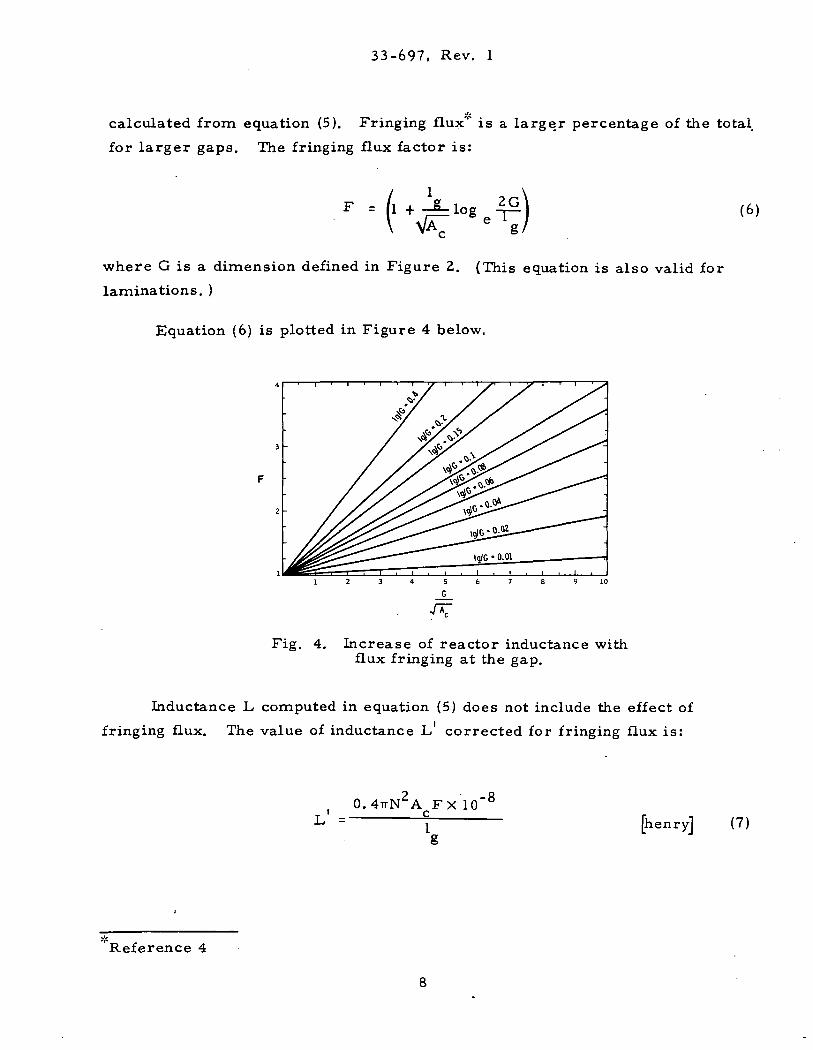
Equation (6) is plotted in Figure 4 below.
Fig. 4. Increase of reactor inductance withflux fringing at the gap.
Inductance L computed in equation (5) does not include the effect of
fringing flux. The value of inductance L corrected for fringing flux is:
0.4TrN2A FX10" 8
[henry] (7)
Reference 4
33-697, Rev. 1
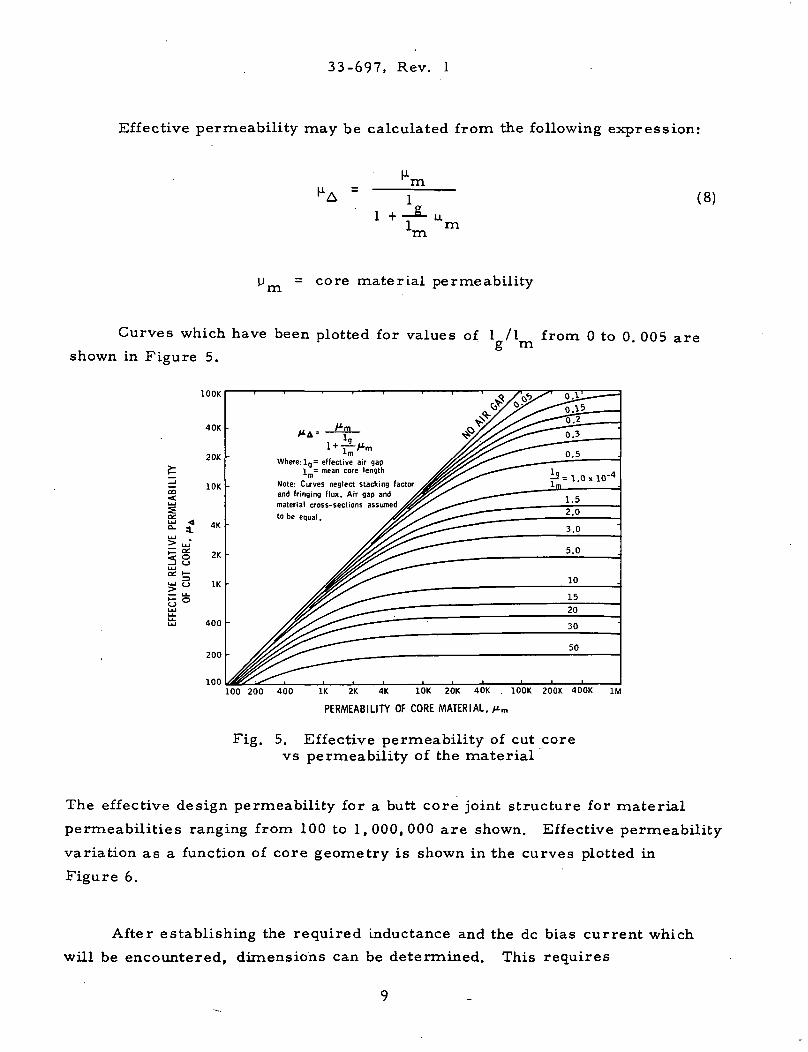
Effective permeability may be calculated from the following expression:
m(8)
1 + um
m
u = core material permeability
Curves which have been plotted for values of 1 /I from 0 to 0. 005 are
shown in Figure 5.
100K
Where: lg= effective air gap1 = mean core length
Note: Curves neglect stacking factorand fringing flux. Air gap andmaterial cross-sections assum
to be equal .
100100 200 400 IK 2K 4K 10K 20K 40K
PERMEABILITY OF CORE MATERIAL, /
100K 200K 400K
Fig. 5. Effective permeability of cut corevs permeability of the material
The effective design permeability for a butt core joint structure for material
permeabilities ranging from 100 to 1,000,000 are shown. Effective permeability
variation as a function of core geometry is shown in the curves plotted in
Figure 6.
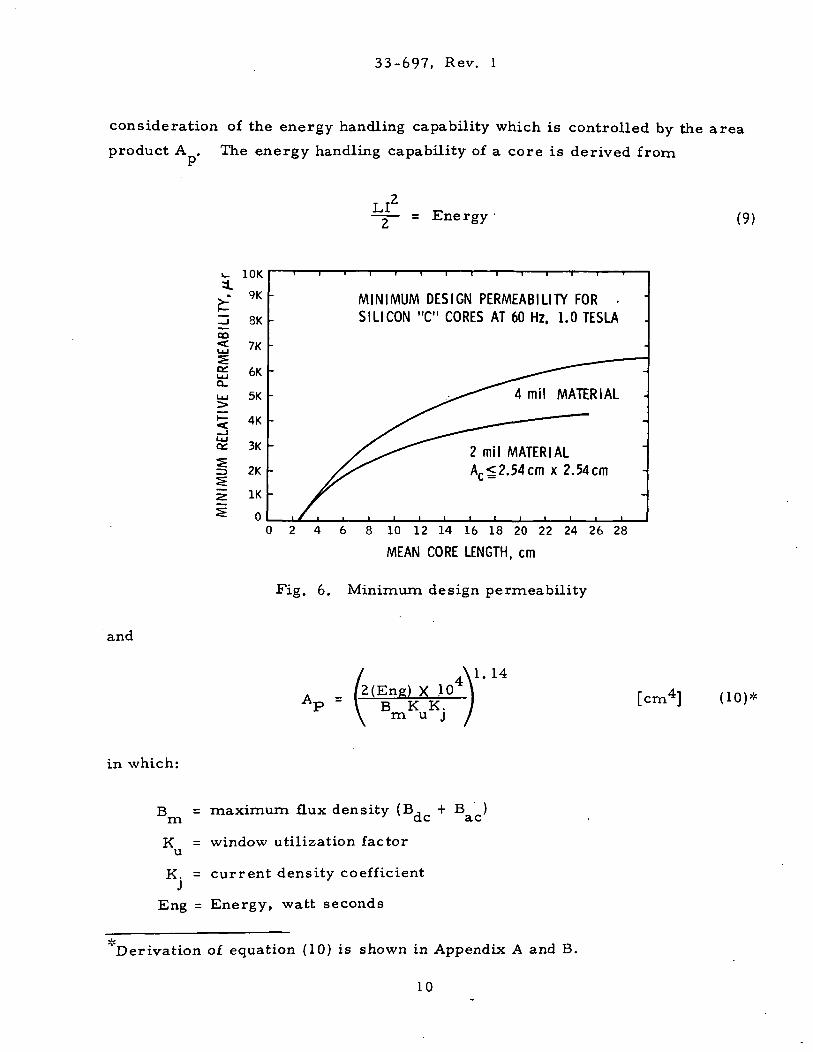
After establishing the required Inductance and the dc bias current which
will be encountered, dimensions can be determined. This requires
33-697, Rev. 1
consideration of the energy handling capability which is controlled by the area
product A . The energy handling capability of a core is derived from
—=— = Energy • (9)
>_ 10K
>-" 9K
jj 3Kco2i 7KS1.1 6Ka.uj 5K
at 3K
| 2K
2 IK
* 0
MINIMUM DESIGN PERMEABILITY FOR -SILICON "C" CORES AT 60 Hz, 1.0 TESLA
2 mil MATERIALAr<2.54cm x 2.54cm
02 4 6 8 10 12 14 16 18 20 22 24 26 28
MEAN CORE LENGTH, cm
Fig. 6. Minimum design permeability
and
,1. 14
AP =f2(Eng) X 10
B K K.m u j[cm4] (10)*
in which:
B = maximum flux density (B, + B )m Q.C ac
K = window utilization factoru
K. = current density coefficient
Eng = Energy, watt seconds
"^Derivation of equation (10) is shown in Appendix A and B.
10
33-697, Rev. 1
DESIGN EXAMPLE
For a typical design example, assume:
1. Inductance 0.015 henrys
2. dc current 2 amp
3. ac current 0. 1 amp
4. 25°C rise
5. Frequency 20 KHz
The procedure would then be as follows:
Step No. 1 Calculate the energy involved from equation (9):
LI2
Eng = — (11)
Eng a 0.015J2.0)2
Eng = 0. 030 [watt second]
Step No. 2 Calculate the area product Ap from equation (10):
4\1. 142(Eng) X 10 \ r^ i
AP = \ B K K. ) [cm ]
m u j /
4\1. 14A 2(0. 03) X 104\ , 4,Ap \ ( 1 . 2 ) ( 0 . 4 ) ( 3 9 5 ) J " 3 '7Z Lcm J
A core which has an area product closest to the calculated value is the AL-10
which is described in Table G9. That size core has an area product A-, ofA *2 "y ^"^
3.85cm (A r = 1. 34 effective cm XW = 2 . 8 7 c m ) .\_t cL
After the Ap has been determined, the geometry of the inductor can be
evaluated as described in Appendix D for weight, Appendix C for surface area
and Appendix E for volume, and appropriate changes made, if required.
11
33-697, Rev. 1
Step No. 3 Determine the current density from:
_ -0.125J - K.Ap
J = 395(3. 72)"°' 125 = 335 amps/cm2
Step No. 4 Determine the wire size from:
Wire size =/ 2amp /cm
Wire size = = 0.00597 [cm2]
Select the wire size from Table Fl. The rule is that when the calculated
wire size does not all close to those listed in the table, the next smallest size
should be selected.
The closest wire size to 0. 00597 is AWG No. 20
Area = 0. 005188 (bare) [cm2]
Step No. 5 Calculate the number of turns.
The number of turns per square cm for No. 20 wire is 98.9 , based on 60%
wire fill factor data taken from Table Fl column J.
effective window X turns /cm
2.58 X 98. 9 = 255
Total number of turns = 255
*Derivation of equation (12) is shown in Appendix B.
12
33-697, Rev. 1
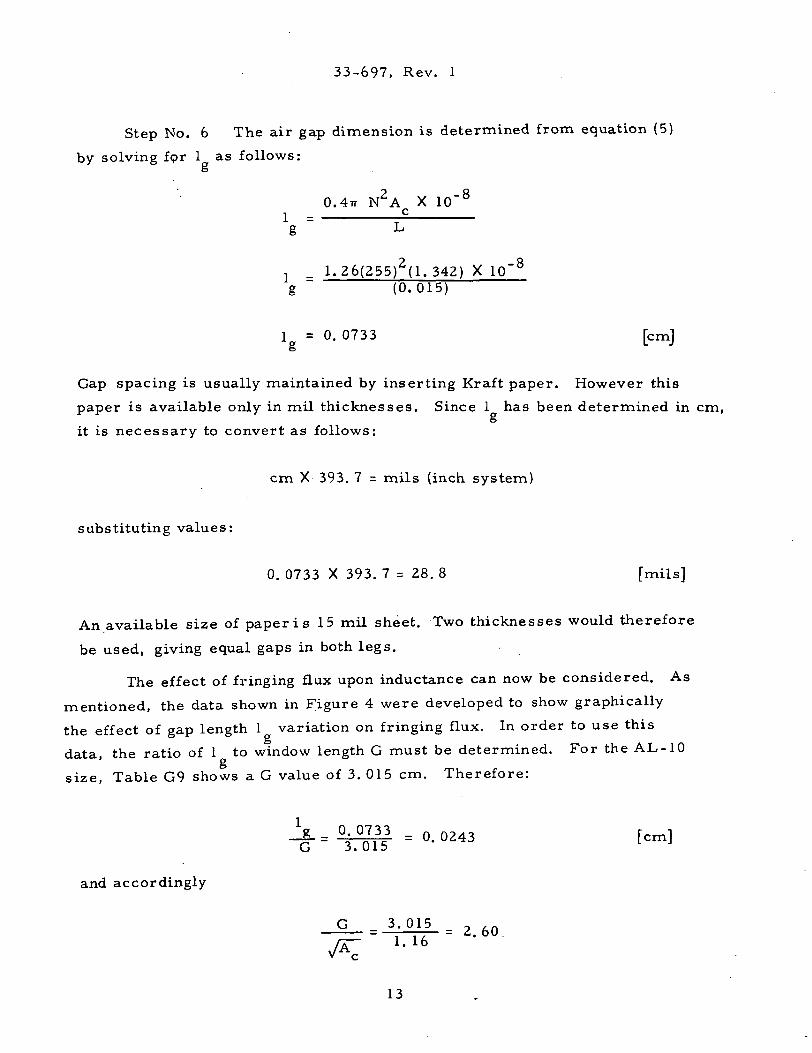
Step No. 6 The air gap dimension is determined from equation (5)
by solving for 1 as follows:6
0.4iT N2A X 10"8
1 _ 1.26(255)2(1. 342) X 10"8
g (0 .015)
1 = 0. 0733 [cm!g L J
Gap spacing is usually maintained by inserting Kraft paper. However this
paper is available only in mil thicknesses. Since 1 has been determined in <6
it is necessary to convert as follows:
cm X 393. 7 = mils (inch system)
substituting values:
0. 0733 X 393. 7 = 28. 8 [mils]
An available size of paper is 15 mil sheet. Two thicknesses would therefore
be used, giving equal gaps in both legs.
The effect of fringing flux upon inductance can now be considered. As
mentioned, the data shown in Figure 4 were developed to show graphically
the effect of gap length 1 variation on fringing flux. In order to use this
data, the ratio of 1 to window length G must be determined. For the AL-10
size, Table G9 shows a G value of 3. 015 cm. Therefore:
= 0. 0243 [cm]
and accordingly
_G-= 3-015
= 2 60JA; »•«
13
33-697, Rev. 1
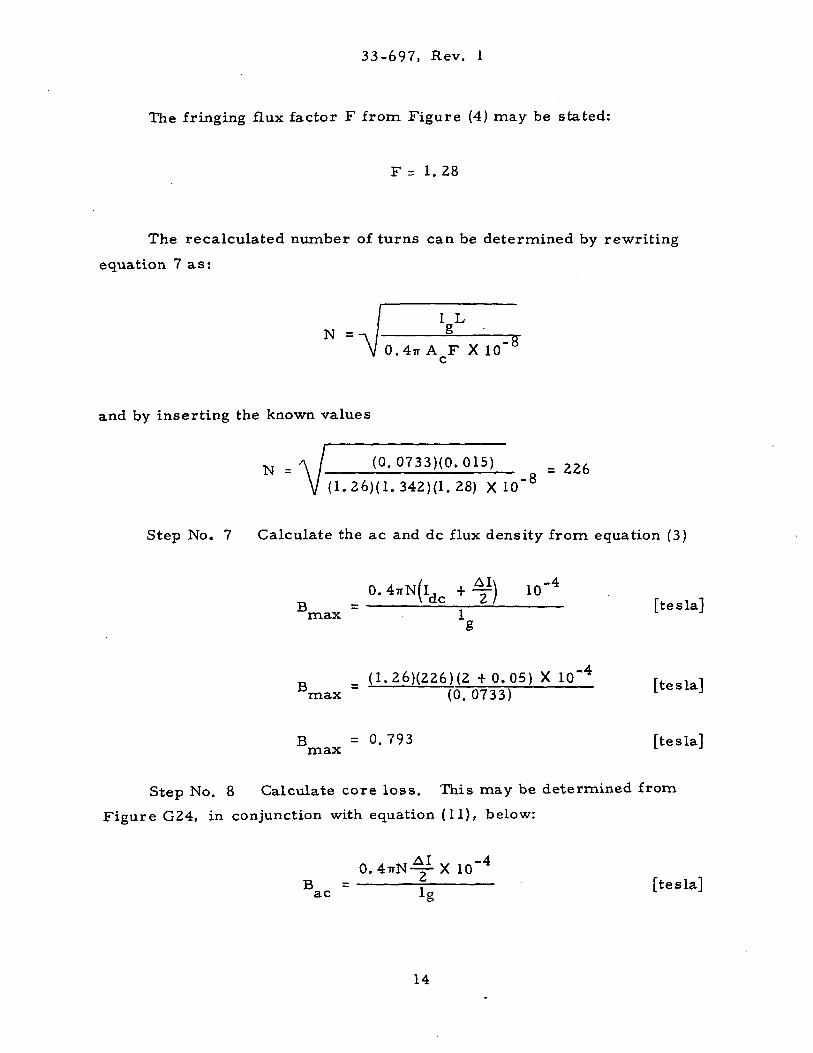
The fringing flux factor F from Figure (4) may be stated:
F = 1. 28
The recalculated number of turns can be determined by rewriting
equation 7 as:
1 LN =- / 1
0.4TT A F X 10~8
c
and by inserting the known values
N = ' (0 .0733)(0 .015)"8
. 342)(1.28) X 10
Step No. 7 Calculate the ac and dc flux density from equation (3)
0.4TrN(l, + -^r) 10"4
B ^dc 2)max 1
B
B =0. 793 [tesla]max L J
Step No. 8 Calculate core loss. This may be determined from
Figure G24, in conjunction with equation (11), below:
0 . 4 T r N - X 10"4
B = - £ - [tesla]ac la l J
14
33-697, Rev. 1
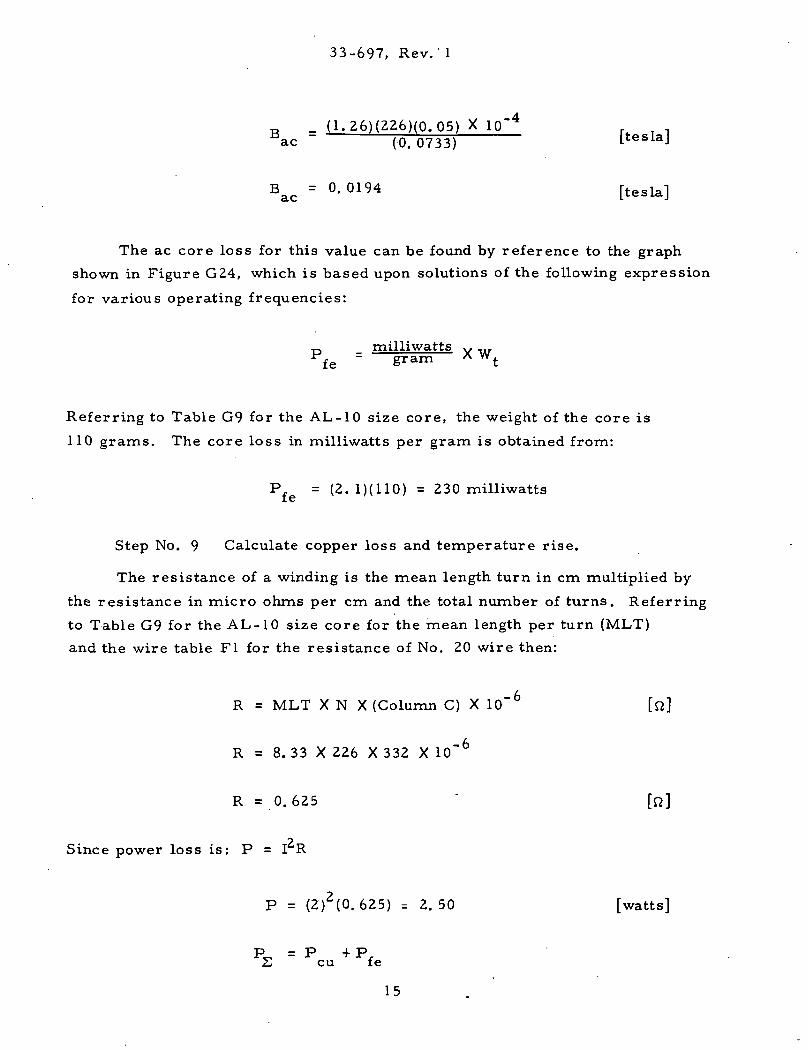
R _ (1 .26 ) (226) (Q .Q5) X 1Q"4
Bac -- (0. 0733) -
Bac
The ac core loss for this value can be found by reference to the graph
shown in Figure G24, which is based upon solutions of the following expression
for various operating frequencies:
_ _ milliwatts Y*fe - gram * w
t
Referring to Table G9 for the AL-10 size core, the weight of the core is
110 grams. The core loss in milliwatts per gram is obtained from:
Pfe = (2. 1)(110) = 230 milliwatts
Step No. 9 Calculate copper loss and temperature rise.
The resistance of a winding is the mean length turn in cm multiplied by
the resistance in micro ohms per cm and the total number of turns. Referring
to Table G9 for the AL-10 size core for the mean length per turn (MLT)
and the wire table Fl for the resistance of No. 20 wire then:
R = MLT X N X (Column C) X 10"6 [ft]
R = 8. 33 X 226 X 332 X 10"6
R = 0.625 ' [n]
Since power loss is: P = I R
P = (2)2(0. 625) = 2. 50 [watts]
= P +Pfcu fe
15
33-697, Rev. 1
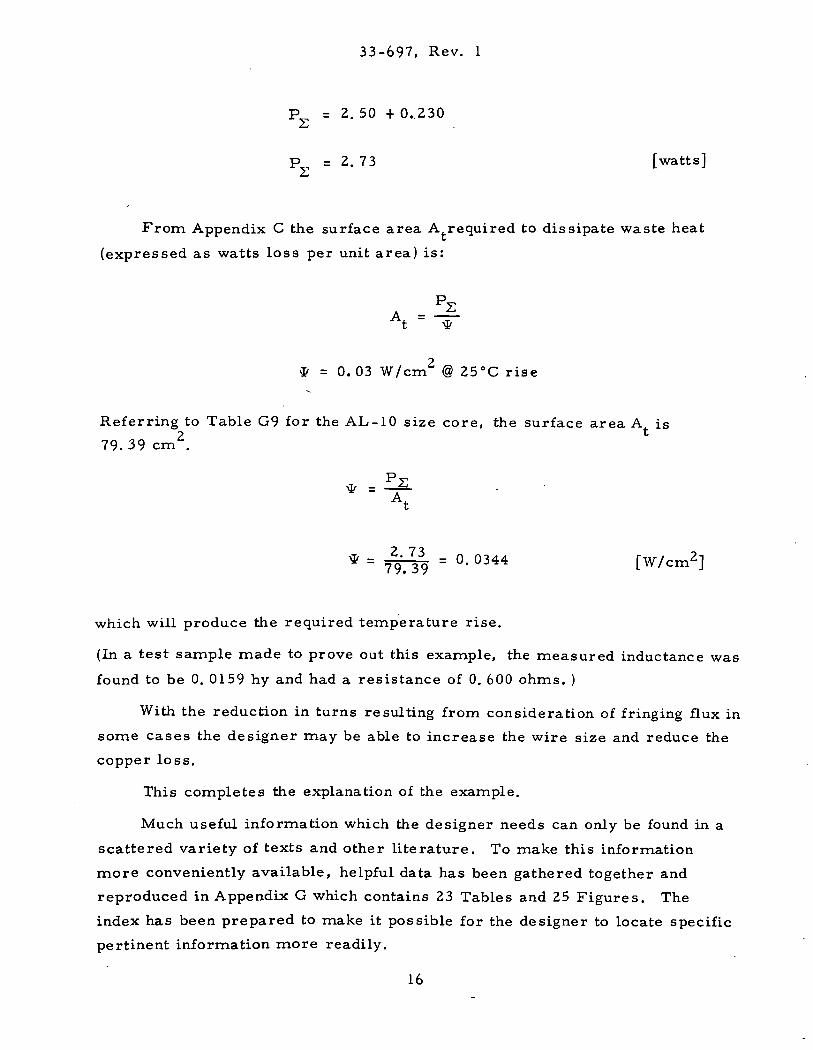
P = 2. 50 + 0.230
p, = 2. 73 [watts]2-t
From Appendix C the surface area A required to dissipate waste heat
(expressed as watts loss per unit area) is:
At =0.03 W/cm2 @ 25°C rise
Referring to Table G9 for the AL-10 size core, the surface area A is
79.39 cm2.
At
* = £r£) = °' °344 [W/cm2]
which will produce the required temperature rise.
(In a test sample made to prove out this example, the measured inductance was
found to be 0. 0159 hy and had a resistance of 0. 600 ohms. )
With the reduction in turns resulting from consideration of fringing flux in
some cases the designer may be able to increase the wire size and reduce the
copper loss.
This completes the explanation of the example.
Much useful information which the designer needs can only be found in a
scattered variety of texts and other literature. To make this information
more conveniently available, helpful data has been gathered together and
reproduced in Appendix G which contains 23 Tables and 25 Figures. The
index has been prepared to make it possible for the designer to locate specific
pertinent information more readily.
16
33-697, Rev. 1
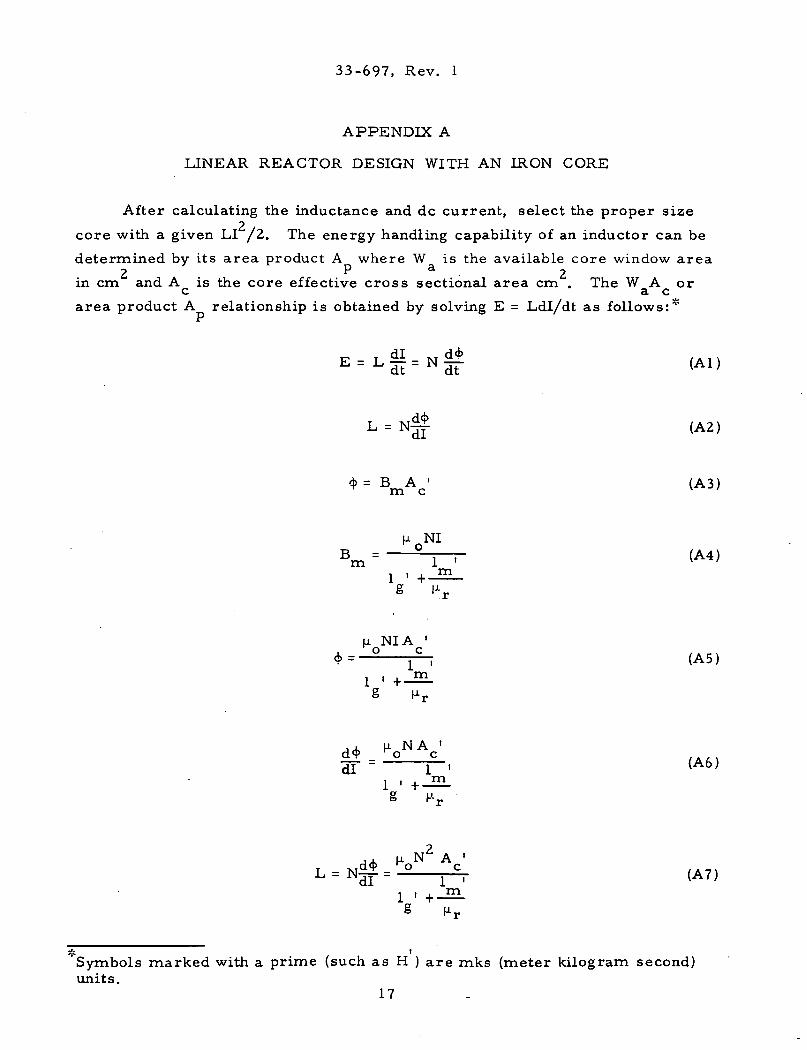
APPENDIX A
LINEAR REACTOR DESIGN WITH AN IRON CORE
After calculating the inductance and dc current, select the proper size
core with a given LI /2. The energy handling capability of an inductor can be
determined by its area product A where W is the available core window area2 P a 2
in cm and A is the core effective cross sectional area cm . The W A orc a carea product A relationship is obtained by solving E = Ldl/dt as follows:*
E = L = N (Al)
L = N (A2)
= BmAc- (A3)
u NIBm = - j-r (A4)
1 '
NIA 'C . (A5)
dl ~1g
NA '_ c_' (A6)
N2 A '(A7)
cSymbols marked with a prime (such as H ) are mks (meter kilogram second)units.
17
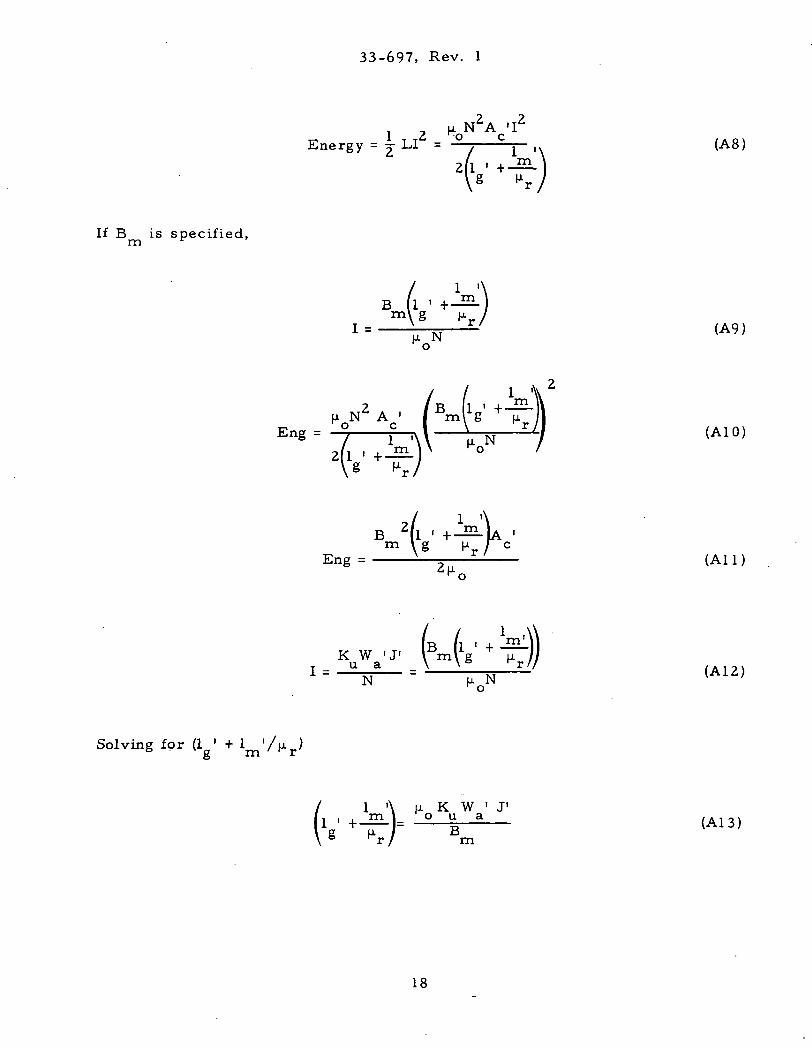
If B is specified,
Solving for (1 ' +
33-697, Rev. 1
Hi N2A 'I2
Energy = j UT = —, ^y- ,. (A8)C* I A \
2(1 ' +^L)g
B l ' +-2Lm\g ^r/
<A9)
-i^Vnr/ <
(B /i • + JHl\K W 'J' \ ml g M. /u a \ \6 rr/,
B i . +m \g u c
Eng = X , ( A l l )^
'\ (j. K W ' J1
L L ° B a (A13)
: / m
18
33-697* Rev. 1
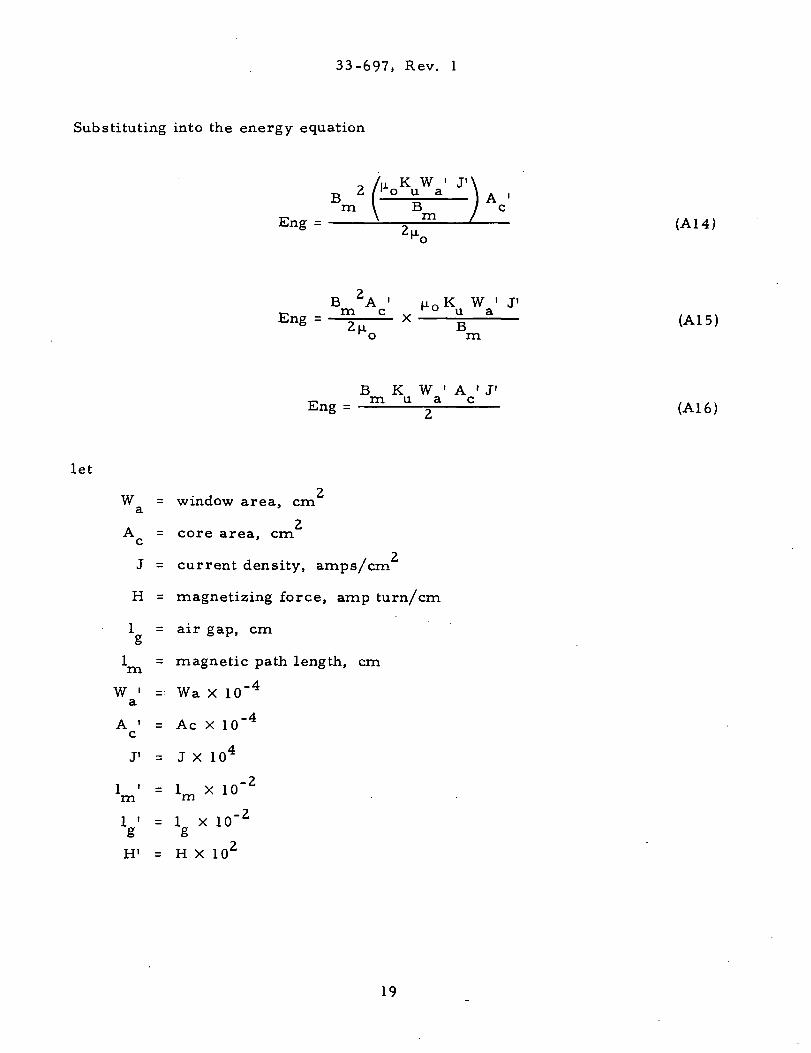
Substituting into the energy equation
let
_ /M K W ' J'\B
2f° " a )A 'm V B / c
Eng = i 5-S L (A14)
B 2A ' u0K W ' J'
m
W = window area, cm3,
A 2A = core area, cm
J = current density, amps/cm
H = magnetizing force, amp turn/ cm
1 = air gap, cmO
1 = magnetic path length, cm
W ' = Wa X 10~4
a
A ' = Ac X 10"4
J1 = J X 104
lm' = lm X 10"
y • ig x io"2
H1 = H X IO2
(A15)
B K W ' A ' J'Eng = m U / C (A16)
19
33-697, Rev. 1
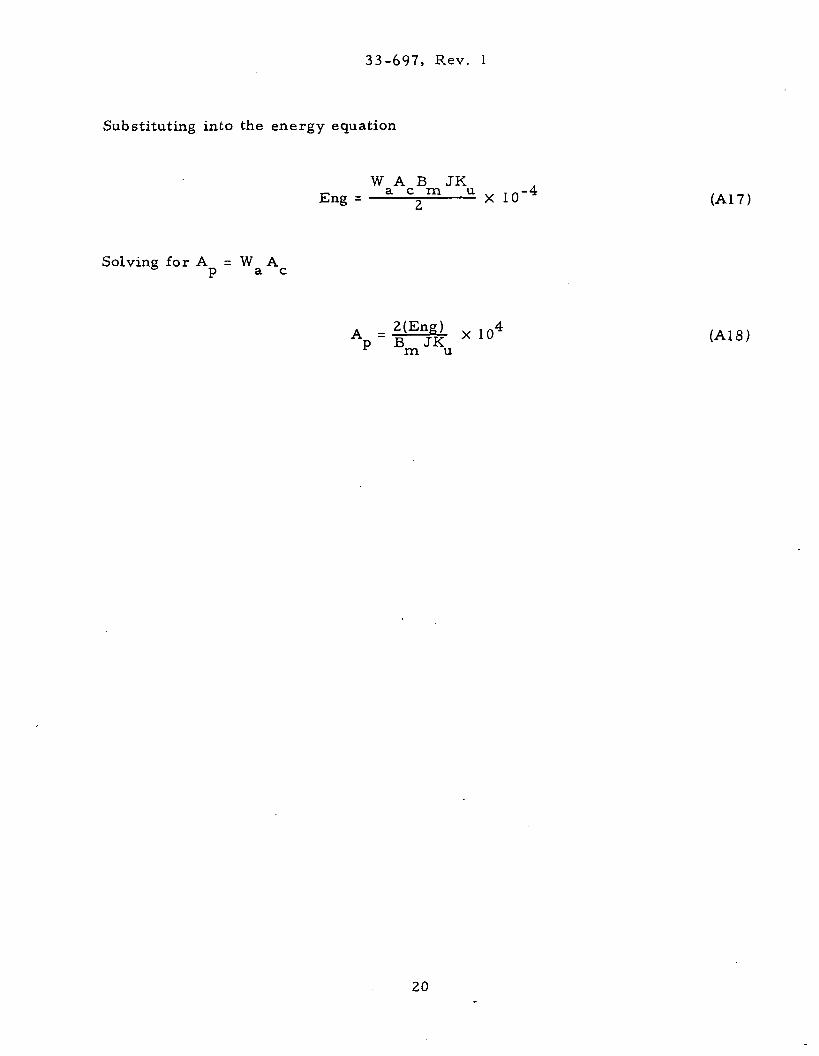
Substituting into the energy equation
W A B JKEng = a %m U X 1C'4 (A17)
Solving for A = W Ae p a c
A =|lEngi X 1 0 4p ~ B JKm u
20
33-697, Rev. 1
APPENDIX B
INDUCTOR CURRENT DENSITY
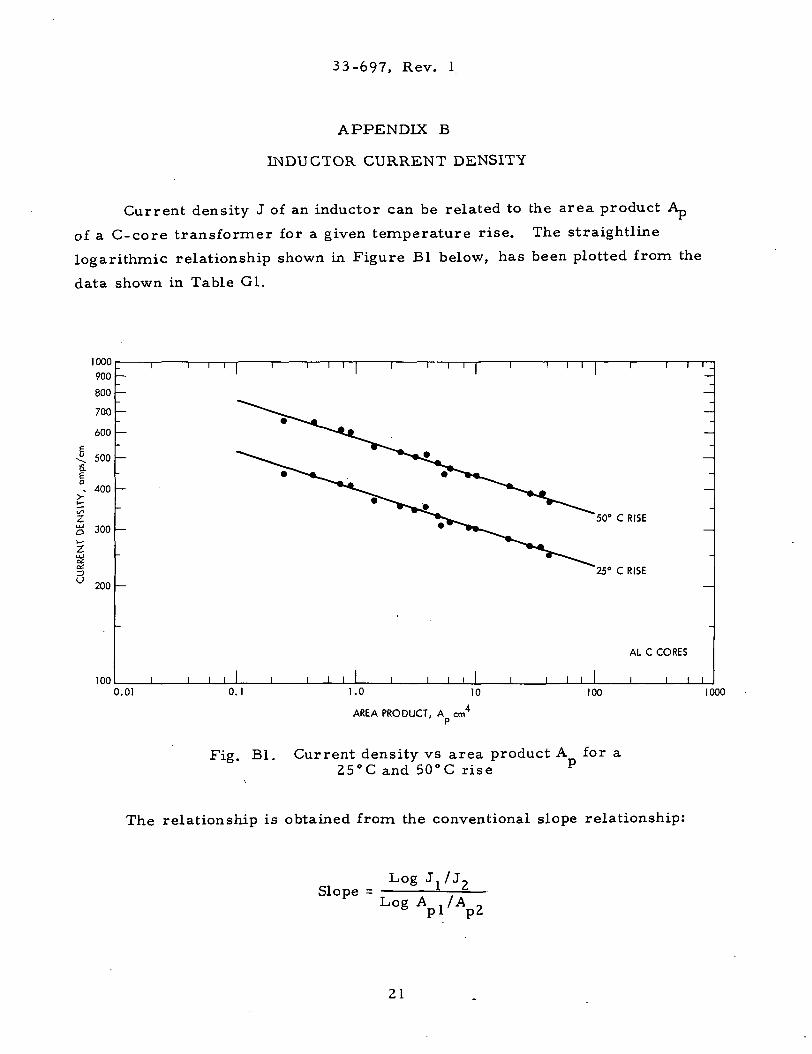
Current density J of an inductor can be related to the area product Ap
of a C-core transformer for a given temperature rise. The straightline
logarithmic relationship shown in Figure Bl below, has been plotted from the
data shown in Table Gl.
1000900
800
700
600
< 500S.
°. 400
300
I 1 I 1 | I \ I
Iu200
100
I I I T | I 1 1 1 \ I
50° C RISE
25° C RISE
j I I I I I I I I I I I
AL C CORES
j I III I I I i0.01 0.1 1.0 10
AREA PRODUCT, A cm4
P
100 1000
Fig. Bl. Current density vs area product A for a25°C and 50°C rise P
The relationship is obtained from the conventional slope relationship:
Slope =Log
21
33-697, Rev. 1
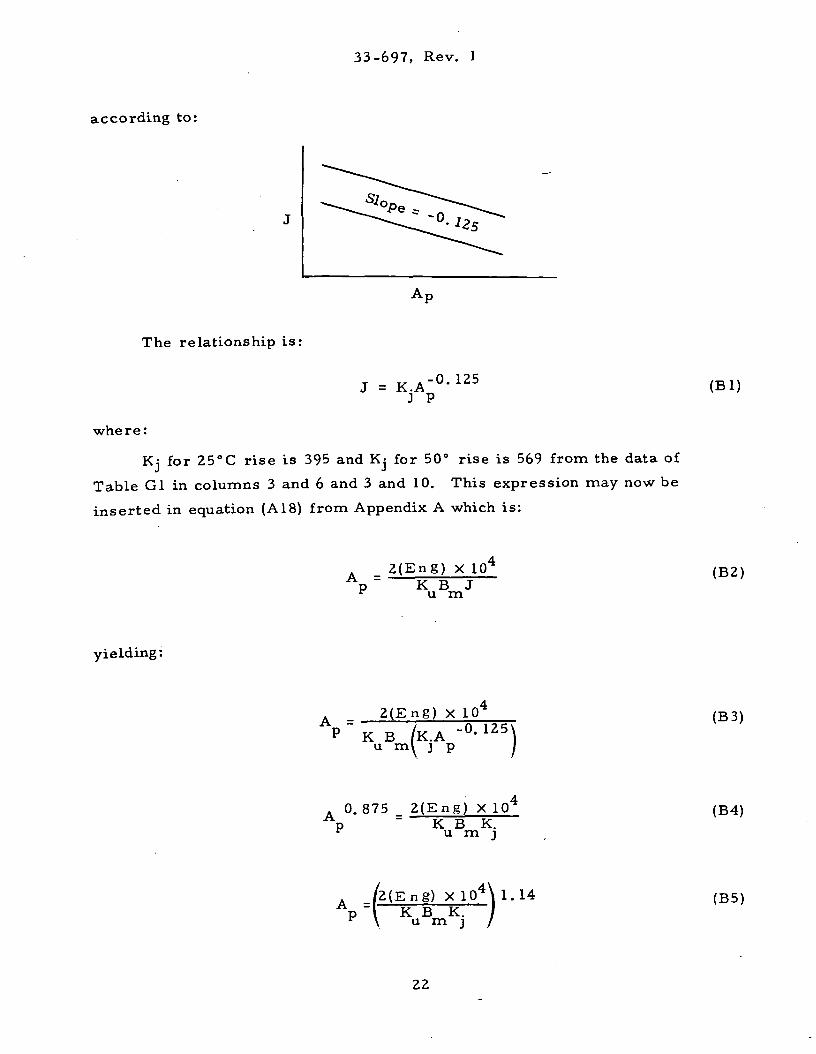
according to:
The relationship is:
°-125(Bl)
where:
Kj for 25°C rise is 395 and Kj for 50° rise is 569 from the data of
Table Gl in columns 3 and 6 and 3 and 10. This expression may now be
inserted in equation (A18) from Appendix A which is:
A =P
2 ( E n g ) X 10K B J
u m
(B2)
yielding:
A _ 2 ( E n g ) X 10
K Bu r M-8-118)(B3)
0. 875 _ 2 ( E n g ) X 10> K B K.u m j
(B4)
A /Z (Eng) X 10p "I KB K.^ \ u m j
1.14 (B5)
22
33-697, Rev. 1
APPENDIX C
RELATIONSHIP OF A TO CONTROL, OF TEMPERATURE RISEP
Temperature Rise
Not all of the P. input power to the inductor is delivered to the load as
the P . Some of the input power is converted to heat by the resistance of the
winding.
The generated heat produces a temperature rise which must be controlled
to prevent damage to or failure of the windings by breakdown of the wire insula-
tion at elevated temperatures. Such heat is dissipated only from the exposed
surfaces of the inductor by a combination of radiation and convection, and thus
is dependent upon the total exposed surface area of the core and windings.
Calculation of Temperature Rise
Temperature rise in an inductor winding cannot be predicted with
complete precision, despite the fact that many different techniques are
described in the literature for its calculation. One reasonably accurate method
for open core and winding construction is based upon the assumption that core
and winding losses may be lumped together as:
and the assumption that thermal energy is dissipated throughout the surface
area of the core and winding assembly. The losses in an inductor due to
ac flux density are very low compared to the copper loss. It is then assumed
that majority of the losses are copper.
P » P, (C2)cu fe
23
33-697, Rev. 1
Transfer of heat by radiation occurs because any body raised to a
temperature above its surroundings emits heat energy in the form of waves. Inu,
accordance with the Stefan-Boltzmann law, 'f this may be expressed as:
= Kt (T24 - Tl4) (C3)
in which
W = watts per square inch of surface
K = 3. 68 X 10"11
c = emissivity factor
T2 = hot body temperature in absolute degrees
Tl = ambient or surrounding temperature in absolute degrees.
Transfer of heat by convection occurs when a body is hotter than the
surrounding medium, which usually is air. A thin layer of air in intimate
contact with the hot body is heated by conduction and expands, rising to take
the absorbed heat with it. The next layer being colder, replaces the risen
layer, and in turn on being heated also rises. This continues until all of the
medium surrounding the body is at the body temperature. Transfer of heat by
convection'1' is stated as:
W = KF6n N/-p- (C4)
in which:
W = watts loss per square inch
K = 1. 4 X 10"3
F = air friction factor (unity for a plane surface)
6 = temperature rise, degrees C
Reference 5
24
33-697, Rev. 1
p = relative barometric pressure (unity at sea level)
r\ = exponential value ranging from 1. 0 to 1. 25, depending on the shape
and position of the surface being cooled.
The total loss dissipated from a plane vertical surface is expressed by
the sum of equations (Cl) and (C8),
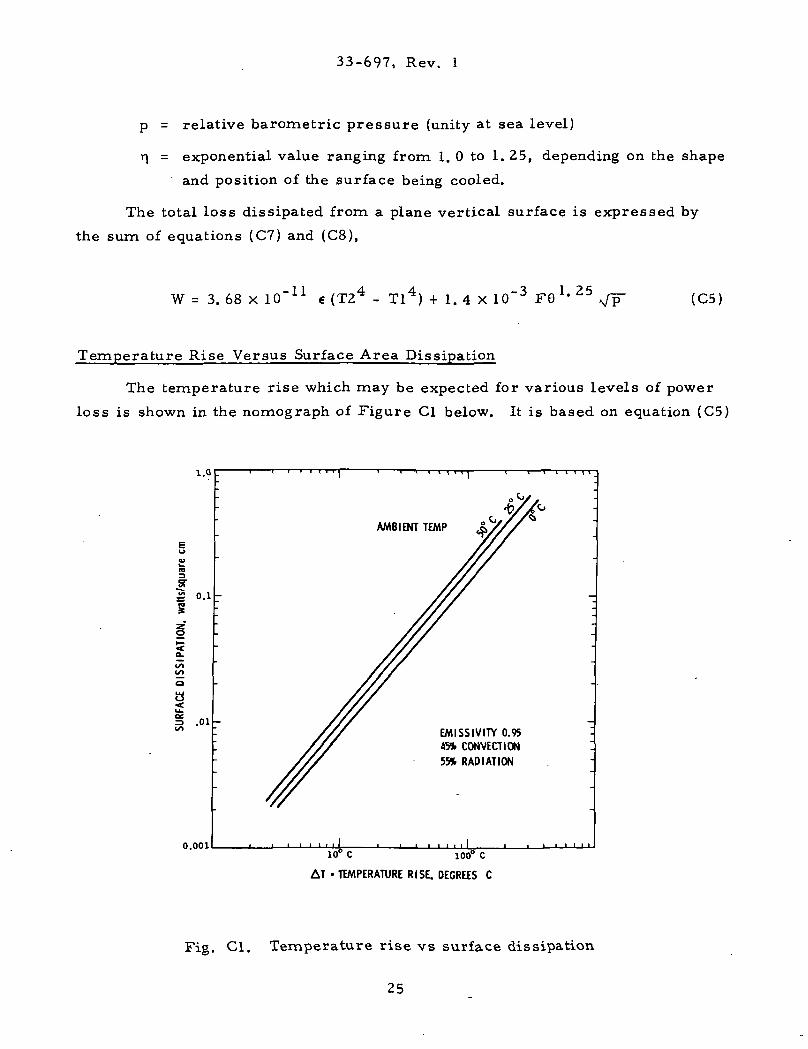
W = 3. 68X10" 1 1 € (T24 - Tl4) + 1. 4 X 10~3 FB1 ' 25 (C5)
Temperature Rise Versus Surface Area Dissipation
The temperature rise which may be expected for various levels of power
loss is shown in the nomograph of Figure Cl below. It is based on equation (C5)
i.o
o.i
a.
o
B.01
0.001
EMISSIVITY 0.95
45* CONVECTION
55% RADIATION
, I10° C 100° C
AT • TEMPERATURE RISE. DEGREES C
Fig. Cl. Temperature rise vs surface dissipation.
25
33-697, Rev. 1
relying on data obtained from Reference 5 for heat transfer effected by a
combination of 55% radiation and 45% convection, from surfaces having an
emissivity of 0. 95, in an ambient of 25°C, at sea level. Power loss (heat
dissipation) is expressed in watts/cm of total surface area. Heat dissipation
by convection from the upper side of a horizontal flat surface is on the order
of 15 to 20% more than from vertical surfaces. Heat dissipation from the
underside of a horizontal flat surface depends upon surface area and
conductivity.
Surface Area Required for Heat Dissipation
The effective surface area A required to dissipate heat (expressed as
watts loss per unit area) is:
(C6)
in which ^ is the power density or the average power lost per unit area of the
heat dissipating surface of the inductor and P^. is the total power lost or
dissipated.
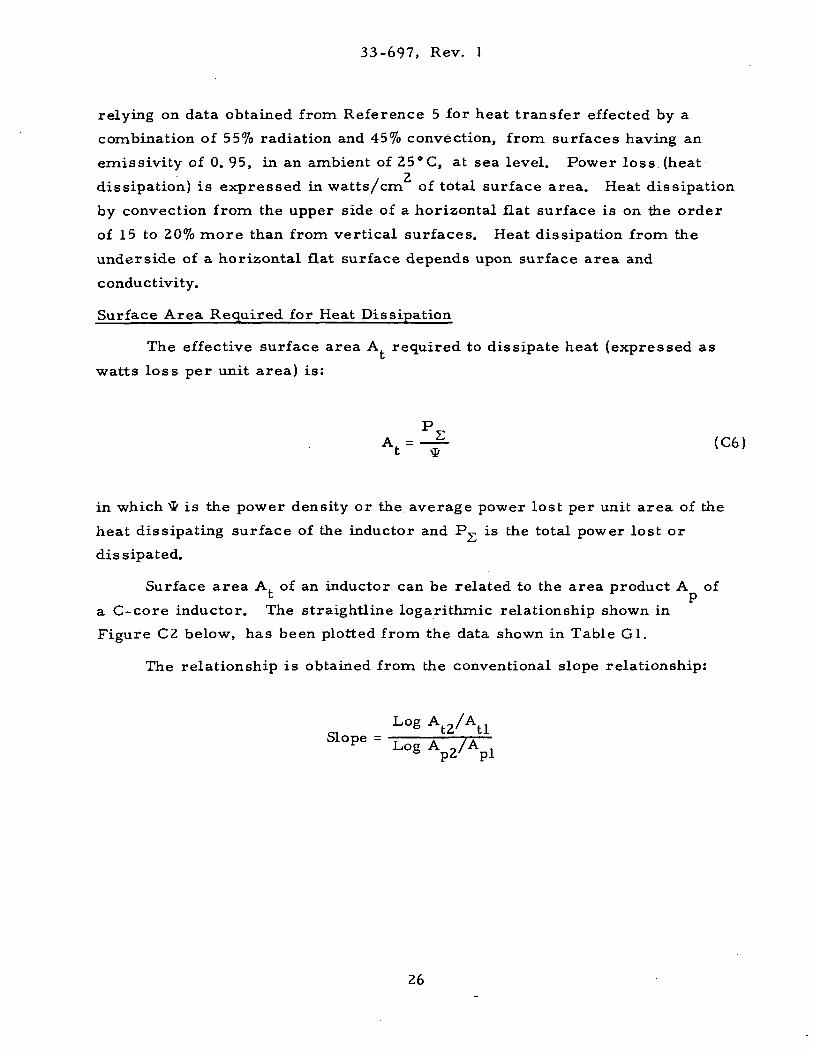
Surface area A of an inductor can be related to the area product A of
a C-core inductor. The straightline logarithmic relationship shown in
Figure C2 below, has been plotted from the data shown in Table Gl.
The relationship is obtained from the conventional slope relationship:
Slope =
26
33-697, Rev. 1
1000
100
<*"
o
10
ALCCORE
1.01 1 1 1 I I 1 1—I 1 I I I I ill0.01 O.I 1.0 10 100
AREA PRODUCT, A cm4
P
Fig. C2. Surface area vs area product A
1000
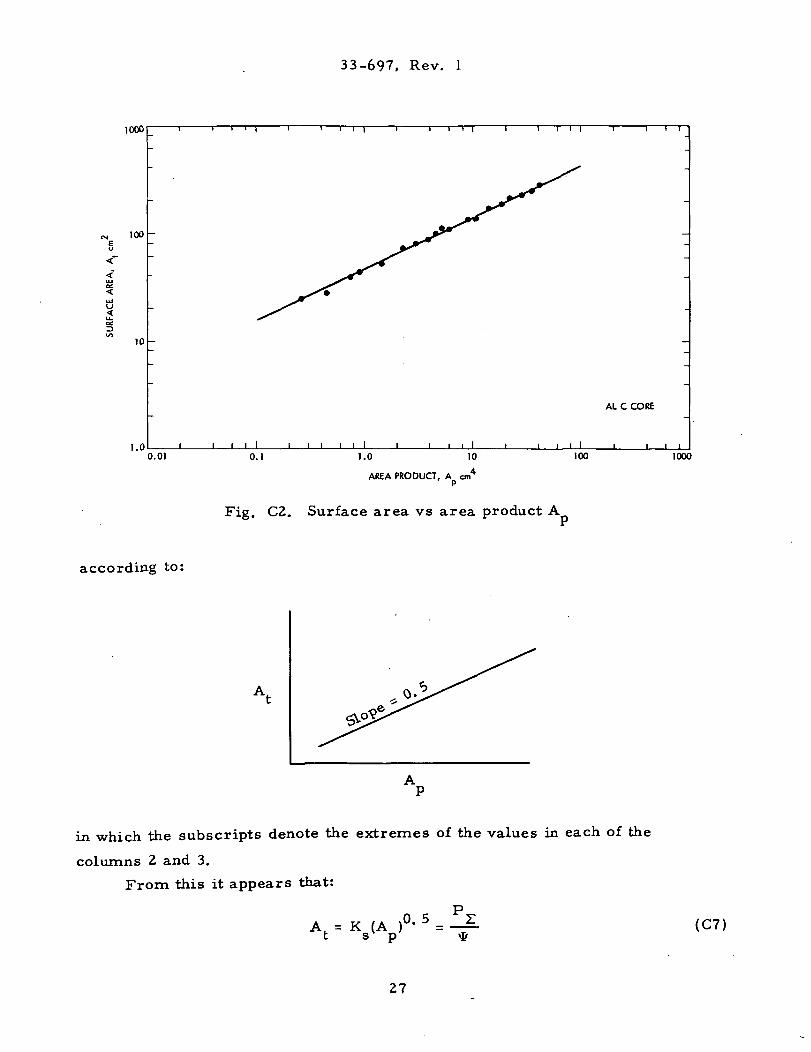
according to:
in which the subscripts denote the extremes of the values in each of the
columns 2 and 3.
From this it appears that:
A = K (A )t sx p'0. 5 _ PZ (C7)
27
33-697, Rev. 1
and that (from Fig. Cl)
V = 0. 03 W/cm @ 25°C rise
* = 0. 07 W/cm2 @ 50°C rise
in which the constant K has been derived empirically by averaging the datas
presented in Table Gl, columns 2 and 3. Column 3 was increased to account
for the gross area of the iron and K therefore is 44. 5.S
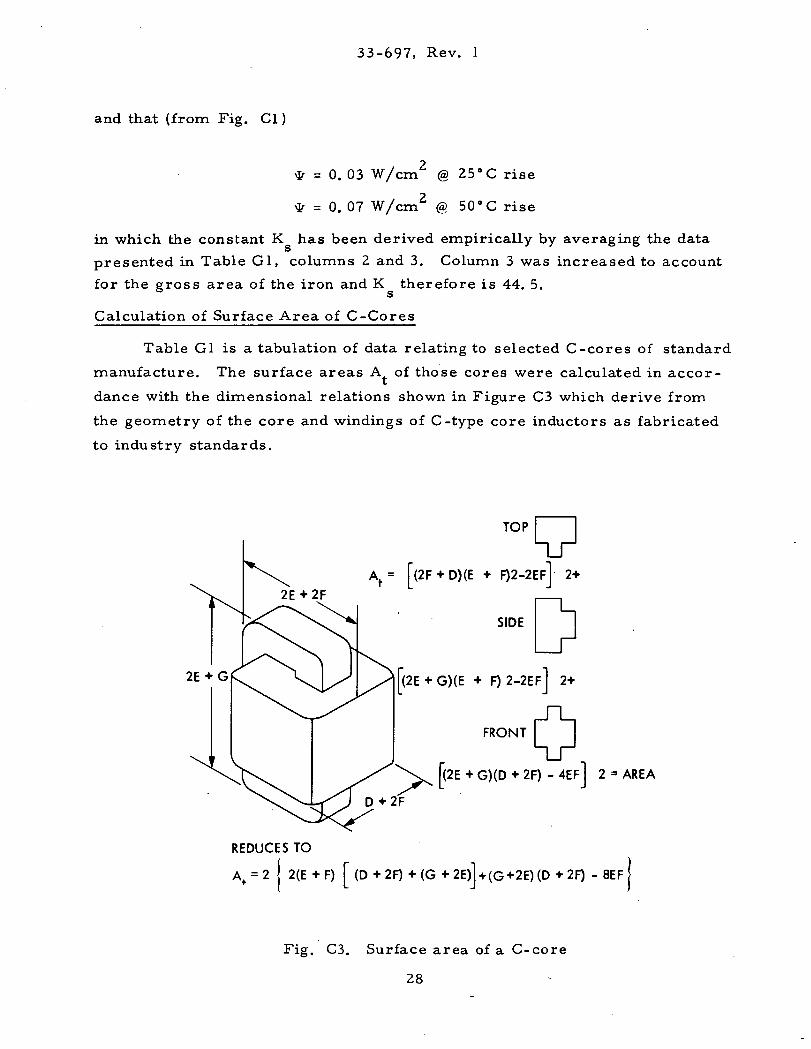
Calculation of Surface Area of C-Cores
Table Gl is a tabulation of data relating to selected C-cores of standard
manufacture. The surface areas A of those cores were calculated in accor-
dance with the dimensional relations shown in Figure C3 which derive from
the geometry of the core and windings of C-type core inductors as fabricated
to industry standards.
REDUCES TO
Af = 2 j 2(E H
TOP
.f = [(2F + D)(E + FJ2-2EFJ 2+
SIDE
F) 2-2EFJ 2+
FRONT
^\^ f(2E + G)(D + 2F) - 4EFJ 2 - AREA
- 8EF
Fig. C3. Surface area of a C-core
28
33-697, Rev. 1
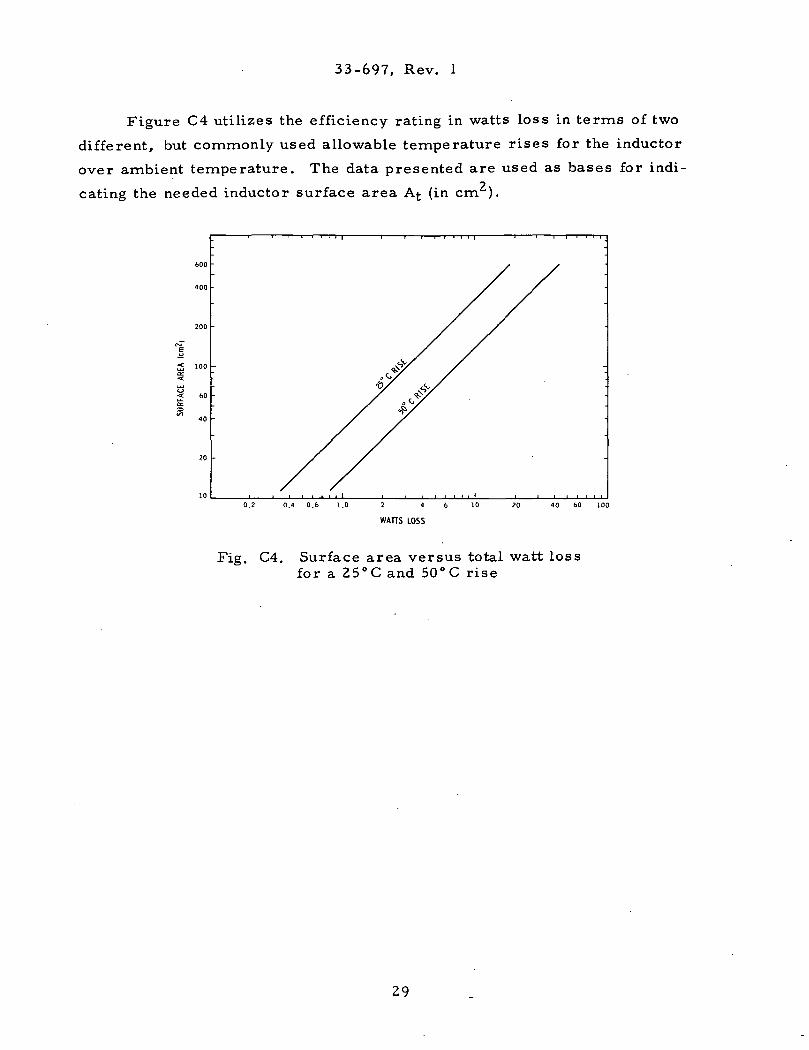
Figure C4 utilizes the efficiency rating in watts loss in terms of two
different, but commonly used allowable temperature rises for the inductor
over ambient temperature. The data presented are used as bases for indi-
cating the needed inductor surface area A^ (in cm ).
0.2 0.4 O.b 1.0 2 4 6 10
WAHS LOSS
20 40 60 100
Fig. C4. Surface area versus total watt lossfor a 25°C and 50° C rise
29
33-697, Rev. 1
APPENDIX D
INDUCTOR WEIGHT
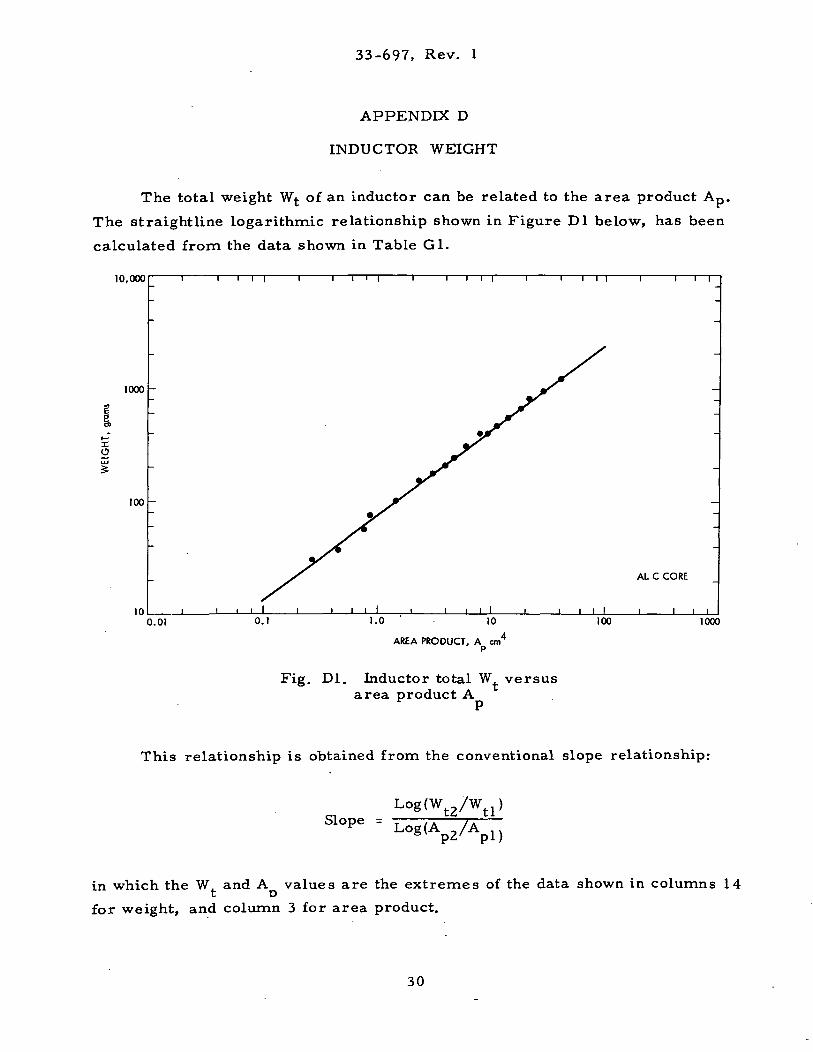
The total weight Wt of an inductor can be related to the area product Ap.
The straightline logarithmic relationship shown in Figure Dl below, has been
calculated from the data shown in Table Gl.
10,000
1000
rUJ
100
10 I I
AL C CORE
0.01 0.1 1.0 10 100 1000
AREA PRODUCT, A on4
P
Fig. Dl. Inductor total W. versusarea product A
This relationship is obtained from the conventional slope relationship:
S1°P6 = Log (A _/Ap2'"pl)
in which the W and A values are the extremes of the data shown in columns 14t D
for weight, and column 3 for area product.
30
33-697, Rev. 1
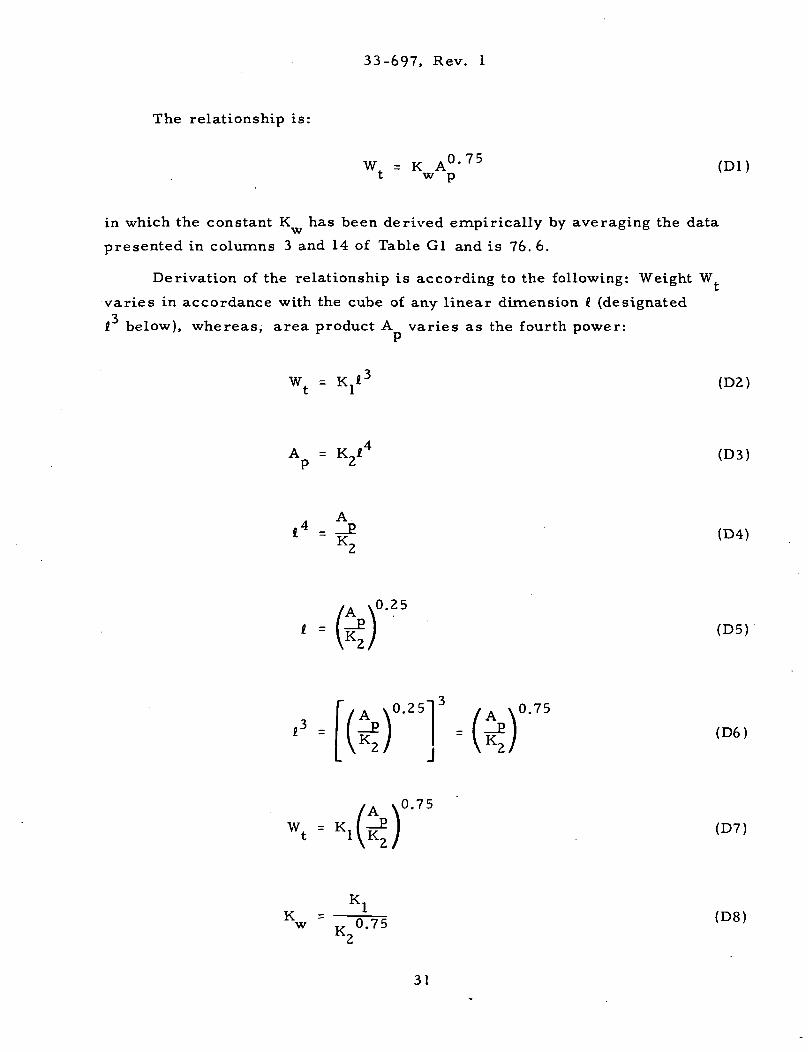
The relationship is:
Wf = K A0 '7 5
t w p(Dl)
in which the constant K has been derived empirically by averaging the data
presented in columns 3 and 14 of Table Gl and is 76. 6.
Derivation of the relationship is according to the following: Weight W
varies in accordance with the cube of any linear dimension I (designated3
i below), whereas, area product A varies as the fourth power:
W = (D2)
A = K_lP 2
(D3)
«4 =A
(D4)
1. - (D5)
0'25]0.75
(D6)
wt = KII (D7)
K
K lw " v 0.75
K2
(D8)
31
33-697, Rev. 1
(D9)
in which K, is a constant depending upon the core material, and K^ is related
to core and window dimensions.
32
33-697, Rev. 1
APPENDIX E
INDUCTOR VOLUME
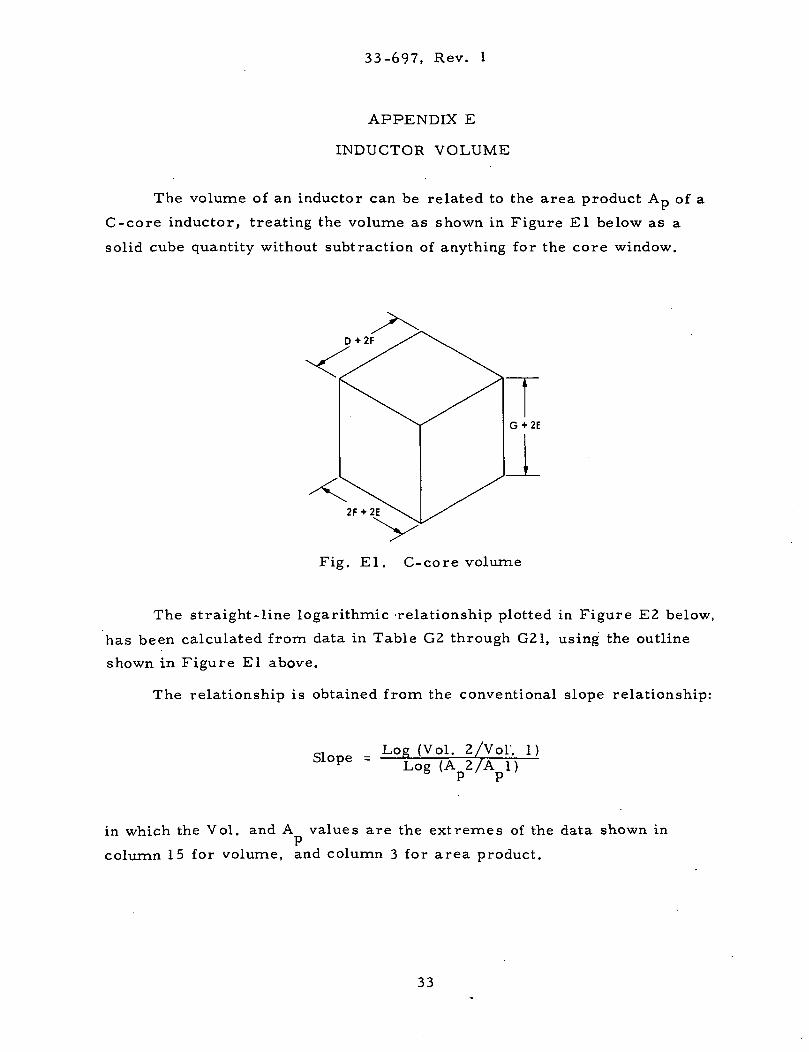
The volume of an inductor can be related to the area product Ap of a
C-core inductor, treating the volume as shown in Figure El below as a
solid cube quantity without subtraction of anything for the core window.
Fig. El. C-core volume
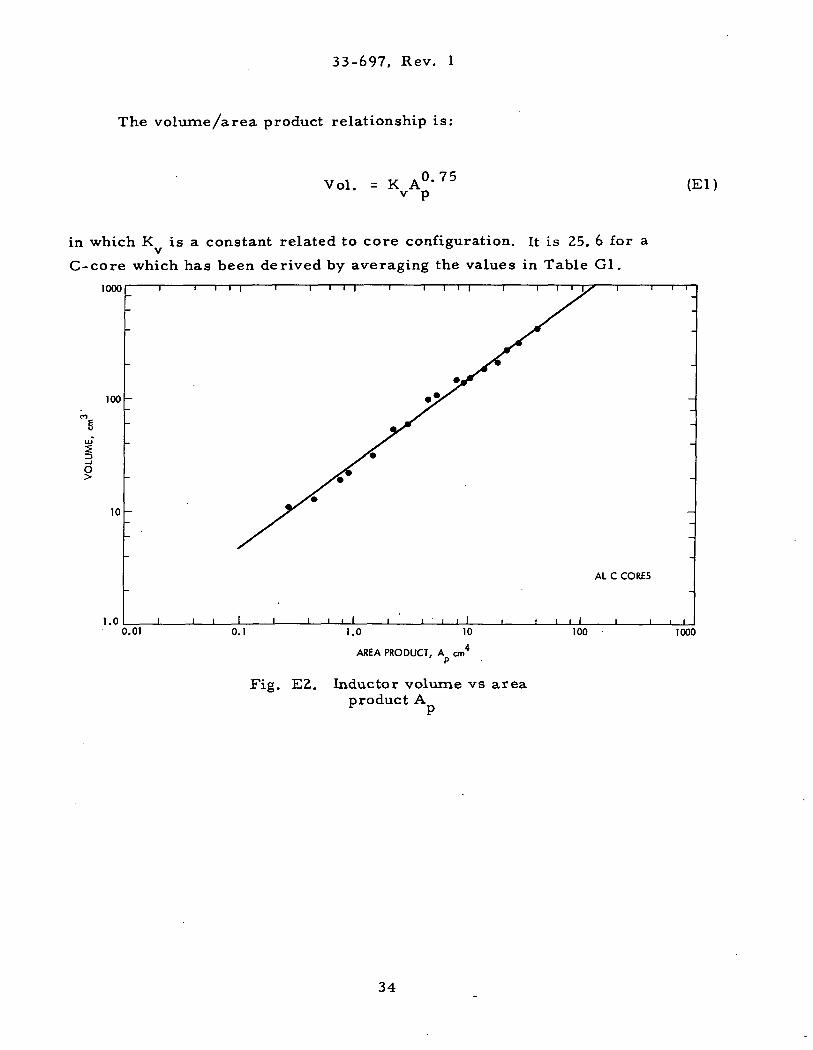
The straight-line logarithmic relationship plotted in Figure E2 below,
has been calculated from data in Table G2 through G21, using the outline
shown in Figure El above.
The relationship is obtained from the conventional slope relationship:
slone _ Log (Vol. 2/Vor. 1)P ' Log (Ap2/Apl)
in which the Vol. and A values are the extremes of the data shown inP
column 15 for volume, and column 3 for area product.
33
33-697, Rev. 1
The volume /area product relationship is:
Vol. = K A0 '75
v p (El)
in which K is a constant related to core configuration. It is 25. 6 for a
C-core which has been derived by averaging the values in Table Gl.
1000
100
o
10
1.00.01 0.1 1.0 10
AREA PRODUCT, A cmP
AL C CORES
100
Fig. E2. Inductor volume vs areaproduct A
1000
34
33-697, Rev. 1
APPENDIX F
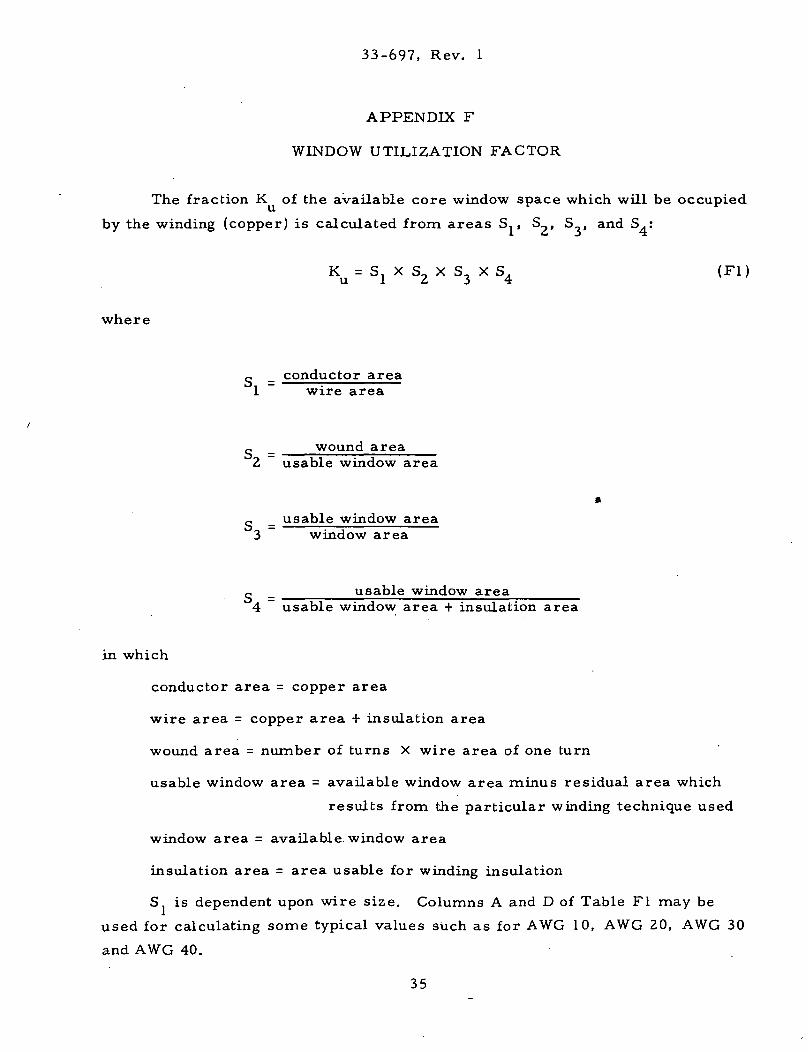
WINDOW UTILIZATION FACTOR
The fraction K of the available core window space which will be occupied
by the winding (copper) is calculated from areas S,, S , S , and S.:
K = S. X S_ X S. X S4 (Fl)
where
e _ conductor area1 ~ wire area
wound area2 usable window area
,., _ usable window area3 ~ window area
usable window area4 usable window area + insulation area
in which
conductor area = copper area
wire area = copper area + insulation area
wound area = number of turns X wire area of one turn
usable window area = available window area minus residual area which
results from the particular winding technique used
window area = available, window area
insulation area = area usable for winding insulation
S is dependent upon wire size. Columns A and D of Table Fl may be
used for calculating some typical values such as for AWG 10, AWG 20, AWG 30
and AWG 40.
35
33-697, Rev. 1
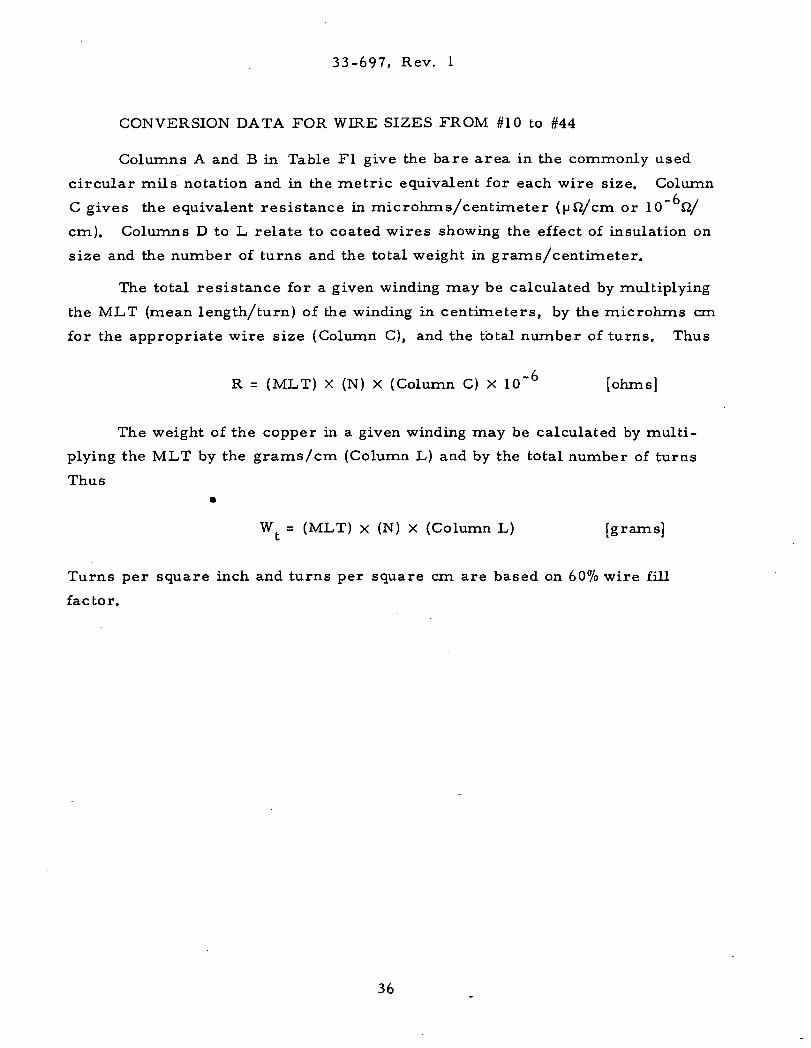
CONVERSION DATA FOR WIRE SIZES FROM #10 to #44
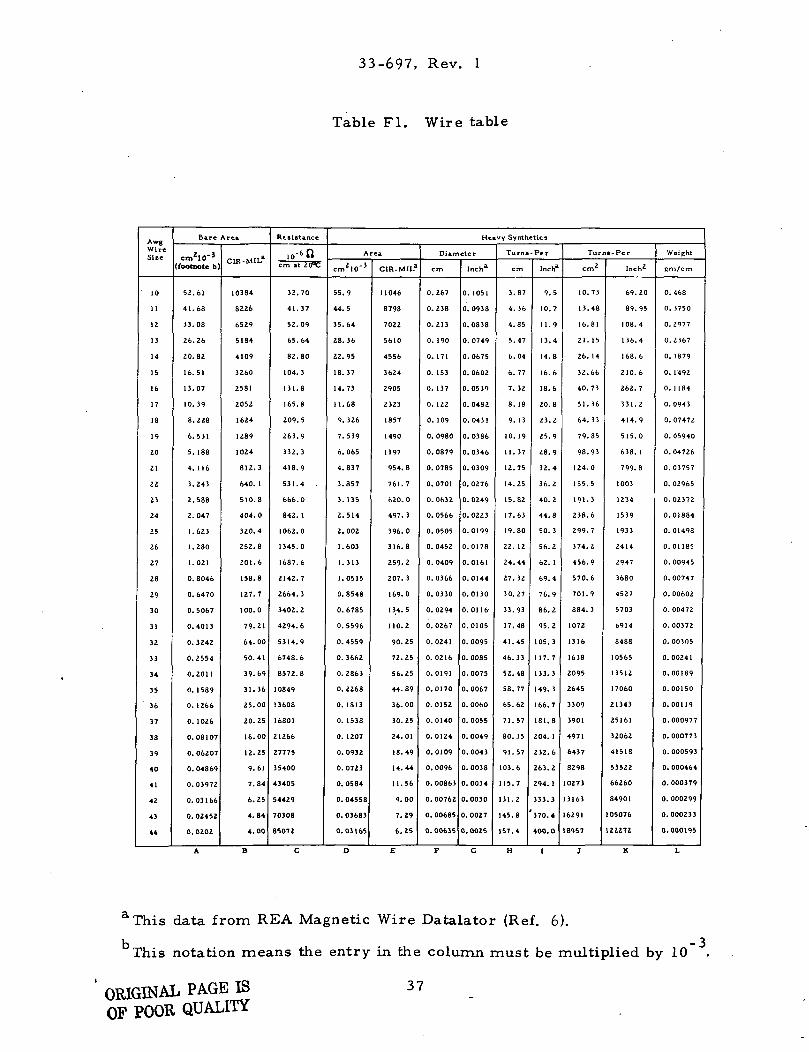
Columns A and B in Table Fl give the bare area in the commonly used
circular mils notation and in the metric equivalent for each wire size. Column
C gives the equivalent resistance in microhms/centimeter (yft/cm or 10" Q/
cm). Columns D to L relate to coated wires showing the effect of insulation on
size and the number of turns and the total weight in grams/centimeter.
The total resistance for a given winding may be calculated by multiplying
the ML/T (mean length/turn) of the winding in centimeters, by the microhms cm
for the appropriate wire size (Column C), and the total number of turns. Thus
R = (MLT) X (N) X (Column C) X 10"6 [ohms]
The weight of the copper in a given winding may be calculated by multi-
plying the MLT by the grams /cm (Column L) and by the total number of turns
Thus•
Wfc = (MLT) X (N) X (Column L) [grams]
Turns per square inch and turns per square cm are based on 60% wire fill
factor.
36
33-697, Rev. 1
Table Fl. Wire table
AwgWireSize
' 10
11
12
13
14
15
16
17
18
19
20
21
22
23
24
25
26
27
28
29
30
31
32
33
34
35
36
37
38
39
40
41
42
43
44
Bare Area
cm210"3
(footnote b
52.61
41.68
33.08
26.26
20.82
16.51
13.07
10.39
8.228
6.531
5.188
4. 116
3.243
2.588
2.047
1.623
1.280
1.021
0. 8046
0.6470
0.5067
0.4013
0.3242
0.2554
0.2011
0. 1589
0. 1266
0. 1026
0.08107
0. 06207
0.04869
0.03972
0.03166
0.02452
0.0202
CIB-MIL"
10384
8226
6529
5184
4109
3260
2581
2052
1624
1289
1024
812.3
640. 1
510.8
404.0
320.4
252.8
201.6
158.8
127.7
100.0
79.21
64.00
50.41
39.69
31.36
25.00
20.25
16.00
12.25
9.61
7.84
6.25
4.84
4.00
Resistance
IQ-* ncm at 20"C
32.70
41.37
52.09
65.64
82.80
104.3
131.8
165.8
209.5
263.9
332.3
418.9
531.4 .
666.0
842. 1
1062.0
1345.0
1687.6
2142.7
2664.3
3402.2
4294.6
5314.9
6748.6
8572.8
10849
13608
16801
21266
27775
35400
43405
54429
70308
85072
Heavy Synthetics
Area
cm210"J
55.9
44.5
35.64
28.36
22.95
18.37
14.73
11.68
9.326
7.539
6.065
4.837
3.857
3.135
2.514
2.002
1.603
1.313
1.0515
0.8548
0.6785
0.5596
0.4559
0.3662
0.2863
0.2268
0. 1813
0. 1538
0. 1207
0.0932
0.0723
0. 0584
0.04558
0.03683
0.03165
CIR-MIL"
11046
8798
7022
5610
4556
3624
2905
2323
1857
1490
1197
954.8
761.7
620.0
497.3
396.0
316.8
259.2
207.3
169.0
134.5
110.2
90.25
72.25
56.25
44.89
36.00
30.25
24.01
18.49
14.44
11.56
9.00
7.29
6.25
Diameter
cm
0.267
0.238
0.213
0. 190
0. 171
0. 153
0. 137
0. 122
0. 109
0. 0980
0.0879
0.0785
0.0701
0.0632
0. 0566
0. 0505
0. 0452
0. 0409
0. 0366
0.0330
0.0294
0.0267
0.0241
0.0216
0.0191
0.0170
0.0152
0.0140
0.0124
0.0109
0.0096
0. 00863
0.00762
0. 00685
0.00635
Inch"
0. 1051
0. 0938
0.0838
0. 0749
0.0675
0.0602
0.0539
0.0482
0.0431
0. 0386
0.0346
0.0309
0.0276
0.0249
0.0223
0.0199
0.0178
0.0161
0.0144
0.0130
0.0116-
0.0105
0. 0095
0. 0085
0.0075
0.0067
0. 0060
0. 0055
0.0049
0.0043
0.0038
0.0034
0.0030
0. 0027
0.0025
Turns. Per
cm
3.87
4. 16
4.85
5.47
6.04
6.77
7. 32
8.18
9. 13
10. 19
11.37
12.75
14.25
15.82
17.63
19.80
22. 12
24.44
27.32
30.27
33.93
37.48
41.45
46.33
52.48
58.77
65.62
71.57
80.35
91.57
103.6
115.7
131.2
145.8
157.4
Inch3
9.5
10.7
11.9
13.4
14.8
16.6
18.6
20.8
23.2
25.9
28.9
32.4
36.2
40.2
44.8
50.3
56.2
62. 1
69.4
76.9
86.2
95.2
105.3
117.7
133.3
149.3
166.7
181.8
204. 1
232.6
263.2
294.1
333.3
370.4
400.0
Turns-Per
cm'
10.73
13.48
16.81
21.15
26. 14
32.66
40.73
51.36
64.33
79.85
98.93
124.0
155.5
191.3
238.6
299.7
374.2
456.9
570.6
701.9
884.3
1072
1316
1638
2095
2645
3309
3901
4971
6437
8298
10273
13163
6291
8957
Inch2
69.20
89.95
108.4
136.4
168.6
210.6
262.7
331.2
414.9
515.0
638. 1
799.8
1003
1234
1539
1933
2414
2947
3680
4527
5703
6914
8488
10565
13512
17060
21343
25161
32062
41518
53522
66260
84901
105076
122272
Weight
cm/cm
0.468
0. 5750
0.2977
0.2367
0. 1879
0. 1492
0. 1 184
0.0943
0.07472
0.05940
0.04726
0.03757
0.02965
0.02372
0.01884
0.01498
0.01185
0. 00945
0.00747
0.00602
0.00472
0.00372
0.00305
0.00241
0.00189
0.00150
0.00119
0.000977
0. 000773
0.000593
0. 000464
0. 000379
0. 000299
0.000233
0.000195
aThis data from REA Magnetic Wire Datalator (Ref. 6).
This notation means the entry in the column must be multiplied by 10
37
-3
' ORIGINAL PAGE ISOF POOR QUALITY
33-697, Rev. 1
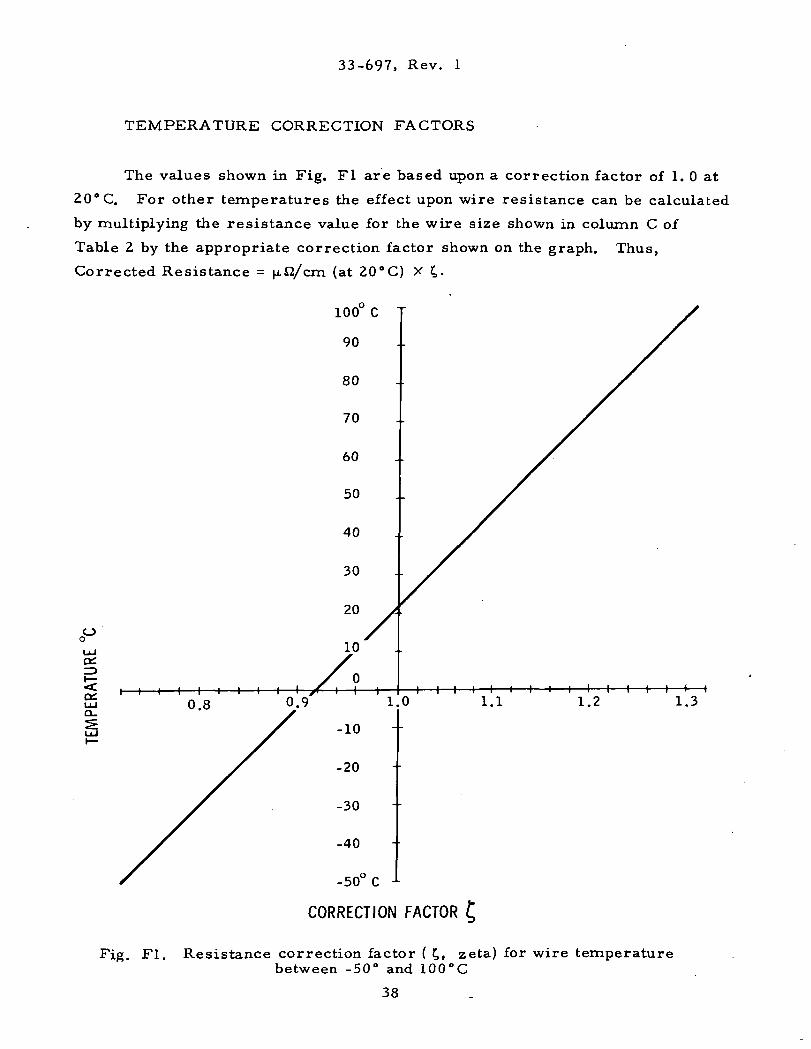
TEMPERATURE CORRECTION FACTORS
The values shown in Fig. Fl are based upon a correction factor of 1. 0 at
20° C. For other temperatures the effect upon wire resistance can be calculated
by multiplying the resistance value for the wire size shown in column C of
Table 2 by the appropriate correction factor shown on the graph. Thus,
Corrected Resistance = ^J2/cm (at 20°C) X £,.
100° C
0°
o;LUO.
CORRECTION FACTOR
Fig. Fl. Resistance correction factor ( t,, zeta) for wire temperaturebetween -50° and 100°C
38
33-697, Rev. 1
Thus:
AWG 10. . 0.941;
AWG 2° • - °- 855 ;
AWG 3 0.
AW«- An 0. 04869 cm2 n ,_,AWG 40 = = 0. 673
S_ is the fill factor for the usable window area. It can be shown that for^ 2
circular cross-section wire wound on a flat form that the ratio of wire cm to
the area required for the turns can never be greater than 0. 91. In practice,
the actual maximum value is dependent upon the tightness of winding, variations
in insulation thickness, and wire lay. Consequently, the fill factor is always
less than the theoretical maximum.
As a typical working value for copper wire with a heavy synthetic film
insulation, a ratio of 0. 60 may be safely used.
The term S_ defines how much of the available window space may
actually be used for the winding. The winding area available to the designer
depends on the bobbin configuration. A single bobbin design offers an effective
W between 0. 835 to 0. 929 while a two bobbin configuration offers an effective3.
W between 0. 687 to 0. 872. A good value to use for both configurations is 0. 75.ct
The term S. can vary from 1. 0 to 0. 80 and defines how much of the usable
window space is actually being used for insulation. If the transformer has
multiple secondaries having significant amounts of insulation S . could be as low
as 0. 8.
A typical value for the copper fraction in the window area is about 0. 40.
For example, for AWG 20 wire, Sj X S2 X S3 X S4 = 0. 855 X 0. 60 X 0. 75 X
1 . 0 = 0. 385, which is very close to 0. 4.
39
33-697, Rev. 1
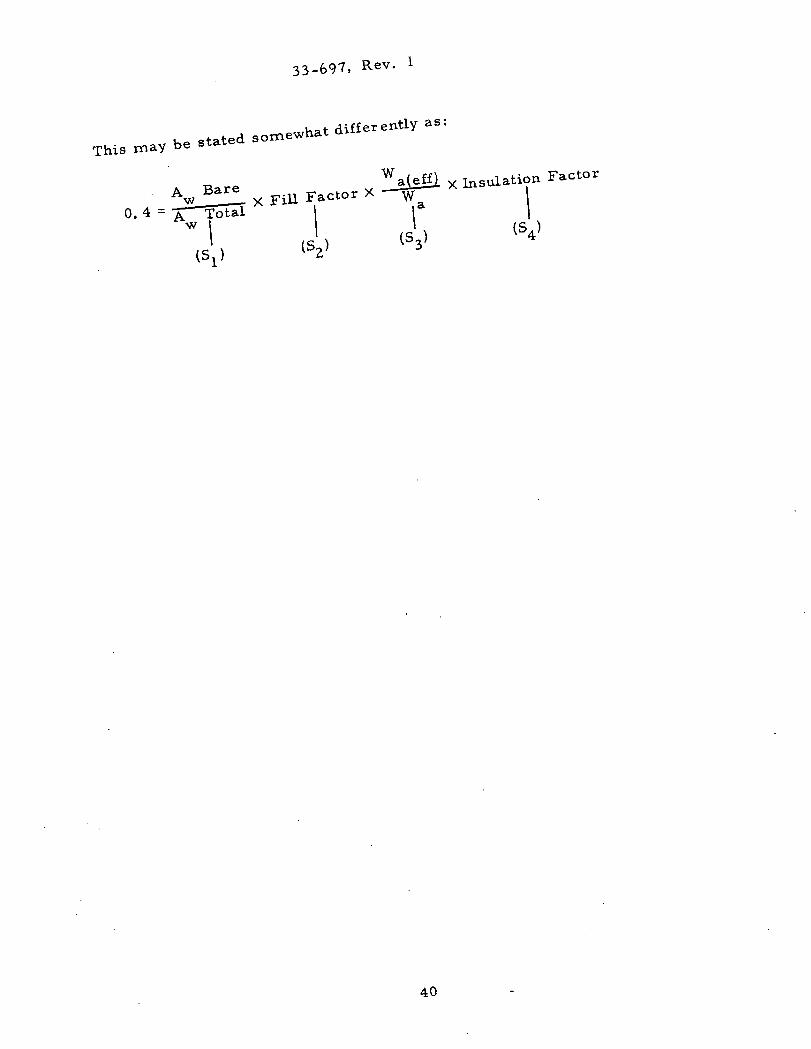
v,_v differently as:
X Insulation Factorx Fill Factor ^
a0 . 4 = - £ Total " I Iw i 1 1 (SA)I /c \ ^4'
,c ) v&3' *(S,) ib2J
40
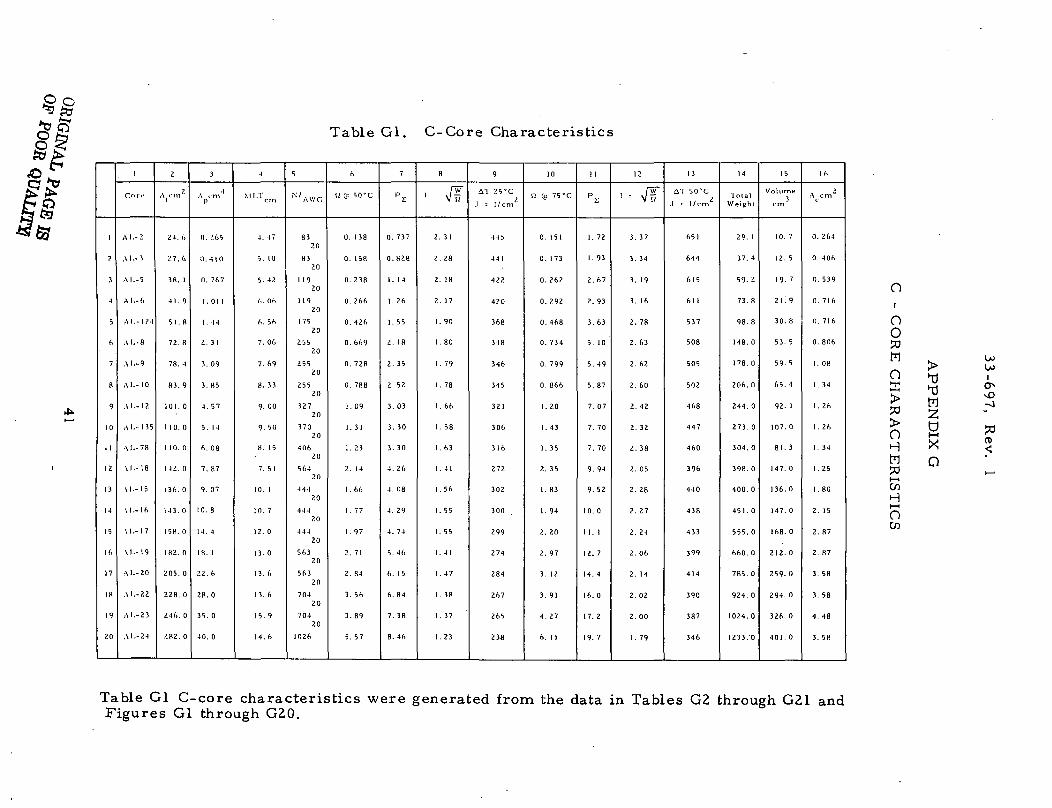
Table Gl. C-Core Characteristics
1
?
3
4
5
6
7
a
9
10
1 1
12
13
u
15
16
17
18
19
20
1
Or,
A I . - 2
A I . - 3
A I . - 5
AI . -6
A l . - l ? 4
A I.- 8
AI.-9
A l . - I O
A I . - I 2
A L - 1 3 5
\ l - -78
A l - 1 8
M . - I 5
\1-16
X 1 . - I 7
\ I - I 9
A I - - 2 0
A I . - 2 2
A I . - 2 3
A I . - 2 4
2
A,cm?-
2-1. h
27.6
38. 1
• 4 1 . 9
5 1 . 8
72. B
78. -1
83.9
1 0 1 . 0
1 10. 0
1 10. 0
142. 0
136.0
143 . 0
I 5 H . 0
182. 0
205. 0
228. 0
246. 0
2K2 . 0
3
A ,m4
l>
0. 265
(1.410
0. 767
1. 01 1
1. 44
2. 31
3. 09
3.85
4. 57
5. 14
h. 08
7.87
9. 07
10. 8
14. 4
18. 1
22 .6
28.0
35. 0
40. 0
4
Ml.Tcm
4. 47
5. 10
5. 42
h. Oh
6. 56
7. 06
7. 69
8. 33
9. 00
9. 50
8. 15
7. 51
10. 1
10. 7
12. 0
13. 0
13 .6
13 .6
15. 9
• 1 4 . 6
5
N ' A W G
8320
8320
1 1920
1 1920
17520
25520
25520
25520
32720
37020
40620
56420
4 4 420
44420
44420
56320
56320
70420
70420
1026
6
17 (r. 50 "C
0. 138
0. 158
0. 238
0. 266
0. 426
0. 669
0. 728
0. 788
1. 09
1 . 3 1
1. 23
2. 14
1. 66
I . 77
1. 97
2. 71
2. 84
3.56
3.89
5. 57
7
P E
0. 737
0.828
1 . 1 4
1 . 2 6
1. 55
2. 18
2. 35
2. 52
3 .03
3. 30
3. 30
4. 26
4. 08
4. 29
4. 74
5 .46
6. 15
6.84
7. 38
8. 46
8
I f^1 VU
2. 31
2.28
2. 18
2. 17
1. 90
1. 80
1. 79
1. 78
1. 66
1. 58
1 . 6 3
1. 41
1. 56
1. 55
1. 55
1 . 4 1
1. 47
1. 38
1. 37
1. 23
9
A'l 25 "C
.1 = I / c m 2
445
441
422
4?0
368
348
346
345
321
306
316
272
302
300
299
274
284
267
265
238
10
a (S 75 'C
0. 151
0. 173
0. 26?
0. 2.92
0.468
0. 734
0. 799
0. 866
1. 2.0
1 . 4 3
1. 35
2. 35
1. 83
1. 94
2. 20
2. 97
3. 1?
3. 91
4 . 2 7
6 . I I
1 1
Pv
1. 72
1. 93
2 . 6 7
?.. 93
3 .63
5. 10
5. 49
5. 87
7. 07
7. 70
7. 70
9. 94
9. 52
10. 0
1 1. 1
12. 7
14. 4
16.0
17. 2
19. 7
12
, f£"1 = V 17
3. 37
3. 34
3. 19
3. 16
2. 78
2 . 6 3
2. 62
2. 60
2. 42
2. 32
2 .38
2. 05
2 .28
2. 27
2. 24
2. 06
2. 14
2. 02
2. 00
1. 79
13
<yi 50"c.1 = I / c m 2
651
644
615
61 1
537
508
505
502
468
447
460
396
440
438
433
399
4 1 4
390
387
346
14
' I n l a lWs igh l
29. 1
37. 4
59.2
73.8
98.8
148. 0
178. 0
206. 0
244 . 0
273. 0
304. 0
398. 0
400. 0
4 5 1 . 0
555. 0
660. 0
785. 0
924. 0
1024.0
1233. 0
15
Volume3cm
10. 7
12. 5
19. 7
Z \ . 9
30.8
53. 5
59. 5
6 5 . 4
92. 1
107. 0
81. 3
147. 0
136. 0
147. 0
168. 0
212. 0
259. 0
294. 0
326.0
401. 0
16
A cm"c
0. 264
0. 406
0. 539
0. 716
0. 716
0. 806
1. 08
1. 34
1. 26
1. 26
1. 34
1. 25
1. 80
2. 15
2. 87
2. 87
3. 58
3. 58
4. 48
3. 58
O1
o0frlIE
C
HA
RA
C
HH
HO
AP
PE
ND
!
XO
boOJI
NO
Table Gl C-core characteristics were generated from the data in Tables G2 through G21 andFigures Gl through G20.
33-697, Rev. 1
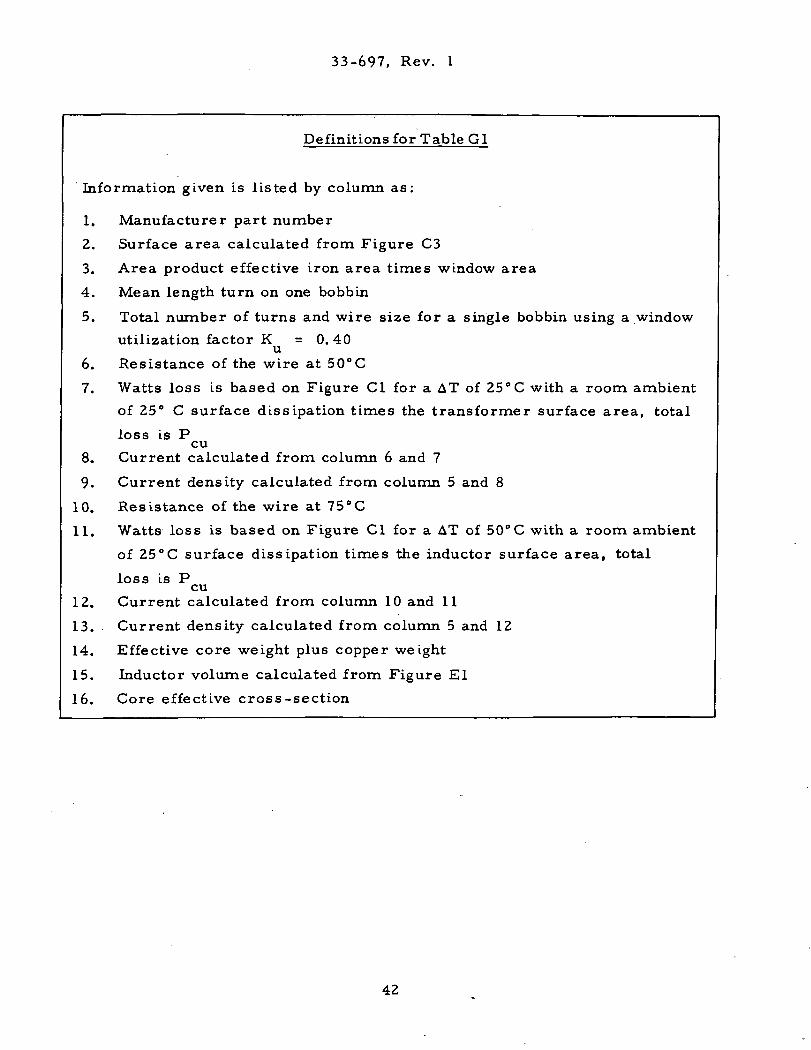
Definitions for Table G1
Information given is listed by column as:
1. Manufacturer part number
2. Surface area calculated from Figure C3
3. Area product effective iron area times window area
4. Mean length turn on one bobbin
5. Total number of turns and wire size for a single bobbin using a window
utilization factor K =0. 40u
6. Resistance of the wire at 50°C
7. Watts loss is based on Figure Cl for a AT of 25 °C with a room ambient
of 25° C surface dissipation times the transformer surface area, total
loss is Pcu
8. Current calculated from column 6 and 7
9. Current density calculated from column 5 and 8
10. Resistance of the wire at 75°C
11. Watts loss is based on Figure Cl for a AT of 50°C with a room ambient
of 25°C surface dissipation times the inductor surface area, total
loss is Pcu12. Current calculated from column 10 and 11
13. Current density calculated from column 5 and 12
14. Effective core weight plus copper weight
15. Inductor volume calculated from Figure El
16. Core effective cross-section
42
33-697, Rev. 1
C CORE AND BOBBIN MAGNETIC AND DIMENSIONALSPECIFICATION
A. Definitions for Tables G2 through G21
*Tables G2 through G21 show magnetic and dimensional specifications for
twenty C cores. Information given is listed by line as:
1 Manufacture and part number
2 Units
3 Ratio of the window area over the iron area
4 Product of the window area times the iron area
5 Window area Wa gross
6 Iron area Ac effective
7 Mean magnetic path length 1m
8 Core weight of silicon steel multiplied by the stacking factor
9 Copper weight single bobbin
10 Mean length turn
11 Ratio of G dimension divided by the square root of the iron area (Ac)
12 Ratio of the Wa eff/Wa
13 Inductor overall surface area A^
14-17 "C" core dimensions## +
18 Bobbin manufacturer and part number
19 Bobbin inside winding length
20 Bobbin inside build
21 Bobbin winding area length times build
22 Bracket manufacturer and part number''"''
B. Nomographs for 20 C core sizes •
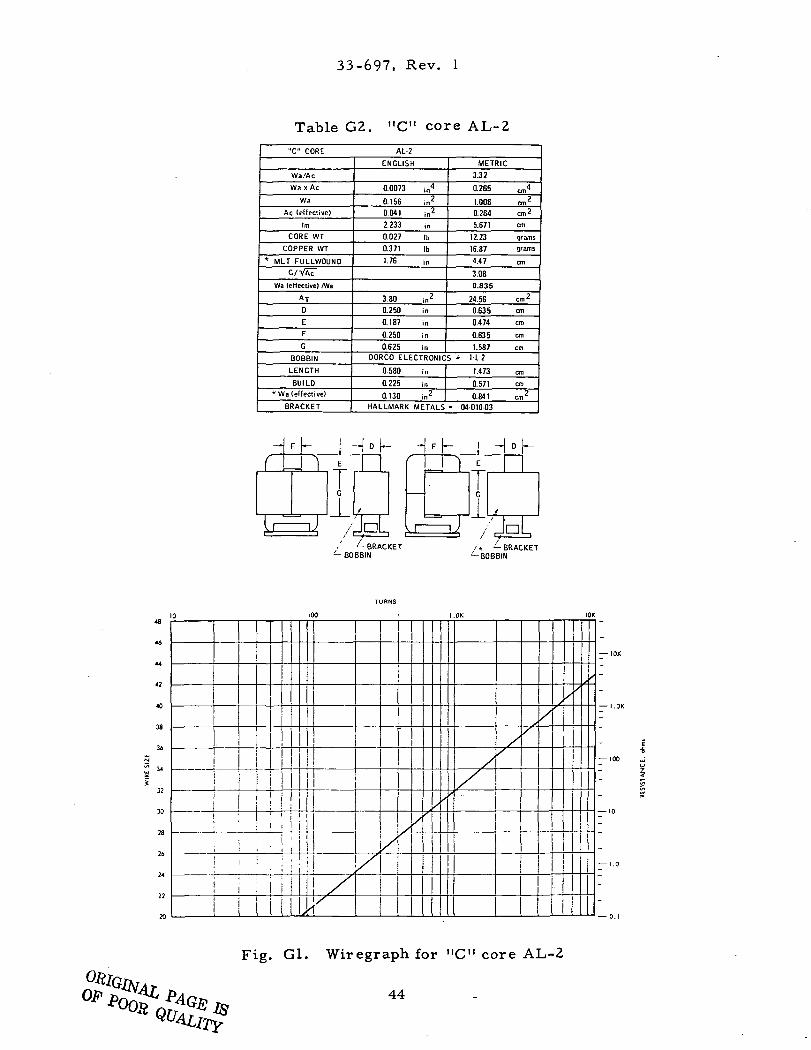
Figures Gl through G20 are graphs for 20 different "C" cores. The
nomographs display resistance, number of turns, and wire size at a fill factor
of K2 = 0.60. These graphs are included to provide a close approximation for
breadboarding purposes.
*References 7, 8
P The first number in front of the part number indicates the number of bobbins.'Dorco Electronics, 15533 Vermont Ave. , Paramount, Calif. 90723.
^Hallmark Metals, 610 West Foothill Blvd. , Glendora, Calif. 91740.
43
33-697, Rev. 1
Table G2. "C" core AL-2
"C" CORE AL-2
Wa/Ac
Wa x Ac
Wa
Ac (effective)
Im
CORE WT
COPPER WT
* MLT FULLWOUND
G/VAc
Wa (effective) /Wa
AT0
E
F
G
BOBBIN
LENGTH
BUILD*Wa (effective)
BRACKET
ENGLISH
0.0073 in4
0.156 in2
0.04) in2
£233 in
0.027 Ib
0.371 Ib
1.76 in
3-80 in2
0.250 in
0.187 in
0.250 in
0.625 in
METRIC
3.32
0.265 cm4
1.006 cm2
0.264 cm 2
5.671
12.23
16.87
4.47
cm
gramsgrams
cm
3.08
0.835
24.56
0.635
0.474
0.635
1.587
cm 2
cm
cm
cm
cmOORCO ELECTRONICS « 1-L-2
0.580 in
0.225 in
0.130 in2
1.473
0.571
0.841
cm
cm
cm2
HALLMARK METALS * 04-010-03
48
46
44
42
40
38
36
34
32
30
28
26
24
22
0
M M
ii — \)
100
' ! 1
f-
(
'11
/JpL
/
^ r
1 1 )
— J/ t- BRACKET
— BOBBIN
TURNS
I.OK
I!iJ
i • i i !i
I
t
/\
/!/
/•/
A/ /
,_
*BCIB
Jo- BRACKETBIN
/xX
>
IOK
/
/
11
I
i/^
i
Fig. Gl. Wiregraph for "C" core AL-2
44
33-697, Rev. 1
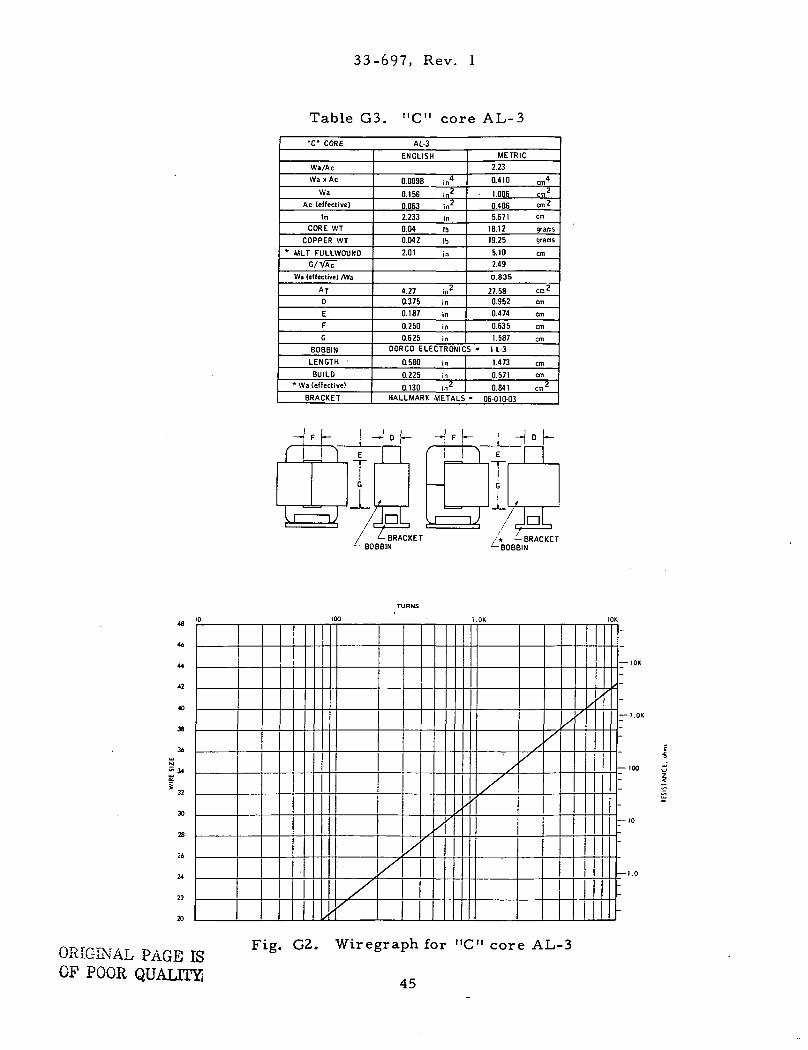
Table G3. "C" core AL-3
"C" CORE AL-3
Wa/Ac
Wax Ac
Wa
Ac (effective)
ImCORE WT
COPPER WT
* MLT FULLWOUND
G/VAc
Wa (effective) /Wa
ATD
Ef
G
BOBBIN
LENGTH
BUILD*Wa (effective)
BRACKET
ENGLISH
0.0098
0.156
0.063
2.233
0.04
0.042
2.01
. 4in
in*•
in
IbIb
in
4.27
0.375
0.187
0.250
0.625
in*in
in
in
in
METRIC
2.23
0.410 cm"
- 1.006 cm2
0.4065.671
18.12
19.25
5.10
cm^
cm
gramsgrams
cm2.49
0.83S
27.580.952
0.474
0.635
1.587
cm
cm
cm
cm
cmOORCO ELECTRONICS » 1-L-3
0.580
0.225
0.130HALLMARK
in
in
in2
1.473
0.571
0.841
METALS * 06-010-03
cmcm
cm2
r i n(
1 I
t
H
/ <- BRACKET^ BOBBIN
s.i~
i }
— iJ
E
T
G
Ac
I
OsL— BRACKET
JBBIN
46
44
42
40
38
36
N"> 34UJ
f32
X
28
26
24
22
20 /'
//
/
/
/
/
/
/
^ *
/
/
/
/
/
//
-
— IOK
-
-
— I. OK
-
— 100
:-— 10
~
— 1.0
:-
ORIGINAL PAGE ISOF POOR QUALITY!
Fig. G2. Wiregraph for "C" core AL-3
45
33-697, Rev. 1
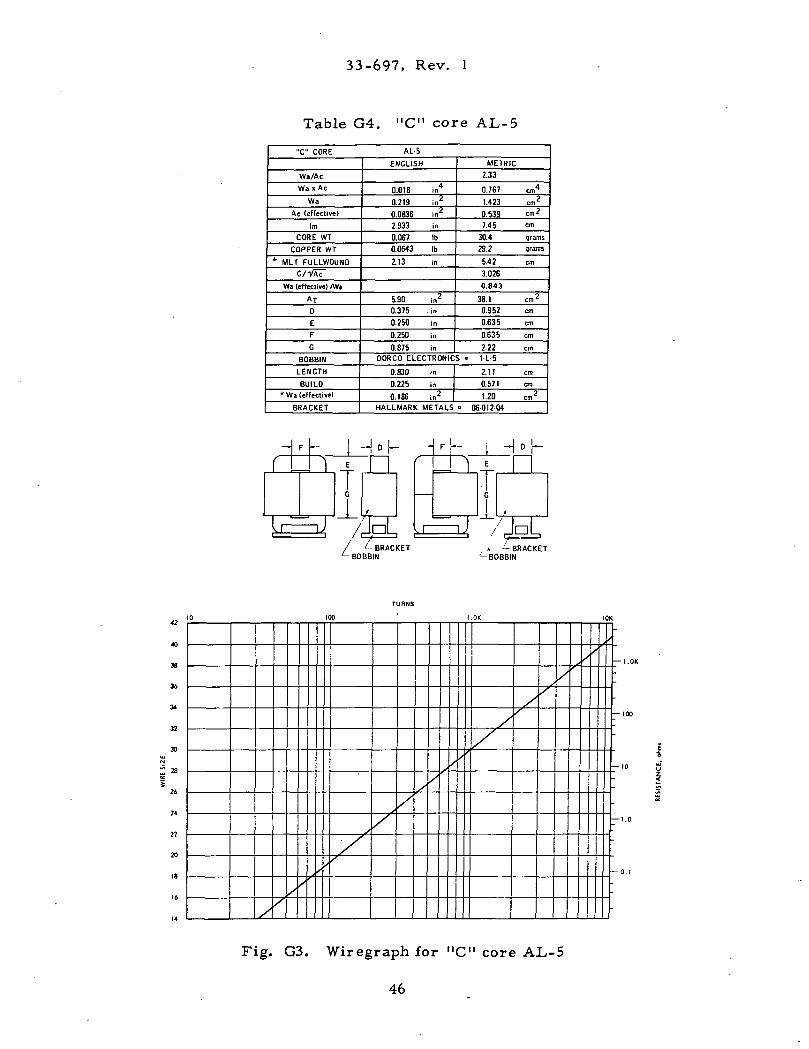
Table G4. "C" core AL-5
"C" CORE AL-5
Wa/Ac
Wa x Ac
Wa
Ac (effective)
Im
CORE WT
COPPER WT
* MLT FULLWOUNDG/VAV
Wa (effective) /Wa
ATD
E
F
G
BOBBIN
LENGTH
BUILD* Wa (effective)
BRACKET
ENGLISH
0.018 in4
0.219 in2
0.0836 in2
2.933 in
0.067 Ib0.0643 Ib
2.13 in
5.90 in2
0.375 in
0.250 in
0.250 in
0.875 in
METRIC2.33
0.767
1.423
0.5397.45
30.4
29.2
5.42
en,"
cm2
cm?cm
grams
grams
cm
3.026
0.843
38.1
0.952
0.635
0.635
2.22
cm 2
cm
cm
cm
cmDORCO ELECTRONICS « l-L-5
0.830 in
0.225 in
0.186 in2
2.1J
0.571
1.20
cm
cm
cm2
HALLMARK METALS « 06-012-04
r i n
LI — iJ
— i( I
|
f
/¥*/ 1- BRACKET^- BOBBIN
—
v i
F|~ i H<>h1 )
=nJ
E
G
/
| |
f
'JaL,t — BRACKET
"^BOBBIN
40
38
36
34
32
30
28
26
24
22
20
18
16
14 /
/
//
,
S
/S
/
/
//
/
/
/
/f
/
/
/
-
— I.OK
;-— 100
•
— 10
— 1.0
-O.I
Fig. G3. Wiregraph for "C" core AL-5
46
33-697, Rev. 1
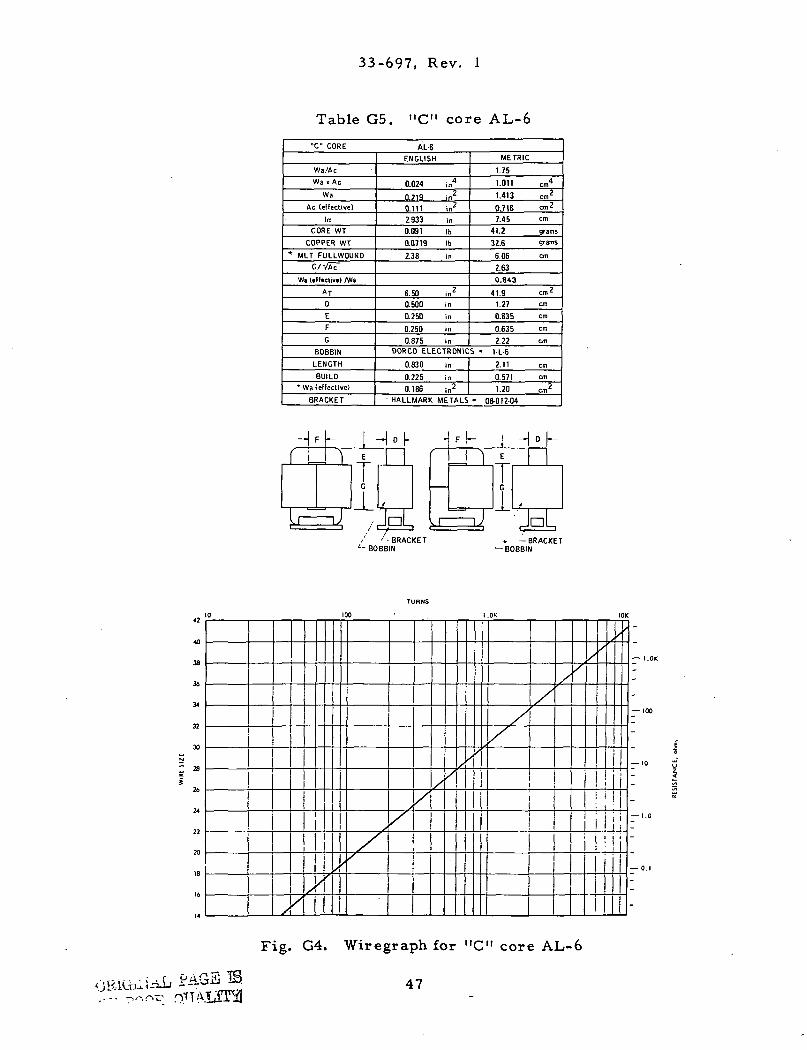
Table G5. "C" core AL-6
"C" CORE AL-6
Wa/Ac
Wa xAc
Wa
Ac (effective)
Im
CORE WT
COPPER WT
* MLT FULLWOUNO
G/VAT
Wa (effective) /Wa
AT0
E
F
G
BOBBIN
LENGTH
BUILD
*Wa (effective)
BRACKET
ENGLISH
0.024
0219
m4
. 2
0.111 in2
2.933
0.091
0.0719
2.38
in
Ib
Ib
in
6.50
0.500
0.250
0.250
0.875
in2
in
in
in
in
METRIC
1.75
1.011
1.413
B.71S
7.45
41.2
32.6
6.06
cm"cm'cm 2
cm
grams
qrams
cm
2.63
0.843
41.9
1.27
O.E35
0.635
2.22
cm2
cm
cm
cm
cm
DORCO ELECTRONICS > 1-L-E
0.830
0.225
0.186• HALLMARK
in
in
in2
2.11
0.571
1.20
METALS - 08-012-04
cm
cm
cm2
( 1
u — \) /hi' -BRACKET
- BOBBIN* —BRACKET
-BOBBIN
yFig. G4. Wiregraph for "C" core AL-6
47
33-697, Rev. 1
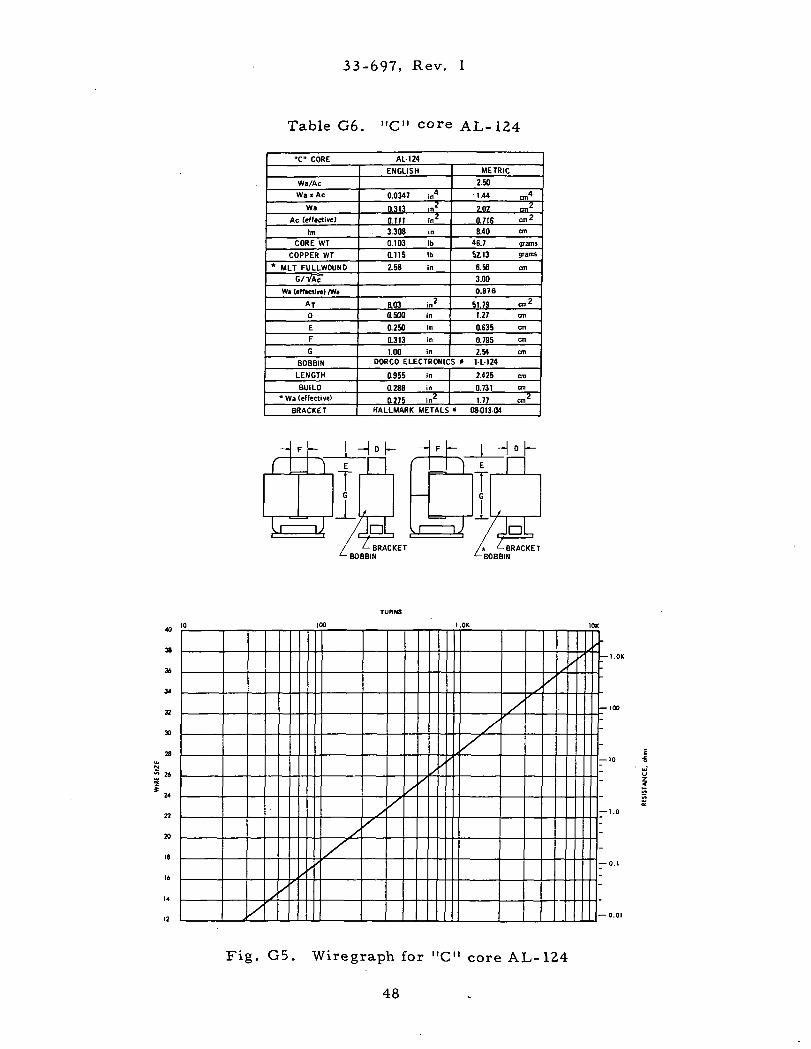
Table G6. "C" core AL-124
"C" CORE AL-124
Wa/Ac
Wax Ac
Wa
Ac (effective)
Im
CORE WT
COPPER WT
* MLT FULLWOUND
G/VAe
Wa (effective) /We
AT0
E
F
G
BOBBIN
LENGTH
BUILD* Wa (effective)
BRACKET
ENGLISH
0.0347 in4
0.313 in2
aill in2
3.308 in
0.103 Ib
0.115 Ib
^58 in
a03 in2
a 500 in
0.250 in
0.313 in
1.00 in
METRIC
2.50
•1.44
2.02
0.716
cm4
cm"*cm?
8.40 cm
46.7
52.13
6.56
gramsgrams
cm
3.00
0.876
51.791.27
0.635
0.795
2.54
cm-!
cm
cm
cm
cmDORCO ELECTRONICS * 1-L-124
O.SK in
0.288 in
0.275 in2
2.425
0.731
1.77
cm
cm
cm"*HALLMARK METALS « 08-013-04
38
36
34
32
X
28
26
24
22
20
18
16
14
1?/
//
/
/
/
//
/
/^
,'
/
/
/
S
/
S
f '
— I.OK
— 100
-
-
— 10
"— 1.0
_
-— 0.1
"— 0.01
Fig. G5. Wiregraph for "C" core AL-124
48
33-697, Rev. 1
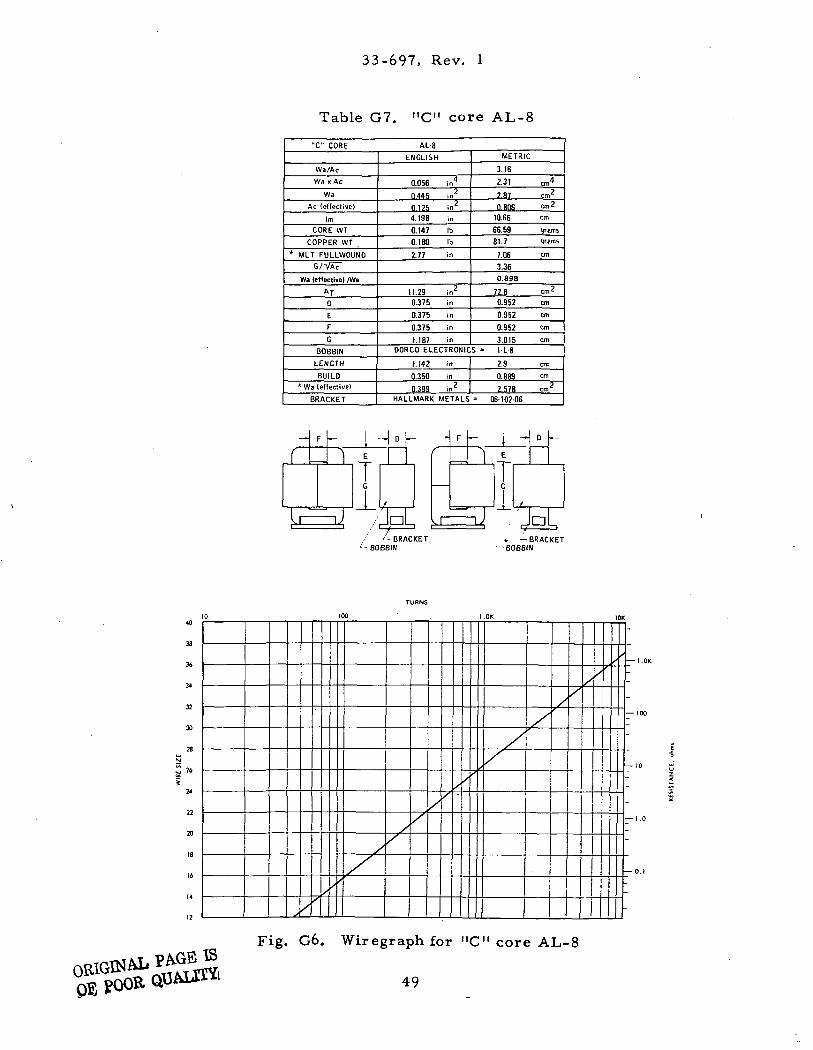
Table G7. "C" core AL-8
"C" CORE AL-8
Wa/Ac
Wa xAc
Wa
Ac (effective)
In
CORE WT
COPPER WT
* MLT FULLWOUNO
G/YATWa (effective) /Wa
AT0
f.
F
G
BOBBIN
LENGTH
BUILD
* Wa (effective)
BRACKET
ENGLISH
0.056 in4
0.445 in2
0.125 in2
4.198 in
0.147 Ib
0.180 Ib
2.77 in
11.29 in2
0.375 in
0.375 in
0.375 in
1.187 in
METRIC
3.16
2.31
2.87
0.806
10.66
66.59
81.7
7.06
cm"
en,2
cm 2
cm
gramsgrams
Cm
3.36
0.898
72.80.952
0.952
0.952
3.015
cm*cm
cm
cm
cmDORCO ELECTRONICS * l-L-8
1.142 in
0.350 in
0.399 in2
2.9
0.889
2.578
cm
cm
cm2
HALLMARK METALS " 06-102-06
—f
U:
F - 1 --I D |-
~ |
-J
E
G
_LL
>/JoL
/ '- BRACKET'-BOBBIN
- F U- i H D |—
fG
iJ JaL* -BRACKET
— BOBBIN
38
36
34
32
30
28
N
'C, 26
24
22
20
18
16
14
12 ,X
x<1
x/
x/// 1/1
/'
//
/
i —
x/
1
-
/ — I.OK
:-— 100
-
— 10
:-— 1.0
-
— O.I
Fig. G6. Wiregraphfor "C" core AL-8
49
33-697, Rev. 1
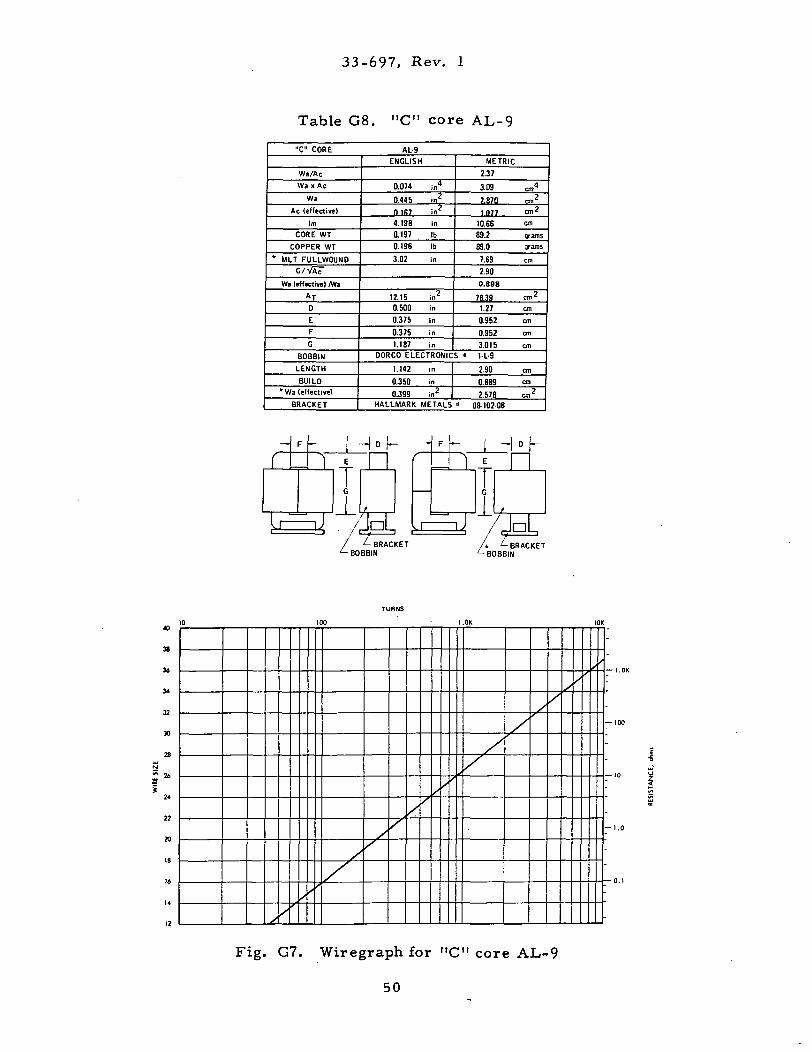
Table G8. "C" core AL-9
"C" CORE AL-9
Wa/Ac
Wax Ac
Wa
Ac (effective)
ImCORE WT
COPPER WT
* MLT FULLWOUNO
G/VATWa (effective) /Wa
ATD
EF
G
BOBBIN
LENGTH
BUILD*Wa (effective)
BRACKET
ENGLISH
0.074 in4
0.445 in2
01B7 in2
4.198 in
0.197 Ib
0.196 Ib
3.02 in
12.15 in2
0.500 in
0.375 in
0.375 in
1.187 in
METRIC
2.37
3.09 cm4
2.870 on2
1077 cm2
10.66
89.2
89.0
7.69
cm
gramsgrams
cm
2.90
0.898
78.391.27
0.952
0.952
3.015
cm2
cm
cm
cm
cmDORCO ELECTRONICS « 1-L-9
1.142 in
0.350 in
0.399 in2
2.90
0.889
cm
cm
2.578 cm2
HALLMARK METALS * 08-102-06
^ -Nl- H1 E
< i
Fk J HD | -
1 1E
G
| |
- BRACKET- BOBBIN
^- BRACKETBOBBIN
38
M
34
32
X
28
26
24
22
20
18
16
14
12,/
/'
>
!/
///
/','
/
/
A//
.s
-
.
— 100
-
_
— 1.0
0 1
Fig. G7. Wiregraph for "C11 core AL-9
50
33-697, Rev. 1
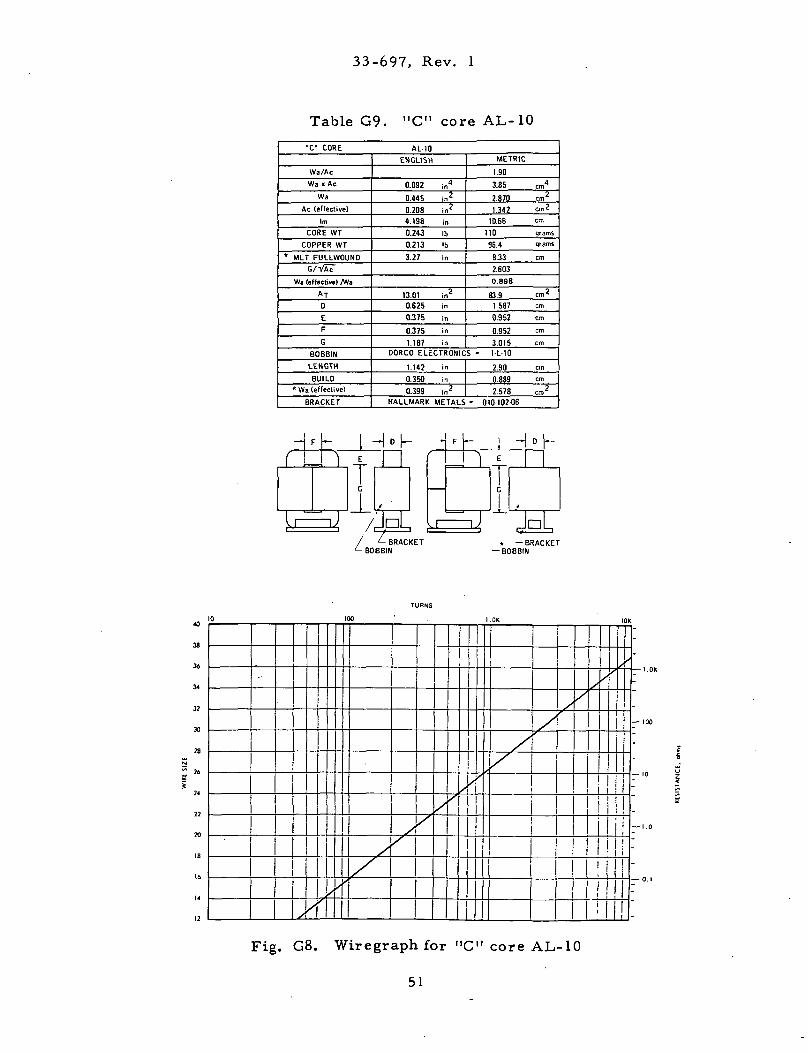
Table G9. "C" core AL-10
"C" CORE AL-10
Wa/Ac
Wa x Ac
Wa
Ac (effective)
Im
CORE WT
COPPER WT
* MLT FULLWOUND
G/VATWa (effective) /Wa
ATD
E
F
G
BOBBIN
LENGTH
BUILD* Wa (effective)
BRACKET
ENGLISH
0.092 in"
0.445 in2
0.208 in2
4.198 in
0.243 Ib
0.213 Ib
3.27 in
13.01 in2
0.625 in
0.375 in
0.375 in
1.187 in
METRIC
1.90
3.85
2870
1342
10.66
11096.4
8.33
cm"
cm^
Cm^
cm
gramsgrams
cm
2.603
0.898
83.91.587
0.952
0.952
3.015
cm-!
cm
cm
cm
cm
DORCO ELECTRONICS « l-L-10
1.142 in
0.350 in
0.399 in2
2.90
0.889
2.578
cm
cm
cm2
HALLMARK METALS • 010102-06
G
BRACKETBOBBIN
* —BRACKET— BOBBIN
32
30
X
A.Fig. G8. Wiregraph for "C" core AL-10
51
33-697, Rev. 1
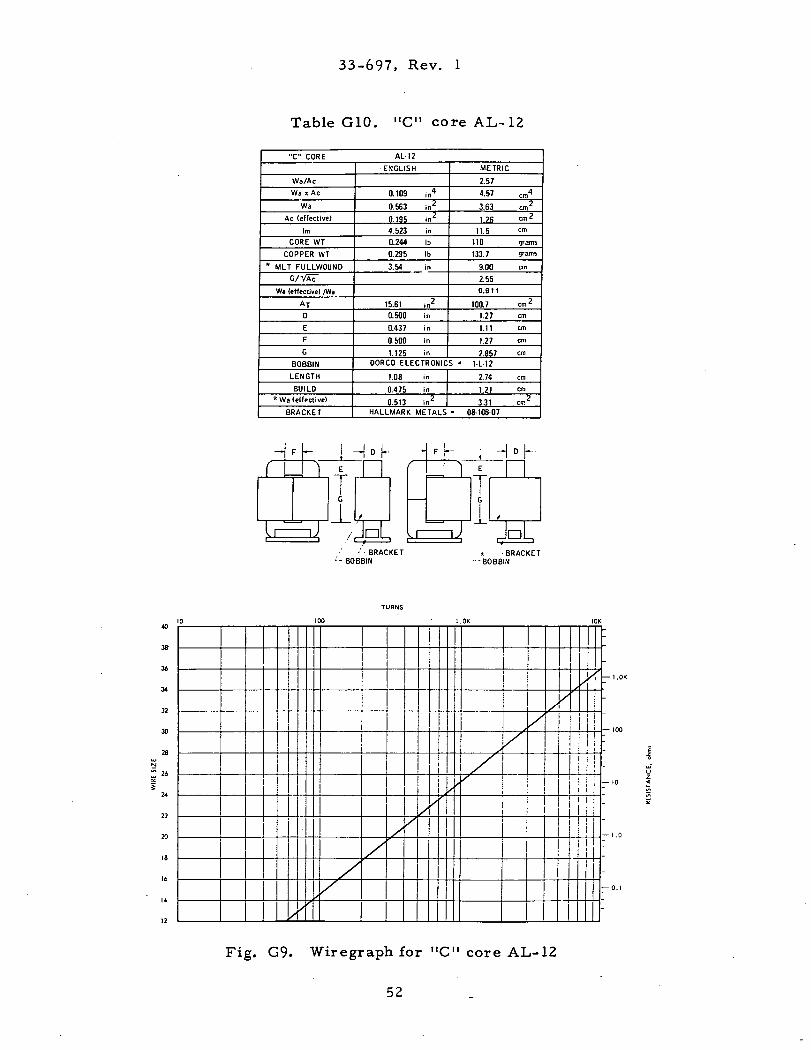
Table G10. "C"coreAL-12
"C" CORE AL-12
Wa/Ac
Wax Ac
Wa
Ac (effective)
Im
CORE WT
COPPER WT
* MLT FULLWOUND
G/VAc
Wa (etfectivel /Wa
ATD
E
F
G
BOBBIN
LENGTH
BUILD*Wa (effective)
BRACKET
•ENGLISH
0.109 in"
0.563 in2
0.195 in2
4.523 in
0.244 Ib
0.295 Ib
3.54 in
15.61 in2
0.500 in
0.437 in
0.500 in
1.125 in
METRIC
2.57
4.57
3.63
1 26
11.5
110
133.7
9.00
cm4
cm2
cm'
cm
gramsgrams
cm
2.55
0.911
100.7
1.27
1.11
1.27
2.857
cm2
cm
cm
cm
cm
DORCO ELECTRONICS => l-L-12
1.08 in
0.475 in
0.513 in2
2.74
1.21
3.31
cm
cm
or2
HALLMARK METALS • 08-106-07
r i n i 1_L-
f
F I— ' — j D I— -
1 ^|
|J
E
G
| |
JoL• BRACKET
- BOBBIN* - BRACKET
--BOBBIN
40
38
36
34
32
30
28
5 2»0£
i24
22
20
Fig. G9. Wiregraph for "C" core AL-12
52
33-697, Rev. 1
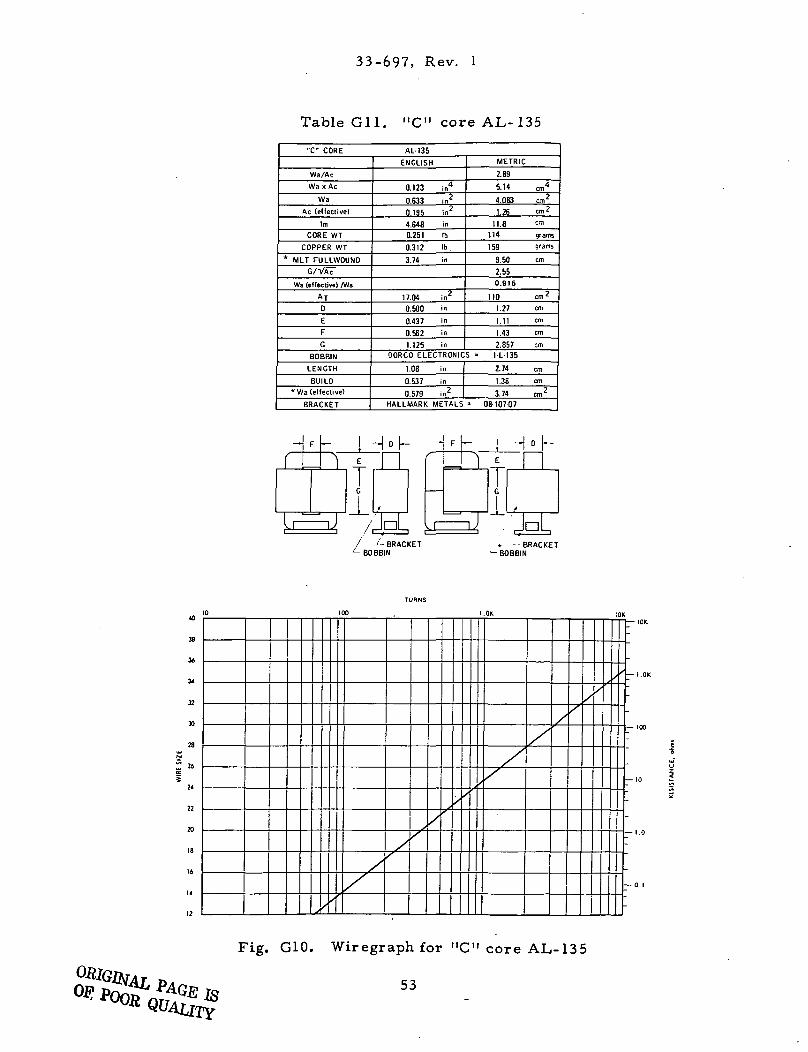
Table Gil. "C" core AL- 135
"C" CORE AL-135
Wa/Ac
Wa xAc
Wa
Ac (effective)
Im
CORE WT
COPPER WT
* MLT FULLWOUND
G/VATWa (effective! /Wa
ATD
E
F
G
BOBBIN
LENGTH
BUILD
* Wa (effective)
BRACKET
ENGLISH
0.123 in4
0.633 in2
0.195 in2
4.648 in
0.251 Ib
0.312 Ib,
3.74 in
17.04 in2
0.500 in
0.437 in
0.562 in
1.125 in
METRIC
2.89
5.14 cm"
4.083 cm2
1.26 cm 2
11.8 cm
114 grams1 59 9rams
9.50 cm2.550.915
110 cm2
1.27 cm
1.11 cm
1.43 cm
2.857 cmOORCO ELECTRONICS - 1-L-135
1.08 in
0.537 in
0.579 in2
2.74 cm
1.36 cm
3.74 cm2
HALLMARK METALS - 08-107-07
,/ '- BRACKET
*- BOBBIN
- 1 i i r1 )
J
E
G
| |
'IbL+ - -BRACKET
- BOBBIN
38
36
34
32
X
28
26
24
22
20
18
16
1?
/
/
/
t
/
'
'
/
/
/
/
/
/'
/'
-_
' -
-
-
-
-
-
-
—
Fig. G10. Wiregraph for "C" core AL-135
53
33-697, Rev. 1
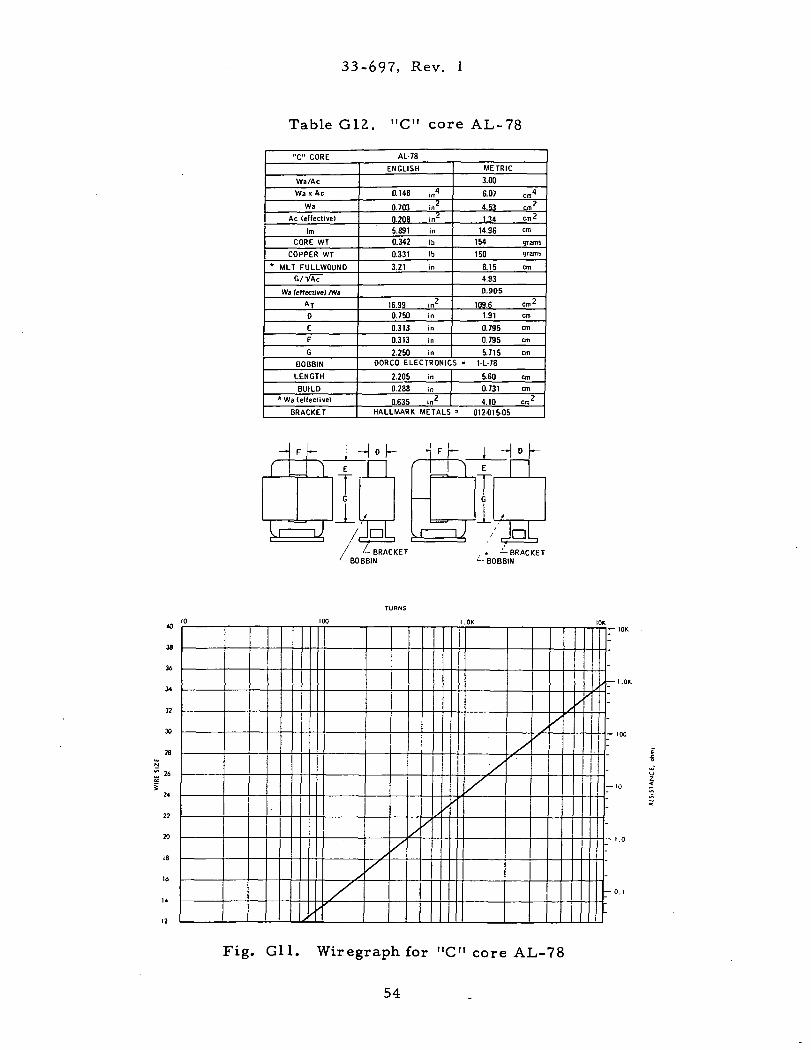
Table G12. "C" core AL-78
"C" CORE AL-78
Wa/Ac
Wax Ac
Wa
Ac (effective)
Im
CORE WT
COPPER WT
* MLT FULLWOUNO
G/VAT
Wa (effective) /Wa
ATD
E
F
G
BOBBIN
LENGTH
BUILD*Wa (effective)
BRACKET
ENGLISH
0.146 in"
0.703 in2
0.208 in2
5.891 in0.342 Ib
0.331 Ib
3.21 in
16.99 in2
0.750 in
0.313 in
0.313 in
2.250 in
METRIC
3.00
6.07
4.53
1.34
14.96
154
150
8.15
cm"
en,'
cm2
cm
gramsgrams
cm
4.93
0.905
109.61.91
0.795
0.795
5.715
cm 2
cm
cm
cm
cmOORCO ELECTRONICS * 1-L-78
2.205 in
0.288 in
0.635 in2
5.60
0.731
4.10
cm
cm
cm2
HALLMARK METALS • 012-015-05
40
38
36
34
32
30
28
24
22
20
18
16
14
12
0
— F
f
—
)
I, J
100
^
I~
(
L_H °h
j1
/JpU/ i- BRACKET*- BOBBIN
TURNS
^
/
/
/
X
fF h
)
\ iJ
.OK
/
/
/
(_ _
*B(
-i D
^
— BRACKET1BBIN
y/
/ x
IOK
/
/
— IOK
x— l.OK
(
— 10
T --
-O.I
Fig. Gil. Wiregraph for "C" core AL-78
54
33-697, Rev. 1
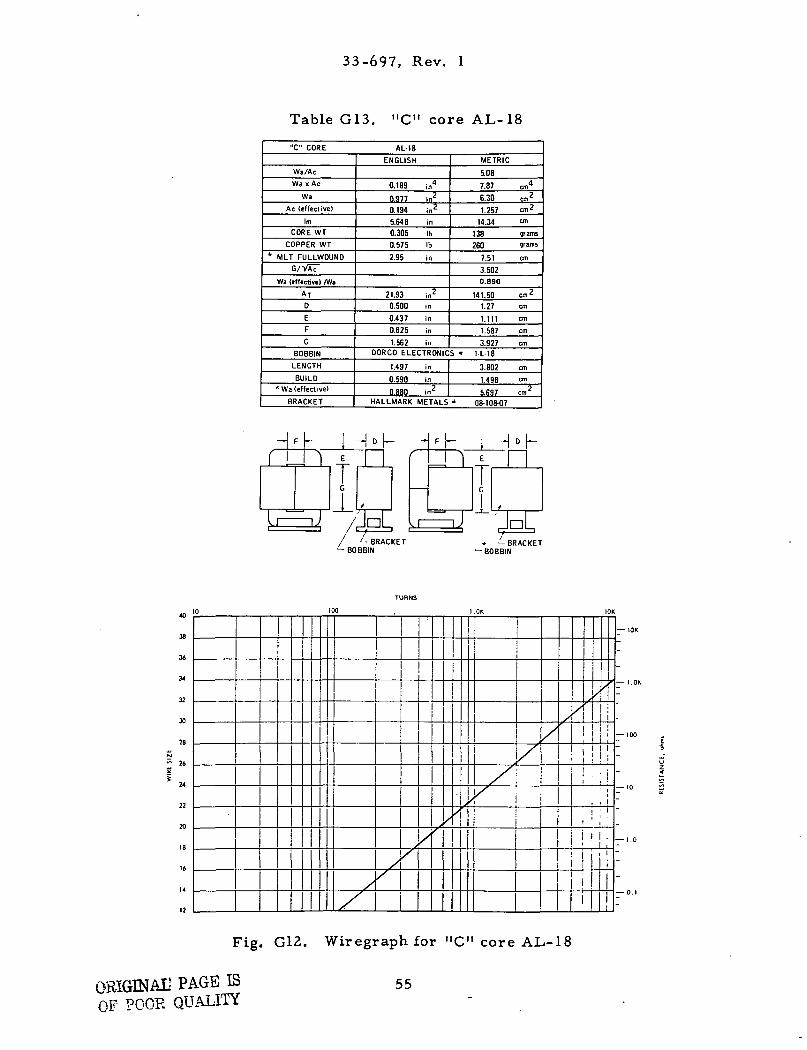
Table G13. "C" core AL-18
"C" CORE AL-18
Wa/Ac
Wa x Ac
Wa
Ac (effective)
Im
CORE WT
COPPER WT
* MLT FULLWOUND
G/VAc
Wa (effective) /Wa
AT0
E
F
G
BOBBIN
LENGTH
BUILD* Wa (effective)
BRACKET
ENGLISH
0.189 in4
0.977 in2
0.194 in2
5.648 in
0.305 Ib
0.575 Ib
2.95 in
21.93 in2
0.500 in
0.437 in
0.625 in
1.562 in
METRIC
5.08
7.87
6.30
cm4
cm2
1.257 cm?
14.34
138260
7.51
cm
gramsgrams
cm
3.502
0.890
141.501.27
1.111
1.587
3.927
cm2
cm
cm
cm
cmOORCO ELECTRONICS » 1-L-18
1.497 in
0.590 in
0.88Q in2
3.802
1.498
5697
cm
cm
cm2
HALLMARK METALS => 08-108-07
» h
40
38
36
34
32
30
28
26
24
22
20
18
16
14
12
0
r i n E
i • • jG
/
'/Jn
~n E
\
/ '- BRACKET^ BOBBIN
TURNS
100
i
Xsf
/
,A
A
\
G
f
* -'-BRACKET— BOBBIN
l .OK
/'/\
/
/)/
IOK
X
i
i i
\! 1 ; • '! • i
i, , l
\
^
i
!
I 1
, i
— IOK
-
-
— 100
--
— 1.0
--
l PAGE ISOF POOP. QUALITY
Fig. G12. Wiregraph for "C" core AL-18
55
33-697, Rev. 1
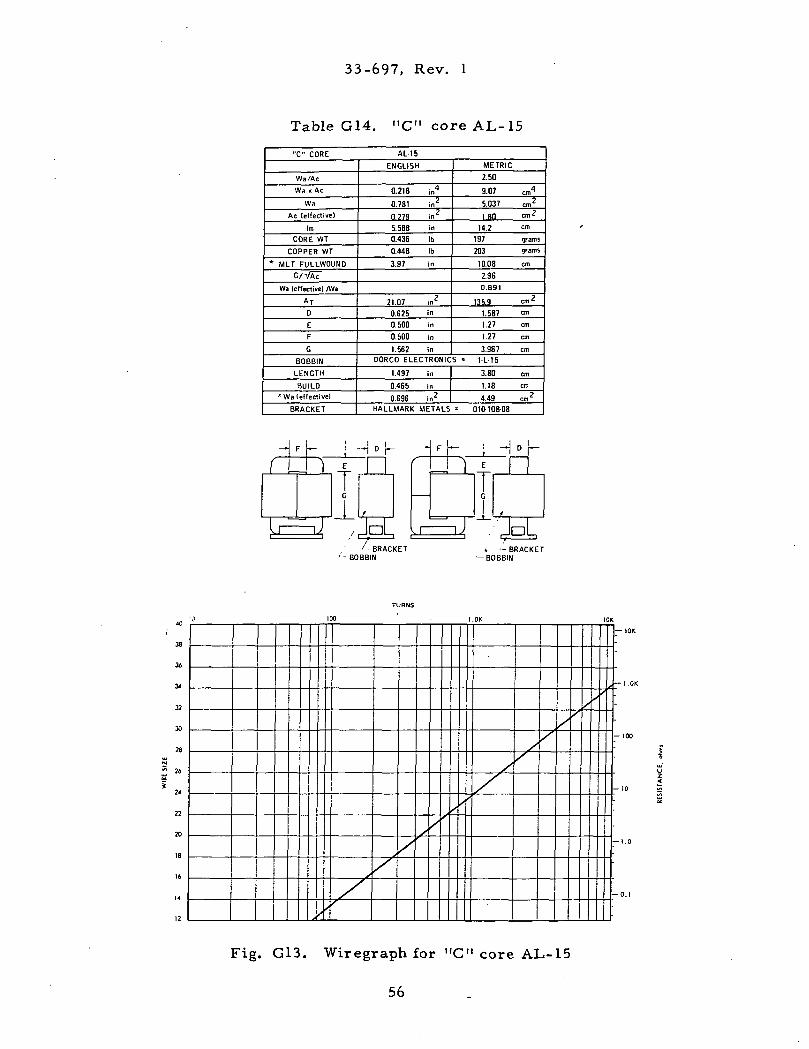
Table G14. "C" core AL-15
"C" CORE AL-15
Wa/Ac
Wa x Ac
Wa
Ac (effective)
Im
CORE WT
COPPER WT
* MLT FULLWOUND
G/VAT
Wa (effective) /Wa
AT0
E
F
G
BOBBIN
LENGTH
BUILD* Wa (effectivel
BRACKET
ENGLISH
0.218 in4
0.781 in2
0.279 in2
5.588 in
0.43E Ib
0.448 Ib
3.97 in
21.07 in2
0.625 '"
0.500 in
0.500 in
1.562 in
METRIC
2.50
9.07
5.037
18014.2
197203
10.08
cm'
cm'cm?
cm
grams
grams
cm
2.96
0.891
135.9
1.587
1.27
1.27
3.967
cm'
on
cm
cm
cm
DORCO ELECTRONICS « 1-L-15
1.497 in
0.465 in
0.696 in2
3.80
1.18
4.49
cm
cm
cm2
HALLMARK METALS - 010-108-08
H -1 • hM M
=3 1 '
I
(
\
• BRACKET"-'- BOBBIN
•-BRACKETBOBBIN
a
38
36
34
32
30
28
26
24
22
20
19
16
14
1?
vl
/
100
s///
/
/
/
I.OK
/
//'
//
/
/
/
7
IOK
— IOK
-
t — I.OK
7 :
-100
— 10
— 1.0
-O.I
Fig. G13. Wiregraph for "C" core AL-15
56
33-697, Rev. 1
Table G15. "C" core AL-16
"C" CORE AL-16
Wa/Ac
Wa xAc
Wa
Ac (effective)
Im
CORE WT
COPPER WT
* MLT FULLWOUNO
G/VAT
W« (effective) /Wa
ATD
E
F
G
BOBBIN
LENGTH
BUILD
* Wa (effective)
BRACKET
ENGLISH
0.26 in"
0.781 in2
0.334 in2
5.588 in
0.519 Ib
0.476 Ib
4.22 in
22.21 in2
0.750 in
0.500 in
0.500 in
1.562 in
METRIC
2.08
10.8 cm*
5.037 cm2
2.15 <m2
14.2 cm
235 grams
216 9'ams
10.72 cm
2.70
0.691
143.3 cm?
1.905 cm
1.27 cm
1.27 cm
3.967 cm
DORCO ELECTRONICS * l-L-16
1.497 in
0.465 in
0.696 in2
3.80 cm
1.18 cm
4.49 cm2
HALLMARK METALS = 012-108-08
40
38
36
34
32
X
28
26
24
22
20
18
16
U
12
0
H F h1 f
ll ij
(
-] D "
/JoL
/*--•
r
_ih^
— i/ '- BRACKET
— BOBBIN
TURNS
100
'
.>
/
^
]//
/
(
J
l .OK
rf'i
i
_
*BC
1
t
JQ
h
— BRACKETBBIN
/
/
/
/
, j
/'
IOK
Sj
i
' r ' '
• ' ; ii :
I ' !
i i 'i . i i1 i i i1
, t
1i
!
— IOK
-
— l .OK
-
— 100I 1•s
v<
-ro SX
-
— 1.0
O.I
Fig. G14. Wiregraph for "C" core AL-16
57
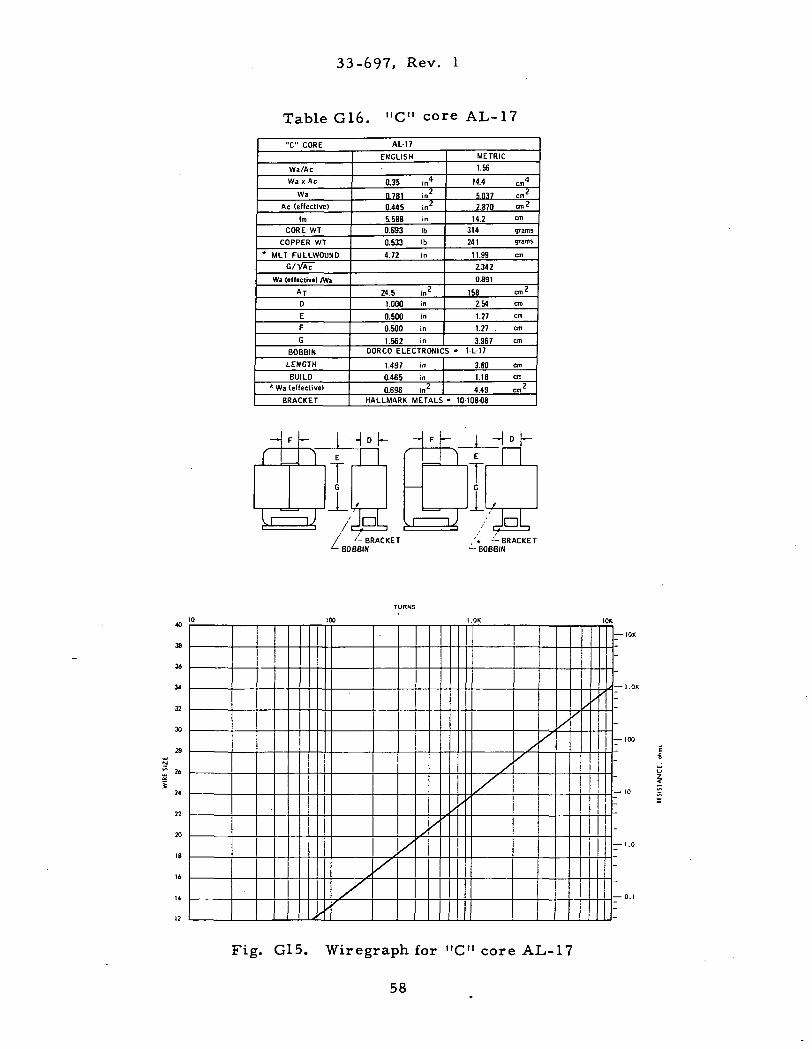
33-697, Rev. 1
Table G16. "C" core AL-17
"C" CORE AL-17
Wa/Ac
Wa x Ac
Wa
Ac (effective)
Im
CORE WT
COPPER WT
* MLT FULLWOUND
G/YAc
Wa (effective) /Wa
ATD
E
F
G
BOBBIN
LENGTH
BUILD
*Wa (effective)
BRACKET
ENGLISH
0.35 in4
0781 in2
0.445 in2
5.588 in
0.693 Ib
0.533 Ib
4.72 in
24.5 in2
1.000 in
0.500 in
0.500 in
1.562 in
METRIC
1.56
14.4
5.037
cm4
cm2
2.870 cm2
14.2
314241
11.99
cm
grams
grams
cm
2.342
0.891
158
2.54
1.27
1.27 .
3.967
cm2
cm
cm
cm
cm
DORCO ELECTRONICS * 1-L-17
1.497 in
0.465 in
0.696 in2
3.80
1.18
4.49
cm
cm
cm2
HALLMARK METALS » 10-108-08
f i l l E
G
1
| |
>
TS4 /CJoL,'- BRACKET
BOBBIN'* — BRACKET
— BOBBIN
38
32
30
28
26
24
22
20
IB
16
14
12s/
// /s
/
,/
x/ //'/
~?
— IOK
-
t — I .OK
-
— 100
-
- — 10
-— 1.0
-
— O.I
-
Fig. G15. Wiregraph for "C" core AL-17
58
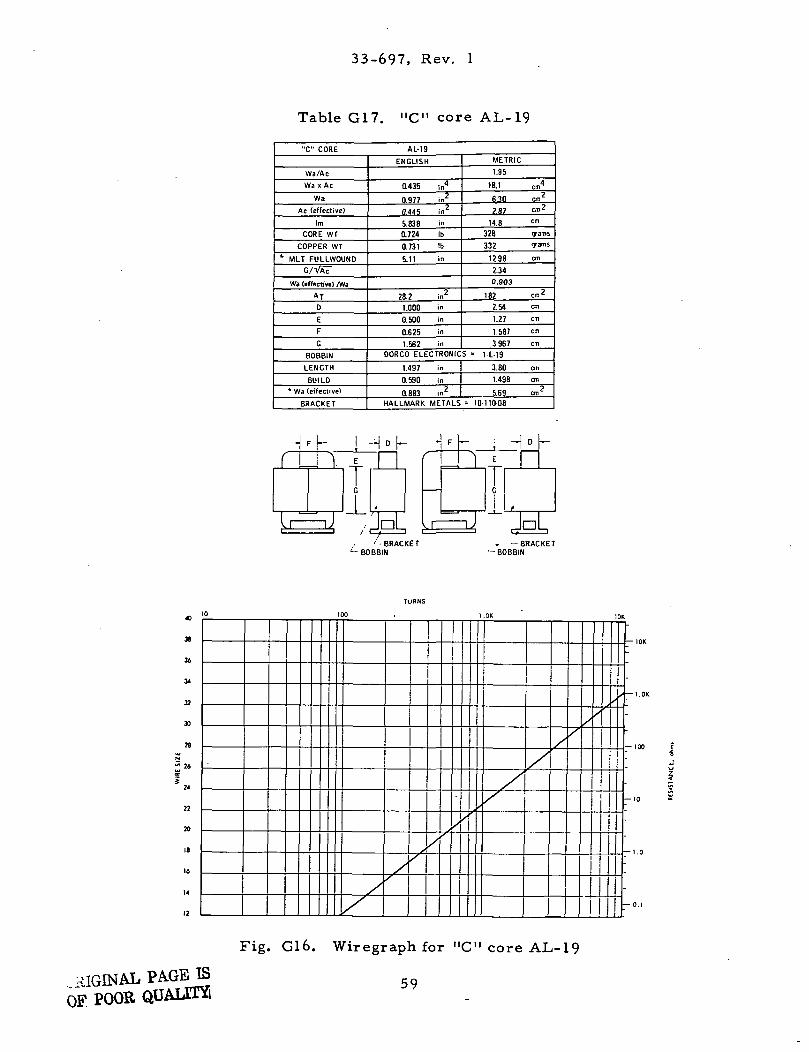
33-697, Rev. 1
Table G17. "C" core AL- 19
"C" CORE AL-19
Wa/Ac
Wax Ac
Wa
Ac (effective)
Im
CORE WT
COPPER WT
* MLT FULLWOUND
G/YAC
Wa (effective) /Wa
ATD
E
F
G
BOBBIN
LENGTH
BUILD
* Wa (effective)
BRACKET
ENGLISH
0.435
0.977
0.445
5.8380.724
0.731
5.11
in4
in2
,»*in
Ib
Ib
in
28.2
1.000
0.500
0.625
1.562
ir,2
in
in
in
in
METRIC
1.95
18.1
6.30
2.87
14.8
328332
12.98
cm4
cm2
cm2
cm
grams
grams
cm
2.34
0.903
1822.54
1.27
1.587
3.967
cm2
cm
cm
cm
cm
DORCO ELECTRONICS « 1 L-19
1.497
0.590
0.883HALLMARK
in
in. 2m
3.80
1.498
5.69METALS - 10-110-08
cm
cm
cm2
f i l l -
1 — 1 c==1 1 — '
— 1
( 1
| |
t
- BRACKET- BOBBIN
* —BRACKETBOBBIN
40
38
36
34
32
30
28
26
22
20
in
I|S
u
i?
0 100
A/
/'
//
I .OK ' |OK
/
/
/
,
'
/
1
.
/ — I.OK
-
— 10
— O.I
AIGINAL PAGE!OF. POOR
Fig. G16. Wiregraph for "C" core AL-19
59
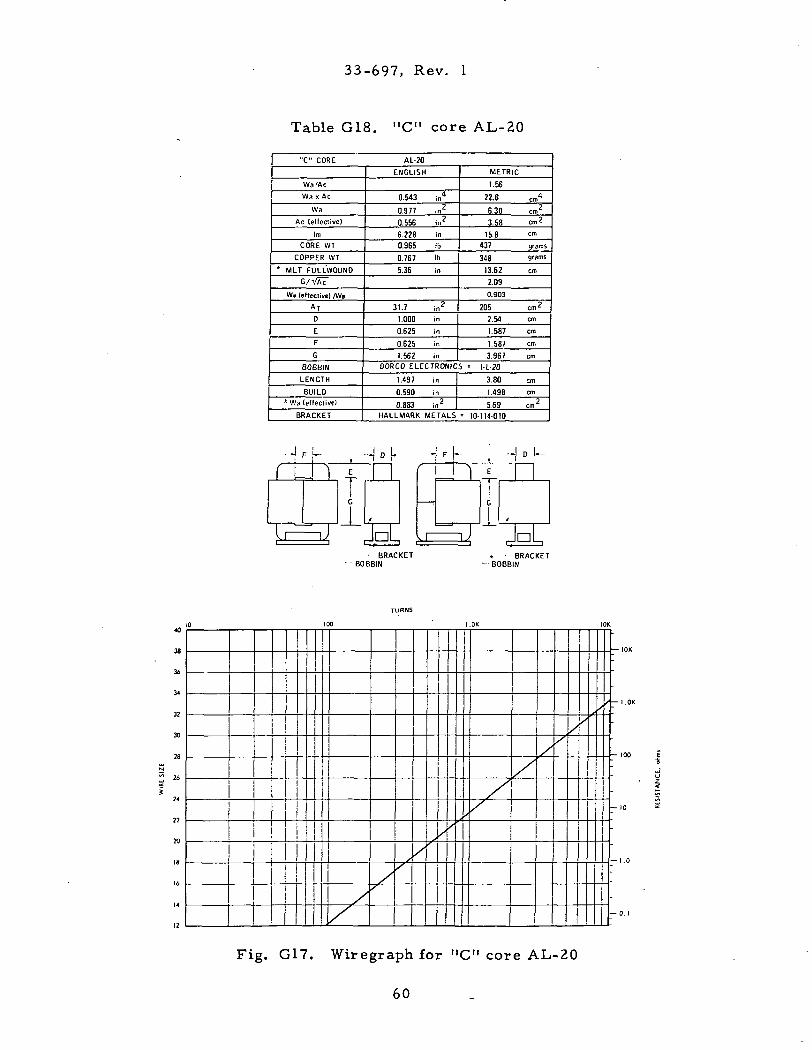
33-697, Rev. 1
Table G18. "C" core AL-20
"C" CORE AL-20
Wa'Ac
Wa x Ac
Wa
Ac (effective)
ImCORE WT
COPPER WT
* MLT FULL'WOUNOG/YAT
Wa (effectivel /Wa
ATD
EF
G
BOBBIN
LENGTH
BUILD* Wa (effective)
BRACKET
ENGLISH
0.543 in4
0.977 in2
0.556 in2
6.228 in
0.965 Ib
0.767 Ib
5.36 in
31.7 in2
1.000 in
0.625 in
0.625 in
1.562 in
METRIC
1.56
22.6
6.30
3.58
15.8437
34813.62
cm4
on2
cm'
cm
gramsgrams
cm
2.09
0.903
2052.54
1.587
1.587
3.967
cm2
cm
cm
cm
cm
DORCO ELECTRONICS « l-L-20
1.497 in
0.590 in
0.883 in2
3.80
1.498
cm
cm
5.69 cm2
HALLMARK METALS = 10-114-010
f >
1.
]
-J
!— ]
I
1_L
JnL
)
BRACKET• BOBBIN
-l)
-it_
BC
JaJ=• BRACKET
)8BIN
I?
/
/
/'
'/
/'
1
/,/
//'
/
1
'
- — IOK
-
t — I.OK/ -
-
-- — 100 E- *U
' i
— 10 «
- —1.0
— O.I
Fig. G17. Wiregraph for "C" core AL-20
60
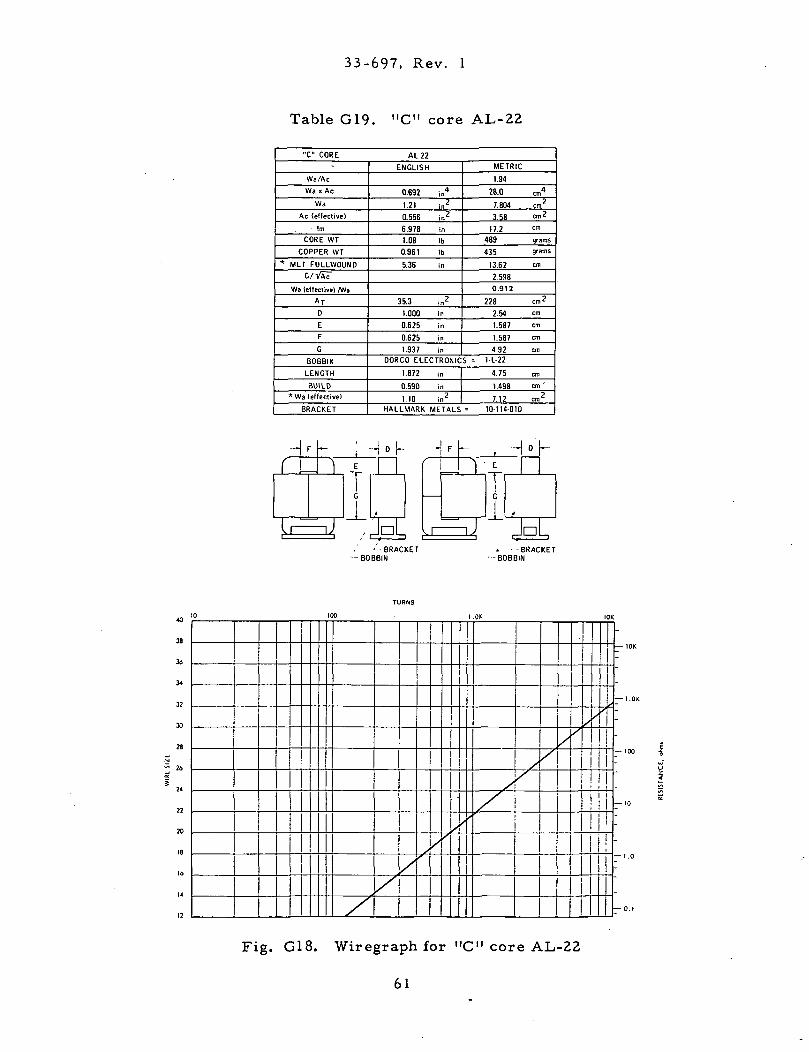
33-697, Rev. 1
Table G19. "C" core AL-22
"C" CORE AL-22-
Wa/Ac
Wax Ac
Wa
Ac (effective)
Im
CORE WT
COPPER WT
* MLT FULLWOUND
G/VAT
Wa (effective) /Wa
AT0
E
F
G
BOBBIN
LENGTH
BUILD*Wa (effective)
BRACKET
ENGLISH
0.692 in4
1.21 in2
0.556 in2
6.978 in
1.08 Ib
0.961 Ib
5.36 in
35.3 in2
1.000 in
0.625 in
0.625 in
1.937 in
METRIC
1.94
28.0 cm4
7.804 cm2
3.58
17.2
489435
13.62
cm 2
cm
gramsgrams
cm
2.5980.912
228 cm2
2.54
r~ 1.587
1.587
4.92
cm
cm
cm
cm
DORCO ELECTRONICS = 1-L-22
1.872 in
0.590 in
1.10 in2
4.75
1.498
7.12
cm
cm
cm''
HALLMARK METALS • 10-114-010
40
38
36
34
32
30
28
26
24
22
20
18
16
14
12
0
r i n
ll ij
100
E
1
C
-
, JnL,
/ —
(r— J• ' •BRACKET
--BOBBIN
TURNS
l.OK
/
A/
s/ '
!
~l
(
—
_
*BC
4
JaL- -BRACKET
1BBIN
.
//
/ ' i
/
IOK
/<ciI i
!
-
~*~ — IOK
— l .OK
-
Er — 100 •§
I\ ~ —
— 10
-
1
— o.t
Fig. G18. Wiregraph for "C" core AL-22
61
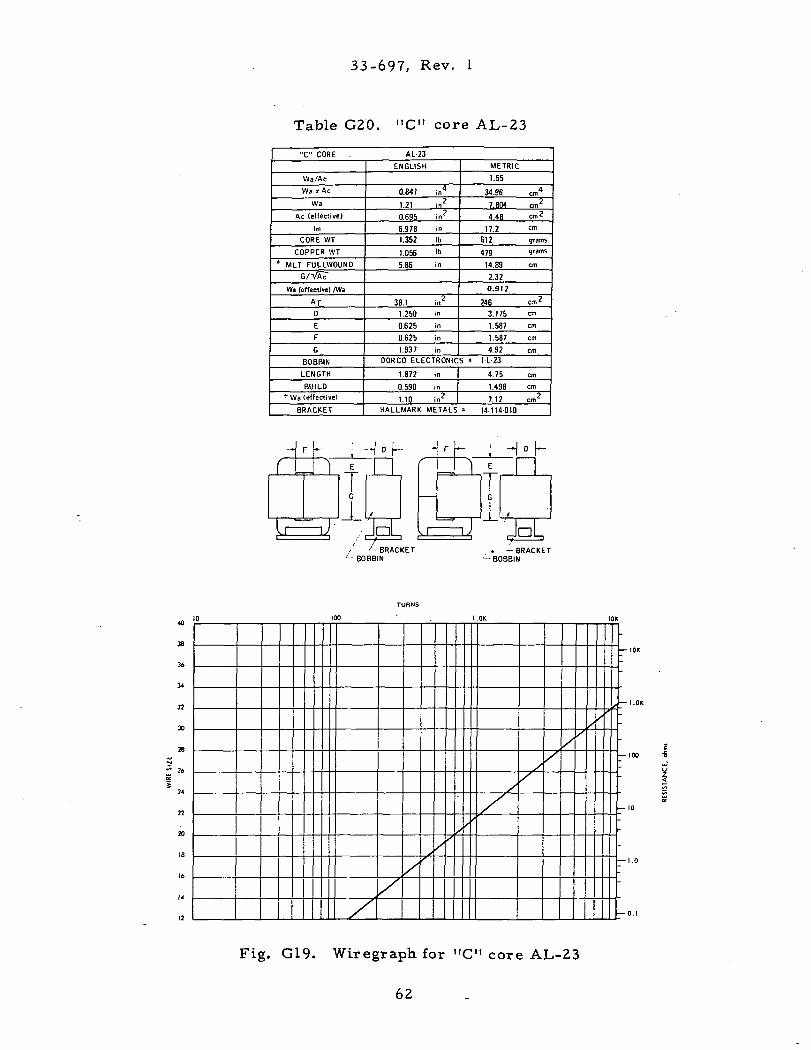
33-697, Rev. 1
Table G20. "C" core AL-23
"C" CORE . AL-23
Wa/Ac
Wa xAc
Wa
Ac (effective)
Im
CORE WT
COPPER WT
* MLT FULLWOUNO
G/VAT
Wa (effective) /Wa
ATD
E
F
G
BOBBIN
LENGTH
BUILD
*Wa (effective)
BRACKET
ENGLISH
0.841 in4
1.21 in2
0.695 in2
6.978 in1.352 Ib
1.056 Ib
5.86 in
38.1 in2
1.250 in
0.625 in
0.625 in
1.937 in
METRIC
1.55
34.96
7.804
4.48
17.2
612
479
14.89
on,"
en,2
cm?
cm
gramsgrams
cm
2.32
0.912
2463.175
1.587
1.587
4.92
en, 2
on
cm
cm
cmDORCO ELECTRONICS * 1 1-23
1.872 in
0.590 in
1.10 in2
4.75
1.498
7.12
cm
cm
cm2
HALLMARK METALS - 14-114-010
BRACKET'•- BOBBIN
* -BRACKET— BOBBIN
38
36
34
32
30
28
26
24
22
20
18
16
14
12/
xx
/.
//
*
x^// s
>'
-— IOK
"
f — I.OK
.
-
— 100
"— 10
_
-— 1.0
— O.I
Fig. G19. Wiregraph for "C" core AL-23
62
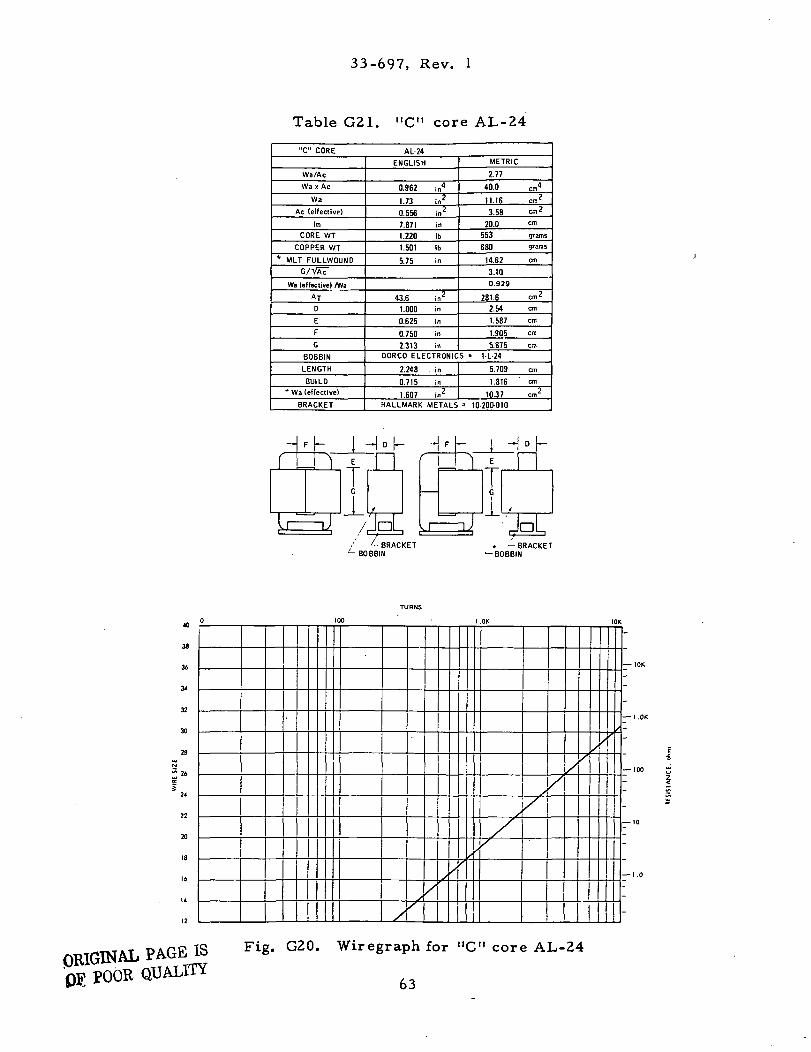
33-697, Rev. 1
Table G21. "C" core AL-24
"C" CORE AL-24
Wa/Ac
Wax Ac
Wa
Ac (effective)
Im
CORE WT
COPPER WT
* MLT FULLWOUND
G/YAT
Wa (effective) /Wa
ATD
E
F
G
BOBBIN
LENGTH
BUILD
* Wa (effective)
BRACKET
ENGLISH
0.962 in4'
1.73 in2
0.556 in2
7.871 in
1.220 Ib
1.501 Ib
5.75 in
43.6 in2
1.000 in
0.625 in
0.750 in
2.313 in
METRIC
2.77
40.0
11.16
3.58
20.0
553680
14.62
cm4
cm''
cm2
cm
grams
grams
cm
3.10
0.929
281.6
2.54
1.587
1.905
5.875
cm2
cm
cm
cm
cm
DORCO ELECTRONICS * 1-L-24
2.248 in
0.715 in
1.607 in2
5.709
1.816
10.37
cm
cm
cm2
HALLMARK METALS - 10-200-010
BRACKET*- BOBBIN
* —BRACKETBOBBIN
38
36
34
32
10
28
26
24
22
20
18
16
U
1? /
/
,/
/
/
s
///
J/
\
-
— IOK
-
-
— I.OK
-
— 100
:-— 10
~
— 1.0
:-
ORIGINAL PAGE ISPOOR QUALITY
Fig- G2°- Wiregraph for "C" core AL-24
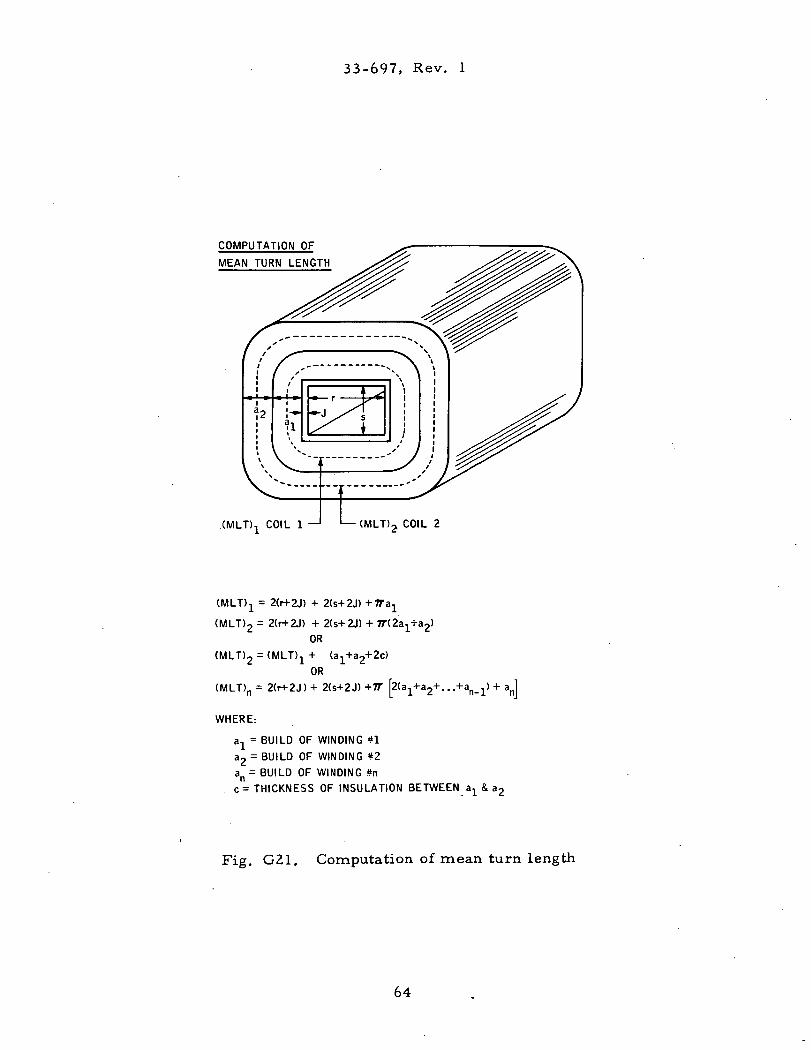
33-697, Rev. 1
COMPUTATION OF
MEAN TURN LENGTH
COIL 1 —' '—(MLT)2 COIL 2
= 2(r+2J) + 2(s+2J)
(MLT)2 = 2CH-2J) + 2(s+2J) + 7T(2a1+a2)OR
(MLT)2 = (MLT)1+ (3^2+20)OR
(MLT)n = 2(r+2J) + 2(s+2J) +7T a l
WHERE:
3l = BUILD OF WINDING #1
a2 = BUILD OF WINDING #2an = BUILD OF WINDING *n
. c= THICKNESS OF INSULATION BETWEEN a± & a2
Fig. G21. Computation of mean turn length
64
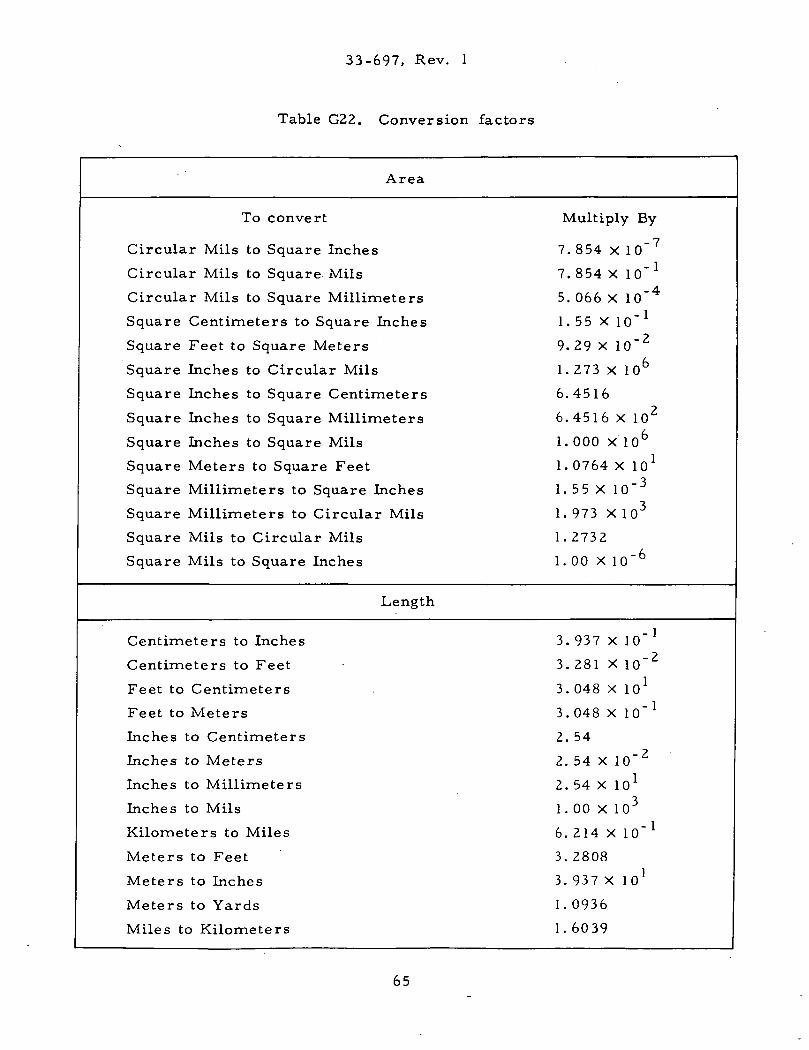
33-697, Rev. 1
Table G22. Conversion factors
Area
To convert
Circular Mils to Square Inches
Circular Mils to Square Mils
Circular Mils to Square Millimeters
Square Centimeters to Square Inches
Square Feet to Square Meters
Square Inches to Circular Mils
Square Inches to Square Centimeters
Square Inches to Square Millimeters
Square Inches to Square Mils
Square Meters to Square Feet
Square Millimeters to Square Inches
Square Millimeters to Circular Mils
Square Mils to Circular Mils
Square Mils to Square Inches
Multiply By
7.854 X 10"7
-4
1
7.854 X 10"
5. 066 X 10
1. 55 X 10
9.29 X 10"'
1.273 X 10*
6.4516
6.4516 X 10'
1.000 X 10⁶
1.0764 X 10
1. 55 X 10"3
1.973 X 10³
1.2732
1.00 X 10"6
1
Length
Centimeters to Inches
Centimeters to Feet
Feet to Centimeters
Feet to Meters
Inches to Centimeters
Inches to Meters
Inches to Millimeters
Inches to Mils
Kilometers to Miles
Meters to Feet
Meters to Inches
Meters to Yards
Miles to Kilometers
3.937 X 10
3.281 X 10
3.048 X 10
3.048 X 10
2. 54
-1
-2
1
-1
2. 54 X 10
2.54 X 10
1. 00 X 10:
-2
1
6. 214 X 10
3. 2808
3.937 X 10
1.0936
1. 6039
-1
65
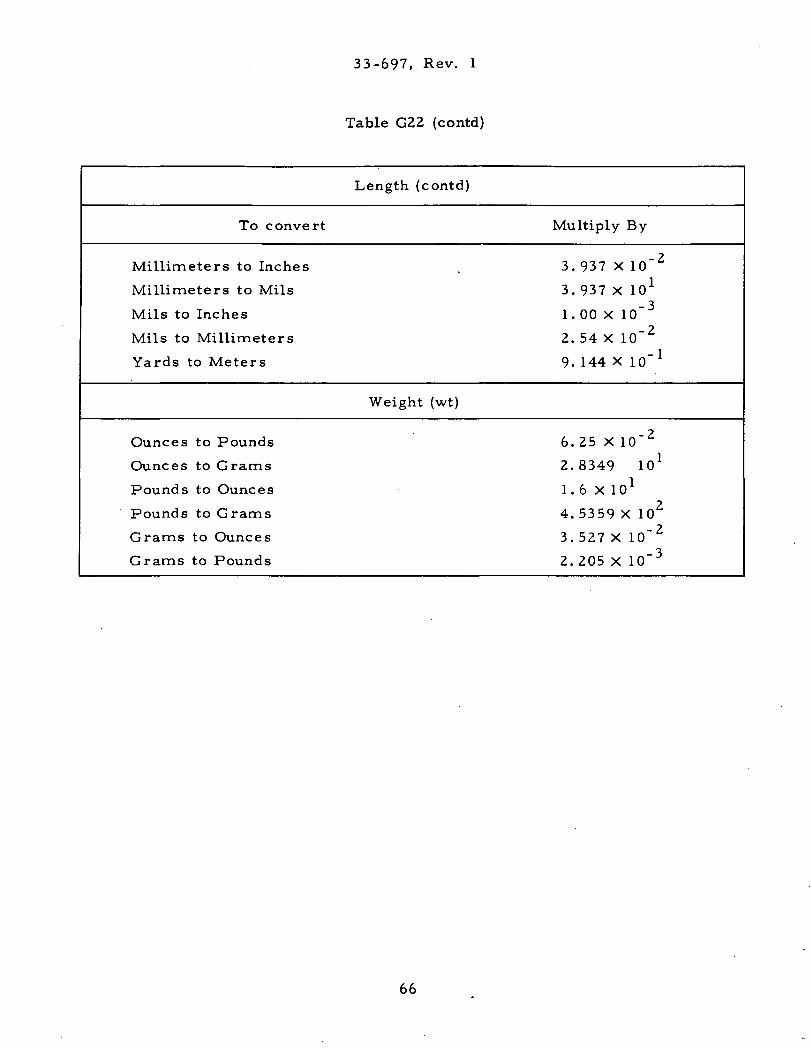
33-697, Rev. 1
Table G22 (contd)
Length (contd)
To convert Multiply By
Millimeters to Inches
Millimeters to Mils
Mils to Inches
Mils to Millimeters
Yards to Meters
3.937 X 10
3.937 X 10⁻³
-2
1
1.00 X 10
2. 54 X 10-2
9.144 X 10 -1
Weight (wt)
Ounces to Pounds
Ounces to Grams
Pounds to Ounces
Pounds to Grams
Grams to Ounces
Grams to Pounds
6.25 X 10 -2
2.8349 10
1.6 X 101
1
4.5359 X 10, -23.527 X 10
2.205 X 10 -3
66
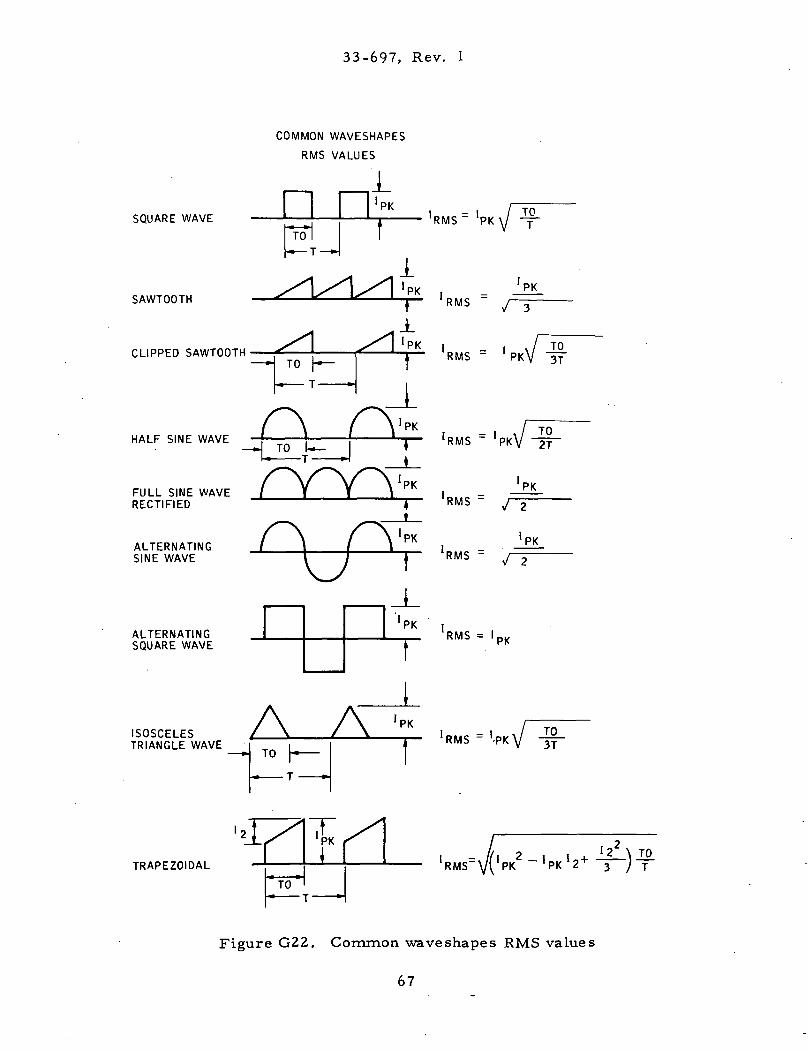
33-697, Rev. 1
COMMON WAVESHAPES
RMS VALUES
I
"rol \
— H TO |—
— J TO U—
KlVlb rK W j
1 >PK , 'PK
| ' R M S /-g
.i-1 'PK i , / TO
1 RMb PKV 37
JL\ ,YPK , , .PF5
j RMS PKV 2T
FULL SINE WAVE / Y Y \ PK 1 - — —RECTIFIED
ALTERNATING ' 1 /SINE WAVE I 7
ALTERNATINGSQUARE WAVE
ISOSCELES / \ / \TRIANGLE WAVE „. i
— » TO p
'2! / |t -3-f PK f
TRAPEZOIDAL — ' ' — * '
TO
| KMi> y 2
\ IpK , 'PK| KMS y 2
_i_'PK i
RM^ - lDlr
_LI ...u1 PK /
'DOC ~ 'n i -A/ T01 RMS -PK y 3T
i /i ? i u. ' 2 2 \ T P1 'RMS Vl'PK 'PK z' 3 / T
Figure G22. Common waveshapes RMS values
67
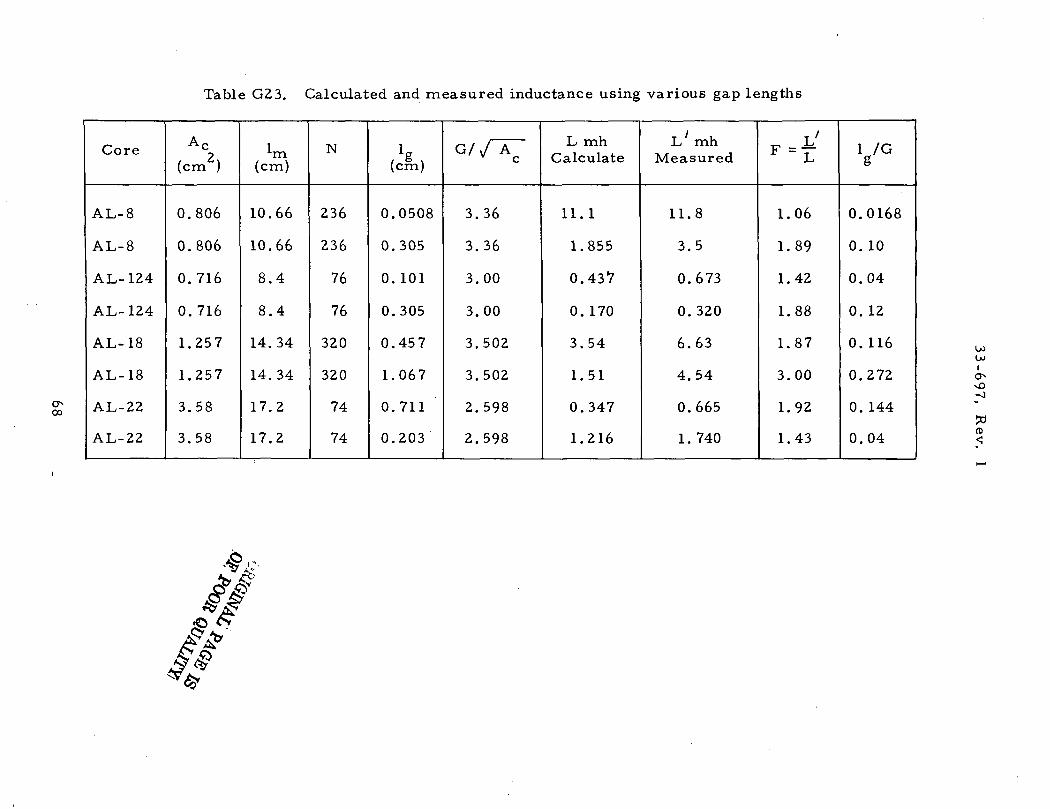
Table G23. Calculated and measured inductance using various gap lengths
oo
Core
AL-8
AL-8
AL-124
AL-124
AL-18
AL-18
AL-22
AL-22
AC(cm )
0.806
0.806
0.716
0.716
1.257
1.257
3.58
3.58
1m(cm)
10.66
10.66
8.4
8.4
14.34
14.34
17.2
17.2
N
236
236
76
76
320
320
74
74
A.(cm)
0.0508
0.305
0. 101
0.305
0.457
1.067
0.711
0.203
G// Ac
3.36
3.36
3.00
3.00
3.502
3.502
2.598
2.598
L mhCalculate
11. 1
1.855
0.437
0. 170
3.54
1.51
0.347
1.216
L' mhMeasured
11.8
3.5
0.673
0. 320
6.63
4.54
0.665
1. 740
'•£
1.06
1.89
1.42
1.88
1.87
3.00
1.92
1.43
VG
0.0168
0. 10
0.04
0. 12
0. 116
0.272
0. 144
0.04
u>(joI
n>
v A'
//rfc ,£>•O
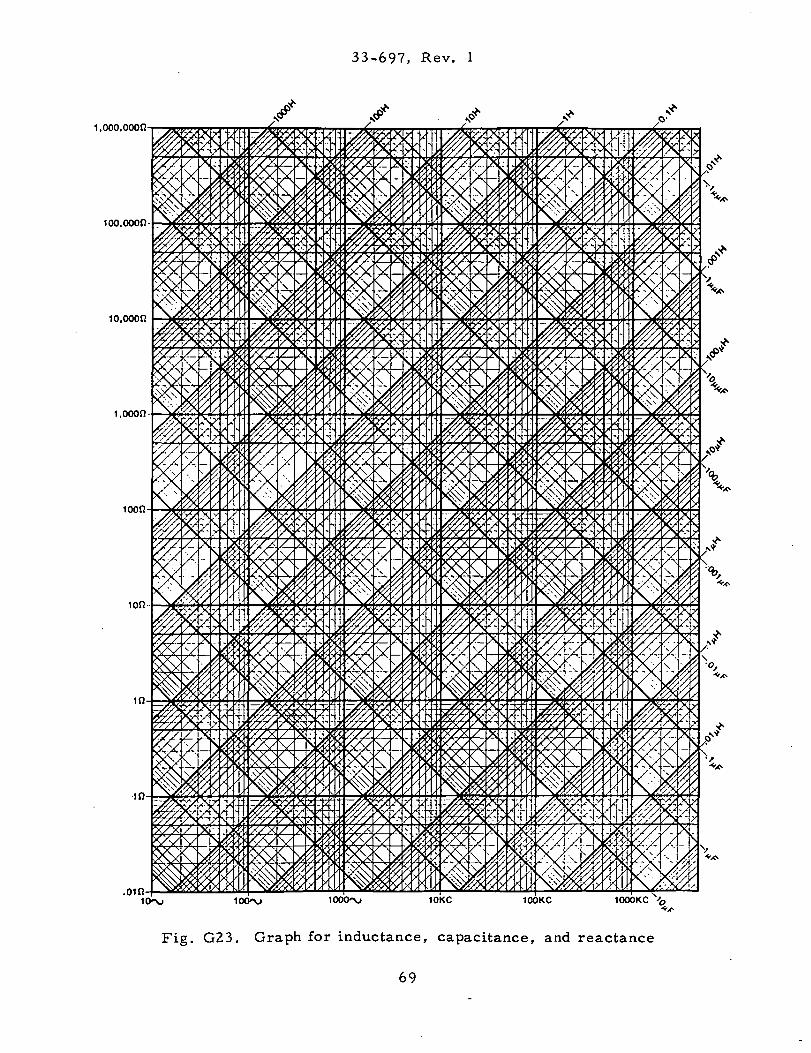
33-697, Rev. 1
i.ooo.ooon
^
loo.ooon
10.000(2
1,0000
ioon
ion
.oin
Fig. G23. Graph for inductance, capacitance, and reactance
69
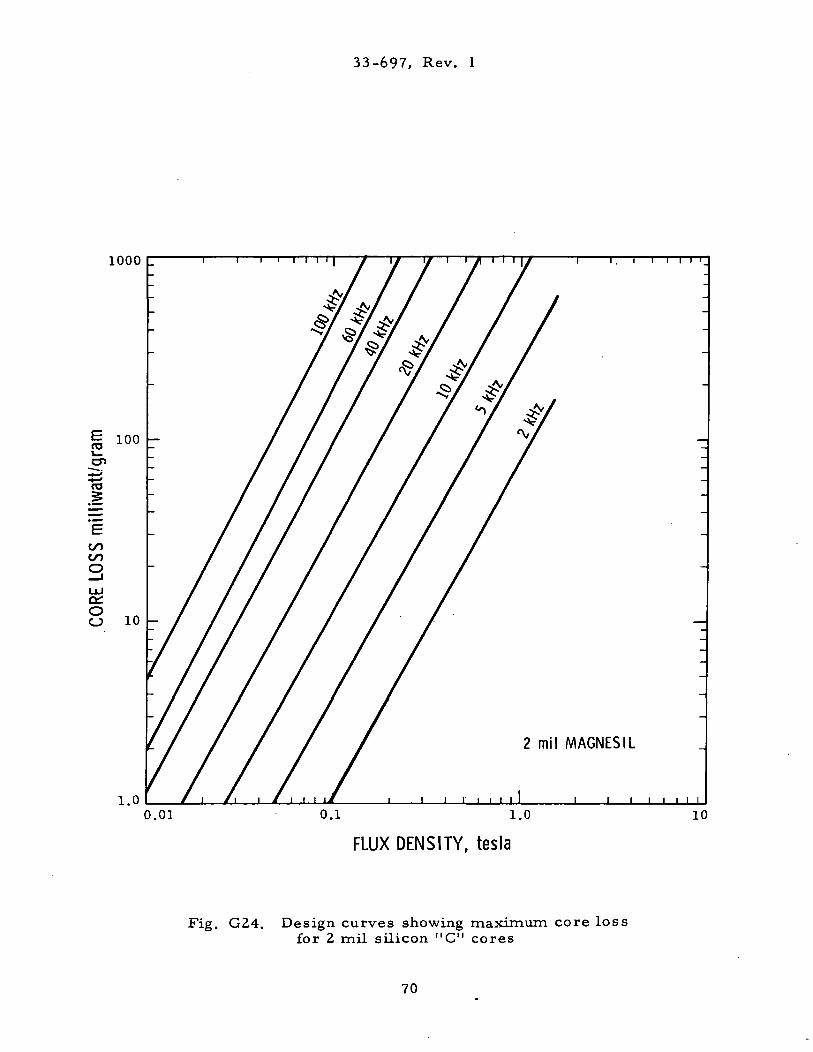
33-697, Rev. 1
1000
COCOo
8 10
1.0
I I . I
0.01
2 mil MAGNESIL
I I I I I
0.1 1.0
FLUX DENSITY, tesla
10
Fig. G24. Design curves showing maximum core lossfor 2 mil silicon "C" cores
70
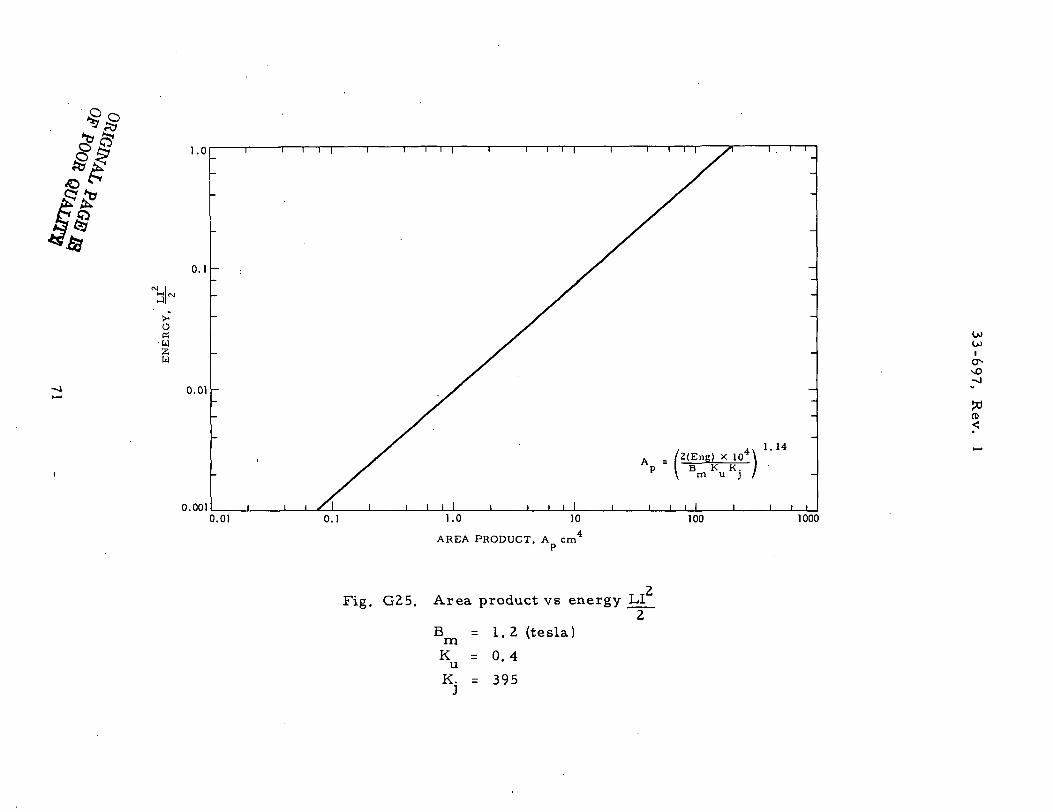
OK
• W2U
1.01 1 1 1—r~l 1 1 ! r ~ l i ' 1
o.oi -
0.0010.01 1000
AREA PRODUCT, A cmP
Fig. G25. Area product vs energy LI2
B = 1 . 2 (tesla)mK = 0 . 4
K. = 395
33-697, Rev. 1
REFERENCES
1. Molypermalloy Powder Cores. Catalog MPP-3035, Magnetic, Inc. ,Butler, Pa.
2. McLyman, C. , Design Parameters of Toroidal and Bobbin Magnetics.Technical Memorandum 33-651 Revision 1, Jet Propulsion Laboratory,Pasadena, Ca.
3. McL/yman, C. , Transformer Design Trade Offs. Technical Memorandum33-767, Jet Propulsion Laboratory, Pasadena, Ca.
4. Lee, R. , Electronic Transformer and Circuits, Second Edition. JohnWiley & Sons, New York, N. Y. 1958.
5. Blume, L. F. , Transformer Engineering. -John Wiley & Sons, Inc.New York, N. Y. 1938.
6. Magnetic Wire Datalator. REA Magnetic Wire Co. , Inc. , Fort Wayne,Ind. , 1958.
7. Silectron Cores Bulletin SC-107B, Arnold Engineering, Marengo, 111.
8. Orthosil Wound Cores Catalog No. W102-C, Thomas & Skinner, Inc. ,Indianapolis, Indiana.
72 NASA-JPl-Coml.. LA.. Calit.
Jt>- Page 1 of 2
TECHNICAL REPORT STANDARD TITLE PAGE
1. Report No. 33-69?, Rev. 1 2. Government Accession No.
4. Title and Subtitle
SIMPLIFIED CUT CORE INDUCTOR DESIGN
7. Author(s) _ ' . TT ... .. _v ' Colonel W. T. McLyman
9. Performing Organization Name ar
JET PROPULSION LABCCalifornia Institul4800 Oak Grove DriPasadena, Calif orn]
d Address
)RATORY;e of Technologyreta 91103
12. Sponsoring Agency Name and Address
NATIONAL AERONAUTICS AND SPACE ADMINISTRATIONWashington, D.C. 20546
3. Recipient's Catalog No.
5. Report DateNovember 1, 1976
6. Performing Organization Code
8. Performing Organization Report No.
10. Work Unit No.
11. Contract or Grant No.NAS 7-100
13. Type of Report and Period Covered
Technical Memorandum
14. Sponsoring Agency Code
15. Supplementary Notes
16. Abstract
Although filter inductor designers have routinely tended to specify molypermalloy powder cores for use in high frequency power converters and pulse-width modulated switching regulators, there are significant advantages inspecifying C cores and cut toroids fabricated from grain oriented siliconsteels which should not "be overlooked. Such steel cores can develop fluxdensities of 1.6 tesla, with useful linearity to 1.2 tesla, whereas molypermalloy cores carrying d.c. current have useful flux density capabilitiesonly to about 0.3 tesla. The use of silicon steel cores thus makes itpossible to design more compact cores, and therefore inductors of reducedvolume, or conversely to provide greater load capacity in inductors of agiven volume.
For years manufacturers have rated their cores with a number that representsits relative energy-handling ability. This method assigns to each core anumber which is the product of its window and core cross-section area, andis called "Area Product Ap." The author has developed a correlation betweenthe Ap numbers and current density J for a given temperature rise. Also,the author has developed straight-line relationships for Ap and Volume, A^and surface area At and,Ap and weight. These relationships can now be usedas new tools to simplify and standardize the process of inductor design.
17. Key Words (Selected by Author(s))
Air Transportation and SafetyGround Support Systems and Facilities(Space)
Spacecraft Communications, Command_ and TrackingJlommumcaii ons
18. Distribution Statement
Unclassified — Unlimited
19. Security Clossif. (of this report)
Unclassified
20. Security Clossif. (of this page)
Unclassified
21. No. of Pages
72
22. Price
HOW TO FILL OUT THE TECHNICAL REPORT STANDARD TITLE PAGE' . . . . . v I . . . - . . - . ' . . .
Make items 1, 4, 5, 9, 12, and 13 agree with the corresponding information on thereport cover. Use all capital letters for title (item 4). Leave items 2, 6, and -14.blank. Complete the remaining items as follows:
3. Recipient's Catalog No. Reserved for use by report recipients.
7. Author(s). Include corresponding information from the report cover. Inaddition, list the affiliation of an author if it differs from that of theperforming organization.
8. Performing Organization Report No. Insert if performing organizationwishes to assign this number.
10. Work Unit No. Use the agency-wide code (for example, 923-50-10-06-72),which uniquely identifies the work unit under which the work was authorized.Non-NASA performing organizations will leave this blank.
1 1. Insert the number of the contract or grant under which the report wasprepared.
15. Supplementary Notes. Enter information not included elsewhere but useful,such as: Prepared in cooperation with. . . Translation of (or by). .. Presentedat conference of. . . To be published in. . .
16. Abstract. Include a-brief "(not to exceed'200 words) factual summary of themost significant information contained in the report. If possible, the
*- abstract of a classified report should be unclassified. If the report contains• • a significant bibliography or literature survey, mention it here.'
17. .Key Words. Insert terms or short phrases selected by the author that identify.the principal subjects covered in the report, and that are sufficiently .specific and precise to be used for cataloging.
'18.- Distribution Statement! Enter one of the-authorized statements used to v
'. 'denote releasability to the public or a limitation on dissemination forreasons other than security of defense information. Authorized statementsare "Unclassified—Unlimited, " "U. S. Government and Contractors only, "
•- "U. S. Government Agencies only, " and "'NASA and NASA Contractors only. "
19. Security Classification (of report). NOTE: Reports carrying a securityclassification will require additional markings giving security and down-grading information as specified, by the Security Requirements Checklist
"" and the" tioD Industrial Security Manual (DoD 5220. 22-M).
20. Security Classification'(of this page). NOTE: Because this^-page may be •used in preparing announcements, bibliographies, and data banks, lit shouldbe unclassified if possible. If a classification is required, indicate sepa-rately the classification of the title and the abstract by following these itemswith either "(U)" for unclassified, or "(C)" or "(S)" as applicable forclassified items. J ' '
21. No. of Pages. Insert the number of pages.
22. Price. Insert the price set by the Clearinghouse-for Federal-Scientific andTechnical Information or the Government Printing Office, if known.
Page 2 of 2
TECHNICAL REPORT STANDARD TITLE PAGE
1. Report No. 33-697, Rev. 1 2. Government Accession No. 3. Recipient's Catalog No.
4. Title and Subtitle 5. Report Date
6. Performing Organization Code
7. Author(s) 8. Performing Organization Report No
9. Performing Organization Name and Address
JET PROPULSION LABORATORY
California Institute of Technology4800 Oak Grove Drive
Pasadena, California 91103
10. Work Unit No.
11. Contract or Grant No.NAS 7-100
13. Type of Report and Period Covered
12. Sponsoring Agency Name and Address
NATIONAL AERONAUTICS AND SPACE ADMINISTRATIONWashington, D.C. 20546
14. Sponsoring Agency Code
15. Supplementary Notes
16. Abstract
They also make it possible to design inductors of small bulk and volume orto optimize efficiency.
The adoption by NASA of the metric system for dimensioning to replace thelong-used English units imposes a requirement on the U.S. transformer de-signer to convert from the familiar units to the less familiar metricequivalents. Material is presented to assist in that transition in thefield of transformer design and fabrication.
17. Key Words (Selected by Author(s)) 18. Distribution Statement
19. Security Classif. (of this report) 20. Security Classif. (of this page) 21. No. of Pages 22. Price
X.
HOW TO FILL OUT THE TECHNICAL REPORT STANDARD TITLE PAGE
Make items 1, 4, 5, 9, 12, and 13 agree with the corresponding information on thereport cover. Use all capital letters for title (item 4). Leave items 2, 6, and 14blank. Complete the remaining items as follows;
3. Recipient's Catalog No. Reserved for use by report recipients.
7. Author(s). Include corresponding information from the report cover. Inaddition, list the affiliation of an author if it differs from that of theperforming organization.
8. Performing Organization Report No. Insert if performing organizationwishes to assign this number.
10. Work Unit No. Use the agency-wide code (for example, 923-50-10-06-72),which uniquely identifies the work unit under which the work was authorized.Non-NASA performing organizations will leave this blank.
11. Insert the number of the contract or grant under which the report wasprepared.
15. Supplementary Notes. Enter information not included elsewhere but useful,such as: Prepared in cooperation with. .. Translation of (or by). . . Presentedat conference of. . . To be published in. . .
16. Abstract. Include a brief (not to exceed 200 words) factual summary of themost significant information contained in the report. If possible, theabstract of a classified report should be unclassified. If the report contains
*- -'- - a significant-bibliography or literature survey, mention it here.
,17. Key Words. Insert terms or short phrases selected by the author that identifythe principal subjects covered in the report, and that are sufficientlyspecific and precise to be used for cataloging.
18. Distribution Statement. Enter one of the authorized statements used todenote releasability to the public or a limitation on dissemination forreasons other than security of defense information. Authorized statementsare "Unclassified—Unlimited, " "U.S. Government and Contractors only, ""U. S. Government Agencies only, " and "NASA and NASA Contractors only. "
19. Security Classification (of report). NOTE: Reports carrying a securityclassification will require additional markings giving security and down-grading information as specified by the Security Requirements Checklistand the DoD Industrial Security Manual (DoD 5220. 22-M).
20. Security Classification (of this page). NOTE: Because this page may beused in preparing announcements, bibliographies, and data banks, it shouldbe unclassified if possible. If a classification is required, indicate sepa-rately the classification of the title and the abstract by following these itemswith either "(U)" for unclassified, or "(C)" or "(S)" as applicable forclassified items.
21. No. of Pages. Insert the number of pages.
22. Price. Insert the price set by the Clearinghouse for Federal Scientific andTechnical Information or the Government Printing Office, if known.