Embed Size (px)
Citation preview

Sickle Cell Disease: Genetics, Cellular and Molecular Mechanisms, and Therapies
Anemia
Guest Editors: Betty S. Pace, Solomon F. Ofori-Acquah, and Kenneth R. Peterson

Sickle Cell Disease: Genetics, Cellular andMolecular Mechanisms, and Therapies

Anemia
Sickle Cell Disease: Genetics, Cellular andMolecular Mechanisms, and Therapies
Guest Editors: Betty S. Pace, Solomon F. Ofori-Acquah,and Kenneth R. Peterson

Copyright © 2012 Hindawi Publishing Corporation. All rights reserved.
This is a special issue published in “Anemia.” All articles are open access articles distributed under the Creative Commons AttributionLicense, which permits unrestricted use, distribution, and reproduction in any medium, provided the original work is properly cited.

Editorial Board
Bruno Annibale, ItalyEdward J. Benz, USADuran Canatan, TurkeyFernando F. Costa, BrazilEitan Fibach, IsraelMaria S. Figueiredo, BrazilAjit C. Gorakshakar, IndiaS. Ha, Hong KongH. Heimpel, Germany
Maureen E. Hoatlin, USAHans Joenje, The NetherlandsG. J. Kontoghiorghes, CyprusVichai Laosombat, ThailandJohnson M. Liu, USAMaurizio Longinotti, ItalyDimitris Loukopoulos, GreeceIain C. Macdougall, UK
Aurelio Maggio, ItalyJohn Meletis, GreeceA. Piga, ItalyK. Sanchaisuriya, ThailandDonald S. Silverberg, IsraelMaria Tsironi, GreeceG. R. Vreugdenhil, The NetherlandsJohn S. Waye, Canada

Contents
Sickle Cell Disease: Genetics, Cellular and Molecular Mechanisms, and Therapies, Betty S. Pace,Solomon F. Ofori-Acquah, and Kenneth R. PetersonVolume 2012, Article ID 143594, 2 pages
Foetal Haemoglobin, Erythrocytes Containing Foetal Haemoglobin, and Hematological Features inCongolese Patients with Sickle Cell Anaemia, L. Tshilolo, V. Summa, C. Gregorj, C. Kinsiama,J. A. Bazeboso, G. Avvisati, and D. LabieVolume 2012, Article ID 105349, 7 pages
Induction of Fetal Hemoglobin In Vivo Mediated by a Synthetic γ-Globin Zinc Finger Activator,Flavia C. Costa, Halyna Fedosyuk, Renee Neades, Johana Bravo de Los Rios, Carlos F. Barbas III,and Kenneth R. PetersonVolume 2012, Article ID 507894, 8 pages
Sickling Cells, Cyclic Nucleotides, and Protein Kinases: The Pathophysiology of Urogenital Disorders inSickle Cell Anemia, Mario Angelo Claudino and Kleber Yotsumoto FertrinVolume 2012, Article ID 723520, 13 pages
Spatiotemporal Dysfunction of the Vascular Permeability Barrier in Transgenic Mice with Sickle CellDisease, Samit Ghosh, Fang Tan, and Solomon F. Ofori-AcquahVolume 2012, Article ID 582018, 6 pages
Hematopoietic Stem Cell Function in a Murine Model of Sickle Cell Disease, Elisabeth H. Javazon,Mohamed Radhi, Bagirath Gangadharan, Jennifer Perry, and David R. ArcherVolume 2012, Article ID 387385, 9 pages
Integrating Interactive Web-Based Technology to Assess Adherence and Clinical Outcomes in PediatricSickle Cell Disease, Lori E. Crosby, Ilana Barach, Meghan E. McGrady, Karen A. Kalinyak, Adryan R. Eastin,and Monica J. MitchellVolume 2012, Article ID 492428, 8 pages
Elevated Circulating Angiogenic Progenitors and White Blood Cells Are Associated withHypoxia-Inducible Angiogenic Growth Factors in Children with Sickle Cell Disease,Solomon F. Ofori-Acquah, Iris D. Buchanan, Ifeyinwa Osunkwo, Jerry Manlove-Simmons, Feyisayo Lawal,Alexander Quarshie, Arshed A. Quyyumi, Gary H. Gibbons, and Beatrice E. GeeVolume 2012, Article ID 156598, 9 pages
FK228 Analogues Induce Fetal Hemoglobin in Human Erythroid Progenitors, Levi Makala,Salvatore Di Maro, Tzu-Fang Lou, Sharanya Sivanand, Jung-Mo Ahn, and Betty S. PaceVolume 2012, Article ID 428137, 13 pages
Association of Oxidative Stress Markers with Atherogenic Index of Plasma in Adult Sickle CellNephropathy, M. A. Emokpae and P. O. UadiaVolume 2012, Article ID 767501, 5 pages
Sickle Cell Disease Activates Peripheral Blood Mononuclear Cells to Induce Cathepsins K and V Activityin Endothelial Cells, Philip M. Keegan, Sindhuja Surapaneni, and Manu O. PlattVolume 2012, Article ID 201781, 7 pages
Hindawi Publishing CorporationAnemiaVolume 2012, Article ID 143594, 2 pagesdoi:10.1155/2012/143594
Editorial
Sickle Cell Disease: Genetics, Cellular and Molecular Mechanisms,and Therapies
Betty S. Pace,1 Solomon F. Ofori-Acquah,2 and Kenneth R. Peterson3
1 Department of Pediatrics, Georgia Health Sciences University, 1120 15th Street, BT-1852, Augusta, GA 30912, USA2 Department of Pediatrics, Emory University School of Medicine, 2015 Uppergate Drive NE, Atlanta, GA 30322, USA3 Department of Biochemistry and Molecular Biology, University of Kansas Medical Center, 3901 Rainbow Boulevard, MS 3030,Kansas City, KS 66160, USA
Correspondence should be addressed to Betty S. Pace, [email protected]
Received 3 June 2012; Accepted 3 June 2012
Copyright © 2012 Betty S. Pace et al. This is an open access article distributed under the Creative Commons Attribution License,which permits unrestricted use, distribution, and reproduction in any medium, provided the original work is properly cited.
Sickle cell disease (SCD) is a global public health disorderthat affects millions of people across the globe. It is amonogenic disorder caused by an A-to-T point mutationin the β-globin gene that produces abnormal hemoglobinS (Hb S), which polymerizes in the deoxygenated state,resulting in physical deformation or sickling of erythrocytes.Sickle erythrocytes promote vaso-occlusion and hemolysis,which are two major cellular hallmarks of the disease. Rapidadvances made in understanding the molecular genetics ofSCD in the early part of the 20th century have not beenmatched by comparable progress towards understanding itsclinical complications, and developing effective therapies.Contemporary reevaluation of SCD as the product of mul-tiple gene interactions promises to overcome the historicalconstraints of the single-gene disease paradigm that hasinevitably impeded translation of research discoveries intoclinical benefit.
Two landmark papers in the late 1940s by the Nobellaureates Linus Pauling and Janet Watson provided themolecular bases for SCD and a rational strategy to treat thedisease. The publication by Pauling et al., Sickle Cell Anemia,a Molecular Disease, in Nature in 1949 established SCD as thefirst molecular human disease, and it established the inher-itance pattern of the disorder and of monogenic diseasesgenerally. In addition, that seminal work laid the foundationfor the explosion of knowledge in human molecular geneticsdecades later that gave birth to a new discipline calledgene therapy. The publication by Watson The Significanceof the Paucity of Sickle Cells in Negro Infants provided theconcept that fetal hemoglobin (Hb F) ameliorates the clinical
presentation of SCD for the first time in 1948, ushering inone of the most intensely studied areas of SCD research.
Advancements in Genetics, Cellular and Molecular Mech-anisms, and Therapy of SCD in the two decades following theseminal works by Pauling and Watson were driven primarilyby studies on the erythrocyte, involving polymerization ofHb S and antisickling hemoglobin variants, rheology, andred cell membrane. A highlight amongst these studies wasthe landmark work by Kan and Dozy published in thearticle DNA Sequence Adjacent to the Human Beta-GlobinStructural Gene: Relationship to Sickle Mutation. That studydescribed the presence of single-nucleotide polymorphismsin the human genome for the first time, and it initiateda new avenue of research that led to the discovery of themulticentric origin of the sickle mutation, and it laid thefoundations for genetic association studies in SCD, which arecurrently a major focus of several investigations.
The scope of SCD research expanded beyond the ery-throcyte in the 1980s to encompass vascular biology, notablythe endothelium, coagulation, and inflammation. Twentyyears later, the most compelling evidence that these factorsplay a critical role in the pathogenesis of SCD is thedemonstration that tumor necrosis factor induced adhesionof leukocytes to the vascular endothelium provides the initialcellular events of vaso-occlusion in a mouse model of SCD.Paradigm-shifting insights into the mechanisms of globingene expression spearheaded by the discovery of the locuscontrol region (LCR) by two groups in the 1990s heraldeda new era in SCD research. First, these insights helpedto create developmentally regulated and clinically relevant
2 Anemia
transgenic mouse models of SCD. Second, they permittedthe development of efficacious DNA vectors for gene therapyof SCD that continue to improve as novel elements of genedelivery systems become available and are incorporated intonewer generation vectors.
The current special issue of Anemia contains originalresearch articles about progress made towards Hb F induc-tion using novel pharmacological agents and artificial zincfinger transcription factors, and a web-based tool to evaluateadherence to hydroxyurea therapy. The latter tool representsefforts to integrate new technology to improve the clinicalcare of individuals with SCD. Also included in this issue isthe first report from a Congolese group of the associationof Hb F levels with clinical severity in this population.Several articles report alteration in redox environment andlink this phenomenon to impaired hematopoietic progenitorand stem cell function improved by treatment with n-acetyl cysteine in transgenic SCD mice, reduced migrationof endothelial progenitors cells derived from children whohave SCD, and lastly an association of oxidative stressmarkers with an atherogenic index in adults with sicklenephropathy. What is known about the deleterious effectsof sickling on the genitourinary tract and the role ofcyclic nucleotide signaling is reviewed. Finally, articles reporttwo endothelial dysfunction including increased activity ofthe elastase cathepsin K, and age-dependent increase, invascular permeability, that culminates in pulmonary edemain middle-aged SCD mice.
The wide variety of experimental studies in this specialissue represents potentially new therapeutic tools, rangingfrom novel approaches for Hb F induction, improvedstem cell function and a biomarker to predict risk forSCD nephropathy. Furthermore, the findings of endothelialdysfunction via upregulated cathepsin activity may representa new pharmacologic target to block accelerated arterialdisease observed in children with SCD. The reports in thisissue will aid research efforts to close the gap betweenunderstanding SCD genetics and developing effective newclinical care approaches and therapeutic options.
Betty S. PaceSolomon F. Ofori-Acquah
Kenneth R. Peterson
Hindawi Publishing CorporationAnemiaVolume 2012, Article ID 105349, 7 pagesdoi:10.1155/2012/105349
Research Article
Foetal Haemoglobin, Erythrocytes Containing FoetalHaemoglobin, and Hematological Features in Congolese Patientswith Sickle Cell Anaemia
L. Tshilolo,1, 2 V. Summa,3 C. Gregorj,3 C. Kinsiama,1 J. A. Bazeboso,1
G. Avvisati,3 and D. Labie4
1 Unite de Depistage de la Drepanocytose, Centre Hospitalier Monkole, BP 817, Kinshasa XI, Democratic Republic of Congo2 Centre de Formation et d’Appui Sanitaire (CEFA), 10, Avenue Kemi, Mont Ngafula, Kinshasa, Democratic Republic of Congo3 Servizio di Ematologia, Universita Campus Bio-Medico di Roma, 21, Via Alvaro del Portillo, 00128 Roma, Italy4 INSERM, Institut Cochin, 4, rue du Faubourg Saint-Jacques, 75014 Paris, France
Correspondence should be addressed to L. Tshilolo, [email protected]
Received 2 January 2012; Revised 14 April 2012; Accepted 7 May 2012
Academic Editor: Betty S. Pace
Copyright © 2012 L. Tshilolo et al. This is an open access article distributed under the Creative Commons Attribution License,which permits unrestricted use, distribution, and reproduction in any medium, provided the original work is properly cited.
High HbF levels and F cells are correlated with reduced morbidity and mortality in sickle cell disease (SCD). This paper wasdesigned to determine the HbF and F cells levels in Congolese sickle cell anemia (SCA) patients in order to determine their impacton the expression of SCD. Population and Method. HbF levels were measured in 89 SCA patients (mean age 11.4 yrs) using astandard HPLC method. F cell quantitation was done in a second group of SCA patients (n = 42, mean age 8.9 yrs) and comparedwith a control group (n = 47, mean age 5 yrs). F cells were quantified by a cytofluorometric system (MoAb-HbF—FITC; cut off at0.5%). Results. The mean value of HbF was 7.2%± 5.0 with heterogeneous distribution, most patients (76%) having HbF < 8%.Mean values of F-cells in SCA patients and control group were 5.4%± 7.6 (median: 2.19% ; range 0,0–30,3%) and 0.5%± 1.6(median 0.0, range 0–5.18), respectively. SCA patients with F cells >4.5% developed less painful crisis and had higher percentageof reticulocytes. Conclusion. Congolese SCA patients displayed low levels of HbF and F-cells that contribute to the severity of SCD.
1. Introduction
Fetal hemoglobin (HbF, a2.2) is a major contributor to thephenotypic heterogeneity of sickle cell anemia (SCA). Amajor ameliorating factor is an inherent ability to producefetal hemoglobin; elevated levels are correlated with reducedmorbidity and mortality in patients with SCA [1–3].
In normal adults, HbF levels are distributed in a nonuni-form way in the red cells with a range varying from 0.1 to 7%of total hemoglobin (Hb). In red cells producing higher HbF(termed F cells), HbF is elevated (around 25% of cellular Hb)and genetically determined [2, 4, 5].
Genetic variation at three principal loci—the HBB clus-ter on chromosome 11p, HBS1L-MYB region on chro-mosome 6q and BCL11A on chromosome 2p—have beenshown to influence HbF levels and disease severity in ßthalassemia and SCA. Taking into account these loci, there is
still substantial residual variance in HbF levels, suggesting theimportance of other quantitative trait loci (QTL) modulatingHBG expression [4, 6].
Total Hb and HbF levels vary in SCA patients accordingto the βS haplotypes: values are greater in patients bearingthe Arabo-Indian and Senegalese haplotypes and less in thosewith the Bantu or Central African haplotype [2, 4, 6–8].
Sickle cell disease (SCD) has a high prevalence in Sub-Saharan Africa where majority of the affected patients live. BS
gene prevalence in the Democratic Republic of Congo (DRC)is around 25% and about 1.7% of newborns are affected(50,000 births per year) [9].
Expression of SCA in Congolese patients displayed asevere form with high mortality and complications [10].
To our knowledge, there are no specific data on HbF andF cells reported in SCA patients living in DRC. We thereforepresent here the preliminary analysis of HbF and F cells
2 Anemia
in two series of SCA patients and correlations with otherhematological parameters and clinical data.
2. Population and Methods
All patients were SS homozygotes regularly followed up incomprehensive sickle cell programs in DRC.
A first study quantified HbF in steady state SCA patientsfollowed up in Lubumbashi (n = 48) and Kinshasa (n = 41),a total of 89 patients (34 M, 48 F; mean age 11.4 yrs ± 5.4).No patient was on hydroxyurea treatment.
The second study involved 42 SCA patients (23F, 24 M;mean age 8.8 yrs ± 5.1) and a control group of 47 non-SCApatients (26 F, 21 M; mean age 5 yrs ± 5.1) recruited in Kin-shasa. In this study, we assessed F Cells numbers and com-pared the results to hematologic parameters and clinical data.
Diagnosis of SCA was established using standard hemo-globin electrophoresis techniques (acetate electrophoresis orIsoelectric focusing-IEF) coupled to Itano solubility test. Thepercentage of HbF was determined by high performanceliquid chromatography (HPLC).
HbF expression was evaluated using a previously describ-ed flow cytometric procedure [11, 12] with slight modifi-cations. In brief, twenty microliters of whole blood werefixed with 1 mL ice-cold 0.05% glutaraldehyde in PBS pH7.4 vortexed for 15 seconds (s), then incubated at roomtemperature (RT) for 10 min. The cells were washed twicewith PBS, permeabilized by vortexing for 15 s with 0.5 mLice-cold 0.1% Triton X-100 (Sigma, Milan) in 0.1% bovineserum albumin in PBS (BSA-PBS), and incubated at RT for5 min. The cells were then washed once with 0.1% BSA-PBSand suspended in 0.5 mL 0.1% BSA-PBS.
Ten microliters of cell suspension were then mixed with20 μL of 1-in-5 diluted MoAb-HbF-FITC (IQ products,Milan) in 0.1% BSA-PBS and 70 μL of 0.1% BSA-PBS andincubated in the dark at RT for 15 min. An irrelevant mouseantibody of the appropriate subclass was used as a negativecontrol to determine background fluorescence. The cellswere washed once with 0.1% BSA-PBS and immediatelymeasured by flow cytometry (as described below).
The flow cytometer analysis reported the percentage ofF+ cells in total counted red blood cells of each sample.The positive cut off point was set at 0.5% above negativepopulation of isotype control staining cells.
HbF expression was, also, analyzed using the Kolmo-gorov-Smirnov statistic test (D-value), which allows theobjective and accurate identification of small differences influorescence intensity [13]. Samples with D < 0.15 wereconsidered negative, whereas those with a D ≥ 0.15 wereconsidered positive.
Modified technique for evaluating HbF expression: con-sidering the complexity of the previous procedure foridentifying the F+ cells, we applied a second flow cytometrictechnique to perform F+ cells evaluation. This method (rou-tinely utilized for characterizing other cellular parameters, asfor example MDR in patients affected by acute leukemias)enabled us to test the samples more conveniently, usingfewer and simpler steps, and a precise identification of the
red blood cells population in the flow cytometric dot plot,useful for a specific analysis. In addition, this technique ledto increased capacity to analyze more samples together thanthe previous one.
Twenty microliters of whole blood were fixed (Fix andPerm permeabilization kit; Caltag Laboratories) with 100 μLof Medium A at room temperature (RT), in the dark, for15 min; then cells were washed once with PBS, and thenafter incubated with 100 μL of Medium B and 4 μL ofMoAb-HbF-FITC at RT, in the dark for 30 min. Finally, cellswere washed once with PBS, and immediately measured byflow cytometry. The flow cytometric analysis was performedconsidering the same parameters used for the previouslydescribed technique [11, 12].
Flow cytometric analysis was conducted using a FACScanflow cytometer (Becton Dickinson), operated at 488 nmwhich detects green (MoAb-HbF-FITC) fluorescence. Dataacquisition and analysis were performed with the CellQuestsoftware (Becton Dickinson). We measured 50,000 events.The red blood cell area was gated by forward scatter signals(FSC) versus side scatter signals (SSC). The latter was meas-ured using the logarithmic scales (log SSC).
Comparison of hematological parameters (Blood cellcounts and HbF levels) were made with other reports of Afri-can SCA patients [14–17].
These studies were approved by the Local Ethnic Com-mittees of the participating institutions, Campus Biomedicodi Roma, and The CEFA/Centre Hopsitalier Monkole, inaccordance with the Declaration of Helsinki.
Statistical analyses were conducted with a software prog-ram SPSS system (Version 12, Chicago). Results were ex-pressed as the mean value and median value: standard devia-tion(SD). Comparisons of means were analysed by Studentst-test, correlations by Pearsons test, and comparison betweencategorical variables by Chi square test or Fishers exact test(where appropriated).
HbF expression (D-value) and F+ cells were representedas dichotomized variable (positive versus negative). Datawere analyzed using the two-sided Student’s t-test to corre-late results obtained by mean of the two different parametersof analysis and the two flow cytometric techniques, whileMann-Whitney U-test was used to measure the differencesobserved between positive and control groups.
Values were considered statistically significant when P <0.05.
3. Results
3.1. Patients Population. In the first study of 89 SCA patients,the mean HbF% was 7.2% ± 5.0 (median 5.9; range 1–27.5%). It was 7% and 7.4% in the Lubumbashi and Kinshasagroup, respectively (P > 0.05). Values of HbF were higher infemales (7.4%, mean age 10.4 yrs) than in males (6.9%, meanage 9.2 yrs), but the difference was not statistically significant(Mann Whitney test chi square = 0.018, degree of freedom= 1, P = NS). Higher values were observed in children agedless than 3 yrs but no statistical differences were observedbetween the different age groups.
Anemia 3
16
14
12
10
8
6
4
2
01 2 3 4 5 6 7 8 9 10 11 12 13 14 15 16 17 18 19 20 21 21>
HbF (%)
Nu
mbe
r of
cas
es
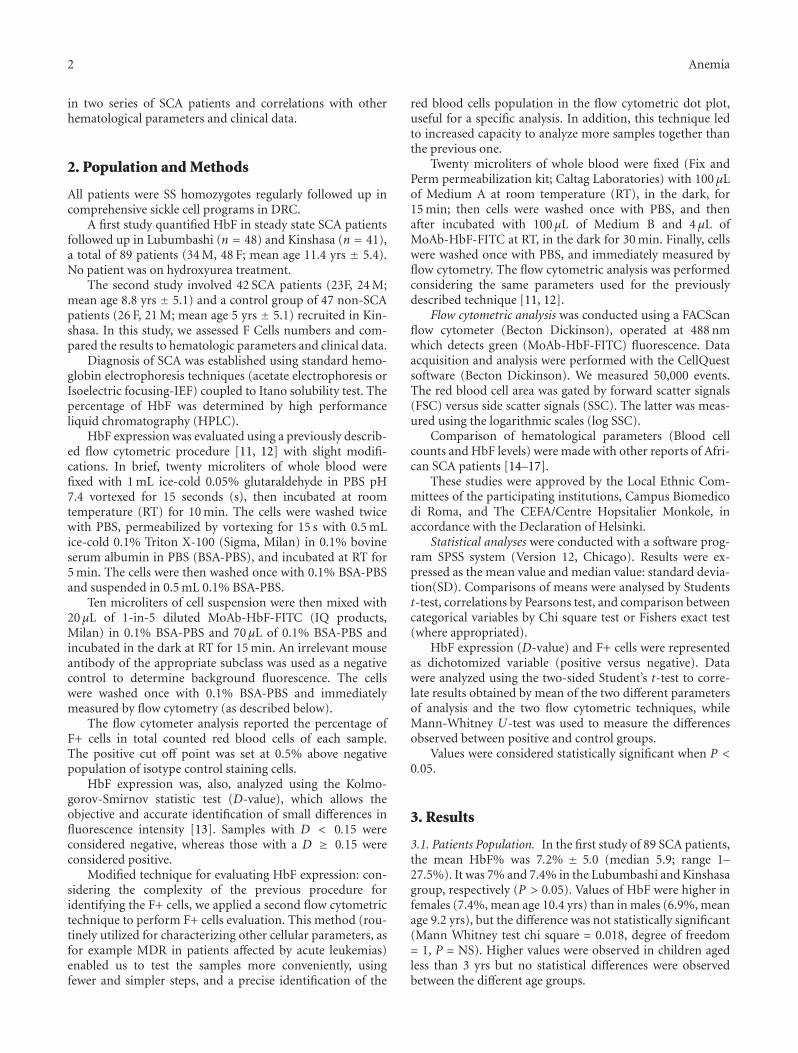
Figure 1: Population distribution of the HbF rate. Patient distribu-tion related to HbF rate displayed a heterogeneous pattern with apredominant group (74%) with HbF% <8. GIobally, only 20/89 (or22.5%) of patients displayed values higher than 10% of HbF.
Distribution of HbF rate displayed a heterogeneous pat-tern with a predominant group (66/89 or 74%) with HbF <8% and two other groups with 9–13% and 14–17%. Globally,levels of HbF were less than 10% in 69/89 of cases (77.5%)and varied considerably; the distribution pattern was notnormal even after log transformation of values (not shown),(Figure 1).
In the second study, enumeration of erythrocytes con-taining HbF (F cells) using the first, standard flow cytometrictechnique resulted in mean %. SD of F+ cells in 42 SCDsamples of 5.44%± 7.6 (median: 2.19%; range 0.00–30.3%).The mean D-value. SD was 0.21± 0.007 (median: 0.33; range0.07–0.57). In the 47 controls, the mean %± SD of F+ cellswas 0.50%± 1.06 (median: 0; range 0–5.18%), and the meanD-value ± SD was 0.024 ± 0.034 (median: 0; range 0–0.15)(Figure 2).
Correlation among F+ cells % and D-value for the entirepopulation was highly significant with a r = 0.67 (P <0.0001). The comparison among SCD patients and controlsas for the % of F+ Cell andD-value was also highly significant(P < 0.001 for both F+ cells % and D-value).
The evaluation of the samples with the Fix & Perm flowcytometric technique showed a mean %. SD of F+ cellsof 8.67%. 13.48 (median: 4.63; range 0–57.75%), while themeanD-value. SD was 0.19. 0.17 (median: 0.15; range 0–0.7).
Comparison of the two flow cytometric techniquesshowed strong correlation for F+ cells values (r = 0.63; P =0.0005) and for D-value parameters (r = 0.53; P < 0.005).40/42 of SCA patients (95%) had values above the cut-off
value of 0.5% while in the control group, only 12/47 subjects(25.5%) had values above the cut off.
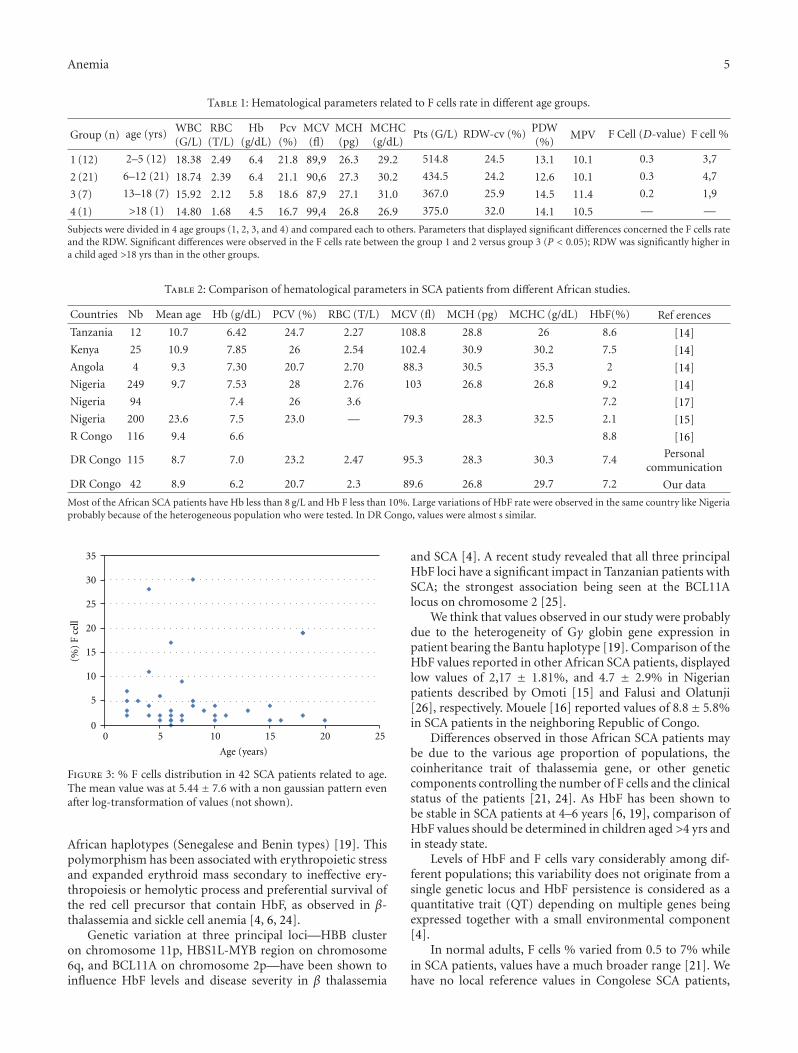
Population distribution of % F cells were heterogeneousand displayed a nonnormal distribution even after log-transformation of values (Figure 3). Patients aged <12 yrsdisplayed higher values than older patients: mean values of
3.7 were observed in group 1 and 4.7 in group 2 versus 1.9 ingroup 3 (Table 1).
3.2. Comparison of %F Cells with Hematological Parametersand Clinical Issue. We found no significant correlationsbetween the results obtained by cytometry system with theglutaraldehyde method with clinical and biological data; butwith the Fix & Perm method, the number of vaso-occlusivecrisis was significantly reduced in patients with F cells rate>4.5% (P < 0.05) while the reticulocytes number wassignificantly elevated (P < 0.005).
We did not observe significant differences betweenhaematological parameters (Hb, MCV, MCH, and MCHC)in different age groups, although children aged >18 yrdisplayed higher value of RDW (Table 1).
Comparisons of hematological parameters in our pa-tients with those described in other African SCA patients aredepicted in Table 2.
4. Discussion
Hematological characteristics and clinical severity in SCA arevariable and are influenced by environmental and geneticfactors, including the presence of α-thalassemia, variationin Hb F level, and the haplotype background that is linkedto the β globin gene [14]. The Bantu or CAR haplotype isconsidered as a major risk factor associated with clinicallysevere form of SCD and organ damage [7, 18, 19]. Most ofthe SCA patients living in central Africa and in DRC carrythe CAR haplotype [20].
The protective role of HbF in the sickling of red cells andthe clinical severity of SCD is evident. The HbF level hasemerged as an important prognostic factor both for sickle cellpain and mortality; and a %HbF > 10% has been suggested asa threshold level for reduced clinical severity [5, 6, 19, 21, 22].
Different studies on HbF levels in SCA patients bearingCAR haplotypes reported levels values varying from 2 to10.8%, but generally less than 10% [14, 18, 19, 23, 24]. Todate, no values of HbF levels have been reported in CongoleseSCA patients living in DRC. The mean value of 7.2% HbFobserved in our study confirmed that patients bearing theCAR haplotype had levels of HbF less than 10%, the minimallevel that permits a protective role on the sickling of red cells[2, 19]. We found no significant differences in Hb levels inour patients related to sex or age although recent studiesconfirmed that adult females have higher HbF and F Cellsvalues than males because of the presence of an X-linkedQTL (Quantitative Trait locus) [4, 6]. Mouele [16] reportedsimilar data in the neigboring Congo Brazzaville.
Nagel et al. [19] suggested that the HbF level in SCApatients aged more than 5 yrs was dependent of the C-Tmutation at position −158 Gγ in the promoter of the Gγglobin gene (known as the Xmn I-Gγ site) [23]. They alsofound mean levels of HbF at 6.4% and 12.4% in the groupswith a rate of Gγ < 38% and Gγ > 38%, respectively.The presence or absence of alpha deletion did not modifythese observations. Patients with CAR haplotype had alow Gγ globin gene expression in comparison to the other
4 Anemia
SCD patients
Fix and perm
Flow cytometric aspects
Glutaraldehyde
SSC
FCS
Even
ts
%F + cells = 9.07
MoAb-HbF + MoAb-HbF +
M1
100 101 102 103 104
1024
0
1000
800
600
400
200
0
1023
010008006004002000 10230
SSC
-hei
ght
FSC-height
Controls
SSC
FCS
Even
ts
%F + cells = 0
M1
100 101 102 103 1040
256
1000
800
600
400
200
010008006004002000
(a) (b)
(a)
100 101 102 103 104
100 101 102 103 104
Even
ts
0
100 101 102 103 104
512
0
100
80
60
40
20
Even
ts
Even
ts (
%)
0
100
80
60
40
20
0
256
MoAb-HbF
MoAb-HbF
lgG1
lgG1
Channels
100 101 102 103 104
SCD patients
KS value
(a)
(b) Controls
D-value = 0.44
D-value = 0
(b)
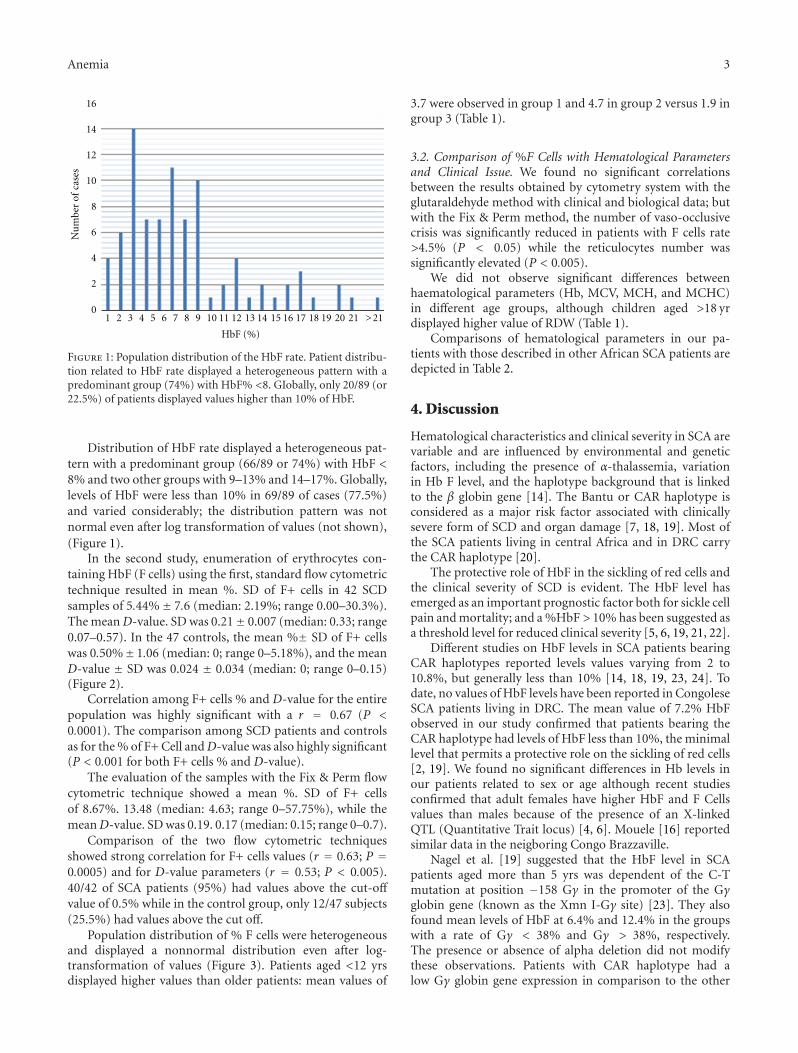
Figure 2: Illustration of flow cytometric and KS aspects of F cells values in a SCA patient and a control. HbF expression was, also, analyzedusing the Kolmogorov-Smirnov (KS) statistic test (D-value), which allows the objective and accurate identification of small differences influorescence intensity. Samples were considered positive when D ≥ 0.15.
Anemia 5
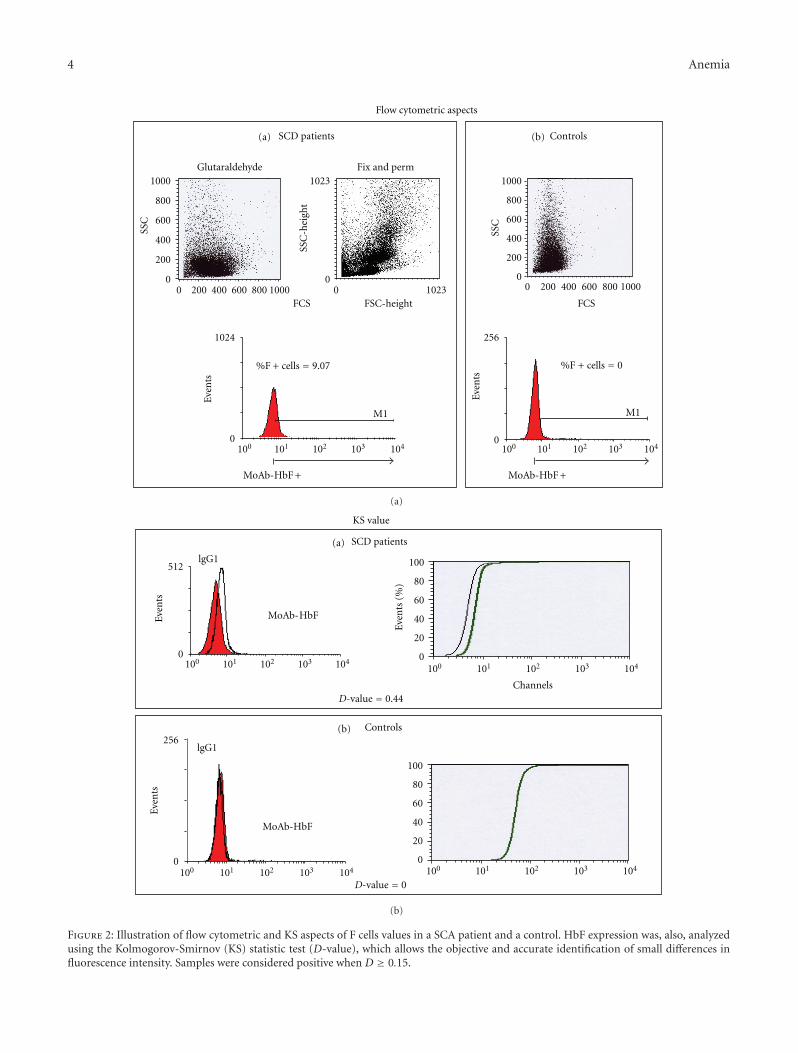
Table 1: Hematological parameters related to F cells rate in different age groups.
Group (n) age (yrs) WBC(G/L)
RBC(T/L)
Hb(g/dL)
Pcv(%)
MCV(fl)
MCH(pg)
MCHC(g/dL)
Pts (G/L) RDW-cv (%) PDW(%)
MPV F Cell (D-value) F cell %
1 (12) 2–5 (12) 18.38 2.49 6.4 21.8 89,9 26.3 29.2 514.8 24.5 13.1 10.1 0.3 3,7
2 (21) 6–12 (21) 18.74 2.39 6.4 21.1 90,6 27.3 30.2 434.5 24.2 12.6 10.1 0.3 4,7
3 (7) 13–18 (7) 15.92 2.12 5.8 18.6 87,9 27.1 31.0 367.0 25.9 14.5 11.4 0.2 1,9
4 (1) >18 (1) 14.80 1.68 4.5 16.7 99,4 26.8 26.9 375.0 32.0 14.1 10.5 — —
Subjects were divided in 4 age groups (1, 2, 3, and 4) and compared each to others. Parameters that displayed significant differences concerned the F cells rateand the RDW. Significant differences were observed in the F cells rate between the group 1 and 2 versus group 3 (P < 0.05); RDW was significantly higher ina child aged >18 yrs than in the other groups.
Table 2: Comparison of hematological parameters in SCA patients from different African studies.
Countries Nb Mean age Hb (g/dL) PCV (%) RBC (T/L) MCV (fl) MCH (pg) MCHC (g/dL) HbF(%) Ref erences
Tanzania 12 10.7 6.42 24.7 2.27 108.8 28.8 26 8.6 [14]
Kenya 25 10.9 7.85 26 2.54 102.4 30.9 30.2 7.5 [14]
Angola 4 9.3 7.30 20.7 2.70 88.3 30.5 35.3 2 [14]
Nigeria 249 9.7 7.53 28 2.76 103 26.8 26.8 9.2 [14]
Nigeria 94 7.4 26 3.6 7.2 [17]
Nigeria 200 23.6 7.5 23.0 — 79.3 28.3 32.5 2.1 [15]
R Congo 116 9.4 6.6 8.8 [16]
DR Congo 115 8.7 7.0 23.2 2.47 95.3 28.3 30.3 7.4 Personalcommunication
DR Congo 42 8.9 6.2 20.7 2.3 89.6 26.8 29.7 7.2 Our data
Most of the African SCA patients have Hb less than 8 g/L and Hb F less than 10%. Large variations of HbF rate were observed in the same country like Nigeriaprobably because of the heterogeneous population who were tested. In DR Congo, values were almost s similar.
0 5 10 15 20 25
Age (years)
(%)
F ce
ll
35
30
25
20
15
10
5
0
Figure 3: % F cells distribution in 42 SCA patients related to age.The mean value was at 5.44± 7.6 with a non gaussian pattern evenafter log-transformation of values (not shown).
African haplotypes (Senegalese and Benin types) [19]. Thispolymorphism has been associated with erythropoietic stressand expanded erythroid mass secondary to ineffective ery-thropoiesis or hemolytic process and preferential survival ofthe red cell precursor that contain HbF, as observed in β-thalassemia and sickle cell anemia [4, 6, 24].
Genetic variation at three principal loci—HBB clusteron chromosome 11p, HBS1L-MYB region on chromosome6q, and BCL11A on chromosome 2p—have been shown toinfluence HbF levels and disease severity in β thalassemia
and SCA [4]. A recent study revealed that all three principalHbF loci have a significant impact in Tanzanian patients withSCA; the strongest association being seen at the BCL11Alocus on chromosome 2 [25].
We think that values observed in our study were probablydue to the heterogeneity of Gγ globin gene expression inpatient bearing the Bantu haplotype [19]. Comparison of theHbF values reported in other African SCA patients, displayedlow values of 2,17 ± 1.81%, and 4.7 ± 2.9% in Nigerianpatients described by Omoti [15] and Falusi and Olatunji[26], respectively. Mouele [16] reported values of 8.8± 5.8%in SCA patients in the neighboring Republic of Congo.
Differences observed in those African SCA patients maybe due to the various age proportion of populations, thecoinheritance trait of thalassemia gene, or other geneticcomponents controlling the number of F cells and the clinicalstatus of the patients [21, 24]. As HbF has been shown tobe stable in SCA patients at 4–6 years [6, 19], comparison ofHbF values should be determined in children aged >4 yrs andin steady state.
Levels of HbF and F cells vary considerably among dif-ferent populations; this variability does not originate from asingle genetic locus and HbF persistence is considered as aquantitative trait (QT) depending on multiple genes beingexpressed together with a small environmental component[4].
In normal adults, F cells % varied from 0.5 to 7% whilein SCA patients, values have a much broader range [21]. Wehave no local reference values in Congolese SCA patients,
6 Anemia
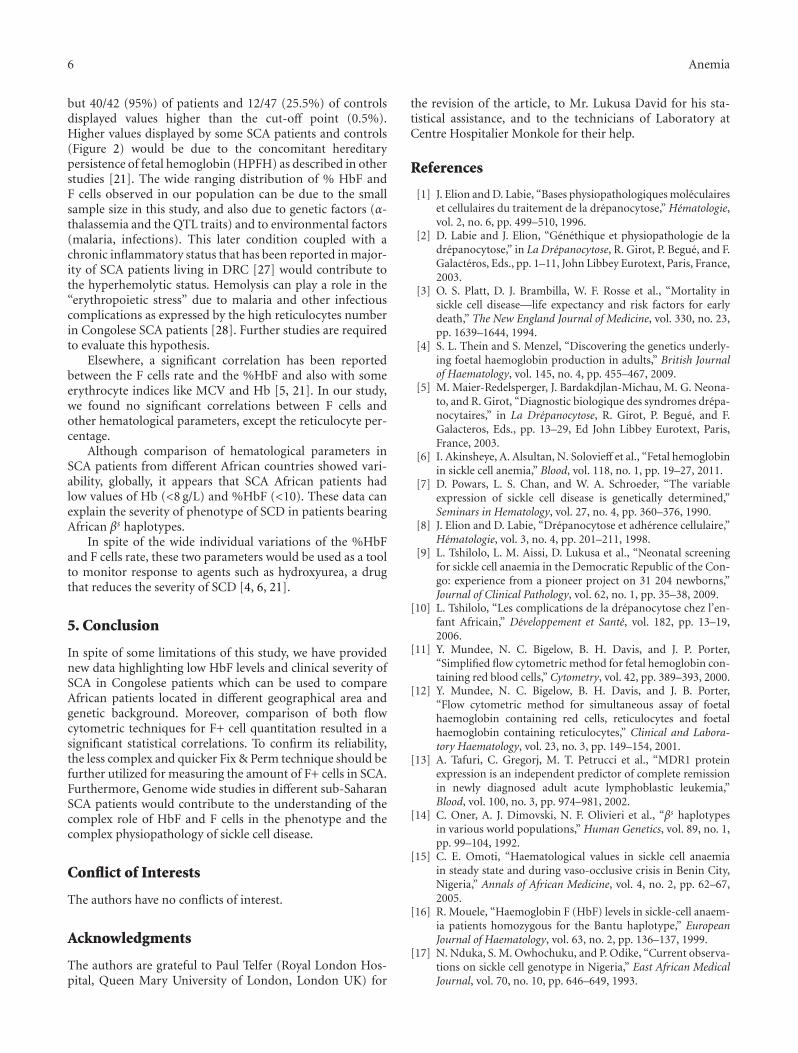
but 40/42 (95%) of patients and 12/47 (25.5%) of controlsdisplayed values higher than the cut-off point (0.5%).Higher values displayed by some SCA patients and controls(Figure 2) would be due to the concomitant hereditarypersistence of fetal hemoglobin (HPFH) as described in otherstudies [21]. The wide ranging distribution of % HbF andF cells observed in our population can be due to the smallsample size in this study, and also due to genetic factors (α-thalassemia and the QTL traits) and to environmental factors(malaria, infections). This later condition coupled with achronic inflammatory status that has been reported in major-ity of SCA patients living in DRC [27] would contribute tothe hyperhemolytic status. Hemolysis can play a role in the“erythropoietic stress” due to malaria and other infectiouscomplications as expressed by the high reticulocytes numberin Congolese SCA patients [28]. Further studies are requiredto evaluate this hypothesis.
Elsewhere, a significant correlation has been reportedbetween the F cells rate and the %HbF and also with someerythrocyte indices like MCV and Hb [5, 21]. In our study,we found no significant correlations between F cells andother hematological parameters, except the reticulocyte per-centage.
Although comparison of hematological parameters inSCA patients from different African countries showed vari-ability, globally, it appears that SCA African patients hadlow values of Hb (<8 g/L) and %HbF (<10). These data canexplain the severity of phenotype of SCD in patients bearingAfrican βs haplotypes.
In spite of the wide individual variations of the %HbFand F cells rate, these two parameters would be used as a toolto monitor response to agents such as hydroxyurea, a drugthat reduces the severity of SCD [4, 6, 21].
5. Conclusion
In spite of some limitations of this study, we have providednew data highlighting low HbF levels and clinical severity ofSCA in Congolese patients which can be used to compareAfrican patients located in different geographical area andgenetic background. Moreover, comparison of both flowcytometric techniques for F+ cell quantitation resulted in asignificant statistical correlations. To confirm its reliability,the less complex and quicker Fix & Perm technique should befurther utilized for measuring the amount of F+ cells in SCA.Furthermore, Genome wide studies in different sub-SaharanSCA patients would contribute to the understanding of thecomplex role of HbF and F cells in the phenotype and thecomplex physiopathology of sickle cell disease.
Conflict of Interests
The authors have no conflicts of interest.
Acknowledgments
The authors are grateful to Paul Telfer (Royal London Hos-pital, Queen Mary University of London, London UK) for
the revision of the article, to Mr. Lukusa David for his sta-tistical assistance, and to the technicians of Laboratory atCentre Hospitalier Monkole for their help.
References
[1] J. Elion and D. Labie, “Bases physiopathologiques moleculaireset cellulaires du traitement de la drepanocytose,” Hematologie,vol. 2, no. 6, pp. 499–510, 1996.
[2] D. Labie and J. Elion, “Genethique et physiopathologie de ladrepanocytose,” in La Drepanocytose, R. Girot, P. Begue, and F.Galacteros, Eds., pp. 1–11, John Libbey Eurotext, Paris, France,2003.
[3] O. S. Platt, D. J. Brambilla, W. F. Rosse et al., “Mortality insickle cell disease—life expectancy and risk factors for earlydeath,” The New England Journal of Medicine, vol. 330, no. 23,pp. 1639–1644, 1994.
[4] S. L. Thein and S. Menzel, “Discovering the genetics underly-ing foetal haemoglobin production in adults,” British Journalof Haematology, vol. 145, no. 4, pp. 455–467, 2009.
[5] M. Maier-Redelsperger, J. Bardakdjlan-Michau, M. G. Neona-to, and R. Girot, “Diagnostic biologique des syndromes drepa-nocytaires,” in La Drepanocytose, R. Girot, P. Begue, and F.Galacteros, Eds., pp. 13–29, Ed John Libbey Eurotext, Paris,France, 2003.
[6] I. Akinsheye, A. Alsultan, N. Solovieff et al., “Fetal hemoglobinin sickle cell anemia,” Blood, vol. 118, no. 1, pp. 19–27, 2011.
[7] D. Powars, L. S. Chan, and W. A. Schroeder, “The variableexpression of sickle cell disease is genetically determined,”Seminars in Hematology, vol. 27, no. 4, pp. 360–376, 1990.
[8] J. Elion and D. Labie, “Drepanocytose et adherence cellulaire,”Hematologie, vol. 3, no. 4, pp. 201–211, 1998.
[9] L. Tshilolo, L. M. Aissi, D. Lukusa et al., “Neonatal screeningfor sickle cell anaemia in the Democratic Republic of the Con-go: experience from a pioneer project on 31 204 newborns,”Journal of Clinical Pathology, vol. 62, no. 1, pp. 35–38, 2009.
[10] L. Tshilolo, “Les complications de la drepanocytose chez l’en-fant Africain,” Developpement et Sante, vol. 182, pp. 13–19,2006.
[11] Y. Mundee, N. C. Bigelow, B. H. Davis, and J. P. Porter,“Simplified flow cytometric method for fetal hemoglobin con-taining red blood cells,” Cytometry, vol. 42, pp. 389–393, 2000.
[12] Y. Mundee, N. C. Bigelow, B. H. Davis, and J. B. Porter,“Flow cytometric method for simultaneous assay of foetalhaemoglobin containing red cells, reticulocytes and foetalhaemoglobin containing reticulocytes,” Clinical and Labora-tory Haematology, vol. 23, no. 3, pp. 149–154, 2001.
[13] A. Tafuri, C. Gregorj, M. T. Petrucci et al., “MDR1 proteinexpression is an independent predictor of complete remissionin newly diagnosed adult acute lymphoblastic leukemia,”Blood, vol. 100, no. 3, pp. 974–981, 2002.
[14] C. Oner, A. J. Dimovski, N. F. Olivieri et al., “βs haplotypesin various world populations,” Human Genetics, vol. 89, no. 1,pp. 99–104, 1992.
[15] C. E. Omoti, “Haematological values in sickle cell anaemiain steady state and during vaso-occlusive crisis in Benin City,Nigeria,” Annals of African Medicine, vol. 4, no. 2, pp. 62–67,2005.
[16] R. Mouele, “Haemoglobin F (HbF) levels in sickle-cell anaem-ia patients homozygous for the Bantu haplotype,” EuropeanJournal of Haematology, vol. 63, no. 2, pp. 136–137, 1999.
[17] N. Nduka, S. M. Owhochuku, and P. Odike, “Current observa-tions on sickle cell genotype in Nigeria,” East African MedicalJournal, vol. 70, no. 10, pp. 646–649, 1993.
Anemia 7
[18] M. S. Figueiredo, J. Kerbauy, M. S. Goncalves et al., “Effectof α-thalassemia and β-globin gene cluster haplotypes on thehematological and clinical features of sickle-cell anemia inBrazil,” American Journal of Hematology, vol. 53, no. 2, pp. 72–76, 1996.
[19] R. L. Nagel, S. K. Rao, and O. Dunda-Belkhodja, “Thehematologic characteristics of sickle cell anemia bearing theBantu haplotype: the relationship between (G)γ and HbFlevel,” Blood, vol. 69, no. 4, pp. 1026–1030, 1987.
[20] M. J. Stuart and R. L. Nagel, “Sickle-cell disease,” The Lancet,vol. 364, no. 9442, pp. 1343–1360, 2004.
[21] S. J. Marcus, T. R. Kinney, W. H. Schultz, E. E. O’Branski, andR. E. Ware, “Quantitative analysis of erythrocytes containingfetal hemoglobin (F cells) in children with sickle cell disease,”American Journal of Hematology, vol. 54, no. 1, pp. 40–46,1997.
[22] M. H. Steinberg, Z. H. Lu, F. B. Barton, M. L. Terrin, S.Charache, and G. J. Dover, “Fetal hemoglobin in sickle cellanemia: determinants of response to hydroxyurea,” Blood, vol.89, no. 3, pp. 1078–1088, 1997.
[23] D. Labie, J. Pagnier, and C. Lapoumeroulie, “Commonhaplotype dependency of high (G)γ-globin gene expressionand high Hb F levels in β-thalasssemia and sickle cell anemiapatients,” Proceedings of the National Academy of Sciences of theUnited States of America, vol. 82, no. 7, pp. 2111–2114, 1985.
[24] U. Testa, “Fetal hemoglobin chemical inducers for treatmentof hemoglobinopathies,” Annals of Hematology, vol. 88, no. 6,pp. 505–528, 2009.
[25] J. Makani, S. Menzel, S. Nkya et al., “Genetics of fetal hemo-globin in Tanzanian and British patients with sickle cell an-emia,” Blood, vol. 117, no. 4, pp. 1390–1392, 2011.
[26] A. G. Falusi and P. O. Olatunji, “Effects of alpha thalassaemiaand haemoglobin F (HbF) level on the clinical severity of sick-le-cell anaemia,” European Journal of Haematology, vol. 52, no.1, pp. 13–15, 1994.
[27] G. Baune, N. Borel Giraud, and L. Tshilolo, “Etude du profilproteique de 45 enfants drepanocytaires homozygotes congo-lais,” Annales de Biologie Clinique, vol. 67, no. 2, pp. 1–6, 2009.
[28] L. Tshilolo, S. Wembonyama, V. Suma, and G. Avvisati, “L’he-mogramme chez l’enfant drepanocytaire congolais au coursdes phases stationnaires,” Medecine Tropicale, vol. 70, no. 5-6,pp. 459–463, 2010.
Hindawi Publishing CorporationAnemiaVolume 2012, Article ID 507894, 8 pagesdoi:10.1155/2012/507894
Research Article
Induction of Fetal Hemoglobin In Vivo Mediated bya Synthetic γ-Globin Zinc Finger Activator
Flavia C. Costa,1 Halyna Fedosyuk,1 Renee Neades,1 Johana Bravo de Los Rios,1
Carlos F. Barbas III,2 and Kenneth R. Peterson1, 3
1 Department of Biochemistry and Molecular Biology, University of Kansas Medical Center, 3901 Rainbow Boulevard, Kansas City,KS 66160, USA
2 Department of Molecular Biology and Chemistry, The Scripps Research Institute, La Jolla, CA 92037, USA3 Department of Anatomy and Cell Biology, University of Kansas Medical Center, 3901 Rainbow Boulevard, Kansas City,KS 66160, USA
Correspondence should be addressed to Kenneth R. Peterson, [email protected]
Received 16 February 2012; Revised 17 April 2012; Accepted 24 April 2012
Academic Editor: Betty S. Pace
Copyright © 2012 Flavia C. Costa et al. This is an open access article distributed under the Creative Commons Attribution License,which permits unrestricted use, distribution, and reproduction in any medium, provided the original work is properly cited.
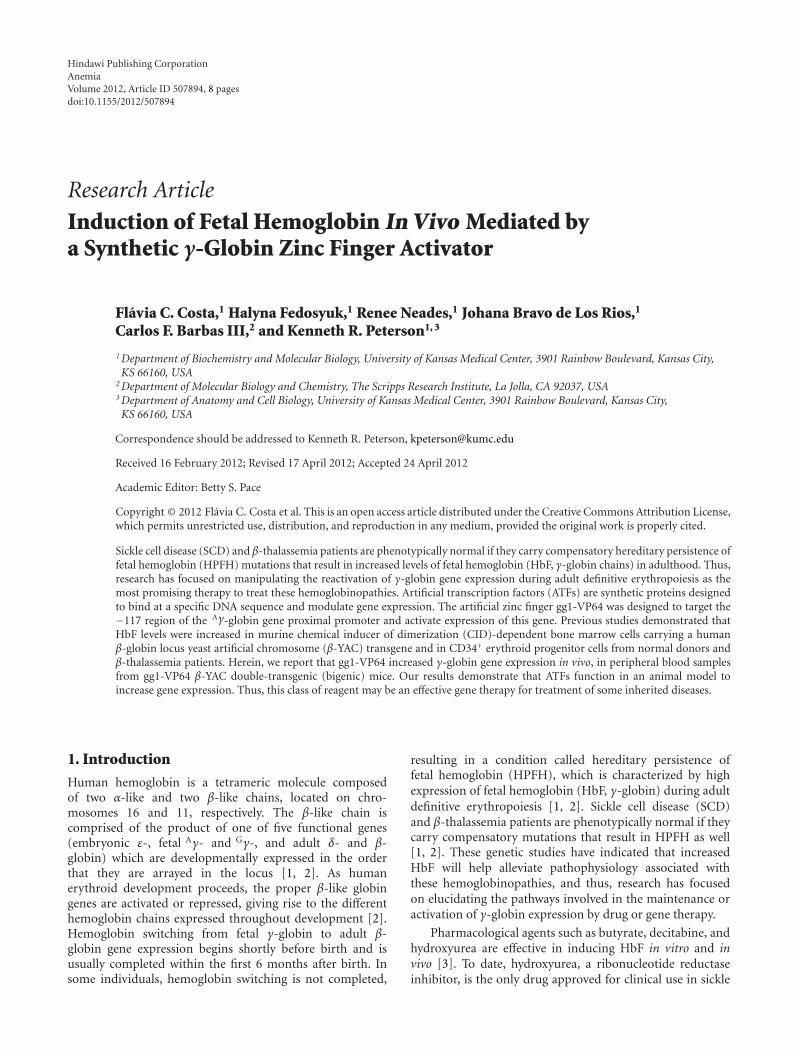
Sickle cell disease (SCD) and β-thalassemia patients are phenotypically normal if they carry compensatory hereditary persistence offetal hemoglobin (HPFH) mutations that result in increased levels of fetal hemoglobin (HbF, γ-globin chains) in adulthood. Thus,research has focused on manipulating the reactivation of γ-globin gene expression during adult definitive erythropoiesis as themost promising therapy to treat these hemoglobinopathies. Artificial transcription factors (ATFs) are synthetic proteins designedto bind at a specific DNA sequence and modulate gene expression. The artificial zinc finger gg1-VP64 was designed to target the−117 region of the Aγ-globin gene proximal promoter and activate expression of this gene. Previous studies demonstrated thatHbF levels were increased in murine chemical inducer of dimerization (CID)-dependent bone marrow cells carrying a humanβ-globin locus yeast artificial chromosome (β-YAC) transgene and in CD34+ erythroid progenitor cells from normal donors andβ-thalassemia patients. Herein, we report that gg1-VP64 increased γ-globin gene expression in vivo, in peripheral blood samplesfrom gg1-VP64 β-YAC double-transgenic (bigenic) mice. Our results demonstrate that ATFs function in an animal model toincrease gene expression. Thus, this class of reagent may be an effective gene therapy for treatment of some inherited diseases.
1. Introduction
Human hemoglobin is a tetrameric molecule composedof two α-like and two β-like chains, located on chro-mosomes 16 and 11, respectively. The β-like chain iscomprised of the product of one of five functional genes(embryonic ε-, fetal Aγ- and Gγ-, and adult δ- and β-globin) which are developmentally expressed in the orderthat they are arrayed in the locus [1, 2]. As humanerythroid development proceeds, the proper β-like globingenes are activated or repressed, giving rise to the differenthemoglobin chains expressed throughout development [2].Hemoglobin switching from fetal γ-globin to adult β-globin gene expression begins shortly before birth and isusually completed within the first 6 months after birth. Insome individuals, hemoglobin switching is not completed,
resulting in a condition called hereditary persistence offetal hemoglobin (HPFH), which is characterized by highexpression of fetal hemoglobin (HbF, γ-globin) during adultdefinitive erythropoiesis [1, 2]. Sickle cell disease (SCD)and β-thalassemia patients are phenotypically normal if theycarry compensatory mutations that result in HPFH as well[1, 2]. These genetic studies have indicated that increasedHbF will help alleviate pathophysiology associated withthese hemoglobinopathies, and thus, research has focusedon elucidating the pathways involved in the maintenance oractivation of γ-globin expression by drug or gene therapy.
Pharmacological agents such as butyrate, decitabine, andhydroxyurea are effective in inducing HbF in vitro and invivo [3]. To date, hydroxyurea, a ribonucleotide reductaseinhibitor, is the only drug approved for clinical use in sickle
2 Anemia
cell patients [3]. Although it is effective in pediatric patients,the drug also has demonstrated effect on the induction of γ-globin in adult patients, but the long-term effect on organdamage, stroke, and carcinogenesis remains uncertain [3–5]. Thus, there is a need to develop new and more effectivetherapeutic drugs to treat SCD and β-thalassemia.
Many studies have demonstrated the role of stage-specifictranscription factors in hemoglobin switching, indicating thepotential therapeutic use of these transcription factors totreat hemoglobinopathies [6–9]. The zinc finger transcrip-tion factor BCL11A was recently shown to function as arepressor of HbF expression [6]. When erythroid Kruppel-like factor 1 (EKLF1, KLF1), an adult β-globin gene-specific zinc finger transcription factor, was knocked downin erythroid progenitor CD34+ cells, γ-globin expression wasinduced [9]. DRED (direct repeat erythroid definitive) is arepressor complex that binds to the direct repeat (DR) ele-ments in the ε- and γ-globin gene promoters, and two of thecomponents in this complex are the orphan nuclear receptorsTR2 and TR4 [8]. Enforced expression of TR2/TR4 increasedfetal γ-globin gene expression in adult erythroid cells fromβ-YAC transgenic mice [7] and also in adult erythroid cellsfrom the humanized SCD mice [10]. These studies clearlydemonstrate that manipulation of transcription factors effi-ciently reactivates γ-globin expression during adult definitiveerythropoiesis.
The use of synthetic zinc finger transcriptional activatorsdesigned to interact with a specific DNA sequence andactivate gene expression has been well documented [11–14].In fact, data from studies in cell lines indicated that syntheticactivators targeted to the proximal promoter of the Aγ-globingene have successfully induced γ-globin gene expression[11–15]. The artificial zinc finger gg1-VP64 was designedto interact with the −117 region of the Aγ-globin geneproximal promoter [12]. A 7–16-fold increase in γ-globinexpression was observed in K562 cells stably transfectedwith gg1-VP64 [12]. Increased γ-globin gene expressionwas also observed following transfection of the gg1-VP64construct into immortalized bone marrow cells isolated fromhuman β-globin locus yeast artificial chromosome (β-YAC)transgenic mice [11]. More recently, the gg1-VP64 activatorwas reported to significantly increase HbF levels in CD34+
erythroid progenitor cells from normal human donors andβ-thalassemia patients [14, 15]. In this study we demon-strate that gg1-VP64 increased γ-globin gene expressionduring adult definitive erythropoiesis in β-YAC transgenicmice.
2. Materials and Methods
2.1. gg1-VP64 Construct. Enforced erythroid-specific ex-pression of the gg1-VP64-HA fusion, consisting of thegg1 zinc finger moiety, the VP64 activator, and an HAtag for detection of the protein fusion was obtained bycloning it into the unique BglII restriction enzyme site ofpμ′LCR-β pr-BglII-β int2-enh, a vector previously shown toconfer erythroid/megakaryocytic-restricted expression upona linked gene [11, 12]. A 0.8 Kb ApaI-HindIII gg1-VP64 frag-
ment was made blunt-ended and ligated into BglII-cut,blunt-ended, and phosphatased pμ′LCR-β pr-BglII-β int2-enh. Transgenic mice were generated as previously described[16, 17]. These mice were crossed to β-YAC transgenic mice[16] to produce four bigenic lines bearing the gg1-VP64construct and a β-YAC reporter (2, 7, 10, and 18). PCRwas employed to genotype the transgenic lines using thefollowing primer sequences: β-YAC: Hu ε-globin forward, 5′-TTCTTGGAAAAGGAGAATGGGAGAGAT-3′; Hu ε-globinreverse, 5′-GCAGTAAAATGCACCATGATGCCAGGC-3′
and gg1-VP64: TF-3, 5′-TTCTCCCGCAGCGATCAC-3′ andTF-4, 5′-CCAAAGCACCTGGGTCTGA-3′ [12].
2.2. Phenylhydrazine Treatment of Mice. Adult bigenic gg1-VP64 β-YAC and single transgenic β-YAC mouse lines at least6 weeks old were given 60 mg phenylhydrazine (10 mg/mL inphosphate-buffered saline; P-6926; Sigma-Aldrich, St. Louis,MO, USA) per kg body weight via intraperitoneal injectionfor three consecutive days [18]. Mice were sacrificed 4 daysposttreatment, and spleen, liver, and blood were harvestedand processed for total RNA extraction and cellular lysatepreparation.
2.3. Reverse-Transcriptase PCR (RT-PCR) and Real-TimeQuantitative PCR (qPCR). Total RNA was prepared fromadult blood and tissue lysates using the GenElute Mam-malian Total RNA Purification Kit (Sigma-Aldrich, St.Louis, MO, USA). cDNA was synthesized using the iScriptcDNA Synthesis Kit (Bio-Rad, Hercules, CA, USA). RT-PCR was performed using gg1-VP64 specific primers TF-3,5′-TTCTCCCGCAGCGATCAC-3′ and TF-4, 5′-CCAAAG-CACCTGGGTCTGA-3′ [12].
qPCR analysis was performed with SYBR Green dyeusing MiniOpticon or CFX96 instruments (Bio-Rad, Her-cules, CA, USA). Expression of γ- and β-globin was calcu-lated using the relative quantification method, as previouslydescribed [19, 20], using samples from β-YAC transgenicsas a control. PCR primer sequences utilized for expressionstudies were: Hu-γ1, 5′-GACCGTTTTGGCAATCCATTTC-3′; Hu-γ2, 5′-GTATTGCTTGCAGAATAAAGCC-3′; β-globin FWD, 5′-GAGAAGTCTGCCGTTACTGCC-3′; β-globin REV, 5′-CCGAGCACTTTCTTGCCATGA-3′; Mo-Gapdh FWD, 5′-AGGTTGTCTCCTGCGACTTCA-3′; Mo-Gapdh REV, 5′-CCAGGAAATGAGCTTGACAAAG-3′; Mo-α-globin FWD, 5′-GATTCTGACAGACTCAGGAAGAAAC-3′; Mo-α-globin REV, 5′-CCTTTCCAGGGCTTCAGCTCC-ATAT-3′. Tripli-cate data sets were generated, and qPCRresults were normalized to murine Gapdh or α-globin genes.
2.4. Western Blot Analysis. Chemical inducer of dimerization(CID)-dependent β-YAC bone marrow cell [11] and CID-dependent gg1-VP64 β-YAC bone marrow cell lysates wereprepared as described [21, 22]. Protein concentrationswere measured spectrophotometrically using the Bradfordassay. Fifteen μg of cellular lysate was mixed with loadingdye (50 mM Tris pH 6.8, 100 mM DTT, 2% SDS, 0.1%bromophenol blue, 10% glycerol) and heated at 95◦C for 5
Anemia 3
minutes, followed by separation in a 10% SDS-12% poly-acrylamide gel using Tris-glycine buffer. Western blottingwas performed as previously described [22], according tostandard procedures [21].
2.5. Antibodies. Anti-β-actin (sc-21757 Santa Cruz Biotech-nology, Santa Cruz, CA, USA) and anti-HA probe (Y-11, sc-805, Santa Cruz Biotechnology), goat anti-rabbit HRP (sc-2030, Santa Cruz Biotechnology), and goat anti-mouse HRP(sc-2031, Santa Cruz Biotechnology) antibodies were usedfor western blotting.
2.6. HbF Detection by Flow Cytometry. Detection of HbF(F cells) was performed by flow cytometric analysis. Briefly,mouse blood was collected from the tail vein in heparinizedcapillary tubes. Ten μL of whole blood was washed inPBS and fixed in 1 mL 4% fresh paraformaldehyde (SigmaAldrich, Saint Louis, MO, USA). The cells were centrifuged,the supernatant discarded, and the pellets were resuspendedin 1 mL ice-cold acetone : methanol (4 : 1) for 1 minute.Cells were washed twice in ice-cold PBS/0.1% BSA andresuspended in 800 μL of PBS/0.1% BSA/0.1% Triton X-100 (PBT). One μg sheep anti-human hemoglobin F-FITC-conjugated antibody (A80-136F, Bethyl Laboratories, Mont-gomery, TX, USA) was added to 100 μL of the cell suspensionand incubated for 40 minutes at room temperature. Cellswere washed twice with 1 mL ice-cold PBS/0.1% BSA, andthe pellets were resuspended in 200 μL of PBS. Cells wereanalyzed using a BD LSRII (BD Biosciences, San Jose, CA,USA) with a 530/30 nm emission filter (FITC/GFP). Datafrom 30,000 events was acquired for analysis using BDFACSDiva software (BD Biosciences, San Jose, CA, USA).
3. Results
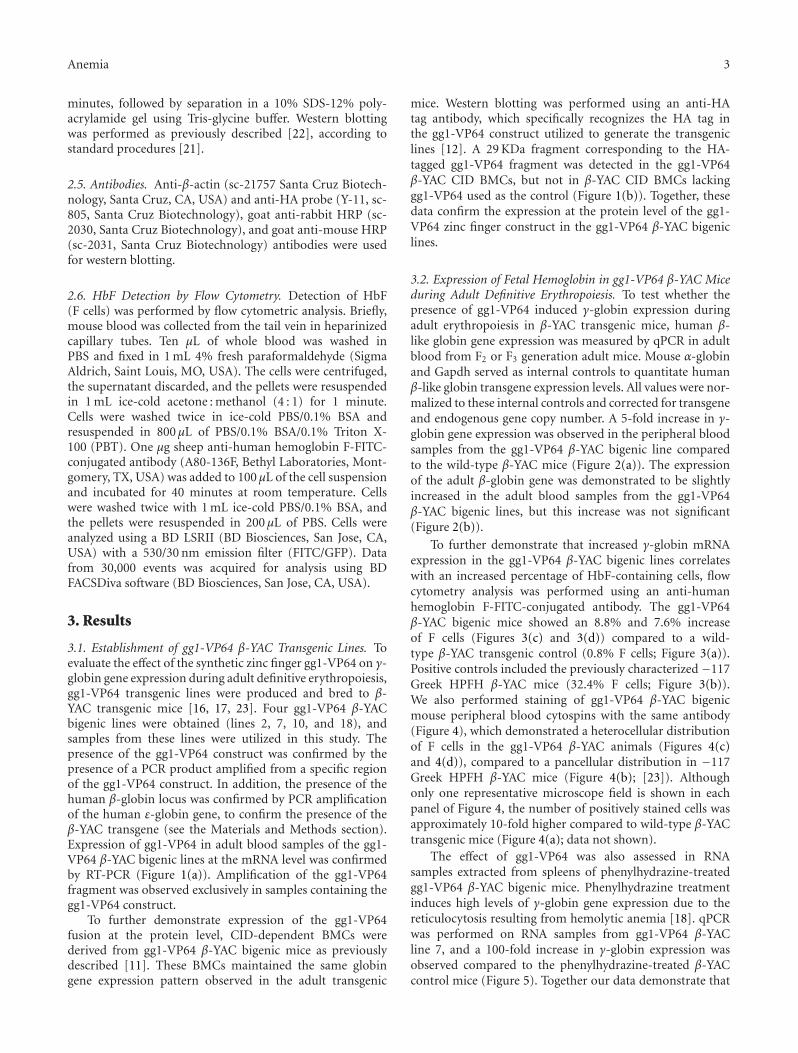
3.1. Establishment of gg1-VP64 β-YAC Transgenic Lines. Toevaluate the effect of the synthetic zinc finger gg1-VP64 on γ-globin gene expression during adult definitive erythropoiesis,gg1-VP64 transgenic lines were produced and bred to β-YAC transgenic mice [16, 17, 23]. Four gg1-VP64 β-YACbigenic lines were obtained (lines 2, 7, 10, and 18), andsamples from these lines were utilized in this study. Thepresence of the gg1-VP64 construct was confirmed by thepresence of a PCR product amplified from a specific regionof the gg1-VP64 construct. In addition, the presence of thehuman β-globin locus was confirmed by PCR amplificationof the human ε-globin gene, to confirm the presence of theβ-YAC transgene (see the Materials and Methods section).Expression of gg1-VP64 in adult blood samples of the gg1-VP64 β-YAC bigenic lines at the mRNA level was confirmedby RT-PCR (Figure 1(a)). Amplification of the gg1-VP64fragment was observed exclusively in samples containing thegg1-VP64 construct.
To further demonstrate expression of the gg1-VP64fusion at the protein level, CID-dependent BMCs werederived from gg1-VP64 β-YAC bigenic mice as previouslydescribed [11]. These BMCs maintained the same globingene expression pattern observed in the adult transgenic
mice. Western blotting was performed using an anti-HAtag antibody, which specifically recognizes the HA tag inthe gg1-VP64 construct utilized to generate the transgeniclines [12]. A 29 KDa fragment corresponding to the HA-tagged gg1-VP64 fragment was detected in the gg1-VP64β-YAC CID BMCs, but not in β-YAC CID BMCs lackinggg1-VP64 used as the control (Figure 1(b)). Together, thesedata confirm the expression at the protein level of the gg1-VP64 zinc finger construct in the gg1-VP64 β-YAC bigeniclines.
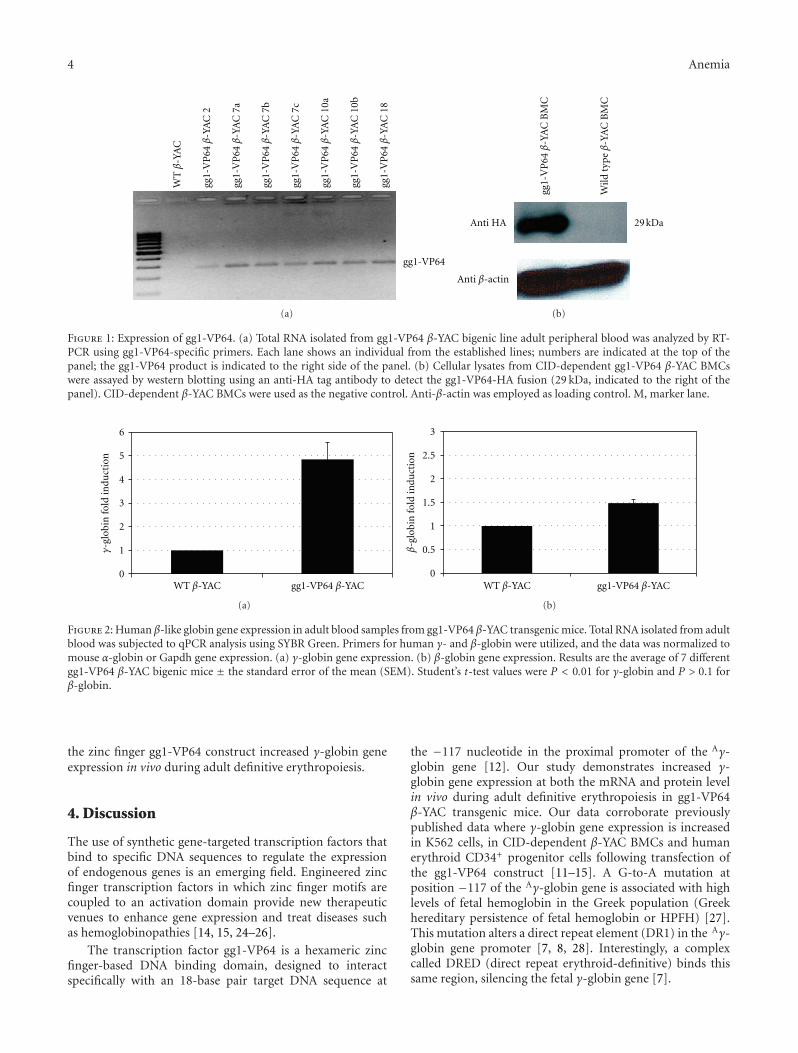
3.2. Expression of Fetal Hemoglobin in gg1-VP64 β-YAC Miceduring Adult Definitive Erythropoiesis. To test whether thepresence of gg1-VP64 induced γ-globin expression duringadult erythropoiesis in β-YAC transgenic mice, human β-like globin gene expression was measured by qPCR in adultblood from F2 or F3 generation adult mice. Mouse α-globinand Gapdh served as internal controls to quantitate humanβ-like globin transgene expression levels. All values were nor-malized to these internal controls and corrected for transgeneand endogenous gene copy number. A 5-fold increase in γ-globin gene expression was observed in the peripheral bloodsamples from the gg1-VP64 β-YAC bigenic line comparedto the wild-type β-YAC mice (Figure 2(a)). The expressionof the adult β-globin gene was demonstrated to be slightlyincreased in the adult blood samples from the gg1-VP64β-YAC bigenic lines, but this increase was not significant(Figure 2(b)).
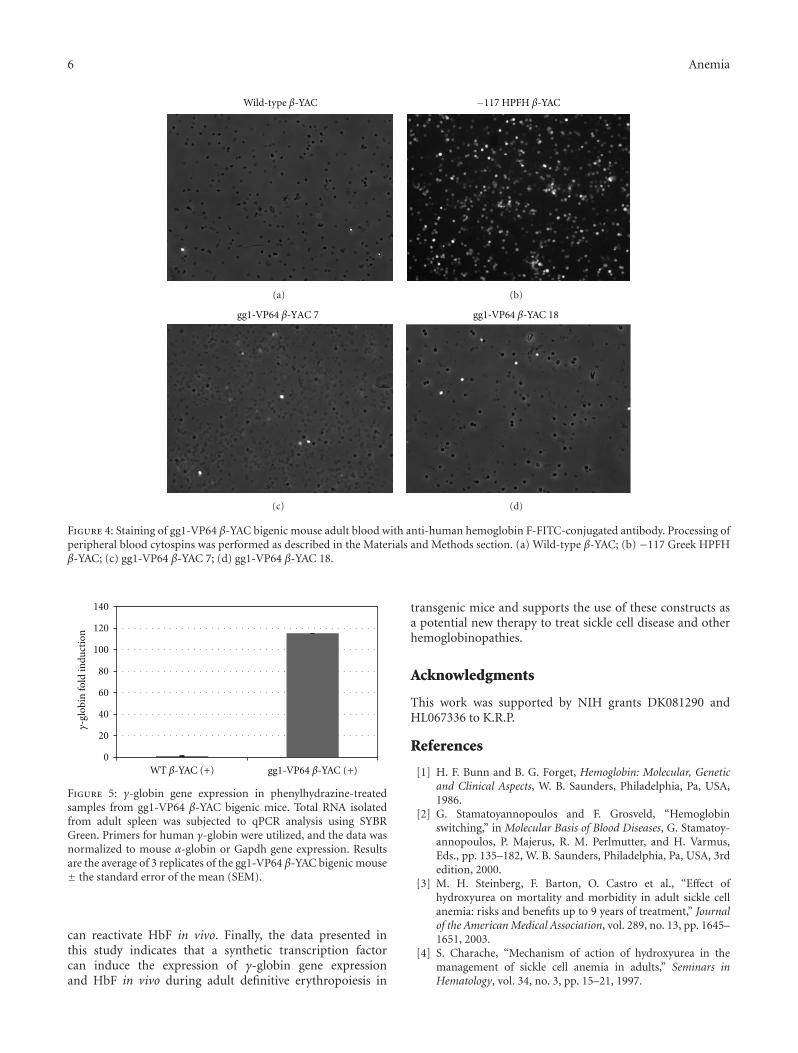
To further demonstrate that increased γ-globin mRNAexpression in the gg1-VP64 β-YAC bigenic lines correlateswith an increased percentage of HbF-containing cells, flowcytometry analysis was performed using an anti-humanhemoglobin F-FITC-conjugated antibody. The gg1-VP64β-YAC bigenic mice showed an 8.8% and 7.6% increaseof F cells (Figures 3(c) and 3(d)) compared to a wild-type β-YAC transgenic control (0.8% F cells; Figure 3(a)).Positive controls included the previously characterized −117Greek HPFH β-YAC mice (32.4% F cells; Figure 3(b)).We also performed staining of gg1-VP64 β-YAC bigenicmouse peripheral blood cytospins with the same antibody(Figure 4), which demonstrated a heterocellular distributionof F cells in the gg1-VP64 β-YAC animals (Figures 4(c)and 4(d)), compared to a pancellular distribution in −117Greek HPFH β-YAC mice (Figure 4(b); [23]). Althoughonly one representative microscope field is shown in eachpanel of Figure 4, the number of positively stained cells wasapproximately 10-fold higher compared to wild-type β-YACtransgenic mice (Figure 4(a); data not shown).
The effect of gg1-VP64 was also assessed in RNAsamples extracted from spleens of phenylhydrazine-treatedgg1-VP64 β-YAC bigenic mice. Phenylhydrazine treatmentinduces high levels of γ-globin gene expression due to thereticulocytosis resulting from hemolytic anemia [18]. qPCRwas performed on RNA samples from gg1-VP64 β-YACline 7, and a 100-fold increase in γ-globin expression wasobserved compared to the phenylhydrazine-treated β-YACcontrol mice (Figure 5). Together our data demonstrate that
4 Anemia
gg1-VP64
WTβ
-YA
C
gg1-
VP
64β
-YA
C 2
gg1-
VP
64β
-YA
C 7
a
gg1-
VP
64β
-YA
C 7
b
gg1-
VP
64β
-YA
C 7
c
gg1-
VP
64β
-YA
C 1
0a
gg1-
VP
64β
-YA
C 1
0b
gg1-
VP
64β
-YA
C 1
8
(a)
gg1-
VP
64β
-YA
C B
MC
Wild
typ
eβ
-YA
C B
MC
Anti β-actin
Anti HA 29 kDa
(b)
Figure 1: Expression of gg1-VP64. (a) Total RNA isolated from gg1-VP64 β-YAC bigenic line adult peripheral blood was analyzed by RT-PCR using gg1-VP64-specific primers. Each lane shows an individual from the established lines; numbers are indicated at the top of thepanel; the gg1-VP64 product is indicated to the right side of the panel. (b) Cellular lysates from CID-dependent gg1-VP64 β-YAC BMCswere assayed by western blotting using an anti-HA tag antibody to detect the gg1-VP64-HA fusion (29 kDa, indicated to the right of thepanel). CID-dependent β-YAC BMCs were used as the negative control. Anti-β-actin was employed as loading control. M, marker lane.
0
1
2
3
4
5
6
γ-gl
obin
fold
indu
ctio
n
WT β-YAC gg1-VP64 β-YAC
(a)
0
0.5
1
1.5
2
2.5
3
β-g
lobi
n fo
ld in
duct
ion
WT β-YAC gg1-VP64 β-YAC
(b)
Figure 2: Human β-like globin gene expression in adult blood samples from gg1-VP64 β-YAC transgenic mice. Total RNA isolated from adultblood was subjected to qPCR analysis using SYBR Green. Primers for human γ- and β-globin were utilized, and the data was normalized tomouse α-globin or Gapdh gene expression. (a) γ-globin gene expression. (b) β-globin gene expression. Results are the average of 7 differentgg1-VP64 β-YAC bigenic mice ± the standard error of the mean (SEM). Student’s t-test values were P < 0.01 for γ-globin and P > 0.1 forβ-globin.
the zinc finger gg1-VP64 construct increased γ-globin geneexpression in vivo during adult definitive erythropoiesis.
4. Discussion
The use of synthetic gene-targeted transcription factors thatbind to specific DNA sequences to regulate the expressionof endogenous genes is an emerging field. Engineered zincfinger transcription factors in which zinc finger motifs arecoupled to an activation domain provide new therapeuticvenues to enhance gene expression and treat diseases suchas hemoglobinopathies [14, 15, 24–26].
The transcription factor gg1-VP64 is a hexameric zincfinger-based DNA binding domain, designed to interactspecifically with an 18-base pair target DNA sequence at
the −117 nucleotide in the proximal promoter of the Aγ-globin gene [12]. Our study demonstrates increased γ-globin gene expression at both the mRNA and protein levelin vivo during adult definitive erythropoiesis in gg1-VP64β-YAC transgenic mice. Our data corroborate previouslypublished data where γ-globin gene expression is increasedin K562 cells, in CID-dependent β-YAC BMCs and humanerythroid CD34+ progenitor cells following transfection ofthe gg1-VP64 construct [11–15]. A G-to-A mutation atposition −117 of the Aγ-globin gene is associated with highlevels of fetal hemoglobin in the Greek population (Greekhereditary persistence of fetal hemoglobin or HPFH) [27].This mutation alters a direct repeat element (DR1) in the Aγ-globin gene promoter [7, 8, 28]. Interestingly, a complexcalled DRED (direct repeat erythroid-definitive) binds thissame region, silencing the fetal γ-globin gene [7].

Anemia 5
800
700
600
500
400
300
200
100
0
Cou
nt
P3
102 100 104 105
Wild-type β-YAC
0.8%
FITC-A
(a)
32.4%
500
400
300
200
100
0
Cou
nt
P3
102 100 104 105
FITC-A
−117 HPFH β-YAC
(b)
700
600
500
400
300
200
100
0
Cou
nt
P3
102 100 104 105
FITC-A
8.8%
gg1-VP64 β-YAC 7
(c)
700
600
500
400
300
200
100
0
Cou
nt
P3
102 100 104 105
FITC-A
gg1-VP64 β-YAC 18
7.6%
(d)
Figure 3: Flow cytometry analysis of F cells in blood from two adult gg1-VP64 β-YAC bigenic mice. A sheep anti-human hemoglobinF-FITC-conjugated antibody was used to determine the percentage of HbF-expressing cells. (a) wild-type β-YAC; (b) −117 Greek HPFHβ-YAC; (c) gg1-VP64 β-YAC 7; (d) gg1-VP64 β-YAC 18.
Many studies have been performed in transgenic mousemodels bearing human β-globin locus constructs [16, 29–31]. Unlike humans, mice do not have a fetal-stage-specifichemoglobin. However, the human Aγ-globin gene functionsas a fetal gene in mice, and the HPFH phenotype is recapit-ulated in transgenic mice containing −117, −175, −195, or−566 Aγ-globin HPFH point-mutant globin constructs or β-YACs ([23, 27, 32–34], unpublished data). These models havebeen utilized extensively to understand the function of cis-acting elements and trans-acting factors within the γ-globin
locus, including their potential effects in restoring γ-globinexpression in adult erythropoiesis [23, 27, 32–34]. Recently,enforced expression of the trans-acting factor TR2/TR4orphan nuclear receptor was shown to increase γ-globin geneexpression in adult erythroid cells of the humanized SCDmouse model [10]. In another study, knockout of BCL11Ain SCD mice was shown to increase γ-globin expressionand red cell survival, thus correcting the SCD phenotype[35]. Taken together, these studies demonstrate the utilityof mouse models for screening transcription factors that
6 Anemia
Wild-type β-YAC
(a)
−117 HPFH β-YAC
(b)
gg1-VP64 β-YAC 7
(c)
gg1-VP64 β-YAC 18
(d)
Figure 4: Staining of gg1-VP64 β-YAC bigenic mouse adult blood with anti-human hemoglobin F-FITC-conjugated antibody. Processing ofperipheral blood cytospins was performed as described in the Materials and Methods section. (a) Wild-type β-YAC; (b) −117 Greek HPFHβ-YAC; (c) gg1-VP64 β-YAC 7; (d) gg1-VP64 β-YAC 18.
0
20
40
60
80
100
120
140
γ-gl
obin
fold
indu
ctio
n
gg1-VP64 β-YAC (+)WT β-YAC (+)
Figure 5: γ-globin gene expression in phenylhydrazine-treatedsamples from gg1-VP64 β-YAC bigenic mice. Total RNA isolatedfrom adult spleen was subjected to qPCR analysis using SYBRGreen. Primers for human γ-globin were utilized, and the data wasnormalized to mouse α-globin or Gapdh gene expression. Resultsare the average of 3 replicates of the gg1-VP64 β-YAC bigenic mouse± the standard error of the mean (SEM).
can reactivate HbF in vivo. Finally, the data presented inthis study indicates that a synthetic transcription factorcan induce the expression of γ-globin gene expressionand HbF in vivo during adult definitive erythropoiesis in
transgenic mice and supports the use of these constructs asa potential new therapy to treat sickle cell disease and otherhemoglobinopathies.
Acknowledgments
This work was supported by NIH grants DK081290 andHL067336 to K.R.P.
References
[1] H. F. Bunn and B. G. Forget, Hemoglobin: Molecular, Geneticand Clinical Aspects, W. B. Saunders, Philadelphia, Pa, USA,1986.
[2] G. Stamatoyannopoulos and F. Grosveld, “Hemoglobinswitching,” in Molecular Basis of Blood Diseases, G. Stamatoy-annopoulos, P. Majerus, R. M. Perlmutter, and H. Varmus,Eds., pp. 135–182, W. B. Saunders, Philadelphia, Pa, USA, 3rdedition, 2000.
[3] M. H. Steinberg, F. Barton, O. Castro et al., “Effect ofhydroxyurea on mortality and morbidity in adult sickle cellanemia: risks and benefits up to 9 years of treatment,” Journalof the American Medical Association, vol. 289, no. 13, pp. 1645–1651, 2003.
[4] S. Charache, “Mechanism of action of hydroxyurea in themanagement of sickle cell anemia in adults,” Seminars inHematology, vol. 34, no. 3, pp. 15–21, 1997.
Anemia 7
[5] O. S. Platt, “Hydroxyurea for the treatment of sickle cellanemia,” The New England Journal of Medicine, vol. 358, no.13, pp. 1362–1326, 2008.
[6] V. G. Sankaran, T. F. Menne, J. Xu et al., “Human fetalhemoglobin expression is regulated by the developmentalstage-specific repressor BCL11A,” Science, vol. 322, no. 5909,pp. 1839–1842, 2008.
[7] O. Tanabe, D. McPhee, S. Kobayashi et al., “Embryonic andfetal β-globin gene repression by the orphan nuclear receptors,TR2 and TR4,” The EMBO Journal, vol. 26, no. 9, pp. 2295–2306, 2007.
[8] K. Tanimoto, Q. Liu, F. Grosveld, J. Bungert, and J. D. Engel,“Context-dependent EKLF responsiveness defines the devel-opmental specificity of the human ε-globin gene in erythroidcells of YAC transgenic mice,” Genes and Development, vol. 14,no. 21, pp. 2778–2794, 2000.
[9] D. Zhou, K. Liu, C. W. Sun, K. M. Pawlik, and T. M. Townes,“KLF1 regulates BCL11A expression and gamma- to beta-globin gene switching,” Nature Genetics, vol. 42, no. 9, pp. 742–744, 2010.
[10] A. D. Campbell, S. Cui, L. Shi et al., “Forced TR2/TR4expression in sickle cell disease mice confers enhanced fetalhemoglobin synthesis and alleviated disease phenotypes,” inProceedings of the National Academy of Sciences of the UnitedStates of America, vol. 108, pp. 18808–18813, 2011.
[11] C. A. Blau, C. F. Barbas III, A. L. Bomhoff et al., “γ-globingene expression in chemical inducer of dimerization (CID)-dependent multipotential cells established from human β-globin locus yeast artificial chromosome (β-YAC) transgenicmice,” The Journal of Biological Chemistry, vol. 280, no. 44, pp.36642–36647, 2005.
[12] T. Graslund, X. Li, L. Magnenat, M. Popkov, and C. F. Barbas,“Exploring strategies for the design of artificial transcriptionfactors: targeting sites proximal to known regulatory regionsfor the induction of γ-globin expression and the treatmentof sickle cell disease,” The Journal of Biological Chemistry, vol.280, no. 5, pp. 3707–3714, 2005.
[13] U. Tschulena, K. R. Peterson, B. Gonzalez, H. Fedosyuk, andC. F. Barbas, “Positive selection of DNA-protein interactionsin mammalian cells through phenotypic coupling with retro-virus production,” Nature Structural and Molecular Biology,vol. 16, no. 11, pp. 1195–1199, 2009.
[14] A. Wilber, P. W. Hargrove, Y. S. Kim et al., “Therapeutic levelsof fetal hemoglobin in erythroid progeny of β-thalassemicCD34+ cells after lentiviral vector-mediated gene transfer,”Blood, vol. 117, no. 10, pp. 2817–2826, 2011.
[15] A. Wilber, U. Tschulena, P. W. Hargrove et al., “A zinc-fingertranscriptional activator designed to interact with the γ-globingene promoters enhances fetal hemoglobin production inprimary human adult erythroblasts,” Blood, vol. 115, no. 15,pp. 3033–3041, 2010.
[16] K. R. Peterson, G. Zitnik, C. Huxley et al., “Use of yeastartificial chromosomes (YACs) for studying control of geneexpression: correct regulation of the genes of a human beta-globin locus YAC following transfer to mouse erythroleukemiacell lines,” Proceedings of the National Academy of Sciences of theUnited States of America, vol. 90, pp. 11207–11211, 1993.
[17] S. Harju, P. A. Navas, G. Stamatoyannopoulos, and K.R. Peterson, “Genome architecture of the human β-globinlocus affects developmental regulation of gene expression,”Molecular and Cellular Biology, vol. 25, no. 20, pp. 8765–8778,2005.
[18] M. Djaldetti, H. Bessler, and P. Fishman, “Hematopoiesis inthe embryonic mouse spleen. II. Alterations after phenylhy-drazine administration to the mothers,” Anatomical Record,vol. 182, no. 1, pp. 123–136, 1975.
[19] K. J. Livak and T. D. Schmittgen, “Analysis of relative geneexpression data using real-time quantitative PCR and the2−ΔΔCT method,” Methods, vol. 25, no. 4, pp. 402–408, 2001.
[20] M. W. Pfaffl, “A new mathematical model for relative quantifi-cation in real-time RT-PCR,” Nucleic Acids Research, vol. 29,no. 9, article e45, 2001.
[21] F. M. Ausubel, Current Protocols in Molecular Biology, JohnWiley & Sons, New York, NY, USA, 2001.
[22] S. Harju-Baker, F. C. Costa, H. Fedosyuk, R. Neades, and K.R. Peterson, “Silencing of Aγ-globin gene expression duringadult definitive erythropoiesis mediated by GATA-1-FOG-1-Mi2 complex binding at the -566 GATA site,” Molecular andCellular Biology, vol. 28, no. 10, pp. 3101–3113, 2008.
[23] K. R. Peterson, Q. L. Li, C. H. Clegg et al., “Use of yeastartificial chromosomes (YACs) in studies of mammaliandevelopment: Production of β-globin locus YAC mice carryinghuman globin developmental mutants,” Proceedings of theNational Academy of Sciences of the United States of America,vol. 92, no. 12, pp. 5655–5659, 1995.
[24] R. R. Beerli, B. Dreier, and C. F. Barbas III, “Positiveand negative regulation of endogenous genes by designedtranscription factors,” Proceedings of the National Academy ofSciences of the United States of America, vol. 97, no. 4, pp. 1495–1500, 2000.
[25] P. Q. Liu, E. J. Rebar, L. Zhang et al., “Regulation of anendogenous locus using a panel of designed zinc fingerproteins targeted to accessible chromatin regions: Activationof vascular endothelial growth factor A,” The Journal ofBiological Chemistry, vol. 276, no. 14, pp. 11323–11334, 2001.
[26] L. Zhang, S. K. Spratt, Q. Liu et al., “Synthetic zinc fingertranscription factor action at an endogenous chromosomalsite: Activation of the human erythropoietin gene,” TheJournal of Biological Chemistry, vol. 275, no. 43, pp. 33850–33860, 2000.
[27] M. Berry, F. Grosveld, and N. Dillon, “A single point mutationis the cuase of the Greek form of hereditary persistence of fetalhaemoglobin,” Nature, vol. 358, no. 6386, pp. 499–502, 1992.
[28] R. Gelinas, B. Endlich, C. Pfeiffer, M. Yagi, and G. Stamatoy-annopoulos, “G to A substitution in the distal CCAAT boxof the Aγ-globin gene in Greek hereditary persistence of fetalhaemoglobin,” Nature, vol. 313, no. 6000, pp. 323–325, 1985.
[29] R. R. Behringer, T. M. Ryan, R. D. Palmiter, R. L. Brinster,and T. M. Townes, “Human γ- to β-globin gene switching intransgenic mice,” Genes and Development, vol. 4, no. 3, pp.380–389, 1990.
[30] N. Dillon and F. Grosveld, “Human γ-globin genes silencedindependently of other genes in the β-globin locus,” Nature,vol. 350, no. 6315, pp. 252–254, 1991.
[31] T. Enver, N. Raich, A. J. Ebens, T. Papayannopoulou, F.Constantini, and G. Stamatoyannopoulos, “Developmentalregulation of human fetal-to-adult globin gene switching intransgenic mice,” Nature, vol. 344, no. 6264, pp. 309–313,1990.
[32] A. F. Da Cunha, A. F. Brugnerotto, M. A. Finzi Coratet al., “High levels of human γ-globin are expressed inadult mice carrying a transgene of the Brazilian type ofhereditary persistence of fetal hemoglobin ( Aγ-golbin-195),”Hemoglobin, vol. 33, no. 6, pp. 439–447, 2009.

8 Anemia
[33] B. Giardine, J. Borg, D. R. Higgs et al., “Systematic doc-umentation and analysis of human genetic variation inhemoglobinopathies using the microattribution approach,”Nature Genetics, vol. 43, no. 4, pp. 295–302, 2011.
[34] A. Omori, O. Tanabe, J. D. Engel, A. Fukamizu, and K.Tanimoto, “Adult stage γ-globin silencing is mediated bya promoter direct repeat element,” Molecular and CellularBiology, vol. 25, no. 9, pp. 3443–3451, 2005.
[35] J. Xu, C. Peng, V. G. Sankaran et al., “Correction of sickle celldisease in adult mice by interference with fetal hemoglobinsilencing,” Science, vol. 334, pp. 993–996, 2011.
Hindawi Publishing CorporationAnemiaVolume 2012, Article ID 723520, 13 pagesdoi:10.1155/2012/723520
Review Article
Sickling Cells, Cyclic Nucleotides, and Protein Kinases: ThePathophysiology of Urogenital Disorders in Sickle Cell Anemia
Mario Angelo Claudino1 and Kleber Yotsumoto Fertrin2
1 Laboratory of Multidisciplinary Research, Sao Francisco University (USF), 12916-900 Braganca Paulista, SP, Brazil2 Hematology and Hemotherapy Center, University of Campinas (UNICAMP), 13083-970 Campinas, SP, Brazil
Correspondence should be addressed to Mario Angelo Claudino, [email protected]
Received 23 January 2012; Revised 16 April 2012; Accepted 22 April 2012
Academic Editor: Solomon F. Ofori-Acquah
Copyright © 2012 M. A. Claudino and K. Y. Fertrin. This is an open access article distributed under the Creative CommonsAttribution License, which permits unrestricted use, distribution, and reproduction in any medium, provided the original work isproperly cited.
Sickle cell anemia is one of the best studied inherited diseases, and despite being caused by a single point mutation in the HBB gene,multiple pleiotropic effects of the abnormal hemoglobin S production range from vaso-occlusive crisis, stroke, and pulmonaryhypertension to osteonecrosis and leg ulcers. Urogenital function is not spared, and although priapism is most frequentlyremembered, other related clinical manifestations have been described, such as nocturia, enuresis, increased frequence of lowerurinary tract infections, urinary incontinence, hypogonadism, and testicular infarction. Studies on sickle cell vaso-occlusion andpriapism using both in vitro and in vivo models have shed light on the pathogenesis of some of these events. The authors reviewwhat is known about the deleterious effects of sickling on the genitourinary tract and how the role of cyclic nucleotides signalingand protein kinases may help understand the pathophysiology underlying these manifestations and develop novel therapies in thesetting of urogenital disorders in sickle cell disease.
1. Introduction
Sickle cell anemia (SCA) has been first described over acentury ago [1] and has become one of the best studiedinherited human diseases. Despite being caused by a singlepoint mutation in the HBB gene, multiple pleiotropic effectsof the abnormal hemoglobin S production range fromvaso-occlusive crisis, stroke, and pulmonary hypertension toosteonecrosis and leg ulcers [2–4].
Genitourinary tract function is also affected in SCA, andalthough priapism is most frequently remembered, otherrelated clinical manifestations have been described, suchas nocturia, enuresis, increased frequency of lower urinarytract infections, urinary incontinence, hypogonadism, andtesticular infarction. Sickle hemoglobin S (HbS) polymerizeswhen deoxygenated, resulting in a series of cellular alter-ations in red cell morphology and function that shortenthe red cell life span and lead to vascular occlusion. Sicklecell disease (SCD) vaso-occlusion constitutes a complexmultifactorial process characterized by oxidative stress andrecurrent ischemia-reperfusion injury in a vicious circle
contributing to reduced blood flow and results, eventually,in complete obstruction of the microcirculation and organicdysfunction [3–6]. The exact pathogenetic mechanisms thattie genitourinary complications to the fundamental event ofHbS polymerization and hemolytic anemia in SCA have justabout started to be unraveled.
This paper focuses on how previous, sometimes poorlyexplained, clinical observations of urogenital disorders inpatients with SCD relate to more recent discoveries onthe role of cyclic nucleotides and protein kinases in thepathophysiology of sickle vaso-occlusion.
2. Priapism
Priapism is defined as a prolonged and persistent penileerection, unassociated with sexual interest or stimulation,and is one of the complications associated with sickle cellanemia (SCA) since early in 1934 [7]. Priapism reaches a fre-quency of up to 45% in male patients with SCA, and the rateof resulting erectile dysfunction (ED) exceeds 30% [8–10].
2 Anemia
Although this complication has been previously reviewedin depth in this journal [11], the main concepts behind itspathophysiology will be summarized here for better under-standing of the mechanisms discussed throughout the paper,but readers are encouraged to read the previous review.
According to the American Urological AssociationGuidelines on the Management of Priapism, priapism canbe subdivided into three categories: ischemic, stuttering, andnonischemic. Ischemic priapism (veno-occlusive, low flow)is a persistent erection marked by rigidity of the corporacavernosa (CC) and little or no cavernous arterial inflow. Inischemic priapism, there are time-dependent changes in thecorporal metabolic environment with progressive hypoxia,hypercarbia, and acidosis that typically generate penile pain.Penile sinusoids are regions prone to red blood cell sicklingin SCD men because of blood stasis and slow flow rates,and ischemic priapism is thought to result from prolongedblockage of venous outflow by the vaso-occlusive process.Clinically, there is congestion and tenderness in the CC,sparing the glans and corpus spongiosum, usually with aprolonged course of over 3 hours, and frequently resulting infibrosis and erectile dysfunction. Stuttering priapism (acute,intermittent, recurrent ischemic priapism) is characterizedby a pattern of recurrence, but an increasing frequency orduration of stuttering episodes may herald a major ischemicpriapism. Nonischemic priapism (arterial, high flow) is apersistent erection caused by unregulated cavernous arterialinflow. Typically, the corpora are tumescent but not rigid, thepenis is not painful and is most frequently associated withtrauma [12–16].
Conventional treatments are largely symptomatic, usu-ally administered after the episode of priapism has alreadyoccurred, because the etiology and mechanisms involved inthe development of priapism are poorly characterized [17,18]. Preventive interventions have been proposed but, with-out a clear idea of the molecular mechanisms involved, theyremain largely impractical to be applied in a regular basis inthe clinic [17]. Due to the difficulty in exploring these mech-anisms in patients, the use of animal models of priapism hasbecome of utmost importance to decipher this devastatingclinical challenge [19]. Animal models for priapisminclude dogs [20, 21], rabbits [22], rats [23–27], and mice[28–41].
Molecular biology and genetic engineering have beenwidely used in animal models to explore gene functionin both human physiology and in the study of pathologyof human priapism. Four major priapism animal modelshave been developed and have yielded greater knowledgeon the intrinsic mechanisms underlying priapism: the intra-corporal opiorphins gene transfer rat model [42–45], theendothelial nitric oxide synthase (eNOS) with or withoutneuronal NOS (nNOS) knock-out (eNOS−/− ± nNOS−/−)mouse models [28, 29, 31–33], the adenosine deaminaseknock-out (Ada−/−) mouse model [35, 36, 40, 41] and thetransgenic sickle cell Berkeley mouse model [30, 33, 34, 37–39]. However, the Berkeley mouse is the only well-acceptedanimal model that displays clinical manifestations similar tothose seen in humans with severe forms of SCD, includingpriapism [30, 34].
Priapism is essentially a derangement of normal erection.Penile erection is a hemodynamic event that is regulated bysmooth muscle relaxation/contraction of corpora cavernosaand associated arterioles during sexual stimulation. Thepenile flaccidity (detumescence state) is mainly maintainedby tonic release of norepinephrine through the sympatheticinnervations of vascular and cavernosal smooth musclecells [46]. During penile erection (tumescence state), vas-cular smooth muscle relaxation decreases vascular resis-tance, thereby increasing blood flow through cavernous andhelicine arteries and filling sinusoids, which are expandeddue to the relaxation of smooth muscle cells in the CC[47]. This physiological relaxation of penile smooth muscle ismainly, although not solely, mediated by the neurotransmit-ter nitric oxide (NO) that is produced by enzymes called NOsynthases (NOS). NOSs are subdivided into three isoforms,endothelial NOS (eNOS or NOS3), neural NOS (nNOSor NOS1), and inducible NOS (iNOS or NOS2) [48, 49].In the penile smooth muscle, NO is released from bothnitrergic nerves and the sinusoidal endothelium [46, 50–52]. NO stimulates the soluble guanylyl cyclase (sGC) inthe cavernosal smooth muscle, triggering increased synthesisof cyclic GMP (cGMP) that provides the main signal forsmooth muscle relaxation [53]. cGMP levels in the CC areregulated by the rate of synthesis determined by sGC andthe rate of cGMP hydrolysis mediated by phosphodiesterasetype 5 (PDE5) [54, 55]. It has been reported that plasmahemoglobin released by intravascularly hemolysed sickleerythrocytes consumes NO, reducing its bioavailability in theerectile tissue, skewing the normal balance of smooth muscletone towards vasoconstriction [17, 56, 57]. Champion andcollaborators [33] showed that the penile smooth muscleof SCD transgenic mice presents with dysregulated PDE5Aexpression activity. Moreover, these mice had spontaneouspriapism, amplified CC relaxation response mediated by theNO-cGMP signaling pathway, and increased intracavernosalpressure in vivo [37, 38].
Recent evidence has shown that another signaling path-way that may also contribute to the pathophysiology ofpriapism in SCD involves adenosine regulation. Similarly toNO, adenosine is a potent vasodilator produced by adeninenucleotide degradation. Adenosine is predominantly gen-erated by adenosine monophosphate (AMP) dephosphory-lation catalyzed by intracellular 5′-nucleotidase. Hydrolysisof s-adenosyl-homocysteine also contributes to intracellularadenosine formation [58, 59]. Extracellular adenosine maybe generated by both adenine nucleotide degradation anddephosphorylation by ectonucleotidases [60]. Adenosine isthen catabolized by two enzymes: adenosine kinase (ADK),which phosphorylates adenosine to AMP and is an importantregulator of intracellular adenosine levels; and adenosinedeaminase (ADA), which catalyzes the irreversible conver-sion of adenosine to inosine [58].
Several physiological processes may be affected by extra-cellular adenosine and this is mediated by four differentreceptors, referred to as A1, A2A, A2B, and A3. All foursubtypes are members of the G protein-coupled receptor(GPCR) superfamily. The activation of the A1 and A3
adenosine receptors inhibits adenylyl cyclase activity and

Anemia 3
also results in increased activity of phospholipase C, whileactivation of the A2A and A2B subtypes increases adenylylcyclase activity [58, 61]. Adenosine-induced vasodilationis mediated by increasing intracellular cyclic adenosinemonophosphate (cAMP) levels in vascular smooth musclecells via A2 receptor signaling [62, 63]. cAMP activatesprotein kinase A (PKA) resulting in decreased calcium-calmodulin-dependent MLC phosphorylation and enhancedsmooth muscle relaxation [64]. Its role in penile erectionhas been investigated in studies showing that intracavernousinjection of adenosine resulted in tumescence and penileerection [36, 61, 65]. In addition, adenosine induces NO syn-thesis in endothelial cells through A2 receptor signaling, andadenosine-mediated CC relaxation is partially dependent onendothelium-derived NO [36, 66–70].
A priapic phenotype in Ada−/− mice was identified andled to further investigation of the impact of adenosine in thepathophysiology of priapism [59]. Previous reports showedthat high levels of adenosine caused prolonged corporalsmooth muscle relaxation in vitro. However, this effect wasquickly corrected by intraperitoneal injection of a high doseof polyethylene glycol-ADA (PEG-ADA), which effectivelyreduces adenosine levels systemically [36, 71]. Moreover,adenosine induced significant increases in cavernosal cAMPlevels via A2B receptor activation. This demonstrated thatA2B receptor signaling is required for adenosine-mediatedstimulation of cAMP production in CC smooth muscle cells[36, 71]. Mi and collaborators [36] have studied adenosinelevels in the penis of sickle cell mice and have founda significant increase in adenosine levels, suggesting thatoverproduction of adenosine may contribute to priapicactivity in SCD [71, 72]. Sickle cell mice submitted to PEG-ADA treatment suffered significant reduction of force andduration of relaxation when compared with untreated mice[71]. In addition, increased adenosine levels contributed tothe development of penile fibrosis in Ada−/− mice as wellas in transgenic sickle cell mice [72]. These findings suggesta general contributory role of elevated adenosine in thepathophysiology of priapism associated with SCD.
Although the penile vascular endothelium and smoothmuscle cells are sources of vasodilation factors such as NOand adenosine, there are vasoconstriction pathways impor-tant to the penile hemodynamics, such as the Rho-kinase(ROCK) pathway. The RhoA/ROCK signal transductionpathway has been shown to influence erectile function in vivothrough an array of mechanisms, including vasoconstrictionof the penile vasculature via smooth muscle contractionand regulation of eNOS [73–76]. This pathway is involvedin the regulation of smooth muscle tone by modulatingthe sensitivity of contractile proteins to Ca2+ [77]. RhoAregulates smooth muscle contraction by cycling between aGDP-bound inactive form (coupled to a guanine dissociationinhibitor, RhoGDI) and a GTP-bound active form [78–80].Upstream activation of heterotrimeric G proteins leads tothe exchange of GDP for GTP, an event carried out by theguanine exchange factors (GEFs) p115RhoGEF [81], PDZ-RhoGEF [82], and LARG (Leukemia-associated RhoGEF)[83], which are able to transduce signals from G protein-coupled receptors to RhoA [84–86]. ROCK is activated
by RhoA and inhibits myosin phosphatase through thephosphorylation of its myosin-binding subunit, leading toan increase in Ca2+ sensitivity. The RhoA/ROCK Ca2+ sen-sitization pathway has been implicated in the regulation ofpenile smooth muscle contraction and tone both in humansand animals [77, 87]. ROCK exerts contractile effects inthe penis by Ca2+-independent promotion of myosin lightchain (MLC) kinase or the attenuation of MLC phosphataseactivity and reduction in endothelial-derived NO production[88]. RhoA activation, ROCK2 protein expression, as well astotal ROCK activity decline in penile of SCD transgenic mice,highlighting that the molecular mechanism of priapism inSCD is associated with decreased vasoconstrictor activity inthe penis [39]. Therefore, should impaired RhoA/ROCK-mediated vasoconstriction contribute to SCD-associatedpriapism, this pathway may become a novel therapeutictarget in the management of this complication.
There has been no definite advance in the management ofsickle cell-associated acute, severe priapism. Penile aspirationwith or without saline intracavernosal injection and eventu-ally performing surgical shunts remains mainstays of care,with no evident benefit of more common approaches, suchas intravenous hydration, blood transfusions, and urinaryalkalinization [89, 90]. Pharmacological interventions insuch cases have been limited to intracavernosal use of sym-pathomimetic drugs, such as epinephrine, norepinephrine,and etilefrine, but there are anecdotal reports of acute use ofPDE5 inhibitor sildenafil [91].
Nonetheless, most attempts to control SCD priapismhave focused on its recurrent, stuttering form. Small caseseries of hormonal manipulation with diethylstilbestrol [92],gonadotropin-releasing hormone (GnRH) analogues [93],and finasteride [94] have been reported to successfullymanage recurrent priapism. Increasing smooth muscle tonewith oral α-agonist etilefrine has also yielded only anecdotalevidence of benefit [95]. Unfortunately, a prospective studycomparing etilefrine and ephedrine failed to demonstratesuperiority or equivalence of both drugs in preventingrecurrent priapism due to poor compliance and low recruit-ment reducing statistical power, but some evidence wasobtained reassuring safety of the use of such strategies,and possibly indicating a lower severity of priapism attacksamong compliant patients [96]. This favors off-label useof pseudoephedrine at bedtime advocated by some experts[57, 90]. Hydroxyurea has also been effective in preventingpriapism recurrence in SCD in a small number of cases[97, 98]. Based on current knowledge of NO-dependentpathways, the use of PDE5 inhibitors has been studied.One clinical trial testing tadalafil in SCD patients has beenterminated, but no outcome data have yet been published(ClinicalTrials.gov NCT00538564), and one ongoing trialaims at the effect of sildenafil in the same setting (Clini-calTrials.gov NCT00940901). Despite these efforts, scientistshave become less optimistic concerning the tolerability ofthis approach, ever since the premature termination of thesildenafil trial for pulmonary hypertension in SCD patients,in which subjects on PDE5 inhibitor were more likely to havesevere pain crises requiring hospitalization [99]. Therefore,novel therapies for preventing and treating priapism in SCD

4 Anemia
are still warranted if the incidence of impotence among thesepatients is expected to be reduced in the long term.
3. Infertility
Progress in the therapy of SCD, particularly the use ofhydroxyurea, has considerably improved the prognosis ofpatients with SCD [100, 101], with their mean life expectancyreaching much over 40 years [102–104], rendering infertilityan important issue. Nevertheless, long before hydroxyureabecame a standard of care in SCD, seminal fluid parametersof SCD males had been reported to fall within the subfertilerange due to decreased sperm concentration, total count,motility, and altered morphology [105–107], and a morerecent study reported over 90% of patients had at least oneabnormal sperm parameter [108].
Hydroxyurea (HU) has been reported to impair sper-matogenesis, causing testicular atrophy, reversible decreasein sperm count, as well as abnormal sperm morphologyand motility [108–114], and its current or previous useshould be among the first probable causes to be consideredin SCD patients complaining of infertility. Moreover, spermabnormalities prior to HU have been attributed to variableeffects of hypogonadism induced by SCD itself, and lack ofappropriate testosterone production seems to be exacerbatedby HU use in a mouse SCD model [115].
Considering that male fertility does not rely solely onthe quality of the seminal fluid, other causes that mayalso render male patients with SCD prone to suffer frominfertility include sexual problems, such as loss of libido,premature ejaculation, frequent priapism, and priapism-related impotence [105–107, 116–121].
Finding a single main cause for male infertility in aparticular SCD patient is highly unlikely and probably willinvolve some degree of endocrinological impairment. Abroader understanding of how hypogonadism takes place inSCD is necessary to explain fertility problems and requiresknowledge of the complexity of sex hormone productionregulation.
4. Hypogonadism
The etiology of hypogonadism in SCD patients is mul-tifactorial, as several mechanisms have been suggested tocontribute to its occurrence, such as primary gonadal failure[117, 122, 123], associated with or caused by repeatedtesticular infarction [124], zinc deficiency [125, 126], andpartial hypothalamic hypogonadism [127].
Physical and sexual development are affected in bothmale and female SCD patients, with onset of puberty(menarche) and appearance of secondary sexual charac-teristics (pubic and axillary hair and beard) being usuallydelayed. The delay is greater in homozygous SCA and S-β0-thalassemia than in SC disease and S-β+-thalassemia [128–130]. Moreover, studies in male patients with SCD reportedreduction of ejaculate volume, spermatozoa count, motility,and abnormal sperm morphology [106, 116].
Biochemical analyses have demonstrated low levels oftestosterone and dihydrotestosterone and variable levels offollicle-stimulating hormone (FSH) and luteinizing hor-mone (LH) in patients with SCD [105–107, 118, 119,121, 131]. The comparison between patients and controlsmatched according to stage of development of secondarysexual characteristics showed higher levels of LH in sicklecell disease, favoring some role for hypergonadotropichypogonadism.
Leydig cells of the testes and other steroidogenic tissuesproduce hormones by a multienzymatic process, in whichfree cholesterol from intracellular stores is transferred to theouter and then to the inner mitochondrial membrane. Leydigcells produce androgens under the control of LH or its pla-cental counterpart human chorionic gonadotropin (hCG), aswell as in response to numerous intratesticular factors [114,132]. LH/hCG receptors belong to the sGC-coupled seven-transmembrane-domain receptor family, whose activationleads to stimulation of adenylyl cyclase [133]. The resultingaccumulation of intracellular cyclic adenosine monophos-phate (cAMP) levels and the concomitant activation of thecAMP-dependent protein kinase (PKA) lead to the phospho-rylation of numerous proteins, including the steroidogenicacute regulatory (StAR) protein [134, 135]. StAR localizespredominantly to steroid hormone-producing tissues andconsists of a 37 kDa precursor containing an NH2-terminalmitochondrial targeting sequence and several isoelectric 30kDa mature protein forms [136–138]. Steroid production ingonadal and adrenal cells requires both de novo synthesis andPKA-dependent phosphorylation of StAR-37 protein [139].The newly synthesized StAR is functional and plays a criticalrole in the transfer of cholesterol from the outer to the innermitochondrial membrane, whereas mitochondrial importand processing to 30 kDa StAR protein terminate this action[140–142].
HbS polymerization is mediated by upstream activationof adenosine receptor A2BR by hypoxia, and hemolysisof irreversibly sickled red blood cells increases adenosinebioavailability through conversion of ATP by ectonucleoti-dases CD39 and CD73, thus predisposing patients with SCDto sustained high levels of cAMP [143, 144]. From this pointof view, steroidogenesis could be expected to be increased inthese patients.
Although Leydig cell steroidogenesis is predominantlyregulated by cAMP/PKA, other pathways also influencethis process [145], including the NO-cGMP signaling path-way [146]. NO promotes a biphasic modulation in theandrogen production, stimulatory at low concentrations,and inhibitory at high concentrations [49, 147, 148]. SCAcauses NO depletion, and in low levels, NO stimulatesLeydig cell steroidogenesis by activating sGC [48, 49, 149]and promotes the formation of low levels of cGMP, albeitenough to activate the cGMP-dependent protein kinase(PKG) and phosphorylate StAR [49, 150]. This signaling iscontrolled by phosphodiesterases (PDEs) [151] and activetransport systems that export cyclic nucleotides (multidrug-resistance proteins) from the cell [152]. In zona glomerulosacells, activation of PKG II by cGMP regulates basal levelsof aldosterone production and phosphorylation of StAR

Anemia 5
Hemolysissickling
Hypoxia
Thrombusformation
ROS
AdenosineNO
bioavailability
cAMP/PKA cGMP/PKG
RhoA/Rho kinase
signaling
Leydigcells
AndrogenVasodilation Vasoconstriction
Testicular infarction
HypogonadismTestosteroneDihydrotestosteroneFollicle-stimulating hormone Luteinizing hormone
ActivityPKC
Testicular failure
X
?
production
Figure 1: Schematic pathophysiology of hypogonadism and testicular infarction in sickle cell disease. The dashed arrow represents theblocking effect of gonadal failure over cyclic nucleotide-stimulated androgen production.
protein [150], but whether there is a role for cGMP in thezona reticularis, where adrenal androgenesis takes place, isunknown.
Hypogonadism observed in patients with SCD withlower circulating testosterone and higher LH levels suggeststhat, at least in this setting, despite the reduced cGMP- andelevated cAMP-mediated stimuli on androgen production,gonadal failure with Leydig cell impairment predominatesin sex hormone production dysfunction (Figure 1). Thisfurther highlights that primary hypogonadism is possiblylargely underdiagnosed and elicits more studies on thepathogenesis of testicular infarction.
5. Testicular Infarction
Segmental testicular infarction is an infrequent cause of acutescrotum and is rarely reported, with fewer than 40 casespublished at the time of this paper. Its etiology is not alwayswell defined, and it may be, at first, clinically mistaken for atesticular tumour [153, 154]. Common causes for testicularinfarction are torsion of the spermatic cord, incarceratedhernia, infection, trauma, and vasculitis [131]. The usualpresentation is a painful testicular mass unresponsive toantibiotics [155]. This testicular disorder has been asso-ciated with epididymitis, hypersensitivity angiitis, intimalfibroplasia of the spermatic cord arteries, polycythemia,anticoagulant use, benign testicular tumors and, in theinterest of this review, sickle cell trait and sickle cell disease[124, 131, 155–158].
Testicular infarction related to sickling has been veryrarely reported with only five individual cases found ret-rospectively, three associated with sickle cell disease andtwo with sickle cell trait [124, 155–157, 159]. Holmes andKane reported the first testicular infarction in a patient with
SCD who presented with testicular swelling unresponsive toantibiotics. Physical examination revealed that a lesion sus-picious for malignancy and ultrasonography demonstrated ahyperechoic mass with an anechoid rim and normal bloodflow in the surrounding parenchyma. Radical orchiectomyrevealed hemorrhagic infarction with sickle blood red cells.In another case report, SCA patient presented with acutescrotum and history of acute chest syndrome, splenic infarc-tion, osteomyelitis, and hemolysis. Physical examinationdemonstrated an erythematous, tender, swollen testicle andultrasound once again revealed normal echotexture andblood flow. Surgical exploration and pathological examina-tion diagnosed segmental testicular infarction with vascularcongestion and sickled red blood cells [124]. In the last tes-ticular infarction case report in a patient with SCD presentedwith increased testicular volume, scrotal ultrasonographyshowed both echogenic and hypoechogenic regions andDoppler ultrasonography revealed vascular changes compat-ible with testicular infarction. Radical orchiectomy was per-formed 10 days after the initial presentation and microscopicevaluation showed necrotic seminiferous tubules devoid ofnuclear debris, congestion, or acute inflammatory infiltrate,consistent with coagulative necrosis of ischemic origin[131].
Testicular blood flow is dependent on the internalspermatic, cremasteric, and deferential arteries. Obstructionof venous outflow may create venous thrombosis, testicularengorgement, and subsequent hemorrhagic infarction. InSCD, low oxygen tensions in erythrocytes lead to sicklingcells that lose pliability in the microcirculation. Conse-quently, capillary flow becomes obstructed, worsening localtissue hypoxia, perpetuating the cycle of sickling, andpromoting testicular infarction [124, 131, 157].
The cyclic nucleotides and protein kinases may play animportant role in the pathophysiology of testicular infarction
6 Anemia
in SCD. Enhanced hemolysis and oxidative stress contributeto a reduction in nitric oxide (NO) bioavailability due toNO scavenging by free hemoglobin and reactive oxygenspecies (ROS) generation [160, 161]. As mentioned before,testicular NO signaling pathway is involved in the regulationof Leydig cell steroidogenesis [48, 49, 147–149, 162–164] butmay also influence testicular circulation. We suggest that thereduction of NO bioavailability and consequent reductionof GMPc levels and of activity of PKG may decrease thevasodilation process in the testes. Moreover, reduced NOlevels in patients with sickle cell disease contribute tothe development of thrombus formation in the vascularsystem and could further enhance local ischemia [165, 166].Furthermore, the cGMP-dependent protein kinase signalingpathway would normally inhibit RhoA-induced Ca2+ sensiti-zation, RhoA/ROCK signaling, and protein kinase C (PKC)activity that mediate contraction in vascular smooth muscle[167–171]. Thus, reduced NO levels may decrease cGMP-dependent protein kinase activity and promote increasingRhoA-induced Ca2+ sensitization and PKC activity, favoringvasoconstriction in the testes. Therefore, tissue hypoxia,sickling of red blood cells, reduced levels of NO, pos-sible thrombus formation, increased RhoA-induced Ca2+
sensitization, and PKC activity may all lead to capillaryand venous flow obstruction promoting testicular infarction(Figure 1).
Although testicular infarction in SCD has been veryrarely reported, it has been speculated that silent testic-ular infarctions are much more common but generallyoverlooked clinically. Testicular biopsy in patients is rarelyperformed and additional studies are necessary to establishthe true incidence of testicular infarction in patients withSCD or even sickle cell trait.
6. Urinary Bladder Dysfunction
The urinary bladder has two important functions: urinestorage and emptying. Urine storage occurs at low pressure,implying that the bladder relaxes during the filling phase.Disturbances of the storage function may result in lowerurinary tract symptoms (LUTSs), such as urgency, increasedfrequency, and urge incontinence, the components of thehypoactive or overactive bladder syndromes [172, 173].The passive phase of bladder filling allows an increase involume at a low intravesical pressure. The bladder neckand urethra remain in a tonic state to prevent leakage,thus maintaining urinary continence. Bladder emptying isaccompanied by a reversal of function in which detrusorsmooth muscle (DSM) contraction predominates in thebladder body that is accompanied by a concomitant reduc-tion in outlet resistance of the bladder neck and urethra[174–176]. The bladder filling and emptying are regulatedby interactions of norepinephrine (sympathetic componentreleased by hypogastric nerve stimulation), acetylcholine andATP (parasympathetic components released by pelvic nervestimulation) with activation of adrenergic, muscarinic, andpurinergic receptors, respectively [175].
Urinary bladder dysfunction is rarely spontaneouslyreported by SCD patients to their caregivers. With increasingsurvival of these patients, physicians may expect that urinarycomplaints increase in association with classical urologicaldisorders associated with advanced age, such as urinary stressincontinence in multiparous women and benign prostatichyperplasia in men. Nonetheless, clinical observations ofmedical complaints involving the urinary bladder startas early as childhood, with enuresis, and continue ontoadulthood with nocturia and urinary tract infections, toname a few, although frequently neglected.
Nocturia has long been attributed to constant increasedurinary volumes in SCD. As part of the renal complicationsof sickling, renal medullary infarcts lead to decreased abilityto concentrate urine, yielding higher daily urinary volumes[177], compensatory polydipsia, and eventually, the need fornocturnal bladder voiding.
For comparison, the effects of polyuria on bladderfunction have been better characterized in diabetic bladderdysfunction (DBD). Both SCD and diabetes mellitus causeincreased urinary volume and, to some extent, the twodiseases involve cellular damage by oxidative stress media-tors; so data from previous studies on DBD may help shedsome light on preliminary data on bladder function in SCDanimal models by understanding a known model of bladderdysfunction.
It has been suggested that DBD comprehends so-calledearly and late phases of the disease, owing to cumulativeeffects of initial polyuria secondary to hyperglycemia, com-plicated by oxidative stress influence on the urothelium andnervous damage in the long term of the natural history ofdiabetes mellitus. In the early phase of DBD, the bladder ishyperactive, leading to LUTS comprised mainly by nocturiaand urge incontinence. Later in the course of the disease,the detrusor smooth muscle becomes atonic, abnormallydistended, and incontinence is mainly by overflow associatedwith a poor control of urethral sphincters, and voidingproblems take over [178].
DSM physiology also involves cyclic nucleotides andactivation of protein kinases. DSM contractions are a conse-quence of cholinergic-mediated contractions and decreasedβ-adrenoceptor-mediated relaxations [179]. DSM contains aheterogeneous population of muscarinic receptor subtypes[180, 181], with a predominance of the M2 subtype anda smaller population of M3 receptors. However, functionalstudies showed that M3 receptors are responsible for pro-motion of contraction in the DSM of several animal models[182–185] and in humans [186, 187]. Activation of M3muscarinic receptors in the DSM promotes stimulation ofphospholipase C, activates PKC, and increases formationof inositol trisphosphate (IP3) and diacylglycerol (DAG) torelease calcium from intracellular stores, leading to DSMcontraction [87]. Moreover, activation of M2 receptors alsoinduces a DSM contraction indirectly by inhibiting theproduction of cAMP, reducing PKA activity, and reversingthe relaxation induced by β-adrenoceptors [179]. Hence,both mechanisms promote urinary bladder emptying.
There is evidence that the Ca2+-independent RhoA/ROCK pathway is involved in the regulation of smooth

Anemia 7
muscle tone by altering the sensitivity of contractile proteinsto Ca2+ [77]. This pathway has been shown to influenceerectile function in vivo through an array of mechanisms,including phosphorylation of the myosin-binding subunitof MLC phosphatase, resulting in increased myosin phos-phorylation. RhoA, a member of the Ras (Rat Sarcoma)low molecular weight of GTP-binding proteins, mediatesagonist-induced activation of ROCK. The exchange of GDPfor GTP on RhoA and translocation of RhoA from thecytosol to the membrane are markers of its activation andenable the downstream stimulation of various effectors suchas ROCK, protein kinase N, phosphatidylinositol 3-kinase,and tyrosine phosphorylation [77]. The RhoA/ROCK Ca2+
sensitization pathway has been implicated in the regulationof bladder smooth muscle contraction and tone in humansand animals [77, 188–191]. Thus, alterations in the contrac-tion or relaxation mechanisms of DSM during the fillingand emptying phases may contribute to urinary bladderdysfunction. Patients with SCD have not been evaluated forbladder dysfunction in a systematic manner, but preliminarydata have shown that Berkeley mice (homozygous SS) exhibithypocontractile DSM ex vivo, due to a significant decreaseof contractile responses to muscarinic agonist carbachol andelectrical field stimulation [192]. This bladder dysfunctionmay contribute to the increased risk of urinary tractinfections observed in SCD patients.
In an epidemiological study of 321 children with SCD,7% had a documented urinary tract infection (UTI), one-third had recurrent infections, and two-thirds had had afebrile UTI [193]. As in normal children, there was a strongpredominance of females, and gram-negative organisms,particularly Escherichia coli, were usually cultured. Mostepisodes of gram-negative septicemia in SCD are secondaryto UTI [194]. Moreover, UTIs are more frequent duringpregnancy in women with SCA or sickle cell trait [195–197]. The prevalence of UTI in women with SCA is nearlytwofold that of unaffected black American women. Thisassociation appears to be directly related to HbS levels, sincepatients with sickle trait have an increased prevalence ofbacteriuria, but to a lesser degree than those with SCA. Morerecently, a study detected that a group of SCD children andadolescents had more symptoms of overactive bladder thana control group [198]. This could be a first documentationof a clinically evident of an early phase of sickle cellbladder dysfunction, but whether there is a late, hypotonicbladder phase in older sickle cell adults remains to bedemonstrated.
The presence of increased intracavernosal pressure asso-ciated with the amplified corpus cavernosum relaxationresponse (priapism) mediated by NO-cGMP signaling path-way, the lack of RhoA/ROCK-mediated vasoconstriction insickle cell transgenic Berkeley mice, and the association ofpriapism with genitourinary infections and urinary retentionfurther suggest the possibility that changes in the DSMreactivity may contribute to urogenital complications in SCD[36, 38–40, 192]. Despite advances in the understandingof urogenital disorders in the SCD, further studies shouldclarify the pathophysiological mechanisms that underliegenitourinary manifestations of SCD.
7. Conclusions
Urogenital disorders in SCD are the result of pleotropiceffects of the production of the abnormal sickling hemoglo-bin S. While priapism still stands out as the most frequentlyencountered, current knowledge of the effects of cyclicnucleotide production and activation of protein kinasesallows to suspect underdiagnosis of bladder dysfunctionand hypogonadism secondary to testicular failure. Moreover,despite our growing understanding of these complications,adequate, efficacious, and well-tolerated treatments are stillunavailable, and male patients continue to suffer frominfertility and erectile dysfunction. Further work in, bothclinical assessments and experimental studies in this field arepromising and should help increase physicians’ awareness ofthe importance of more accurate diagnoses, design improvedtherapeutic strategies, and eventually, achieve better qualityof life for SCD patients.
Abbreviations
ROS: Reactive oxygen speciesNO: Nitric oxidecAMP: Cyclic adenosine monophosphatePKA: Cyclic adenosine monophosphate-dependent
protein kinasecGMP: Cyclic Guanosine monophosphate;PKG: Cyclic Guanosine monophosphate protein kinase;PKC: Protein kinase C.
References
[1] C. J. Herrick, “The evolution of intelligence and its organs,”Science, vol. 31, no. 784, pp. 7–18, 1910.
[2] M. H. Steinberg, “Management of sickle cell disease,” TheNew England Journal of Medicine, vol. 340, no. 13, pp. 1021–1030, 1999.
[3] G. J. Kato and M. T. Gladwin, “Evolution of novel small-molecule therapeutics targeting sickle cell vasculopathy,”Journal of the American Medical Association, vol. 300, no. 22,pp. 2638–2646, 2008.
[4] N. Conran, C. F. Franco-Penteado, and F. F. Costa, “Neweraspects of the pathophysiology of sickle cell disease vaso-occlusion,” Hemoglobin, vol. 33, no. 1, pp. 1–16, 2009.
[5] R. P. Hebbel, M. A. B. Boogaerts, J. W. Eaton, and M. H.Steinberg, “Erythrocyte adherence to endothelium in sickle-cell anemia. A possible determinant of disease severity,” TheNew England Journal of Medicine, vol. 302, no. 18, pp. 992–995, 1980.
[6] R. B. Francis Jr. and C. S. Johnson, “Vascular occlusionin sickle cell disease: current concepts and unansweredquestions,” Blood, vol. 77, no. 7, pp. 1405–1414, 1991.
[7] L. W. Diggs and R. E. Ching, “Pathology of sickle cell ane-mia,” Southern Medical Journal, vol. 27, pp. 839–845, 1934.
[8] A. B. Adeyoju, A. B. K. Olujohungbe, J. Morris et al.,“Priapism in sickle-cell disease; incidence, risk factors andcomplications—an international multicentre study,” BJUInternational, vol. 90, no. 9, pp. 898–902, 2002.
[9] V. G. Nolan, D. F. Wyszynski, L. A. Farrer, and M. H.Steinberg, “Hemolysis-associated priapism in sickle celldisease,” Blood, vol. 106, no. 9, pp. 3264–3267, 2005.
8 Anemia
[10] T. J. Bivalacqua and A. L. Burnett, “Priapism: new concepts inthe pathophysiology and new treatment strategies,” CurrentUrology Reports, vol. 7, no. 6, pp. 497–502, 2006.
[11] G. M. Crane and N. E. Bennett Jr., “Priapism in sicklecell anemia: emerging mechanistic understanding and betterpreventative strategies,” Anemia, vol. 2011, Article ID 297364,6 pages, 2011.
[12] American Foundation for Urologic Disease, “Thought leaderpanel on evaluation and treatment of priapism. Report of theAmerican Foundation for Urologic Disease (AFUD) thoughtleader panel for evaluation and treatment of priapism,” Inter-national Journal of Impotence Research, vol. 15, supplement,pp. S39–S43, 2001.
[13] F. Numan, M. Cantasdemir, M. Ozbayrak et al., “Posttrau-matic nonischemic priapism treated with autologous bloodclot embolization,” Journal of Sexual Medicine, vol. 5, no. 1,pp. 173–179, 2008.
[14] A. L. Burnett and T. J. Bivalacqua, “Glucose-6-phosphatedehydrogenase deficiency: an etiology for idiopathic pri-apism?” Journal of Sexual Medicine, vol. 5, no. 1, pp. 237–240,2008.
[15] D. S. Finley, “Glucose-6-phosphate dehydrogenase deficiencyassociated stuttering priapism: report of a case,” Journal ofSexual Medicine, vol. 5, no. 12, pp. 2963–2966, 2008.
[16] Y. C. Jin, S. C. Gam, J. H. Jung, J. S. Hyun, K. C. Chang, andJ. S. Hyun, “Expression and activity of heme oxygenase-1 inartificially induced low-flow priapism in rat penile tissues,”Journal of Sexual Medicine, vol. 5, no. 8, pp. 1876–1882, 2008.
[17] A. L. Burnett, “Pathophysiology of priapism: dysregulatoryerection physiology thesis,” Journal of Urology, vol. 170, no.1, pp. 26–34, 2003.
[18] T. J. Bivalacqua, B. Musicki, O. Kutlu, and A. L. Burnett,“New insights into the pathophysiology of sickle cell disease-associated priapism,” Journal of Sexual Medicine, vol. 9, pp.79–87, 2011.
[19] Q. Dong, S. Deng, R. Wang, and J. Yuan, “In vitro and invivo animal models in priapism research,” Journal of SexualMedicine, vol. 8, no. 2, pp. 347–359, 2011.
[20] K. K. Chen, J. Y. Chan, L. S. Chang, M. T. Chen, and S. H.Chan, “Intracavernous pressure as an experimental index ina rat model for the evaluation of penile erection,” Journal ofUrology, vol. 147, no. 4, pp. 1124–1128, 1992.
[21] M. Ul-Hasan, A. I. El-Sakka, C. Lee, T. S. Yen, R. Dahiya, andT. F. Lue, “Expression of TGF-beta-1 mRNA and ultrastruc-tural alterations in pharmacologically induced prolongedpenile erection in a canine model,” The Journal of Urology,vol. 160, no. 6, pp. 2263–2266, 1998.
[22] R. Munarriz, K. Park, Y. H. Huang et al., “Reperfusionof ischemic corporal tissue: physiologic and biochemicalchanges in an animal model of ischemic priapism,” Urology,vol. 62, no. 4, pp. 760–764, 2003.
[23] Y. Evliyaoglu, L. Kayrin, and B. Kaya, “Effect of allopurinolon lipid peroxidation induced in corporeal tissue by veno-occlusive priapism in a rat model,” British Journal of Urology,vol. 80, no. 3, pp. 476–479, 1997.
[24] Y. Evliyaoglu, L. Kayrin, and B. Kaya, “Effect of pentoxifyllineon veno-occlusive priapism-induced corporeal tissule lipidperoxidation in a rat model,” Urological Research, vol. 25, no.2, pp. 143–147, 1997.
[25] O. Sanli, A. Armagan, E. Kandirali et al., “TGF-β1 neu-tralizing antibodies decrease the fibrotic effects of ischemicpriapism,” International Journal of Impotence Research, vol.16, no. 6, pp. 492–497, 2004.
[26] Y. C. Jin, S. C. Gam, J. H. Jung, J. S. Hyun, K. C. Chang, andJ. S. Hyun, “Expression and activity of heme oxygenase-1 inartificially induced low-flow priapism in rat penile tissues,”Journal of Sexual Medicine, vol. 5, no. 8, pp. 1876–1882, 2008.
[27] N. Uluocak, D. AtIlgan, F. Erdemir et al., “An animalmodel of ischemic priapism and the effects of melatonin onantioxidant enzymes and oxidative injury parameters in ratpenis,” International Urology and Nephrology, vol. 42, no. 4,pp. 889–895, 2010.
[28] P. L. Huang, T. M. Dawson, D. S. Bredt, S. H. Snyder, and M.C. Fishman, “Targeted disruption of the neuronal nitric oxidesynthase gene,” Cell, vol. 75, no. 7, pp. 1273–1286, 1993.
[29] P. L. Huang, Z. Huang, H. Mashimo et al., “Hypertension inmice lacking the gene for endothelial nitric oxide synthase,”Nature, vol. 377, no. 6546, pp. 239–242, 1995.
[30] C. Paszty, C. M. Brion, E. Manci et al., “Transgenic knockoutmice with exclusively human sickle hemoglobin and sicklecell disease,” Science, vol. 278, no. 5339, pp. 876–878, 1997.
[31] P. L. Huang, “Lessons learned from nitric oxide synthaseknockout animals,” Seminars in Perinatology, vol. 24, no. 1,pp. 87–90, 2000.
[32] L. A. Barouch, R. W. Harrison, M. W. Skaf et al., “Nitric oxideregulates the heart by spatial confinement of nitric oxidesynthase isoforms,” Nature, vol. 416, no. 6878, pp. 337–340,2002.
[33] H. C. Champion, T. J. Bivalacqua, E. Takimoto, D. A. Kass,and A. L. Burnett, “Phosphodiesterase-5A dysregulation inpenile erectile tissue is a mechanism of priapism,” Proceedingsof the National Academy of Sciences of the United States ofAmerica, vol. 102, no. 5, pp. 1661–1666, 2005.
[34] Hsu, “Hemolysis in sickle cell mice causes pulmonaryhypertension due to global impairment in nitric oxidebioavailability,” Blood, vol. 109, no. 7, pp. 3088–3098, 2007.
[35] J. H. Yuan, J. L. Chunn, T. J. Mi et al., “Adenosine deaminaseknockout in mice induces priapism via A2b receptor,” Journalof Urology, vol. 177, supplement, p. 227, 2007.
[36] T. Mi, S. Abbasi, H. Zhang et al., “Excess adenosine in murinepenile erectile tissues contributes to priapism via A2B adeno-sine receptor signaling,” Journal of Clinical Investigation, vol.118, no. 4, pp. 1491–1501, 2008.
[37] T. J. Bivalacqua, B. Musicki, L. L. Hsu, M. T. Gladwin, A. L.Burnett, and H. C. Champion, “Establishment of a transgenicsickle-cell mouse model to study the pathophysiology ofpriapism,” Journal of Sexual Medicine, vol. 6, no. 9, pp. 2494–2504, 2009.
[38] M. A. Claudino, C. F. Franco-penteado, M. A. F. Corat et al.,“Increased cavernosal relaxations in sickle cell mice priapismare associated with alterations in the NO-cGMP signalingpathway,” Journal of Sexual Medicine, vol. 6, no. 8, pp. 2187–2196, 2009.
[39] T. J. Bivalacqua, A. E. Ross, T. D. Strong et al., “AttenuatedrhoA/rho-kinase signaling in penis of transgenic sickle cellmice,” Urology, vol. 76, no. 2, pp. 510.e7–510.e12, 2010.
[40] J. Wen, X. Jiang, Y. Dai et al., “Adenosine deaminase enzymetherapy prevents and reverses the heightened cavernosalrelaxation in priapism,” Journal of Sexual Medicine, vol. 7, no.9, pp. 3011–3022, 2010.
[41] J. Wen, X. Jiang, Y. Dai et al., “Increased adenosine con-tributes to penile fibrosis, a dangerous feature of priapism,via A2B adenosine receptor signaling,” The FASEB Journal,vol. 24, no. 3, pp. 740–749, 2010.
[42] Y. Tong, M. Tar, F. Davelman, G. Christ, A. Melman, and K.P. Davies, “Variable coding sequence protein A1 as a marker

Anemia 9
for erectile dysfunction,” BJU International, vol. 98, no. 2, pp.396–401, 2006.
[43] Y. Tong, M. Tar, V. Monrose, M. DiSanto, A. Melman, andK. P. Davies, “hSMR3A as a marker for patients with erectiledysfunction,” Journal of Urology, vol. 178, no. 1, pp. 338–343,2007.
[44] Y. Tong, M. Tar, A. Melman, and K. Davies, “The opiorphingene (ProL1) and its homologues function in erectile physi-ology,” BJU International, vol. 102, no. 6, pp. 736–740, 2008.
[45] N. D. Kanika, M. Tar, Y. Tong, D. S. R. Kuppam, A.Melman, and K. P. Davies, “The mechanism of opiorphin-induced experimental priapism in rats involves activationof the polyamine synthetic pathway,” American Journal ofPhysiology, vol. 297, no. 4, pp. C916–C927, 2009.
[46] K. E. Andersson, “Pharmacology of penile erection,” Phar-macological Reviews, vol. 53, no. 3, pp. 417–450, 2001.
[47] P. V. Phatarpekar, J. Wen, and Y. Xia, “Role of adenosinesignaling in penile erection and erectile disorders,” Journal ofSexual Medicine, vol. 7, no. 11, pp. 3553–3564, 2010.
[48] M. S. Davidoff, R. Middendorff, B. Mayer, J. DeVente, D.Koesling, and A. F. Holstein, “Nitric oxide/cGMP pathwaycomponents in the Leydig cells of the human testis,” Cell andTissue Research, vol. 287, no. 1, pp. 161–170, 1997.
[49] S. A. Andric, M. M. Janjic, N. J. Stojkov, and T. S. Kostic,“Protein kinase G-mediated stimulation of basal Leydig cellsteroidogenesis,” American Journal of Physiology, vol. 293, no.5, pp. E1399–E1408, 2007.
[50] A. L. Burnett, C. J. Lowenstein, D. S. Bredt, T. S. K. Chang,and S. H. Snyder, “Nitric oxide: a physiologic mediator ofpenile erection,” Science, vol. 257, no. 5068, pp. 401–403,1992.
[51] K. E. Andersson and G. Wagner, “Physiology of penile erec-tion,” Physiological Reviews, vol. 75, no. 1, pp. 191–236, 1995.
[52] T. F. Lue, “Erectile dysfunction,” The New England Journal ofMedicine, vol. 342, pp. 1802–1813, 2000.
[53] K. A. Lucas, G. M. Pitari, S. Kazerounian et al., “Guanylylcyclases and signaling by cyclic GMP,” PharmacologicalReviews, vol. 52, no. 3, pp. 375–414, 2000.
[54] M. Boolell, M. J. Allen, S. A. Ballard et al., “Sildenafil: anorally active type 5 cyclic GMP-specific phosphodiesteraseinhibitor for the treatment of penile erectile dysfunction,”International Journal of Impotence Research, vol. 8, no. 2, pp.47–52, 1996.
[55] V. K. Gopal, S. H. Francis, and J. D. Corbin, “Allostericsites of phosphodiesterase-5 (PDE5). A potential role innegative feedback regulation of cGMP signaling in corpuscavernosum,” European Journal of Biochemistry, vol. 268, no.11, pp. 3304–3312, 2001.
[56] K. Ohene-Frempong and M. H. Steinberg, “Clinical aspectsof sickle cell anemia in adults and children,” in Disordersof Hemoglobin: Genetics, Pathophysiology and Clinical Man-agement, M. H. Steinberg, B. G. Forget, D. R. Higgs, andR. L. Nagel, Eds., pp. 611–670, Cambridge University Press,Cambridge, UK, 2001.
[57] Z. R. Rogers, “Priapism in sickle cell disease,” Hematology/Oncology Clinics of North America, vol. 19, pp. 917–928, 2005.
[58] B. B. Fredholm, A. P. Ijzerman, K. A. Jacobson, K. N. Klotz,and J. Linden, “International Union of Pharmacology. XXV.Nomenclature and classification of adenosine receptors,”Pharmacological Reviews, vol. 53, no. 4, pp. 527–552, 2001.
[59] P. V. Phatarpekar, J. Wen, and Y. Xia, “Role of adenosinesignaling in penile erection and erectile disorders,” Journal ofSexual Medicine, vol. 7, no. 11, pp. 3553–3564, 2010.
[60] S. P. Colgan, H. K. Eltzschig, T. Eckle, and L. F. Thomp-son, “Physiological roles for ecto-5′-nucleotidase (CD73),”Purinergic Signalling, vol. 2, no. 2, pp. 351–360, 2006.
[61] R. C. Tostes, F. R. C. Giachini, F. S. Carneiro, R. Leite, E. W.Inscho, and R. C. Webb, “Determination of adenosine effectsand adenosine receptors in murine corpus cavernosum,”Journal of Pharmacology and Experimental Therapeutics, vol.322, no. 2, pp. 678–685, 2007.
[62] R. A. Olsson and J. D. Pearson, “Cardiovascular purinocep-tors,” Physiological Reviews, vol. 70, no. 3, pp. 761–845, 1990.
[63] A. M. Tager, P. LaCamera, B. S. Shea et al., “The lysophos-phatidic acid receptor LPA1 links pulmonary fibrosis tolung injury by mediating fibroblast recruitment and vascularleak,” Nature Medicine, vol. 14, no. 1, pp. 45–54, 2008.
[64] C. S. Lin, G. Lin, and T. F. Lue, “Cyclic nucleotide signaling incavernous smooth muscle,” Journal of Sexual Medicine, vol. 2,no. 4, pp. 478–491, 2005.
[65] D. Prieto, “Physiological regulation of penile arteries andveins,” International Journal of Impotence Research, vol. 20,no. 1, pp. 17–29, 2008.
[66] A. Vials and G. Burnstock, “A2-purinoceptor-mediated relax-ation in the guinea-pig coronary vasculature: a role for nitricoxide,” British Journal of Pharmacology, vol. 109, no. 2, pp.424–429, 1993.
[67] L. Sobrevia, D. L. Yudilevich, and G. E. Mann, “Activationof A2-purinoceptors by adenosine stimulates L-argininetransport (system y+) and nitric oxide synthesis in humanfetal endothelial cells,” Journal of Physiology, vol. 499, no. 1,pp. 135–140, 1997.
[68] J. M. Li, R. A. Fenton, H. B. Wheeler et al., “AdenosineA2a receptors increase arterial endothelial cell nritric oxide,”Journal of Surgical Research, vol. 80, no. 2, pp. 357–364, 1998.
[69] P. H. Chiang, S. N. Wu, E. M. Tsai et al., “Adenosinemodulation of neurotransmission in penile erection,” BritishJournal of Clinical Pharmacology, vol. 38, no. 4, pp. 357–362,1994.
[70] M. Faria, T. Magalhaes-Cardoso, J. M. Lafuente-De-Carvalho, and P. Correia-De-Sa, “Corpus cavernosum frommen with vasculogenic impotence is partially resistantto adenosine relaxation due to endothelial A2B receptordysfunction,” Journal of Pharmacology and ExperimentalTherapeutics, vol. 319, no. 1, pp. 405–413, 2006.
[71] Y. Dai, Y. Zhang, P. Phatarpekar et al., “Adenosine signaling,priapism and novel therapies,” Journal of Sexual Medicine,vol. 6, no. 3, supplement, pp. 292–301, 2009.
[72] J. Wen, X. Jiang, Y. Dai et al., “Increased adenosine con-tributes to penile fibrosis, a dangerous feature of priapism,via A2B adenosine receptor signaling,” The FASEB Journal,vol. 24, no. 3, pp. 740–749, 2010.
[73] K. Chitaley, C. J. Wingard, R. Clinton Webb et al., “Antago-nism of Rho-kinase stimulates rat penile erection via a nitricoxide-independent pathway,” Nature Medicine, vol. 7, no. 1,pp. 119–122, 2001.
[74] T. M. Mills, K. Chitaley, C. J. Wingard, R. W. Lewis, and R. C.Webb, “Effect of rho-kinase inhibition on vasoconstriction inthe penile circulation,” Journal of Applied Physiology, vol. 91,no. 3, pp. 1269–1273, 2001.
[75] T. J. Bivalacqua, H. C. Champion, M. F. Usta et al.,“RhoA/Rho-kinase suppresses endothelial nitric oxide syn-thase in the penis: a mechanism for diabetes-associatederectile dysfunction,” Proceedings of the National Academy ofSciences of the United States of America, vol. 101, no. 24, pp.9121–9126, 2004.
10 Anemia
[76] B. Musicki, A. E. Ross, H. C. Champion, A. L. Burnett, and T.J. Bivalacqua, “Posttranslational modification of constitutivenitric oxide synthase in the penis,” Journal of Andrology, vol.30, no. 4, pp. 352–362, 2009.
[77] A. P. Somlyo and A. V. Somlyo, “Ca2+ sensitivity of smoothmuscle and nonmuscle myosin II: modulated by G proteins,kinases, and myosin phosphatase,” Physiological Reviews, vol.83, no. 4, pp. 1325–1358, 2003.
[78] N. Wettschureck and S. Offermanns, “Rho/Rho-kinase medi-ated signaling in physiology and pathophysiology,” Journal ofMolecular Medicine, vol. 80, no. 10, pp. 629–638, 2002.
[79] K. Riento and A. J. Ridley, “Rocks: multifunctional kinases incell behaviour,” Nature Reviews Molecular Cell Biology, vol. 4,no. 6, pp. 446–456, 2003.
[80] M. Bhattacharya, A. V. Babwah, and S. S. G. Ferguson, “SmallGTP-binding protein-coupled receptors,” Biochemical SocietyTransactions, vol. 32, no. 6, pp. 1040–1044, 2004.
[81] M. J. Hart, S. Sharma, N. Elmasry et al., “Identificationof a novel guanine nucleotide exchange factor for the RhoGTPase,” Journal of Biological Chemistry, vol. 271, no. 41, pp.25452–25458, 1996.
[82] S. Fukuhara, C. Murga, M. Zohar, T. Igishi, and J. S. Gutkind,“A novel PDZ domain containing guanine nucleotideexchange factor links heterotrimeric G proteins to Rho,”Journal of Biological Chemistry, vol. 274, no. 9, pp. 5868–5879, 1999.
[83] P. J. Kourlas, M. P. Strout, B. Becknell et al., “Identificationof a gene at 11q23 encoding a guanine nucleotide exchangefactor: evidence for its fusion with MLL in acute myeloidleukemia,” Proceedings of the National Academy of Sciences ofthe United States of America, vol. 97, no. 5, pp. 2145–2150,2000.
[84] E. M. Ross and T. M. Wilkie, “GTPase-activating proteinsfor heterotrimeric G proteins: regulators of G ProteinSignaling (RGS) and RGS-like proteins,” Annual Review ofBiochemistry, vol. 69, pp. 795–827, 2000.
[85] S. Fukuharaa, H. Chikumi, and J. Silvio Gutkind, “RGS-containing RhoGEFs: the missing link between transformingG proteins and Rho?” Oncogene, vol. 20, no. 13, pp. 1661–1668, 2001.
[86] A. Schmidt and A. Hall, “Guanine nucleotide exchangefactors for Rho GTPases: turning on the switch,” Genes andDevelopment, vol. 16, no. 13, pp. 1587–1609, 2002.
[87] C. E. Teixeira, F. B. M. Priviero, and R. C. Webb, “Effects of 5-cyclopropyl-2-[1-(2-fluoro-benzyl)-1H-pyrazolo[3,4-b]pyr-idine-3-yl]pyrimidin-4-ylamine (BAY 41-2272) on smoothmuscle tone, soluble guanylyl cyclase activity, and NADPHoxidase activity/expression in corpus cavernosum fromwild-type, neuronal, and endothelial nitric-oxide synthasenull mice,” Journal of Pharmacology and ExperimentalTherapeutics, vol. 322, no. 3, pp. 1093–1102, 2007.
[88] A. V. Somlyo, “New roads leading to Ca2+ sensitization,”Circulation Research, vol. 91, no. 2, pp. 83–84, 2002.
[89] E. Mantadakis, D. H. Ewalt, J. D. Cavender, Z. R. Rogers,and G. R. Buchanan, “Outpatient penile aspiration andepinephrine irrigation for young patients with sickle cellanemia and prolonged priapism,” Blood, vol. 95, no. 1, pp.78–82, 2000.
[90] G. J. Kato, “Priapism in sickle-cell disease: a hematologist’sperspective,” The Journal of Sexual Medicine, vol. 9, no. 1, pp.70–78, 2012.
[91] E. S. Bialecki and K. R. Bridges, “Sildenafil relieves priapismin patients with sickle cell disease,” American Journal ofMedicine, vol. 113, no. 3, p. 252, 2002.
[92] G. R. Serjeant, K. de Ceulaer, and G. H. Maude, “Stilboestroland stuttering priapism in homozygous sickle-cell disease,”The Lancet, vol. 2, no. 8467, pp. 1274–1276, 1985.
[93] L. A. Levine and S. P. Guss, “Gonadotropin-releasing hor-mone analogues in the treatment of sickle cell anemia-associated priapism,” Journal of Urology, vol. 150, no. 2, pp.475–477, 1993.
[94] D. Rachid-Filho, A. G. Cavalcanti, L. A. Favorito, W. S. Costa,and F. J. B. Sampaio, “Treatment of recurrent priapism insickle cell anemia with finasteride: a new approach,” Urology,vol. 74, no. 5, pp. 1054–1057, 2009.
[95] I. Okpala, N. Westerdale, T. Jegede, and B. Cheung, “Etile-frine for the prevention of priapism in adult sickle celldisease,” British Journal of Haematology, vol. 118, no. 3, pp.918–921, 2002.
[96] A. D. Seftel, “A prospective diary study of stuttering priapismin adolescents and young men with sickle cell anemia: reportof an international randomized control trial; The priapism insickle cell study (PISCES study),” Journal of Urology, vol. 185,no. 5, pp. 1837–1838, 2011.
[97] S. T. O. Saad, C. Lajolo, S. Gilli et al., “Follow-up of sicklecell disease patients with priapism treated by hydroxyurea,”American Journal of Hematology, vol. 77, no. 1, pp. 45–49,2004.
[98] A. Hassan, A. Jam’a, and I. A. Al Dabbous, “Hydroxyurea inthe treatment of sickle cell associated priapism,” Journal ofUrology, vol. 159, no. 5, p. 1642, 1998.
[99] R. F. Machado, R. J. Barst, N. A. Yovetich et al., “Hospitaliza-tion for pain in patients with sickle cell disease treated withsildenafil for elevated TRV and low exercise capacity,” Blood,vol. 118, no. 4, pp. 855–864, 2011.
[100] S. Charache, M. L. Terrin, R. D. Moore et al., “Effect ofhydroxyurea on the frequency of painful crises in Sickle cellanemia,” The New England Journal of Medicine, vol. 332, no.20, pp. 1317–1322, 1995.
[101] S. M. Bakanay, E. Dainer, B. Clair et al., “Mortality in sicklecell patients on hydroxyurea therapy,” Blood, vol. 105, no. 2,pp. 545–547, 2005.
[102] O. S. Platt, D. J. Brambilla, W. F. Rosse et al., “Mortality insickle cell disease—life expectancy and risk factors for earlydeath,” The New England Journal of Medicine, vol. 330, no.23, pp. 1639–1644, 1994.
[103] D. R. Powars, L. S. Chan, A. Hiti, E. Ramicone, andC. Johnson, “Outcome of sickle cell anemia: a 4-decadeobservational study of 1056 patients,” Medicine, vol. 84, no.6, pp. 363–376, 2005.
[104] C. D. Fitzhugh, N. Lauder, J. C. Jonassaint et al., “Car-diopulmonary complications leading to premature deaths inadult patients with sickle cell disease,” American Journal ofHematology, vol. 85, no. 1, pp. 36–40, 2010.
[105] C. R. D. Nahoum, E. A. Fontes, and F. R. Freire, “Semenanalysis in sickle cell disease,” Andrologia, vol. 12, no. 6, pp.542–545, 1980.
[106] D. N. Osegbe, O. Akinyanju, and E. O. Amaku, “Fertility inmales with sickle cell disease,” The Lancet, vol. 2, no. 8241,pp. 275–276, 1981.
[107] V. O. Agbaraji, R. B. Scott, S. Leto, and L. W. Kingslow,“Fertility studies in sickle cell disease: semen analysis in adultmale patients,” International Journal of Fertility, vol. 33, no. 5,pp. 347–352, 1988.
[108] I. Berthaut, G. Guignedoux, F. Kirsch-Noir et al., “Influenceof sickle cell disease and treatment with hydroxyurea onsperm parameters and fertility of human males,” Haemato-logica, vol. 93, no. 7, pp. 988–993, 2008.

Anemia 11
[109] C. C. Lu and M. L. Meistrich, “Cytotoxic effects of chemo-therapeutic drugs on mouse testis cells,” Cancer Research, vol.39, no. 9, pp. 3575–3582, 1979.
[110] G. Ficsor and L. C. Ginsberg, “The effect of hydroxyurea andmitomycin C on sperm motility in mice,” Mutation Research,vol. 70, no. 3, pp. 383–387, 1980.
[111] H. Singh and C. Taylor, “Effects of Thio-TEPA and hydrox-yurea on sperm production in Lakeview hamsters,” Journalof Toxicology and Environmental Health, vol. 8, no. 1-2, pp.307–316, 1981.
[112] D. P. Evenson and L. K. Jost, “Hydroxyurea exposure altersmouse testicular kinetics and sperm chromatin structure,”Cell Proliferation, vol. 26, no. 2, pp. 147–159, 1993.
[113] R. Wiger, J. K. Hongslo, D. P. Evenson, P. De Angelis, P.E. Schwarze, and J. A. Holme, “Effects of acetaminophenand hydroxyurea on spermatogenesis and sperm chromatinstructure in laboratory mice,” Reproductive Toxicology, vol. 9,no. 1, pp. 21–33, 1995.
[114] J. M. Saez, “Leydig cells: endocrine, paracrine, and autocrineregulation,” Endocrine Reviews, vol. 15, no. 5, pp. 574–626,1994.
[115] K. M. Jones, M. S. Niaz, C. M. Brooks et al., “Adverse effectsof a clinically relevant dose of hydroxyurea used for thetreatment of sickle cell disease on male fertility endpoints,”International Journal of Environmental Research and PublicHealth, vol. 6, no. 3, pp. 1124–1144, 2009.
[116] G. Friedman, R. Freeman, and R. Bookchin, “Testicularfunction in sickel cell disease,” Fertility and Sterility, vol. 25,no. 12, pp. 1018–1021, 1974.
[117] A. A. Abbasi, A. S. Prasad, and J. Ortega, “Gonadal functionabnormalities in sickle cell anemia; studies in male adultpatients,” Annals of Internal Medicine, vol. 85, no. 5, pp. 601–605, 1976.
[118] O. Modebe and U. O. Ezeh, “Effect of age on testicularfunction in adult males with sickle cell anemia,” Fertility andSterility, vol. 63, no. 4, pp. 907–912, 1995.
[119] O. A. Dada and E. U. Nduka, “Endocrine function andhemoglobinopathies: relation between the sickle cell geneand circulating plasma levels of testosterone, luteinizinghormone (LH) and follicle stimulating hormone (FSH) inadult males,” Clinica Chimica Acta, vol. 105, no. 2, pp. 269–273, 1980.
[120] M. A. F. El-Hazmi, H. M. Bahakim, and I. Al-Fawaz,“Endocrine functions in sickle cell anaemia patients,” Journalof Tropical Pediatrics, vol. 38, no. 6, pp. 307–313, 1992.
[121] E. K. Abudu, S. A. Akanmu, O. O. Soriyan et al., “Serumtestosterone levels of HbSS (sickle cell disease) male subjectsin Lagos, Nigeria,” BMC Research Notes, vol. 17, no. 4, p. 298,2011.
[122] D. N. Osegbe and O. O. Akinyanju, “Testicular dysfunctionin men with sickle cell disease,” Postgraduate Medical Journal,vol. 63, no. 736, pp. 95–98, 1987.
[123] O. O. Abdulwaheed, A. A. Abdulrasaq, A. K. Sulaimanet al., “The hormonal assessment of the infertile male inIlorin, Nigeria,” African Journal of Clinical Endocrinology &Metabolism, vol. 3, pp. 62–64, 2002.
[124] O. N. Gofrit, D. Rund, A. Shapiro, O. Pappo, E. H. Landau,and D. Pode, “Segmental testicular infarction due to sicklecell disease,” Journal of Urology, vol. 160, no. 3, part 1, pp.835–836, 1998.
[125] A. S. Prasad, E. B. Schoomaker, and J. Ortega, “Zincdeficiency in sickle cell disease,” Clinical Chemistry, vol. 21,no. 4, pp. 582–587, 1975.
[126] A. S. Prasad and Z. T. Cossack, “Zinc supplementation andgrowth in sickle cell disease,” Annals of Internal Medicine, vol.100, no. 3, pp. 367–371, 1984.
[127] C. S. Landefeld, M. Schambelan, S. L. Kaplan, and S. H.Embury, “Clomiphene-responsive hypogonadism in sicklecell anemia,” Annals of Internal Medicine, vol. 99, no. 4, pp.480–483, 1983.
[128] C. T. Jiminez, R. B. Scott, W. L. Henry et al., “Studies insickle cell anemia. XXVI. The effect of homozygous sicklecell disease on the onset of menarche, pregnancy, fertility,pubescent changes and body growth in Negro subjects,”American Journal Of Diseases Of Children, vol. 111, pp. 497–503, 1966.
[129] O. S. Platt, W. Rosenstock, and M. A. Espeland, “Influenceof sickle hemoglobinopathies on growth and development,”The New England Journal of Medicine, vol. 311, no. 1, pp. 7–12, 1984.
[130] M. A. Zago, J. Kerbauy, H. M. Souza et al., “Growthand sexual maturation of Brazilian patients with sickle celldiseases,” Tropical and Geographical Medicine, vol. 44, no. 4,pp. 317–321, 1992.
[131] M. Li, J. Fogarty, K. D. Whitney, and P. Stone, “Repeatedtesticular infarction in a patient with sickle cell disease: apossible mechanism for testicular failure,” Urology, vol. 62,no. 3, p. 551, 2003.
[132] M. L. Dufau, “The luteinizing hormone receptor,” AnnualReview of Physiology, vol. 60, pp. 461–496, 1998.
[133] M. Ascoli, F. Fanelli, and D. L. Segaloff, “Thelutropin/choriogonadotropin receptor, a 2002 perspective,”Endocrine Reviews, vol. 23, no. 2, pp. 141–174, 2002.
[134] D. M. Stocco, “StAR protein and the regulation of steroidhormone biosynthesis,” Annual Review of Physiology, vol. 63,pp. 193–213, 2001.
[135] J. J. Tremblay, F. Hamel, and R. S. Viger, “Proteinkinase A-dependent cooperation between GATA andCCAAT/enhancer-binding protein transcription factorsregulates steroidogenic acute regulatory protein promoteractivity,” Endocrinology, vol. 143, no. 10, pp. 3935–3945,2002.
[136] L. F. Epstein and N. R. Orme-Johnson, “Acute action ofluteinizing hormone on mouse Leydig cells: accumulationof mitochondrial phosphoproteins and stimulation of testos-terone synthesis,” Molecular and Cellular Endocrinology, vol.81, no. 1–3, pp. 113–126, 1991.
[137] L. F. Epstein and N. R. Orme-Johnson, “Regulation of steroidhormone biosynthesis: identification of precursors of aphosphoprotein targeted to the mitochondrion in stimulatedrat adrenal cortex cells,” Journal of Biological Chemistry, vol.266, no. 29, pp. 19739–19745, 1991.
[138] T. Seebacher, E. Beitz, H. Kumagami, K. Wild, J. P. Rup-persberg, and J. E. Schultz, “Expression of membrane-boundand cytosolic guanylyl cyclases in the rat inner ear,” HearingResearch, vol. 127, no. 1-2, pp. 95–102, 1999.
[139] F. Arakane, S. R. King, Y. Du et al., “Phosphorylation ofsteroidogenic acute regulatory protein (StAR) modulates itssteroidogenic activity,” Journal of Biological Chemistry, vol.272, no. 51, pp. 32656–32662, 1997.
[140] I. P. Artemenko, D. Zhao, D. B. Hales, K. H. Hales, and C.R. Jefcoate, “Mitochondrial processing of newly synthesizedsteroidogenic acute regulatory protein (StAR), but not totalStAR, mediates cholesterol transfer to cytochrome P450 sidechain cleavage enzyme in adrenal cells,” Journal of BiologicalChemistry, vol. 276, no. 49, pp. 46583–46596, 2001.
12 Anemia
[141] C. Jefcoate, “High-flux mitochondrial cholesterol trafficking,a specialized function of the adrenal cortex,” Journal ofClinical Investigation, vol. 110, no. 7, pp. 881–890, 2002.
[142] J. Liu, M. B. Rone, and V. Papadopoulos, “Protein-proteininteractions mediate mitochondrial cholesterol transportand steroid biosynthesis,” Journal of Biological Chemistry, vol.281, no. 50, pp. 38879–38893, 2006.
[143] H. K. Eltzschig, J. C. Ibla, G. T. Furuta et al., “Coordi-nated adenine nucleotide phosphohydrolysis and nucleosidesignaling in posthypoxic endothelium: role of ectonucleoti-dases and adenosine A2B receptors,” Journal of ExperimentalMedicine, vol. 198, no. 5, pp. 783–796, 2003.
[144] Y. Zhang, Y. Dai, J. Wen et al., “Detrimental effects ofadenosine signaling in sickle cell disease,” Nature Medicine,vol. 17, no. 1, pp. 79–86, 2011.
[145] D. M. Stocco, X. Wang, Y. Jo, and P. R. Manna, “Multiplesignaling pathways regulating steroidogenesis and steroido-genic acute regulatory protein expression: more complicatedthan we thought,” Molecular Endocrinology, vol. 19, no. 11,pp. 2647–2659, 2005.
[146] M. L. Khurana and K. N. Pandey, “Receptor-mediatedstimulatory effect of atrial natriuretic factor, brain natriureticpeptide, and C- type natriuretic peptide on testosteroneproduction in purified mouse Leydig cells: activation ofcholesterol side- chain cleavage enzyme,” Endocrinology, vol.133, no. 5, pp. 2141–2149, 1993.
[147] K. Del Punta, E. H. Charreau, and O. P. Pignataro, “Nitricoxide inhibits leydig cell steroidogenesis,” Endocrinology, vol.137, no. 12, pp. 5337–5343, 1996.
[148] J. G. Drewett, R. L. Adams-Hays, B. Y. Ho, and D. J.Hegge, “Nitric oxide potently inhibits the rate-limitingenzymatic step in steroidogenesis,” Molecular and CellularEndocrinology, vol. 194, no. 1-2, pp. 39–45, 2002.
[149] S. Valenti, C. M. Cuttica, L. Fazzuoli, G. Giordano, and M.Giusti, “Biphasic effect of nitric oxide on testosterone andcyclic GMP production by purified rat Leydig cells culturedin vitro,” International Journal of Andrology, vol. 22, no. 5, pp.336–341, 1999.
[150] S. Gambaryan, E. Butt, K. Marcus et al., “cGMP-dependentprotein kinase type II regulates basal level of aldosteroneproduction by zona glomerulosa cells without increasingexpression of the steroidogenic acute regulatory proteingene,” Journal of Biological Chemistry, vol. 278, no. 32, pp.29640–29648, 2003.
[151] D. A. Kass, H. C. Champion, and J. A. Beavo, “Phosphodi-esterase type 5: expanding roles in cardiovascular regulation,”Circulation Research, vol. 101, no. 11, pp. 1084–1095, 2007.
[152] S. A. Andric, T. S. Kostic, and S. S. Stojilkovic, “Contributionof multidrug resistance protein MRP5 in control of cyclicguanosine 5′-monophosphate intracellular signaling in ante-rior pituitary cells,” Endocrinology, vol. 147, no. 7, pp. 3435–3445, 2006.
[153] G. C. Fernandez-Perez, F. M. Tardaguila, M. Velasco etal., “Radiologic findings of segmental testicular infarction,”American Journal of Roentgenology, vol. 184, no. 5, pp. 1587–1593, 2005.
[154] S. Madaan, S. Joniau, K. Klockaerts et al., “Segmentaltesticular infarction: conservative management is feasible andsafe,” European Urology, vol. 53, no. 2, pp. 441–445, 2008.
[155] D. P. Han, R. R. Dmochowski, M. H. Blasser, and J. R. Auman,“Segmental infarction of the testicle: atypical presentation ofa testicular mass,” Journal of Urology, vol. 151, no. 1, pp. 159–160, 1994.
[156] G. H. Urwin, N. Kehoe, S. Dundas, and M. Fox, “Testicularinfarction in a patient with sickle cell trait,” British Journal ofUrology, vol. 58, no. 3, pp. 340–341, 1986.
[157] N. M. Holmes and C. J. Kane, “Testicular infarction associ-ated with sickle cell disease,” Journal of Urology, vol. 160, no.1, p. 130, 1998.
[158] D. Bruno, D. R. Wigfall, S. A. Zimmerman, P. M. Rosoff,and J. S. Wiener, “Genitourinary complications of sickle celldisease,” Journal of Urology, vol. 166, no. 3, pp. 803–811, 2001.
[159] P. S. Sarma, “Testis involvement in sickle cell trait,” TheJournal of the Association of Physicians of India, vol. 35, no.4, p. 321, 1987.
[160] K. J. Hurt, B. Musicki, M. A. Palese et al., “Akt-dependentphosphorylation of endothelial nitric-oxide synthase medi-ates penile erection,” Proceedings of the National Academy ofSciences of the United States of America, vol. 99, no. 6, pp.4061–4066, 2002.
[161] K. C. Wood, L. L. Hsu, and M. T. Gladwin, “Sickle cell diseasevasculopathy: a state of nitric oxide resistance,” Free RadicalBiology and Medicine, vol. 44, no. 8, pp. 1506–1528, 2008.
[162] M. L. Adams, E. R. Meyer, B. N. Sewing, and T. J. Cicero,“Effects of nitric oxide-related agents on rat testicularfunction,” Journal of Pharmacology and Experimental Ther-apeutics, vol. 269, no. 1, pp. 230–237, 1994.
[163] D. B. Hales, “Testicular macrophage modulation of Leydigcell steroidogenesis,” Journal of Reproductive Immunology,vol. 57, no. 1-2, pp. 3–18, 2002.
[164] C. Mondillo, R. M. Pagotto, B. Piotrkowski et al., “Involve-ment of nitric oxide synthase in the mechanism of histamine-induced inhibition of leydig cell steroidogenesis via his-tamine receptor subtypes in sprague-dawley rats,” Biology ofReproduction, vol. 80, no. 1, pp. 144–152, 2009.
[165] A. Solovey, R. Kollander, L. C. Milbauer et al., “Endothelialnitric oxide synthase and nitric oxide regulate endothelialtissue factor expression in vivo in the sickle transgenicmouse,” American Journal of Hematology, vol. 85, no. 1, pp.41–45, 2010.
[166] L. De Franceschi, M. D. Cappellini, and O. Olivieri, “Throm-bosis and sickle cell disease,” Seminars in Thrombosis andHemostasis, vol. 37, no. 3, pp. 226–236, 2011.
[167] R. Gopalakrishna, Zhen Hai Chen, and U. Gundimeda,“Nitric oxide and nitric oxide-generating agents inducea reversible inactivation of protein kinase C activity andphorbol ester binding,” Journal of Biological Chemistry, vol.268, no. 36, pp. 27180–27185, 1993.
[168] V. Sauzeau, H. Le Jeune, C. Cario-Toumaniantz et al., “CyclicGMP-dependent protein kinase signaling pathway inhibitsRhoA- induced Ca2+ sensitization of contraction in vascularsmooth muscle,” Journal of Biological Chemistry, vol. 275, no.28, pp. 21722–91729, 2000.
[169] N. Sawada, H. Itoh, J. Yamashita et al., “cGMP-dependentprotein kinase phosphorylates and inactivates RhoA,” Bio-chemical and Biophysical Research Communications, vol. 280,no. 3, pp. 798–805, 2001.
[170] N. L. Jernigan, B. R. Walker, and T. C. Resta, “Chronichypoxia augments protein kinase G-mediated Ca2+ desen-sitization in pulmonary vascular smooth muscle throughinhibition of RhoA/Rho kinase signaling,” American Journalof Physiology, vol. 287, no. 6, pp. L1220–L1229, 2004.
[171] F. B. M. Priviero, L. M. Jin, Z. Ying, C. E. Teixeira, and R.C. Webb, “Up-regulation of the RhoA/Rho-kinase signalingpathway in corpus cavernosum from endothelial Nitric-Oxide Synthase (NOS), but not neuronal NOS, null mice,”
Anemia 13
Journal of Pharmacology and Experimental Therapeutics, vol.333, no. 2, pp. 184–192, 2010.
[172] P. Abrams, “Describing bladder storage function: overactivebladder syndrome and detrusor overactivity,” Urology, vol.62, no. 5, supplement 2, pp. 28–37, 2003.
[173] M. C. Michel and M. M. Barendrecht, “Physiological andpathological regulation of the autonomic control of urinarybladder contractility,” Pharmacology and Therapeutics, vol.117, no. 3, pp. 297–312, 2008.
[174] K. E. Andersson, P. Hedlund, A. J. Wein, R. R. Dmochowski,and D. R. Staskin, “Pharmacologic perspective on thephysiology of the lower urinary tract,” Urology, vol. 60, no.5, pp. 13–20, 2002.
[175] K. E. Andersson and A. Arner, “Urinary bladder contractionand relaxation: physiology and pathophysiology,” Physiologi-cal Reviews, vol. 84, no. 3, pp. 935–986, 2004.
[176] S. L. M. Peters, M. Schmidt, and M. C. Michel, “Rho kinase:a target for treating urinary bladder dysfunction?” Trends inPharmacological Sciences, vol. 27, no. 9, pp. 492–497, 2006.
[177] K. I. Ataga and E. P. Orringer, “Renal abnormalities in sicklecell disease,” American Journal of Hematology, vol. 63, no. 4,pp. 205–211, 2000.
[178] F. Daneshgari, G. Liu, L. Birder, A. T. Hanna-Mitchell, and S.Chacko, “Diabetic bladder dysfunction: current translationalknowledge,” Journal of Urology, vol. 182, no. 6, pp. S18–S26,2009.
[179] C. R. Chapple, T. Yamanishi, R. Chess-Williams, J. G.Ouslander, J. P. Weiss, and K. E. Andersson, “Muscarinicreceptor subtypes and management of the overactive blad-der,” Urology, vol. 60, no. 5, pp. 82–89, 2002.
[180] S. S. Hegde and R. M. Eglen, “Muscarinic receptor subtypesmodulating smooth muscle contractility in the urinarybladder,” Life Sciences, vol. 64, no. 6-7, pp. 419–428, 1999.
[181] S. S. Hegde, A. Choppin, D. Bonhaus et al., “Functional roleof M2 and M3 muscarinic receptors in the urinary bladder ofrats in vitro and in vivo,” British Journal of Pharmacology, vol.120, no. 8, pp. 1409–1418, 1997.
[182] P. A. Longhurst, R. E. Leggett, and J. A. K. Briscoe,“Characterization of the functional muscarinic receptors inthe rat urinary bladder,” British Journal of Pharmacology, vol.116, no. 4, pp. 2279–2285, 1995.
[183] A. Choppin, R. M. Eglen, and S. S. Hegde, “Pharmacologicalcharacterization of muscarinic receptors in rabbit isolatediris sphincter muscle and urinary bladder smooth muscle,”British Journal of Pharmacology, vol. 124, no. 5, pp. 883–888,1998.
[184] S. Mutoh, J. Latifpour, M. Saito, and R. M. Weiss, “Evidencefor the presence of regional differences in the subtypespecificity of muscarinic receptors in rabbit lower urinarytract,” Journal of Urology, vol. 157, no. 2, pp. 717–721, 1997.
[185] D. J. Sellers, T. Yamanishi, C. R. Chapple, C. Couldwell, K.Yasuda, and R. Chess-Williams, “M3 muscarinic receptorsbut not M2 mediate contraction of the porcine detrusormuscle in vitro,” Journal of Autonomic Pharmacology, vol. 20,no. 3, pp. 171–176, 2000.
[186] G. D’Agostino, M. L. Bolognesi, A. Lucchelli et al., “Prejunc-tional muscarinic inhibitory control of acetylcholine releasein the human isolated detrusor: involvement of the M4receptor subtype,” British Journal of Pharmacology, vol. 129,no. 3, pp. 493–500, 2000.
[187] R. Chess-Williams, C. R. Chapple, T. Yamanishi, K. Yasuda,and D. J. Sellers, “The minor population of M3-receptorsmediate contraction of human detrusor muscle in vitro,”
Journal of Autonomic Pharmacology, vol. 21, no. 5, pp. 243–248, 2001.
[188] L. O. S. Leiria, F. Z. T. Monica, F. D. G. F. Carvalho et al.,“Functional, morphological and molecular characterizationof bladder dysfunction in streptozotocin-induced diabeticmice: eidence of a role for L-type voltage-operated Ca2+
channels,” British Journal of Pharmacology, vol. 163, no. 6, pp.1276–1288, 2011.
[189] A. C. Ramos-Filho, F. Z. Monica, C. F. Franco-Penteado et al.,“Characterization of the urinary bladder dysfunction in ren-ovascular hypertensive rats,” Neurourology and Urodynamics,vol. 30, no. 7, pp. 1392–402, 2011.
[190] K. Nakanishi, T. Kamai, T. Mizuno, K. Arai, and T. Yaman-ishi, “Expression of RhoA mRNA and activated RhoA inurothelium and smooth muscle, and effects of a Rho-kinaseinhibitor on contraction of the porcine urinary bladder,”Neurourology and Urodynamics, vol. 28, no. 6, pp. 521–528,2009.
[191] L. Boberg, M. Poljakovic, A. Rahman, R. Eccles, and A. Arner,“Role of Rho-kinase and protein kinase C during contractionof hypertrophic detrusor in mice with partial urinary bladderoutlet obstruction,” BJU International, vol. 109, no. 1, pp.132–140, 2012.
[192] M. A. Claudino, C. F. Franco-Penteado, M. A. F. Corat et al.,“Reduction of urinary bladder activity in transgenic sicklecell disease mice,” Blood, vol. 114, abstract 2580, 2009, (ASHAnnual Meeting Abstracts).
[193] W. F. Tarry, J. W. Duckett, and M. I. H. Snyder, “Urologicalcomplications of sickle cell disease in a pediatric population,”Journal of Urology, vol. 138, no. 3, pp. 592–594, 1987.
[194] H. S. Zarkowsky, D. Gallagher, and F. M. Gill, “Bacteremiain sickle hemoglobinopathies,” Journal of Pediatrics, vol. 109,no. 4, pp. 579–585, 1986.
[195] J. M. Miller Jr., “Sickle cell trait in pregnancy,” SouthernMedical Journal, vol. 76, no. 8, pp. 962–963, 1983.
[196] I. C. Baill and F. R. Witter, “Sickle trait and its associationwith birthweight and urinary tract infections in pregnancy,”International Journal of Gynecology and Obstetrics, vol. 33, no.1, pp. 19–21, 1990.
[197] L. M. Pasture, D. A. Savitz, and J. M. Thorp, “Predictors ofurinary tract infection at the first prenatal visit,” Epidemiol-ogy, vol. 10, no. 3, pp. 282–287, 1999.
[198] M. L. Portocarrero, M. L. Portocarrero, M. M. Sobral, I. Lyra,P. Lordelo, and U. Barroso Jr., “Prevalence of enuresis anddaytime urinary incontinence in children and adolescentswith sickle cell disease,” Journal of Urology, vol. 187, no. 3,pp. 1037–1040, 2012.
Hindawi Publishing CorporationAnemiaVolume 2012, Article ID 582018, 6 pagesdoi:10.1155/2012/582018
Research Article
Spatiotemporal Dysfunction of the Vascular Permeability Barrierin Transgenic Mice with Sickle Cell Disease
Samit Ghosh,1 Fang Tan,1 and Solomon F. Ofori-Acquah1, 2
1 Aflac Cancer and Blood Disorders Center, Division of Hematology/Oncology/BMT, Department of Pediatrics,Emory University School of Medicine, Atlanta, GA 30322, USA
2 Department of Pediatrics, Children’s Healthcare of Atlanta, Atlanta, GA 30322, USA
Correspondence should be addressed to Solomon F. Ofori-Acquah, [email protected]
Received 16 December 2011; Accepted 15 February 2012
Academic Editor: Kenneth R. Peterson
Copyright © 2012 Samit Ghosh et al. This is an open access article distributed under the Creative Commons Attribution License,which permits unrestricted use, distribution, and reproduction in any medium, provided the original work is properly cited.
Sickle cell disease (SCD) is characterized by chronic intravascular hemolysis that generates excess cell-free hemoglobin in the bloodcirculation. Hemoglobin causes multiple endothelial dysfunctions including increased vascular permeability, impaired reactivityto vasoactive agonists, and increased adhesion of leukocytes to the endothelium. While the adhesive and vasomotor defects ofSCD associated with cell-free hemoglobin are well defined, the vascular permeability phenotype remains poorly appreciated. Weaddressed this issue in two widely used and clinically relevant mouse models of SCD. We discovered that the endothelial barrier isnormal in most organs in the young but deteriorates with aging particularly in the lung. Indeed, middle-aged sickle mice developedpulmonary edema revealing for the first time similarities in the chronic permeability phenotypes of the lung in mice and humanswith SCD. Intravenous administration of lysed red blood cells into the circulation of sickle mice increased vascular permeabilitysignificantly in the lung without impacting permeability in other organs. Thus, increased vascular permeability is an endothelialdysfunction of SCD with the barrier in the lung likely the most vulnerable to acute inflammation.
1. Introduction
Sickle cell disease (SCD) is characterized by the productionof red blood cells with increased propensity for lysis andadhesion [1]. Its clinical manifestations fall broadly into twosubphenotypes defined by hyperhemolysis and vasoocclu-sion [2]. At least 30% of the hemolysis in SCD is intravas-cular [3], which means that the endothelial wall in thisdisease is persistently exposed to cell-free hemoglobin. Theendothelium is a semipermeable barrier that regulates theresponse of the vascular wall to inflammatory agonists. Thisresponse involves activation of adhesion molecule expres-sion, increased permeability of the endothelium, and extra-vasations of fluid from the blood into interstitial tissuecompartments [4]. Increased vascular permeability resultsfrom opening of gaps at sites of endothelial cell-cell contacts.There are multiple indicators of systemic inflammation inSCD [5]. In addition, markers of vascular inflammation havealso been documented [6–8]. There is increased expression
of adhesion molecules in the pulmonary endothelium of theBerkeley sickle mice [9], although the histology of these samemice shows less severe inflammatory and ischemic changesand no evidence of pneumonia [10]. Nonetheless, theyspontaneously develop pulmonary hypertension [11], whichis a major problem in SCD [12]. Pulmonary edema and theacute chest syndrome implicate increased vascular perme-ability in both chronic and acute complications of SCD [13,14]. Despite this significance, there is currently no knowledgeof the vascular permeability phenotypes of major organs thatare impacted by SCD.
2. Materials and Methods
2.1. Transgenic Sickle Mice. Experiments were performedusing protocols approved by the Institutional Animal Careand Use Committee (IACUC) of Emory University. TheBerkeley [15] and Townes [16] transgenic SCD mousemodels used have previously been described.
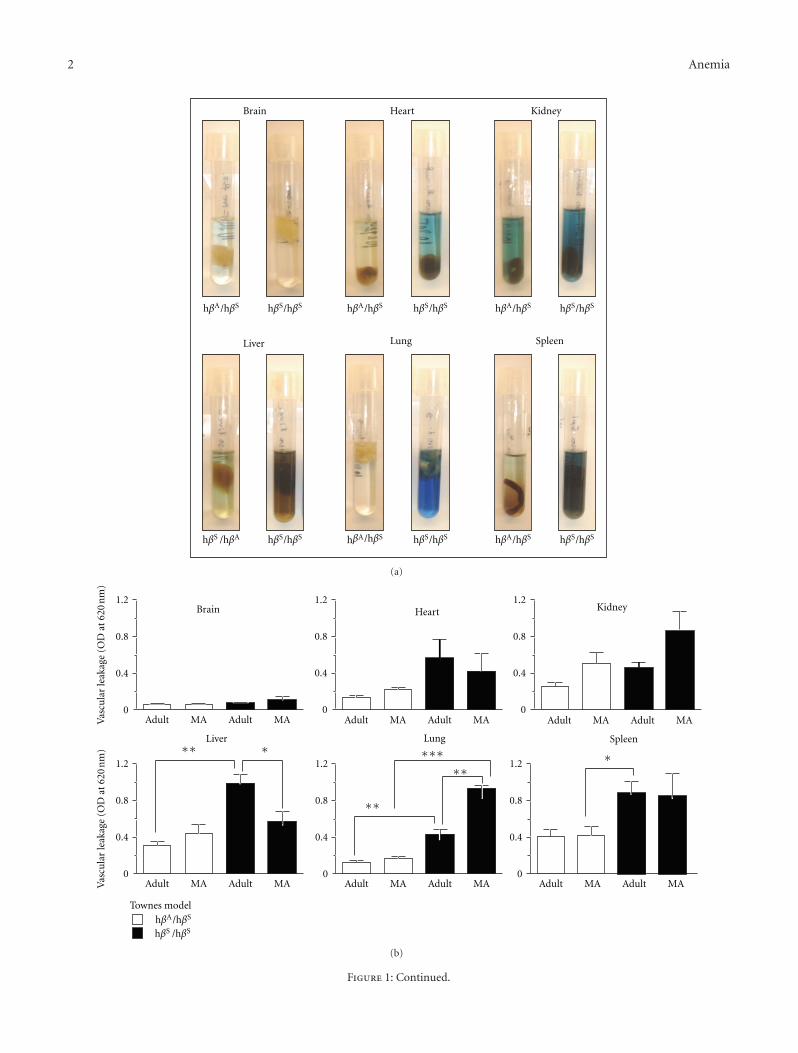
2 Anemia
hβA/hβS hβS/hβS
Spleen
hβS/hβS
Lung
hβA/hβS hβS/hβS
Brain
hβA/hβS
hβA/hβS
hβS/hβS
Heart
hβA/hβS hβS/hβS
Kidney
hβS /hβA hβS/hβS
Liver
(a)
0.8
1.2
0.4
0Adult AdultMA MA
0.8
1.2
0.4
0Adult AdultMA MA
0.8
1.2
0.4
0Adult AdultMA MA
Brain
0.8
1.2
0.4
0Adult AdultMA MA
Liver
Vas
cula
r le
akag
e (O
D a
t 62
0 n
m)
Vas
cula
r le
akag
e (O
D a
t 62
0 n
m)
Townes model
Heart Kidney
∗∗ ∗
0.8
1.2
0.4
0Adult AdultMA MA
Lung
∗∗
∗∗∗∗∗
0.8
1.2
0.4
0Adult AdultMA MA
Spleen
∗
hβA/hβS
hβS /hβS
(b)
Figure 1: Continued.
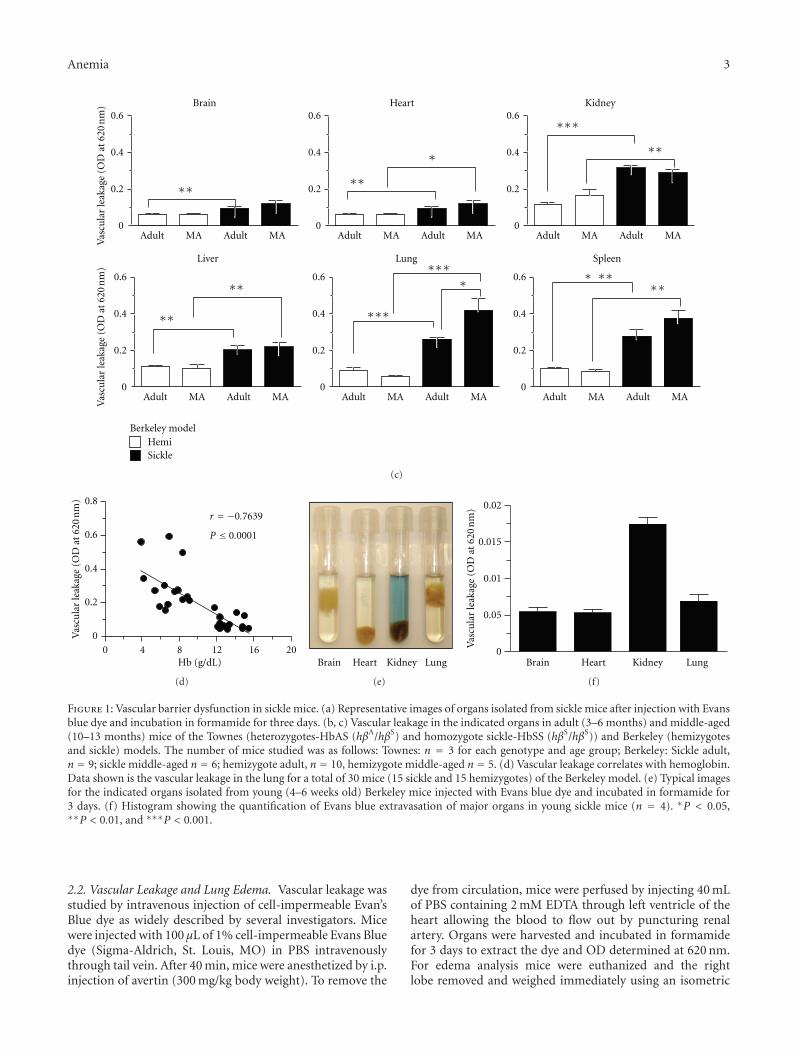
Anemia 3
Vas
cula
r le
akag
e (O
D a
t 62
0 n
m)
Vas
cula
r le
akag
e (O
D a
t 62
0 n
m)
HemiBerkeley model
Sickle
KidneyHeartBrain
Liver Lung Spleen
0.4
0.6
0.2
0Adult AdultMA MA
∗∗
0.4
0.6
0.2
0Adult AdultMA MA
∗
∗∗
0.4
0.6
0.2
0Adult AdultMA MA
∗∗∗
∗∗
0.4
0.6
0.2
0Adult AdultMA MA
∗∗
∗∗
0.4
0.6
0.2
0Adult AdultMA MA
∗∗∗
∗∗∗∗
0.4
0.6
0.2
0Adult AdultMA MA
∗∗∗∗∗
(c)
00 4 8 12 16 20
Vas
cula
r le
akag
e (O
D a
t 62
0 n
m)
0.2
0.4
0.6
0.8
r = −0.7639
P ≤ 0.0001
Hb (g/dL)
(d)
Brain Heart Kidney Lung
(e)
0Brain Heart Kidney Lung
0.05
0.01
0.015
0.02
Vas
cula
r le
akag
e (O
D a
t 62
0 n
m)
(f)
Figure 1: Vascular barrier dysfunction in sickle mice. (a) Representative images of organs isolated from sickle mice after injection with Evansblue dye and incubation in formamide for three days. (b, c) Vascular leakage in the indicated organs in adult (3–6 months) and middle-aged(10–13 months) mice of the Townes (heterozygotes-HbAS (hβA/hβS) and homozygote sickle-HbSS (hβS/hβS)) and Berkeley (hemizygotesand sickle) models. The number of mice studied was as follows: Townes: n = 3 for each genotype and age group; Berkeley: Sickle adult,n = 9; sickle middle-aged n = 6; hemizygote adult, n = 10, hemizygote middle-aged n = 5. (d) Vascular leakage correlates with hemoglobin.Data shown is the vascular leakage in the lung for a total of 30 mice (15 sickle and 15 hemizygotes) of the Berkeley model. (e) Typical imagesfor the indicated organs isolated from young (4–6 weeks old) Berkeley mice injected with Evans blue dye and incubated in formamide for3 days. (f) Histogram showing the quantification of Evans blue extravasation of major organs in young sickle mice (n = 4). ∗P < 0.05,∗∗P < 0.01, and ∗∗∗P < 0.001.
2.2. Vascular Leakage and Lung Edema. Vascular leakage wasstudied by intravenous injection of cell-impermeable Evan’sBlue dye as widely described by several investigators. Micewere injected with 100 μL of 1% cell-impermeable Evans Bluedye (Sigma-Aldrich, St. Louis, MO) in PBS intravenouslythrough tail vein. After 40 min, mice were anesthetized by i.p.injection of avertin (300 mg/kg body weight). To remove the
dye from circulation, mice were perfused by injecting 40 mLof PBS containing 2 mM EDTA through left ventricle of theheart allowing the blood to flow out by puncturing renalartery. Organs were harvested and incubated in formamidefor 3 days to extract the dye and OD determined at 620 nm.For edema analysis mice were euthanized and the rightlobe removed and weighed immediately using an isometric
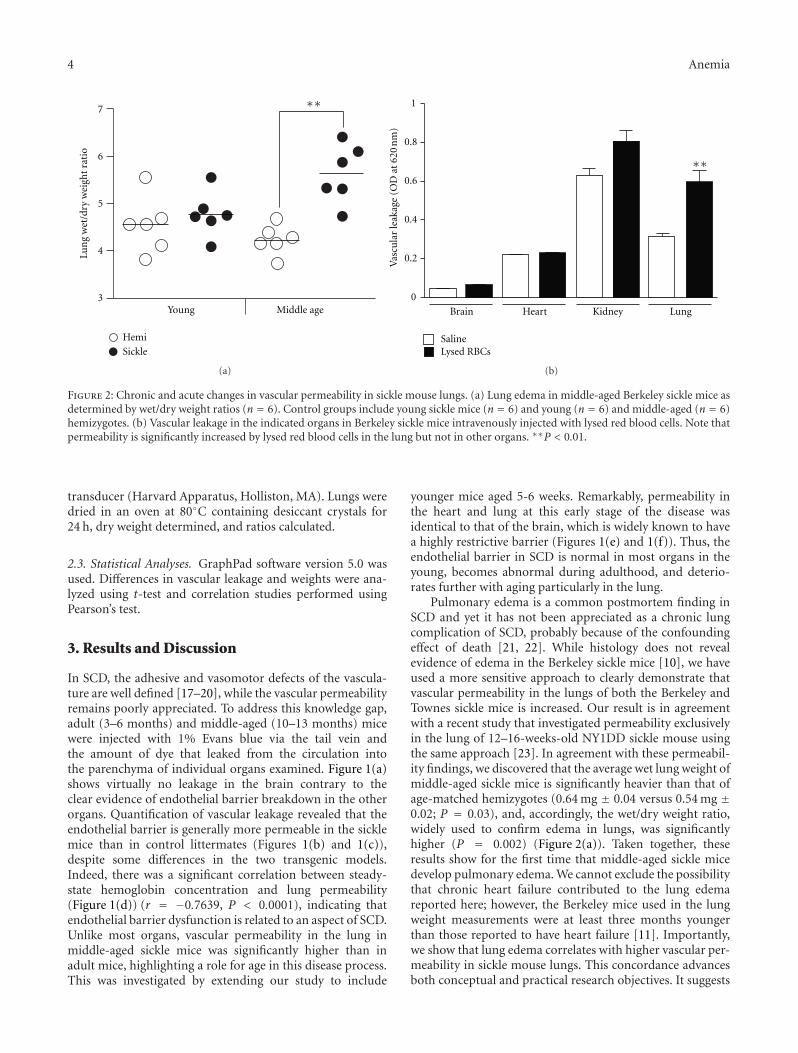
4 Anemia
Hemi
Sickle
Lun
g w
et/d
ry w
eigh
t ra
tio
Young Middle age
7
6
5
4
3
∗∗
(a)
1
0.8
0.6
0.4
0.2
0
Vas
cula
r le
akag
e (O
D a
t 62
0 n
m)
SalineLysed RBCs
Brain Heart Kidney Lung
∗∗
(b)
Figure 2: Chronic and acute changes in vascular permeability in sickle mouse lungs. (a) Lung edema in middle-aged Berkeley sickle mice asdetermined by wet/dry weight ratios (n = 6). Control groups include young sickle mice (n = 6) and young (n = 6) and middle-aged (n = 6)hemizygotes. (b) Vascular leakage in the indicated organs in Berkeley sickle mice intravenously injected with lysed red blood cells. Note thatpermeability is significantly increased by lysed red blood cells in the lung but not in other organs. ∗∗P < 0.01.
transducer (Harvard Apparatus, Holliston, MA). Lungs weredried in an oven at 80◦C containing desiccant crystals for24 h, dry weight determined, and ratios calculated.
2.3. Statistical Analyses. GraphPad software version 5.0 wasused. Differences in vascular leakage and weights were ana-lyzed using t-test and correlation studies performed usingPearson’s test.
3. Results and Discussion
In SCD, the adhesive and vasomotor defects of the vascula-ture are well defined [17–20], while the vascular permeabilityremains poorly appreciated. To address this knowledge gap,adult (3–6 months) and middle-aged (10–13 months) micewere injected with 1% Evans blue via the tail vein andthe amount of dye that leaked from the circulation intothe parenchyma of individual organs examined. Figure 1(a)shows virtually no leakage in the brain contrary to theclear evidence of endothelial barrier breakdown in the otherorgans. Quantification of vascular leakage revealed that theendothelial barrier is generally more permeable in the sicklemice than in control littermates (Figures 1(b) and 1(c)),despite some differences in the two transgenic models.Indeed, there was a significant correlation between steady-state hemoglobin concentration and lung permeability(Figure 1(d)) (r = −0.7639, P < 0.0001), indicating thatendothelial barrier dysfunction is related to an aspect of SCD.Unlike most organs, vascular permeability in the lung inmiddle-aged sickle mice was significantly higher than inadult mice, highlighting a role for age in this disease process.This was investigated by extending our study to include
younger mice aged 5-6 weeks. Remarkably, permeability inthe heart and lung at this early stage of the disease wasidentical to that of the brain, which is widely known to havea highly restrictive barrier (Figures 1(e) and 1(f)). Thus, theendothelial barrier in SCD is normal in most organs in theyoung, becomes abnormal during adulthood, and deterio-rates further with aging particularly in the lung.
Pulmonary edema is a common postmortem finding inSCD and yet it has not been appreciated as a chronic lungcomplication of SCD, probably because of the confoundingeffect of death [21, 22]. While histology does not revealevidence of edema in the Berkeley sickle mice [10], we haveused a more sensitive approach to clearly demonstrate thatvascular permeability in the lungs of both the Berkeley andTownes sickle mice is increased. Our result is in agreementwith a recent study that investigated permeability exclusivelyin the lung of 12–16-weeks-old NY1DD sickle mouse usingthe same approach [23]. In agreement with these permeabil-ity findings, we discovered that the average wet lung weight ofmiddle-aged sickle mice is significantly heavier than that ofage-matched hemizygotes (0.64 mg ± 0.04 versus 0.54 mg ±0.02; P = 0.03), and, accordingly, the wet/dry weight ratio,widely used to confirm edema in lungs, was significantlyhigher (P = 0.002) (Figure 2(a)). Taken together, theseresults show for the first time that middle-aged sickle micedevelop pulmonary edema. We cannot exclude the possibilitythat chronic heart failure contributed to the lung edemareported here; however, the Berkeley mice used in the lungweight measurements were at least three months youngerthan those reported to have heart failure [11]. Importantly,we show that lung edema correlates with higher vascular per-meability in sickle mouse lungs. This concordance advancesboth conceptual and practical research objectives. It suggests
Anemia 5
that the permeability phenotypes of the lung in mice andhumans with SCD are similar, and it validates, for the firsttime, the use of the Evans blue extravasation approach tostudy vascular permeability in transgenic sickle mice.
The permeability phenotypes identified here likely reflectthe intrinsic properties of individual organs, as well as ofendothelial cell types. For instance, it is well establishedthat heterogeneity of endothelial cell junction contributes tounique permeability attributes [24], and this may account forsome of the dramatic differences in permeability phenotypesreported here (e.g., brain and lung). However, endothelialcells in individual organs may also respond differently to bar-rier disrupting factors found in SCD. Among these factors,cell-free hemoglobin is unique because it is released inabundance during acute intravascular hemolysis, which is adaily event in SCD. We assessed the response of major vas-cular beds in the sickle mice to acute hemolysis. Leuko-depleted packed red blood cells were lysed by repeated freeze-thaw cycles and intravenously administered to sickle micevia tail vein. Compared to saline, the lysed red blood cellsincreased vascular permeability by 2-fold in the lungs ofadult sickle mice but had a modest or negligible impact onthe kidney, brain, and heart (Figure 2(b)). That lysed redblood cells caused morbidity and significantly altered barrierfunction in the Berkeley sickle mice indicates this and othersevere models of SCD can be used to unlock mechanisms ofacute hemolysis in SCD. In particular the vulnerability of thelung endothelial barrier to lysed red blood cells highlightsacute intravascular hemolysis as a potential trigger of theacute chest syndrome since a decreasing concentration ofhemoglobin is invariably associated with this condition [14].
In conclusion, SCD appears to be characterized by weak-ening of the endothelial barrier, which predisposes someorgans, such as the lung to acute loss of barrier function,reminiscent of the acute chest syndrome. Ongoing studies arefocused on unraveling the relationship between acute hemol-ysis and the endothelial barrier in SCD.
Authors’ Contribution
S. Ghosh designed and performed most of the experiments.F. Tan characterized the transgenic mice and performedresearch. S. F. Ofori-Acquah designed the study and providedoverall oversight of the projects.
Acknowledgments
The authors are grateful to Dr. Townes of the Universityof Alabama at Birmingham for the knock-in transgenicmice with SCD and to Dr. Archer of Emory Universityfor the Berkeley mice. This work was supported by GrantsR01HL077769 awarded to SFOA.
References
[1] S. Embury, R. P. Hebbel, N. Mohandas, and M. H. Steinberg,Sickle Cell Disease: Basic Principles and Clinical Practice, RavenPress, New York, NY, USA, 1995.
[2] G. J. Kato, M. T. Gladwin, and M. H. Steinberg, “Deconstruct-ing sickle cell disease: reappraisal of the role of hemolysis in thedevelopment of clinical subphenotypes,” Blood Reviews, vol.21, no. 1, pp. 37–47, 2007.
[3] T. A. Bensinger and P. N. Gillette, “Hemolysis in sickle cell dis-ease,” Archives of Internal Medicine, vol. 133, no. 4, pp. 624–631, 1974.
[4] W. Aird, Endothelial Biomedicine, Cambridge University Press,2007.
[5] M. H. Steinberg, “Sickle cell anemia, the first molecular dis-ease: overview of molecular etiology, pathophysiology, andtherapeutic approaches,” TheScientificWorldJournal, vol. 8, pp.1295–1324, 2008.
[6] A. J. Duits, R. C. Pieters, A. W. Saleh et al., “Enhanced levelsof soluble VCAM-1 in sickle cell patients and their specificincrement during vasoocclusive crisis,” Clinical Immunologyand Immunopathology, vol. 81, no. 1, pp. 96–98, 1996.
[7] A. Solovey, Y. Lin, P. Browne, S. Choong, E. Wayner, and R.P. Hebbel, “Circulating activated endothelial cells in sickle cellanemia,” New England Journal of Medicine, vol. 337, no. 22, pp.1584–1590, 1997.
[8] A. Solovey, L. Gui, N. S. Key, and R. P. Hebbel, “Tissue factorexpression by endothelial cells in sickle cell anemia,” Journal ofClinical Investigation, vol. 101, no. 9, pp. 1899–1904, 1998.
[9] J. D. Belcher, C. J. Bryant, J. Nguyen et al., “Transgenic sicklemice have vascular inflammation,” Blood, vol. 101, no. 10, pp.3953–3959, 2003.
[10] E. A. Manci, C. A. Hillery, C. A. Bodian, Z. G. Zhang, G. A.Lutty, and B. S. Coller, “Pathology of Berkeley sickle cell mice:similarities and differences with human sickle cell disease,”Blood, vol. 107, no. 4, pp. 1651–1658, 2006.
[11] L. L. Hsu, H. C. Champion, S. A. Campbell-Lee et al., “Hemo-lysis in sickle cell mice causes pulmonary hypertension due toglobal impairment in nitric oxide bioavailability,” Blood, vol.109, no. 7, pp. 3088–3098, 2007.
[12] M. T. Gladwin, V. Sachdev, M. L. Jison et al., “PulmonaryHypertension as a Risk Factor for Death in Patients with SickleCell Disease,” New England Journal of Medicine, vol. 350, no. 9,pp. 886–895, 2004.
[13] J. K. Graham, M. Mosunjac, R. L. Hanzlick, and M. Mosunjac,“Sickle cell lung disease and sudden death: a retrospective/prospective study of 21 autopsy cases and literature review,”American Journal of Forensic Medicine and Pathology, vol. 28,no. 2, pp. 168–172, 2007.
[14] E. P. Vichinsky, L. D. Neumayr, A. N. Earles et al., “Causes andoutcomes of the acute chest syndrome in sickle cell disease,”New England Journal of Medicine, vol. 342, no. 25, pp. 1855–1865, 2000.
[15] C. Paszty, C. M. Brion, E. Manci et al., “Transgenic knockoutmice with exclusively human sickle hemoglobin and sickle celldisease,” Science, vol. 278, no. 5339, pp. 876–878, 1997.
[16] L. C. Wu, C. W. Sun, T. M. Ryan, K. M. Pawlik, J. Ren, and T.M. Townes, “Correction of sickle cell disease by homologousrecombination in embryonic stem cells,” Blood, vol. 108, no. 4,pp. 1183–1188, 2006.
[17] C. D. Reiter, X. Wang, J. E. Tanus-Santos et al., “Cell-freehemoglobin limits nitric oxide bioavailability in sickle-celldisease,” Nature Medicine, vol. 8, no. 12, pp. 1383–1389, 2002.
[18] M. T. Gladwin, V. Sachdev, M. L. Jison et al., “Pulmonaryhypertension as a risk factor for death in patients with sicklecell disease,” New England Journal of Medicine, vol. 350, no. 9,pp. 886–895, 2004.
[19] R. P. Hebbel, R. Osarogiagbon, and D. Kaul, “The endothelialbiology of sickle cell disease: inflammation and a chronic
6 Anemia
vasculopathy,” Microcirculation, vol. 11, no. 2, pp. 129–151,2004.
[20] B. N. Y. Setty and M. J. Stuart, “Vascular cell adhesion mol-ecule-1 is involved in mediating hypoxia- induced sickle redblood cell adherence to endothelium: potential role in sicklecell disease,” Blood, vol. 88, no. 6, pp. 2311–2320, 1996.
[21] J. K. Graham, M. Mosunjac, R. L. Hanzlick, and M. Mosunjac,“Sickle cell lung disease and sudden death: a retrospective/prospective study of 21 autopsy cases and literature review,”American Journal of Forensic Medicine and Pathology, vol. 28,no. 2, pp. 168–172, 2007.
[22] W. Girard, “Case report: postoperative pulmonary edema andsickle cell crisis,” Clinical Notes on Respiratory Diseases, vol. 17,no. 4, pp. 13–14, 1979.
[23] K. L. Wallace, M. A. Marshall, S. I. Ramos et al., “NKT cellsmediate pulmonary inflammation and dysfunction in murinesickle cell disease through production of IFN-γ and CXCR3chemokines,” Blood, vol. 114, no. 3, pp. 667–676, 2009.
[24] A. Masedunskas, J. A. King, F. Tan et al., “Activated leukocytecell adhesion molecule is a component of the endothelial junc-tion involved in transendothelial monocyte migration,” FEBSLetters, vol. 580, no. 11, pp. 2637–2645, 2006.
Hindawi Publishing CorporationAnemiaVolume 2012, Article ID 387385, 9 pagesdoi:10.1155/2012/387385
Research Article
Hematopoietic Stem Cell Function in a Murine Model ofSickle Cell Disease
Elisabeth H. Javazon,1 Mohamed Radhi,2 Bagirath Gangadharan,3
Jennifer Perry,3 and David R. Archer3
1 Department of Biology, Morehouse College, 830 Westview Drive Southwest, Atlanta, GA 30314-3773, USA2 Department of Pediatrics, UI Hospitals and Clinics, University of Iowa, 2633 Carver Pavilion, 200 Hawkins Drive,Iowa City, IA 52242, USA
3 Aflac Cancer and Blood Disorders Center, Emory University and Children’s Healthcare of Atlanta, 2015 Uppergate Drive,Atlanta, GA 30322, USA
Correspondence should be addressed to David R. Archer, [email protected]
Received 17 December 2011; Revised 8 March 2012; Accepted 29 March 2012
Academic Editor: Betty S. Pace
Copyright © 2012 Elisabeth H. Javazon et al. This is an open access article distributed under the Creative Commons AttributionLicense, which permits unrestricted use, distribution, and reproduction in any medium, provided the original work is properlycited.
Previous studies have shown that the sickle environment is highly enriched for reactive oxygen species (ROS). We examined theoxidative effects of sickle cell disease on hematopoietic stem cell function in a sickle mouse model. In vitro colony-forming assaysshowed a significant decrease in progenitor colony formation derived from sickle compared to control bone marrow (BM). SickleBM possessed a significant decrease in the KSL (c-kit+, Sca-1+, Lineage−) progenitor population, and cell cycle analysis showedthat there were fewer KSL cells in the G0 phase of the cell cycle compared to controls. We found a significant increase in both lipidperoxidation and ROS in sickle-derived KSL cells. In vivo analysis demonstrated that normal bone marrow cells engraft withincreased frequency into sickle mice compared to control mice. Hematopoietic progenitor cells derived from sickle mice, however,demonstrated significant impairment in engraftment potential. We observed partial restoration of engraftment by n-acetylcysteine (NAC) treatment of KSL cells prior to transplantation. Increased intracellular ROS and lipid peroxidation combined withimprovement in engraftment following NAC treatment suggests that an altered redox environment in sickle mice affects hemato-poietic progenitor and stem cell function.
1. Introduction
Sickle cell disease (SCD) is one of the most common inher-ited hemoglobinopathies in the world. In the United States,approximately 1 in 600 African Americans have been diag-nosed with SCD [1]. SCD is an autosomal recessive geneticdisorder caused by a substitution of glutamic acid by valinein the beta subunit of the hemoglobin gene. This substitutionresults in the production of abnormal hemoglobin (HbS).Deoxygenated HbS polymerizes, resulting in intravascularhemolysis of the red blood cell and release of hemoglobin andother compounds into the plasma [2]. Repeating cycles ofpolymerization and hemolysis lead to vaso-occlusion and
ischemia-reperfusion injury. Inherent in these processes areinflammatory responses and oxidant stress which result inpathological outcomes such as acute chest syndrome, pul-monary hypertension, and stroke in patients with SCD [3].
Oxidative stress is a result of increased production ofreactive oxygen species (ROS) combined with decreased pro-duction or availability of antioxidants. Cellular metabolismof oxygen can lead to the production of ROS such as super-oxide anion radicals, hydrogen peroxide, and hydroxylradicals. ROS can impair the proper function of DNA, lipids,proteins, and carbohydrates [4]. An imbalance in the amountof pro-oxidants and antioxidants leads to an environment ofoxidative stress, cell dysfunction, or cell death. Antioxidants
2 Anemia
such as nitric oxide (NO), superoxide dismutase (SOD),and reduced glutathione (GSH) function to neutralize excessROS.
There is increasing evidence that oxidative stress and ROSplay a pivotal role in the pathophysiology of numerous dis-eases including neurodegenerative diseases, cardiovasculardiseases, cancers, and arthritis [5–10]. Oxidative stress hasbeen linked to vascular defects leading to hypertension andatherosclerosis as well as cardiac defects leading to contractiledysfunction and dysrhythmias [11]. In addition to the abilityto induce mutations in DNA, ROS play a key role in cellsignaling and cell regulatory pathways and thus play a pivotalrole in the development of tumors and malignancies [12–16].
In SCD, under low-oxygen conditions, HbS polymerizesleading to hemolysis and a significantly shortened lifespan[17]. Hemolysed RBCs release hemoglobin, iron, and argin-ase into the plasma resulting in decreased nitric oxide avail-ability and leading to imbalanced vascular homeostasis andoxidative stress [17–19]. Sickle RBCs generate more super-oxide, hydrogen peroxide, and lipid oxidation productscompared to normal RBCs [20]. Increased ROS in plateletsand polymorphonuclear neutrophils along with decreasedglutathione levels has also been documented in patients withSCD [21]. In addition, endothelium exposed to sickled RBCsbecome activated, causing sickled RBCs and leukocytes toadhere to the activated endothelium, resulting in a release ofcytokines and ROS [6, 22, 23]. In this study, we studied theeffects of this pro-oxidant and proinflammatory environ-ment on hematopoietic progenitor and stem cells in theBerkeley model of sickle cell disease.
2. Materials and Methods
2.1. Animals. Sickle mice, originally supplied by Dr. Paszty[24], express exclusively human α-, βsickle, and γ-globin andexist on a mixed genetic background (FVB/N, 129, DBA/2,C57BL/6, and Black Swiss). Breeding and pregnant sicklemice were fed TestDiet no. 0007573 (Purina). The colony ismaintained by breeding female hemizygous mice with 2copies of the transgene to homozygous male mice. Theresulting pups are hemizygous, expressing one (H-1) or two(H-2) copies of the transgene, one copy of murine betaglobin, but no expression of murine alpha globin. Homozy-gous “sickle” mice that only express human gamma, alpha,and betasickle globins are easily distinguishable from wild typeand the H-1 and H-2 hemizygotes by hemoglobin electro-phoresis (Figure 1) [24, 25]. H-1 mice have ∼28% sicklehemoglobin and H-2 mice have ∼45%. Despite having onlyone copy of the sickle hemoglobin transgene, H-1 mice arehematologically more severe (Figure 1). H-2 and C57BL/6were primarily used as control mice for the homozygousmice. All breeding and experimental procedures were per-formed at Emory University in accordance with the rec-ommendations of the Institutional Animal Care and UseCommittee (IACUC).
2.2. Flow Cytometry. Bone marrow was harvested and stainedwith the following fluorochrome-conjugated antibodies:
CD45.1-PE, CD45.2-APC, c-kit-FITC, Sca1-PE, and Lin-eage-APC (B220, CD3, CD11b, GR-1, and Ter119; BDPharmingen, San Diego, CA), and KSL cells were sorted ona FACSAria. Cells from the peripheral blood were analyzedat various time points on an LSR II flow cytometer (BDBiosciences, San Jose, CA). Propidium iodide was used toexclude dead cells. For ROS analysis, cells were incubated in160 μM Dichlorodihydrofluorescein diacetate (H2DCFDA)(St. Louis, MO, Sigma-Aldrich) or 5 μM N-(fluorescein-5thiocarbamoyl)-1,2-dihexadecanoyl-sn-glycero-3-phos-phoethanolamine, triethylammonium salt (DHPE) (Carls-bad, CA, Invitrogen) in HBSS for 15 min or 60 min, res-pectively, at 37◦C shaking in the dark. Cells were washedand analyzed by flow cytometry. Absolute cell counts wereperformed using Trucount tubes (BD Biosciences).
2.3. HPP Assay. Twenty thousand freshly isolated bonemarrow mononuclear cells were plated in methylcellulosemedium (StemCell Technologies Inc., Vancouver) contain-ing recombinant cytokines (100 ng rat steel factor, 1600Um-CSF, 75U IL-3, 5000U IL-1α, 30 ng/mL EGF, and30 ng/mL FGF) to analyze the colony-forming potential ofstem cells derived from the bone marrow of sickle andcontrol mice. Cells were cultured for 10 days, and colonieswere counted using an inverted microscope.
2.4. Hemoglobin Analysis. Differential hemoglobin electro-phoresis of peripheral blood from Berkeley sickle mice wasperformed to determine hetero- and homozygosity of themurine and human globin genes (Helena Titan III electro-phoresis system, Helena Laboratories, Beaumont, TX) [26].As shown in Figure 1, C57BL/6 mice express the murine betaglobin “single” allele, the H-1 and H-2 hemizygotes expressincreasing amounts of human betasickle globin in the presenceof the murine allele expressing “diffuse” beta globin, and themice homozygous for the deletions of murine alpha and betaglobins express only human betasickle globin.
2.5. Transplants
2.5.1. The Effect of the Recipient Environment. To test theeffects of transplanting into the sickle microenvironment,1 × 107 bone marrow cells from C57BL/6 mice (expressingCD45.2) were transplanted into homozygous sickle (n = 8)and B6.SJL-Ptprca Pepcb/BoyJ mice (n = 10; both expressingCD45.1) without ablation. While sickle and C57BL/6 sharethe MCH class I allele H-2Kb, their genetic backgrounds arenot identical and therefore are unlikely to share the full hap-lotype. We have previously shown that T-cell costimulationblockade promotes engraftment across allo-barriers in thismodel, and it was therefore included in this protocol. Specif-ically, 500 μg each of hamster antimouse-CD40L (MR1;BioExpress, Lebanon, NH) and human CTLA4-immuno-globulin (generous gift from Dr. C. Larsen) was given intra-peritoneally on days 0, 2, 4, and 7 relative to BMT.
2.5.2. Competitive Repopulation Study. To test the repop-ulation capacity of individual stem cell populations, three
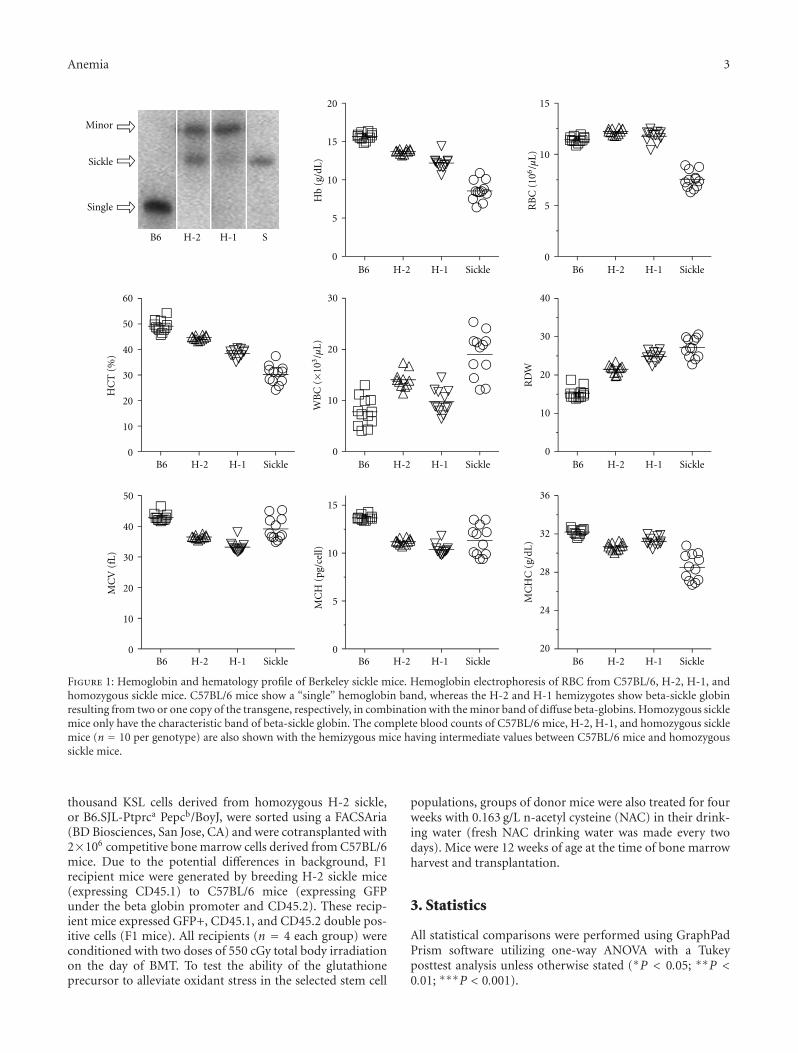
Anemia 3
Minor
Sickle
Single
B6 H-2 H-1 S
0
5
10
15
20
Hb
(g/d
L)
0
5
10
15
RB
C (
106/µ
L)
0
10
20
30
40
50
60
HC
T (
%)
0
10
20
30
WB
C (×1
03/µ
L)
RD
W
MC
V (
fL)
MC
H (
pg/c
ell)
20
24
28
32
36
MC
HC
(g/
dL)
0
10
20
30
40
0
10
20
30
40
50
0
5
10
15
B6 H-2 H-1 Sickle B6 H-2 H-1 Sickle B6 H-2 H-1 Sickle
B6 H-2 H-1 Sickle B6 H-2 H-1 Sickle B6 H-2 H-1 Sickle
B6 H-2 H-1 Sickle B6 H-2 H-1 Sickle
Figure 1: Hemoglobin and hematology profile of Berkeley sickle mice. Hemoglobin electrophoresis of RBC from C57BL/6, H-2, H-1, andhomozygous sickle mice. C57BL/6 mice show a “single” hemoglobin band, whereas the H-2 and H-1 hemizygotes show beta-sickle globinresulting from two or one copy of the transgene, respectively, in combination with the minor band of diffuse beta-globins. Homozygous sicklemice only have the characteristic band of beta-sickle globin. The complete blood counts of C57BL/6 mice, H-2, H-1, and homozygous sicklemice (n = 10 per genotype) are also shown with the hemizygous mice having intermediate values between C57BL/6 mice and homozygoussickle mice.
thousand KSL cells derived from homozygous H-2 sickle,or B6.SJL-Ptprca Pepcb/BoyJ, were sorted using a FACSAria(BD Biosciences, San Jose, CA) and were cotransplanted with2×106 competitive bone marrow cells derived from C57BL/6mice. Due to the potential differences in background, F1recipient mice were generated by breeding H-2 sickle mice(expressing CD45.1) to C57BL/6 mice (expressing GFPunder the beta globin promoter and CD45.2). These recip-ient mice expressed GFP+, CD45.1, and CD45.2 double pos-itive cells (F1 mice). All recipients (n = 4 each group) wereconditioned with two doses of 550 cGy total body irradiationon the day of BMT. To test the ability of the glutathioneprecursor to alleviate oxidant stress in the selected stem cell
populations, groups of donor mice were also treated for fourweeks with 0.163 g/L n-acetyl cysteine (NAC) in their drink-ing water (fresh NAC drinking water was made every twodays). Mice were 12 weeks of age at the time of bone marrowharvest and transplantation.
3. Statistics
All statistical comparisons were performed using GraphPadPrism software utilizing one-way ANOVA with a Tukeyposttest analysis unless otherwise stated (∗P < 0.05; ∗∗P <0.01; ∗∗∗P < 0.001).
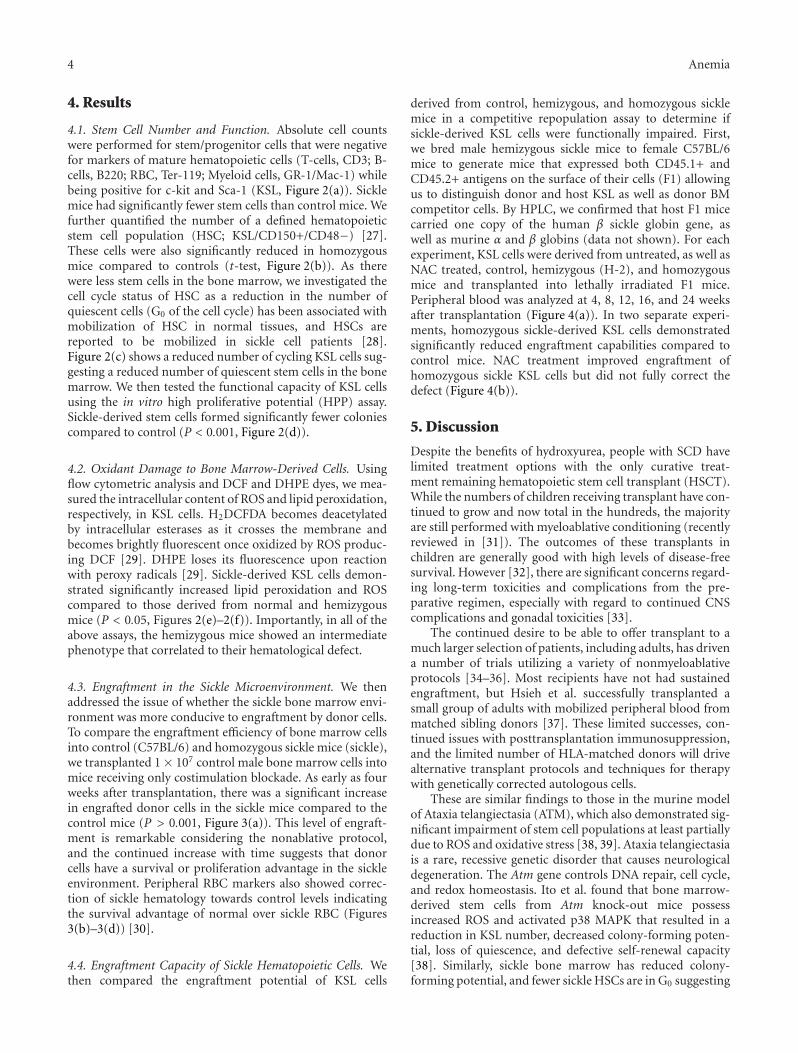
4 Anemia
4. Results
4.1. Stem Cell Number and Function. Absolute cell countswere performed for stem/progenitor cells that were negativefor markers of mature hematopoietic cells (T-cells, CD3; B-cells, B220; RBC, Ter-119; Myeloid cells, GR-1/Mac-1) whilebeing positive for c-kit and Sca-1 (KSL, Figure 2(a)). Sicklemice had significantly fewer stem cells than control mice. Wefurther quantified the number of a defined hematopoieticstem cell population (HSC; KSL/CD150+/CD48−) [27].These cells were also significantly reduced in homozygousmice compared to controls (t-test, Figure 2(b)). As therewere less stem cells in the bone marrow, we investigated thecell cycle status of HSC as a reduction in the number ofquiescent cells (G0 of the cell cycle) has been associated withmobilization of HSC in normal tissues, and HSCs arereported to be mobilized in sickle cell patients [28].Figure 2(c) shows a reduced number of cycling KSL cells sug-gesting a reduced number of quiescent stem cells in the bonemarrow. We then tested the functional capacity of KSL cellsusing the in vitro high proliferative potential (HPP) assay.Sickle-derived stem cells formed significantly fewer coloniescompared to control (P < 0.001, Figure 2(d)).
4.2. Oxidant Damage to Bone Marrow-Derived Cells. Usingflow cytometric analysis and DCF and DHPE dyes, we mea-sured the intracellular content of ROS and lipid peroxidation,respectively, in KSL cells. H2DCFDA becomes deacetylatedby intracellular esterases as it crosses the membrane andbecomes brightly fluorescent once oxidized by ROS produc-ing DCF [29]. DHPE loses its fluorescence upon reactionwith peroxy radicals [29]. Sickle-derived KSL cells demon-strated significantly increased lipid peroxidation and ROScompared to those derived from normal and hemizygousmice (P < 0.05, Figures 2(e)–2(f)). Importantly, in all of theabove assays, the hemizygous mice showed an intermediatephenotype that correlated to their hematological defect.
4.3. Engraftment in the Sickle Microenvironment. We thenaddressed the issue of whether the sickle bone marrow envi-ronment was more conducive to engraftment by donor cells.To compare the engraftment efficiency of bone marrow cellsinto control (C57BL/6) and homozygous sickle mice (sickle),we transplanted 1× 10⁷ control male bone marrow cells intomice receiving only costimulation blockade. As early as fourweeks after transplantation, there was a significant increasein engrafted donor cells in the sickle mice compared to thecontrol mice (P > 0.001, Figure 3(a)). This level of engraft-ment is remarkable considering the nonablative protocol,and the continued increase with time suggests that donorcells have a survival or proliferation advantage in the sickleenvironment. Peripheral RBC markers also showed correc-tion of sickle hematology towards control levels indicatingthe survival advantage of normal over sickle RBC (Figures3(b)–3(d)) [30].
4.4. Engraftment Capacity of Sickle Hematopoietic Cells. Wethen compared the engraftment potential of KSL cells
derived from control, hemizygous, and homozygous sicklemice in a competitive repopulation assay to determine ifsickle-derived KSL cells were functionally impaired. First,we bred male hemizygous sickle mice to female C57BL/6mice to generate mice that expressed both CD45.1+ andCD45.2+ antigens on the surface of their cells (F1) allowingus to distinguish donor and host KSL as well as donor BMcompetitor cells. By HPLC, we confirmed that host F1 micecarried one copy of the human β sickle globin gene, aswell as murine α and β globins (data not shown). For eachexperiment, KSL cells were derived from untreated, as well asNAC treated, control, hemizygous (H-2), and homozygousmice and transplanted into lethally irradiated F1 mice.Peripheral blood was analyzed at 4, 8, 12, 16, and 24 weeksafter transplantation (Figure 4(a)). In two separate experi-ments, homozygous sickle-derived KSL cells demonstratedsignificantly reduced engraftment capabilities compared tocontrol mice. NAC treatment improved engraftment ofhomozygous sickle KSL cells but did not fully correct thedefect (Figure 4(b)).
5. Discussion
Despite the benefits of hydroxyurea, people with SCD havelimited treatment options with the only curative treat-ment remaining hematopoietic stem cell transplant (HSCT).While the numbers of children receiving transplant have con-tinued to grow and now total in the hundreds, the majorityare still performed with myeloablative conditioning (recentlyreviewed in [31]). The outcomes of these transplants inchildren are generally good with high levels of disease-freesurvival. However [32], there are significant concerns regard-ing long-term toxicities and complications from the pre-parative regimen, especially with regard to continued CNScomplications and gonadal toxicities [33].
The continued desire to be able to offer transplant to amuch larger selection of patients, including adults, has drivena number of trials utilizing a variety of nonmyeloablativeprotocols [34–36]. Most recipients have not had sustainedengraftment, but Hsieh et al. successfully transplanted asmall group of adults with mobilized peripheral blood frommatched sibling donors [37]. These limited successes, con-tinued issues with posttransplantation immunosuppression,and the limited number of HLA-matched donors will drivealternative transplant protocols and techniques for therapywith genetically corrected autologous cells.
These are similar findings to those in the murine modelof Ataxia telangiectasia (ATM), which also demonstrated sig-nificant impairment of stem cell populations at least partiallydue to ROS and oxidative stress [38, 39]. Ataxia telangiectasiais a rare, recessive genetic disorder that causes neurologicaldegeneration. The Atm gene controls DNA repair, cell cycle,and redox homeostasis. Ito et al. found that bone marrow-derived stem cells from Atm knock-out mice possessincreased ROS and activated p38 MAPK that resulted in areduction in KSL number, decreased colony-forming poten-tial, loss of quiescence, and defective self-renewal capacity[38]. Similarly, sickle bone marrow has reduced colony-forming potential, and fewer sickle HSCs are in G0 suggesting
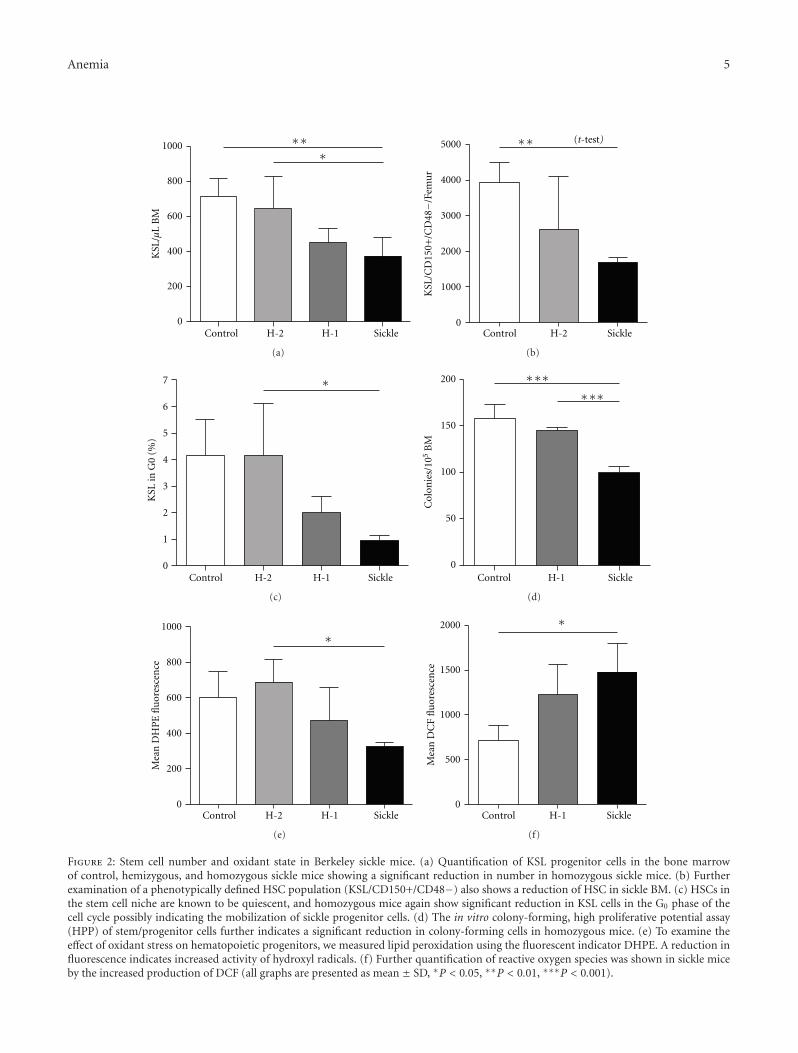
Anemia 5
KSL
/µL
BM
0
200
400
600
800
1000 ∗∗∗
Control H-2 H-1 Sickle
(a)
∗∗
Control H-2 Sickle
(t-test)
0
1000
2000
3000
4000
5000
KSL
/CD
150+
/CD
48−/
Fem
ur
(b)
∗
Control H-2 H-1 Sickle0
1
2
3
4
5
6
7
KSL
in G
0 (%
)
(c)
∗∗∗∗∗∗
Control H-1 Sickle0
50
100
150
200
Col
onie
s/10
5B
M
(d)
∗
Control H-2 H-1 Sickle0
200
400
600
800
1000
Mea
n D
HP
E fl
uor
esce
nce
(e)
∗
Control H-1 Sickle0
500
1000
1500
2000
Mea
n D
CF
flu
ores
cen
ce
(f)
Figure 2: Stem cell number and oxidant state in Berkeley sickle mice. (a) Quantification of KSL progenitor cells in the bone marrowof control, hemizygous, and homozygous sickle mice showing a significant reduction in number in homozygous sickle mice. (b) Furtherexamination of a phenotypically defined HSC population (KSL/CD150+/CD48−) also shows a reduction of HSC in sickle BM. (c) HSCs inthe stem cell niche are known to be quiescent, and homozygous mice again show significant reduction in KSL cells in the G0 phase of thecell cycle possibly indicating the mobilization of sickle progenitor cells. (d) The in vitro colony-forming, high proliferative potential assay(HPP) of stem/progenitor cells further indicates a significant reduction in colony-forming cells in homozygous mice. (e) To examine theeffect of oxidant stress on hematopoietic progenitors, we measured lipid peroxidation using the fluorescent indicator DHPE. A reduction influorescence indicates increased activity of hydroxyl radicals. (f) Further quantification of reactive oxygen species was shown in sickle miceby the increased production of DCF (all graphs are presented as mean ± SD, ∗P < 0.05, ∗∗P < 0.01, ∗∗∗P < 0.001).
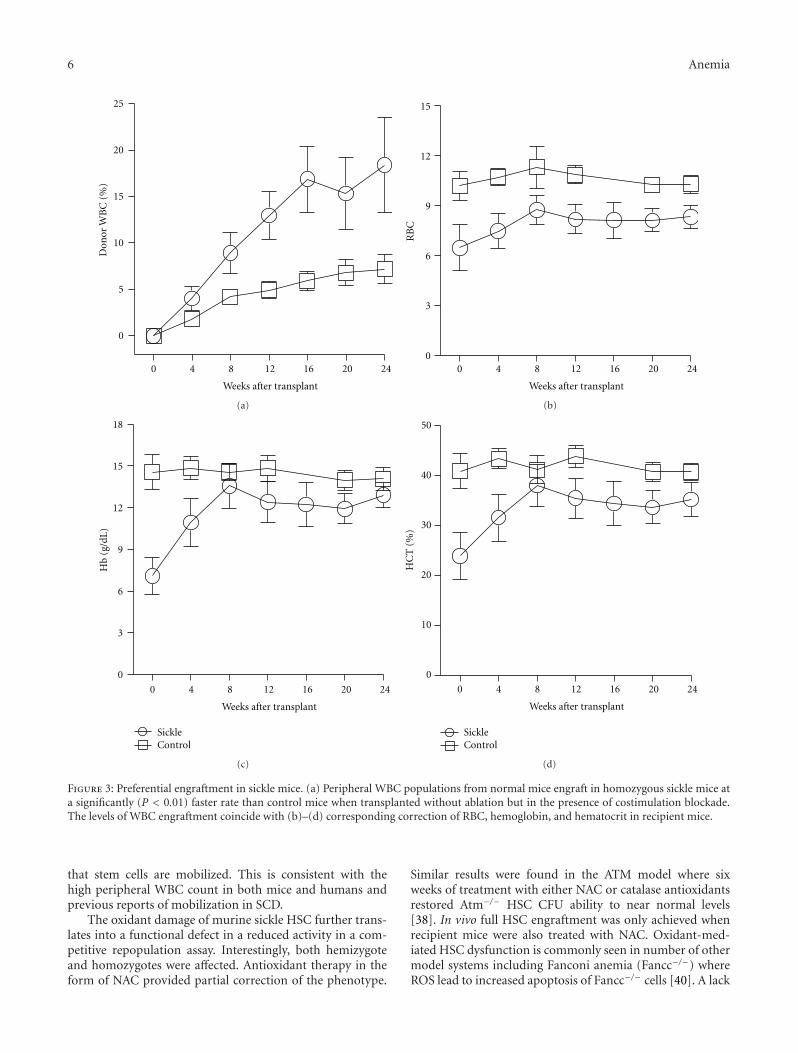
6 Anemia
0
5
10
15
20
25D
onor
WB
C (
%)
0 4 8 12 16 20 24
Weeks after transplant
(a)
0 4 8 12 16 20 24
Weeks after transplant
0
3
6
9
12
15
RB
C(b)
0 4 8 12 16 20 24
Weeks after transplant
SickleControl
0
3
6
9
12
15
18
Hb
(g/d
L)
(c)
0 4 8 12 16 20 24
Weeks after transplant
SickleControl
0
10
20
30
40
50
HC
T (
%)
(d)
Figure 3: Preferential engraftment in sickle mice. (a) Peripheral WBC populations from normal mice engraft in homozygous sickle mice ata significantly (P < 0.01) faster rate than control mice when transplanted without ablation but in the presence of costimulation blockade.The levels of WBC engraftment coincide with (b)–(d) corresponding correction of RBC, hemoglobin, and hematocrit in recipient mice.
that stem cells are mobilized. This is consistent with thehigh peripheral WBC count in both mice and humans andprevious reports of mobilization in SCD.
The oxidant damage of murine sickle HSC further trans-lates into a functional defect in a reduced activity in a com-petitive repopulation assay. Interestingly, both hemizygoteand homozygotes were affected. Antioxidant therapy in theform of NAC provided partial correction of the phenotype.
Similar results were found in the ATM model where sixweeks of treatment with either NAC or catalase antioxidantsrestored Atm−/− HSC CFU ability to near normal levels[38]. In vivo full HSC engraftment was only achieved whenrecipient mice were also treated with NAC. Oxidant-med-iated HSC dysfunction is commonly seen in number of othermodel systems including Fanconi anemia (Fancc−/−) whereROS lead to increased apoptosis of Fancc−/− cells [40]. A lack
Anemia 7
SSC
FSC
(a)
Live
/dea
d
Lineage
(b)
C-K
it
Sca-1
(c)
CD
45.1
CD45.2
Con. 15%
F1 6%
Comp. 79%M
(d)
CD
45.1
CD45.2
F1 6%
Comp. 91%
Sickle 3%
M
(e)
CD
45.1
CD45.2
F1 6%
Comp. 85%
Sickle + NAC 9%
M
(f)
0
10
20
30
40
50
60
70
Control
NAC
Don
or W
BC
(%
)
Control H-2 Sickle
∗∗
∗∗
(g)
Figure 4: Functional defect of sickle hematopoietic stem cells in a competitive repopulation assay. Strategy for sorting KSL cells from wholebone marrow: mononuclear cells gated on FSC and SSC of whole BM (a), gated lineage and propidium iodide negative on mononuclear cells(b), and c-kit+, Sca1+, Lin− (KSL) cells (c). Peripheral blood engraftment after transplantation. Representative flow cytometry plots showingKSL cells from control mice engrafted at 15% (d), sickle KSL cells engrafted at 3% (e), and NAC- treated sickle KSL cells engrafted at 9% (f).Composite data showing a reduced capacity for engraftment between hemizygous and control mice and a further defect in KSL cells fromhomozygous mice 24 weeks after transplant (g). Graphical representation of the data from all mice: pretreatment of donor cells with NACpartially restored engraftment of KSL cells from homozygous sickle cell mice.
of FoxO family members also leads to an increase in ROS anda reduction in both HSC number and reconstitution ability[41]. In both of these models, antioxidant therapy with NACis able to reverse or ameliorate the defects. Oxidant mediatedstem cell damage is not limited to hematopoietic cells, forexample, Kim and Wong demonstrated an oxidant-mediated
defect in atm−/− neural stem cells that was responsive to NAC[42]. It is interesting to speculate that the high levels of oxi-dant stress could affect other organ-specific stem cell popula-tions, and that this might be an important factor in the ongo-ing repair of sickle-related organ pathology. The HSC defectsshould also be considered when designing gene therapy
8 Anemia
protocols first, as there may be a reduced number of HSCsavailable for collection and secondly as the HSCs have areduced engraftment potential prior to ex-vivo manipula-tion.
Clinically, patients with severe sickle disease, who wouldbe a desirable target population for HSCT, are likely toencounter more complications during transplant due toongoing disease-related pathology and inflammation. How-ever, with successful immunomodulatory strategies our datawould suggest that engraftment of HSC into the sickleenvironment itself should be successful, and donor cells mayhave a comparative advantage. This could be especiallyimportant if designing approaches based on mixed hemato-poietic chimerism that have been successfully used in murinemodel systems [30, 43].
All of the major pathologic consequences of SCD suchRBC lysis, endothelial activation, and vaso-occlusion eitherinduce or exacerbate the production of ROS with subsequenteffects being likely to contribute to further pathologic pro-cesses (recently reviewed in [3, 4]). Consequently, a numberof investigators have studied the use of antioxidants in SCD,mostly focusing on RBC effects. Vitamins C and E and NAChave all been shown to reduce ROS and increase the levels ofglutathione in sickle RBC and PMN in vitro [21]. Treatmentof NAC reduced the formation of dense RBC and increasedthe levels of intracellular glutathione in RBC of patients withSCD; importantly this correlated with a reduction in thenumber of vaso-occlusive crises during the treatment period[44]. Similarly, treatment with NAC for 6 weeks reducedphosphatidyl serine exposure on the membrane of sickleRBC and the levels of cell-free hemoglobin [45] indicatinga cellular effect for an oral antioxidant.
In summary, we describe the effects of sickle-mediatedoxidant stress on the bone marrow environment and hema-topoietic stem and progenitors and detail defects in HSCfunction that raise important concerns when designingfuture stem cell therapies for sickle cell disease.
Acknowledgments
Flow cytometry was performed in the Emory-Children’sPediatric Research Center Flow Cytometry Core. Partial sup-port was from HL073307 (D. R. Archer).
References
[1] D. J. Weatherall and J. B. Clegg, “Inherited haemoglobindisorders: an increasing global health problem,” Bulletin of theWorld Health Organization, vol. 79, no. 8, pp. 704–712, 2001.
[2] J. I. Malowany and J. Butany, “Pathology of sickle cell disease,”Seminars in Diagnostic Pathology, vol. 29, pp. 49–55, 2012.
[3] E. Nur, B. J. Biemond, H. M. Otten, D. P. Brandjes, and J. J.B. Schnog, “Oxidative stress in sickle cell disease; pathophys-iology and potential implications for disease management,”American Journal of Hematology, vol. 86, no. 6, pp. 484–489,2011.
[4] E. N. Chirico and V. Pialoux, “Role of oxidative stress in thepathogenesis of sickle cell disease,” IUBMB Life, vol. 64, pp.72–80, 2012.
[5] M. Aslan, D. Thornley-Brown, and B. A. Freeman, “Reactivespecies in sickle cell disease,” Annals of the New York Academyof Sciences, vol. 899, pp. 375–391, 2000.
[6] R. P. Hebbel, R. Osarogiagbon, and D. Kaul, “The endothelialbiology of sickle cell disease: inflammation and a chronicvasculopathy,” Microcirculation, vol. 11, no. 2, pp. 129–151,2004.
[7] D. K. Kaul, X. D. Liu, X. Zhang, L. Ma, C. J. C. Hsia, and R.L. Nagel, “Inhibition of sickle red cell adhesion and vasooc-clusion in the microcirculation by antioxidants,” AmericanJournal of Physiology, vol. 291, no. 1, pp. H167–H175, 2006.
[8] A. Kyle Mack and G. J. Kato, “Sickle cell disease and nitricoxide: a paradigm shift?” International Journal of Biochemistryand Cell Biology, vol. 38, no. 8, pp. 1237–1243, 2006.
[9] S. S. Somjee, R. P. Warrier, J. L. Thomson, J. Ory-Ascani, andJ. M. Hempe, “Advanced glycation end-products in sickle cellanaemia,” British Journal of Haematology, vol. 128, no. 1, pp.112–118, 2005.
[10] K. Ito, A. Hirao, F. Arai et al., “Regulation of oxidative stressby ATM is required for self-renewal of haematopoietic stemcells,” Nature, vol. 431, no. 7011, pp. 997–1002, 2004.
[11] N. S. Dhalla, R. M. Temsah, and T. Netticadan, “Role of oxida-tive stress in cardiovascular diseases,” Journal of Hypertension,vol. 18, no. 6, pp. 655–673, 2000.
[12] M. Valko, C. J. Rhodes, J. Moncol, M. Izakovic, and M. Mazur,“Free radicals, metals and antioxidants in oxidative stress-induced cancer,” Chemico-Biological Interactions, vol. 160, no.1, pp. 1–40, 2006.
[13] T. Finkel and N. J. Holbrook, “Oxidants, oxidative stress andthe biology of ageing,” Nature, vol. 408, no. 6809, pp. 239–247,2000.
[14] S. Muhammad, A. Bierhaus, and M. Schwaninger, “Reactiveoxygen species in diabetes-induced vascular damage, stroke,and Alzheimer’s disease,” Journal of Alzheimer’s Disease, vol.16, no. 4, pp. 775–785, 2009.
[15] K. Sugamura and J. F. Keaney Jr., “Reactive oxygen species incardiovascular disease,” Free Radical Biology and Medicine, vol.51, pp. 978–992, 2011.
[16] C. L. Allen and U. Bayraktutan, “Oxidative stress and its rolein the pathogenesis of ischaemic stroke,” International Journalof Stroke, vol. 4, no. 6, pp. 461–470, 2009.
[17] Z. Y. Aliyu, A. R. Tumblin, and G. J. Kato, “Current therapyof sickle cell disease,” Haematologica, vol. 91, no. 1, pp. 7–10,2006.
[18] G. J. Kato, M. T. Gladwin, and M. H. Steinberg, “Deconstruct-ing sickle cell disease: reappraisal of the role of hemolysis in thedevelopment of clinical subphenotypes,” Blood Reviews, vol.21, no. 1, pp. 37–47, 2007.
[19] M. T. Gladwin and G. J. Kato, “Cardiopulmonary complica-tions of sickle cell disease: role of nitric oxide and hemolyticanemia,” Hematology, pp. 51–57, 2005.
[20] R. P. Hebbel, J. W. Eaton, M. Balasingam, and M. H. Steinberg,“Spontaneous oxygen radical generation by sickle erythro-cytes,” Journal of Clinical Investigation, vol. 70, no. 6, pp. 1253–1259, 1982.
[21] J. Amer, H. Ghoti, E. Rachmilewitz, A. Koren, C. Levin, andE. Fibach, “Red blood cells, platelets and polymorphonuclearneutrophils of patients with sickle cell disease exhibit oxidativestress that can be ameliorated by antioxidants,” British Journalof Haematology, vol. 132, no. 1, pp. 108–113, 2006.
[22] T. Dasgupta, R. P. Hebbel, and D. K. Kaul, “Protective effectof arginine on oxidative stress in transgenic sickle mousemodels,” Free Radical Biology and Medicine, vol. 41, no. 12, pp.1771–1780, 2006.
Anemia 9
[23] M. D. Brown, T. M. Wick, and J. R. Eckman, “Activation ofvascular endothelial cell adhesion molecule expression bysickle blood cells,” Pediatric Pathology and Molecular Medicine,vol. 20, no. 1, pp. 47–72, 2001.
[24] C. Paszty, C. M. Brion, E. Manci et al., “Transgenic knockoutmice with exclusively human sickle hemoglobin and sickle celldisease,” Science, vol. 278, no. 5339, pp. 876–878, 1997.
[25] C. T. Noguchi, M. Gladwin, B. Diwan et al., “Pathophysiologyof a sickle cell trait mouse model: human αβS transgeneswith one mouse β-globin allele,” Blood Cells, Molecules, andDiseases, vol. 27, no. 6, pp. 971–977, 2001.
[26] J. B. Whitney III, “Simplified typing of mouse hemoglobin(Hbb) phenotypes using cystamine,” Biochemical Genetics, vol.16, no. 7-8, pp. 667–672, 1978.
[27] M. J. Kiel, O. H. Yilmaz, T. Iwashita, O. H. Yilmaz, C. Terhorst,and S. J. Morrison, “SLAM family receptors distinguish hema-topoietic stem and progenitor cells and reveal endothelialniches for stem cells,” Cell, vol. 121, no. 7, pp. 1109–1121,2005.
[28] H. Croizat, L. Ponchio, F. E. Nicolini, R. L. Nagel, and C. J.Eaves, “Primitive haematopoietic progenitors in the blood ofpatients with sickle cell disease appear to be endogenouslymobilized,” British Journal of Haematology, vol. 111, no. 2, pp.491–497, 2000.
[29] J. Amer, A. Goldfarb, and E. Fibach, “Flow cytometric analysisof the oxidative status of normal and thalassemic red bloodcells,” Cytometry Part A, vol. 60, no. 1, pp. 73–80, 2004.
[30] L. S. Kean, E. A. Manci, J. Perry et al., “Chimerism and cure:hematologic and pathologic correction of murine sickle celldisease,” Blood, vol. 102, no. 13, pp. 4582–4593, 2003.
[31] R. Khoury and M. R. Abboud, “Stem-cell transplantation inchildren and adults with sickle cell disease: an update,” ExpertReview of Hematology, vol. 4, no. 3, pp. 343–351, 2011.
[32] M. C. Walters, M. Patience, W. Leisenring et al., “Bone marrowtransplantation for sickle cell disease,” New England Journal ofMedicine, vol. 335, no. 6, pp. 369–376, 1996.
[33] M. C. Walters, K. Hardy, S. Edwards et al., “Pulmonary,gonadal, and central nervous system status after bone marrowtransplantation for sickle cell disease,” Biology of Blood andMarrow Transplantation, vol. 16, no. 2, pp. 263–272, 2010.
[34] R. Iannone, J. F. Casella, E. J. Fuchs et al., “Results of minimallytoxic nonmyeloablative transplantation in patients with sicklecell anemia and β-thalassemia,” Biology of Blood and MarrowTransplantation, vol. 9, no. 8, pp. 519–528, 2003.
[35] J. T. Horan, J. L. Liesveld, P. Fenton, N. Blumberg, and M. C.Walters, “Hematopoietic stem cell transplantation for multi-ply transfused patients with sickle cell disease and thalassemiaafter low-dose total body irradiation, fludarabine, and rabbitanti-thymocyte globulin,” Bone Marrow Transplantation, vol.35, no. 2, pp. 171–177, 2005.
[36] L. Krishnamurti, S. Kharbanda, M. A. Biernacki et al., “Stablelong-term donor engraftment following reduced-intensityhematopoietic cell transplantation for sickle cell disease,” Bio-logy of Blood and Marrow Transplantation, vol. 14, no. 11, pp.1270–1278, 2008.
[37] M. M. Hsieh, E. M. Kang, C. D. Fitzhugh et al., “Allogeneichematopoietic stem-cell transplantation for sickle cell disease,”New England Journal of Medicine, vol. 361, no. 24, pp. 2309–2317, 2009.
[38] K. Ito, A. Hirao, F. Arai et al., “Reactive oxygen species actthrough p38 MAPK to limit the lifespan of hematopoietic stemcells,” Nature Medicine, vol. 12, no. 4, pp. 446–451, 2006.
[39] K. Ito, K. Takubo, F. Arai et al., “Regulation of reactive oxygenspecies by Atm is essential for proper response to DNA double-strand breaks in lymphocytes,” Journal of Immunology, vol.178, no. 1, pp. 103–110, 2007.
[40] M. R. Saadatzadeh, K. Bijangi-Vishehsaraei, P. Hong, H.Bergmann, and L. S. Haneline, “Oxidant hypersensitivity offanconi anemia type C-deficient cells is dependent on a redox-regulated apoptotic pathway,” Journal of Biological Chemistry,vol. 279, no. 16, pp. 16805–16812, 2004.
[41] Z. Tothova, R. Kollipara, B. J. Huntly et al., “FoxOs are criticalmediators of hematopoietic stem cell resistance to physiologicoxidative stress,” Cell, vol. 128, no. 2, pp. 325–339, 2007.
[42] J. Kim and P. K. Y. Wong, “Loss of ATM impairs proliferationof neural stem cells through oxidative stress-mediated p38MAPK signaling,” Stem Cells, vol. 27, no. 8, pp. 1987–1998,2009.
[43] L. S. Kean, M. M. Durham, A. B. Adams et al., “A cure formurine sickle cell disease through stable mixed chimerism andtolerance induction after nonmyeloablative conditioning andmajor histocompatibility complex-mismatched bone marrowtransplantation,” Blood, vol. 99, no. 5, pp. 1840–1849, 2002.
[44] B. S. Pace, A. Shartava, A. Pack-Mabien, M. Mulekar, A. Ardia,and S. R. Goodman, “Effects of N-acetylcysteine on dense cellformation in sickle cell disease,” American Journal of Hematol-ogy, vol. 73, no. 1, pp. 26–32, 2003.
[45] E. Nur, D. P. Brandjes, T. Teerlink et al., “N-acetylcysteinereduces oxidative stress in sickle cell patients,” Annals of Hema-tology. In press.
Hindawi Publishing CorporationAnemiaVolume 2012, Article ID 492428, 8 pagesdoi:10.1155/2012/492428
Clinical Study
Integrating Interactive Web-Based Technology toAssess Adherence and Clinical Outcomes in PediatricSickle Cell Disease
Lori E. Crosby,1, 2 Ilana Barach,3 Meghan E. McGrady,2, 3 Karen A. Kalinyak,1, 2
Adryan R. Eastin,2 and Monica J. Mitchell1, 2, 3
1 College of Medicine, University of Cincinnati, Cincinnati, OH 45221, USA2 Behavioral Medicine and Clinical Psychology, Cincinnati Children’s Hospital Medical Center, Cincinnati, OH 45229, USA3 Department of Psychology, University of Cincinnati, Cincinnati, OH 45221, USA
Correspondence should be addressed to Lori E. Crosby, [email protected]
Received 17 January 2012; Revised 21 March 2012; Accepted 12 April 2012
Academic Editor: Betty S. Pace
Copyright © 2012 Lori E. Crosby et al. This is an open access article distributed under the Creative Commons Attribution License,which permits unrestricted use, distribution, and reproduction in any medium, provided the original work is properly cited.
Research indicates that the quality of the adherence assessment is one of the best predictors for improving clinical outcomes. Newertechnologies represent an opportunity for developing high quality standardized assessments to assess clinical outcomes such aspatient experience of care but have not been tested systematically in pediatric sickle cell disease (SCD). The goal of the current studywas to pilot an interactive web-based tool, the Take-Charge Program, to assess adherence to clinic visits and hydroxyurea (HU),barriers to adherence, solutions to overcome these barriers, and clinical outcomes in 43 patients with SCD age 6–21 years. Resultsindicate that the web-based tool was successfully integrated into the clinical setting while maintaining high patient satisfaction(>90%). The tool provided data consistent with the medical record, staff report, and/or clinical lab data. Participants reportedthat forgetting and transportation were major barriers for adherence to both clinic attendance and HU. A greater number of self-reported barriers (P < .01) and older age (P < .05) were associated with poorer clinic attendance and HU adherence. In summary,the tool represents an innovative approach to integrate newer technology to assess adherence and clinical outcomes for pediatricpatients with SCD.
1. Introduction
Sickle cell disease (SCD) is a genetic red blood cell disordercharacterized by the sickling of red blood cells resultingin pain episodes, organ damage, risk for infections, anddecreased life expectancy [1]. Care guidelines for SCD rec-ommend that patients attend routine clinic appointmentsone to two times per year and more frequently if there arecomplications or if clinical monitoring is needed to assesstolerance to medications and other treatments [1, 2]. Pre-ventative care such as flu shots, immunizations, and moni-toring labs is also essential to effectively manage sickle celldisease [3]. Hydroxyurea (HU), which is used to increasefetal hemoglobin (Hb F), has been shown to decreasemorbidity and mortality in patients with SCD [4]. Studieshave indicated that daily oral HU use is associated with
reduced pain crises, hospitalizations, acute chest syndrome,and transfusions and improved growth and health-relatedquality of life [5–9]. Thus, the consequences of nonadherenceto clinic attendance and HU treatments result in increasedmorbidity [10], healthcare costs [11], and decreased qualityof life [12].
There is limited research available examining treatmentnonadherence in pediatric SCD. A meta-analytic reviewfound a nonadherence rate for clinic appointments in pediat-ric populations of approximately 40% [13]. Similarly, nonad-herence rates for clinic appointments in SCD range between36%–44% [14, 15]. On the surface, it would seem thatpatients who attend their appointments would demonstratehigher levels of adherence to their treatment regimen;however, the relationship between clinic attendance and

2 Anemia
treatment adherence appears to be complex. As an example,Finney et al. [16] found that the 48% of patients who kepttheir follow-up appointment had been nonadherent to theirprescribed regimen. Thus, it is important to assess barriersto the treatment regimen even with patients who attendappointments regularly.
Research on medication adherence in SCD suggestshigher rates for acute medications than daily medications.Dampier et al. [17] found that 85% of adolescents with SCDtook analgesic medications on days when they experiencedsickle-cell related pain. In contrast, studies found that 38%–60% of pediatric and adult patients were adherent to theirprescribed days of home chelation therapy or deferoxamineusage [18, 19] and rates ranged from 12%–67% for youngchildren with SCD taking prophylactic penicillin [20–22].Studies of HU adherence in SCD have typically utilizedsmall sample sizes or single measures of adherence (e.g., pillcounts) [23]. Overall, these studies indicate variable rates ofadherence and lower rates for long-term trials [23, 24]. Forexample, Zimmerman and colleagues discontinued HU in12% of their participants due to nonadherence [24]. Datafrom our own clinic indicate that 30% of patients whowere prescribed HU were discontinued due to nonadherence.Poor adherence with HU may have unintended consequencesas the medication can be discontinued on the assumptionthat the patient is a nonresponder, while other patients mayhave their dose increased to a level that is toxic when theyactually begin taking it. Standardized and multidimensionalapproaches to measuring adherence are needed to ensurethat patients receive optimal benefits from the medicationwhile also minimizing risks to patients.
Overall, research indicates low and variable adherencerates to different components of the SCD treatment regimen.Studies identifying barriers to adherence have indicateda clear link between adherence and poor clinical out-comes in pediatric populations [25]. In pediatric SCDsamples, studies have identified the following as key bar-riers: competing activities, health status, patient-providerrelationships, adverse clinical experiences, and forgetting[26]. Other studies have identified sociocultural barriers toadherence including developmental factors, transportation,and health literacy [27–29]. Multicomponent, behavioral,and educational interventions to promote adherence havebeen found to be well-established pediatric treatments, [30,31]; however, a recent study indicates that the quality ofthe adherence assessment is one of the best predictors forimproving clinical outcomes [25]. Newer technologies (e.g.,computer-based, text messaging) represent an opportunityfor developing high quality, standardized and cost-effectiveassessments of treatment adherence and clinical outcomessuch as patient experience of care (e.g., communication withand responsiveness of staff, quality of information received,wait time, satisfaction, etc.), disease-specific outcomes (e.g.,labs) and health-related quality of life [32]. These typesof approaches have been used effectively in chronic illnesspopulations including adults with hypertension, diabetes[33, 34], and pediatric asthma [35].
The current study represents a first step in integratinginteractive web-based technologies in SCD clinical care. The
aims of the current study were to pilot an interactive family-based web-based tool, the Take-Charge Program, to assessadherence and clinical outcomes including: (1) patient HUadherence, barriers to HU adherence, and potential solutionsto improve HU adherence; (2) patient clinic attendanceadherence, barriers to clinic attendance adherence, andpotential solutions to improve clinic attendance; and (3)clinical outcomes (patient experience of care, sickle-relatedoutcomes hemoglobin level, ANC, MCV, and percent fetalhemoglobin level for HU patients).
2. Participants and Methods
Data presented in this paper are from the baseline assessmentof a larger longitudinal study being conducted at a tertiaryurban pediatric medical center in the Midwest. Eligibleparticipants were patients of a comprehensive SCD clinic, age6 to 21 years (and their caregivers), and prescribed hydrox-yurea (HU) therapy or referred by clinic staff for attendanceproblems. Patients who had significant health complications(e.g., acute illness, recent stroke) that would interfere withthe completion of the study or significant cognitive ordevelopmental disabilities were excluded due to the demandon participants to understand questions in the assessment.Of the 182 patients in the clinic, 98 were eligible based on theabove criteria. To date, 47 patients have been enrolled in thestudy with 4 being withdrawn because they no longer metcriteria; thus, data will be presented on the 43 participants inthe sample. Potential participants were identified by the clin-ical staff and the research team confirmed eligibility criteria.All participants were approached during a scheduled clinicvisit. After obtaining consent, data collection proceeded atthat visit.
2.1. Measures. Patients and caregivers completed the follow-ing measures.
2.1.1. Background Information Form. This form summarizedpersonal/family demographic information, including par-ticipant school/vocational history, parent education, familyincome, family transitions, and life events. In addition, self-report of pain frequency and intensity, and hospital andemergency room visits over the past year was collected forcomparison with data collected from the medical recordreview.
2.1.2. Barriers to Care Questionnaire [36]. This validated andreliable 40-item questionnaire measures parents’ report ofencounters or situations that may interfere with access tocare, use of care, the patient-physician experience, or adher-ence with medical instructions. Barriers are conceptualizedas multidimensional and include pragmatics (logistics, cost),expectations about care, health knowledge and beliefs,marginalization and health care navigation skills.
2.1.3. The Take Charge Program (Web-Based Tool). A voice-automated interactive web-based assessment tool was devel-oped based on questions from the Disease Management

Anemia 3
Interview [37] and consultation from clinic staff. Caregiverand child dyads complete the tool which takes approxi-mately 15–20 minutes. The measure included questions andprompts that enabled patients and caregivers to identifybarriers to adherence to clinic attendance and HU from astandard list [26, 37] and at least one strategy for improvingadherence. The voice-automation increased the validity asliteracy was not required to complete the measure. Theinitial development of the Take-Charge Program has beendescribed elsewhere [38]. During the second phase ofdevelopment, patients and caregivers matched barriers andpotential solutions for HU. Cognitive interviewing was usedto ensure that questions were being understood as intended[36, 38]. The web-based tool assessed clinic attendance,hydroxyurea adherence, and patient experience of care. TheClinic Attendance Module assessed self-reported adherenceto clinic appointments on a 10-point Likert-type scalewith 10 representing perfect adherence. The hydroxyureamodule assessed self-reported HU adherence on a 10-pointLikert-type scale with 10 representing perfect adherence.Both modules also asked participants to select applicablebarriers and a potential solution to address these barriers.The Patient Experience of Care Module, an adapted versionof Krahn et al.’s [39] questionnaire using a 4-point Likertscale and 2 open-ended questions assessed (1) wait time inclinic, (2) understanding of treatment recommendations byhealthcare team, (3) time spent with healthcare team, and (4)helpfulness of web-based tool. Once participants identifieda potential solution to try, clinic staff or a member of theresearch team utilized a standardized problem-solving inter-vention adapted from Behavioral Family Systems Therapy[40] to help participants develop a specific plan to implementthe solution.
2.1.4. Medical Record Review. Electronic medical recordswere reviewed to confirm participant’s type of SCD andcollect the following data: hemoglobin level, ANC, MCV,percent fetal hemoglobin, clinic attendance, ER visits, andhospitalizations. Information on the participant’s prescribedtreatment plan was also collected and verified with clinicstaff.
2.2. Data Analysis. Data collected from the web-based tooland electronic medical record (EMR) were integrated intoa single database. Descriptive statistics and frequencies wereutilized to summarize demographics, health characteristics,health care utilization, self-reported adherence, barriers,potential solutions, and patient experience of care. Pearsonproduct-moment correlation coefficients were computedto conduct exploratory analyses to assess the relationshipbetween adherence to clinic visits (e.g., self-reported barrierson the Take-Charge Program, number of barriers), adher-ence to HU (e.g., self-reported barriers on the Take-ChargeProgram, number of barriers), demographics, patient expe-rience of care and sickle cell related outcomes. All analyseswere conducted in IBM SPSS Statistics 19 (SPSS: An IBMCompany).
3. Results
3.1. Participants. Study participants included 43 youth withSCD (M = 12.81+3.98 years; 39.5% Male; 79.0% HbSS; 9.3%HbSC; 4.7% Hβ+Thal; 7.0% other) and their primary care-givers (83.7% mothers; 7.0% fathers; 9.3% other). Additionaldemographic characteristics are reported in Table 1. Thissample is representative of the total SCD clinic population,with the exception of hemoglobin type (fewer participantswith HbSC) but is consistent with the fact that the majorityof participants in the study were on HU therapy. With respectto clinical characteristics, 62.2% of the sample reportedhaving six or less pain days in the past 12 months, and 61.5%reported missing 6 days of school for pain in the past 12months. Emergency room (ER) visit and hospitalization dataindicated that most participants had three or fewer ER visits(95.1%) or hospitalizations (90.5%) in the past 12 months(see Table 2).
3.2. Clinic Attendance. According to the data, approximatelyhalf of participants (47.5%) indicate that they “always come”when describing their clinic attendance over the previous12 months. This self-reported adherence was similar todata obtained from the EMR which indicated that 55%of patients never missed an appointment during this sameperiod. Although about half of patients missed at leastone appointment, a higher percent (75%) understood thattheir SCD providers recommended clinic appointments atleast twice a year, and participants attended 84.5% of allscheduled appointments. Top-rated barriers on the Barriersto Care Questionnaire (BCQ) were related to pragmatics(i.e., logistics, cost) (M = 76.1; SD = 15.7) and health-care navigation skills (M = 79.4, SD = 22.4). Whenasked specifically about barriers to clinic attendance on theTake-Charge Program, participants reported the followingbarriers: transportation difficulties (22.5%), inability to takeoff from work/school (17.5%), forgetting (10%), waitingtoo long (7.5%), competing activities (e.g., sports; 5%),feeling tired (5%); dislike of treatments (2.5%), feeling itis unnecessary (2.5%), and other (10%). Other barriersincluded getting appointment dates and times confused,not having transportation vouchers/setup, and not havingappointments available at a time that works with thefamily’s schedule. For potential solutions, 47.1% chose anindividualized solution; 29.4% reported that they would tryscheduling their appointment at a better/different time; and5.9% reported that they would try setting an alarm (e.g.,phone).
Participants were asked to rate their adherence on a scaleof 0 to 10 with 10 being no problems with adherence. Themean rating for the sample was 8.9/10 (N = 40; SD : 2.1).They were also asked to rate how many visits they missper year on average. The mean for missed visits was 1.0(N = 40; SD = 1.4). Exploratory analyses showed that agreater percentage of no shows over the 12 month periodprior to study enrollment was positively related to (1) moreself-reported barriers to clinic attendance on the Take ChargeProgram r = .550, n = 40, P < .001; (2) the number of visitsrequired r = .455, n = 39, P < .01; (3) age r = .317, n = 41,
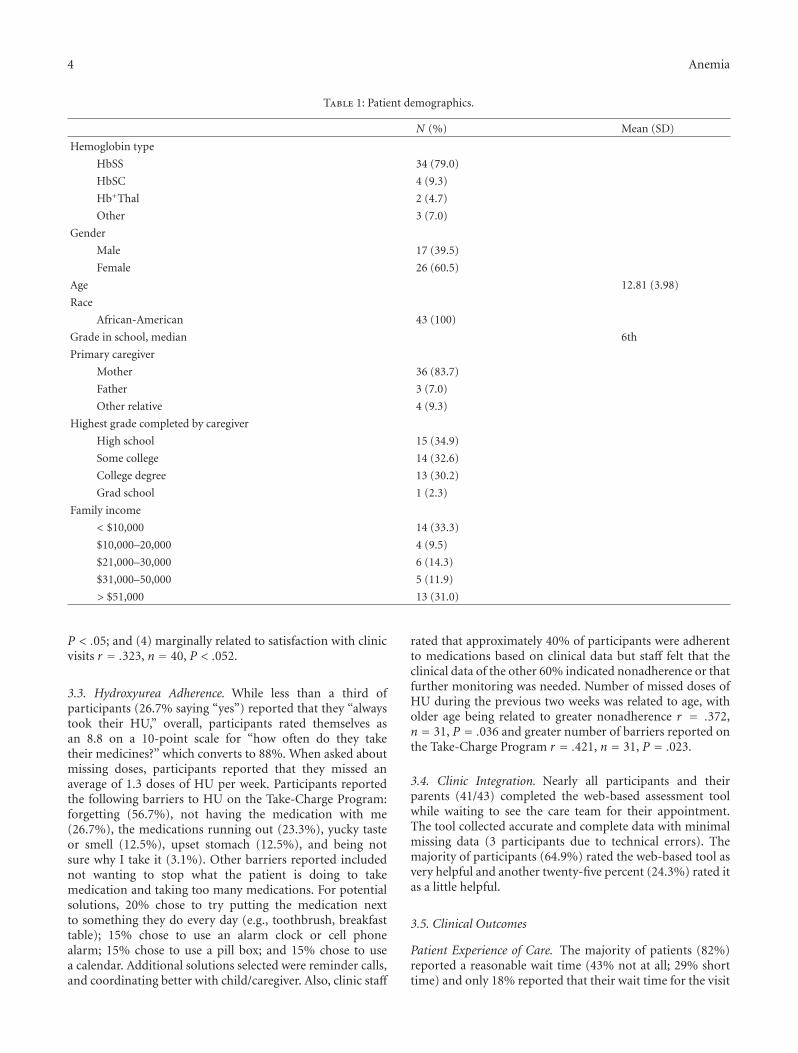
4 Anemia
Table 1: Patient demographics.
N (%) Mean (SD)
Hemoglobin type
HbSS 34 (79.0)
HbSC 4 (9.3)
Hb+Thal 2 (4.7)
Other 3 (7.0)
Gender
Male 17 (39.5)
Female 26 (60.5)
Age 12.81 (3.98)
Race
African-American 43 (100)
Grade in school, median 6th
Primary caregiver
Mother 36 (83.7)
Father 3 (7.0)
Other relative 4 (9.3)
Highest grade completed by caregiver
High school 15 (34.9)
Some college 14 (32.6)
College degree 13 (30.2)
Grad school 1 (2.3)
Family income
< $10,000 14 (33.3)
$10,000–20,000 4 (9.5)
$21,000–30,000 6 (14.3)
$31,000–50,000 5 (11.9)
> $51,000 13 (31.0)
P < .05; and (4) marginally related to satisfaction with clinicvisits r = .323, n = 40, P < .052.
3.3. Hydroxyurea Adherence. While less than a third ofparticipants (26.7% saying “yes”) reported that they “alwaystook their HU,” overall, participants rated themselves asan 8.8 on a 10-point scale for “how often do they taketheir medicines?” which converts to 88%. When asked aboutmissing doses, participants reported that they missed anaverage of 1.3 doses of HU per week. Participants reportedthe following barriers to HU on the Take-Charge Program:forgetting (56.7%), not having the medication with me(26.7%), the medications running out (23.3%), yucky tasteor smell (12.5%), upset stomach (12.5%), and being notsure why I take it (3.1%). Other barriers reported includednot wanting to stop what the patient is doing to takemedication and taking too many medications. For potentialsolutions, 20% chose to try putting the medication nextto something they do every day (e.g., toothbrush, breakfasttable); 15% chose to use an alarm clock or cell phonealarm; 15% chose to use a pill box; and 15% chose to usea calendar. Additional solutions selected were reminder calls,and coordinating better with child/caregiver. Also, clinic staff
rated that approximately 40% of participants were adherentto medications based on clinical data but staff felt that theclinical data of the other 60% indicated nonadherence or thatfurther monitoring was needed. Number of missed doses ofHU during the previous two weeks was related to age, witholder age being related to greater nonadherence r = .372,n = 31, P = .036 and greater number of barriers reported onthe Take-Charge Program r = .421, n = 31, P = .023.
3.4. Clinic Integration. Nearly all participants and theirparents (41/43) completed the web-based assessment toolwhile waiting to see the care team for their appointment.The tool collected accurate and complete data with minimalmissing data (3 participants due to technical errors). Themajority of participants (64.9%) rated the web-based tool asvery helpful and another twenty-five percent (24.3%) rated itas a little helpful.
3.5. Clinical Outcomes
Patient Experience of Care. The majority of patients (82%)reported a reasonable wait time (43% not at all; 29% shorttime) and only 18% reported that their wait time for the visit
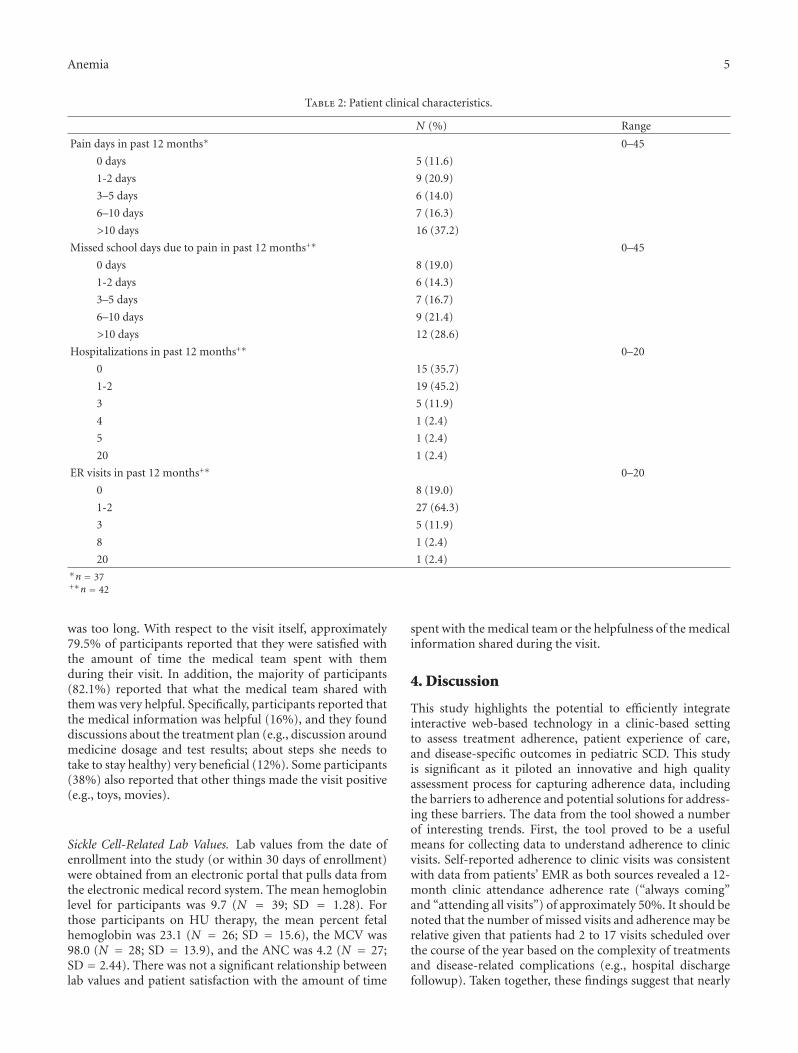
Anemia 5
Table 2: Patient clinical characteristics.
N (%) Range
Pain days in past 12 months∗ 0–45
0 days 5 (11.6)
1-2 days 9 (20.9)
3–5 days 6 (14.0)
6–10 days 7 (16.3)
>10 days 16 (37.2)
Missed school days due to pain in past 12 months+∗ 0–45
0 days 8 (19.0)
1-2 days 6 (14.3)
3–5 days 7 (16.7)
6–10 days 9 (21.4)
>10 days 12 (28.6)
Hospitalizations in past 12 months+∗ 0–20
0 15 (35.7)
1-2 19 (45.2)
3 5 (11.9)
4 1 (2.4)
5 1 (2.4)
20 1 (2.4)
ER visits in past 12 months+∗ 0–20
0 8 (19.0)
1-2 27 (64.3)
3 5 (11.9)
8 1 (2.4)
20 1 (2.4)∗n = 37+∗n = 42
was too long. With respect to the visit itself, approximately79.5% of participants reported that they were satisfied withthe amount of time the medical team spent with themduring their visit. In addition, the majority of participants(82.1%) reported that what the medical team shared withthem was very helpful. Specifically, participants reported thatthe medical information was helpful (16%), and they founddiscussions about the treatment plan (e.g., discussion aroundmedicine dosage and test results; about steps she needs totake to stay healthy) very beneficial (12%). Some participants(38%) also reported that other things made the visit positive(e.g., toys, movies).
Sickle Cell-Related Lab Values. Lab values from the date ofenrollment into the study (or within 30 days of enrollment)were obtained from an electronic portal that pulls data fromthe electronic medical record system. The mean hemoglobinlevel for participants was 9.7 (N = 39; SD = 1.28). Forthose participants on HU therapy, the mean percent fetalhemoglobin was 23.1 (N = 26; SD = 15.6), the MCV was98.0 (N = 28; SD = 13.9), and the ANC was 4.2 (N = 27;SD = 2.44). There was not a significant relationship betweenlab values and patient satisfaction with the amount of time
spent with the medical team or the helpfulness of the medicalinformation shared during the visit.
4. Discussion
This study highlights the potential to efficiently integrateinteractive web-based technology in a clinic-based settingto assess treatment adherence, patient experience of care,and disease-specific outcomes in pediatric SCD. This studyis significant as it piloted an innovative and high qualityassessment process for capturing adherence data, includingthe barriers to adherence and potential solutions for address-ing these barriers. The data from the tool showed a numberof interesting trends. First, the tool proved to be a usefulmeans for collecting data to understand adherence to clinicvisits. Self-reported adherence to clinic visits was consistentwith data from patients’ EMR as both sources revealed a 12-month clinic attendance adherence rate (“always coming”and “attending all visits”) of approximately 50%. It should benoted that the number of missed visits and adherence may berelative given that patients had 2 to 17 visits scheduled overthe course of the year based on the complexity of treatmentsand disease-related complications (e.g., hospital dischargefollowup). Taken together, these findings suggest that nearly
6 Anemia
85% of all scheduled clinic visits were attended by partici-pants in this study. Understanding barriers to nonadherencewas also important, especially given that adherence to clinicvisits does not take into account cancellations, same daycancellations or rescheduled visits as a nonattended visit.Finally, data from the Take-Charge Program was integratedwith patients’ EMR data providing a wealth of data to informclinical practice in “real time.”
The barriers to clinic attendance endorsed by partic-ipants were multifaceted and included logistical (trans-portation, getting off work), health care navigation skills(using calendars to manage multiple appointments and med-ications), socioeconomic (lack of insurance), and disease-related barriers (did not feel well). BCQ mean scores forthis sample were consistent with mean scores for otherpediatric populations with similar challenges (e.g., asthma,children with special health care needs) [36, 41]. Participantsalso identified potential solutions for improving adherenceand attendance (which is the basis for a larger longitudinalintervention study). Additional potential risk factors forno-shows emerged from exploratory analysis of the datawhich found that nonadherence to clinic visits increasedwith age, more required visits, and self-reported barriersto attendance. These findings, though preliminary, furtherhighlight the richness of the data and provide meaningfultrends and a basis for prioritizing patients who may bein need of additional clinical supports to ensure patientengagement and attendance.
The Take-Charge tool was also piloted to better under-stand the subset of patients on HU (74% of the sample).Anecdotally, nonadherence to HU is cited as a problemfor many children and adolescents with SCD althoughdevelopmentally-appropriate approaches for children andadolescents are very limited. The findings support that theTake-Charge tool was useful for assessing relevant informa-tion from participants on HU related to their perceptionsof how they are to be taking their medications, concernsabout side-effects and other barriers. Data from the toolhighlighted that approaches to working with patients aroundmedication management will need to address organizationalissues [18, 19] such as helping patients and parents use cal-endars, phone alarms, and emerging innovative technologies(e.g., pill cases that glow in the dark and beep) to reduce thepotential for “forgetting” to take medications, getting themrefilled, and packing them when away from home.
Qualitative data from participants further highlight theimportance of implementing family-based strategies andthe need to tailor them appropriately to individual needs.Medication side-effects (e.g., taste, smell, upset stomach)and lack of awareness (i.e., to address patients who are notsure why they are taking medication) are other importantbarriers to address. Interestingly, some of the reasonsthat are commonly considered for nonadherence (e.g., theprobability for loss of hair, stigma, fear of blood draws, andthat the medicine would not make a difference) were notendorsed by these participants but still may be important forpatients who do not agree to try the medication or who showearly signs of nonadherence. Several participants noted thattransportation and lack of insurance were barriers not only
to clinic attendance, but also to HU adherence, highlightingthe pervasiveness of income and access to health care onadherence. The barriers that are assessed in the tool appearto have some clinical utility as more barriers were relatedto a higher number of missed doses of medicine duringthe previous two weeks prior to the study. This study alsosupports previous research which suggests that age shouldalso be considered as a target in the clinical evaluation, giventhe potential for nonadherence to medication increasedwith age [10, 34]. Data support the potential for the toolto reliably assess adherence and other health utilizationoutcomes while fostering individualized and family-basedsolutions for addressing barriers to adherence to clinic visitsand medication. Patient experience of care data on theclinical integration of the tool showed positive trends with atleast 90% of participants endorsing satisfaction/helpfulnessof the tool. It was positive that satisfaction with the clinicvisit was also not compromised with >90% also endorsingsatisfaction with the clinic visit.
The limitations of the study should be noted. First, giventhe pilot/feasibility nature of the study, only patients whowere engaged in our clinic were included in the study. Itwill be important in future clinical research to understandand address the barriers of patients (perhaps via the webor other engaging methods) who have lost contact or whoare unable to attend clinic because of barriers and risks todetermine if more significant intervention is needed. Second,the study included a range of participants across a broaddevelopmental level. In addition, since this was a family-based assessment and intervention study, individual reportsof barriers for patients and caregivers were not collected. Thislimitation should be overcome in future studies by insuringthat older patients identify individual barriers to treatmentadherence. Third, patients were diverse in income, diseaseseverity, and other factors. Replicating this study with alarger sample to better understand adherence within devel-opmental and disease-related subgroups will be important.Fourth, data collection from the EMR was a challenge inthis study as corresponding lab values were not availablefor all study visits. It will be essential to better coordinatelab draws and study visits and to ensure study funds topay for corresponding labs so that data can be tracked overtime. Finally, the data reported here are cross-sectional andsome are self-reported in nature. Future research is neededto monitor clinical outcome data longitudinally and to assessthe relationship between adherence and clinical outcomesover time.
A next step in advancing our research is to refinethe tool. There were a number of “other” responses thatreceived a high endorsement which justify some additionalrevision of existing screens to include additional responseoptions. While this program has the potential to be usedas a tool to help improve adherence and clinical outcomesduring follow-up visits, a goal and a challenge will be tomaintain high patient satisfaction with the program. As theprogram becomes further standardized, another goal will beto streamline the clinic integration process and to pilot itin other SCD clinic settings. In spite of these limitationsthe study’s overall goal was met which was to integrate the

Anemia 7
web-based tool within a clinic-based setting (rather than ina nonclinical research setting) and to assess adherence andclinical outcomes for pediatric patients with SCD.
Conflict of Interests
All the authors declare that they have no conflicts of interests.
Acknowledgments
The authors would like to acknowledge Heather Strong,Steven Lenzly, II, Annie Garner, and Keri Shiels for theirassistance with data collection and data entry. The presentstudy was funded by Grant #no.# U54HL070871, Compre-hensive Sickle Cell Center, funded by the National Institutesof Health (NIH), National Heart, Lung, and Blood Institute(NHLBI).
References
[1] National Institutes of Health: National Heart, and Blood Insti-tute, “The management of sickle cell disease,” NIH PublicationNo. 02-2117, 2002.
[2] S. Claster and E. P. Vichinsky, “Managing sickle cell disease,”British Medical Journal, vol. 327, no. 7424, pp. 1151–1155,2003.
[3] W. Y. Wong, “Prevention and management of infection in chil-dren with sickle cell anaemia,” Paediatric Drugs, vol. 3, no. 11,pp. 793–801, 2001.
[4] O. S. Platt, D. J. Brambilla, W. F. Rosse et al., “Mortality insickle cell disease. Life expectancy and risk factors for earlydeath,” The New England Journal of Medicine, vol. 330, no. 23,pp. 1639–1644, 1994.
[5] C. L. Edwards, M. T. Scales, C. Loughlin et al., “A brief reviewof the pathophysiology, associated pain, and psychosocialissues in sickle cell disease,” International Journal of BehavioralMedicine, vol. 12, no. 3, pp. 171–179, 2005.
[6] S. Charache, F. B. Barton, R. D. Moore et al., “Hydroxyureaand sickle cell anemia: clinical utility of a myelosuppressive“switching” agent,” Medicine, vol. 75, no. 6, pp. 300–326, 1996.
[7] S. Charache, M. L. Terrin, R. D. Moore et al., “Effect ofhydroxyurea on the frequency of painful crises in sickle cellanemia,” The New England Journal of Medicine, vol. 332, no.20, pp. 1317–1322, 1995.
[8] W. C. Wang, K. H. Morales, C. D. Scher et al., “Effect of long-term transfusion on growth in children with sickle cell anemia:results of the stop trial,” Journal of Pediatrics, vol. 147, no. 2,pp. 244–247, 2005.
[9] S. K. Ballas, F. B. Barton, M. A. Waclawiw et al., “Hydroxyureaand sickle cell anemia: effect on quality of life,” Health andQuality of Life Outcomes, vol. 4, article 59, 2006.
[10] J. Dunbar-Jacob, J. A. Erlen, E. A. Schlenk, C. M. Ryan, S. M.Sereika, and W. M. Doswell, “Adherence in chronic disease,”Annual Review of Nursing Research, vol. 18, pp. 48–90, 2000.
[11] S. D. Candrilli, S. H. O’Brien, R. E. Ware, M. C. Nahata, E.E. Seiber, and R. Balkrishnan, “Hydroxyurea adherence andassociated outcomes among medicaid enrollees with sickle celldisease,” American Journal of Hematology, vol. 86, no. 3, pp.273–277, 2011.
[12] L. P. Barakat, M. Lutz, K. Smith-Whitley, and K. Ohene-Frempong, “Is treatment adherence associated with better
quality of life in children with sickle cell disease?” Quality ofLife Research, vol. 14, no. 2, pp. 407–414, 2005.
[13] W. M. Macharia, G. Leon, B. H. Rowe, B. J. Stephenson, and R.B. Haynes, “An overview of interventions to improve compli-ance with appointment keeping for medical services,” Journalof the American Medical Association, vol. 267, no. 13, pp. 1813–1817, 1992.
[14] N. Robinson, H. Huber, P. Jenkins et al., “Improving access tomedical care for children with sickle cell disease,” in Proceed-ings of the 29th Annual Meeting of the National Sickle CellDisease, Memphis, Tenn, USA, 2006.
[15] C. D. Thornburg, A. Calatroni, M. Telen, and A. R. Kemper,“Adherence to hydroxyurea therapy in children with sickle cellanemia,” Journal of Pediatrics, vol. 156, no. 3, pp. 415–419,2010.
[16] J. W. Finney, R. J. Hook, P. C. Friman, M. A. Rapoff, and E.R. Christophersen, “The overestimation of adherence to pedi-atric medical regimens,” Children’s Health Care, vol. 22, no. 4,pp. 297–304, 1993.
[17] C. Dampier, B. Ely, D. Brodecki, and P. O’Neal, “Characteris-tics of pain managed at home in children and adolescents withsickle cell disease by using diary self-reports,” Journal of Pain,vol. 3, no. 6, pp. 461–470, 2002.
[18] M. J. Treadwell, A. W. Law, J. Sung et al., “Barriers to adherenceof deferoxamine usage in sickle cell disease,” Pediatric Bloodand Cancer, vol. 44, no. 5, pp. 500–507, 2005.
[19] L. Weissman, M. Treadwell, and E. Vichinsky, “Evaluation ofhome desferal care in transfusion-dependent children withthalassemia and sickle cell disease,” International Journal ofPediatric Hematology/Oncology, vol. 4, no. 1, pp. 61–68, 1997.
[20] M. Berkovitch, D. Papadouris, D. Shaw, N. Onuaha, C. Dias,and N. F. Olivieri, “Trying to improve compliance with pro-phylactic penicillin therapy in children with sickle cell disease,”British Journal of Clinical Pharmacology, vol. 45, no. 6, pp. 605–607, 1998.
[21] V. Elliott, S. Morgan, S. Day, L. S. Mollerup, and W. Wang,“Parental health beliefs and compliance with prophylacticpenicillin administration in children with sickle cell disease,”Journal of Pediatric Hematology/Oncology, vol. 23, no. 2, pp.112–116, 2001.
[22] S. J. Teach, K. A. Lillis, and M. Grossi, “Compliance with pen-icillin prophylaxis in patients with sickle cell disease,” Archivesof Pediatrics and Adolescent Medicine, vol. 152, no. 3, pp. 274–278, 1998.
[23] S. A. Zimmerman, W. H. Schultz, J. S. Davis et al., “Sustainedlong-term hematologic efficacy of hydroxyurea at maximumtolerated dose in children with sickle cell disease,” Blood, vol.103, no. 6, pp. 2039–2045, 2004.
[24] N. F. Olivieri and E. P. Vichinsky, “Hydroxyurea in childrenwith sickle cell disease: impact on splenic function andcompliance with therapy,” Journal of Pediatric Hematol-ogy/Oncology, vol. 20, no. 1, pp. 26–31, 1998.
[25] M. R. DiMatteo, P. J. Giordani, H. S. Lepper, and T. W.Croghan, “Patient adherence and medical treatment out-comes: a meta-analysis,” Medical Care, vol. 40, no. 9, pp. 794–811, 2002.
[26] L. E. Crosby, A. C. Modi, K. L. Lemanek, S. M. Guilfoyle, K.A. Kalinyak, and M. J. Mitchell, “Perceived barriers to clinicappointments for adolescents with sickle cell disease,” Journalof Pediatric Hematology/Oncology, vol. 31, no. 8, pp. 571–576,2009.
[27] A. Garcia-Gonzalez, M. Richardson, M. Garcia Popa-Lisseanuet al., “Treatment adherence in patients with rheumatoid

8 Anemia
arthritis and systemic lupus erythematosus,” Clinical Rheuma-tology, vol. 27, no. 7, pp. 883–889, 2008.
[28] D. Logan, N. Zelikovsky, L. Labay, and J. Spergel, “The IllnessManagement Survey: identifying adolescents’ perceptions ofbarriers to adherence,” Journal of Pediatric Psychology, vol. 28,no. 6, pp. 383–392, 2003.
[29] D. Schillinger, K. Grumbach, J. Piette et al., “Association ofhealth literacy with diabetes outcomes,” Journal of the Amer-ican Medical Association, vol. 288, no. 4, pp. 475–482, 2002.
[30] M. M. Graves, M. C. Roberts, M. Rapoff, and A. Boyer, “Theefficacy of adherence interventions for chronically ill children:a meta-analytic review,” Journal of Pediatric Psychology, vol. 35,no. 4, pp. 368–382, 2010.
[31] S. Kahana, D. Drotar, and T. Frazier, “Meta-analysis of psy-chological interventions to promote adherence to treatmentin pediatric chronic health conditions,” Journal of PediatricPsychology, vol. 33, no. 6, pp. 590–611, 2008.
[32] J. Stinson, R. Wilson, N. Gill, J. Yamada, and J. Holt, “Asystematic review of internet-based self-management inter-ventions for youth with health conditions,” Journal of pediatricpsychology, vol. 34, no. 5, pp. 495–510, 2009.
[33] D. L. Hunt, R. B. Haynes, R. S. A. Hayward, M. A. Pim, andJ. Horsman, “Patient-specific evidence-based care recommen-dations for diabetes mellitus: development and initial clinicexperience with a computerized decision support system,”International Journal of Medical Informatics, vol. 51, no. 2-3,pp. 127–135, 1998.
[34] E. A. Walker, M. Molitch, M. K. Kramer et al., “Adherence topreventive medications: predictors and outcomes in the dia-betes prevention program,” Diabetes Care, vol. 29, no. 9, pp.1997–2002, 2006.
[35] R. Shegog, L. K. Bartholomew, M. M. Sockrider et al., “Com-puter-based decision support for pediatric asthma manage-ment: description and feasibility of the stop asthma clinicalsystem,” Health Informatics Journal, vol. 12, no. 4, pp. 259–273,2006.
[36] M. Seid, L. Opipari-Arrigan, L. R. Gelhard, J. W. Varni, andK. Driscoll, “Barriers to care questionnaire: reliability, validity,and responsiveness to change among parents of children withasthma,” Academic Pediatrics, vol. 9, no. 2, pp. 106–113, 2009.
[37] A. C. Modi, L. E. Crosby, S. M. Guilfoyle, K. L. Lemanek,D. Witherspoon, and M. J. Mitchell, “Barriers to treatmentadherence for pediatric patients with sickle cell disease andtheir families,” Children’s Health Care, vol. 38, no. 2, pp. 107–122, 2009.
[38] A. C. Modi, L. E. Crosby, J. Hines, D. Drotar, and M. J.Mitchell, “Feasibility of web-based technology to assess adher-ence to clinic appointments in youth with sickle cell disease,”Journal of Pediatric Hematology/Oncology, vol. 34, no. 3, pp.e93–e96, 2012.
[39] G. L. Krahn, D. Eisert, and B. Fifield, “Obtaining parentalperceptions of the quality of services for children with specialhealth needs,” Journal of Pediatric Psychology, vol. 15, no. 6, pp.761–774, 1990.
[40] T. Wysocki, M. A. Harris, L. M. Buckloh et al., “Effects of be-havioral family systems therapy for diabetes on adolescents’family relationships, treatment adherence, and metabolic con-trol,” Journal of Pediatric Psychology, vol. 31, no. 9, pp. 928–938, 2006.
[41] M. Seid, E. J. Sobo, L. R. Gelhard, and J. W. Varni, “Parents’reports of barriers to care for children with special healthcare needs: development and validation of the barriers to carequestionnaire,” Ambulatory Pediatrics, vol. 4, no. 4, pp. 323–331, 2004.
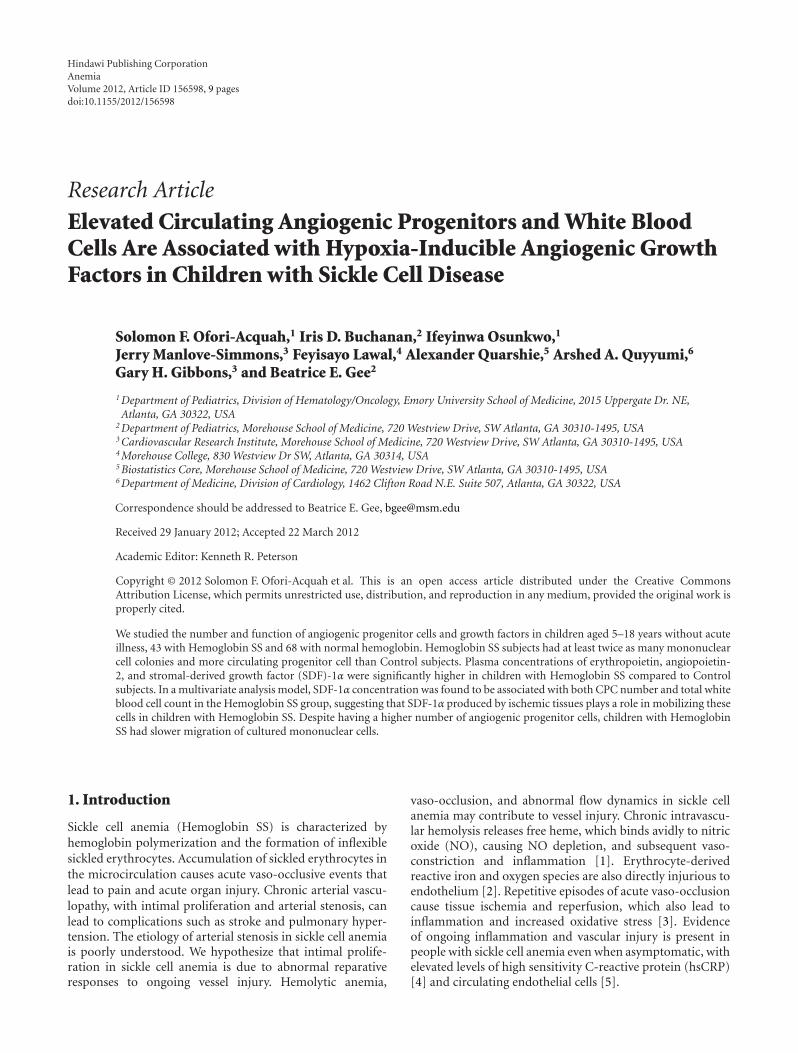
Hindawi Publishing CorporationAnemiaVolume 2012, Article ID 156598, 9 pagesdoi:10.1155/2012/156598
Research Article
Elevated Circulating Angiogenic Progenitors and White BloodCells Are Associated with Hypoxia-Inducible Angiogenic GrowthFactors in Children with Sickle Cell Disease
Solomon F. Ofori-Acquah,1 Iris D. Buchanan,2 Ifeyinwa Osunkwo,1
Jerry Manlove-Simmons,3 Feyisayo Lawal,4 Alexander Quarshie,5 Arshed A. Quyyumi,6
Gary H. Gibbons,3 and Beatrice E. Gee2
1 Department of Pediatrics, Division of Hematology/Oncology, Emory University School of Medicine, 2015 Uppergate Dr. NE,Atlanta, GA 30322, USA
2 Department of Pediatrics, Morehouse School of Medicine, 720 Westview Drive, SW Atlanta, GA 30310-1495, USA3 Cardiovascular Research Institute, Morehouse School of Medicine, 720 Westview Drive, SW Atlanta, GA 30310-1495, USA4 Morehouse College, 830 Westview Dr SW, Atlanta, GA 30314, USA5 Biostatistics Core, Morehouse School of Medicine, 720 Westview Drive, SW Atlanta, GA 30310-1495, USA6 Department of Medicine, Division of Cardiology, 1462 Clifton Road N.E. Suite 507, Atlanta, GA 30322, USA
Correspondence should be addressed to Beatrice E. Gee, [email protected]
Received 29 January 2012; Accepted 22 March 2012
Academic Editor: Kenneth R. Peterson
Copyright © 2012 Solomon F. Ofori-Acquah et al. This is an open access article distributed under the Creative CommonsAttribution License, which permits unrestricted use, distribution, and reproduction in any medium, provided the original work isproperly cited.
We studied the number and function of angiogenic progenitor cells and growth factors in children aged 5–18 years without acuteillness, 43 with Hemoglobin SS and 68 with normal hemoglobin. Hemoglobin SS subjects had at least twice as many mononuclearcell colonies and more circulating progenitor cell than Control subjects. Plasma concentrations of erythropoietin, angiopoietin-2, and stromal-derived growth factor (SDF)-1α were significantly higher in children with Hemoglobin SS compared to Controlsubjects. In a multivariate analysis model, SDF-1α concentration was found to be associated with both CPC number and total whiteblood cell count in the Hemoglobin SS group, suggesting that SDF-1α produced by ischemic tissues plays a role in mobilizing thesecells in children with Hemoglobin SS. Despite having a higher number of angiogenic progenitor cells, children with HemoglobinSS had slower migration of cultured mononuclear cells.
1. Introduction
Sickle cell anemia (Hemoglobin SS) is characterized byhemoglobin polymerization and the formation of inflexiblesickled erythrocytes. Accumulation of sickled erythrocytes inthe microcirculation causes acute vaso-occlusive events thatlead to pain and acute organ injury. Chronic arterial vascu-lopathy, with intimal proliferation and arterial stenosis, canlead to complications such as stroke and pulmonary hyper-tension. The etiology of arterial stenosis in sickle cell anemiais poorly understood. We hypothesize that intimal prolife-ration in sickle cell anemia is due to abnormal reparativeresponses to ongoing vessel injury. Hemolytic anemia,
vaso-occlusion, and abnormal flow dynamics in sickle cellanemia may contribute to vessel injury. Chronic intravascu-lar hemolysis releases free heme, which binds avidly to nitricoxide (NO), causing NO depletion, and subsequent vaso-constriction and inflammation [1]. Erythrocyte-derivedreactive iron and oxygen species are also directly injurious toendothelium [2]. Repetitive episodes of acute vaso-occlusioncause tissue ischemia and reperfusion, which also lead toinflammation and increased oxidative stress [3]. Evidenceof ongoing inflammation and vascular injury is present inpeople with sickle cell anemia even when asymptomatic, withelevated levels of high sensitivity C-reactive protein (hsCRP)[4] and circulating endothelial cells [5].
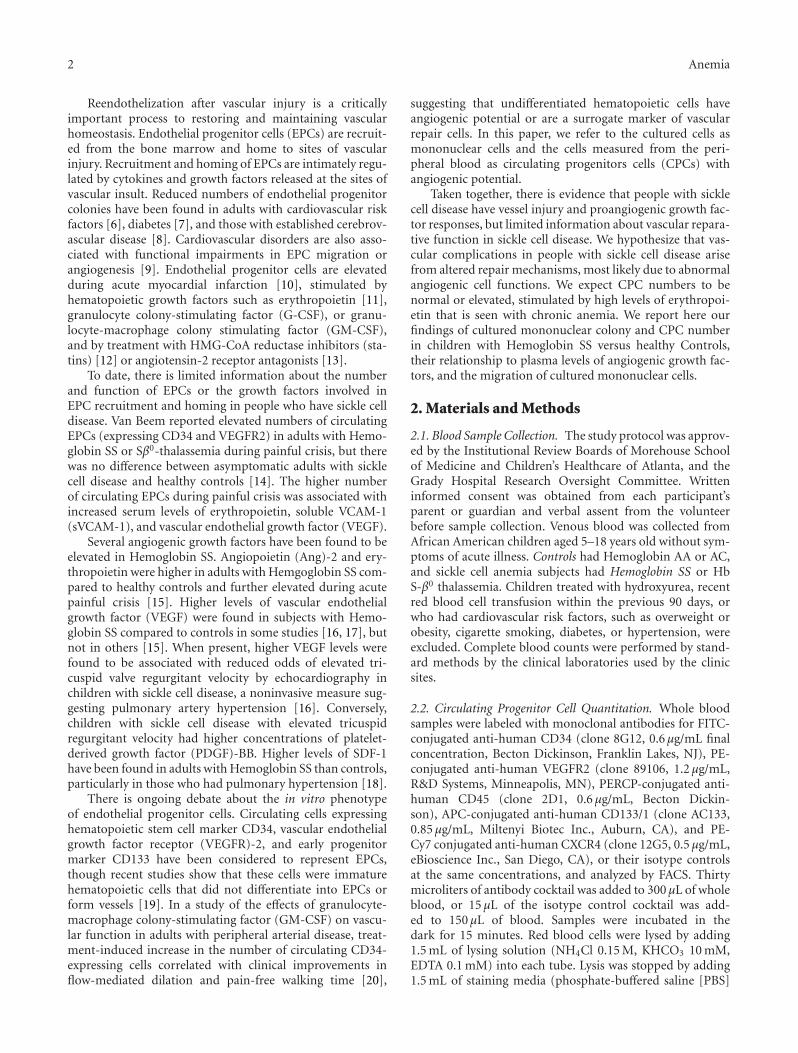
2 Anemia
Reendothelization after vascular injury is a criticallyimportant process to restoring and maintaining vascularhomeostasis. Endothelial progenitor cells (EPCs) are recruit-ed from the bone marrow and home to sites of vascularinjury. Recruitment and homing of EPCs are intimately regu-lated by cytokines and growth factors released at the sites ofvascular insult. Reduced numbers of endothelial progenitorcolonies have been found in adults with cardiovascular riskfactors [6], diabetes [7], and those with established cerebrov-ascular disease [8]. Cardiovascular disorders are also asso-ciated with functional impairments in EPC migration orangiogenesis [9]. Endothelial progenitor cells are elevatedduring acute myocardial infarction [10], stimulated byhematopoietic growth factors such as erythropoietin [11],granulocyte colony-stimulating factor (G-CSF), or granu-locyte-macrophage colony stimulating factor (GM-CSF),and by treatment with HMG-CoA reductase inhibitors (sta-tins) [12] or angiotensin-2 receptor antagonists [13].
To date, there is limited information about the numberand function of EPCs or the growth factors involved inEPC recruitment and homing in people who have sickle celldisease. Van Beem reported elevated numbers of circulatingEPCs (expressing CD34 and VEGFR2) in adults with Hemo-globin SS or Sβ0-thalassemia during painful crisis, but therewas no difference between asymptomatic adults with sicklecell disease and healthy controls [14]. The higher numberof circulating EPCs during painful crisis was associated withincreased serum levels of erythropoietin, soluble VCAM-1(sVCAM-1), and vascular endothelial growth factor (VEGF).
Several angiogenic growth factors have been found to beelevated in Hemoglobin SS. Angiopoietin (Ang)-2 and ery-thropoietin were higher in adults with Hemgoglobin SS com-pared to healthy controls and further elevated during acutepainful crisis [15]. Higher levels of vascular endothelialgrowth factor (VEGF) were found in subjects with Hemo-globin SS compared to controls in some studies [16, 17], butnot in others [15]. When present, higher VEGF levels werefound to be associated with reduced odds of elevated tri-cuspid valve regurgitant velocity by echocardiography inchildren with sickle cell disease, a noninvasive measure sug-gesting pulmonary artery hypertension [16]. Conversely,children with sickle cell disease with elevated tricuspidregurgitant velocity had higher concentrations of platelet-derived growth factor (PDGF)-BB. Higher levels of SDF-1have been found in adults with Hemoglobin SS than controls,particularly in those who had pulmonary hypertension [18].
There is ongoing debate about the in vitro phenotypeof endothelial progenitor cells. Circulating cells expressinghematopoietic stem cell marker CD34, vascular endothelialgrowth factor receptor (VEGFR)-2, and early progenitormarker CD133 have been considered to represent EPCs,though recent studies show that these cells were immaturehematopoietic cells that did not differentiate into EPCs orform vessels [19]. In a study of the effects of granulocyte-macrophage colony-stimulating factor (GM-CSF) on vascu-lar function in adults with peripheral arterial disease, treat-ment-induced increase in the number of circulating CD34-expressing cells correlated with clinical improvements inflow-mediated dilation and pain-free walking time [20],
suggesting that undifferentiated hematopoietic cells haveangiogenic potential or are a surrogate marker of vascularrepair cells. In this paper, we refer to the cultured cells asmononuclear cells and the cells measured from the peri-pheral blood as circulating progenitors cells (CPCs) withangiogenic potential.
Taken together, there is evidence that people with sicklecell disease have vessel injury and proangiogenic growth fac-tor responses, but limited information about vascular repara-tive function in sickle cell disease. We hypothesize that vas-cular complications in people with sickle cell disease arisefrom altered repair mechanisms, most likely due to abnormalangiogenic cell functions. We expect CPC numbers to benormal or elevated, stimulated by high levels of erythropoi-etin that is seen with chronic anemia. We report here ourfindings of cultured mononuclear colony and CPC numberin children with Hemoglobin SS versus healthy Controls,their relationship to plasma levels of angiogenic growth fac-tors, and the migration of cultured mononuclear cells.
2. Materials and Methods
2.1. Blood Sample Collection. The study protocol was approv-ed by the Institutional Review Boards of Morehouse Schoolof Medicine and Children’s Healthcare of Atlanta, and theGrady Hospital Research Oversight Committee. Writteninformed consent was obtained from each participant’sparent or guardian and verbal assent from the volunteerbefore sample collection. Venous blood was collected fromAfrican American children aged 5–18 years old without sym-ptoms of acute illness. Controls had Hemoglobin AA or AC,and sickle cell anemia subjects had Hemoglobin SS or HbS-β0 thalassemia. Children treated with hydroxyurea, recentred blood cell transfusion within the previous 90 days, orwho had cardiovascular risk factors, such as overweight orobesity, cigarette smoking, diabetes, or hypertension, wereexcluded. Complete blood counts were performed by stand-ard methods by the clinical laboratories used by the clinicsites.
2.2. Circulating Progenitor Cell Quantitation. Whole bloodsamples were labeled with monoclonal antibodies for FITC-conjugated anti-human CD34 (clone 8G12, 0.6 μg/mL finalconcentration, Becton Dickinson, Franklin Lakes, NJ), PE-conjugated anti-human VEGFR2 (clone 89106, 1.2 μg/mL,R&D Systems, Minneapolis, MN), PERCP-conjugated anti-human CD45 (clone 2D1, 0.6 μg/mL, Becton Dickin-son), APC-conjugated anti-human CD133/1 (clone AC133,0.85 μg/mL, Miltenyi Biotec Inc., Auburn, CA), and PE-Cy7 conjugated anti-human CXCR4 (clone 12G5, 0.5 μg/mL,eBioscience Inc., San Diego, CA), or their isotype controlsat the same concentrations, and analyzed by FACS. Thirtymicroliters of antibody cocktail was added to 300 μL of wholeblood, or 15 μL of the isotype control cocktail was add-ed to 150 μL of blood. Samples were incubated in thedark for 15 minutes. Red blood cells were lysed by adding1.5 mL of lysing solution (NH4Cl 0.15 M, KHCO3 10 mM,EDTA 0.1 mM) into each tube. Lysis was stopped by adding1.5 mL of staining media (phosphate-buffered saline [PBS]
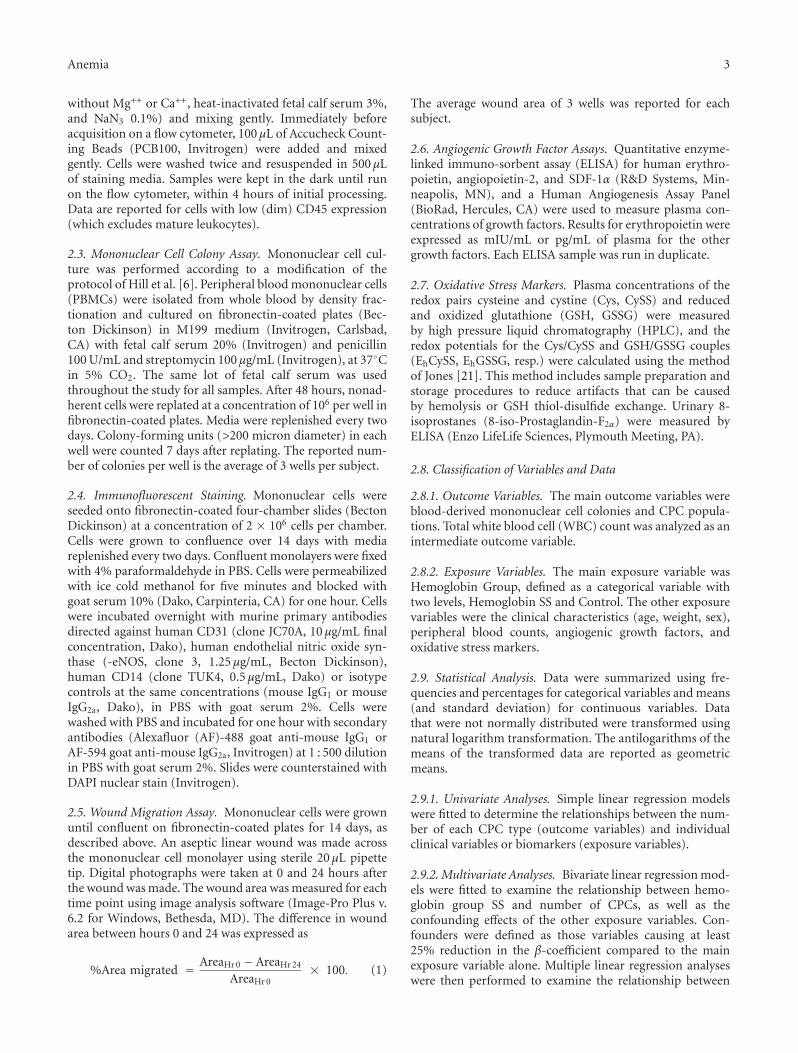
Anemia 3
without Mg++ or Ca++, heat-inactivated fetal calf serum 3%,and NaN3 0.1%) and mixing gently. Immediately beforeacquisition on a flow cytometer, 100 μL of Accucheck Count-ing Beads (PCB100, Invitrogen) were added and mixedgently. Cells were washed twice and resuspended in 500 μLof staining media. Samples were kept in the dark until runon the flow cytometer, within 4 hours of initial processing.Data are reported for cells with low (dim) CD45 expression(which excludes mature leukocytes).
2.3. Mononuclear Cell Colony Assay. Mononuclear cell cul-ture was performed according to a modification of theprotocol of Hill et al. [6]. Peripheral blood mononuclear cells(PBMCs) were isolated from whole blood by density frac-tionation and cultured on fibronectin-coated plates (Bec-ton Dickinson) in M199 medium (Invitrogen, Carlsbad,CA) with fetal calf serum 20% (Invitrogen) and penicillin100 U/mL and streptomycin 100 μg/mL (Invitrogen), at 37◦Cin 5% CO2. The same lot of fetal calf serum was usedthroughout the study for all samples. After 48 hours, nonad-herent cells were replated at a concentration of 106 per well infibronectin-coated plates. Media were replenished every twodays. Colony-forming units (>200 micron diameter) in eachwell were counted 7 days after replating. The reported num-ber of colonies per well is the average of 3 wells per subject.
2.4. Immunofluorescent Staining. Mononuclear cells wereseeded onto fibronectin-coated four-chamber slides (BectonDickinson) at a concentration of 2 × 10⁶ cells per chamber.Cells were grown to confluence over 14 days with mediareplenished every two days. Confluent monolayers were fixedwith 4% paraformaldehyde in PBS. Cells were permeabilizedwith ice cold methanol for five minutes and blocked withgoat serum 10% (Dako, Carpinteria, CA) for one hour. Cellswere incubated overnight with murine primary antibodiesdirected against human CD31 (clone JC70A, 10 μg/mL finalconcentration, Dako), human endothelial nitric oxide syn-thase (-eNOS, clone 3, 1.25 μg/mL, Becton Dickinson),human CD14 (clone TUK4, 0.5 μg/mL, Dako) or isotypecontrols at the same concentrations (mouse IgG1 or mouseIgG2a, Dako), in PBS with goat serum 2%. Cells werewashed with PBS and incubated for one hour with secondaryantibodies (Alexafluor (AF)-488 goat anti-mouse IgG1 orAF-594 goat anti-mouse IgG2a, Invitrogen) at 1 : 500 dilutionin PBS with goat serum 2%. Slides were counterstained withDAPI nuclear stain (Invitrogen).
2.5. Wound Migration Assay. Mononuclear cells were grownuntil confluent on fibronectin-coated plates for 14 days, asdescribed above. An aseptic linear wound was made acrossthe mononuclear cell monolayer using sterile 20 μL pipettetip. Digital photographs were taken at 0 and 24 hours afterthe wound was made. The wound area was measured for eachtime point using image analysis software (Image-Pro Plus v.6.2 for Windows, Bethesda, MD). The difference in woundarea between hours 0 and 24 was expressed as
%Area migrated = AreaHr 0 − AreaHr 24
AreaHr 0× 100. (1)
The average wound area of 3 wells was reported for eachsubject.
2.6. Angiogenic Growth Factor Assays. Quantitative enzyme-linked immuno-sorbent assay (ELISA) for human erythro-poietin, angiopoietin-2, and SDF-1α (R&D Systems, Min-neapolis, MN), and a Human Angiogenesis Assay Panel(BioRad, Hercules, CA) were used to measure plasma con-centrations of growth factors. Results for erythropoietin wereexpressed as mIU/mL or pg/mL of plasma for the othergrowth factors. Each ELISA sample was run in duplicate.
2.7. Oxidative Stress Markers. Plasma concentrations of theredox pairs cysteine and cystine (Cys, CySS) and reducedand oxidized glutathione (GSH, GSSG) were measuredby high pressure liquid chromatography (HPLC), and theredox potentials for the Cys/CySS and GSH/GSSG couples(EhCySS, EhGSSG, resp.) were calculated using the methodof Jones [21]. This method includes sample preparation andstorage procedures to reduce artifacts that can be causedby hemolysis or GSH thiol-disulfide exchange. Urinary 8-isoprostanes (8-iso-Prostaglandin-F2α) were measured byELISA (Enzo LifeLife Sciences, Plymouth Meeting, PA).
2.8. Classification of Variables and Data
2.8.1. Outcome Variables. The main outcome variables wereblood-derived mononuclear cell colonies and CPC popula-tions. Total white blood cell (WBC) count was analyzed as anintermediate outcome variable.
2.8.2. Exposure Variables. The main exposure variable wasHemoglobin Group, defined as a categorical variable withtwo levels, Hemoglobin SS and Control. The other exposurevariables were the clinical characteristics (age, weight, sex),peripheral blood counts, angiogenic growth factors, andoxidative stress markers.
2.9. Statistical Analysis. Data were summarized using fre-quencies and percentages for categorical variables and means(and standard deviation) for continuous variables. Datathat were not normally distributed were transformed usingnatural logarithm transformation. The antilogarithms of themeans of the transformed data are reported as geometricmeans.
2.9.1. Univariate Analyses. Simple linear regression modelswere fitted to determine the relationships between the num-ber of each CPC type (outcome variables) and individualclinical variables or biomarkers (exposure variables).
2.9.2. Multivariate Analyses. Bivariate linear regression mod-els were fitted to examine the relationship between hemo-globin group SS and number of CPCs, as well as theconfounding effects of the other exposure variables. Con-founders were defined as those variables causing at least25% reduction in the β-coefficient compared to the mainexposure variable alone. Multiple linear regression analyseswere then performed to examine the relationship between
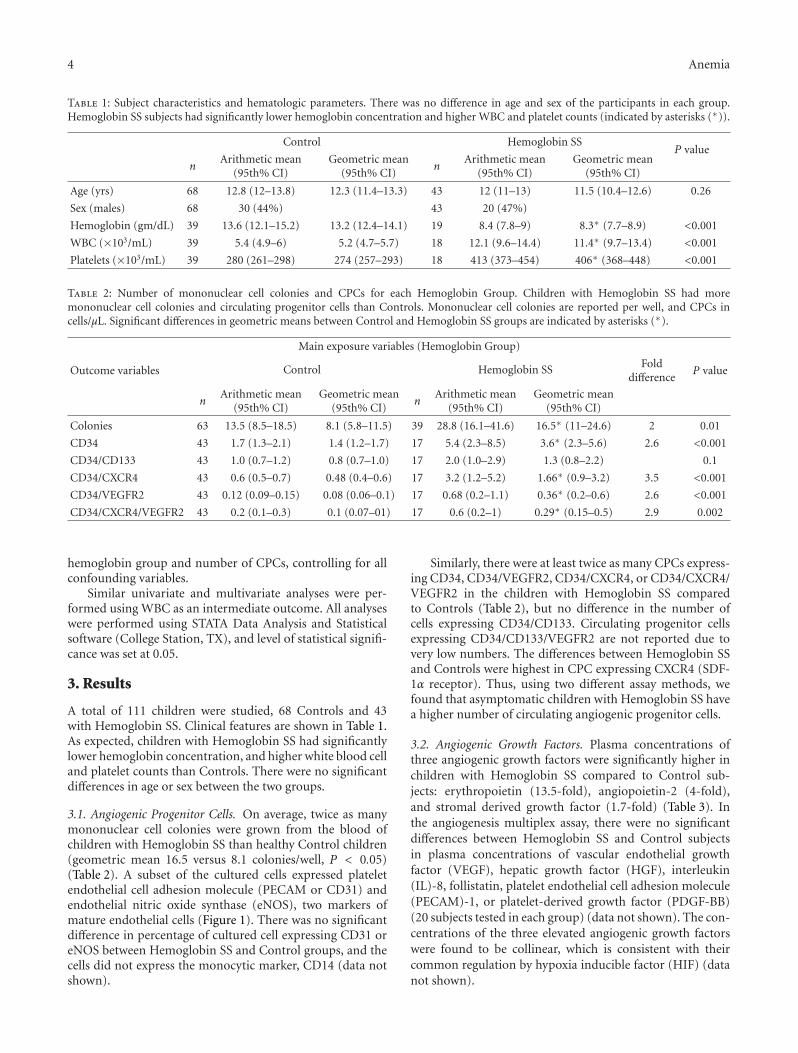
4 Anemia
Table 1: Subject characteristics and hematologic parameters. There was no difference in age and sex of the participants in each group.Hemoglobin SS subjects had significantly lower hemoglobin concentration and higher WBC and platelet counts (indicated by asterisks (∗)).
Control Hemoglobin SSP value
nArithmetic mean
(95th% CI)Geometric mean
(95th% CI)n
Arithmetic mean(95th% CI)
Geometric mean(95th% CI)
Age (yrs) 68 12.8 (12–13.8) 12.3 (11.4–13.3) 43 12 (11–13) 11.5 (10.4–12.6) 0.26
Sex (males) 68 30 (44%) 43 20 (47%)
Hemoglobin (gm/dL) 39 13.6 (12.1–15.2) 13.2 (12.4–14.1) 19 8.4 (7.8–9) 8.3∗ (7.7–8.9) <0.001
WBC (×103/mL) 39 5.4 (4.9–6) 5.2 (4.7–5.7) 18 12.1 (9.6–14.4) 11.4∗ (9.7–13.4) <0.001
Platelets (×103/mL) 39 280 (261–298) 274 (257–293) 18 413 (373–454) 406∗ (368–448) <0.001
Table 2: Number of mononuclear cell colonies and CPCs for each Hemoglobin Group. Children with Hemoglobin SS had moremononuclear cell colonies and circulating progenitor cells than Controls. Mononuclear cell colonies are reported per well, and CPCs incells/μL. Significant differences in geometric means between Control and Hemoglobin SS groups are indicated by asterisks (∗).
Main exposure variables (Hemoglobin Group)
Outcome variables Control Hemoglobin SS Folddifference
P value
nArithmetic mean
(95th% CI)Geometric mean
(95th% CI)n
Arithmetic mean(95th% CI)
Geometric mean(95th% CI)
Colonies 63 13.5 (8.5–18.5) 8.1 (5.8–11.5) 39 28.8 (16.1–41.6) 16.5∗ (11–24.6) 2 0.01
CD34 43 1.7 (1.3–2.1) 1.4 (1.2–1.7) 17 5.4 (2.3–8.5) 3.6∗ (2.3–5.6) 2.6 <0.001
CD34/CD133 43 1.0 (0.7–1.2) 0.8 (0.7–1.0) 17 2.0 (1.0–2.9) 1.3 (0.8–2.2) 0.1
CD34/CXCR4 43 0.6 (0.5–0.7) 0.48 (0.4–0.6) 17 3.2 (1.2–5.2) 1.66∗ (0.9–3.2) 3.5 <0.001
CD34/VEGFR2 43 0.12 (0.09–0.15) 0.08 (0.06–0.1) 17 0.68 (0.2–1.1) 0.36∗ (0.2–0.6) 2.6 <0.001
CD34/CXCR4/VEGFR2 43 0.2 (0.1–0.3) 0.1 (0.07–01) 17 0.6 (0.2–1) 0.29∗ (0.15–0.5) 2.9 0.002
hemoglobin group and number of CPCs, controlling for allconfounding variables.
Similar univariate and multivariate analyses were per-formed using WBC as an intermediate outcome. All analyseswere performed using STATA Data Analysis and Statisticalsoftware (College Station, TX), and level of statistical signifi-cance was set at 0.05.
3. Results
A total of 111 children were studied, 68 Controls and 43with Hemoglobin SS. Clinical features are shown in Table 1.As expected, children with Hemoglobin SS had significantlylower hemoglobin concentration, and higher white blood celland platelet counts than Controls. There were no significantdifferences in age or sex between the two groups.
3.1. Angiogenic Progenitor Cells. On average, twice as manymononuclear cell colonies were grown from the blood ofchildren with Hemoglobin SS than healthy Control children(geometric mean 16.5 versus 8.1 colonies/well, P < 0.05)(Table 2). A subset of the cultured cells expressed plateletendothelial cell adhesion molecule (PECAM or CD31) andendothelial nitric oxide synthase (eNOS), two markers ofmature endothelial cells (Figure 1). There was no significantdifference in percentage of cultured cell expressing CD31 oreNOS between Hemoglobin SS and Control groups, and thecells did not express the monocytic marker, CD14 (data notshown).
Similarly, there were at least twice as many CPCs express-ing CD34, CD34/VEGFR2, CD34/CXCR4, or CD34/CXCR4/VEGFR2 in the children with Hemoglobin SS comparedto Controls (Table 2), but no difference in the number ofcells expressing CD34/CD133. Circulating progenitor cellsexpressing CD34/CD133/VEGFR2 are not reported due tovery low numbers. The differences between Hemoglobin SSand Controls were highest in CPC expressing CXCR4 (SDF-1α receptor). Thus, using two different assay methods, wefound that asymptomatic children with Hemoglobin SS havea higher number of circulating angiogenic progenitor cells.
3.2. Angiogenic Growth Factors. Plasma concentrations ofthree angiogenic growth factors were significantly higher inchildren with Hemoglobin SS compared to Control sub-jects: erythropoietin (13.5-fold), angiopoietin-2 (4-fold),and stromal derived growth factor (1.7-fold) (Table 3). Inthe angiogenesis multiplex assay, there were no significantdifferences between Hemoglobin SS and Control subjectsin plasma concentrations of vascular endothelial growthfactor (VEGF), hepatic growth factor (HGF), interleukin(IL)-8, follistatin, platelet endothelial cell adhesion molecule(PECAM)-1, or platelet-derived growth factor (PDGF-BB)(20 subjects tested in each group) (data not shown). The con-centrations of the three elevated angiogenic growth factorswere found to be collinear, which is consistent with theircommon regulation by hypoxia inducible factor (HIF) (datanot shown).

Anemia 5
CD31
(a)
eNOS
(b)
(c) (d)
Figure 1: Immunofluorescent staining of cultured mononculear cells for endothelial antigens CD31 and endothelial nitric oxide synthase(eNOS). CD31 and eNOS staining was observed in a subset of cells. A representative sample from a subject with Hemoglobin SS is shown.(a) shows phase contrast image and (c) shows CD31 staining (green) with nuclei stained with DAPI (blue) in the same field. (b) Shows phasecontrast and (d) shows eNOS staining (green) for the same sample.
3.3. Oxidative Markers. Both cysteine and cystine were sig-nificantly higher (1.5-fold) in the children with HemoglobinSS compared to Controls. There was no difference in levelsof reduced glutathione (GSH) between groups, whereas theoxidized form of glutathione (GSSG) was 2-fold lower inthe children with Hemoglobin SS (Table 3). The calculatedredox potential for CyS/CySS (EhCySS) was significantlylower (more reduced) in the Hemoglobin SS group thanControls, but there was no difference in EhGSSG betweengroups. Urinary isoprostane levels were also not differentbetween groups.
3.4. Wound Migration. Migration across a linear wound wasmeasured in a subset of mononuclear cell samples. Mono-nuclear cells from Hemoglobin SS subjects (n = 5) migrat-ed over a significantly smaller percentage of the originalwound area in 24 hours than cells from healthy Controls (n =8) (28 versus 59%, respectively, P < 0.01) (Figure 2). Theassay was not performed if samples had not grown to con-fluence within the 14–16-day culture period.
3.5. Multivariate Analyses. Supplementary Table 1 (availableonline at doi:10.1155/2012/156598) shows the results of uni-variate analyses. Circulating progenitor cell number was sig-nificantly associated with erythropoietin, angiopoietin, SDF-1α, hemoglobin concentration, WBC and platelet counts,
and CySS and CySH levels. The strongest associations werefound with total WBC, SDF-1α, or erythropoietin.
A multivariate model was then used to test the role ofthe exposure variables as possible determinants of the elevat-ed number of CPCs in children with Hemoglobin SS. Totalwhite blood cell count was strongly associated with allCPC types (Table 4). When CPC number was correctedper 100 WBC, CD34/VEGFR2-expressing cells remained sig-nificantly higher in the Hemoglobin SS group than Controls(mean 0.61 versus 0.25 per 100 WBC/μL, P = 0.04), butthere were no differences for the other CPC types. To test forthe effects of the angiogenic growth factors alone, WBC wasexcluded from the initial model.
Erythropoietin was associated with CD34 and CD34/CXCR4 numbers, and angiopoietin-2 was associated withCD34/CXCR4/VEGFR2 number. However, SDF-1α was con-sistently associated with the number of all CPC types inthe Hemoglobin SS group (Table 5). SDF-1α in combinationwith either erythropoietin or angiopoietin-2 had slightlystronger associative effects. None of the other exposure vari-ables or biomarkers, including total hemoglobin, reticulo-cytes, or platelet count were found to be associated with CPCnumber in the Hemoglobin SS group.
White blood cells were then analyzed as a possible inter-mediate outcome. In univariate analysis, total WBC was

6 Anemia
Control Hemoglobin SS
0 h
rs24
hrs
(a)
Mononuclear cell migration at 24 hrs90
80
70
60
50
40
30
20
10
0Control (n = 8) SS (n = 5)
Are
a m
igra
ted
(%)
(b)
Figure 2: Mononuclear cell migration. Migration across a wound over 24 hours was significantly less in children with Hemoglobin SS thanControls. (a) shows a representative pair of Control and Hemoglobin SS wound migration assays. The freshly made wound was photographedat 0 (zero) hours, and the area migrated is measured after 24 hours. (b) shows the cumulative data for 8 Control and 5 Hemoglobin SSsamples. The mean area migrated was less in children with Hemoglobin SS (28% versus 59% of the original wound area, P < 0.01).
Table 3: Angiogenic growth factors and oxidant stress markers for each Hemoglobin Group. Children with Hemoglobin SS had higher levelsof three angiogenic growth factors, higher cysteine and cystine, and lower oxidized glutathione than Controls. Significant differences in thegeometric means between Control and Hemoglobin SS groups are indicated by asterisks (∗).
Other exposurevariables
Main exposure variables (Hemoglobin Group)
Control Hemoglobin SS Folddifference
P value
nArithmetic mean
(95th% CI)Geometric mean
(95th% CI)n
Arithmetic mean(95th% CI)
Geometric mean(95th% CI)
Erythropoietin(IU/mL)
68 6.6 (4.8, 8.4) 4.2 (3.2, 5.5) 42 72.4 (55.6, 89) 56.6∗ (43.9, 73) 13.5 <0.001
Angiopoietin-2(pg/mL)
45 1922 (1343, 2501) 1144 (809, 1616) 27 5946 (4661, 7231) 4968∗ (3820, 6461) 4.3 <0.001
SDF-1α (pg/mL) 64 2376 (2192, 2561) 2270 (2104, 2449) 38 4065 (3660, 4471) 3877∗ (3491, 4305) 1.7 <0.001
CyS (μM) 44 8.0 (7, 9) 7.4 (6.5, 8.4) 19 11.5 (9.5, 13.5) 10.8∗ (9, 13) 1.5 0.001
CySS (μM) 44 23.9 (22.3, 25.5) 23.4 (21.9, 24.9) 19 34.6 (30.4, 38.8) 33.7∗ (30, 37.8) 1.5 <0.001
EhCySS (mV) 44 −81.1 (−84,–78) 18− 87.1∗ (−92,
−83)0.026
GSH (μM) 44 1.1 (1, 1.2) 1.0 (0.9, 1.2) 19 1.1 (0.7, 1.5) 0.89 (0.7, 1.2) 0.38
GSSG (μM) 44 0.1 (0.08, 0.1) 0.08 (0.07, 0.1) 19 0.08 (0, 0.17) 0.04∗ (0.02, 0.07) 0.5 0.002
EhGSSG (mV) 44−117.2
(−121, −113)18
124.1(−132, −117)
0.11
Urinary 8-isoprostanes(ng/mL)
40 15 (9.7, 20.2) 8.88 (6.2, 12.7) 16 8.9 (7.2, 10.5) 8.4 (7, 10.1) 0.83
Table 4: Bivariate linear regression showing relationship between Hemoglobin SS group, WBC, and CPC types. WBC was found to be astrongly associated with CPC number in the Hemoglobin SS group. Significant reductions in the beta-coefficient (>25%) compared to themain exposure variable are marked with an asterisk (∗).
Outcome variables
Exposure variables CD34 CD34/CXCR4 CD34/VEGFR2 CD34/CXCR4/VEGFR2
β Adj r2 β Adj r2 β Adj r2 β Adj r2
Group = Hb SS 0.94 0.19 1.24 0.28 1.45 0.29 1.06 0.14
Hb SS + WBC −0.11∗ 0.36 0.22∗ 0.39 1.06∗ 0.29 0.32∗ 0.17
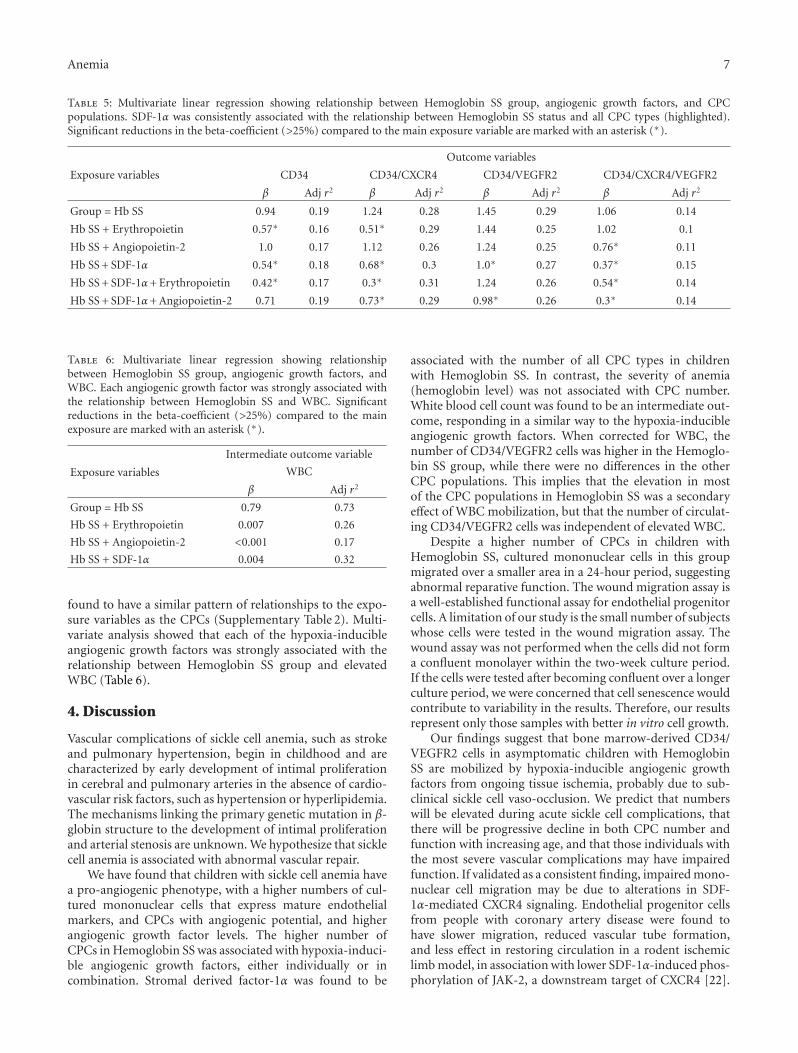
Anemia 7
Table 5: Multivariate linear regression showing relationship between Hemoglobin SS group, angiogenic growth factors, and CPCpopulations. SDF-1α was consistently associated with the relationship between Hemoglobin SS status and all CPC types (highlighted).Significant reductions in the beta-coefficient (>25%) compared to the main exposure variable are marked with an asterisk (∗).
Outcome variables
Exposure variables CD34 CD34/CXCR4 CD34/VEGFR2 CD34/CXCR4/VEGFR2
β Adj r2 β Adj r2 β Adj r2 β Adj r2
Group = Hb SS 0.94 0.19 1.24 0.28 1.45 0.29 1.06 0.14
Hb SS + Erythropoietin 0.57∗ 0.16 0.51∗ 0.29 1.44 0.25 1.02 0.1
Hb SS + Angiopoietin-2 1.0 0.17 1.12 0.26 1.24 0.25 0.76∗ 0.11
Hb SS + SDF-1α 0.54∗ 0.18 0.68∗ 0.3 1.0∗ 0.27 0.37∗ 0.15
Hb SS + SDF-1α+ Erythropoietin 0.42∗ 0.17 0.3∗ 0.31 1.24 0.26 0.54∗ 0.14
Hb SS + SDF-1α+ Angiopoietin-2 0.71 0.19 0.73∗ 0.29 0.98∗ 0.26 0.3∗ 0.14
Table 6: Multivariate linear regression showing relationshipbetween Hemoglobin SS group, angiogenic growth factors, andWBC. Each angiogenic growth factor was strongly associated withthe relationship between Hemoglobin SS and WBC. Significantreductions in the beta-coefficient (>25%) compared to the mainexposure are marked with an asterisk (∗).
Intermediate outcome variable
Exposure variables WBC
β Adj r2
Group = Hb SS 0.79 0.73
Hb SS + Erythropoietin 0.007 0.26
Hb SS + Angiopoietin-2 <0.001 0.17
Hb SS + SDF-1α 0.004 0.32
found to have a similar pattern of relationships to the expo-sure variables as the CPCs (Supplementary Table 2). Multi-variate analysis showed that each of the hypoxia-inducibleangiogenic growth factors was strongly associated with therelationship between Hemoglobin SS group and elevatedWBC (Table 6).
4. Discussion
Vascular complications of sickle cell anemia, such as strokeand pulmonary hypertension, begin in childhood and arecharacterized by early development of intimal proliferationin cerebral and pulmonary arteries in the absence of cardio-vascular risk factors, such as hypertension or hyperlipidemia.The mechanisms linking the primary genetic mutation in β-globin structure to the development of intimal proliferationand arterial stenosis are unknown. We hypothesize that sicklecell anemia is associated with abnormal vascular repair.
We have found that children with sickle cell anemia havea pro-angiogenic phenotype, with a higher numbers of cul-tured mononuclear cells that express mature endothelialmarkers, and CPCs with angiogenic potential, and higherangiogenic growth factor levels. The higher number ofCPCs in Hemoglobin SS was associated with hypoxia-induci-ble angiogenic growth factors, either individually or incombination. Stromal derived factor-1α was found to be
associated with the number of all CPC types in childrenwith Hemoglobin SS. In contrast, the severity of anemia(hemoglobin level) was not associated with CPC number.White blood cell count was found to be an intermediate out-come, responding in a similar way to the hypoxia-inducibleangiogenic growth factors. When corrected for WBC, thenumber of CD34/VEGFR2 cells was higher in the Hemoglo-bin SS group, while there were no differences in the otherCPC populations. This implies that the elevation in mostof the CPC populations in Hemoglobin SS was a secondaryeffect of WBC mobilization, but that the number of circulat-ing CD34/VEGFR2 cells was independent of elevated WBC.
Despite a higher number of CPCs in children withHemoglobin SS, cultured mononuclear cells in this groupmigrated over a smaller area in a 24-hour period, suggestingabnormal reparative function. The wound migration assay isa well-established functional assay for endothelial progenitorcells. A limitation of our study is the small number of subjectswhose cells were tested in the wound migration assay. Thewound assay was not performed when the cells did not forma confluent monolayer within the two-week culture period.If the cells were tested after becoming confluent over a longerculture period, we were concerned that cell senescence wouldcontribute to variability in the results. Therefore, our resultsrepresent only those samples with better in vitro cell growth.
Our findings suggest that bone marrow-derived CD34/VEGFR2 cells in asymptomatic children with HemoglobinSS are mobilized by hypoxia-inducible angiogenic growthfactors from ongoing tissue ischemia, probably due to sub-clinical sickle cell vaso-occlusion. We predict that numberswill be elevated during acute sickle cell complications, thatthere will be progressive decline in both CPC number andfunction with increasing age, and that those individuals withthe most severe vascular complications may have impairedfunction. If validated as a consistent finding, impaired mono-nuclear cell migration may be due to alterations in SDF-1α-mediated CXCR4 signaling. Endothelial progenitor cellsfrom people with coronary artery disease were found tohave slower migration, reduced vascular tube formation,and less effect in restoring circulation in a rodent ischemiclimb model, in association with lower SDF-1α-induced phos-phorylation of JAK-2, a downstream target of CXCR4 [22].
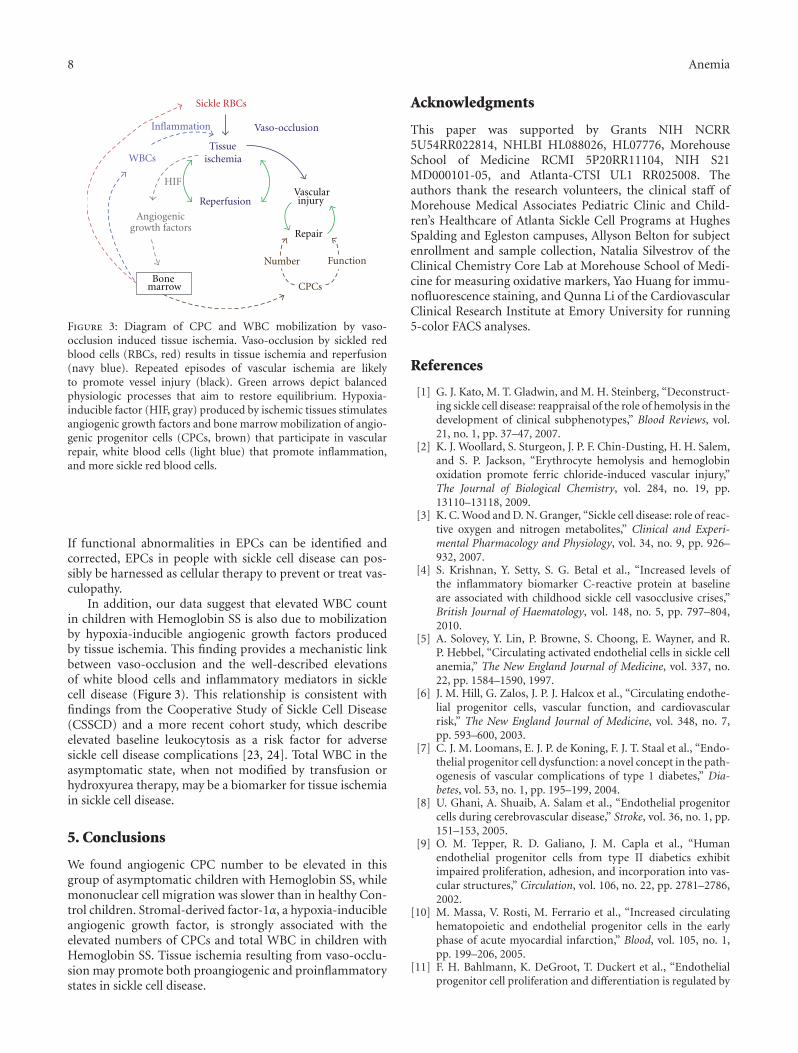
8 Anemia
Sickle RBCs
Inflammation
WBCs
Angiogenicgrowth factors
HIF
Tissue ischemia
ReperfusionVascularinjury
Repair
Number Function
CPCs
Vaso-occlusion
Bonemarrow
Figure 3: Diagram of CPC and WBC mobilization by vaso-occlusion induced tissue ischemia. Vaso-occlusion by sickled redblood cells (RBCs, red) results in tissue ischemia and reperfusion(navy blue). Repeated episodes of vascular ischemia are likelyto promote vessel injury (black). Green arrows depict balancedphysiologic processes that aim to restore equilibrium. Hypoxia-inducible factor (HIF, gray) produced by ischemic tissues stimulatesangiogenic growth factors and bone marrow mobilization of angio-genic progenitor cells (CPCs, brown) that participate in vascularrepair, white blood cells (light blue) that promote inflammation,and more sickle red blood cells.
If functional abnormalities in EPCs can be identified andcorrected, EPCs in people with sickle cell disease can pos-sibly be harnessed as cellular therapy to prevent or treat vas-culopathy.
In addition, our data suggest that elevated WBC countin children with Hemoglobin SS is also due to mobilizationby hypoxia-inducible angiogenic growth factors producedby tissue ischemia. This finding provides a mechanistic linkbetween vaso-occlusion and the well-described elevationsof white blood cells and inflammatory mediators in sicklecell disease (Figure 3). This relationship is consistent withfindings from the Cooperative Study of Sickle Cell Disease(CSSCD) and a more recent cohort study, which describeelevated baseline leukocytosis as a risk factor for adversesickle cell disease complications [23, 24]. Total WBC in theasymptomatic state, when not modified by transfusion orhydroxyurea therapy, may be a biomarker for tissue ischemiain sickle cell disease.
5. Conclusions
We found angiogenic CPC number to be elevated in thisgroup of asymptomatic children with Hemoglobin SS, whilemononuclear cell migration was slower than in healthy Con-trol children. Stromal-derived factor-1α, a hypoxia-inducibleangiogenic growth factor, is strongly associated with theelevated numbers of CPCs and total WBC in children withHemoglobin SS. Tissue ischemia resulting from vaso-occlu-sion may promote both proangiogenic and proinflammatorystates in sickle cell disease.
Acknowledgments
This paper was supported by Grants NIH NCRR5U54RR022814, NHLBI HL088026, HL07776, MorehouseSchool of Medicine RCMI 5P20RR11104, NIH S21MD000101-05, and Atlanta-CTSI UL1 RR025008. Theauthors thank the research volunteers, the clinical staff ofMorehouse Medical Associates Pediatric Clinic and Child-ren’s Healthcare of Atlanta Sickle Cell Programs at HughesSpalding and Egleston campuses, Allyson Belton for subjectenrollment and sample collection, Natalia Silvestrov of theClinical Chemistry Core Lab at Morehouse School of Medi-cine for measuring oxidative markers, Yao Huang for immu-nofluorescence staining, and Qunna Li of the CardiovascularClinical Research Institute at Emory University for running5-color FACS analyses.
References
[1] G. J. Kato, M. T. Gladwin, and M. H. Steinberg, “Deconstruct-ing sickle cell disease: reappraisal of the role of hemolysis in thedevelopment of clinical subphenotypes,” Blood Reviews, vol.21, no. 1, pp. 37–47, 2007.
[2] K. J. Woollard, S. Sturgeon, J. P. F. Chin-Dusting, H. H. Salem,and S. P. Jackson, “Erythrocyte hemolysis and hemoglobinoxidation promote ferric chloride-induced vascular injury,”The Journal of Biological Chemistry, vol. 284, no. 19, pp.13110–13118, 2009.
[3] K. C. Wood and D. N. Granger, “Sickle cell disease: role of reac-tive oxygen and nitrogen metabolites,” Clinical and Experi-mental Pharmacology and Physiology, vol. 34, no. 9, pp. 926–932, 2007.
[4] S. Krishnan, Y. Setty, S. G. Betal et al., “Increased levels ofthe inflammatory biomarker C-reactive protein at baselineare associated with childhood sickle cell vasocclusive crises,”British Journal of Haematology, vol. 148, no. 5, pp. 797–804,2010.
[5] A. Solovey, Y. Lin, P. Browne, S. Choong, E. Wayner, and R.P. Hebbel, “Circulating activated endothelial cells in sickle cellanemia,” The New England Journal of Medicine, vol. 337, no.22, pp. 1584–1590, 1997.
[6] J. M. Hill, G. Zalos, J. P. J. Halcox et al., “Circulating endothe-lial progenitor cells, vascular function, and cardiovascularrisk,” The New England Journal of Medicine, vol. 348, no. 7,pp. 593–600, 2003.
[7] C. J. M. Loomans, E. J. P. de Koning, F. J. T. Staal et al., “Endo-thelial progenitor cell dysfunction: a novel concept in the path-ogenesis of vascular complications of type 1 diabetes,” Dia-betes, vol. 53, no. 1, pp. 195–199, 2004.
[8] U. Ghani, A. Shuaib, A. Salam et al., “Endothelial progenitorcells during cerebrovascular disease,” Stroke, vol. 36, no. 1, pp.151–153, 2005.
[9] O. M. Tepper, R. D. Galiano, J. M. Capla et al., “Humanendothelial progenitor cells from type II diabetics exhibitimpaired proliferation, adhesion, and incorporation into vas-cular structures,” Circulation, vol. 106, no. 22, pp. 2781–2786,2002.
[10] M. Massa, V. Rosti, M. Ferrario et al., “Increased circulatinghematopoietic and endothelial progenitor cells in the earlyphase of acute myocardial infarction,” Blood, vol. 105, no. 1,pp. 199–206, 2005.
[11] F. H. Bahlmann, K. DeGroot, T. Duckert et al., “Endothelialprogenitor cell proliferation and differentiation is regulated by
Anemia 9
erythropoietin,” Kidney International, vol. 64, no. 5, pp. 1648–1652, 2003.
[12] U. Landmesser, N. Engberding, F. H. Bahlmann et al., “Statin-induced improvement of endothelial progenitor cell mobiliza-tion, myocardial neovascularization, left ventricular function,and survival after experimental myocardial infarction requiresendothelial nitric oxide synthase,” Circulation, vol. 110, no. 14,pp. 1933–1939, 2004.
[13] F. H. Bahlmann, K. de Groot, O. Mueller, B. Hertel, H. Haller,and D. Fliser, “Stimulation of endothelial progenitor cells:a new putative therapeutic effect of angiotensin II receptorantagonists,” Hypertension, vol. 45, no. 4, pp. 526–529, 2005.
[14] R. T. van Beem, E. Nur, J. J. Zwaginga et al., “Elevated endo-thelial progenitor cells during painful sickle cell crisis,” Experi-mental Hematology, vol. 37, no. 9, pp. 1054–1059, 2009.
[15] A. J. Duits, T. Rodriguez, and J. J. B. Schnog, “Serum levelsof angiogenic factors indicate a pro-angiogenic state in adultswith sickle cell disease,” British Journal of Haematology, vol.134, no. 1, pp. 116–119, 2006.
[16] X. Niu, M. Nouraie, A. Campbell et al., “Angiogenic andinflammatory markers of cardiopulmonary changes in chil-dren and adolescents with sickle cell disease,” PLoS One, vol.4, no. 11, Article ID e7956, 2009.
[17] A. Solovey, L. Gui, S. Ramakrishnan, M. H. Steinberg, and R.P. Hebbel, “Sickle cell anemia as a possible state of enhancedanti-apoptotic tone: survival effect of vascular endothelialgrowth factor on circulating and unanchored endothelialcells,” Blood, vol. 93, no. 11, pp. 3824–3830, 1999.
[18] P. P. Landburg, E. Nur, N. Maria et al., “Elevated circulatingstromal-derived factor-1 levels in sickle cell disease,” ActaHaematologica, vol. 122, no. 1, pp. 64–69, 2009.
[19] J. Case, L. E. Mead, W. K. Bessler et al., “HumanCD34+AC133+VEGFR-2+ cells are not endothelial progenitorcells but distinct, primitive hematopoietic progenitors,” Exper-imental Hematology, vol. 35, no. 7, pp. 1109–1118, 2007.
[20] V. Subramaniyam, E. K. Waller, J. R. Murrow et al., “Bonemarrow mobilization with granulocyte macrophage colony-stimulating factor improves endothelial dysfunction andexercise capacity in patients with peripheral arterial disease,”American Heart Journal, vol. 158, no. 1, pp. 53–60, 2009.
[21] D. P. Jones and Y. Liang, “Measuring the poise of thiol/disulfide couples in vivo,” Free Radical Biology and Medicine,vol. 47, no. 10, pp. 1329–1338, 2009.
[22] D. H. Walter, J. Haendeler, J. Reinhold et al., “Impaired CXCR4signaling contributes to the reduced neovascularization capac-ity of endothelial progenitor cells from patients with coronaryartery disease,” Circulation Research, vol. 97, no. 11, pp. 1142–1151, 2005.
[23] S. T. Miller, L. A. Sleeper, C. H. Pegelow et al., “Prediction ofadverse outcomes in children with sickle cell disease,” The NewEngland Journal of Medicine, vol. 342, no. 2, pp. 83–89, 2000.
[24] C. T. Quinn, N. J. Lee, E. P. Shull, N. Ahmad, Z. R. Rogers, andG. R. Buchanan, “Prediction of adverse outcomes in childrenwith sickle cell anemia: a study of the Dallas Newborn Cohort,”Blood, vol. 111, no. 2, pp. 544–548, 2008.
Hindawi Publishing CorporationAnemiaVolume 2012, Article ID 428137, 13 pagesdoi:10.1155/2012/428137
Research Article
FK228 Analogues Induce Fetal Hemoglobin inHuman Erythroid Progenitors
Levi Makala,1 Salvatore Di Maro,2, 3 Tzu-Fang Lou,4 Sharanya Sivanand,5
Jung-Mo Ahn,2 and Betty S. Pace1
1 Department of Pediatrics, Georgia Health Sciences University, Augusta, GA 30912, USA2 Department of Chemistry, University of Texas at Dallas, Richardson, TX 75083, USA3 Department of Pharmacological and Toxicological Chemistry, University of Naples Federico II, 80100 Naples, Italy4 Department of Molecular and Cell Biology, University of Texas at Dallas, TX 75080, USA5 Department of Developmental Biology, University of Texas Southwestern Medical Center, Dallas, TX 75390, USA
Correspondence should be addressed to Betty S. Pace, [email protected]
Received 16 December 2011; Accepted 7 March 2012
Academic Editor: Solomon F. Ofori-Acquah
Copyright © 2012 Levi Makala et al. This is an open access article distributed under the Creative Commons Attribution License,which permits unrestricted use, distribution, and reproduction in any medium, provided the original work is properly cited.
Fetal hemoglobin (HbF) improves the clinical severity of sickle cell disease (SCD), therefore, research to identify HbF-inducingagents for treatment purposes is desirable. The focus of our study is to investigate the ability of FK228 analogues to induce HbFusing a novel KU812 dual-luciferase reporter system. Molecular modeling studies showed that the structure of twenty FK228analogues with isosteric substitutions did not disturb the global structure of the molecule. Using the dual-luciferase system, asubgroup of FK228 analogues was shown to be inducers of HbF at nanomolar concentrations. To determine the physiologicalrelevance of these compounds, studies in primary erythroid progenitors confirmed that JMA26 and JMA33 activated HbF synthesisat levels comparable to FK228 with low cellular toxicity. These data support our lead compounds as potential therapeutic agentsfor further development in the treatment of SCD.
1. Introduction
Several classes of pharmacological compounds that reactivateγ-globin gene transcription have been identified. They in-clude cytotoxic agents, DNA methyl transferase, and his-tone deacetylase (HDAC) inhibitors. Cytotoxic compoundsterminate actively cycling progenitors and perturb cellulargrowth to trigger rapid erythroid regeneration and γ-globingene activation. S-stage cytotoxic drugs, such as cytosinearabinoside [1], myleran [2], vinblastine [3], and hydrox-yurea [4, 5], induce HbF production in primates and humans[4, 6, 7]. The Multicenter Study of Hydroxyurea establishedthis agent as the first FDA-approved treatment for SCD [7].Hydroxyurea was shown to reduce vaso-occlusive episodes inthe majority of sickle-cell patients treated. However, limita-tions to using hydroxyurea such as bone marrow suppression
[8], concerns over long-term carcinogenic complications,and a 30% non-response rate [7, 9], make the developmentof alternative therapies desirable.
The HDAC inhibitors have also been shown to bepotent HbF inducers. These agents target HDACs, whichplay a dynamic role in regulating cell cycle progression andchromatin conformation by changes in histone acetylationstatus. Aberrant transcriptional repression mediated by ClassI and II HDACs has been demonstrated in many cancers [10].Thus, HDAC inhibitors have been developed as promisinganticancer therapeutics [11]. Structurally diverse classes ofnatural and synthetic HDAC inhibitors bind target HDACsto block histone deacetylation [12] and produce an openchromatin confirmation and gene activation [13].
There has been great interest in HDAC inhibitors asHbF inducers to treat SCD. They include (1) short-chain

2 Anemia
fatty acids such as sodium butyrate (NaB), the first HDACinhibitor reported [14, 15]; (2) the benzamides (i.e., MS-275); (3) non cyclic and cyclic hydroxamates, like SAHA(suberoylanilide hydroxamic acid) and TSA (TrichostatinA); (4) cyclic peptides including FK228 (depsipeptide).NaB induces differentiation in mouse erythroleukemia cellsvia Stat5 phosphorylation and HbF synthesis through p38mitogen-activated protein kinase signaling [16–18]. Otherfatty acids including phenylacetate and propionate [19–21], induce HbF in erythroid progenitors, however, theseagents are rapidly metabolized and oral preparations arenot available. These published studies serve as the basis forresearch efforts to develop HDAC inhibitors as therapeuticagents for SCD.
Of the hydroxamic acid derivatives, the prototype TSAis a potent HDAC inhibitor [22, 23]. It interacts with adivalent zinc-binding motif in the binding pocket of ClassI and II HDACs [24]. Other HDAC inhibitors in the hydrox-amic acid class include the second-generation analogues ofTSA, identified from a library screen of 600 synthesizedcompounds [25]. The most widely studied TSA analoguesare SAHA and Scriptaid. SAHA targets HDAC1, 3, and 4and inhibits prostate cancer cell growth in vitro and invivo [26, 27]. Recently, it was demonstrated by Pace andcolleagues that SAHA and Scriptaid induce HbF synthesiscomparable to NaB and TSA in erythroid cells and β-YACtransgenic mice respectively [28]. However, limitations tothe further development of these agents included toxicity inprimary cells.
Another potent HDAC inhibitor is FK228, also knownas depsipeptide, isolated from Chromobacterium violaceum[29]. This compound has a unique bicyclic structure and isa stable pro-drug activated by the reduction of the disulfidebond by glutathione to produce an active form (redFK) afteruptake into cells [30]. The reduced sulfhydryl group interactsstrongly with the zinc ion at the active site of the enzyme andhas been shown to inhibit tumor proliferation in vitro andin vivo at nanomolar concentrations [27, 31, 32]. Recently,FK228 was tested in the μLCRβprRluc
AγprFluc GM979 stablecell line and erythroid progenitors grown in methylcellulosecolonies produced from peripheral blood mononuclear cells[33]. FK228 was shown to induce HbF in both systems.The level of γ-globin and β-globin promoter activity wasquantified indirectly using firefly (γ) and renilla (β) luciferaseactivity.
Drug-mediated HbF induction remains the best ap-proach to ameliorate the symptoms and complications ofSCD. Among many compounds, FK228 showed efficacy ininducing γ-globin transcription at low concentrations, how-ever, cell toxicity was observed and the drug is difficult tosynthesize. It is a bicyclic depsipeptide almost exclusivelycomprised of unnatural amino acids, D-valine, D-cysteineand, (Z)-dehydrobutyrine (Dhb) as well as a (3S, 4E)-3-hydroxy-7-mercapto-4-heptenoic acid, which is a keycomponent to form the highly constrained bicyclic structure.The high content of the unnatural amino acids and theconstrained bicyclic structure make it extremely stable inphysiological condition. Simon and coworkers first reportedits total synthesis in 1996 [34], and suggested a laborious
synthetic route with moderate yield (18% overall yield withover 16 steps).
Despite its exceptionally high in vitro and in vivoactivity, FK228 has not been explored due to its non-trivialand challenging synthesis, which hampered its productionand the design of analogues. The latter would aide ourunderstanding of the molecular mechanism of FK228 and toachieve higher potency and selectivity for HbF induction. Infact, only a few FK228 analogues have been created to dateeven after intensive synthetic efforts were made [34–36]. Tocircumvent this problem, we used in silico structure analysisand molecular modeling to design twenty FK228 structuralanalogues that can be easily synthesized [37]. Furthermore,two isosteric substitutions were made without altering itsglobal conformation.
The objective of our study was to investigate the abilityof the newly synthesized FK228 analogues to induce γ-globin gene transcription using a dual luciferase-based assaysystem. We identified two lead compounds, JMA26 andJMA33, which induce HbF expression in primary erythroidprogenitors. The potential of HDAC enzymes as druggabletargets in the treatment of SCD is discussed.
2. Materials and Methods
2.1. Synthesis of FK228 Analogues. The synthesis of all FK228analogues described in this study was accomplished byfollowing the previously reported solid-phase synthetic pro-cedure outlined in Scheme 1 [37]. Briefly, S-trityl cysteaminewas loaded on aminomethylated polystyrene (AM-PS) resinthat was previously functionalized with a backbone amidelinker (BAL) [38]. The resulting secondary amine 1 was thencoupled with the first amino acid, Fmoc-L-Asp(OAl) to givethe aspartylcysteamine 2 with high yield (98%). Thus, theaspartylcysteamine moiety designed to replace the heptenoicacid in the native FK228, was constructed in a single reactionstep. The remaining four amino acids were introducedsequentially using the standard N-Fmoc/tBu solid-phasepeptide synthesis strategy to build the linear pentapeptides6a-f. After the allyl and N-Fmoc protecting groups wereremoved, the macrolactams 7a-f were formed with HBTU(O-benzotriazole-N,N,N′,N′-tetramethyluronium hexafluo-rophosphate) as a coupling reagent with high yields andpurity (>95%). S-Trityl protecting groups were removedwith dilute 1% trifluoroacetic acid and the resulting freethiols were oxidized with iodine to produce the bicyclicFK228 analogues. The analogues were cleaved from the resinwith TFA (>95%) and characterized by reverse phase—high performance liquid chromatography and electrosprayionization mass spectrometry.
2.2. Cell Culture. Human KU812 leukemia cells were grownin Iscove’s Modified Dulbecco’s medium (IMDM) (Invitro-gen, Carlsbad, CA) with 10% fetal bovine serum (AtlantaBiologicals, Atlanta, GA), penicillin (100 U/mL), and strep-tomycin (0.1 mg/mL). The cells were incubated at 37◦C with5% CO2. Cell count and viability were determined using ahemocytometer and 2% Trypan blue exclusion. Inductions
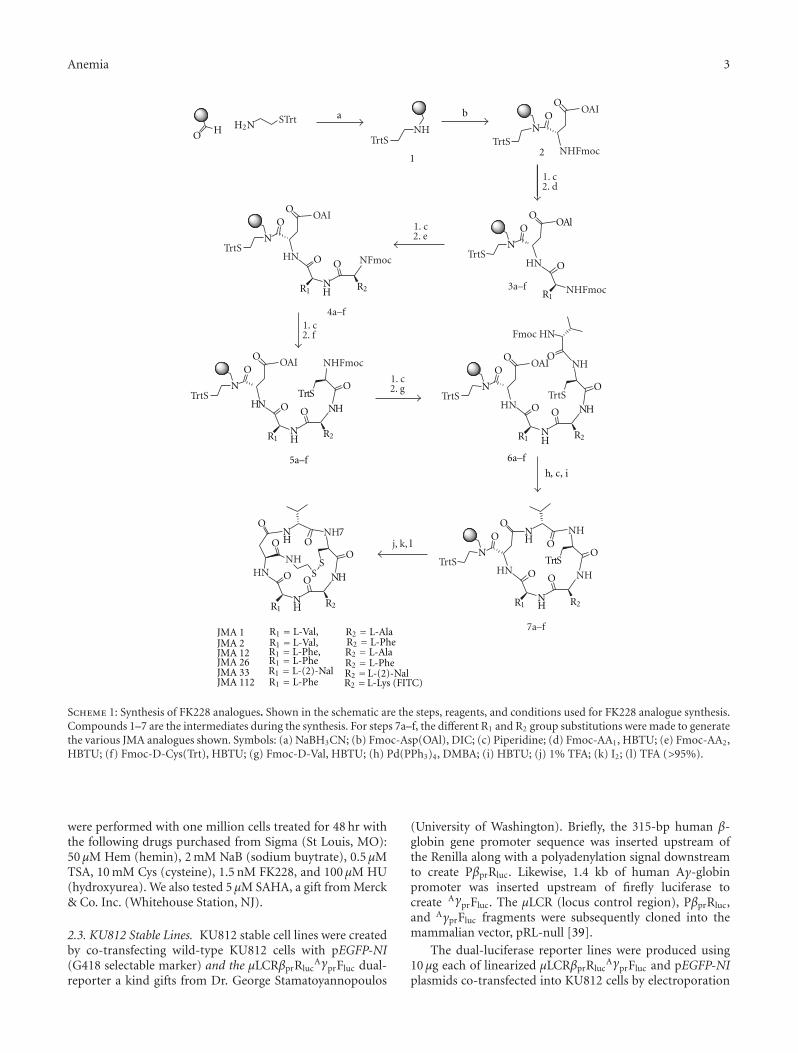
Anemia 3
a
h, c, i
b
NH
NH
NH
SS
O
OO
OO
O
NH
NH
N
OO
O
OO
O
N
OO
OAl
N
OO
O
HN
NH
NH
NTrtS
OO
O
OO
O H
NH
N
OO
OO
NH
NTrtS
OO
O
OO
ONH
12
H2N STrtNH
TrtS TrtS
TrtS
TrtS
TrtS
TrtS
TrtS
TrtS
NHFmoc
NHFmoc
NHFmoc
NFmoc
Fmoc HN
R2
R2 R2
R2R2
R1
R1 R1
R1R1
R1
HNHN
HN
HNHN
3a–f
5a–f
4a–f
1. c2. d
1. c2. f
1. c2. e
1. c2. g
OAI
OAI OAI
OAI
NH
NHNH
NH
NH
j, k, l
JMA 1 R1 = L-Val,JMA 2 R1 = L-Val,JMA 12 R1 = L-Phe,JMA 26 R1 = L-PheJMA 33 R1 = L-(2)-NalJMA 112 R1 = L-Phe
R2 = L-AlaR2 = L-PheR2 = L-AlaR2 = L-PheR2 =L-(2)-NalR2 =L-Lys (FITC)
7
7a–f
6a–f
Scheme 1: Synthesis of FK228 analogues. Shown in the schematic are the steps, reagents, and conditions used for FK228 analogue synthesis.Compounds 1–7 are the intermediates during the synthesis. For steps 7a–f, the different R1 and R2 group substitutions were made to generatethe various JMA analogues shown. Symbols: (a) NaBH3CN; (b) Fmoc-Asp(OAl), DIC; (c) Piperidine; (d) Fmoc-AA1, HBTU; (e) Fmoc-AA2,HBTU; (f) Fmoc-D-Cys(Trt), HBTU; (g) Fmoc-D-Val, HBTU; (h) Pd(PPh3)4, DMBA; (i) HBTU; (j) 1% TFA; (k) I2; (l) TFA (>95%).
were performed with one million cells treated for 48 hr withthe following drugs purchased from Sigma (St Louis, MO):50 μM Hem (hemin), 2 mM NaB (sodium buytrate), 0.5 μMTSA, 10 mM Cys (cysteine), 1.5 nM FK228, and 100 μM HU(hydroxyurea). We also tested 5 μM SAHA, a gift from Merck& Co. Inc. (Whitehouse Station, NJ).
2.3. KU812 Stable Lines. KU812 stable cell lines were createdby co-transfecting wild-type KU812 cells with pEGFP-NI(G418 selectable marker) and the μLCRβprRluc
AγprFluc dual-reporter a kind gifts from Dr. George Stamatoyannopoulos
(University of Washington). Briefly, the 315-bp human β-globin gene promoter sequence was inserted upstream ofthe Renilla along with a polyadenylation signal downstreamto create PβprRluc. Likewise, 1.4 kb of human Aγ-globinpromoter was inserted upstream of firefly luciferase tocreate AγprFluc. The μLCR (locus control region), PβprRluc,and AγprFluc fragments were subsequently cloned into themammalian vector, pRL-null [39].
The dual-luciferase reporter lines were produced using10 μg each of linearized μLCRβprRluc
AγprFluc and pEGFP-NIplasmids co-transfected into KU812 cells by electroporation
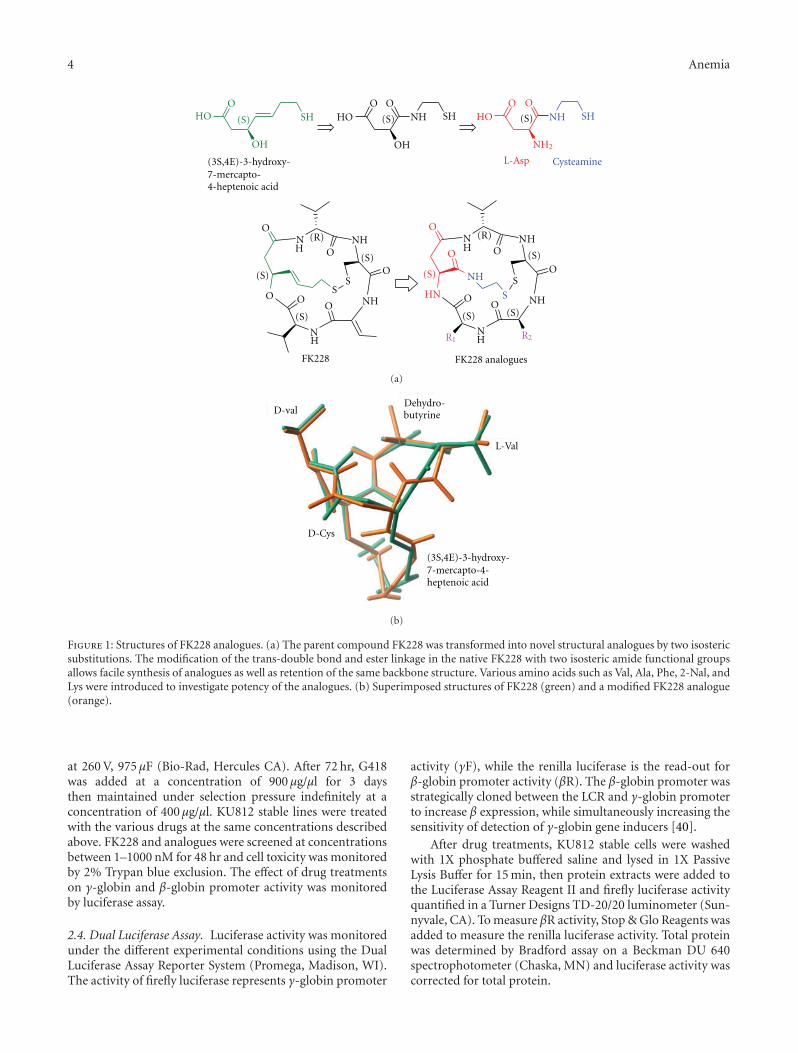
4 Anemia
(S) (S)
(S)
(R) (R)
(S)
(S)
(S)
(S) (S)
(S)
(S)
O ONH
O OHO
O
NHNH
NH
S
S
O
O
O
OO
ONH
O
NH
SS
O
O
OO
O
HO
OH OH
SH SHNH
NH
NH
NHNH
SHHO
NH2
L-Asp Cysteamine
FK228 FK228 analogues
HN
R2R1
(3S,4E)-3-hydroxy-7-mercapto-4-heptenoic acid
(a)
D-val
(3S,4E)-3-hydroxy-7-mercapto-4-heptenoic acid
D-Cys
Dehydro-butyrine
L-Val
(b)
Figure 1: Structures of FK228 analogues. (a) The parent compound FK228 was transformed into novel structural analogues by two isostericsubstitutions. The modification of the trans-double bond and ester linkage in the native FK228 with two isosteric amide functional groupsallows facile synthesis of analogues as well as retention of the same backbone structure. Various amino acids such as Val, Ala, Phe, 2-Nal, andLys were introduced to investigate potency of the analogues. (b) Superimposed structures of FK228 (green) and a modified FK228 analogue(orange).
at 260 V, 975 μF (Bio-Rad, Hercules CA). After 72 hr, G418was added at a concentration of 900 μg/μl for 3 daysthen maintained under selection pressure indefinitely at aconcentration of 400 μg/μl. KU812 stable lines were treatedwith the various drugs at the same concentrations describedabove. FK228 and analogues were screened at concentrationsbetween 1–1000 nM for 48 hr and cell toxicity was monitoredby 2% Trypan blue exclusion. The effect of drug treatmentson γ-globin and β-globin promoter activity was monitoredby luciferase assay.
2.4. Dual Luciferase Assay. Luciferase activity was monitoredunder the different experimental conditions using the DualLuciferase Assay Reporter System (Promega, Madison, WI).The activity of firefly luciferase represents γ-globin promoter
activity (γF), while the renilla luciferase is the read-out forβ-globin promoter activity (βR). The β-globin promoter wasstrategically cloned between the LCR and γ-globin promoterto increase β expression, while simultaneously increasing thesensitivity of detection of γ-globin gene inducers [40].
After drug treatments, KU812 stable cells were washedwith 1X phosphate buffered saline and lysed in 1X PassiveLysis Buffer for 15 min, then protein extracts were added tothe Luciferase Assay Reagent II and firefly luciferase activityquantified in a Turner Designs TD-20/20 luminometer (Sun-nyvale, CA). To measure βR activity, Stop & Glo Reagents wasadded to measure the renilla luciferase activity. Total proteinwas determined by Bradford assay on a Beckman DU 640spectrophotometer (Chaska, MN) and luciferase activity wascorrected for total protein.
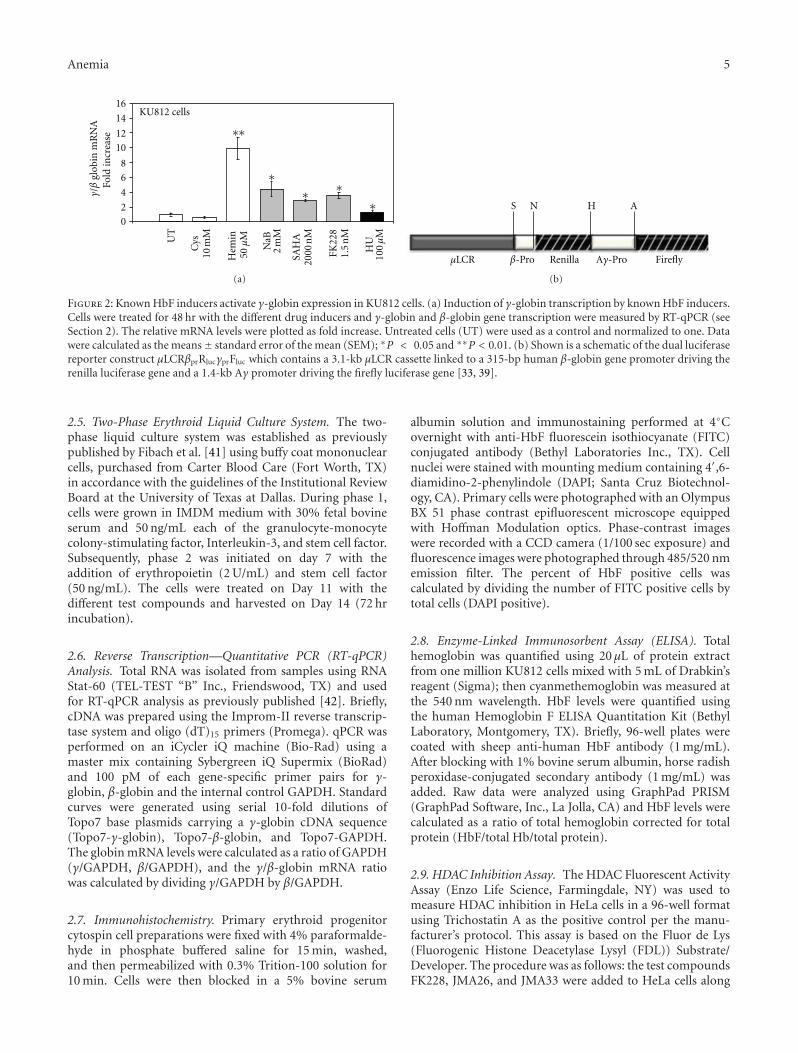
Anemia 5
SAH
A20
00 n
M
FK22
81.
5 n
M
HU
100 μ
M
KU812 cellsFo
ld in
crea
se
UT
50 μ
MH
emin
Cys
10 m
M
NaB
2 m
M
γ/β
glob
in m
RN
A ∗∗
∗ ∗∗
∗
0
2
4
6
8
10
12
14
16
(a)
S N H A
Renilla FireflyAγ-Proβ-ProμLCR
(b)
Figure 2: Known HbF inducers activate γ-globin expression in KU812 cells. (a) Induction of γ-globin transcription by known HbF inducers.Cells were treated for 48 hr with the different drug inducers and γ-globin and β-globin gene transcription were measured by RT-qPCR (seeSection 2). The relative mRNA levels were plotted as fold increase. Untreated cells (UT) were used as a control and normalized to one. Datawere calculated as the means± standard error of the mean (SEM); ∗P < 0.05 and ∗∗P < 0.01. (b) Shown is a schematic of the dual luciferasereporter construct μLCRβprRlucγprFluc which contains a 3.1-kb μLCR cassette linked to a 315-bp human β-globin gene promoter driving therenilla luciferase gene and a 1.4-kb Aγ promoter driving the firefly luciferase gene [33, 39].
2.5. Two-Phase Erythroid Liquid Culture System. The two-phase liquid culture system was established as previouslypublished by Fibach et al. [41] using buffy coat mononuclearcells, purchased from Carter Blood Care (Fort Worth, TX)in accordance with the guidelines of the Institutional ReviewBoard at the University of Texas at Dallas. During phase 1,cells were grown in IMDM medium with 30% fetal bovineserum and 50 ng/mL each of the granulocyte-monocytecolony-stimulating factor, Interleukin-3, and stem cell factor.Subsequently, phase 2 was initiated on day 7 with theaddition of erythropoietin (2 U/mL) and stem cell factor(50 ng/mL). The cells were treated on Day 11 with thedifferent test compounds and harvested on Day 14 (72 hrincubation).
2.6. Reverse Transcription—Quantitative PCR (RT-qPCR)Analysis. Total RNA was isolated from samples using RNAStat-60 (TEL-TEST “B” Inc., Friendswood, TX) and usedfor RT-qPCR analysis as previously published [42]. Briefly,cDNA was prepared using the Improm-II reverse transcrip-tase system and oligo (dT)15 primers (Promega). qPCR wasperformed on an iCycler iQ machine (Bio-Rad) using amaster mix containing Sybergreen iQ Supermix (BioRad)and 100 pM of each gene-specific primer pairs for γ-globin, β-globin and the internal control GAPDH. Standardcurves were generated using serial 10-fold dilutions ofTopo7 base plasmids carrying a γ-globin cDNA sequence(Topo7-γ-globin), Topo7-β-globin, and Topo7-GAPDH.The globin mRNA levels were calculated as a ratio of GAPDH(γ/GAPDH, β/GAPDH), and the γ/β-globin mRNA ratiowas calculated by dividing γ/GAPDH by β/GAPDH.
2.7. Immunohistochemistry. Primary erythroid progenitorcytospin cell preparations were fixed with 4% paraformalde-hyde in phosphate buffered saline for 15 min, washed,and then permeabilized with 0.3% Trition-100 solution for10 min. Cells were then blocked in a 5% bovine serum
albumin solution and immunostaining performed at 4◦Covernight with anti-HbF fluorescein isothiocyanate (FITC)conjugated antibody (Bethyl Laboratories Inc., TX). Cellnuclei were stained with mounting medium containing 4′,6-diamidino-2-phenylindole (DAPI; Santa Cruz Biotechnol-ogy, CA). Primary cells were photographed with an OlympusBX 51 phase contrast epifluorescent microscope equippedwith Hoffman Modulation optics. Phase-contrast imageswere recorded with a CCD camera (1/100 sec exposure) andfluorescence images were photographed through 485/520 nmemission filter. The percent of HbF positive cells wascalculated by dividing the number of FITC positive cells bytotal cells (DAPI positive).
2.8. Enzyme-Linked Immunosorbent Assay (ELISA). Totalhemoglobin was quantified using 20 μL of protein extractfrom one million KU812 cells mixed with 5 mL of Drabkin’sreagent (Sigma); then cyanmethemoglobin was measured atthe 540 nm wavelength. HbF levels were quantified usingthe human Hemoglobin F ELISA Quantitation Kit (BethylLaboratory, Montgomery, TX). Briefly, 96-well plates werecoated with sheep anti-human HbF antibody (1 mg/mL).After blocking with 1% bovine serum albumin, horse radishperoxidase-conjugated secondary antibody (1 mg/mL) wasadded. Raw data were analyzed using GraphPad PRISM(GraphPad Software, Inc., La Jolla, CA) and HbF levels werecalculated as a ratio of total hemoglobin corrected for totalprotein (HbF/total Hb/total protein).
2.9. HDAC Inhibition Assay. The HDAC Fluorescent ActivityAssay (Enzo Life Science, Farmingdale, NY) was used tomeasure HDAC inhibition in HeLa cells in a 96-well formatusing Trichostatin A as the positive control per the manu-facturer’s protocol. This assay is based on the Fluor de Lys(Fluorogenic Histone Deacetylase Lysyl (FDL)) Substrate/Developer. The procedure was as follows: the test compoundsFK228, JMA26, and JMA33 were added to HeLa cells along

6 Anemia
Primary cells
∗∗ ∗∗ ∗∗
∗∗
SAH
A20
00 n
M
FK22
81.
5 n
M
Fold
incr
ease
UT
50 μ
MH
emin
Cys
10 m
M
JMA
11.
5 n
MJM
A2
1 n
M
JMA
1210
00 n
M
JMA
2650
0 n
M
JMA
3310
00 n
M
γ/β
glob
in m
RN
A
0
1
2
3
4
5
(a)
FITC
DAPI
FITC
DAPI
Untreated Cysteine Hemin SAHA FK228
JMA1 JMA2 JMA12 JMA26 JMA33
(b)
Figure 3: JMA33 and JMA26 induce HbF in primary erythroid cells. (a) Day 11 erythroid progenitors were treated for 48 hr with the controlsagents and the FK228 analogues shown and then analyzed by RT-qPCR. Untreated cells (UT) were used as a control and normalized to one.Data were calculated as the means ± SEM. (b) Progenitors were stained with anti-γ-globin FITC conjugated antibody overnight and HbFpositive cells for were visualized. DAPI staining was performed to identify cell nuclei and to determine cell counts. Images were photographedat 40X power. The images generated were used to count 500 DAPI positive cells and the %FITC positive cells were calculated accordingly.
with the FDL substrate to allow intracellular drug activationthen fluorescence levels were read on the fluorometer at440 nm (CytoFluor II, PerSeptive Biosystems, Farmingdale,NY). The drug concentrations tested were based on theamount required for HbF induction in primary cells. Datawas reported as the mean ± standard deviation (SD) for atleast five replicates.
2.10. Statistical Analysis. The data are reported as themean ± standard error of the mean (SEM) from at least fivedata points generated from independent drug treatments.Data were analyzed by a two-tailed student’s t-test, andvalues of P < 0.05 were considered statistically significant.Statistical analyses were performed using Microsoft Excel(Redmond, WA, USA).
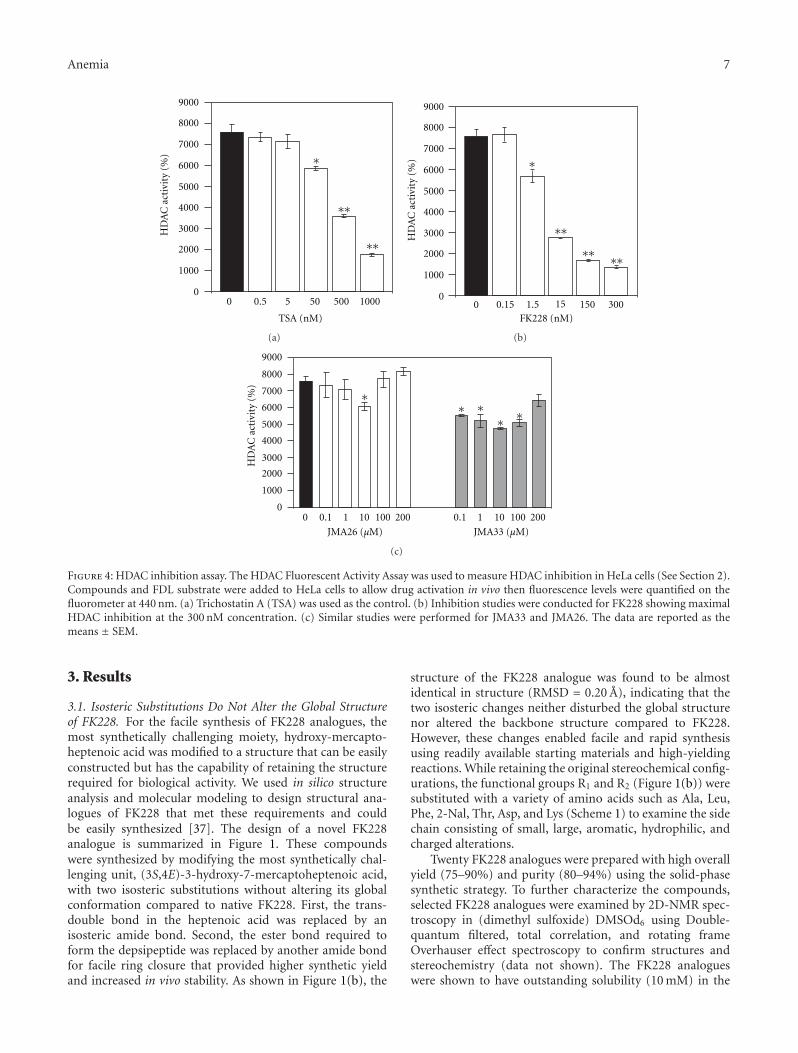
Anemia 7
0
1000
2000
3000
4000
5000
6000
7000
8000
9000
HD
AC
act
ivit
y (%
)
TSA (nM)
0 0.5 5 50 500 1000
∗
∗∗
∗∗
(a)
0
1000
2000
3000
4000
5000
6000
7000
8000
9000
FK228 (nM)
HD
AC
act
ivit
y (%
)
0 0.15 1.5 15 150 300
∗∗
∗∗ ∗∗
∗
(b)
0
1000
2000
3000
4000
5000
6000
7000
8000
9000
HD
AC
act
ivit
y (%
)
0 0.1 1 10 100 200 0.1 1 10 100 200
JMA33 (μM)JMA26 (μM)
∗ ∗∗ ∗
∗
(c)
Figure 4: HDAC inhibition assay. The HDAC Fluorescent Activity Assay was used to measure HDAC inhibition in HeLa cells (See Section 2).Compounds and FDL substrate were added to HeLa cells to allow drug activation in vivo then fluorescence levels were quantified on thefluorometer at 440 nm. (a) Trichostatin A (TSA) was used as the control. (b) Inhibition studies were conducted for FK228 showing maximalHDAC inhibition at the 300 nM concentration. (c) Similar studies were performed for JMA33 and JMA26. The data are reported as themeans ± SEM.
3. Results
3.1. Isosteric Substitutions Do Not Alter the Global Structureof FK228. For the facile synthesis of FK228 analogues, themost synthetically challenging moiety, hydroxy-mercapto-heptenoic acid was modified to a structure that can be easilyconstructed but has the capability of retaining the structurerequired for biological activity. We used in silico structureanalysis and molecular modeling to design structural ana-logues of FK228 that met these requirements and couldbe easily synthesized [37]. The design of a novel FK228analogue is summarized in Figure 1. These compoundswere synthesized by modifying the most synthetically chal-lenging unit, (3S,4E)-3-hydroxy-7-mercaptoheptenoic acid,with two isosteric substitutions without altering its globalconformation compared to native FK228. First, the trans-double bond in the heptenoic acid was replaced by anisosteric amide bond. Second, the ester bond required toform the depsipeptide was replaced by another amide bondfor facile ring closure that provided higher synthetic yieldand increased in vivo stability. As shown in Figure 1(b), the
structure of the FK228 analogue was found to be almostidentical in structure (RMSD = 0.20 A), indicating that thetwo isosteric changes neither disturbed the global structurenor altered the backbone structure compared to FK228.However, these changes enabled facile and rapid synthesisusing readily available starting materials and high-yieldingreactions. While retaining the original stereochemical config-urations, the functional groups R1 and R2 (Figure 1(b)) weresubstituted with a variety of amino acids such as Ala, Leu,Phe, 2-Nal, Thr, Asp, and Lys (Scheme 1) to examine the sidechain consisting of small, large, aromatic, hydrophilic, andcharged alterations.
Twenty FK228 analogues were prepared with high overallyield (75–90%) and purity (80–94%) using the solid-phasesynthetic strategy. To further characterize the compounds,selected FK228 analogues were examined by 2D-NMR spec-troscopy in (dimethyl sulfoxide) DMSOd6 using Double-quantum filtered, total correlation, and rotating frameOverhauser effect spectroscopy to confirm structures andstereochemistry (data not shown). The FK228 analogueswere shown to have outstanding solubility (10 mM) in the
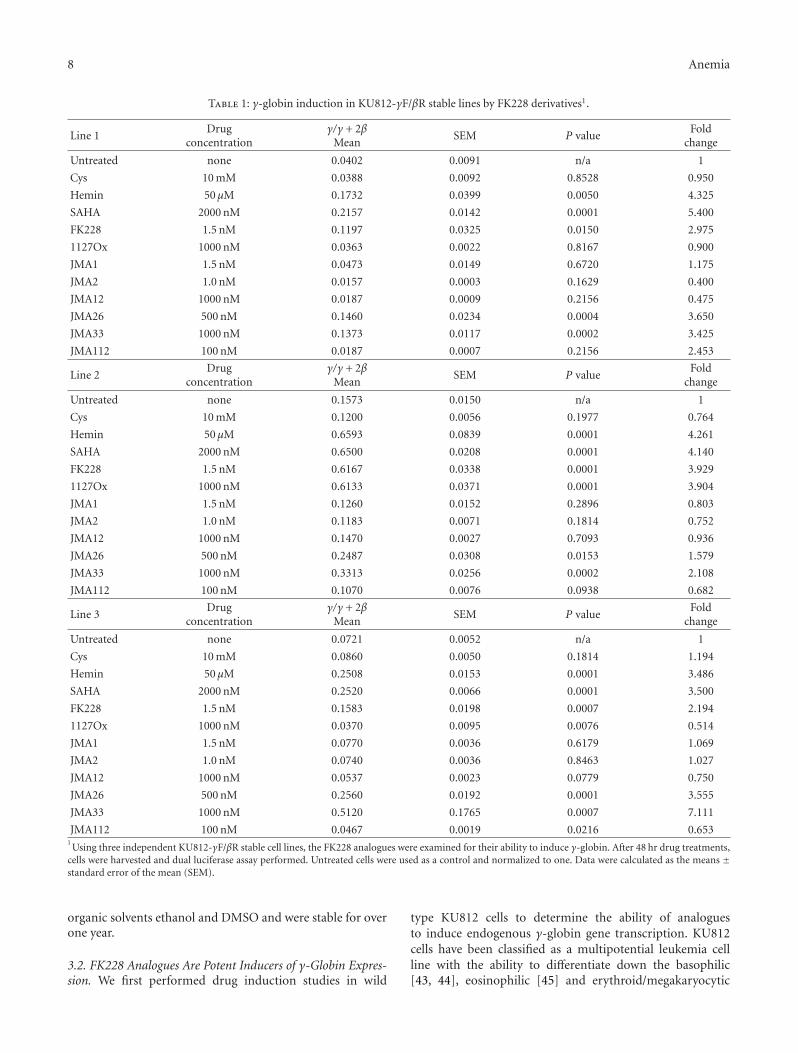
8 Anemia
Table 1: γ-globin induction in KU812-γF/βR stable lines by FK228 derivatives1.
Line 1Drug
concentrationγ/γ + 2β
MeanSEM P value
Foldchange
Untreated none 0.0402 0.0091 n/a 1
Cys 10 mM 0.0388 0.0092 0.8528 0.950
Hemin 50 μM 0.1732 0.0399 0.0050 4.325
SAHA 2000 nM 0.2157 0.0142 0.0001 5.400
FK228 1.5 nM 0.1197 0.0325 0.0150 2.975
1127Ox 1000 nM 0.0363 0.0022 0.8167 0.900
JMA1 1.5 nM 0.0473 0.0149 0.6720 1.175
JMA2 1.0 nM 0.0157 0.0003 0.1629 0.400
JMA12 1000 nM 0.0187 0.0009 0.2156 0.475
JMA26 500 nM 0.1460 0.0234 0.0004 3.650
JMA33 1000 nM 0.1373 0.0117 0.0002 3.425
JMA112 100 nM 0.0187 0.0007 0.2156 2.453
Line 2Drug
concentrationγ/γ + 2β
MeanSEM P value
Foldchange
Untreated none 0.1573 0.0150 n/a 1
Cys 10 mM 0.1200 0.0056 0.1977 0.764
Hemin 50 μM 0.6593 0.0839 0.0001 4.261
SAHA 2000 nM 0.6500 0.0208 0.0001 4.140
FK228 1.5 nM 0.6167 0.0338 0.0001 3.929
1127Ox 1000 nM 0.6133 0.0371 0.0001 3.904
JMA1 1.5 nM 0.1260 0.0152 0.2896 0.803
JMA2 1.0 nM 0.1183 0.0071 0.1814 0.752
JMA12 1000 nM 0.1470 0.0027 0.7093 0.936
JMA26 500 nM 0.2487 0.0308 0.0153 1.579
JMA33 1000 nM 0.3313 0.0256 0.0002 2.108
JMA112 100 nM 0.1070 0.0076 0.0938 0.682
Line 3Drug
concentrationγ/γ + 2β
MeanSEM P value
Foldchange
Untreated none 0.0721 0.0052 n/a 1
Cys 10 mM 0.0860 0.0050 0.1814 1.194
Hemin 50 μM 0.2508 0.0153 0.0001 3.486
SAHA 2000 nM 0.2520 0.0066 0.0001 3.500
FK228 1.5 nM 0.1583 0.0198 0.0007 2.194
1127Ox 1000 nM 0.0370 0.0095 0.0076 0.514
JMA1 1.5 nM 0.0770 0.0036 0.6179 1.069
JMA2 1.0 nM 0.0740 0.0036 0.8463 1.027
JMA12 1000 nM 0.0537 0.0023 0.0779 0.750
JMA26 500 nM 0.2560 0.0192 0.0001 3.555
JMA33 1000 nM 0.5120 0.1765 0.0007 7.111
JMA112 100 nM 0.0467 0.0019 0.0216 0.6531Using three independent KU812-γF/βR stable cell lines, the FK228 analogues were examined for their ability to induce γ-globin. After 48 hr drug treatments,
cells were harvested and dual luciferase assay performed. Untreated cells were used as a control and normalized to one. Data were calculated as the means ±standard error of the mean (SEM).
organic solvents ethanol and DMSO and were stable for overone year.
3.2. FK228 Analogues Are Potent Inducers of γ-Globin Expres-sion. We first performed drug induction studies in wild
type KU812 cells to determine the ability of analoguesto induce endogenous γ-globin gene transcription. KU812cells have been classified as a multipotential leukemia cellline with the ability to differentiate down the basophilic[43, 44], eosinophilic [45] and erythroid/megakaryocytic
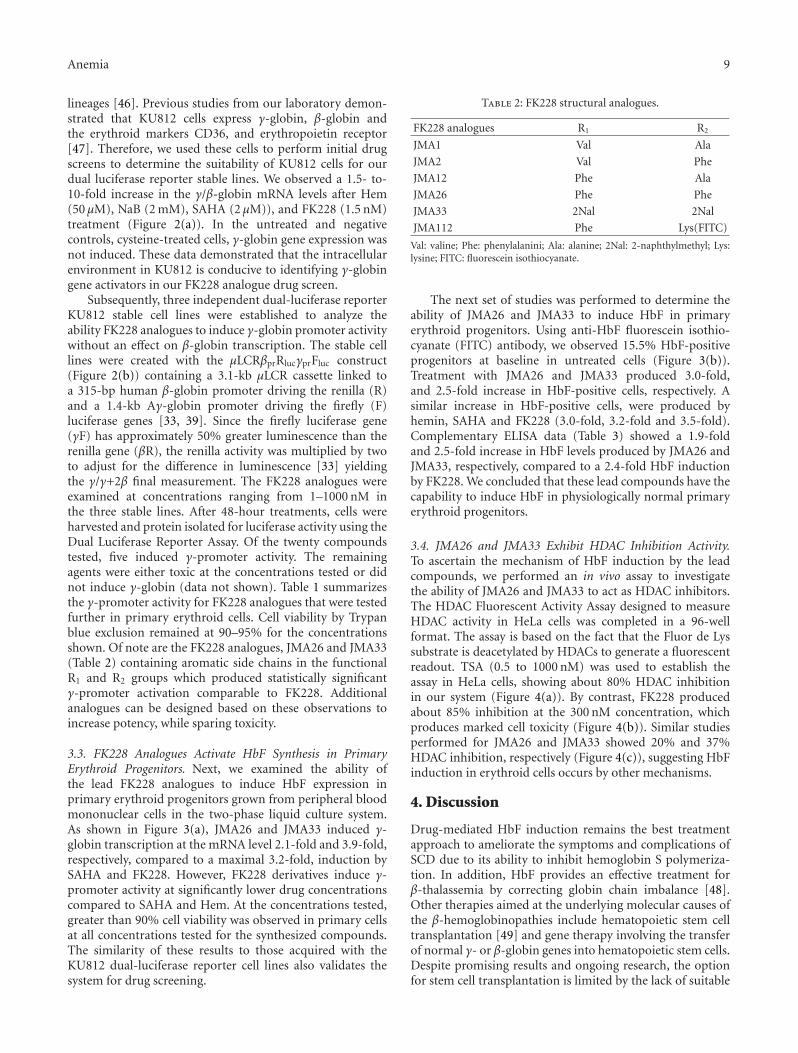
Anemia 9
lineages [46]. Previous studies from our laboratory demon-strated that KU812 cells express γ-globin, β-globin andthe erythroid markers CD36, and erythropoietin receptor[47]. Therefore, we used these cells to perform initial drugscreens to determine the suitability of KU812 cells for ourdual luciferase reporter stable lines. We observed a 1.5- to-10-fold increase in the γ/β-globin mRNA levels after Hem(50 μM), NaB (2 mM), SAHA (2 μM)), and FK228 (1.5 nM)treatment (Figure 2(a)). In the untreated and negativecontrols, cysteine-treated cells, γ-globin gene expression wasnot induced. These data demonstrated that the intracellularenvironment in KU812 is conducive to identifying γ-globingene activators in our FK228 analogue drug screen.
Subsequently, three independent dual-luciferase reporterKU812 stable cell lines were established to analyze theability FK228 analogues to induce γ-globin promoter activitywithout an effect on β-globin transcription. The stable celllines were created with the μLCRβprRlucγprFluc construct(Figure 2(b)) containing a 3.1-kb μLCR cassette linked toa 315-bp human β-globin promoter driving the renilla (R)and a 1.4-kb Aγ-globin promoter driving the firefly (F)luciferase genes [33, 39]. Since the firefly luciferase gene(γF) has approximately 50% greater luminescence than therenilla gene (βR), the renilla activity was multiplied by twoto adjust for the difference in luminescence [33] yieldingthe γ/γ+2β final measurement. The FK228 analogues wereexamined at concentrations ranging from 1–1000 nM inthe three stable lines. After 48-hour treatments, cells wereharvested and protein isolated for luciferase activity using theDual Luciferase Reporter Assay. Of the twenty compoundstested, five induced γ-promoter activity. The remainingagents were either toxic at the concentrations tested or didnot induce γ-globin (data not shown). Table 1 summarizesthe γ-promoter activity for FK228 analogues that were testedfurther in primary erythroid cells. Cell viability by Trypanblue exclusion remained at 90–95% for the concentrationsshown. Of note are the FK228 analogues, JMA26 and JMA33(Table 2) containing aromatic side chains in the functionalR1 and R2 groups which produced statistically significantγ-promoter activation comparable to FK228. Additionalanalogues can be designed based on these observations toincrease potency, while sparing toxicity.
3.3. FK228 Analogues Activate HbF Synthesis in PrimaryErythroid Progenitors. Next, we examined the ability ofthe lead FK228 analogues to induce HbF expression inprimary erythroid progenitors grown from peripheral bloodmononuclear cells in the two-phase liquid culture system.As shown in Figure 3(a), JMA26 and JMA33 induced γ-globin transcription at the mRNA level 2.1-fold and 3.9-fold,respectively, compared to a maximal 3.2-fold, induction bySAHA and FK228. However, FK228 derivatives induce γ-promoter activity at significantly lower drug concentrationscompared to SAHA and Hem. At the concentrations tested,greater than 90% cell viability was observed in primary cellsat all concentrations tested for the synthesized compounds.The similarity of these results to those acquired with theKU812 dual-luciferase reporter cell lines also validates thesystem for drug screening.
Table 2: FK228 structural analogues.
FK228 analogues R1 R2
JMA1 Val Ala
JMA2 Val Phe
JMA12 Phe Ala
JMA26 Phe Phe
JMA33 2Nal 2Nal
JMA112 Phe Lys(FITC)
Val: valine; Phe: phenylalanini; Ala: alanine; 2Nal: 2-naphthylmethyl; Lys:lysine; FITC: fluorescein isothiocyanate.
The next set of studies was performed to determine theability of JMA26 and JMA33 to induce HbF in primaryerythroid progenitors. Using anti-HbF fluorescein isothio-cyanate (FITC) antibody, we observed 15.5% HbF-positiveprogenitors at baseline in untreated cells (Figure 3(b)).Treatment with JMA26 and JMA33 produced 3.0-fold,and 2.5-fold increase in HbF-positive cells, respectively. Asimilar increase in HbF-positive cells, were produced byhemin, SAHA and FK228 (3.0-fold, 3.2-fold and 3.5-fold).Complementary ELISA data (Table 3) showed a 1.9-foldand 2.5-fold increase in HbF levels produced by JMA26 andJMA33, respectively, compared to a 2.4-fold HbF inductionby FK228. We concluded that these lead compounds have thecapability to induce HbF in physiologically normal primaryerythroid progenitors.
3.4. JMA26 and JMA33 Exhibit HDAC Inhibition Activity.To ascertain the mechanism of HbF induction by the leadcompounds, we performed an in vivo assay to investigatethe ability of JMA26 and JMA33 to act as HDAC inhibitors.The HDAC Fluorescent Activity Assay designed to measureHDAC activity in HeLa cells was completed in a 96-wellformat. The assay is based on the fact that the Fluor de Lyssubstrate is deacetylated by HDACs to generate a fluorescentreadout. TSA (0.5 to 1000 nM) was used to establish theassay in HeLa cells, showing about 80% HDAC inhibitionin our system (Figure 4(a)). By contrast, FK228 producedabout 85% inhibition at the 300 nM concentration, whichproduces marked cell toxicity (Figure 4(b)). Similar studiesperformed for JMA26 and JMA33 showed 20% and 37%HDAC inhibition, respectively (Figure 4(c)), suggesting HbFinduction in erythroid cells occurs by other mechanisms.
4. Discussion
Drug-mediated HbF induction remains the best treatmentapproach to ameliorate the symptoms and complications ofSCD due to its ability to inhibit hemoglobin S polymeriza-tion. In addition, HbF provides an effective treatment forβ-thalassemia by correcting globin chain imbalance [48].Other therapies aimed at the underlying molecular causes ofthe β-hemoglobinopathies include hematopoietic stem celltransplantation [49] and gene therapy involving the transferof normal γ- or β-globin genes into hematopoietic stem cells.Despite promising results and ongoing research, the optionfor stem cell transplantation is limited by the lack of suitable

10 Anemia
Table 3: Fetal hemoglobin quantification in primary erythroidcells.
Drugconcentration
Mean SEM P valueFold
change
Untreated none 0.683 0.0291 n/a 1
Cys 10 mM 0.737 0.1201 0.7773 1.079
Hemin 50 μM 1.515 0.0405 0.0001 2.218
SAHA 2000 nM 1.094 0.1049 0.0197 1.602
FK228 1.5 nM 1.676 0.0506 0.0001 2.454
JMA1 1.5 nM 0.7953 0.0849 0.2803 1.164
JMA2 1.0 nM 0.8120 0.0165 0.0183 1.188
JMA26 500 nM 1.3086 0.0535 0.0005 1.916
JMA33 1000 nM 1.7223 0.0725 0.0002 2.521
donors for the majority of SCD patients. On the other hand,gene therapy offers a universal cure but there are concernsabout mutagenesis of target genes due to random vectorintegration and the effects of viral sequences on nearby geneexpression [50]. Therefore, pharmacologic HbF inductionremains a viable choice for the development of additionaltherapeutic options for treating SCD.
Hydroxyurea is the only drug approved by the Foodand Drug Administration for the treatment of SCD [7, 51],however, it is not effective in all patients [7] and of minimalbenefit in β-thalassemia [52]. Moreover, there are concernsabout undesirable side effects including long-term carcino-genesis [53]. Clinical trials with other compounds, suchas arginine butyrate [54] and decitabine [55] have shownconsiderable promise, however, orally active preparationsneed to be developed to make these agents viable treatmentalternatives.
For many years, K562 cells have been used to screen phar-macological agents as potential HbF inducers. For example,NaB, decitabine, and hydroxyurea, among others, stimulateerythroid differentiation in K562 cells and induce γ-globingene transcription [56]. Many HDAC inhibitors includingFK228 are also known to induce HbF. However, syntheticdifficulties associated with FK228 production have severelydeterred structure-activity studies to aid understanding of itsmechanism of action and to improve efficacy. Our data showsthat JMA26 and JMA33 increased HbF levels by a mechanismindependent of HDAC inhibition.
Many published studies have shown that primary ery-throid cells remain the best system to confirm HbF-inducingagents and to serve as a predictor of efficacy in vivo. Humanburst forming units—erythroid cells in clonogenic assays[57] or erythroid progenitors grown in liquid culture [39,41]—have been used to evaluate putative HbF inducers.However, these assays are not easily adaptable to large-scale drug screening, thus immortalized cell lines havebeen investigated for this purpose. Previously, FK228 wastested in the μLCRβprRluc
AγprFluc GM979 stable line [33]and was shown to induce γ-promoter activity at the 1 nMconcentration. We expanded on these studies to establish adual-luciferase reporter system. Thus, we used KU812 cellsderived from an individual with chronic myeloid leukemia
[58] because both γ-globin and β-globin are actively tran-scribed [47]. Moreover, gene profiling data generated byour laboratory showed that KU812 cells express CD36 andthe erythropoietin receptor at levels comparable to day-14human erythroid progenitors [47].
In this study, when wild-type KU812 cells were treatedwith Hem, NaB, SAHA, and FK228, we observed a 3- to10-fold increase in the γ/β-globin ratio. We next testedthe FK228 analogues in the KU812 dual-luciferase reportersystem created with the μLCRβprRluc
AγprFluc construct. TwoFK228 analogues identified in the reporter assay, JMA26 andJMA33, showed efficacy as HbF inducer in primary erythroidprogenitors suggesting these compounds have the potentialfor further development.
Our last set of experiments was aimed at understandingthe mechanism by which JMA26 and JMA33 induce γ-globin. Histone acetylation is a highly dynamic reversiblemodification that contributes to gene expression throughchanges in chromatin conformations. The parent compoundFK228 is a class IV cyclic peptide capable of inhibiting ClassI HDAC enzymes (HDAC1, 2, 3, and 8) after intracellularreduction of its disulfide bond by glutathione to producethe active reduced form of FK228. The functional sulfhydrylgroup fits inside the catalytic pocket producing zinc chelationand inhibition of enzymatic activity [59].
The role of HDAC inhibition in HbF induction has beeninvestigated by several laboratories. NaB was the first agentshown to mediate histone H3 and H4 hyperacetylation asa mechanism of HbF induction [60]. Subsequently, manyother HDAC inhibitors such as TSA [42], scriptaid [28],SBHA (suberohydroxamic acid), and SAHA (suberoylanilidehydroxamic acid) [59] were shown to be HbF inducers basedon the central role of histone hyperacetylation. Subsequently,Perrine and colleagues showed the ability of short-chain fattyacids to induce γ-globin by displacement of an HDAC3-NcoR repressor complex [61]. More recently, there existchemical genetic screen-identified HDAC1 and HDAC2 asmolecular targets facilitating drug-mediated HbF induction[62]. Therefore, to determine the mechanism of action ofJMA26 and JMA33, we completed the HDAC inhibitionassay.
Using the Fluor de Lys system, FK228 produced strongHDAC inhibition but at a higher concentration (300 nM)than required for HbF induction. Similar studies performedfor JMA26 and JMA33 showed 20% and 37% maximalinhibition, respectively. These findings suggest that thealterations in FK228 structure may have uncoupled HDACinhibition activity as the primary mechanism of HbFinduction since higher test drug concentrations did notproduce more HDAC inhibition. These data suggests JMA26and JMA33 may induce γ-globin by mechanisms other thantargeting HDACs. Since the FK228 analogues were developedfrom a structural library designed by molecular modeling,additional compounds can be synthesized with greaterHbF inducing potency and selectivity to Class I HDACs.Additional studies will also be conducted to determine othermechanisms by JMA26 and JMA33 that induce HbF suchas activation of the p38 mitogen-activated protein kinase orother signaling pathways [17, 63, 64].
Anemia 11
5. Conclusions
The current drug treatment options for SCD are limitedwith hydroxyurea being the only FDA-approved drug. Thekey finding of this study is the high-efficiency synthesis ofFK228 analogues with structural modifications which didnot disturb the global chemical structure of the parentcompound. The analogues exhibited HbF induction atnanomolar concentrations in primary erythroid progenitorsdemonstrating physiological relevance. These data supportthe FK228 analogues as potential therapeutic agents andalso validates the KU812 dual-luciferase stable cell linesas an efficacious screening system to identify γ-globinactivators. Long-term our goal is to establish a group of HbFinducers that selectively inhibit Class I HDACs to expand ourunderstanding of epigenetic mechanisms of γ-globin generegulation and to facilitate the development of drug therapyfor SCD.
Acknowledgment
This work was supported by a Grant from the NationalHeart Lung and Blood Institute (R01HL069234; BSP), theFrancis J. Tedesco Distinguished Chair in Pediatric Hematol-ogy/Oncology (BSP), and the Robert A. Welch Foundation(AT-1595; JMA).
References
[1] T. Papayannopoulou, A. Torrealba De Ron, and R. Veith,“Arabinosylcytosine induces fetal hemoglobin in baboons byperturbing erythroid cell differentiation kinetics,” Science, vol.224, no. 4649, pp. 617–619, 1984.
[2] D. P. Liu, C. C. Liang, Z. H. Ao et al., “Treatment of severeβ-thalassemia (patients) with myleran,” American Journal ofHematology, vol. 33, no. 1, pp. 50–55, 1990.
[3] R. Veith, T. Papayannopoulou, S. Kurachi, and G. Stamatoy-annopoulos, “Treatment of baboon with vinblastine: insightsinto the mechanisms of pharmacologic stimulation of hb f inthe adult,” Blood, vol. 66, no. 2, pp. 456–459, 1985.
[4] R. Galanello, G. Stamatoyannopoulos, and PapayannopoulouTh., “Mechanism of hb f stimulation by s-stage compounds. invitro studies with bone marrow cells exposed to 5-azacytidine,ara-c, or hydroxyurea,” Journal of Clinical Investigation, vol. 81,no. 4, pp. 1209–1216, 1988.
[5] N. L. Letvin, D. C. Linch, and G. P. Beardsley, “Augmenta-tion of fetal-hemoglobin production in anemic monkeys byhydroxyurea,” New England Journal of Medicine, vol. 310, no.14, pp. 869–873, 1984.
[6] M. H. Steinberg, F. Barton, O. Castro et al., “Effect ofhydroxyurea on mortality and morbidity in adult sickle cellanemia: risks and benefits up to 9 years of treatment,” Journalof the American Medical Association, vol. 289, no. 13, pp. 1645–1651, 2003.
[7] S. Charache, M. L. Terrin, R. D. Moore et al., “Effect ofhydroxyurea on the frequency of painful crises in sickle cellanemia. Investigators of the Multicenter Study of Hydroxyureain Sickle Cell Anemia,” The New England Journal of Medicine,vol. 332, pp. 1317–1322, 1995.
[8] M. H. Steinberg, Z. H. Lu, F. B. Barton, M. L. Terrin, S.Charache, and G. J. Dover, “Fetal hemoglobin in sickle cell
anemia: determinants of response to hydroxyurea,” Blood, vol.89, no. 3, pp. 1078–1088, 1997.
[9] X. De La Cruz, S. Lois, S. Sanchez-Molina, and M. A.Martınez-Balbas, “Do protein motifs read the histone code?”Bioessays, vol. 27, no. 2, pp. 164–175, 2005.
[10] P. A. Marks and X. Jiang, “Histone deacetylase inhibitors inprogrammed cell death and cancer therapy,” Cell Cycle, vol. 4,no. 4, pp. 549–551, 2005.
[11] C. Monneret, “Histone deacetylase inhibitors,” European Jour-nal of Medicinal Chemistry, vol. 40, no. 1, pp. 1–13, 2005.
[12] K. N. Prasad, “Butyric acid: a small fatty acid with diversebiological functions,” Life Sciences, vol. 27, no. 15, pp. 1351–1358, 1980.
[13] A. E. Smith, P. J. Hurd, A. J. Bannister, T. Kouzarides, andK. G. Ford, “Heritable gene repression through the action ofa directed dna methyltransferase at a chromosomal locus,”Journal of Biological Chemistry, vol. 283, no. 15, pp. 9878–9885, 2008.
[14] S. D. Gore and M. A. Carducci, “Modifying histones totame cancer: clinical development of sodium phenylbutyrateand other histone deacetylase inhibitors,” Expert Opinion onInvestigational Drugs, vol. 9, no. 12, pp. 2923–2934, 2000.
[15] T. Yamashita, H. Wakao, A. Miyajima, and S. Asano, “Differ-entiation inducers modulate cytokine signaling pathways in amurine erythroleukemia cell line,” Cancer Research, vol. 58, no.3, pp. 556–561, 1998.
[16] O. Witt, K. Sand, and A. Pekrun, “Butyrate-induced erythroiddifferentiation of human k562 leukemia cells involves inhibi-tion of erk and activation of p38 map kinase pathways,” Blood,vol. 95, no. 7, pp. 2391–2396, 2000.
[17] B. S. Pace, X. H. Qian, J. Sangerman et al., “P38 map kinaseactivation mediates γ-globin gene induction in erythroidprogenitors,” Experimental Hematology, vol. 31, no. 11, pp.1089–1096, 2003.
[18] S. Torkelson, B. White, D. V. Faller, K. Phipps, C. Pantazis,and S. P. Perrine, “Erythroid progenitor proliferation isstimulated by phenoxyacetic and phenylalkyl acids,” BloodCells, Molecules, and Diseases, vol. 22, no. 2, pp. 150–158, 1996.
[19] G. J. Dover, S. Brusilow, and S. Charache, “Induction of fetalhemoglobin production in subjects with sickle cell anemia byoral sodium phenylbutyrate,” Blood, vol. 84, no. 1, pp. 339–343, 1994.
[20] E. Liakopoulou, C. A. Blau, Q. Li et al., “Stimulation of fetalhemoglobin production by short chain fatty acids,” Blood, vol.86, no. 8, pp. 3227–3235, 1995.
[21] N. Tsuji, M. Kobayashi, and K. Nagashima, “A new antifungalantibiotic, trichostatin,” Journal of Antibiotics, vol. 29, no. 1,pp. 1–6, 1976.
[22] M. Yoshida, M. Kijima, M. Akita, and T. Beppu, “Potent andspecific inhibition of mammalian histone deacetylase bothin vivo and in vitro by trichostatin a,” Journal of BiologicalChemistry, vol. 265, no. 28, pp. 17174–17179, 1990.
[23] M. S. Finnin, J. R. Donigian, A. Cohen et al., “Structures ofa histone deacetylase homologue bound to the tsa and sahainhibitors,” Nature, vol. 401, no. 6749, pp. 188–193, 1999.
[24] V. M. Richon, S. Emiliani, E. Verdin et al., “A class of hybridpolar inducers of transformed cell differentiation inhibitshistone deacetylases,” Proceedings of the National Academy ofSciences of the United States of America, vol. 95, no. 6, pp. 3003–3007, 1998.
[25] L. M. Butler, D. B. Agus, H. I. Scher et al., “Suberoylanilidehydroxamic acid, an inhibitor of histone deacetylase, sup-presses the growth of prostate cancer cells in vitro and in vivo,”Cancer Research, vol. 60, no. 18, pp. 5165–5170, 2000.
12 Anemia
[26] P. A. Marks, V. M. Richon, R. Breslow, and R. A. Rifkind,“Histone deacetylase inhibitors as new cancer drugs,” CurrentOpinion in Oncology, vol. 13, no. 6, pp. 477–483, 2001.
[27] H. Ueda, H. Nakajima, Y. Hori et al., “Fr901228, a novel anti-tumor bicyclic depsipeptide produced by chromobacteriumviolaceum no. 968. i. taxonomy, fermentation, isolation,physico-chemical and biological properties, and antitumoractivity,” Journal of Antibiotics, vol. 47, no. 3, pp. 301–310,1994.
[28] J. Johnson, R. Hunter, R. McElveen, X. H. Qian, B. S. Baliga,and B. S. Pace, “Fetal hemoglobin induction by the histonedeacetylase inhibitor, scriptaid,” Cellular and Molecular Biol-ogy, vol. 51, no. 2, pp. 229–238, 2005.
[29] R. Furumai, A. Matsuyama, N. Kobashi et al., “Fk228 (dep-sipeptide) as a natural prodrug that inhibits class i histonedeacetylases,” Cancer Research, vol. 62, no. 17, pp. 4916–4921,2002.
[30] J. J. Xiao, J. Byrd, G. Marcucci, M. Grever, and K. K. Chan,“Identification of thiols and glutathione conjugates of dep-sipeptide fk228 (fr901228), a novel histone protein deacetylaseinhibitor, in the blood,” Rapid Communications in MassSpectrometry, vol. 17, no. 8, pp. 757–766, 2003.
[31] H. Kosugi, M. Ito, Y. Yamamoto et al., “In vivo effects of ahistone deacetylase inhibitor, fk228, on human acute promye-locytic leukemia in nod/shi-scid/scid mice,” Japanese Journalof Cancer Research, vol. 92, no. 5, pp. 529–536, 2001.
[32] K. A. Fecteau, M. E. I. Jianxun, and H. C. Wang, “Differentialmodulation of signaling pathways and apoptosis of ras-transformed 10t1/2 cells by the depsipeptide fr901228,” Jour-nal of Pharmacology and Experimental Therapeutics, vol. 300,no. 3, pp. 890–899, 2002.
[33] H. Cao and G. Stamatoyannopoulos, “Histone deacetylaseinhibitor fk228 is a potent inducer of human fetal hemo-globin,” American Journal of Hematology, vol. 81, no. 12, pp.981–983, 2006.
[34] K. W. Li, J. Wu, W. Xing, and J. A. Simon, “Total synthesis ofthe antitumor depsipeptide fr-901,228,” Journal of the Ameri-can Chemical Society, vol. 118, no. 30, pp. 7237–7238, 1996.
[35] T. J. Greshock, D. M. Johns, Y. Noguchi, and R. M. Williams,“Improved total synthesis of the potent hdac inhibitor FK228(FK-901228),” Organic Letters, vol. 10, no. 4, pp. 613–616,2008.
[36] A. A. Bowers, T. J. Greshook, N. West et al., “Synthesis andconformation-activity relationships of the peptide isosteres offk228 and largazole,” Journal of the American Chemical Society,vol. 131, no. 8, pp. 2900–2905, 2009.
[37] S. Di Maro, R. C. Pong, J. T. Hsieh, and J. M. Ahn, “Efficientsolid-phase synthesis of fk228 analogues as potent antitumoralagents,” Journal of Medicinal Chemistry, vol. 51, no. 21, pp.6639–6641, 2008.
[38] K. J. Jensen, J. Alsina, M. F. Songster, J. Vagner, F. Albericio,and G. Barany, “Backbone amide linker (BAL) strategyfor solid-phase synthesis of c-terminal-modified and cyclicpeptides,” Journal of the American Chemical Society, vol. 120,no. 22, pp. 5441–5452, 1998.
[39] E. Skarpidi, G. Vassilopoulos, Q. Li, and G. Stamatoyannopou-los, “Novel in vitro assay for the detection of pharmacologicinducers of fetal hemoglobin,” Blood, vol. 96, no. 1, pp. 321–326, 2000.
[40] C. Y. Gui and A. Dean, “Acetylation of a specific promoternucleosome accompanies activation of the ε-globin gene byβ-globin locus control region HS2,” Molecular and CellularBiology, vol. 21, no. 4, pp. 1155–1163, 2001.
[41] E. Fibach, L. P. Burke, A. N. Schechter, C. T. Noguchi, and G. P.Rodgers, “Hydroxyurea increases fetal hemoglobin in culturederythroid cells derived from normal individuals and patientswith sickle cell anemia or β- thalassemia,” Blood, vol. 81, no. 6,pp. 1630–1635, 1993.
[42] J. Sangerman, S. L. Moo, X. Yao et al., “Mechanism forfetal hemoglobin induction by histone deacetylase inhibitorsinvolves γ-globin activation by creb1 and atf-2,” Blood, vol.108, no. 10, pp. 3590–3599, 2006.
[43] T. Fukuda, K. Kishi, Y. Ohnishi, and A. Shibata, “Bipotentialcell differentiation of ku-812: evidence of a hybrid cell line thatdifferentiates into basophils and macrophage-like cells,” Blood,vol. 70, no. 3, pp. 612–619, 1987.
[44] K. Kishi, “A new leukemia cell line with Philadelphia chro-mosome characterized as basophil precursors,” LeukemiaResearch, vol. 9, no. 3, pp. 381–390, 1985.
[45] M. Yamashita, A. Ichikawa, Y. Katakura et al., “Inductionof basophilic and eosinophilic differentiation in the humanleukemic cell line ku812,” Cytotechnology, vol. 36, no. 1–3, pp.179–186, 2001.
[46] M. Nakazawa, M. T. Mitjavila, N. Debili et al., “Ku 812: apluripotent human cell line with spontaneous erythroid ter-minal maturation,” Blood, vol. 73, no. 7, pp. 2003–2013, 1989.
[47] S. Zein, W. Li, V. Ramakrishnan et al., “Identification offetal hemoglobin-inducing agents using the human leukemiaku812 cell line,” Experimental Biology and Medicine, vol. 235,no. 11, pp. 1385–1394, 2010.
[48] D. G. Nathan and R. B. Gunn, “Thalassemia: the consequencesof unbalanced hemoglobin synthesis,” the American Journal ofMedicine, vol. 41, no. 5, pp. 815–830, 1966.
[49] M. Bhatia and M. C. Walters, “Hematopoietic cell transplan-tation for thalassemia and sickle cell disease: past, present andfuture,” Bone Marrow Transplantation, vol. 41, no. 2, pp. 109–117, 2008.
[50] C. E. Dunbar, “The yin and yang of stem cell gene therapy:insights into hematopoiesis, leukemogenesis, and gene therapysafety,” Hematology/the Education Program of the AmericanSociety of Hematology. American Society of Hematology. Edu-cation Program, pp. 460–465, 2007.
[51] M. H. Steinberg, Z. H. Lu, F. B. Barton, M. L. Terrin, S.Charache, and G. J. Dover, “Fetal hemoglobin in sickle cellanemia: determinants of response to hydroxyurea,” Blood, vol.89, no. 3, pp. 1078–1088, 1997.
[52] H. Fathallah, M. Sutton, and G. F. Atweh, “Pharmacologicalinduction of fetal hemoglobin: why haven’t we been moresuccessful in thalassemia?” Annals of the New York Academy ofSciences, vol. 1054, pp. 228–237, 2005.
[53] S. C. Davies and A. Gilmore, “The role of hydroxyurea in themanagement of sickle cell disease,” Blood Reviews, vol. 17, no.2, pp. 99–109, 2003.
[54] G. F. Atweh, M. Sutton, I. Nassif et al., “Sustained inductionof fetal hemoglobin by pulse butyrate therapy in sickle celldisease,” Blood, vol. 93, no. 6, pp. 1790–1797, 1999.
[55] Y. Saunthararajah, R. Molokie, S. Saraf et al., “Clinicaleffectiveness of decitabine in severe sickle cell disease,” BritishJournal of Haematology, vol. 141, no. 1, pp. 126–129, 2008.
[56] R. Mabaera, R. J. West, S. J. Conine et al., “A cell stresssignaling model of fetal hemoglobin induction: what doesn’tkill red blood cells may make them stronger,” ExperimentalHematology, vol. 36, no. 9, pp. 1057–1072, 2008.
[57] P. Constantoulakis, G. Knitter, and G. Stamatoyannopoulos,“On the induction of fetal hemoglobin by butyrates: in vivoand in vitro studies with sodium butyrate and comparison of
Anemia 13
combination treatments with 5-AZAC and ARAC,” Blood, vol.74, no. 6, pp. 1963–1971, 1989.
[58] A. Goga, J. McLaughlin, D. E. H. Afar, D. C. Saffran, andO. N. Witte, “Alternative signals to ras for hematopoietictransformation by the bcr- abl oncogene,” Cell, vol. 82, no. 6,pp. 981–988, 1995.
[59] R. Furumai, A. Matsuyama, N. Kobashi et al., “FK228 (dep-sipeptide) as a natural prodrug that inhibits class i histonedeacetylases,” Cancer Research, vol. 62, no. 17, pp. 4916–4921,2002.
[60] H. Fathallah, R. S. Weinberg, Y. Galperin, M. Sutton, and G.F. Atweh, “Role of epigenetic modifications in normal globingene regulation and butyrate-mediated induction of fetalhemoglobin,” Blood, vol. 110, no. 9, pp. 3391–3397, 2007.
[61] R. Mankidy, D. V. Faller, R. Mabaera et al., “Short-chain fattyacids induce γ-globin gene expression by displacement of ahdac3-ncor repressor complex,” Blood, vol. 108, no. 9, pp.3179–3186, 2006.
[62] J. E. Bradner, R. Mak, S. K. Tanguturi et al., “Chemical geneticstrategy identifies histone deacetylase 1 (HDAC1) and HDAC2as therapeutic targets in sickle cell disease,” Proceedings of theNational Academy of Sciences of the United States of America,vol. 107, no. 28, pp. 12617–12622, 2010.
[63] O. Witt, K. Sand, and A. Pekrun, “Butyrate-induced erythroiddifferentiation of human k562 leukemia cells involves inhi-bition of ERK and activation of p38 map kinase pathways,”Blood, vol. 95, no. 7, pp. 2391–2396, 2000.
[64] O. Witt, S. Monkemeyer, K. Kanbach, and A. Pekrun, “Induc-tion of fetal hemoglobin synthesis by valproate: modulationof mapkinase pathways,” American Journal of Hematology, vol.71, no. 1, pp. 45–46, 2002.
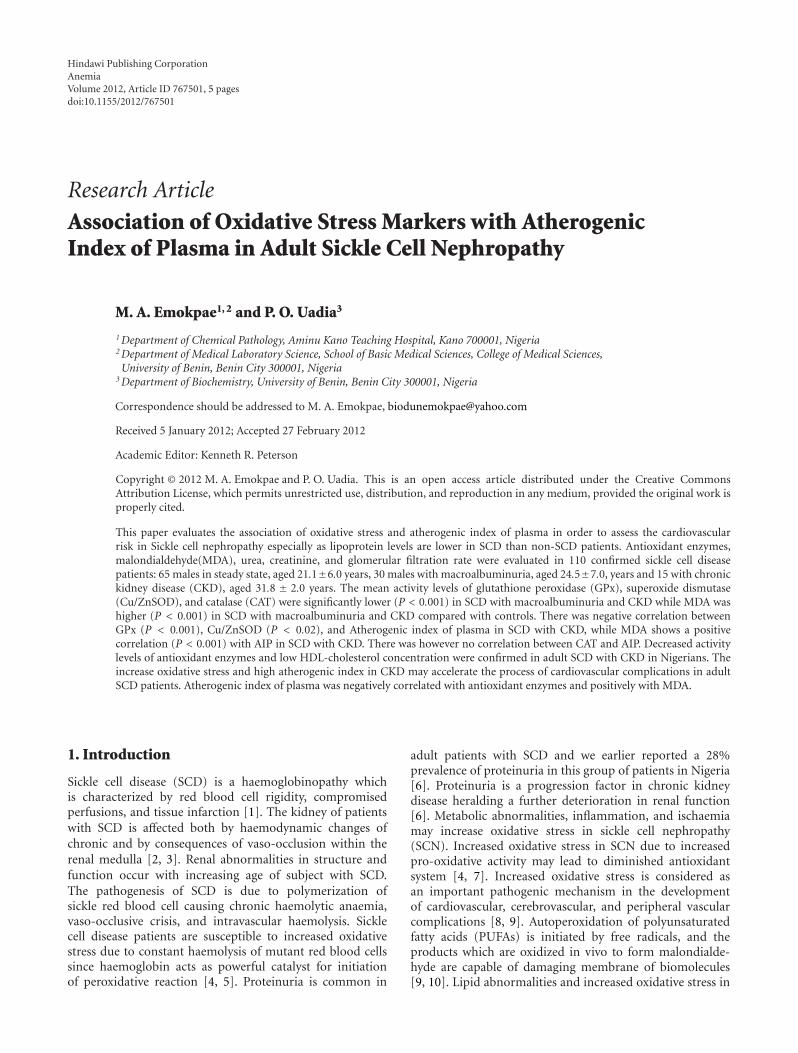
Hindawi Publishing CorporationAnemiaVolume 2012, Article ID 767501, 5 pagesdoi:10.1155/2012/767501
Research Article
Association of Oxidative Stress Markers with AtherogenicIndex of Plasma in Adult Sickle Cell Nephropathy
M. A. Emokpae1, 2 and P. O. Uadia3
1 Department of Chemical Pathology, Aminu Kano Teaching Hospital, Kano 700001, Nigeria2 Department of Medical Laboratory Science, School of Basic Medical Sciences, College of Medical Sciences,University of Benin, Benin City 300001, Nigeria
3 Department of Biochemistry, University of Benin, Benin City 300001, Nigeria
Correspondence should be addressed to M. A. Emokpae, [email protected]
Received 5 January 2012; Accepted 27 February 2012
Academic Editor: Kenneth R. Peterson
Copyright © 2012 M. A. Emokpae and P. O. Uadia. This is an open access article distributed under the Creative CommonsAttribution License, which permits unrestricted use, distribution, and reproduction in any medium, provided the original work isproperly cited.
This paper evaluates the association of oxidative stress and atherogenic index of plasma in order to assess the cardiovascularrisk in Sickle cell nephropathy especially as lipoprotein levels are lower in SCD than non-SCD patients. Antioxidant enzymes,malondialdehyde(MDA), urea, creatinine, and glomerular filtration rate were evaluated in 110 confirmed sickle cell diseasepatients: 65 males in steady state, aged 21.1±6.0 years, 30 males with macroalbuminuria, aged 24.5±7.0, years and 15 with chronickidney disease (CKD), aged 31.8 ± 2.0 years. The mean activity levels of glutathione peroxidase (GPx), superoxide dismutase(Cu/ZnSOD), and catalase (CAT) were significantly lower (P < 0.001) in SCD with macroalbuminuria and CKD while MDA washigher (P < 0.001) in SCD with macroalbuminuria and CKD compared with controls. There was negative correlation betweenGPx (P < 0.001), Cu/ZnSOD (P < 0.02), and Atherogenic index of plasma in SCD with CKD, while MDA shows a positivecorrelation (P < 0.001) with AIP in SCD with CKD. There was however no correlation between CAT and AIP. Decreased activitylevels of antioxidant enzymes and low HDL-cholesterol concentration were confirmed in adult SCD with CKD in Nigerians. Theincrease oxidative stress and high atherogenic index in CKD may accelerate the process of cardiovascular complications in adultSCD patients. Atherogenic index of plasma was negatively correlated with antioxidant enzymes and positively with MDA.
1. Introduction
Sickle cell disease (SCD) is a haemoglobinopathy whichis characterized by red blood cell rigidity, compromisedperfusions, and tissue infarction [1]. The kidney of patientswith SCD is affected both by haemodynamic changes ofchronic and by consequences of vaso-occlusion within therenal medulla [2, 3]. Renal abnormalities in structure andfunction occur with increasing age of subject with SCD.The pathogenesis of SCD is due to polymerization ofsickle red blood cell causing chronic haemolytic anaemia,vaso-occlusive crisis, and intravascular haemolysis. Sicklecell disease patients are susceptible to increased oxidativestress due to constant haemolysis of mutant red blood cellssince haemoglobin acts as powerful catalyst for initiationof peroxidative reaction [4, 5]. Proteinuria is common in
adult patients with SCD and we earlier reported a 28%prevalence of proteinuria in this group of patients in Nigeria[6]. Proteinuria is a progression factor in chronic kidneydisease heralding a further deterioration in renal function[6]. Metabolic abnormalities, inflammation, and ischaemiamay increase oxidative stress in sickle cell nephropathy(SCN). Increased oxidative stress in SCN due to increasedpro-oxidative activity may lead to diminished antioxidantsystem [4, 7]. Increased oxidative stress is considered asan important pathogenic mechanism in the developmentof cardiovascular, cerebrovascular, and peripheral vascularcomplications [8, 9]. Autoperoxidation of polyunsaturatedfatty acids (PUFAs) is initiated by free radicals, and theproducts which are oxidized in vivo to form malondialde-hyde are capable of damaging membrane of biomolecules[9, 10]. Lipid abnormalities and increased oxidative stress in
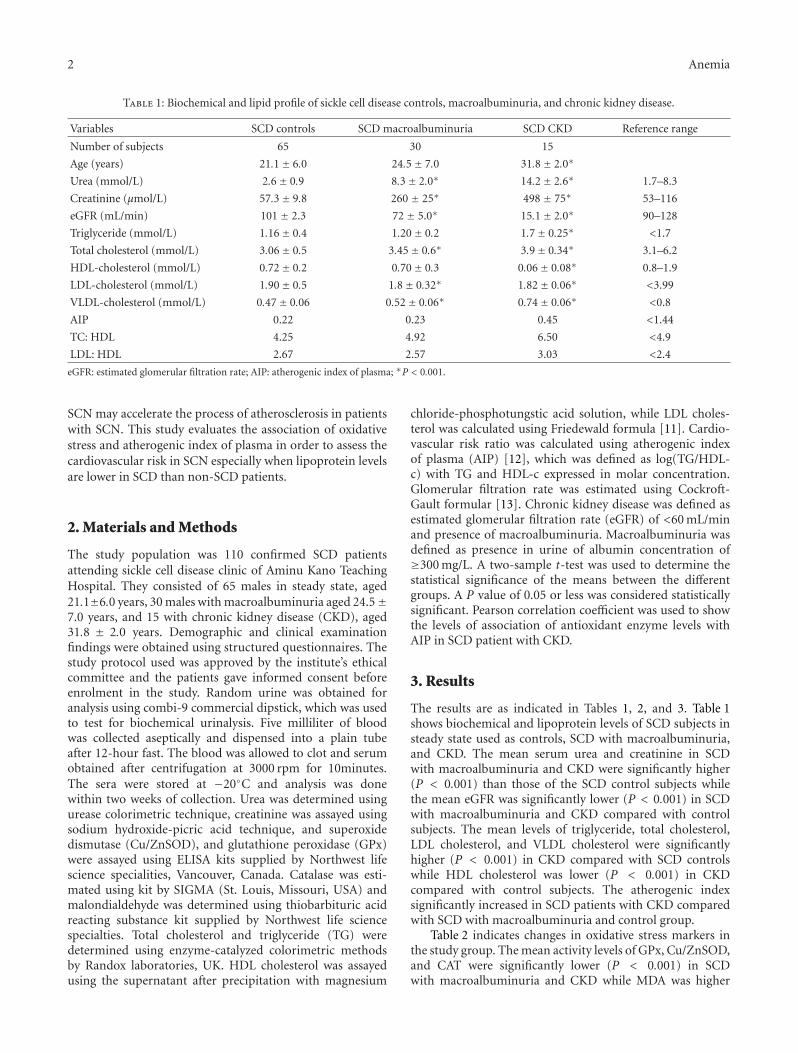
2 Anemia
Table 1: Biochemical and lipid profile of sickle cell disease controls, macroalbuminuria, and chronic kidney disease.
Variables SCD controls SCD macroalbuminuria SCD CKD Reference range
Number of subjects 65 30 15
Age (years) 21.1± 6.0 24.5± 7.0 31.8± 2.0∗
Urea (mmol/L) 2.6± 0.9 8.3± 2.0∗ 14.2± 2.6∗ 1.7–8.3
Creatinine (µmol/L) 57.3± 9.8 260 ± 25∗ 498 ± 75∗ 53–116
eGFR (mL/min) 101 ± 2.3 72 ± 5.0∗ 15.1± 2.0∗ 90–128
Triglyceride (mmol/L) 1.16± 0.4 1.20± 0.2 1.7± 0.25∗ <1.7
Total cholesterol (mmol/L) 3.06± 0.5 3.45± 0.6∗ 3.9± 0.34∗ 3.1–6.2
HDL-cholesterol (mmol/L) 0.72± 0.2 0.70± 0.3 0.06± 0.08∗ 0.8–1.9
LDL-cholesterol (mmol/L) 1.90± 0.5 1.8± 0.32∗ 1.82± 0.06∗ <3.99
VLDL-cholesterol (mmol/L) 0.47± 0.06 0.52± 0.06∗ 0.74± 0.06∗ <0.8
AIP 0.22 0.23 0.45 <1.44
TC: HDL 4.25 4.92 6.50 <4.9
LDL: HDL 2.67 2.57 3.03 <2.4
eGFR: estimated glomerular filtration rate; AIP: atherogenic index of plasma; ∗P < 0.001.
SCN may accelerate the process of atherosclerosis in patientswith SCN. This study evaluates the association of oxidativestress and atherogenic index of plasma in order to assess thecardiovascular risk in SCN especially when lipoprotein levelsare lower in SCD than non-SCD patients.
2. Materials and Methods
The study population was 110 confirmed SCD patientsattending sickle cell disease clinic of Aminu Kano TeachingHospital. They consisted of 65 males in steady state, aged21.1±6.0 years, 30 males with macroalbuminuria aged 24.5±7.0 years, and 15 with chronic kidney disease (CKD), aged31.8 ± 2.0 years. Demographic and clinical examinationfindings were obtained using structured questionnaires. Thestudy protocol used was approved by the institute’s ethicalcommittee and the patients gave informed consent beforeenrolment in the study. Random urine was obtained foranalysis using combi-9 commercial dipstick, which was usedto test for biochemical urinalysis. Five milliliter of bloodwas collected aseptically and dispensed into a plain tubeafter 12-hour fast. The blood was allowed to clot and serumobtained after centrifugation at 3000 rpm for 10minutes.The sera were stored at −20◦C and analysis was donewithin two weeks of collection. Urea was determined usingurease colorimetric technique, creatinine was assayed usingsodium hydroxide-picric acid technique, and superoxidedismutase (Cu/ZnSOD), and glutathione peroxidase (GPx)were assayed using ELISA kits supplied by Northwest lifescience specialities, Vancouver, Canada. Catalase was esti-mated using kit by SIGMA (St. Louis, Missouri, USA) andmalondialdehyde was determined using thiobarbituric acidreacting substance kit supplied by Northwest life sciencespecialties. Total cholesterol and triglyceride (TG) weredetermined using enzyme-catalyzed colorimetric methodsby Randox laboratories, UK. HDL cholesterol was assayedusing the supernatant after precipitation with magnesium
chloride-phosphotungstic acid solution, while LDL choles-terol was calculated using Friedewald formula [11]. Cardio-vascular risk ratio was calculated using atherogenic indexof plasma (AIP) [12], which was defined as log(TG/HDL-c) with TG and HDL-c expressed in molar concentration.Glomerular filtration rate was estimated using Cockroft-Gault formular [13]. Chronic kidney disease was defined asestimated glomerular filtration rate (eGFR) of <60 mL/minand presence of macroalbuminuria. Macroalbuminuria wasdefined as presence in urine of albumin concentration of≥300 mg/L. A two-sample t-test was used to determine thestatistical significance of the means between the differentgroups. A P value of 0.05 or less was considered statisticallysignificant. Pearson correlation coefficient was used to showthe levels of association of antioxidant enzyme levels withAIP in SCD patient with CKD.
3. Results
The results are as indicated in Tables 1, 2, and 3. Table 1shows biochemical and lipoprotein levels of SCD subjects insteady state used as controls, SCD with macroalbuminuria,and CKD. The mean serum urea and creatinine in SCDwith macroalbuminuria and CKD were significantly higher(P < 0.001) than those of the SCD control subjects whilethe mean eGFR was significantly lower (P < 0.001) in SCDwith macroalbuminuria and CKD compared with controlsubjects. The mean levels of triglyceride, total cholesterol,LDL cholesterol, and VLDL cholesterol were significantlyhigher (P < 0.001) in CKD compared with SCD controlswhile HDL cholesterol was lower (P < 0.001) in CKDcompared with control subjects. The atherogenic indexsignificantly increased in SCD patients with CKD comparedwith SCD with macroalbuminuria and control group.
Table 2 indicates changes in oxidative stress markers inthe study group. The mean activity levels of GPx, Cu/ZnSOD,and CAT were significantly lower (P < 0.001) in SCDwith macroalbuminuria and CKD while MDA was higher

Anemia 3
Table 2: Oxidative stress markers of sickle cell disease control, macroalbuminuria, and chronic kidney disease.
Oxidative markers SCD controlsSCD with
macroalbuminuriaSCD with chronic
kidney diseaseReference range
Number of subjects 65 30 15
Glutathione peroxidase (mU/mL) 9.2± 0.9 5.54± 3.5∗ 3.01± 0.24∗ 9.2–19.6
Superoxide dismutase (ng/mL) 30.6± 5.1 21.3± 5.2∗ 18.5± 2.6∗ 22.5–103
Catalase (µmol/min/L) 154 ± 7.9 150 ± 2.58 147 ± 1.06∗ 156–182
Malondialdehyde (µmol/L) 2.5± 0.4 3.8± 1.7∗ 5.30± 0.3∗ 0.025–0.98∗P < 0.001.
Table 3: Correlation between antioxidant enzymes and atherogenicindex of plasma in SCD with chronic kidney disease.
Correlation between parameters R value P value
GPx and AIP −0.760 0.001
Cu/ZnSOD and AIP −0.621 0.02
CAT and AIP −0.416 NS
MDA and AIP 0.943 0.001
GPx: Glutathione peroxidase; Cu/ZnSOD: Superoxide Dismutase; CAT:Catalase and MDA: Malondialdehyde.
(P < 0.001) in SCD with macroalbuminuria and CKDcompared with controls.
Table 3 shows the levels of association of antioxidantmarkers with AIP in SCD with CKD. There were negativecorrelations between GPx (P < 0.001), Cu/ZnSOD (P <0.02), and AIP in SCD with CKD, while MDA shows apositive correlation (P < 0.001) with AIP in SCD withCKD. The correlation between CAT and AIP was howevernot significant.
4. Discussion
The data showed that there were increases in oxidative stressand lipoprotein levels in SCD patients with macroalbumin-uria and CKD. Atherogenic index of plasma was negativelycorrelated with antioxidant enzymes and positively withMDA in CKD. Studies have shown decreases in the activitylevels of antioxidant enzymes in SCD patients in steady state[4] and in non-SCD patients with acute renal failure [14].The present study associated the decreases in the antioxidantenzyme activity levels with AIP, used as cardiovascular risk,especially as lipoprotein levels in SCD patients are lowerthan non-SCD individuals in both normal and renal disease.In this study, we observed increased oxidative stress inSCD patients with CKD. Oxidative damage is due to redoximbalance between production of reactive oxygen species(ROS) and the countering effects of the various antioxidantsin the body. The increased production of ROS in SCD canbe grossly amplified in response to a variety of pathophysio-logical conditions including renal disorders, inflammation,immunologic disorders, hypoxia, metabolism of drugs oralcohol, and deficiency in antioxidant enzymes [1, 4, 15].Reactive oxygen species can cause significant damage tobiomolecules since membrane lipids readily react with ROSresulting in lipid peroxidation [16–18]. Increased oxidative
stress has been reported to mediate most of the risk factorsinvolved in kidney disease [19]. Free radical mediated injuryis the primary event leading to renal injury and progressiverenal insufficiency and may lead to increased levels of lipidperoxidation. This occurs because cell membrane containslarge quantity of PUFAs. These PUFAs react with ROS toform peroxide derivatives [20, 21]. Oxidative damage mayalter both structure and function of the glomerulus due toits effects on mesangial and endothelial cells. Overexpressionof ROS by both enzymatic and nonenzymatic pathways(Fenton chemistry) promotes intravascular oxidant stressthat can disrupt nitric oxide homeostasis and produce thehighly oxidative peroxynitrite [22]. Previous reports haveshowed that renal disease in SCD has the capacity to diminisharginine bioavailability through the loss of de novo argininesynthesis from citrulline which occurs primarily in thekidneys. Renal insufficiency may impair the major route forendogenous arginine biosynthesis [23] since it plays someroles in the regulation of nitric oxide production [24]. Adultswith SCD are arginine deficient even at steady state [25, 26].
The observed increases (P < 0.001) in the levels ofserum triglyceride, LDL, VLDL, and decrease (P < 0.001)of HDL-cholesterol levels in SCD patients with CKD areconsistent with other studies elsewhere and in Nigeria [27–30]. The lipid profile of SCD patients is quite lower thanthat in subjects with normal haemoglobin and SCD patientsin Nigeria have even lower levels than SCD patients inAmerica and the Middle East [27–29]. Several reasons havebeen proposed as to why there are inconsistencies betweenlipid studies; these include differences in age, diet, weight,smoking, gender, small sample sizes, different ranges ofdisease severity, and treatment regimen [31–33]. Shores etal. [28] proposed the reasons why lipoprotein levels arelower in SCD than nonSCD even in the same environmentalcondition to be partly due to a decrease in red blood cellvolume leading to a dilution effect on plasma constituents.It may also result from strong downregulation of thesynthetic pathways or downregulation of the enzymes in lipidbiosynthesis. Others suggested that it is the haemolytic stressin SCD patients that is associated with a significant reductionin plasma lipids in SCD patients [29, 34].
5. Conclusion
Decreased activity levels of antioxidant enzymes and lowHDL-cholesterol concentration were confirmed in adultSCD with CKD in Nigerians. The increase oxidative stress
4 Anemia
and high atherogenic index in CKD may accelerate the pro-cess of cardiovascular complications in adult SCD patients.Atherogenic index of plasma was negatively correlated withantioxidant enzymes and positively with MDA.
References
[1] M. A. Emokpae, P. O. Uadia, and A. A. Gadzama, “Correlationof oxidative stress and inflammatory markers with the severityof sickle cell nephropathy,” Annals of African Medicine, vol. 9,no. 3, pp. 141–146, 2010.
[2] I. Batinic-Haberle, J. S. Reboucas, and I. Spasojevic, “Super-oxide Dismutase mimics: chemistry, pharmacology and Ther-apeutic potential,” Antioxid Redox Signal, vol. 13, no. 6, pp.877–918, 2010.
[3] G. R. Serjeant, “Renal manifestation in sickle cell disease,” inOxford Textbook of Clinical Nephrology, pp. 261–281, OxfordUniversity Press, London, UK, 2nd edition, 1992.
[4] A. M. Emokpae, P. O. Uadia, and A. Kuliya-Gwarzo, “Antioxi-dant enzymes and acute phase proteins correlate with markerof lipid peroxide in adult Nigerian sickle cell disease patients,”Iranian Journal of Basic Medical Sciences, vol. 13, no. 4, pp.177–182, 2010.
[5] E. S. Klings and H. W. Farber, “Role of free radicals in thepathogenesis of acute chest syndrome in sickle cell disease,”Respiratory Research, vol. 2, no. 5, pp. 280–285, 2001.
[6] A. Abdu, M. Emokpae, P. Uadia, and A. Kuliya-Gwarzo, “Pro-teinuria among adult sickle cell anemia patients in Nigeria,”Annals of African Medicine, vol. 10, no. 1, pp. 34–37, 2011.
[7] M. H. Steinberg, “Pathophysiologically based drug treatmentof sickle cell disease,” Trends in Pharmacological Sciences, vol.27, no. 4, pp. 204–210, 2006.
[8] R. P. Hebbel, J. W. Eaton, M. Balasingam, and M. H.Steinberg, “Spontaneous oxygen radical generation by sickleerythrocytes,” Journal of Clinical Investigation, vol. 70, no. 6,pp. 1253–1259, 1982.
[9] J. Yam, L. Frank, and R. J. Roberts, “Oxygen toxicity: com-parison of lung biochemical responses in neonatal and adultrats,” Pediatric Research, vol. 12, no. 2, pp. 115–119, 1978.
[10] I. Fridovich and B. Freeman, “Antioxidant defenses in thelung,” Annual Review of Physiology, vol. 48, pp. 693–702, 1986.
[11] W. T. Friedewald, R. I. Levy, and D. S. Fredrickson, “Estima-tion of the concentration of low-density lipoprotein choles-terol in plasma, without use of the preparative ultracen-trifuge,” Clinical Chemistry, vol. 18, no. 6, pp. 499–502, 1972.
[12] D. W. Cockcroft and M. H. Gault, “Prediction of creatinineclearance from serum creatinine,” Nephron, vol. 16, no. 1, pp.31–41, 1976.
[13] V. Manfredini, L. L. Lazzaretti, I. H. Griebeler, A. P. Santin, V.D. Brandao, and S. Wagner, “Blood antioxidant parameters insickle cell anaemia patients in steady state,” National MedicalAssociation, vol. 100, pp. 897–902, 2008.
[14] G. Ramani, G. Kavitha, P. K. Dhass, and R. M. Aruna,“Oxidative stress and its association with cardiovascular riskin acute renal failure,” International Journal of Pharma and BioSciences, vol. 2, no. 3, pp. B329–B334, 2011.
[15] G. Remuzzi and T. Bertani, “Pathophysiology of progressivenephropathies,” New England Journal of Medicine, vol. 339, no.20, pp. 1448–1456, 1998.
[16] K. Pawlak, D. Pawlek, and M. Mysliwice, “Cu/Zn superoxidedismutase plasma level as a new useful chemical biomarkerof oxidative stress in patients with end stage renal disease,”Clinical Biochemistry, vol. 38, pp. 700–705, 2005.
[17] O. G. Arinola, J. A. Olaniyi, and M. O. Akiibinu, “Evaluationof antioxidant levels and trace element status in Nigerian sicklecell disease patients with Plasmodium parasitaemia,” PakistanJournal of Nutrition, vol. 7, no. 6, pp. 766–769, 2008.
[18] T. A. Sutton, H. E. Mang, S. B. Campos, R. M. Sandol, M. C.Yoder, and B. A. Molitoris, “Injury of the renal microvascularendothelium alters banner function after ischemia,” AmericanJournal of Physiology, vol. 285, pp. F191–F198, 2003.
[19] R. E. Ratych and G. B. Bulkley, “Free-radical-mediatedpostischemic reperfusion injury in the kidney,” Journal of FreeRadicals in Biology and Medicine, vol. 2, no. 5-6, pp. 311–319,1986.
[20] S. P. Mark, R. H. John, and F. F. Thomas, “Oxygen free radicalsin Ischaemic acute renal failure in the rat,” Journal of ClinicalInvestigation, vol. 74, pp. 1156–1164, 1984.
[21] E. L. Greene and M. S. Paller, “Oxygen free radicals in acuterenal failure,” Mineral and Electrolyte Metabolism, vol. 17, no.2, pp. 124–132, 1991.
[22] M. A. Emokpae, O. H. Uwumarongie, and H. B. Osadolor,“Sex dimorphism in serum lecithin: cholesterol acyltransferaseand lipoprotein lipase activities in adult sickle cell anaemiapatients with proteinuria,” Indian Journal of Clinical Biochem-istry, vol. 26, no. 1, pp. 57–61, 2011.
[23] K. C. Wood, L. L. Hsu, and M. T. Gladwin, “Sickle cell diseasevasculopathy: a state of nitric oxide resistance,” Free RadicalBiology and Medicine, vol. 44, no. 8, pp. 1506–1528, 2008.
[24] C. R. Morris, “Mechanisms of vasculopathy in sickle celldisease and Thalassemia. Current and Future Therapies ofsickle cell anemia,” Hematology, vol. 1, pp. 177–185, 2008.
[25] C. R. Morris, C. Teehanke, and G. Kato, “Decreased argininebioavailability contributes to the pathogenesis of pulmonaryartery hypertension,” in Proceedings of the Annual Meeting ofAmerican College of Cardiology, Orlando, Fla, USA, 2005.
[26] C. O. Enwonwu, “Increased metabolic demand for arginine insickle cell anaemia,” Medical Science Research, vol. 17, no. 23,pp. 997–998, 1989.
[27] M. A. Emokpae, A. Abdu, P. O. Uadia, and M. M. Borodo,“Lipid profile in sickle cell disease patients with chronic kidneydisease,” Sahel Medical Journal, vol. 13, no. 1, pp. 20–23, 2010.
[28] J. Shores, J. Peterson, D. VanderJagt, and R. H. Glew, “Reducedcholesterol levels in African-American adults with sickle celldisease,” Journal of the National Medical Association, vol. 95,no. 9, pp. 813–817, 2003.
[29] Z. Rahimi, A. Merat, M. Haghshenass, H. Madani, M. Rezaei,and R. L. Nagel, “Plasma lipids in Iranians with sickle celldisease: hypocholesterolemia in sickle cell anemia and increaseof HDL-cholesterol in sickle cell trait,” Clinica Chimica Acta,vol. 365, no. 1-2, pp. 217–220, 2006.
[30] C. R. Morris, F. A. Kuypers, S. Larkin, E. P. Vichinsky, and L. A.Styles, “Patterns of arginine and nitric oxide in patients withsickle cell disease with vaso-occlusive crisis and acute chestsyndrome,” Journal of Pediatric Hematology/Oncology, vol. 22,no. 6, pp. 515–520, 2000.
[31] M. Z. Zailaie, Z. M. Marzouki, and S. M. Khoja, “Plasma andred blood cells membrane lipid concentration of sickle celldisease patients,” Saudi Medical Journal, vol. 24, no. 4, pp. 376–379, 2003.
[32] E. Choy and N. Sattar, “Interpreting lipid levels in the contextof high-grade inflammatory states with a focus on rheumatoidarthritis: a challenge to conventional cardiovascular riskactions,” Annals of the Rheumatic Diseases, vol. 68, no. 4, pp.460–469, 2009.

Anemia 5
[33] A. P. H. Gotto, Manual of Lipid Disorders: Reducing the Riskfor Coronary Heart Disease, Lippincott, Williams and Wilkins,Philadelphia, Pa, USA, 2003.
[34] S. Zorca, L. Freeman, M. Hildesheim et al., “Lipid levels insickle-cell disease associated with haemolytic severity, vasculardysfunction and pulmonary hypertension,” British Journal ofHaematology, vol. 149, no. 3, pp. 436–445, 2010.
Hindawi Publishing CorporationAnemiaVolume 2012, Article ID 201781, 7 pagesdoi:10.1155/2012/201781
Research Article
Sickle Cell Disease Activates Peripheral Blood Mononuclear Cellsto Induce Cathepsins K and V Activity in Endothelial Cells
Philip M. Keegan, Sindhuja Surapaneni, and Manu O. Platt
Wallace H. Coulter Department of Biomedical Engineering, Georgia Institute of Technology and Emory University, Atlanta,GA 30332, USA
Correspondence should be addressed to Manu O. Platt, [email protected]
Received 21 December 2011; Accepted 14 February 2012
Academic Editor: Betty S. Pace
Copyright © 2012 Philip M. Keegan et al. This is an open access article distributed under the Creative Commons AttributionLicense, which permits unrestricted use, distribution, and reproduction in any medium, provided the original work is properlycited.
Sickle cell disease is a genetic disease that increases systemic inflammation as well as the risk of pediatric strokes, but links betweensickle-induced inflammation and arterial remodeling are not clear. Cathepsins are powerful elastases and collagenases secreted byendothelial cells and monocyte-derived macrophages in atherosclerosis, but their involvement in sickle cell disease has not beenstudied. Here, we investigated how tumor necrosis alpha (TNFα) and circulating mononuclear cell adhesion to human aorticendothelial cells (ECs) increase active cathepsins K and V as a model of inflammation occurring in the arterial wall. ECs werestimulated with TNFα and cultured with peripheral blood mononuclear cells (PBMCs) from persons homozygous for sickle (SS)or normal (AA) hemoglobin. TNFα was necessary to induce cathepsin K activity, but either PBMC binding or TNFα increasedcathepsin V activity. SS PBMCs were unique; they induced cathepsin K in ECs without exogenous TNFα (n = 4, P < 0.05).Inhibition of c-Jun N-terminal kinase (JNK) significantly reduced cathepsins K and V activation by 60% and 51%, respectively.Together, the inflammation and activated circulating mononuclear cells upregulate cathepsin activity through JNK signaling,identifying new pharmaceutical targets to block the accelerated pathology observed in arteries of children with sickle cell disease.
1. Introduction
Sickle cell disease is a genetic disorder that causes in vivo po-lymerization of hemoglobin molecules into rigid fibers with-in red blood cells, deforming them in the canonically de-scribed “sickle” shape. Rigid, sickled red blood cells and thebyproducts of their hemolysis cause chronic vascular damageand increase systemic levels of inflammatory cytokines, mo-bilized mononuclear cells [1], and pathological levels ofincreased monocyte adhesion to the endothelium [2, 3].Overall, these pathological inflammatory conditions andmononuclear cell-endothelial cell interactions may contrib-ute to intimal thickening, and lumen narrowing seen in pul-monary hypertension and stroke lesions of children; pul-monary hypertension is responsible for 20–30% of sickle-cell-related deaths in adult patients [4, 5] and 11% of chil-dren with sickle cell disease will suffer from a major stroke bythe age of 16.
Both of these clinical syndromes are characterized by vas-cular remodeling [6–8]. Vascular remodeling analogous to
stroke lesions in sickle cell disease has been observed inatherosclerosis, the major cardiovascular disease, wheremononuclear cell infiltration of the subendothelial space,degradation of the elastic lamina, and subsequent smoothmuscle cell proliferation mediate lesion progression andluminal narrowing [2]. These similarities suggest that com-mon mechanisms for arterial remodeling may exist betweenthe well-studied, well-characterized atherosclerosis, and theless understood mechanisms of sickle cell disease.
Arterial remodeling can be defined as changes in thecomposition of proteins, cell types, and even cell phenotypesthat induce chronic effects on the structure, mechanicalproperties, and total health of the artery [6–8]. This includesdegradation of old matrix by newly activated proteases aswell as synthesis and deposition of new extracellular matrixproteins. Cysteine cathepsins, one such family of proteasesupregulated in arterial remodeling [6, 9], belong to thepapain superfamily of proteases and contain the mostpotent human collagenases and elastases [10]. Increasedcathepsin activity has been linked to tissue destruction in
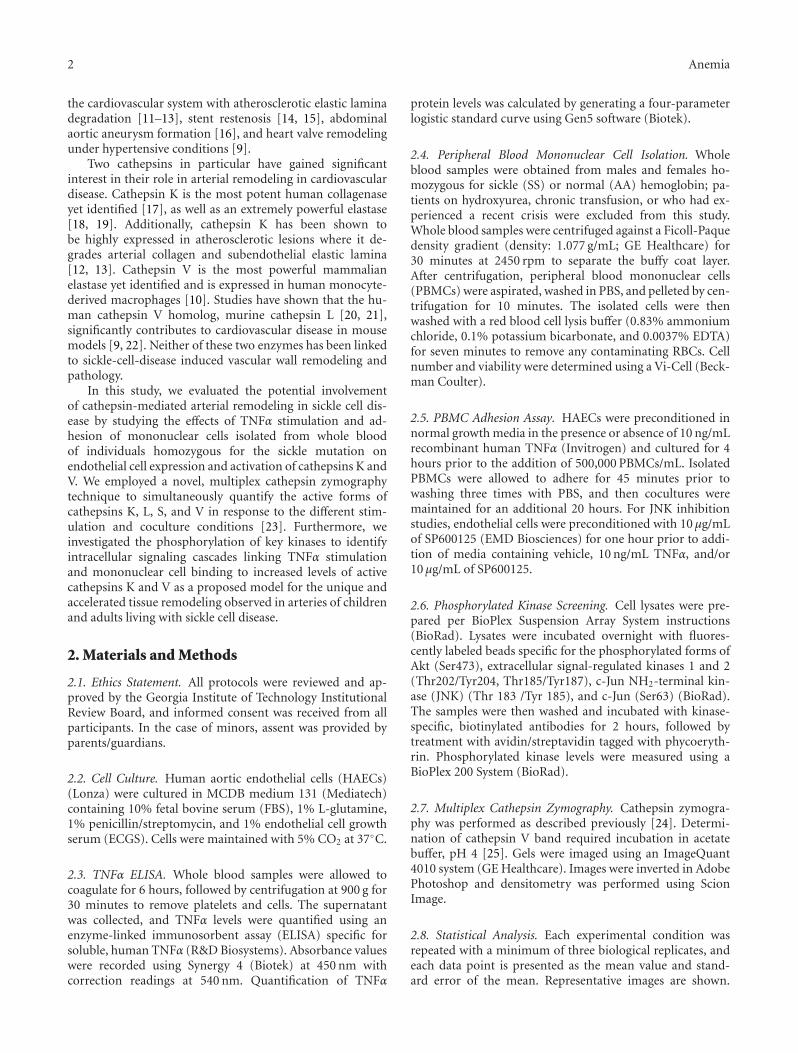
2 Anemia
the cardiovascular system with atherosclerotic elastic laminadegradation [11–13], stent restenosis [14, 15], abdominalaortic aneurysm formation [16], and heart valve remodelingunder hypertensive conditions [9].
Two cathepsins in particular have gained significantinterest in their role in arterial remodeling in cardiovasculardisease. Cathepsin K is the most potent human collagenaseyet identified [17], as well as an extremely powerful elastase[18, 19]. Additionally, cathepsin K has been shown tobe highly expressed in atherosclerotic lesions where it de-grades arterial collagen and subendothelial elastic lamina[12, 13]. Cathepsin V is the most powerful mammalianelastase yet identified and is expressed in human monocyte-derived macrophages [10]. Studies have shown that the hu-man cathepsin V homolog, murine cathepsin L [20, 21],significantly contributes to cardiovascular disease in mousemodels [9, 22]. Neither of these two enzymes has been linkedto sickle-cell-disease induced vascular wall remodeling andpathology.
In this study, we evaluated the potential involvementof cathepsin-mediated arterial remodeling in sickle cell dis-ease by studying the effects of TNFα stimulation and ad-hesion of mononuclear cells isolated from whole bloodof individuals homozygous for the sickle mutation onendothelial cell expression and activation of cathepsins K andV. We employed a novel, multiplex cathepsin zymographytechnique to simultaneously quantify the active forms ofcathepsins K, L, S, and V in response to the different stim-ulation and coculture conditions [23]. Furthermore, weinvestigated the phosphorylation of key kinases to identifyintracellular signaling cascades linking TNFα stimulationand mononuclear cell binding to increased levels of activecathepsins K and V as a proposed model for the unique andaccelerated tissue remodeling observed in arteries of childrenand adults living with sickle cell disease.
2. Materials and Methods
2.1. Ethics Statement. All protocols were reviewed and ap-proved by the Georgia Institute of Technology InstitutionalReview Board, and informed consent was received from allparticipants. In the case of minors, assent was provided byparents/guardians.
2.2. Cell Culture. Human aortic endothelial cells (HAECs)(Lonza) were cultured in MCDB medium 131 (Mediatech)containing 10% fetal bovine serum (FBS), 1% L-glutamine,1% penicillin/streptomycin, and 1% endothelial cell growthserum (ECGS). Cells were maintained with 5% CO2 at 37◦C.
2.3. TNFα ELISA. Whole blood samples were allowed tocoagulate for 6 hours, followed by centrifugation at 900 g for30 minutes to remove platelets and cells. The supernatantwas collected, and TNFα levels were quantified using anenzyme-linked immunosorbent assay (ELISA) specific forsoluble, human TNFα (R&D Biosystems). Absorbance valueswere recorded using Synergy 4 (Biotek) at 450 nm withcorrection readings at 540 nm. Quantification of TNFα
protein levels was calculated by generating a four-parameterlogistic standard curve using Gen5 software (Biotek).
2.4. Peripheral Blood Mononuclear Cell Isolation. Wholeblood samples were obtained from males and females ho-mozygous for sickle (SS) or normal (AA) hemoglobin; pa-tients on hydroxyurea, chronic transfusion, or who had ex-perienced a recent crisis were excluded from this study.Whole blood samples were centrifuged against a Ficoll-Paquedensity gradient (density: 1.077 g/mL; GE Healthcare) for30 minutes at 2450 rpm to separate the buffy coat layer.After centrifugation, peripheral blood mononuclear cells(PBMCs) were aspirated, washed in PBS, and pelleted by cen-trifugation for 10 minutes. The isolated cells were thenwashed with a red blood cell lysis buffer (0.83% ammoniumchloride, 0.1% potassium bicarbonate, and 0.0037% EDTA)for seven minutes to remove any contaminating RBCs. Cellnumber and viability were determined using a Vi-Cell (Beck-man Coulter).
2.5. PBMC Adhesion Assay. HAECs were preconditioned innormal growth media in the presence or absence of 10 ng/mLrecombinant human TNFα (Invitrogen) and cultured for 4hours prior to the addition of 500,000 PBMCs/mL. IsolatedPBMCs were allowed to adhere for 45 minutes prior towashing three times with PBS, and then cocultures weremaintained for an additional 20 hours. For JNK inhibitionstudies, endothelial cells were preconditioned with 10 μg/mLof SP600125 (EMD Biosciences) for one hour prior to addi-tion of media containing vehicle, 10 ng/mL TNFα, and/or10 μg/mL of SP600125.
2.6. Phosphorylated Kinase Screening. Cell lysates were pre-pared per BioPlex Suspension Array System instructions(BioRad). Lysates were incubated overnight with fluores-cently labeled beads specific for the phosphorylated forms ofAkt (Ser473), extracellular signal-regulated kinases 1 and 2(Thr202/Tyr204, Thr185/Tyr187), c-Jun NH2-terminal kin-ase (JNK) (Thr 183 /Tyr 185), and c-Jun (Ser63) (BioRad).The samples were then washed and incubated with kinase-specific, biotinylated antibodies for 2 hours, followed bytreatment with avidin/streptavidin tagged with phycoeryth-rin. Phosphorylated kinase levels were measured using aBioPlex 200 System (BioRad).
2.7. Multiplex Cathepsin Zymography. Cathepsin zymogra-phy was performed as described previously [24]. Determi-nation of cathepsin V band required incubation in acetatebuffer, pH 4 [25]. Gels were imaged using an ImageQuant4010 system (GE Healthcare). Images were inverted in AdobePhotoshop and densitometry was performed using ScionImage.
2.8. Statistical Analysis. Each experimental condition wasrepeated with a minimum of three biological replicates, andeach data point is presented as the mean value and stand-ard error of the mean. Representative images are shown.
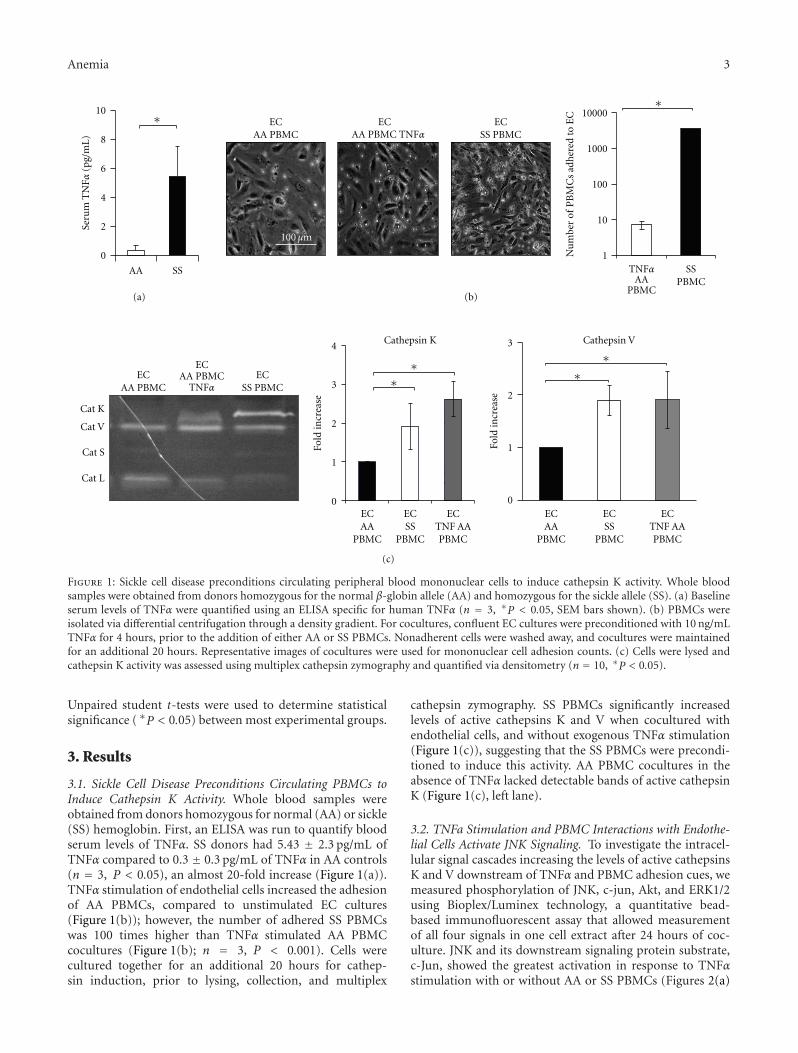
Anemia 3
AA PBMCTNFα
EC AA PBMC
2
3
100μm
10
8
6
4
2
0
AA SS
Seru
m T
NFα
(pg/
mL
)
∗∗
ECAA PBMC
ECSS PBMC
SSPBMC
Nu
mbe
r of
PB
MC
s ad
her
ed to
EC
AAPBMC
TNFα
10000
1000
100
10
1
ECAA PBMC TNFα
(a) (b)
∗ ∗∗∗EC
AA PBMC
ECAA
PBMC
ECSS
PBMC
ECAA
PBMC
ECSS PBMC
ECTNF AAPBMC
ECSS
PBMC
ECTNF AAPBMC
Cat K
Cat V
Cat S
Cat L
TNFα
ECAA PBMC
4
3
2
1
0
Fold
incr
ease
3
2
1
0Fo
ld in
crea
se
Cathepsin K Cathepsin V
(c)
100 μm
Figure 1: Sickle cell disease preconditions circulating peripheral blood mononuclear cells to induce cathepsin K activity. Whole bloodsamples were obtained from donors homozygous for the normal β-globin allele (AA) and homozygous for the sickle allele (SS). (a) Baselineserum levels of TNFα were quantified using an ELISA specific for human TNFα (n = 3, ∗P < 0.05, SEM bars shown). (b) PBMCs wereisolated via differential centrifugation through a density gradient. For cocultures, confluent EC cultures were preconditioned with 10 ng/mLTNFα for 4 hours, prior to the addition of either AA or SS PBMCs. Nonadherent cells were washed away, and cocultures were maintainedfor an additional 20 hours. Representative images of cocultures were used for mononuclear cell adhesion counts. (c) Cells were lysed andcathepsin K activity was assessed using multiplex cathepsin zymography and quantified via densitometry (n = 10, ∗P < 0.05).
Unpaired student t-tests were used to determine statisticalsignificance ( ∗P < 0.05) between most experimental groups.
3. Results
3.1. Sickle Cell Disease Preconditions Circulating PBMCs toInduce Cathepsin K Activity. Whole blood samples wereobtained from donors homozygous for normal (AA) or sickle(SS) hemoglobin. First, an ELISA was run to quantify bloodserum levels of TNFα. SS donors had 5.43 ± 2.3 pg/mL ofTNFα compared to 0.3 ± 0.3 pg/mL of TNFα in AA controls(n = 3, P < 0.05), an almost 20-fold increase (Figure 1(a)).TNFα stimulation of endothelial cells increased the adhesionof AA PBMCs, compared to unstimulated EC cultures(Figure 1(b)); however, the number of adhered SS PBMCswas 100 times higher than TNFα stimulated AA PBMCcocultures (Figure 1(b); n = 3, P < 0.001). Cells werecultured together for an additional 20 hours for cathep-sin induction, prior to lysing, collection, and multiplex
cathepsin zymography. SS PBMCs significantly increasedlevels of active cathepsins K and V when cocultured withendothelial cells, and without exogenous TNFα stimulation(Figure 1(c)), suggesting that the SS PBMCs were precondi-tioned to induce this activity. AA PBMC cocultures in theabsence of TNFα lacked detectable bands of active cathepsinK (Figure 1(c), left lane).
3.2. TNFa Stimulation and PBMC Interactions with Endothe-lial Cells Activate JNK Signaling. To investigate the intracel-lular signal cascades increasing the levels of active cathepsinsK and V downstream of TNFα and PBMC adhesion cues, wemeasured phosphorylation of JNK, c-jun, Akt, and ERK1/2using Bioplex/Luminex technology, a quantitative bead-based immunofluorescent assay that allowed measurementof all four signals in one cell extract after 24 hours of coc-ulture. JNK and its downstream signaling protein substrate,c-Jun, showed the greatest activation in response to TNFαstimulation with or without AA or SS PBMCs (Figures 2(a)
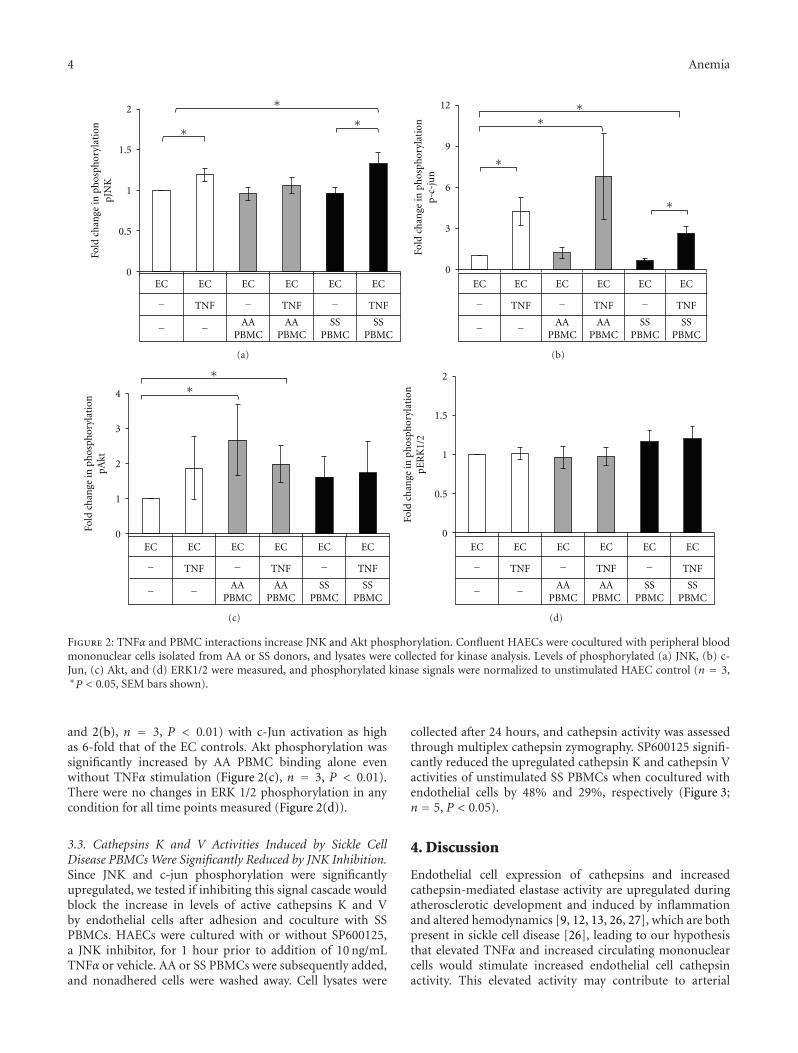
4 Anemia
2
1.5
1
0.5
0
Fold
ch
ange
in p
hos
phor
ylat
ion
pJN
K
EC EC EC EC EC EC
TNF TNF TNF−
− −
− −AA
PBMCAA
PBMCSS
PBMCSS
PBMC
∗
∗∗
(a)
Fold
ch
ange
in p
hos
phor
ylat
ion
p-c-
jun
EC EC EC EC EC EC
TNF TNF TNF−
− −
− −AA
PBMCAA
PBMCSS
PBMCSS
PBMC
∗∗
∗
∗
12
9
6
3
0
(b)
Fold
ch
ange
in p
hos
phor
ylat
ion
pAkt
EC EC EC EC EC EC
TNF TNF TNF−
− −
− −AA
PBMCAA
PBMCSS
PBMCSS
PBMC
∗∗4
3
2
1
0
(c)
Fold
ch
ange
in p
hos
phor
ylat
ion
pER
K1/
2
EC EC EC EC EC EC
TNF TNF TNF−
− −
− −AA
PBMCAA
PBMCSS
PBMCSS
PBMC
2
1.5
1
0.5
0
(d)
Figure 2: TNFα and PBMC interactions increase JNK and Akt phosphorylation. Confluent HAECs were cocultured with peripheral bloodmononuclear cells isolated from AA or SS donors, and lysates were collected for kinase analysis. Levels of phosphorylated (a) JNK, (b) c-Jun, (c) Akt, and (d) ERK1/2 were measured, and phosphorylated kinase signals were normalized to unstimulated HAEC control (n = 3,∗P < 0.05, SEM bars shown).
and 2(b), n = 3, P < 0.01) with c-Jun activation as highas 6-fold that of the EC controls. Akt phosphorylation wassignificantly increased by AA PBMC binding alone evenwithout TNFα stimulation (Figure 2(c), n = 3, P < 0.01).There were no changes in ERK 1/2 phosphorylation in anycondition for all time points measured (Figure 2(d)).
3.3. Cathepsins K and V Activities Induced by Sickle CellDisease PBMCs Were Significantly Reduced by JNK Inhibition.Since JNK and c-jun phosphorylation were significantlyupregulated, we tested if inhibiting this signal cascade wouldblock the increase in levels of active cathepsins K and Vby endothelial cells after adhesion and coculture with SSPBMCs. HAECs were cultured with or without SP600125,a JNK inhibitor, for 1 hour prior to addition of 10 ng/mLTNFα or vehicle. AA or SS PBMCs were subsequently added,and nonadhered cells were washed away. Cell lysates were
collected after 24 hours, and cathepsin activity was assessedthrough multiplex cathepsin zymography. SP600125 signifi-cantly reduced the upregulated cathepsin K and cathepsin Vactivities of unstimulated SS PBMCs when cocultured withendothelial cells by 48% and 29%, respectively (Figure 3;n = 5, P < 0.05).
4. Discussion
Endothelial cell expression of cathepsins and increasedcathepsin-mediated elastase activity are upregulated duringatherosclerotic development and induced by inflammationand altered hemodynamics [9, 12, 13, 26, 27], which are bothpresent in sickle cell disease [26], leading to our hypothesisthat elevated TNFα and increased circulating mononuclearcells would stimulate increased endothelial cell cathepsinactivity. This elevated activity may contribute to arterial
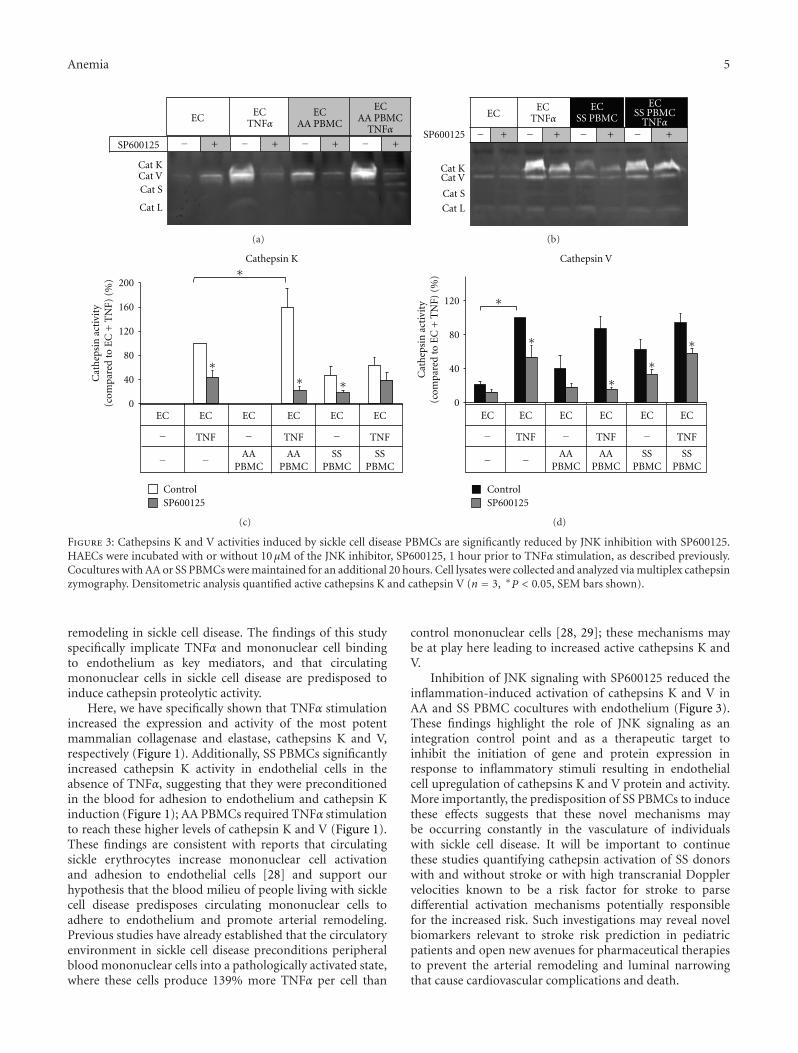
Anemia 5
ECEC
TNFα
SP600125
Cat KCat VCat S
Cat L
TNFα
ECAA PBMC
ECAA PBMC
− − − −+ + + +
(a)
SP600125
Cat KCat V
Cat S
Cat L
ECEC
TNFα TNFα
ECSS PBMC
ECSS PBMC
− − − −+ + + +
(b)
EC EC EC EC EC EC
TNF TNF TNF−
− −
− −AA
PBMCAA
PBMCSS
PBMCSS
PBMC
200
160
120
80
40
0
∗
∗∗ ∗
Cathepsin K
Cat
hep
sin
act
ivit
y(c
ompa
red
to E
C+
TN
F) (
%)
ControlSP600125
(c)
EC EC EC EC EC EC
TNF TNF TNF−
− −
− −AA
PBMCAA
PBMCSS
PBMCSS
PBMC
∗
∗
∗∗
∗
Cathepsin V
120
80
40
0
Cat
hep
sin
act
ivit
y(c
ompa
red
to E
C+
TN
F) (
%)
ControlSP600125
(d)
Figure 3: Cathepsins K and V activities induced by sickle cell disease PBMCs are significantly reduced by JNK inhibition with SP600125.HAECs were incubated with or without 10 μM of the JNK inhibitor, SP600125, 1 hour prior to TNFα stimulation, as described previously.Cocultures with AA or SS PBMCs were maintained for an additional 20 hours. Cell lysates were collected and analyzed via multiplex cathepsinzymography. Densitometric analysis quantified active cathepsins K and cathepsin V (n = 3, ∗P < 0.05, SEM bars shown).
remodeling in sickle cell disease. The findings of this studyspecifically implicate TNFα and mononuclear cell bindingto endothelium as key mediators, and that circulatingmononuclear cells in sickle cell disease are predisposed toinduce cathepsin proteolytic activity.
Here, we have specifically shown that TNFα stimulationincreased the expression and activity of the most potentmammalian collagenase and elastase, cathepsins K and V,respectively (Figure 1). Additionally, SS PBMCs significantlyincreased cathepsin K activity in endothelial cells in theabsence of TNFα, suggesting that they were preconditionedin the blood for adhesion to endothelium and cathepsin Kinduction (Figure 1); AA PBMCs required TNFα stimulationto reach these higher levels of cathepsin K and V (Figure 1).These findings are consistent with reports that circulatingsickle erythrocytes increase mononuclear cell activationand adhesion to endothelial cells [28] and support ourhypothesis that the blood milieu of people living with sicklecell disease predisposes circulating mononuclear cells toadhere to endothelium and promote arterial remodeling.Previous studies have already established that the circulatoryenvironment in sickle cell disease preconditions peripheralblood mononuclear cells into a pathologically activated state,where these cells produce 139% more TNFα per cell than
control mononuclear cells [28, 29]; these mechanisms maybe at play here leading to increased active cathepsins K andV.
Inhibition of JNK signaling with SP600125 reduced theinflammation-induced activation of cathepsins K and V inAA and SS PBMC cocultures with endothelium (Figure 3).These findings highlight the role of JNK signaling as anintegration control point and as a therapeutic target toinhibit the initiation of gene and protein expression inresponse to inflammatory stimuli resulting in endothelialcell upregulation of cathepsins K and V protein and activity.More importantly, the predisposition of SS PBMCs to inducethese effects suggests that these novel mechanisms maybe occurring constantly in the vasculature of individualswith sickle cell disease. It will be important to continuethese studies quantifying cathepsin activation of SS donorswith and without stroke or with high transcranial Dopplervelocities known to be a risk factor for stroke to parsedifferential activation mechanisms potentially responsiblefor the increased risk. Such investigations may reveal novelbiomarkers relevant to stroke risk prediction in pediatricpatients and open new avenues for pharmaceutical therapiesto prevent the arterial remodeling and luminal narrowingthat cause cardiovascular complications and death.
6 Anemia
5. Conclusion
Elevated inflammatory factors and circulating mononucle-ar cells inherent to sickle cell disease induce pathologicallyhigh levels of cathepsins K and V activity when bindingto and stimulating endothelial cells, increasing proteolyticactivity that may be involved in arterial wall remodeling toincrease risk of stroke and pulmonary hypertension. Thereis a pressing need for novel pharmaceutical targets to inhibitthese activities, and from this work, we propose that JNK,cathepsin K, and cathepsin V are three new targets for inhi-bition to reduce pathological arterial remodeling in sickle celldisease.
Conflict of Interests
The authors have declared that no competing interests exist.
Acknowledgments
The authors of this paper would like to thank Eric Kopfle andAlex Miller for assistance with data collection. Additionally,the authors would like to thank the Sickle Cell Foundation ofGeorgia for collecting and recruiting blood donors for thesestudies. This paper was funded by Georgia Tech startup fundsand NIH New Innovator Grant no. 1DP2OD007433-01 (M.O. Platt) from the Office of the Director, National Institutesof Health. The content is solely the responsibility of theauthors and does not necessarily represent the official viewsof the Office of the Director, National Institutes of Health, orthe National Institutes of Health. P. M. Keegan was supportedby an NSF graduate research fellowship. The funders had norole in study design, data collection and analysis, decision topublish, or preparation of the paper.
References
[1] N. Conran, S. T. O. Saad, F. F. Costa, and T. Ikuta, “Leukocytenumbers correlate with plasma levels of granulocyte-macro-phage colony-stimulating factor in sickle cell disease,” Annalsof Hematology, vol. 86, no. 4, pp. 255–261, 2007.
[2] J. A. Switzer, D. C. Hess, F. T. Nichols, and R. J. Adams, “Pa-thophysiology and treatment of stroke in sickle-cell disease:present and future,” Lancet Neurology, vol. 5, no. 6, pp. 501–512, 2006.
[3] G. A. Barabino, L. V. McIntire, S. G. Eskin, and D. Sears, “En-dothelial cell interactions with sickle cell, sickle trait, mechani-cally injured, and normal erythrocytes under controlled flow,”Blood, vol. 70, no. 1, pp. 152–157, 1987.
[4] B. Maıtre, A. Mekontso-Dessap, A. Habibi et al., “Pulmonarycomplications in adult sickle cell disease,” Revue des MaladiesRespiratoires, vol. 28, no. 2, pp. 129–137, 2011.
[5] L. A. Verduzco and D. G. Nathan, “Sickle cell disease andstroke,” Blood, vol. 114, no. 25, pp. 5117–5125, 2009.
[6] J. D. Belcher, H. Mahaseth, T. E. Welch et al., “Critical role ofendothelial cell activation in hypoxia-induced vasoocclusionin transgenic sickle mice,” American Journal of Physiology, vol.288, no. 6, pp. H2715–H2725, 2005.
[7] J. Liu, G. K. Sukhova, J. T. Yang et al., “Cathepsin L expressionand regulation in human abdominal aortic aneurysm, athero-sclerosis, and vascular cells,” Atherosclerosis, vol. 184, no. 2, pp.302–311, 2006.
[8] A. M. Malek, S. L. Alper, and S. Izumo, “Hemodynamic shearstress and its role in atherosclerosis,” Journal of the AmericanMedical Association, vol. 282, no. 21, pp. 2035–2042, 1999.
[9] M. O. Platt, R. F. Ankeny, and H. Jo, “Laminar shear stressinhibits cathepsin L activity in endothelial cells,” Arteriosclero-sis, Thrombosis, and Vascular Biology, vol. 26, no. 8, pp. 1784–1790, 2006.
[10] Y. Yasuda, Z. Li, D. Greenbaum, M. Bogyo, E. Weber, and D.Bromme, “Cathepsin V, a novel and potent elastolytic activityexpressed in activated macrophages,” Journal of BiologicalChemistry, vol. 279, no. 35, pp. 36761–36770, 2004.
[11] G. S. Gacko, “Expression of the elastolytic cathepsins S andK in human atheroma and regulation of their production insmooth muscle cells,” Clinical Chemistry, vol. 36, pp. 449–452,1998.
[12] M. O. Platt, R. F. Ankeny, G. P. Shi et al., “Expression of cathep-sin K is regulated by shear stress in cultured endothelial cellsand is increased in endothelium in human atherosclerosis,”American Journal of Physiology, vol. 292, no. 3, pp. H1479–H1486, 2007.
[13] G. K. Sukhova, D. I. Simon, H. A. Chapman, and P. Libby, “Ex-pression of the elastolytic cathepsins S and K in human athero-ma and regulation of their production in smooth muscle cells,”The Journal of Clinical Investigation, vol. 102, no. 3, pp. 576–583, 1998.
[14] C. L. Burns-Kurtis, A. R. Olzinski, S. Needle et al., “CathepsinS expression is up-regulated following balloon angioplasty inthe hypercholesterolemic rabbit,” Cardiovascular Research, vol.62, no. 3, pp. 610–620, 2004.
[15] A. Garcia-Touchard, T. D. Henry, G. Sangiorgi et al., “Extracel-lular proteases in atherosclerosis and restenosis,” Arteriosclero-sis, Thrombosis, and Vascular Biology, vol. 25, no. 6, pp. 1119–1127, 2005.
[16] H. Abdul-Hussien, R. G. V. Soekhoe, E. Weber et al., “Collagendegradation in the abdominal aneurysm: a conspiracy of ma-trix metalloproteinase and cysteine collagenases,” AmericanJournal of Pathology, vol. 170, no. 3, pp. 809–817, 2007.
[17] P. Garnero, O. Borel, I. Byrjalsen et al., “The collagenolytic ac-tivity of cathepsin K is unique among mammalian protein-ases,” Journal of Biological Chemistry, vol. 273, no. 48, pp.32347–32352, 1999.
[18] W. Kafienah, D. Bromme, D. J. Buttle, L. J. Croucher, and A.P. Hollander, “Human cathepsin K cleaves native type I andII collagens at the N-terminal end of the triple helix,” Bio-chemical Journal, vol. 331, part 3, pp. 727–732, 1998.
[19] H. A. Chapman, R. J. Riese, and G. P. Shi, “Emerging rolesfor cysteine proteases in human biology,” Annual Review ofPhysiology, vol. 59, pp. 63–88, 1997.
[20] D. Bromme, Z. Li, M. Barnes, and E. Mehler, “Human cat-hepsin V functional expression, tissue distribution, electro-static surface potential, enzymatic characterization, and chro-mosomal localization,” Biochemistry, vol. 38, no. 8, pp. 2377–2385, 1999.
[21] E. Tolosa, W. Li, Y. Yasuda et al., “Cathepsin V is involved inthe degradation of invariant chain in human thymus and isoverexpressed in myasthenia gravis,” The Journal of Clinical In-vestigation, vol. 112, no. 4, pp. 517–526, 2003.
[22] M. Yang, Y. Zhang, J. Pan et al., “Cathepsin L activity controlsadipogenesis and glucose tolerance,” Nature Cell Biology, vol.9, no. 8, pp. 970–977, 2007.
Anemia 7
[23] B. Chen and M. O. Platt, “Multiplex zymography capturesstage-specific activity profiles of cathepsins K, L, and S in hu-man breast, lung, and cervical cancer,” Journal of TranslationalMedicine, vol. 9, pp. 109–2011.
[24] W. A. Li, Z. T. Barry, J. D. Cohen et al., “Detection of fem-tomole quantities of mature cathepsin K with zymography,”Analytical Biochemistry, vol. 401, no. 1, pp. 91–98, 2010.
[25] C. L. Wilder and M. O. Platt, “Manipulating substrate and pHin zymography protocols selectively identifies cathepsins K, L,S, and V activity in cells and tissues,” Archives of Biochemistryand Biophysics, vol. 516, no. 1, pp. 52–57, 2011.
[26] G. A. Barabino, M. O. Platt, and D. K. Kaul, “Sickle cell bio-mechanics,” Annual Review of Biomedical Engineering, vol. 12,pp. 345–367, 2010.
[27] G. P. Shi, G. K. Sukhova, A. Grubb et al., “Cystatin C deficiencyin human atherosclerosis and aortic aneurysms,” The Journalof Clinical Investigation, vol. 104, no. 9, pp. 1191–1197, 1999.
[28] R. Zennadi, A. Chien, K. Xu, M. Batchvarova, and M. J.Telen, “Sickle red cells induce adhesion of lymphocytes andmonocytes to endothelium,” Blood, vol. 112, no. 8, pp. 3474–3483, 2008.
[29] J. D. Belcher, P. H. Marker, J. P. Weber, and R. P. Hebbel,“Activated monocytes in sickle cell disease: potential role inthe activation of vascular endothelium and vaso-occlusion,”Blood, vol. 96, no. 7, pp. 2451–2459, 2000.