Embed Size (px)
Citation preview

https://doi.org/10.1177/0956797617702501
Psychological Science 1 –15© The Author(s) 2017
Reprints and permissions: sagepub.com/journalsPermissions.navDOI: 10.1177/0956797617702501www.psychologicalscience.org/PS
General Article
Recent evidence indicates that the burgeoning field of behavioral science can help solve a wide range of policy problems (Halpern, 2015; Johnson & Goldstein, 2003; Johnson et al., 2012; Larrick & Soll, 2008; Ly, Mazar, Zhao, & Soman, 2013; Sunstein, 2013; Thaler & Sunstein, 2008; The World Bank, 2015). In response, governments are increasingly interested in using behavioral insights as a supplement to or replacement for traditional economic levers, such as incentives, to shape the behavior of citizens and government personnel to promote public priorities. A number of governments around the world have formed nudge units: teams of behavioral science experts tasked with designing behavioral interventions that have the potential to encourage desirable behavior without restrict-ing choice, testing those interventions rapidly and inex-pensively, and then widely implementing the strategies that prove most effective. The United Kingdom established a nudge unit in 2010 and was soon followed by other countries, including Australia, Germany, The Netherlands,
and Singapore, as well as the United States, where an Executive Order issued in September 2015 directed federal agencies to incorporate behavioral science into their pro-grams (Obama, 2015). Of course, it is important to empha-size that behaviorally informed approaches can also be, and often have been, implemented by agencies without the use of designated nudge units.
A key feature of behavioral strategies is that they aim to change “people’s behavior in a predictable way with-out forbidding any options or significantly changing their economic incentives. To count as a mere nudge, [an] intervention must be easy and cheap to avoid. Nudges are not mandates” (Thaler & Sunstein, 2008, p. 6). Nudges
702501 PSSXXX10.1177/0956797617702501Should Governments Invest More in Nudging?Benartzi et al.research-article2017
Corresponding Author:Katherine L. Milkman, The Wharton School, University of Pennsylvania, 566 Jon M. Huntsman Hall, 3730 Walnut St., Philadelphia, PA 19104 E-mail: [email protected]
Should Governments Invest More in Nudging?
Shlomo Benartzi1, John Beshears2, Katherine L. Milkman3, Cass R. Sunstein4, Richard H. Thaler5, Maya Shankar6, Will Tucker-Ray7, William J. Congdon7, and Steven Galing8
1Anderson School of Management, University of California, Los Angeles; 2Harvard Business School, Harvard University; 3The Wharton School, University of Pennsylvania; 4Harvard Law School, Harvard University; 5Booth School of Business, University of Chicago; 6White House Office of Science and Technology Policy, Washington, DC; 7ideas42, New York, NY; and 8United States Department of Defense, Washington, DC
AbstractGovernments are increasingly adopting behavioral science techniques for changing individual behavior in pursuit of policy objectives. The types of “nudge” interventions that governments are now adopting alter people’s decisions without coercion or significant changes to economic incentives. We calculated ratios of impact to cost for nudge interventions and for traditional policy tools, such as tax incentives and other financial inducements, and we found that nudge interventions often compare favorably with traditional interventions. We conclude that nudging is a valuable approach that should be used more often in conjunction with traditional policies, but more calculations are needed to determine the relative effectiveness of nudging.
Keywordsnudge, nudge unit, choice architecture, behavioral science, behavioral economics, savings, pension plan, education, college enrollment, energy, electricity usage, preventive health, influenza vaccination, flu shot, open materials
Received 4/27/16; Revision accepted 3/11/17

2 Benartzi et al.
do not impose material costs but instead alter the under-lying “choice architecture,” for example by changing the default option to take advantage of people’s tendency to accept defaults passively. Nudges stand in contrast to tra-ditional policy tools, which change behavior with man-dates or bans or through economic incentives (including significant subsidies or fines).
For example, a behaviorally informed policy interven-tion might automatically enroll people in programs designed to reduce poverty (U.S. Department of Agricul-ture, Food and Nutrition Service, Office of Research and Analysis, 2013), eliminate or reduce paperwork require-ments for obtaining licenses or permits, or streamline the process of applying for government financial aid for college attendance (Bettinger, Long, Oreopoulos, & Sanbonmatsu, 2012). Many nudges have this general form; they simplify processes to make benefits more readily available. As governments decide on the appropriate level of resources to invest in nudge policies, an important question is how efficiently nudge initiatives achieve their objectives. A nudge policy that increases engagement in a desired behavior (e.g., college attendance) by a larger amount per dollar spent than a traditional intervention would be an attractive investment of public resources.
This point may seem obvious, and some nudges do produce self-evidently large behavioral changes (Benartzi & Thaler, 2013). But because extremely cost-effective nudges do not always create large absolute shifts in behavior, scholars and policymakers may underappreci-ate their value in the absence of cost-effectiveness calcu-lations. As a motivating case study for assessing the cost effectiveness (rather than merely the effectiveness) of nudge policies, consider an experiment conducted by the White House Social and Behavioral Sciences Team (SBST)—the U.S. nudge unit—in collaboration with the U.S. Department of Defense (DOD).
This experiment was intended to increase savings among military personnel in the defined-contribution retirement plan offered to federal government employ-ees, a program in which the government already offers monetary incentives for saving (retirement-plan contribu-tions are tax-deductible). In the experiment, most of the 806,861 military service members who were not contrib-uting to the plan received e-mails nudging them to begin contributing (a control group received no e-mail—the business-as-usual practice). The e-mails were experimen-tally varied to test different behaviorally informed strate-gies for increasing sign-ups (see SBST-DOD Experiment in the Supplemental Material available online for further information on the experiment and its results). The busi-ness-as-usual control group had a 1.1% savings-plan enrollment rate over the month following the messaging campaign, while the groups who received e-mails had enrollment rates ranging from 1.6% to 2.1%.
At first blush, this campaign’s impact seems modest. However, the incremental administrative costs of devel-oping and deploying the e-mail campaign were just $5,000, and the messages collectively increased savings-plan enrollment by roughly 5,200 people and increased contributions by more than $1.3 million in just the first month after the experiment.1 If we extrapolate and assume that the intervention’s effect will decay linearly to zero over 1 year (a highly conservative assumption given that people rarely change their savings-plan contribu-tions once they are set), the program increased savings by approximately $8 million total. Thus, the intervention generated $1,600 in additional savings per dollar spent by the government, an impact that is more than 100 times larger than the impact per dollar spent by the govern-ment on tax incentives, as we will report later in this article. This case study demonstrates that nudge policies do not need to produce a large impact in absolute terms to be effective.
Past studies on nudges, including those disseminated by existing nudge units, have typically measured only the extent to which an intended behavior was changed (if at all). To be maximally informative, future policy-oriented behavioral science research should measure the impact per dollar spent on behavioral interventions in compari-son with more traditional interventions. In the absence of such calculations, policymakers lack the evidence needed to design optimal policies and to decide on the appropri-ate allocation of resources across behaviorally informed and traditional interventions.
Method
Study-selection criteria
We formed a list of policy areas by combining the focus areas from the 2015 summary reports of the U.S. nudge unit (SBST, 2015) and the U.K. nudge unit (The Behav-ioural Insights Team, or BIT, 2015), eliminating redun-dancies and excluding areas that are not major domestic policy foci of the U.S. government. Within each policy area, we identified one well-defined behavior to be our outcome variable of interest (see Study-Selection Criteria in the Supplemental Material for details of our selection methodology). In short, when a policy area had an obvi-ous behavior on which to focus, the choice was simple (e.g., in “Energy,” we focused on energy consumption). When there was no obvious target, we used the outcome variable emphasized by the SBST. If the policy area was not studied by the SBST, we used the outcome variable emphasized by the BIT. Table 1 displays the SBST and BIT policy areas of focus, our categorization of these areas, areas that were excluded, and outcome variables of interest.

Should Governments Invest More in Nudging? 3
We next searched leading academic journals for origi-nal research, published from 2000 to mid-2015, studying interventions aimed at directly influencing outcome vari-ables of interest. Using Google Scholar to determine aca-demic journal rankings,2 we limited our set of academic journals to the three leading general-interest journals (Science, Nature, and Proceedings of the National Acad-emy of Sciences, USA); three leading economics journals, excluding finance journals (The American Economic Review, The Quarterly Journal of Economics, and The Review of Economics and Statistics); three leading psy-chology journals, excluding journals that publish only review articles (Psychological Science, Journal of Person-ality and Social Psychology, and Journal of Applied Psy-chology); and, in the case of health, three leading general medical journals (The New England Journal of Medicine, The Lancet, and Journal of the American Medical Association).
Criteria for inclusion in our analyses were that the entire research article was available online; the article analyzed a (a) nudge, (b) tax incentive, (c) reward, or (d) educational program targeting one of the dependent vari-ables of interest; and either the article presented the nec-essary information to construct relative-effectiveness calculations or we could obtain this information from the authors. (Note that reminders and streamlined or salient disclosure policies can qualify as nudges, but for our present purposes, we did not count traditional educa-tional programs as such.) If our search for articles
reporting a given outcome variable did not identify an article that met our inclusion criteria, we dropped that outcome variable from our analysis. If our search for arti-cles studying a given outcome variable identified articles that met our inclusion criteria and that covered some but not all of the four intervention types, we attempted to fill the gaps by widening our search.
Our method for choosing dependent variables for inclusion in our relative-effectiveness analysis ensured the selection of outcomes for which the ex ante belief of policymakers was that nudges had a chance to impact behavior. This method likely gave an advantage to nudges over incentives and educational interventions in our rela-tive-effectiveness calculations. However, it may be appro-priate to confer this advantage if policymakers are indeed selective in applying nudges where they have a high potential for impact. Furthermore, we were careful to focus only on areas of major domestic policy interest (U.S. Office of Management and Budget, 2016), which makes our findings highly policy-relevant regardless of any selection concerns.3
Relative-effectiveness calculations
We compared the effectiveness of behaviorally motivated policies with the effectiveness of standard policies by using a single measure that takes both the cost of a pro-gram and its impact into account. Specifically, we exam-ined the ratio between an intervention’s causal effect on
Table 1. Categorization of Social and Behavioral Sciences Team (SBST) and Behavioural Insights Team (BIT) Focus Areas
Our categorizationCorresponding focus area in SBST 2015 Annual Report
Corresponding focus area in BIT 2013–2015 Update Report Outcome variable of interest
Financial security in retirement
Promoting retirement security Empowering consumersa Retirement savings
Education Improving college access and affordability
Education College enrollment among recent high school graduates
Energy N/A Energy and sustainability Energy consumptionHealth Helping families get health
coverage and stay healthyHealth and well-being Adult outpatient influenza
vaccinationsJob training Advancing economic
opportunityEconomic growth and the labor market; skills and youth
Enrollment in job-training programsc
Program integrity and compliance
Promoting program integrity and compliance
Fraud, error, and debtb Compliance with paying a required fee to the governmentc
Home affairs N/A Home affairs Reducing crimes such as illegal migration, mobile-phone theft, and online exploitationc
Note: Our list excluded the following SBST and BIT focus areas because they are not major areas of domestic policy for the U.S. government: ensuring cost-effective program operations (SBST), giving and social action (BIT), international development (BIT), and work with other governments (BIT).aWe grouped this focus area with SBST’s focus area on promoting retirement security because its leading example concerned pensions. bWe grouped this focus area with SBST’s focus area on promoting program integrity and compliance because both focused on improving tax and fee collection. cFor these variables, the targeted behaviors were not studied in published research articles in leading academic journals from 2000 to mid-2015 (see Method for an explanation of our journal selection criteria), so we excluded these areas from our analysis.
4 Benartzi et al.
a given outcome variable and its (inflation-adjusted) implementation cost. We adjusted all costs to June 2015 levels using the annual consumer price index from the year of intervention. For multiyear interventions, we adjusted using the midpoint year.
Our definition of the impact of an intervention fol-lowed from the main findings of the article reporting on it. When an article reported the effect of an intervention on multiple outcome variables or target populations, we selected the outcome and target population that were most comparable with the outcomes and target popula-tions studied in other articles on the same topic. For example, Bettinger et al. (2012) studied the effect of Free Application for Federal Student Aid (FAFSA) assistance on FAFSA completion rates, college attendance rates, Pell Grant receipt rates, and years of postsecondary educa-tion for both traditional and nontraditional students. We focused on the effect on college attendance rates among traditional students for comparability with other studies.
We often needed to make additional assumptions to produce intervention cost estimates. Some interventions affected an outcome by increasing enrollment in another program that affected the outcome. For example, Bettinger et al. (2012) provided assistance in completing the FAFSA to increase college enrollment through improved access to financial aid. Milkman et al. (2011) and Chapman et al. (2010) used nudges to encourage people to obtain flu shots during free vaccination campaigns. One may argue that in situations such as these, interventions have addi-tional, indirect costs because they increase the use of other programs. However, in most of the cases we stud-ied, the intervention simply encouraged use of existing, under-capacity institutions in a way that better fulfilled those institutions’ missions. Some interventions may cre-ate perverse outcomes that are costly (e.g., Chapman et al., 2010, reported an implementation of an opt-out vaccination appointment system that increased no-shows at a vaccination clinic), and in those situations, we explic-itly accounted for those costs. That said, we did not include any indirect costs that resulted from increases in the intended use of other, existing institutions.
In most cases, the different interventions we studied within a domain operated over similar time horizons. We evaluated retirement-savings interventions over a horizon of 1 year. Similarly, college-education interventions were measured in terms of their impact on annual enrollment, and influenza-vaccination interventions operated over the course of a single year’s vaccination cycle (approxi-mately September through December). In contrast, results from energy-conservation interventions are reported for intervals ranging from a few months to several years, and we note these differences when discussing energy-conservation calculations. However, even in the case of energy-conservation interventions, our relative-effectiveness
calculations provide useful guidance to policymakers who apply a low intertemporal discount rate to future financial costs and energy savings.
Some experimental studies have multiple treatment conditions, and experimenters incur research costs (e.g., data-collection costs, participant payments) for all study conditions, including the control condition. Treatment effects are estimated on the basis of the marginal increase in the outcome variable in the treatment group compared with the control group, and we calculated intervention costs in the same way: as the marginal cost of the treat-ment relative to the cost of no treatment. We further focused our attention on capturing the primary costs for each intervention, and we omitted the costs of any minor unreported aspects of the program.4
Of course, relative-effectiveness calculations do not address the question of whether increasing the behavior in question is socially beneficial. Our approach was to take stated government goals as given and then to address how best those goals can be achieved.
Results
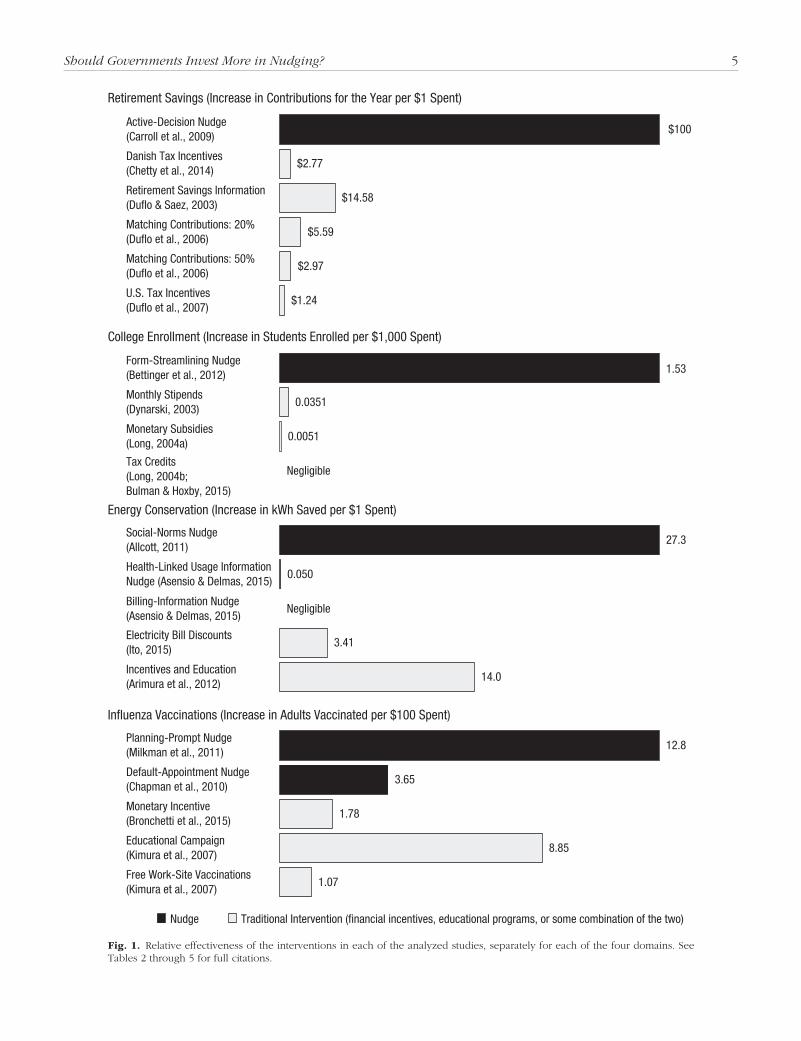
The results of our relative-effectiveness calculations are summarized in Figure 1. Except where noted, monetary amounts are reported in 2015 dollars. Readers interested in additional details should consult Relative-Effectiveness Calculations in the Supplemental Material.
Increasing retirement savings
We first investigated the effectiveness of interventions designed to increase retirement savings (see Table 2). Carroll, Choi, Laibson, Madrian, and Metrick (2009) stud-ied an active-decision nudge for retirement savings. A company’s new employees were required to indicate their preferred contribution rate in a workplace savings plan within their first month of employment. Compared with an enrollment system that asked employees to choose a contribution rate on their own and that imple-mented a default contribution rate of zero for employees who had not chosen another rate, the active-decision nudge increased the average contribution rate in the first year of employment by more than 1% of salary. The nudge was effective because it ensured that procrastina-tion would not prevent new employees from signing up for the plan (O’Donoghue & Rabin, 1999).
We conservatively applied the average contribution-rate increase of 1 percentage point to an annual salary of $20,000 (well below these employees’ median income), for a contribution increase of $200 per employee. We estimated that the cost of including the savings-plan enrollment form in the information packet for new hires and following up with the 5% of employees who failed to
Should Governments Invest More in Nudging? 5
Nudge Traditional Intervention (financial incentives, educational programs, or some combination of the two)
Active-Decision Nudge(Carroll et al., 2009)
Danish Tax Incentives (Chetty et al., 2014)
Retirement Savings Information(Duflo & Saez, 2003)
Matching Contributions: 20%(Duflo et al., 2006)
Matching Contributions: 50%(Duflo et al., 2006)
U.S. Tax Incentives (Duflo et al., 2007)
Form-Streamlining Nudge(Bettinger et al., 2012)
Monthly Stipends(Dynarski, 2003)
Monetary Subsidies(Long, 2004a)
Tax Credits(Long, 2004b;Bulman & Hoxby, 2015)
Social-Norms Nudge(Allcott, 2011)
Health-Linked Usage InformationNudge (Asensio & Delmas, 2015)
Billing-Information Nudge(Asensio & Delmas, 2015)
Electricity Bill Discounts(Ito, 2015)
Incentives and Education(Arimura et al., 2012)
Planning-Prompt Nudge(Milkman et al., 2011)
Default-Appointment Nudge(Chapman et al., 2010)
Monetary Incentive(Bronchetti et al., 2015)
Educational Campaign(Kimura et al., 2007)
Free Work-Site Vaccinations(Kimura et al., 2007)
$100
$2.77
$14.58
$5.59
$2.97
$1.24
1.53
0.0351
0.0051
Negligible
27.3
0.050
Negligible
3.41
14.0
12.8
3.65
1.78
8.85
1.07
Influenza Vaccinations (Increase in Adults Vaccinated per $100 Spent)
Energy Conservation (Increase in kWh Saved per $1 Spent)
College Enrollment (Increase in Students Enrolled per $1,000 Spent)
Retirement Savings (Increase in Contributions for the Year per $1 Spent)
Fig. 1. Relative effectiveness of the interventions in each of the analyzed studies, separately for each of the four domains. See Tables 2 through 5 for full citations.

6 Benartzi et al.
return the form was approximately $2 per employee, so the active-decision nudge generated $100 of additional savings per dollar spent.
Perhaps the best-known nudges for promoting sav-ings in workplace retirement accounts enroll employees automatically, use automatic escalation to increase their contribution rates, or employ a combination of these two nudges. Automatic enrollment is effective because
people exhibit inertia, which favors sticking to defaults; because people infer that policymakers are recommend-ing the default option; and because defaults become ref-erence points, which makes deviations from the default feel like losses, which loom larger than gains ( Johnson & Goldstein, 2003). The most definitive study of auto-matic enrollment in savings plans used data from Den-mark (Chetty, Friedman, Leth-Petersen, Nielsen, & Olsen,
Table 2. Relative Effectiveness of Interventions Targeting Retirement Savings
ArticleIntervention
type Treatment Impact CostRelative
effectiveness
Carroll, Choi, Laibson, Madrian, & Metrick (2009)
Nudge New employees at a company were required to indicate their preferred contribution rate in a workplace retirement-savings plan within their first month of employment.
$200 increase in savings-plan contributions per employeea
$2 per employee for distributing the form and for following up with employees who did not respond
$100 increase in savings-plan contributions per $1 spenta
Chetty, Friedman, Leth-Petersen, Nielsen, & Olsen (2014)
Traditional (financial incentive)
The Danish government changed the tax deduction for contributions to one type of pension account for the roughly 20% of earners who were in the top tax bracket.
$540 (27) change in contributions to the affected pension account per person affected
$195 change in government revenue per person affected
$2.77 (0.14) change in contributions to the affected pension account per $1 spent
Duflo & Saez (2003)
Traditional (education)
Monetary inducements were offered to employees of a large university for attending a benefits fair where they would receive information about the retirement savings plan.
$58.95 increase in savings-plan contributions per employeea
$4.04 per employee for monetary inducements
$14.58 increase in savings-plan contributions per $1 spenta
Duflo, Gale, Liebman, Orszag, & Saez (2006)
Traditional (financial incentive)
Clients preparing a tax return at offices in low- and middle-income neighborhoods in St. Louis, Missouri, were offered 20%, 50%, or no matching contributions for the first $1,000 of additional contributions to a retirement savings account.
20% match: $93.6 (9.0) in incremental contributions per person; 50% match: $244.5 (12.8) in incremental contributions per person
20% match: $16.70 in matching dollars per person; 50% match: $82.40 in matching dollars per person
20% match: $5.59 (0.54) increase in contributions per $1 spent; 50% match: $2.97 (0.16) increase in contributions per $1 spent
Duflo, Gale, Liebman, Orszag, & Saez (2007)
Traditional (financial incentive)
The U.S. federal government increased the tax credit on the first $2,000 of retirement savings from 20% to 50% when adjusted gross income dropped below a specified threshold.
$11.6 (1.00) increase in retirement-account contributions per person
$9.35 increase in tax credits per person
$1.24 (0.11) increase in retirement-account contributions per $1 spent
Note: Standard errors are reported in parentheses. Standard errors for the relative-effectiveness measure were calculated by scaling the standard errors for the overall impact by the cost of the intervention, ignoring any uncertainty regarding the cost of the intervention.aFor this estimate, standard errors could not be calculated using the information reported.

Should Governments Invest More in Nudging? 7
2014). Changing the fraction of an individual’s salary that is automatically directed to a retirement account can generate savings changes of several percentage points of annual salary at essentially zero cost if the infrastructure for payroll deduction into a retirement account already exists (Madrian & Shea, 2001, and Card & Ransom, 2011, studied automatic enrollment and related nudges and found similar results). By contrast, Chetty et al. also report the impact of a reduction in the tax deduction available for contributions to a particular type of retire-ment account. Chetty et al. show that this traditional policy change reduced contributions by 2,449 Danish kroner (DKr), or US$540, and increased government rev-enues by 883 DKr, or US$195, for each person affected by the change, which implies that the tax deduction gen-erated only $2.77 of additional savings in this type of account per dollar of government expenditure.5
Duflo and Saez (2003) tested a traditional educational intervention, offering a university’s employees $20 to attend a benefits fair to receive information about its retirement savings plan. This intervention increased plan contributions over the next year by $58.95 at a cost of $4.04 per employee, generating $14.58 in additional con-tributions in the year per dollar spent. (Choi, Laibson, & Madrian, 2011, analyzed a similar intervention but did not find a statistically significant impact, so the Duflo & Saez results are potentially overly optimistic.)
Duflo, Gale, Liebman, Orszag, and Saez (2006) pro-vided clients of a tax-preparation company with matching contributions for deposits to a retirement-savings account. Clients who were offered a 20% match contributed $76.90 more to the account relative to the control group (which received 0% matching) and received average matching contributions of $16.70, for total incremental contribu-tions of $93.60 per treated client and a mere $5.59 in total contributions per dollar of matching expenditures. This pattern of results held for clients who were offered a 50% match: They contributed $162.10 more to the account relative to the control group and received average match-ing contributions of $82.40, for total incremental contribu-tions of $244.50 per treated client and only $2.97 in total contributions per dollar of matching expenditures.
Duflo et al. (2006) also calculated the effect of tax credits on retirement-account contributions, but we focused on the results from a companion article (Duflo, Gale, Liebman, Orszag, & Saez, 2007) devoted specifi-cally to studying these tax credits. The authors estimated that an increase in the tax credit from 20% to 50% of contributions would generate an additional $11.60 of deposits to a retirement account, from an average of $12.00 to $23.50. This increase translates to just $1.24 ($11.60/(0.50 × 23.50 – 0.20 × 12.00)) of retirement sav-ings per dollar of tax credits.
Increasing college enrollment among recent high school graduates
Next, we turned to interventions designed to increase college enrollment among recent high school graduates (see Table 3). We began by examining a nudge interven-tion undertaken by the tax-preparation company, H&R Block. When H&R Block facilitated the process of filing the FAFSA for its clients, high school seniors whose fami-lies received the assistance were 8.1 percentage points more likely to attend college the following year than seniors in the control group (whose families did not receive the assistance). The incremental cost of this nudge intervention over the cost for the control group was $53.02 per participant. Thus, it produced 1.53 addi-tional college enrollees per $1,000 spent (Bettinger et al., 2012). This streamlined personalized-assistance nudge likely reduced procrastination by making the FAFSA eas-ier to complete, alleviated anxiety about making errors, reduced the stigma for low-socioeconomic-status indi-viduals associated with filling out the FAFSA, and increased the salience and perceived value of completing it. When this nudge was replaced with a more traditional educational intervention providing families with details about their aid eligibility, there was a statistically insignifi-cant decrease in college enrollment relative to that in the untreated control group (Bettinger et al., 2012).
Dynarski (2003) estimated the effect of the Social Security Student Benefit Program, a federal subsidy for postsecondary education, on college enrollment. The elimination of benefit eligibility reduced attendance rates for affected students by 18.2 percentage points. The aver-age annual subsidy for each student in 1980 was $9,252, and 56% of the eligible group attended college for a cost per eligible individual of $5,181. The program therefore generated 0.0351 additional college enrollees per $1,000 spent (0.182/5,181 × 1,000). This impact per $1,000 spent is approximately 40 times smaller than the corresponding impact of the Bettinger et al. (2012) nudge.6
Long (2004a) studied state higher education subsidies for enrollment in public universities. Long’s estimates indicate that in the absence of any state support, 5,535 students in the sample would enroll in college. If the state provided vouchers proportional to the expected years of study, 5,664 students would enroll, with 3,766 in 4-year colleges and 1,898 in 2-year colleges. According to the working-paper version of the article, the vouchers provide $5,367 per student at a 4-year college and $2,683 per student at a 2-year college. The total voucher expen-diture would therefore be $25.3 million (3,766 × $5,367 + 1,898 × $2,683). The educational vouchers therefore increased college enrollment by just 0.0051 students per $1,000 spent ((5,664 – 5,535)/25,300,000 × 1,000).

8 Benartzi et al.
Two studies of tax incentives for college enrollment examining the Hope Scholarship, Lifetime Learning, and American Opportunity Tax Credits estimated that these produced no measurable increases in college attendance (Bulman & Hoxby, 2015; Long, 2004b).
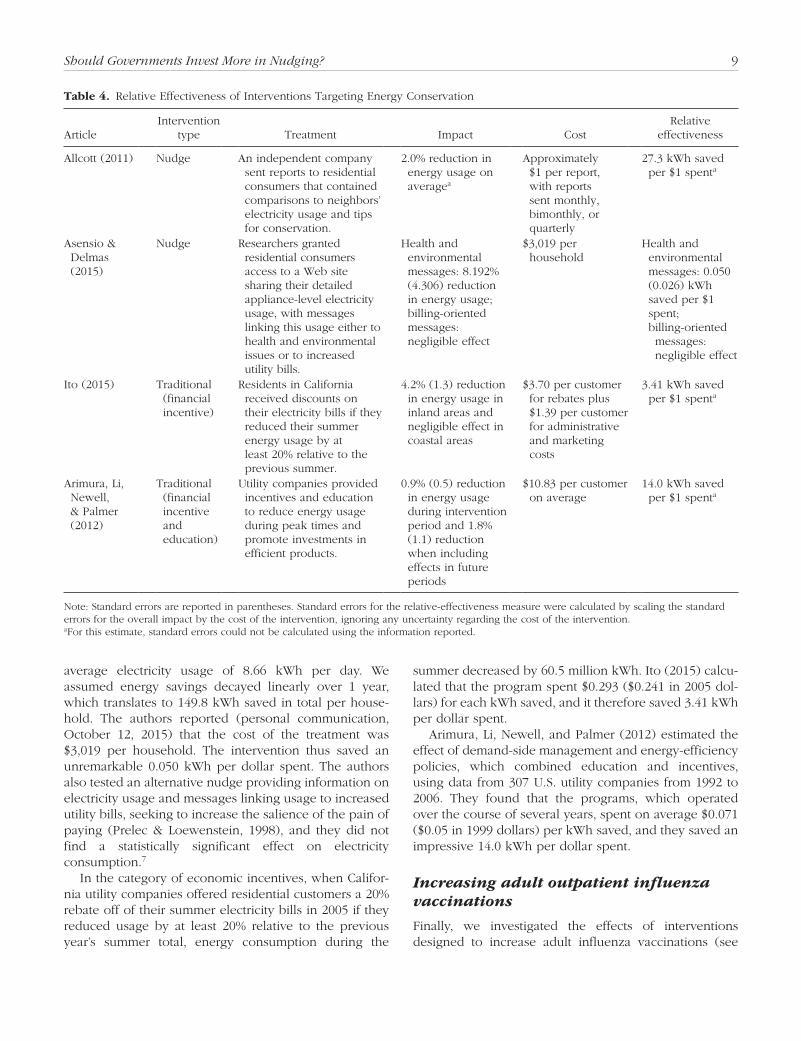
Increasing energy conservation
We next investigated interventions designed to increase energy conservation (see Table 4). Schultz, Nolan, Cialdini, Goldstein, and Griskevicius (2007) and Allcott and Rogers (2014) considered the effects of nudging households to reduce electricity consumption by sending them letters comparing their energy use with that of their neighbors. These interventions harnessed both competitiveness and the power of social norms. Allcott and Rogers (2014) directed readers to Allcott (2011) for simpler cost-effectiveness calculations for the program. We focused on
the Allcott (2011) calculations for this reason and because they are based on much larger sample sizes than those in the Schultz et al. (2007) analysis. Allcott (2011) found that the program averaged $0.0367 ($0.0331 in 2009 dollars) of expenditures for each kWh of electricity saved over the course of approximately 2 years, or saved 27.3 kWh per dollar spent (Allcott & Mullainathan, 2010, report similar results).
Asensio and Delmas (2015) studied a nudge that stra-tegically framed information provided to households from meters recording appliance-level electricity usage. Giving households access to a Web page with this infor-mation along with messages linking pollution from elec-tricity usage to health and environmental issues, perhaps sparking moral concerns (Haidt, 2001), reduced electric-ity consumption by 8.192%, or 70.9 kWh (0.0819 × 8.66 × 100), over the 100-day treatment period relative to the same period in the control group, which had baseline
Table 3. Relative Effectiveness of Interventions Targeting College Enrollment
ArticleIntervention
type Treatment Impact CostRelative
effectiveness
Bettinger, Long, Oreopoulos, & Sanbonmatsu (2012)
Nudge Tax professionals offered to help low-income families fill out financial-aid forms and calculate potential aid amounts at the time of tax preparation.
Increase of 8.1 (3.5) percentage points in likelihood of attending college the next year
$53.02 per participant for training of and payment for tax professionals, materials, software, and call-center support
1.53 (0.66) additional students enrolled in college within the next year per $1,000 spent
Dynarski (2003) Traditional (financial incentive)
The Social Security Student Benefit Program gave out monthly stipends to young adults enrolled in college who had a parent eligible for benefits as a federal postsecondary-education subsidy until the 1980s.
Change of 18.2 (9.6) percentage points in likelihood of attending college
$5,181 per eligible person for stipends
0.0351 (0.0185) additional students enrolled in college per $1,000 spent
Long (2004a) Traditional (financial incentive)
Some states offered state education subsidies for students attending their in-state public universities.
2.3% increase in number of students attending college (from 5,535 to 5,664 students)a,b
$4,468 per college student ($25.3 million total) for subsidiesb
0.0051 additional students enrolled in college per $1,000 spenta
Long (2004b);Bulman & Hoxby (2015)
Traditional (financial incentive)
The federal government offered the Hope Scholarship, Lifetime Learning, and American Opportunity Tax Credits to subsidize spending on higher education.
Negligible effect Negligible effect
Note: Standard errors are reported in parentheses. Standard errors for the relative-effectiveness measure were calculated by scaling the standard errors for the overall impact by the cost of the intervention, ignoring any uncertainty regarding the cost of the intervention.aFor this estimate, standard errors could not be calculated using the information reported. bIt was not possible to calculate a figure for this estimate that was strictly comparable with the other figures in the same column.
Should Governments Invest More in Nudging? 9
average electricity usage of 8.66 kWh per day. We assumed energy savings decayed linearly over 1 year, which translates to 149.8 kWh saved in total per house-hold. The authors reported (personal communication, October 12, 2015) that the cost of the treatment was $3,019 per household. The intervention thus saved an unremarkable 0.050 kWh per dollar spent. The authors also tested an alternative nudge providing information on electricity usage and messages linking usage to increased utility bills, seeking to increase the salience of the pain of paying (Prelec & Loewenstein, 1998), and they did not find a statistically significant effect on electricity consumption.7
In the category of economic incentives, when Califor-nia utility companies offered residential customers a 20% rebate off of their summer electricity bills in 2005 if they reduced usage by at least 20% relative to the previous year’s summer total, energy consumption during the
summer decreased by 60.5 million kWh. Ito (2015) calcu-lated that the program spent $0.293 ($0.241 in 2005 dol-lars) for each kWh saved, and it therefore saved 3.41 kWh per dollar spent.
Arimura, Li, Newell, and Palmer (2012) estimated the effect of demand-side management and energy-efficiency policies, which combined education and incentives, using data from 307 U.S. utility companies from 1992 to 2006. They found that the programs, which operated over the course of several years, spent on average $0.071 ($0.05 in 1999 dollars) per kWh saved, and they saved an impressive 14.0 kWh per dollar spent.
Increasing adult outpatient influenza vaccinations
Finally, we investigated the effects of interventions designed to increase adult influenza vaccinations (see
Table 4. Relative Effectiveness of Interventions Targeting Energy Conservation
ArticleIntervention
type Treatment Impact CostRelative
effectiveness
Allcott (2011) Nudge An independent company sent reports to residential consumers that contained comparisons to neighbors’ electricity usage and tips for conservation.
2.0% reduction in energy usage on averagea
Approximately $1 per report, with reports sent monthly, bimonthly, or quarterly
27.3 kWh saved per $1 spenta
Asensio & Delmas (2015)
Nudge Researchers granted residential consumers access to a Web site sharing their detailed appliance-level electricity usage, with messages linking this usage either to health and environmental issues or to increased utility bills.
Health and environmental messages: 8.192% (4.306) reduction in energy usage; billing-oriented messages: negligible effect
$3,019 per household
Health and environmental messages: 0.050 (0.026) kWh saved per $1 spent;billing-oriented messages: negligible effect
Ito (2015) Traditional (financial incentive)
Residents in California received discounts on their electricity bills if they reduced their summer energy usage by at least 20% relative to the previous summer.
4.2% (1.3) reduction in energy usage in inland areas and negligible effect in coastal areas
$3.70 per customer for rebates plus $1.39 per customer for administrative and marketing costs
3.41 kWh saved per $1 spenta
Arimura, Li, Newell, & Palmer (2012)
Traditional (financial incentive and education)
Utility companies provided incentives and education to reduce energy usage during peak times and promote investments in efficient products.
0.9% (0.5) reduction in energy usage during intervention period and 1.8% (1.1) reduction when including effects in future periods
$10.83 per customer on average
14.0 kWh saved per $1 spenta
Note: Standard errors are reported in parentheses. Standard errors for the relative-effectiveness measure were calculated by scaling the standard errors for the overall impact by the cost of the intervention, ignoring any uncertainty regarding the cost of the intervention.aFor this estimate, standard errors could not be calculated using the information reported.

10 Benartzi et al.
Table 5). Milkman, Beshears, Choi, Laibson, and Madrian (2011) studied a nudge prompting people to plan the date and time when they would obtain an influenza vac-cination. Such prompts embed intentions more firmly in memory and associate cues such as the intended time of action with the intended behavior, thereby reducing for-getfulness. They also help people think through logistical hurdles and strategies for overcoming those hurdles. Finally, they create a commitment that is uncomfortable to break (Rogers, Milkman, John, & Norton, 2015). The authors found that planning prompts increased the num-ber of people who obtained a flu shot by 4.2 percentage points. Adding the prompts to reminder letters that were already being mailed required 5 hr of labor at a cost of $75 per hr in 2011 dollars, which totals $415.58 in 2015 dollars. With 1,270 employees receiving the prompts, the intervention generated 12.8 additional vaccinations per $100 spent ((0.042 × 1,270)/415.58 × 100).
Chapman, Li, Colby, and Yoon (2010) studied the effect of opt-out appointments (a nudge) on vaccination rates. As explained in the discussion of automatic sav-ings-plan enrollment, defaults capitalize on inertia, infer-ences about recommendations, and loss aversion. In the treatment group, individuals were automatically sched-uled for vaccination appointments, while individuals in the control group were given only a Web link to schedule their own appointments. In both conditions, participants were not penalized for missing appointments, and they could walk into the clinic without an appointment. The opt-out condition increased the vaccination rate by 11.7 percentage points over the opt-in control condition. In follow-up correspondence (personal communication, August 25, 2015), one of the authors estimated that a clinic faces a cost of $1.25 for each request to change (cancel, add, reschedule) an appointment, a cost of $5 to add staff for each extra appointment, and a cost of $30
Table 5. Relative Effectiveness of Interventions Targeting Influenza Vaccination
ArticleIntervention
type Treatment Impact CostRelative
effectiveness
Milkman, Beshears, Choi, Laibson, & Madrian (2011)
Nudge An employer modified the normal informational mailings regarding free flu-shot clinics to prompt employees to write down details about when they planned to obtain vaccinations.
Increase of 4.2 (1.9) percentage points in employees obtaining a flu shot
$0.33 per employee for adding planning prompts to reminder letters
12.8 (5.8) additional people vaccinated per $100 spent
Chapman, Li, Colby, & Yoon (2010)
Nudge A university automatically assigned its faculty and staff to (nonmandatory) flu-shot appointment times.
Increase of 11.7 (4.5) percentage points in people obtaining a flu shot
$3.21 per person for excess (unutilized) clinic capacity
3.65 (1.40) additional people vaccinated per $100 spent
Bronchetti, Huffman, & Magenheim (2015)
Traditional (financial incentive)
Experimenters paid college students a $30 incentive to get a flu shot at the campus clinic.
Increase of 10.7 (0.9) percentage points in students obtaining a flu shot
$6.03 per eligible student for incentive
1.78 (0.15) additional people vaccinated per $100 spent
Kimura, Nguyen, Higa, Hurwitz, & Vugia (2007)
Traditional (education and financial incentive)
A health-care facility conducted an educational campaign for its workers on the benefits of influenza vaccination and provided free on-site influenza vaccines.
Education: increase of 8.19 percentage points in workers obtaining a flu shot;a free vaccines: increase of 15.3 percentage points in workers obtaining a flu shota
Education: $0.93 per employee; free vaccines: $14.28 per employee
Education: 8.85 additional people vaccinated per $100 spent;a free vaccines: 1.07 additional people vaccinated per $100 spenta
Note: Standard errors are reported in parentheses. Standard errors for the relative-effectiveness measure were calculated by scaling the standard errors for the overall impact by the cost of the intervention, ignoring any uncertainty regarding the cost of the intervention.aFor this estimate, standard errors could not be calculated using the information reported.

Should Governments Invest More in Nudging? 11
for stocking each extra unused vaccine. In the opt-out group, 39 people changed or canceled appointments. In the opt-in group, 50 people scheduled appointments (none were changed or canceled).
We assume that a clinic must provide enough staff to cover the number of people who have appointments or the number of people who keep their appointment plus the number of walk-ins, whichever is greater, for a total of 221 appointments for the opt-out group and 80 appointments and walk-ins for the opt-in group. We also assume that clinics accurately anticipate the proportion of people who keep their automatic appointments, which means that the number of vaccines that expire is negli-gible. The opt-out condition then had a total cost of $1,153.75 ($1.25 × 39 + $5 × 221) in 2009 dollars, while the opt-in condition had a total cost of $462.50 ($1.25 × 50 + $5 × 80) in 2009 dollars, so the inflation-adjusted marginal cost of the opt-out condition was $766.06. Given that 239 people were in the treatment group, the opt-out nudge generated 3.65 additional vaccinations per $100 spent ((0.117 × 239)/766.06 × 100).
As for price-based policies, Bronchetti, Huffman, and Magenheim (2015) found that offering a $30 incentive ($31.07 in 2015 dollars) increased vaccination rates at campus clinics by 10.7 percentage points. The baseline vaccination rate in the control group was 8.7%, so the treatment generated just 1.78 additional vaccinations per $100 spent (0.107/(31.07 × (0.107 + 0.087)) × 100).
Kimura, Nguyen, Higa, Hurwitz, and Vugia (2007) examined the effect of education and free workplace-vaccination clinics in a long-term health-care facility. Applying a difference-in-differences approach to their findings, we calculated that the educational campaign increased vaccination rates by 8.19 percentage points, while free vaccinations increased vaccination rates by 15.3 percentage points. The authors estimated that an educational campaign for 100 employees costs $92.54, while free vaccinations cost $1,427.77. The educational and free vaccination treatments therefore generated an impressive 8.85 ((8.19/92.54) × 100) and a less remark-able 1.07 ((15.3/1,427.77) × 100) additional vaccinations per $100 spent, respectively.
Discussion
In this research, we extracted critical new information from past work by calculating comparable relative-effec-tiveness numbers and examining them side by side to illustrate how different interventions measure up on this important dimension. The results hardly provide an exhaustive review of the relative effectiveness of nudges compared with traditional policy tools, such as bans and incentives. Nonetheless, our selective but systematic cal-culations indicate that the impact of nudges is often
greater, on a cost-adjusted basis, than that of traditional tools.
In which situations are nudges more impactful per dollar spent than traditional policy tools and vice versa (Goldin & Lawson, 2016)? Far more work needs to be done on this question (Goldin & Lawson, 2016), but monetary incentives may well do better, along that dimension, when the policymaker’s objective is to correct a misalignment between the public interest and the pri-vate interests of citizens making carefully reasoned deci-sions (as in cases in which private decisions impose externalities). To be sure, nudges can help even there, and sometimes they may be preferable (Sunstein & Reisch, 2014). But their comparative advantages will typi-cally be greater when the policymaker’s objective is to change the day-to-day behavior of individuals who are making biased, rushed, or otherwise imperfect decisions, in which imperfection is judged by reference to the wel-fare of those same individuals. As Tables 2 through 5 show, monetary incentives in these settings can generate large increases in desirable behavior, but are sometimes too expensive to generate a favorable ratio of impact to cost. Because traditional interventions are intended to change behavior by altering the cost-benefit calculation that individuals undertake when focusing on a particular decision, these interventions face the challenge that indi-viduals’ ability (and desire) to engage high-level cogni-tive capacities is often limited (Shah, Mullainathan, & Shafir, 2012). Nudges, by contrast, can succeed because they account for individuals’ intuitions, emotions, and automatic decision-making processes. These processes can be triggered or enlisted with simple cues and subtle changes to the choice environment, so nudges can be effective yet cheap, generating high impact per dollar spent.
Should nudges therefore replace traditional policy tools? Sometimes, but often not, and so it would be a mistake to jump to this conclusion. As the case of exter-nalities reveals, nudges are not always the best tool for pursuing policy objectives, and prohibitions and man-dates have their place (consider the problem of violent crime). In many cases, nudges work in concert with other tools, which makes it easier for individuals to take advan-tage of beneficial programs and subsidies that are already in place. For example, the retirement-savings active-decision nudge directed greater attention to an existing savings plan, the FAFSA intervention increased college attendance by simplifying the process of applying for stu-dent aid programs, and the vaccination-planning prompts helped individuals to focus on how they could follow through on the intention to attend an existing free work-place clinic. Automatic enrollment in savings plans and default flu-shot appointments required no up-front effort on the part of individuals but nonetheless started them

12 Benartzi et al.
down the path of engaging with existing savings plans and free vaccination clinics, respectively.
An important caveat to our calculations is that they are not apples-to-apples exercises: They compared the effec-tiveness of different interventions without holding fixed the population studied. We lack sufficient studies com-paring multiple policy interventions simultaneously across similar populations. It would also be desirable to examine additional consequences of interventions beyond their effects on the narrow behavior targeted (e.g., costs incurred by individuals as they react to the interventions; see Allcott & Kessler, 2015). Notably, the operational philosophy of nudging is to test competing behavioral interventions and then to cull ineffective ones from the portfolio of nudges. This rapid testing cycle—along with the low cost of deploying most nudges in the first place—increases the likelihood that failures will be inexpensive.
Conclusion
We offer three recommendations. First, there should be increased investment in behaviorally informed policies to supplement traditional policies both inside and outside of governments. Second, nudge units and other organiza-tions enlisting nudges should share data and knowledge (e.g., through a central repository) and coordinate efforts to maximize their learning from one another. Tracking failures is as important for knowledge creation as track-ing successes. Third, behavioral scientists should mea-sure relative effectiveness explicitly in their studies in order to quantify the impact of nudge interventions com-pared with other available policy tools (and to learn which nudge interventions work best). Nudging has entered governments in the United Kingdom, in the United States, and far beyond, but in light of growing evidence of its relative effectiveness, we believe that policymakers should nudge more.
Action Editor
Gretchen B. Chapman served as action editor for this article.
Author Contributions
All of the authors developed the concept for this article. S. Benartzi, J. Beshears, and K. L. Milkman developed the criteria for selecting policy domains and prior studies for inclusion in the relative-effectiveness analysis. J. Beshears conducted this analysis. M. Shankar, W. Tucker-Ray, W. J. Congdon, S. Galing, and K. L. Milkman designed and implemented the Social and Behavioral Sciences Team–Department of Defense (SBST-DOD) experiment. J. Beshears and K. L. Milkman analyzed the data for the SBST-DOD experiment. S. Benartzi, J. Beshears, and K. L. Milkman drafted the manuscript, and C. R. Sunstein, R. H. Thaler, M. Shankar, and W. Tucker-Ray provided critical
revisions. All of the authors approved the final version of the manuscript for submission.
Acknowledgments
The authors thank Andrew Joung, David Mao, Byron Perpetua, and Sean (Yixiang) Wang for outstanding research assistance, as well as Leslie Bales, Hyunsoo Chang, Daniel J. Hopkins, Bruce Keith, and the staff of the Defense Finance and Accounting Ser-vice for integral support on the Social and Behavioral Sciences Team–Department of Defense (SBST-DOD) experiment.
Declaration of Conflicting Interests
S. Benartzi is the Chief Scientist of the California Digital Nudge Initiative, an uncompensated position. He is also a compen-sated academic advisor to Voya Financial, Acorns, Personal Capital, and idomoo. J. Beshears is a compensated advisor to Nutmeg Saving and Investment and an uncompensated advisor to Morningstar and 401k4USA. K. L. Milkman is a compensated advisor to HealthPrize and idomoo and an uncompensated advisor to Morningstar. C. R. Sunstein was Administrator of the Office of Information and Regulatory Affairs (2009–2012), served on the President’s Review Group on Intelligence and Communications Technologies (2013–2014), and served on the Defense Innovation Board of the Department of Defense (2016–2017). He is an uncompensated board member of Greenudge and a compensated affiliate of The Greatest Good, a consulting group that sometimes uses behavioral science. He has consulted with many governments on behavioral science, including in Sweden, Germany, Denmark, Mexico, the United Kingdom, and Colombia, and he is occasionally compensated for this work. He has also been compensated as a consultant for PepsiCo on issues relating to the use of behavioral science. R. H. Thaler has served as an uncompensated advisor to the United Kingdom Behavioural Insights Team and the United States Social and Behavioral Sciences Team, both from their inception. He also has numerous behavioral biases so would personally benefit from evidence-based noncoercive nudges. M. Shankar was a Senior Advisor at the White House Office of Science and Technology Policy and Chair of the Social and Behavioral Sciences Team (2013–2016). She was also an Ameri-can Association for the Advancement of Science Fellow (2013–2016) and a research fellow at Princeton University (2016–2017). W. Tucker-Ray was a Fellow on the Social and Behavioral Sci-ences Team (2014–2016) and has also been a Fellow at the Office of Evaluation Sciences (2016–present). He is also an employee of ideas42, a nonprofit organization that uses behav-ioral science. W. J. Congdon was a Fellow on the Social and Behavioral Sciences Team (2014–2016) and is currently an employee of ideas42. S. Galing is an employee of the U.S. Department of Defense.
Funding
J. Beshears received financial support from the Pershing Square Fund for Research on the Foundations of Human Behavior. M. Shankar received financial support from the Alfred P. Sloan Foundation. W. Tucker-Ray and W. J. Congdon received finan-cial support from the Laura and John Arnold Foundation.
Should Governments Invest More in Nudging? 13
Supplemental Material
Additional supporting information can be found at http:// journals.sagepub.com/doi/suppl/10.1177/0956797617702501
Open Practices
The only original data we used in these analyses came from a White House Social and Behavioral Sciences Team (SBST) experiment with the U.S. Department of Defense (DOD). Because the data concerns the administrative personnel records of active-duty service members, the SBST-DOD will not release it publicly. That said, we would be delighted to connect any researchers interested in working with this data to the right people in the SBST. All materials have been made publicly available via the Open Science Framework and can be accessed at https://osf.io/5xysn/. The complete Open Practices Disclo-sure for this article can be found at http://journals.sagepub .com/doi/suppl/10.1177/0956797617702501. This article has received the badge for Open Materials. More information about the Open Practices badges can be found at http://www .psychologicalscience.org/publications/badges.
Notes
1. This estimate is relative to our estimate of what would have happened had everyone been in the control group. To estimate the overall effect of the e-mail campaign on enrollment, we ran an ordinary least squares (OLS) regression with an indicator for enrollment as the outcome variable and with only a constant and an indicator variable for receiving an e-mail as the explanatory variables. Multiplying the point estimate (and the end points of the 95% confidence interval) for the coefficient on the e-mail indicator variable by the number of individuals who received e-mails, we estimated that the e-mail campaign increased savings-program enrollment by 5,265 people (95% confidence interval = [4,563, 5,968]). Using the same methodology, we also estimated that the e-mail campaign increased total contributions to retire-ment accounts in the month following the e-mail campaign by $1,367,423. Note that this last calculation excludes Marines and is therefore an understatement of the effect.2. See https://scholar.google.com/citations?view_op=top_venues. Our results were obtained September 29, 2015.3. Another potential concern is that our process for selecting research articles might be likely to identify false-positive results. We have conducted p-curve analyses for the key results identi-fied by our process. The results concerning nudge interventions have evidential value, as do the results concerning traditional interventions (see Evidential Value of the Underlying Studies in the Supplemental Material).4. This may have led us to account for a category of cost in one setting but not in another. For example, administrative and marketing costs for a purely informational intervention may be the most significant costs of the intervention, and we would therefore have included them in our cost accounting. However, for grant programs or tax credits, administrative and marketing costs are small in relation to the total amount of money trans-ferred, so accounting for them would not significantly affect our
estimates. Thus, we did not explicitly incorporate such costs.5. We converted Danish kroner to U.S. dollars using the 6.5-to-1 exchange rate preferred by Chetty et al. (2014), and we then adjusted from 1999 to 2015 price levels. Chetty et al. (2014) also studied the extent to which savings increases in a retire-ment account caused by changes to automatic contributions or caused by changes to tax incentives are offset by savings decreases in an individual’s other financial accounts. The off-set is minor in the case of changes to automatic contributions. However, when savings in a retirement account are altered in response to changes to tax incentives for the account, this response is almost completely offset by adjustments in other accounts. The other articles that we analyzed did not report results regarding the extent of such offsetting because the data were not available.6. Note that Dynarski (2003) evaluated the elimination of an incentive rather than the addition of an incentive, which may not have symmetric effects given past research showing that losses loom larger than gains (Kahneman & Tversky, 1979). Other researchers (Linsenmeier, Rosen, & Rouse, 2006; Conley & Taber, 2011) did not find statistically significant estimates of the effect of grants on college enrollment. Our focus on the Dynarski (2003) results was a potentially overly optimistic view of the effect of educational subsidies.7. Sexton (2015) demonstrated that withdrawing consumers from automatic electricity-bill payment programs significantly reduced energy usage. This intervention does not fit into any of the traditional policy categories we evaluated; it comes closest to being a nudge. We excluded it from our analysis because it imposed significant transaction costs on consumers and there-fore is not truly a nudge.
References
Allcott, H. (2011). Social norms and energy conservation. Journal of Public Economics, 95, 1082–1095.
Allcott, H., & Kessler, J. B. (2015). The welfare effects of nudges: A case study of energy use social comparisons (National Bureau of Economic Research Working Paper 21671). Retrieved from http://www.nber.org/papers/w21671
Allcott, H., & Mullainathan, S. (2010). Behavior and energy pol-icy. Science, 327, 1204–1205.
Allcott, H., & Rogers, T. (2014). The short-run and long-run effects of behavioral interventions: Experimental evidence from energy conservation. American Economic Review, 104, 3003–3037.
Arimura, T. H., Li, S., Newell, R. G., & Palmer, K. (2012). Cost-effectiveness of electricity energy efficiency programs. Energy Journal, 33, 63–99.
Asensio, O. I., & Delmas, M. A. (2015). Nonprice incentives and energy conservation. Proceedings of the National Academy of Sciences, USA, 112, E510–E515.
The Behavioural Insights Team. (2015). The Behavioural Insights Team update report 2013-2015. Retrieved from http://38r8om2xjhhl25mw24492dir.wpengine.netdna-cdn .com/wp-content/uploads/2015/08/BIT_Update-Report-Final-2013-2015.pdf
Benartzi, S., & Thaler, R. H. (2013). Behavioral economics and the retirement savings crisis. Science, 339, 1152–1153.
14 Benartzi et al.
Bettinger, E. P., Long, B. T., Oreopoulos, P., & Sanbonmatsu, L. (2012). The role of application assistance and information in college decisions: Results from the H&R Block FAFSA exper-iment. Quarterly Journal of Economics, 127, 1205–1242.
Bronchetti, E. T., Huffman, D. B., & Magenheim, E. (2015). Attention, intentions, and follow-through in preventive health behavior: Field experimental evidence on flu vac-cination. Journal of Economic Behavior & Organization, 116, 270–291.
Bulman, G. B., & Hoxby, C. M. (2015). The returns to the fed-eral tax credits for higher education. Tax Policy and the Economy, 29, 13–88.
Card, D., & Ransom, M. (2011). Pension plan characteristics and framing effects in employee savings behavior. The Review of Economics and Statistics, 93, 228–243.
Carroll, G. D., Choi, J. J., Laibson, D., Madrian, B. C., & Metrick, A. (2009). Optimal defaults and active decisions. Quarterly Journal of Economics, 124, 1639–1674.
Chapman, G. B., Li, M., Colby, H., & Yoon, H. (2010). Opting in vs opting out of influenza vaccination. Journal of the American Medical Association, 304, 43–44.
Chetty, R., Friedman, J. N., Leth-Petersen, S., Nielsen, T. H., & Olsen, T. (2014). Active vs. passive decisions and crowd-out in retirement savings accounts: Evidence from Denmark. Quarterly Journal of Economics, 129, 1141–1219.
Choi, J. J., Laibson, D., & Madrian, B. C. (2011). $100 bills on the sidewalk: Suboptimal investment in 401(k) plans. The Review of Economics and Statistics, 93, 748–763.
Conley, T. G., & Taber, C. R. (2011). Inference with “difference in differences” with a small number of policy changes. The Review of Economics and Statistics, 93, 113–125.
Duflo, E., Gale, W., Liebman, J., Orszag, P., & Saez, E. (2006). Saving incentives for low- and middle-income fami-lies: Evidence from a field experiment with H&R Block. Quarterly Journal of Economics, 121, 1311–1346.
Duflo, E., Gale, W., Liebman, J., Orszag, P., & Saez, E. (2007). Savings incentives for low- and moderate-income families in the United States: Why is the saver’s credit not more effective? Journal of the European Economic Association, 5, 647–661.
Duflo, E., & Saez, E. (2003). The role of information and social interactions in retirement plan decisions: Evidence from a randomized experiment. Quarterly Journal of Economics, 118, 815–842.
Dynarski, S. M. (2003). Does aid matter? Measuring the effect of student aid on college attendance and completion. American Economic Review, 93, 279–288.
Goldin, J., & Lawson, N. (2016). Defaults, mandates, and taxes: Policy design with active and passive decision-makers. American Law and Economics Review, 18, 438–462.
Haidt, J. (2001). The emotional dog and its rational tail: A social intuitionist approach to moral judgment. Psychological Review, 108, 814–834.
Halpern, D. (2015). Inside the nudge unit: How small changes can make a big difference. London, England: WH Allen.
Ito, K. (2015). Asymmetric incentives in subsidies: Evidence from a large-scale electricity rebate program. American Economic Journal: Economic Policy, 7, 209–237.
Johnson, E. J., & Goldstein, D. (2003). Do defaults save lives? Science, 302, 1338–1339.
Johnson, E. J., Shu, S. B., Dellaert, B. G. C., Fox, C., Goldstein, D. G., Häubl, G., . . . Weber, E. U. (2012). Beyond nudges: Tools of a choice architecture. Marketing Letters, 23, 487–504.
Kahneman, D., & Tversky, A. (1979). Prospect theory: An analy-sis of decision under risk. Econometrica, 47, 263–291.
Kimura, A. C., Nguyen, C. N., Higa, J. I., Hurwitz, E. L., & Vugia, D. J. (2007). The effectiveness of vaccine day and educa-tional interventions on influenza vaccine coverage among health care workers at long-term care facilities. American Journal of Public Health, 97, 684–690.
Larrick, R. P., & Soll, J. B. (2008). The mpg illusion. Science, 320, 1593–1594.
Linsenmeier, D. M., Rosen, H. S., & Rouse, C. E. (2006). Financial aid packages and college enrollment decisions: An econometric case study. The Review of Economics and Statistics, 88, 126–145.
Long, B. T. (2004a). Does the format of a financial aid program matter? The effect of state in-kind tuition subsidies. The Review of Economics and Statistics, 86, 767–782.
Long, B. T. (2004b). The impact of federal tax credits for higher education expenses. In C. M. Hoxby (Ed.), College choices: The economics of where to go, when to go, and how to pay for it (pp. 101–168). Chicago, IL: University of Chicago Press.
Ly, K., Mazar, N., Zhao, M., & Soman, D. (2013). A practitioner’s guide to nudging (Rotman School of Management Working Paper No. 2609347). doi:10.2139/ssrn.2609347
Madrian, B. C., & Shea, D. F. (2001). The power of sugges-tion: Inertia in 401(k) participation and savings behavior. Quarterly Journal of Economics, 116, 1149–1187.
Milkman, K. L., Beshears, J., Choi, J. J., Laibson, D., & Madrian, B. C. (2011). Using implementation intentions prompts to enhance influenza vaccination rates. Proceedings of the National Academy of Sciences, USA, 108, 10415–10420.
Obama, B. (2015). Executive order—Using behavioral science insights to better serve the American people. Retrieved from https://www.whitehouse.gov/the-press-office/2015/09/15/executive-order-using-behavioral-science-insights-better-serve-american
O’Donoghue, T., & Rabin, M. (1999). Doing it now or later. American Economic Review, 89, 103–124.
Prelec, D., & Loewenstein, G. (1998). The red and the black: Mental accounting of savings and debt. Marketing Science, 17, 4–28.
Rogers, T., Milkman, K. L., John, L. K., & Norton, M. I. (2015). Beyond good intentions: Prompting people to make plans improves follow-through on important tasks. Behavioral Science & Policy, 1(2), 33–41.
Schultz, P. W., Nolan, J. M., Cialdini, R. B., Goldstein, N. J., & Griskevicius, V. (2007). The constructive, destructive, and reconstructive power of social norms. Psychological Science, 18, 429–434.
Sexton, S. (2015). Automatic bill payment and salience effects: Evidence from electricity consumption. The Review of Economics and Statistics, 97, 229–241.
Shah, A., Mullainathan, S., & Shafir, E. (2012). Some conse-quences of having too little. Science, 338, 682–685.
Social and Behavioral Sciences Team. (2015). Social and Behavioral Sciences Team annual report. Retrieved from https://www.dol.gov/asp/evaluation/reports/sbst_2015_annual_report_final_9_14_15.pdf

Should Governments Invest More in Nudging? 15
Sunstein, C. R. (2013). Simpler: The future of government. New York, NY: Simon & Schuster.
Sunstein, C. R., & Reisch, L. A. (2014). Automatically green: Behavioral economics and environmental protection. Harvard Environmental Law Review, 38, 127–158.
Thaler, R. H., & Sunstein, C. R. (2008). Nudge: Improving deci-sions about health, wealth, and happiness. New Haven, CT: Yale University Press.
U.S. Department of Agriculture, Food and Nutrition Service, Office of Research and Analysis. (2013). Direct certification
in the national school lunch program: State implementa-tion progress, school year 2012-2013, report to Congress—Summary. Retrieved from https://www.fns.usda.gov/sites/default/files/NSLPDirectCertification2013_Summary.pdf
U.S. Office of Management and Budget. (2016). Budget of the U.S. government, fiscal year 2017. Retrieved from https://www.govinfo.gov/content/pkg/BUDGET-2017-BUD/pdf/BUDGET-2017-BUD.pdf
The World Bank. (2015). World development report 2015: Mind, society, and behavior. Washington, DC: Author.