Embed Size (px)
Citation preview
Chem 360 Jasperse Ch. 13 Notes. Spectroscopy
1
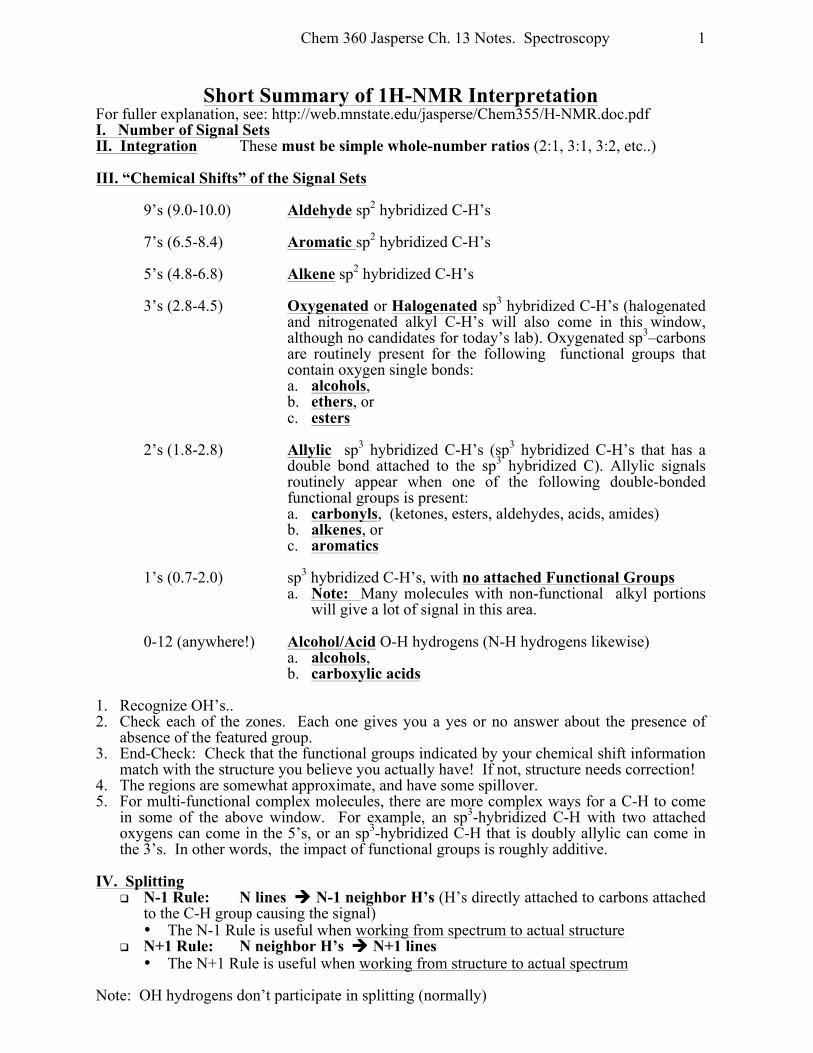
Short Summary of 1H-NMR Interpretation
For fuller explanation, see: http://web.mnstate.edu/jasperse/Chem355/H-NMR.doc.pdf I. Number of Signal Sets II. Integration These must be simple whole-number ratios (2:1, 3:1, 3:2, etc..) III. “Chemical Shifts” of the Signal Sets
9’s (9.0-10.0) Aldehyde sp2 hybridized C-H’s 7’s (6.5-8.4) Aromatic sp2 hybridized C-H’s 5’s (4.8-6.8) Alkene sp2 hybridized C-H’s 3’s (2.8-4.5) Oxygenated or Halogenated sp3 hybridized C-H’s (halogenated
and nitrogenated alkyl C-H’s will also come in this window, although no candidates for today’s lab). Oxygenated sp3–carbons are routinely present for the following functional groups that contain oxygen single bonds: a. alcohols, b. ethers, or c. esters
2’s (1.8-2.8) Allylic sp3 hybridized C-H’s (sp3 hybridized C-H’s that has a
double bond attached to the sp3 hybridized C). Allylic signals routinely appear when one of the following double-bonded functional groups is present: a. carbonyls, (ketones, esters, aldehydes, acids, amides) b. alkenes, or c. aromatics
1’s (0.7-2.0) sp3 hybridized C-H’s, with no attached Functional Groups
a. Note: Many molecules with non-functional alkyl portions will give a lot of signal in this area.
0-12 (anywhere!) Alcohol/Acid O-H hydrogens (N-H hydrogens likewise)
a. alcohols, b. carboxylic acids
1. Recognize OH’s.. 2. Check each of the zones. Each one gives you a yes or no answer about the presence of
absence of the featured group. 3. End-Check: Check that the functional groups indicated by your chemical shift information
match with the structure you believe you actually have! If not, structure needs correction! 4. The regions are somewhat approximate, and have some spillover. 5. For multi-functional complex molecules, there are more complex ways for a C-H to come
in some of the above window. For example, an sp3-hybridized C-H with two attached oxygens can come in the 5’s, or an sp3-hybridized C-H that is doubly allylic can come in the 3’s. In other words, the impact of functional groups is roughly additive.
IV. Splitting
q N-1 Rule: N lines à N-1 neighbor H’s (H’s directly attached to carbons attached to the C-H group causing the signal) • The N-1 Rule is useful when working from spectrum to actual structure
q N+1 Rule: N neighbor H’s à N+1 lines • The N+1 Rule is useful when working from structure to actual spectrum
Note: OH hydrogens don’t participate in splitting (normally)
Chem 360 Jasperse Ch. 13 Notes. Spectroscopy
2
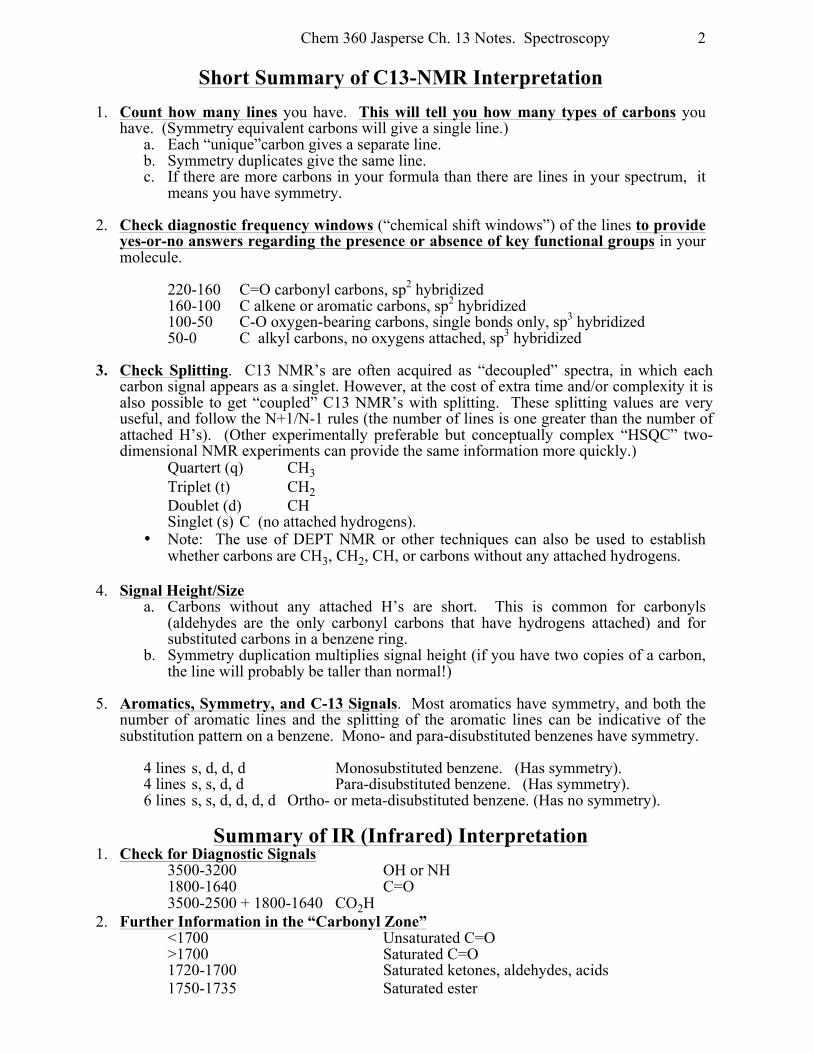
Short Summary of C13-NMR Interpretation 1. Count how many lines you have. This will tell you how many types of carbons you
have. (Symmetry equivalent carbons will give a single line.) a. Each “unique”carbon gives a separate line. b. Symmetry duplicates give the same line. c. If there are more carbons in your formula than there are lines in your spectrum, it
means you have symmetry.
2. Check diagnostic frequency windows (“chemical shift windows”) of the lines to provide yes-or-no answers regarding the presence or absence of key functional groups in your molecule.
220-160 C=O carbonyl carbons, sp2 hybridized 160-100 C alkene or aromatic carbons, sp2 hybridized 100-50 C-O oxygen-bearing carbons, single bonds only, sp3 hybridized 50-0 C alkyl carbons, no oxygens attached, sp3 hybridized
3. Check Splitting. C13 NMR’s are often acquired as “decoupled” spectra, in which each
carbon signal appears as a singlet. However, at the cost of extra time and/or complexity it is also possible to get “coupled” C13 NMR’s with splitting. These splitting values are very useful, and follow the N+1/N-1 rules (the number of lines is one greater than the number of attached H’s). (Other experimentally preferable but conceptually complex “HSQC” two-dimensional NMR experiments can provide the same information more quickly.)
Quartert (q) CH3 Triplet (t) CH2 Doublet (d) CH Singlet (s) C (no attached hydrogens).
• Note: The use of DEPT NMR or other techniques can also be used to establish whether carbons are CH3, CH2, CH, or carbons without any attached hydrogens.
4. Signal Height/Size
a. Carbons without any attached H’s are short. This is common for carbonyls (aldehydes are the only carbonyl carbons that have hydrogens attached) and for substituted carbons in a benzene ring.
b. Symmetry duplication multiplies signal height (if you have two copies of a carbon, the line will probably be taller than normal!)
5. Aromatics, Symmetry, and C-13 Signals. Most aromatics have symmetry, and both the
number of aromatic lines and the splitting of the aromatic lines can be indicative of the substitution pattern on a benzene. Mono- and para-disubstituted benzenes have symmetry.
4 lines s, d, d, d Monosubstituted benzene. (Has symmetry). 4 lines s, s, d, d Para-disubstituted benzene. (Has symmetry). 6 lines s, s, d, d, d, d Ortho- or meta-disubstituted benzene. (Has no symmetry).
Summary of IR (Infrared) Interpretation 1. Check for Diagnostic Signals
3500-3200 OH or NH 1800-1640 C=O 3500-2500 + 1800-1640 CO2H
2. Further Information in the “Carbonyl Zone” <1700 Unsaturated C=O >1700 Saturated C=O 1720-1700 Saturated ketones, aldehydes, acids 1750-1735 Saturated ester
Chem 360 Jasperse Ch. 13 Notes. Spectroscopy
3
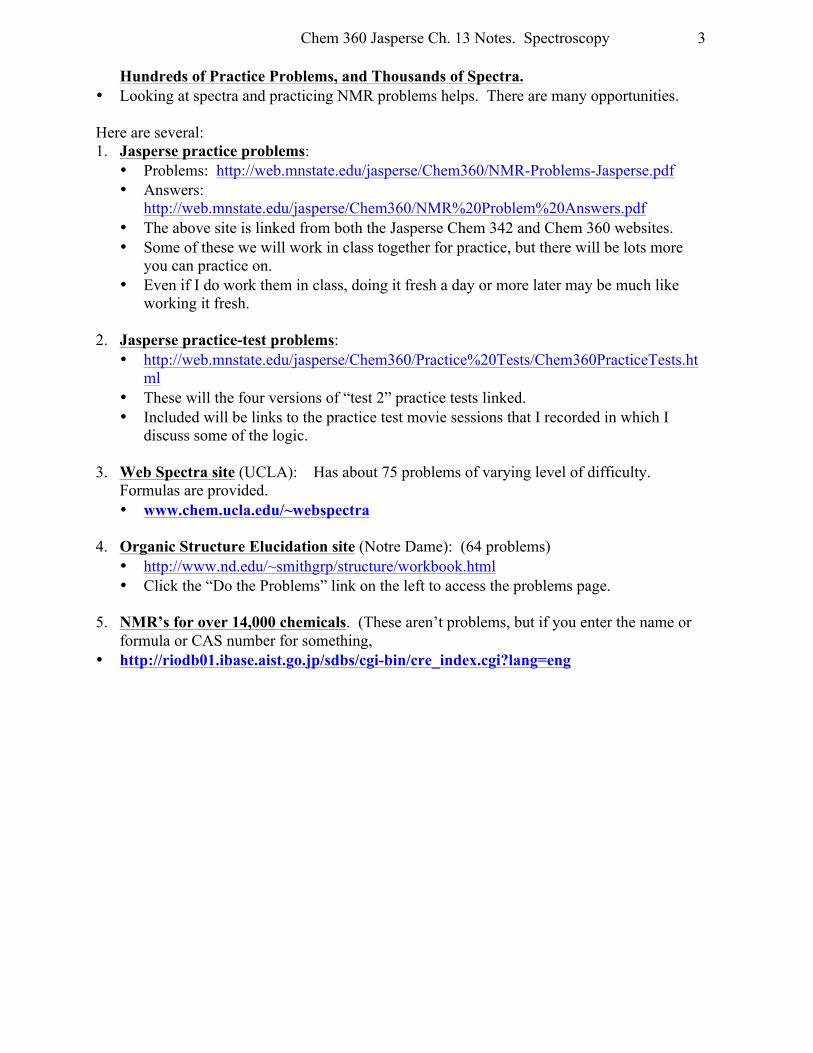
Hundreds of Practice Problems, and Thousands of Spectra. • Looking at spectra and practicing NMR problems helps. There are many opportunities. Here are several: 1. Jasperse practice problems:
• Problems: http://web.mnstate.edu/jasperse/Chem360/NMR-Problems-Jasperse.pdf • Answers:
http://web.mnstate.edu/jasperse/Chem360/NMR%20Problem%20Answers.pdf • The above site is linked from both the Jasperse Chem 342 and Chem 360 websites. • Some of these we will work in class together for practice, but there will be lots more
you can practice on. • Even if I do work them in class, doing it fresh a day or more later may be much like
working it fresh. 2. Jasperse practice-test problems:
• http://web.mnstate.edu/jasperse/Chem360/Practice%20Tests/Chem360PracticeTests.html
• These will the four versions of “test 2” practice tests linked. • Included will be links to the practice test movie sessions that I recorded in which I
discuss some of the logic. 3. Web Spectra site (UCLA): Has about 75 problems of varying level of difficulty.
Formulas are provided. • www.chem.ucla.edu/~webspectra
4. Organic Structure Elucidation site (Notre Dame): (64 problems)
• http://www.nd.edu/~smithgrp/structure/workbook.html • Click the “Do the Problems” link on the left to access the problems page.
5. NMR’s for over 14,000 chemicals. (These aren’t problems, but if you enter the name or
formula or CAS number for something, • http://riodb01.ibase.aist.go.jp/sdbs/cgi-bin/cre_index.cgi?lang=eng
Chem 360 Jasperse Ch. 13 Notes. Spectroscopy
4
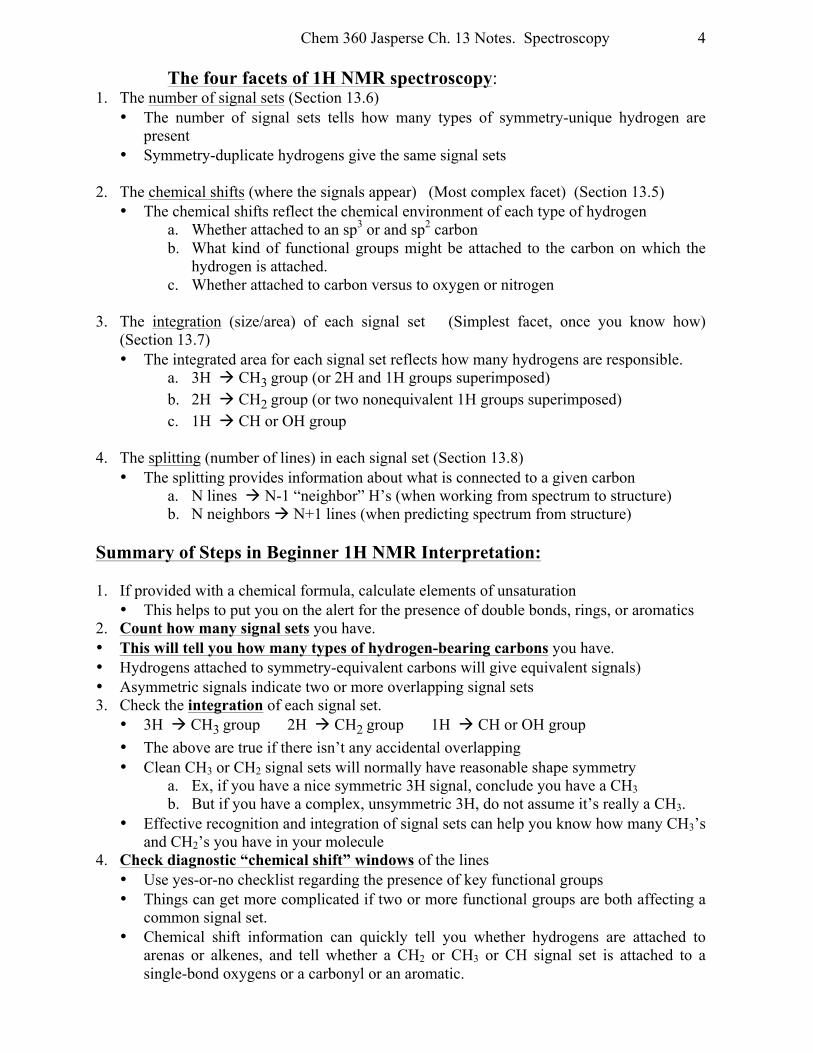
The four facets of 1H NMR spectroscopy: 1. The number of signal sets (Section 13.6)
• The number of signal sets tells how many types of symmetry-unique hydrogen are present
• Symmetry-duplicate hydrogens give the same signal sets 2. The chemical shifts (where the signals appear) (Most complex facet) (Section 13.5)
• The chemical shifts reflect the chemical environment of each type of hydrogen a. Whether attached to an sp3 or and sp2 carbon b. What kind of functional groups might be attached to the carbon on which the
hydrogen is attached. c. Whether attached to carbon versus to oxygen or nitrogen
3. The integration (size/area) of each signal set (Simplest facet, once you know how)
(Section 13.7) • The integrated area for each signal set reflects how many hydrogens are responsible.
a. 3H à CH3 group (or 2H and 1H groups superimposed) b. 2H à CH2 group (or two nonequivalent 1H groups superimposed) c. 1H à CH or OH group
4. The splitting (number of lines) in each signal set (Section 13.8)
• The splitting provides information about what is connected to a given carbon a. N lines à N-1 “neighbor” H’s (when working from spectrum to structure) b. N neighbors à N+1 lines (when predicting spectrum from structure)
Summary of Steps in Beginner 1H NMR Interpretation: 1. If provided with a chemical formula, calculate elements of unsaturation
• This helps to put you on the alert for the presence of double bonds, rings, or aromatics 2. Count how many signal sets you have. • This will tell you how many types of hydrogen-bearing carbons you have. • Hydrogens attached to symmetry-equivalent carbons will give equivalent signals) • Asymmetric signals indicate two or more overlapping signal sets 3. Check the integration of each signal set.
• 3H à CH3 group 2H à CH2 group 1H à CH or OH group • The above are true if there isn’t any accidental overlapping • Clean CH3 or CH2 signal sets will normally have reasonable shape symmetry
a. Ex, if you have a nice symmetric 3H signal, conclude you have a CH3 b. But if you have a complex, unsymmetric 3H, do not assume it’s really a CH3.
• Effective recognition and integration of signal sets can help you know how many CH3’s and CH2’s you have in your molecule
4. Check diagnostic “chemical shift” windows of the lines • Use yes-or-no checklist regarding the presence of key functional groups • Things can get more complicated if two or more functional groups are both affecting a
common signal set. • Chemical shift information can quickly tell you whether hydrogens are attached to
arenas or alkenes, and tell whether a CH2 or CH3 or CH signal set is attached to a single-bond oxygens or a carbonyl or an aromatic.
Chem 360 Jasperse Ch. 13 Notes. Spectroscopy
5
5. Check the splitting of each signal set. • A signal set with N lines means that there are N-1 hydrogens attached to carbons
directly connected to the carbon that holds the signal set hydrogens • The splitting tells you nothing about the signal set itself (for example, whether it is a
CH3 or a CH2 group). But it can tell you for example whether a CH3 group (for example) is connected to a CH2 group or a CH group, or perhaps to an oxygen or a carbonyl carbon that doesn’t have any directly attached hydrogens.
• Etc. 6. Try to find any sure things that you can as soon as you can. 7. Try to use integration to find any clean 3H signals that indicate CH3 groups. Then use
splitting and/or chemical shifts to track down what the CH3 group is connected to, etc.. Other Practical Tips 1. Try to recognize any easy and obvious sure-thing components, for example:
a. Aryl groups (chemical shift in the 7’s, a 4H or 5H integral depending on whether di- or mono-substituted)
b. CH3 methyl groups (based on clean 3H integration) c. Isopropyl groups (6H doublet) d. Alcohol OH: integrates for only 1H, and normally doesn’t have the splitting that a
CH hydrogen does 2. Try to work from end(s) toward the middle
• If you know you have a CH3 group, you can write it down for sure, and then try to figure out via splitting and/or chemical shifts what it’s connected to, etc.
3. Recognizing “end groups” can give you an idea whether you have a straight chain or have branching • CH3 • Cl, Br • OH • C6H5
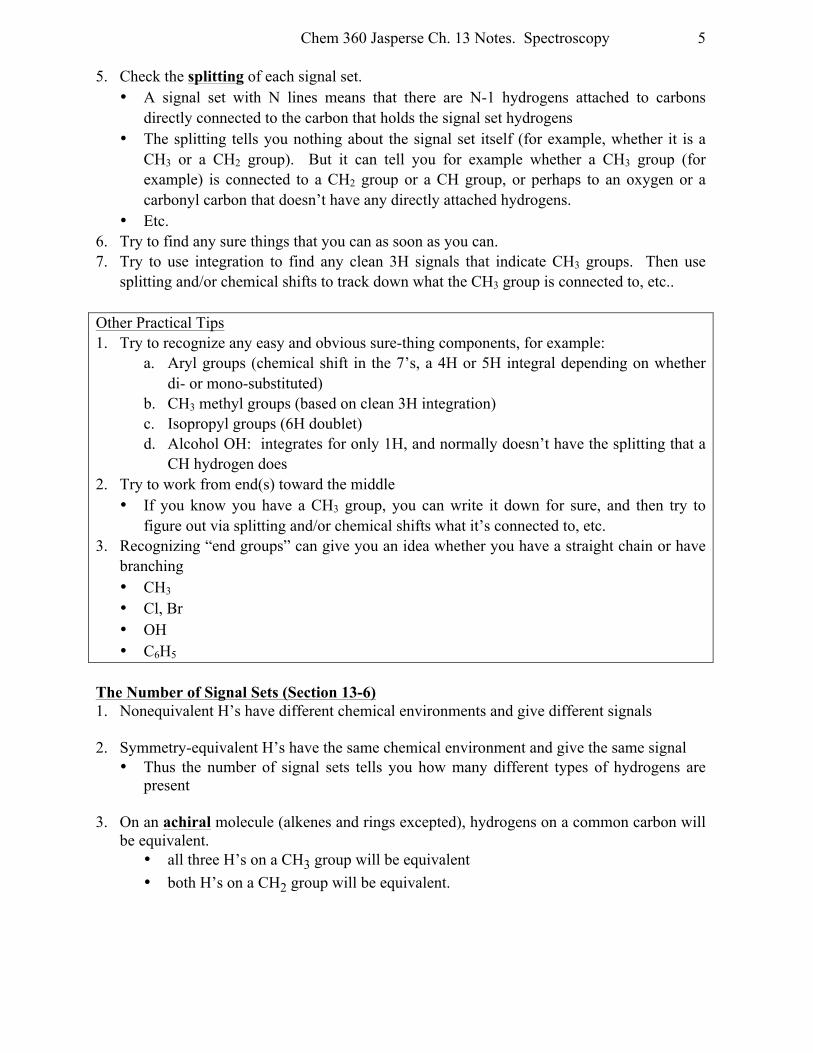
The Number of Signal Sets (Section 13-6) 1. Nonequivalent H’s have different chemical environments and give different signals 2. Symmetry-equivalent H’s have the same chemical environment and give the same signal
• Thus the number of signal sets tells you how many different types of hydrogens are present
3. On an achiral molecule (alkenes and rings excepted), hydrogens on a common carbon will
be equivalent. • all three H’s on a CH3 group will be equivalent • both H’s on a CH2 group will be equivalent.
Chem 360 Jasperse Ch. 13 Notes. Spectroscopy
6
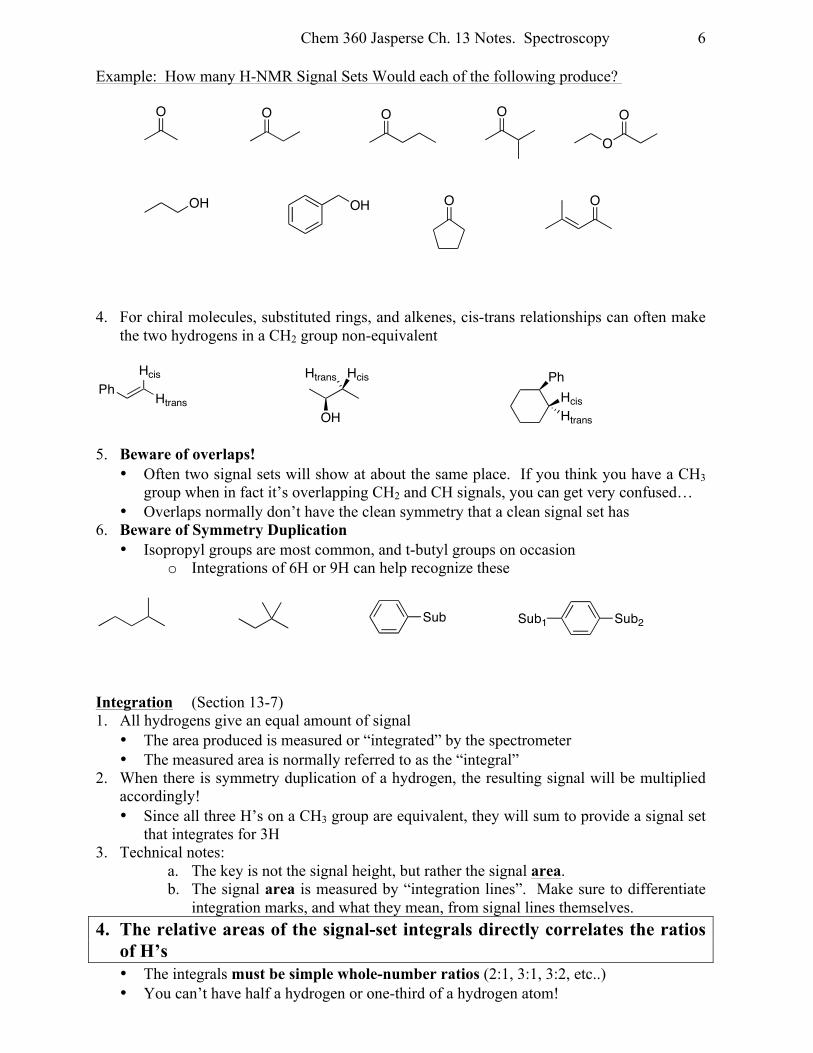
Example: How many H-NMR Signal Sets Would each of the following produce?
4. For chiral molecules, substituted rings, and alkenes, cis-trans relationships can often make
the two hydrogens in a CH2 group non-equivalent
5. Beware of overlaps!
• Often two signal sets will show at about the same place. If you think you have a CH3 group when in fact it’s overlapping CH2 and CH signals, you can get very confused…
• Overlaps normally don’t have the clean symmetry that a clean signal set has 6. Beware of Symmetry Duplication
• Isopropyl groups are most common, and t-butyl groups on occasion o Integrations of 6H or 9H can help recognize these
Integration (Section 13-7) 1. All hydrogens give an equal amount of signal
• The area produced is measured or “integrated” by the spectrometer • The measured area is normally referred to as the “integral”
2. When there is symmetry duplication of a hydrogen, the resulting signal will be multiplied accordingly! • Since all three H’s on a CH3 group are equivalent, they will sum to provide a signal set
that integrates for 3H 3. Technical notes:
a. The key is not the signal height, but rather the signal area. b. The signal area is measured by “integration lines”. Make sure to differentiate
integration marks, and what they mean, from signal lines themselves. 4. The relative areas of the signal-set integrals directly correlates the ratios
of H’s • The integrals must be simple whole-number ratios (2:1, 3:1, 3:2, etc..) • You can’t have half a hydrogen or one-third of a hydrogen atom!
OH
O O
O
O
OH
OO
O O
Ph Htrans
Hcis
OH
HcisHtrans PhHcisHtrans
Sub Sub2Sub1
Chem 360 Jasperse Ch. 13 Notes. Spectroscopy
7
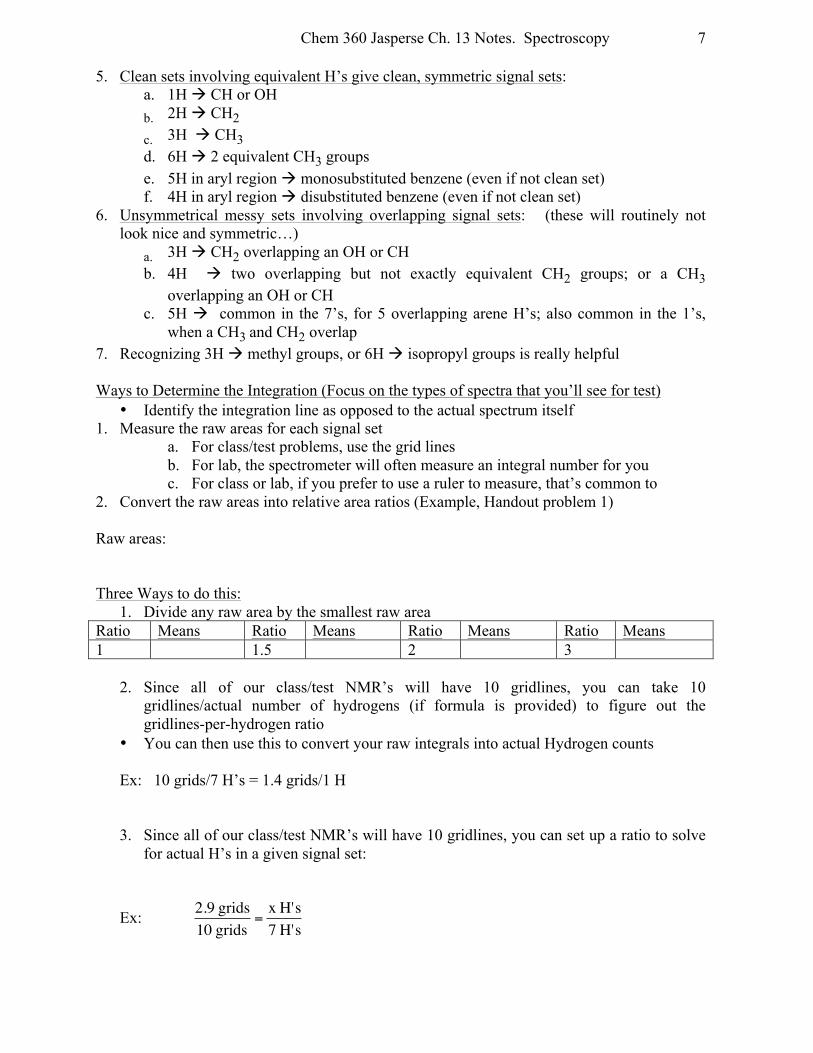
5. Clean sets involving equivalent H’s give clean, symmetric signal sets: a. 1H à CH or OH b. 2H à CH2
c. 3H à CH3 d. 6H à 2 equivalent CH3 groups e. 5H in aryl region à monosubstituted benzene (even if not clean set) f. 4H in aryl region à disubstituted benzene (even if not clean set)
6. Unsymmetrical messy sets involving overlapping signal sets: (these will routinely not look nice and symmetric…)
a. 3H à CH2 overlapping an OH or CH b. 4H à two overlapping but not exactly equivalent CH2 groups; or a CH3
overlapping an OH or CH c. 5H à common in the 7’s, for 5 overlapping arene H’s; also common in the 1’s,
when a CH3 and CH2 overlap 7. Recognizing 3H à methyl groups, or 6H à isopropyl groups is really helpful Ways to Determine the Integration (Focus on the types of spectra that you’ll see for test)
• Identify the integration line as opposed to the actual spectrum itself 1. Measure the raw areas for each signal set
a. For class/test problems, use the grid lines b. For lab, the spectrometer will often measure an integral number for you c. For class or lab, if you prefer to use a ruler to measure, that’s common to
2. Convert the raw areas into relative area ratios (Example, Handout problem 1) Raw areas: Three Ways to do this:
1. Divide any raw area by the smallest raw area Ratio Means Ratio Means Ratio Means Ratio Means 1 1.5 2 3
2. Since all of our class/test NMR’s will have 10 gridlines, you can take 10
gridlines/actual number of hydrogens (if formula is provided) to figure out the gridlines-per-hydrogen ratio
• You can then use this to convert your raw integrals into actual Hydrogen counts
Ex: 10 grids/7 H’s = 1.4 grids/1 H
3. Since all of our class/test NMR’s will have 10 gridlines, you can set up a ratio to solve for actual H’s in a given signal set:
Ex:
€
2.9 grids10 grids
=x H's7 H's
Chem 360 Jasperse Ch. 13 Notes. Spectroscopy
8
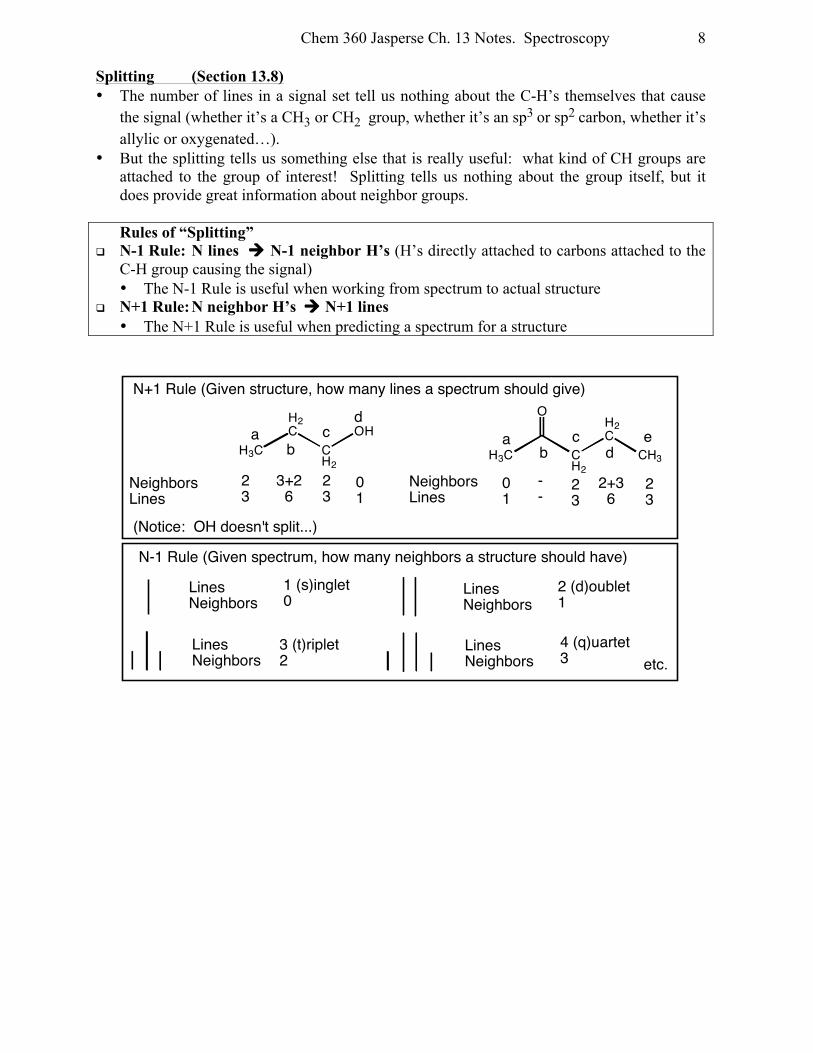
Splitting (Section 13.8) • The number of lines in a signal set tell us nothing about the C-H’s themselves that cause
the signal (whether it’s a CH3 or CH2 group, whether it’s an sp3 or sp2 carbon, whether it’s allylic or oxygenated…).
• But the splitting tells us something else that is really useful: what kind of CH groups are attached to the group of interest! Splitting tells us nothing about the group itself, but it does provide great information about neighbor groups.
Rules of “Splitting”
q N-1 Rule: N lines à N-1 neighbor H’s (H’s directly attached to carbons attached to the C-H group causing the signal) • The N-1 Rule is useful when working from spectrum to actual structure
q N+1 Rule: N neighbor H’s à N+1 lines • The N+1 Rule is useful when predicting a spectrum for a structure
H3C
H2C
CH2
OHab
cd
NeighborsLines
23
3+2 6
23
H3C CH2
H2C
CH3
O
eab
cd
NeighborsLines
01
--
23
23
2+3 6
01
(Notice: OH doesn't split...)
LinesNeighbors
1 (s)inglet0
LinesNeighbors
2 (d)oublet1
LinesNeighbors
4 (q)uartet3
LinesNeighbors
3 (t)riplet 2
N+1 Rule (Given structure, how many lines a spectrum should give)
N-1 Rule (Given spectrum, how many neighbors a structure should have)
etc.
Chem 360 Jasperse Ch. 13 Notes. Spectroscopy
9
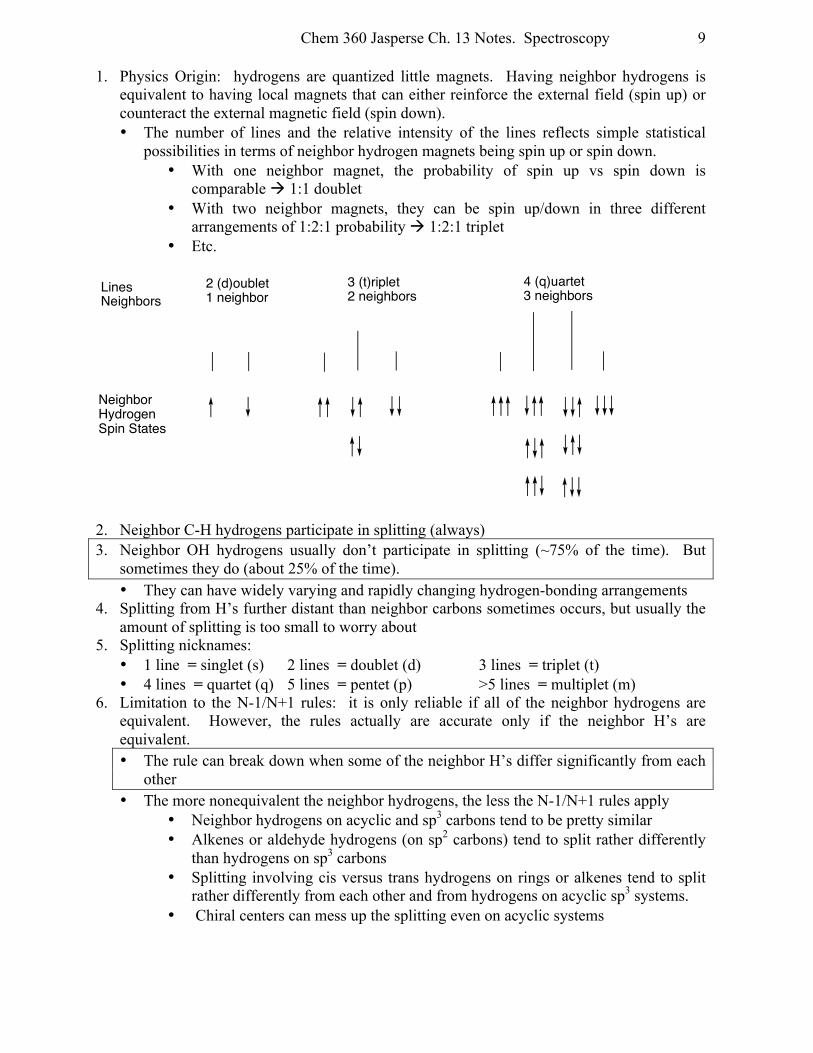
1. Physics Origin: hydrogens are quantized little magnets. Having neighbor hydrogens is equivalent to having local magnets that can either reinforce the external field (spin up) or counteract the external magnetic field (spin down). • The number of lines and the relative intensity of the lines reflects simple statistical
possibilities in terms of neighbor hydrogen magnets being spin up or spin down. • With one neighbor magnet, the probability of spin up vs spin down is
comparable à 1:1 doublet • With two neighbor magnets, they can be spin up/down in three different
arrangements of 1:2:1 probability à 1:2:1 triplet • Etc.
2. Neighbor C-H hydrogens participate in splitting (always) 3. Neighbor OH hydrogens usually don’t participate in splitting (~75% of the time). But
sometimes they do (about 25% of the time). • They can have widely varying and rapidly changing hydrogen-bonding arrangements
4. Splitting from H’s further distant than neighbor carbons sometimes occurs, but usually the amount of splitting is too small to worry about
5. Splitting nicknames: • 1 line = singlet (s) 2 lines = doublet (d) 3 lines = triplet (t) • 4 lines = quartet (q) 5 lines = pentet (p) >5 lines = multiplet (m)
6. Limitation to the N-1/N+1 rules: it is only reliable if all of the neighbor hydrogens are equivalent. However, the rules actually are accurate only if the neighbor H’s are equivalent. • The rule can break down when some of the neighbor H’s differ significantly from each
other • The more nonequivalent the neighbor hydrogens, the less the N-1/N+1 rules apply
• Neighbor hydrogens on acyclic and sp3 carbons tend to be pretty similar • Alkenes or aldehyde hydrogens (on sp2 carbons) tend to split rather differently
than hydrogens on sp3 carbons • Splitting involving cis versus trans hydrogens on rings or alkenes tend to split
rather differently from each other and from hydrogens on acyclic sp3 systems. • Chiral centers can mess up the splitting even on acyclic systems
LinesNeighbors
2 (d)oublet1 neighbor
NeighborHydrogenSpin States
4 (q)uartet 3 neighbors
3 (t)riplet 2 neighbors
Chem 360 Jasperse Ch. 13 Notes. Spectroscopy
10
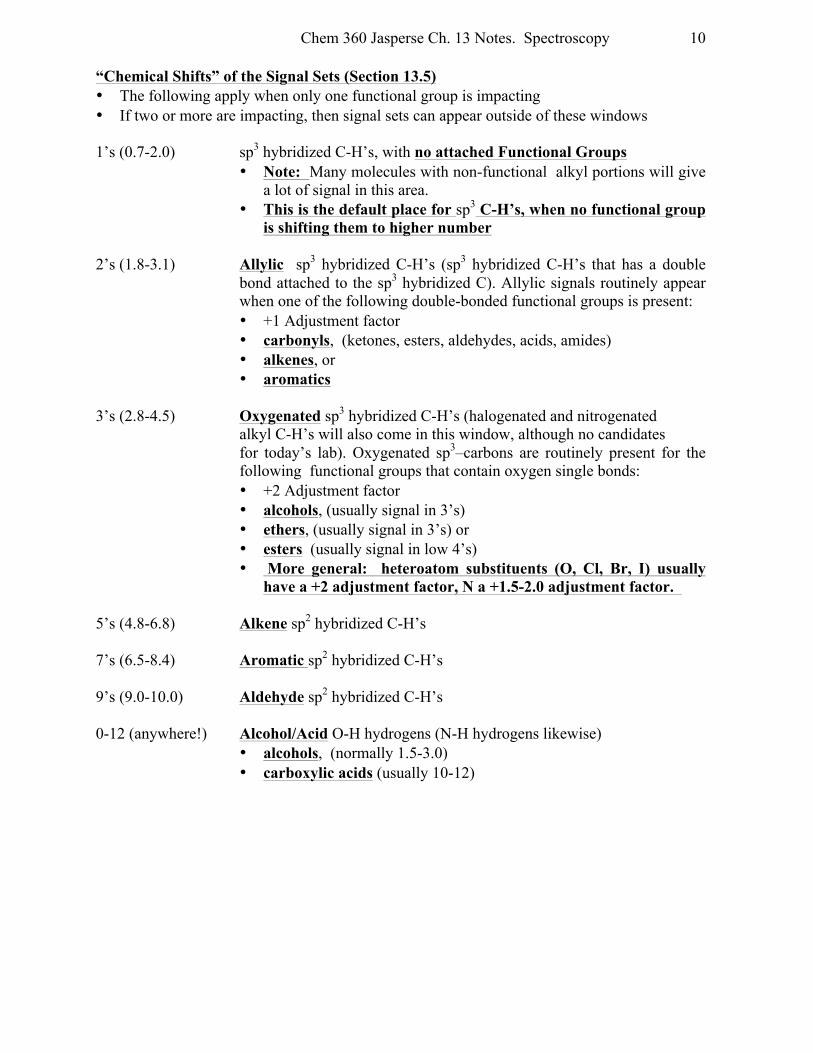
“Chemical Shifts” of the Signal Sets (Section 13.5) • The following apply when only one functional group is impacting • If two or more are impacting, then signal sets can appear outside of these windows 1’s (0.7-2.0) sp3 hybridized C-H’s, with no attached Functional Groups
• Note: Many molecules with non-functional alkyl portions will give a lot of signal in this area.
• This is the default place for sp3 C-H’s, when no functional group is shifting them to higher number
2’s (1.8-3.1) Allylic sp3 hybridized C-H’s (sp3 hybridized C-H’s that has a double
bond attached to the sp3 hybridized C). Allylic signals routinely appear when one of the following double-bonded functional groups is present: • +1 Adjustment factor • carbonyls, (ketones, esters, aldehydes, acids, amides) • alkenes, or • aromatics
3’s (2.8-4.5) Oxygenated sp3 hybridized C-H’s (halogenated and nitrogenated alkyl C-H’s will also come in this window, although no candidates for today’s lab). Oxygenated sp3–carbons are routinely present for the
following functional groups that contain oxygen single bonds: • +2 Adjustment factor • alcohols, (usually signal in 3’s) • ethers, (usually signal in 3’s) or • esters (usually signal in low 4’s) • More general: heteroatom substituents (O, Cl, Br, I) usually
have a +2 adjustment factor, N a +1.5-2.0 adjustment factor. 5’s (4.8-6.8) Alkene sp2 hybridized C-H’s 7’s (6.5-8.4) Aromatic sp2 hybridized C-H’s 9’s (9.0-10.0) Aldehyde sp2 hybridized C-H’s 0-12 (anywhere!) Alcohol/Acid O-H hydrogens (N-H hydrogens likewise)
• alcohols, (normally 1.5-3.0) • carboxylic acids (usually 10-12)
Chem 360 Jasperse Ch. 13 Notes. Spectroscopy
11
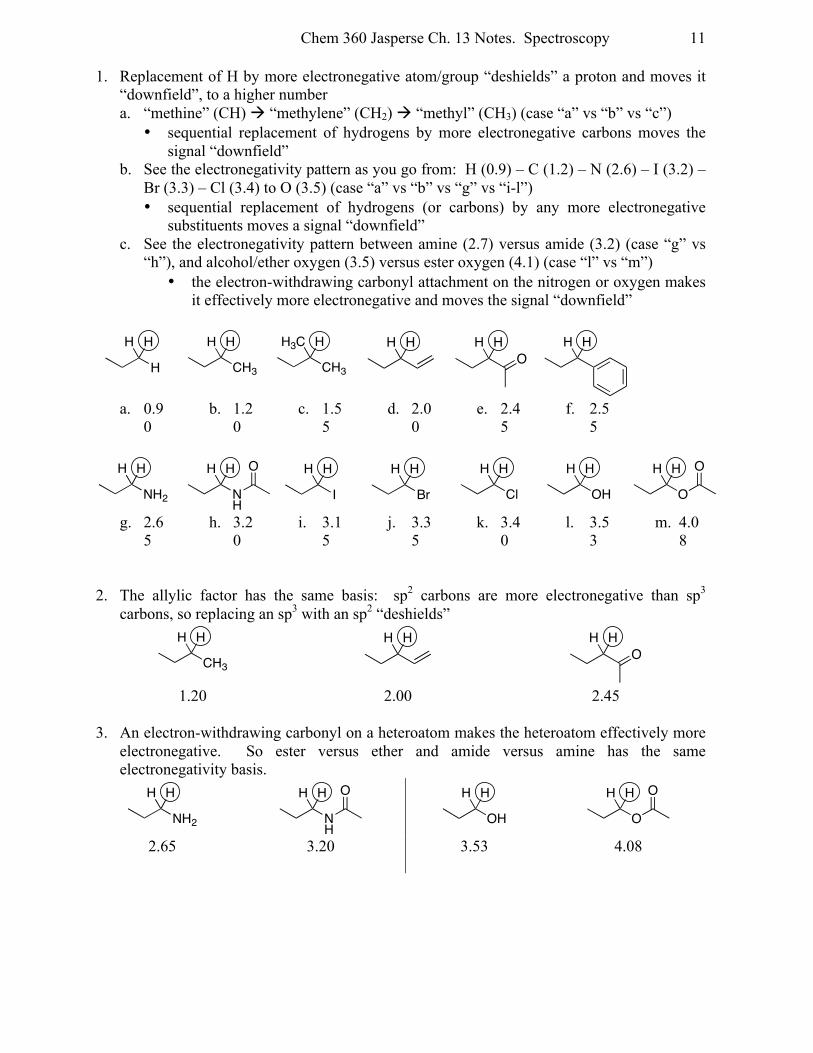
1. Replacement of H by more electronegative atom/group “deshields” a proton and moves it “downfield”, to a higher number a. “methine” (CH) à “methylene” (CH2) à “methyl” (CH3) (case “a” vs “b” vs “c”)
• sequential replacement of hydrogens by more electronegative carbons moves the signal “downfield”
b. See the electronegativity pattern as you go from: H (0.9) – C (1.2) – N (2.6) – I (3.2) – Br (3.3) – Cl (3.4) to O (3.5) (case “a” vs “b” vs “g” vs “i-l”) • sequential replacement of hydrogens (or carbons) by any more electronegative
substituents moves a signal “downfield” c. See the electronegativity pattern between amine (2.7) versus amide (3.2) (case “g” vs
“h”), and alcohol/ether oxygen (3.5) versus ester oxygen (4.1) (case “l” vs “m”) • the electron-withdrawing carbonyl attachment on the nitrogen or oxygen makes
it effectively more electronegative and moves the signal “downfield”
a. 0.90
b. 1.20
c. 1.55
d. 2.00
e. 2.45
f. 2.55
g. 2.65
h. 3.20
i. 3.15
j. 3.35
k. 3.40
l. 3.53
m. 4.08
2. The allylic factor has the same basis: sp2 carbons are more electronegative than sp3
carbons, so replacing an sp3 with an sp2 “deshields”
1.20 2.00 2.45 3. An electron-withdrawing carbonyl on a heteroatom makes the heteroatom effectively more
electronegative. So ester versus ether and amide versus amine has the same electronegativity basis.
2.65
3.20 3.53 4.08
H
H H
CH3
H H
CH3
H3C H H H H HO
H H
NH2
H H
NH
H H O
I
H H
Br
H H
Cl
H H
OH
H H
O
H H O
CH3
H H H H H HO
NH2
H H
NH
H H O
OH
H H
O
H H O
Chem 360 Jasperse Ch. 13 Notes. Spectroscopy
12
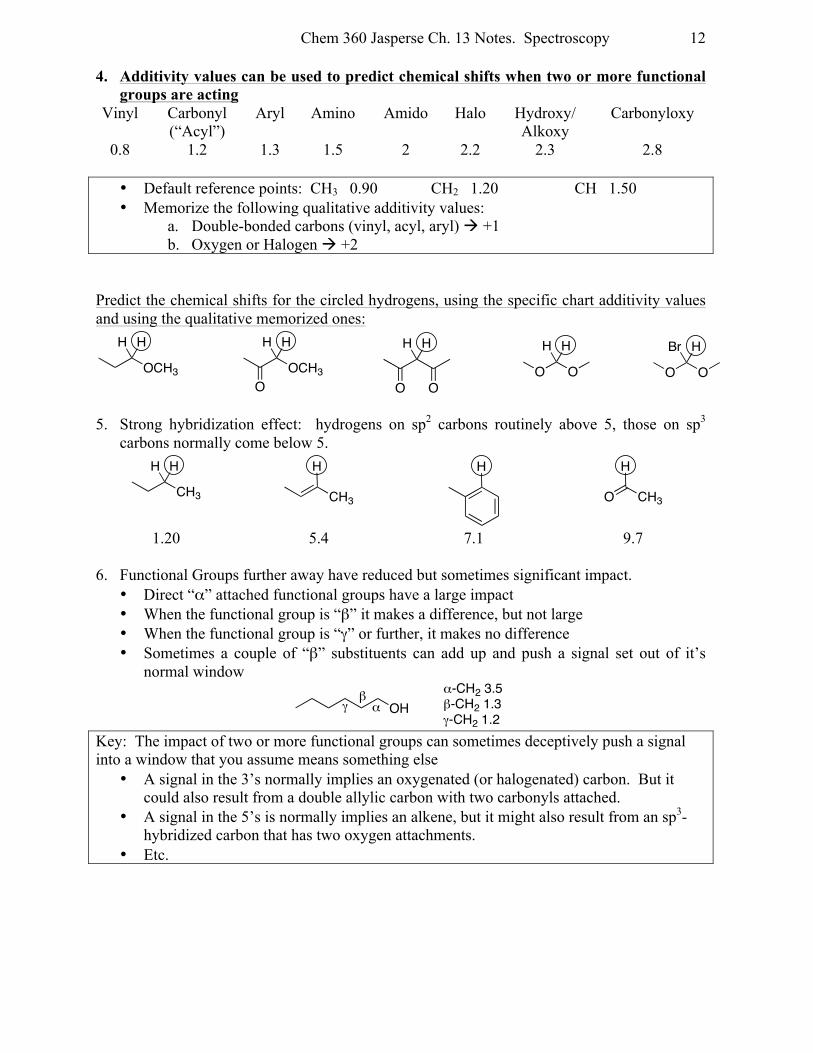
4. Additivity values can be used to predict chemical shifts when two or more functional groups are acting
Vinyl Carbonyl (“Acyl”)
Aryl Amino Amido Halo Hydroxy/ Alkoxy
Carbonyloxy
0.8 1.2 1.3 1.5 2 2.2 2.3 2.8
• Default reference points: CH3 0.90 CH2 1.20 CH 1.50 • Memorize the following qualitative additivity values:
a. Double-bonded carbons (vinyl, acyl, aryl) à +1 b. Oxygen or Halogen à +2
Predict the chemical shifts for the circled hydrogens, using the specific chart additivity values and using the qualitative memorized ones:
5. Strong hybridization effect: hydrogens on sp2 carbons routinely above 5, those on sp3
carbons normally come below 5.
1.20 5.4 7.1 9.7 6. Functional Groups further away have reduced but sometimes significant impact.
• Direct “α” attached functional groups have a large impact • When the functional group is “β” it makes a difference, but not large • When the functional group is “γ” or further, it makes no difference • Sometimes a couple of “β” substituents can add up and push a signal set out of it’s
normal window
Key: The impact of two or more functional groups can sometimes deceptively push a signal into a window that you assume means something else
• A signal in the 3’s normally implies an oxygenated (or halogenated) carbon. But it could also result from a double allylic carbon with two carbonyls attached.
• A signal in the 5’s is normally implies an alkene, but it might also result from an sp3-hybridized carbon that has two oxygen attachments.
• Etc.
OCH3
H H
OCH3
H H
O
H H
O OO O
H H
O O
Br H
CH3
H H
CH3
H H
O CH3
H
OHαβ
γα-CH2 3.5 β-CH2 1.3γ-CH2 1.2
Chem 360 Jasperse Ch. 13 Notes. Spectroscopy
13
7. Recognize OH’s..
a. An OH can come anywhere, and can easily cause you to make a mistaken conclusion about a feature group. For example, if you have an OH and it comes in the 2’s, and you conclude that you have an allylic C-H, that might send you down a bad blind alley. Or if you have an OH that appears in the 5’s, you might falsely deduce that you have an alkene, etc.. Thus it is really helpful to recognize OH’s when they appear so that they don’t confuse you.
b. Three recognition factors for OH signals: 1. They always integrate for 1H, never for 2H or 3H 2. They lack sharp splitting, and often appear as singlets, often somewhat broad.
C-H signals tend to be sharper, and any C-H signal set that integrates for 1H will have significant splitting. The only way to have a 1H that doesn’t split is for it to be an OH.
3. They come anywhere, but often in the 1.5-3.0 range 4. If you have an OH signal, of course you will also have some C-H signals in the 3.0-
4.5 area.
8. Check each of the zones. Each one gives you a tentative yes or no answer about the presence of absence of the featured group.
• Do I have something in the 9’s? If yes à aldehyde • Do I have something in the 7’s? (Other than a solvent singlet…)? If yes à
aromatic • Do I have something in the 5’s? If yes à alkene • Do I have something in the 3’s? If yes à alcohol, ether, or ester (or OH) • Do I have something in the 2’s? If yes à ketone, aromatic, or alkene (or OH) • Do I have something in the 1’s? If yes à some nonfunctional alkyl carbons (or
OH) Caution: Mistaken conclusions can sometimes be drawn from two sources:
a. An OH in the 2’s or 3’s or 5’s, from which you falsely conclude that you be allylic or oxygenated of vinylic
b. A signal that appears where it does because of the effect of two (or more) functional groups, rather than just one.
Chem 360 Jasperse Ch. 13 Notes. Spectroscopy
14
Standard Summary Format and Predicting H-NMR’s There is a standard summary report format for H-NMR’s which addresses chemical shift, integration, and splitting. Normally an interpretation/correlation with the actual structure is also included.
Ex: CH3OCH2CH2CH2C(O)CH3 (I’ll number the carbons from left to right…)
Standard report format (approximate chemical shift range, integration, splitting, and interpretation of which signal correlates to which group in the structure…)
3’s, 3H, s (CH3-1) 3’s, 2H, t (CH2-2) 1’s, 2H, p (CH2-3) 2’s, 2H, t (CH2-4) 2’s, 3H, s (CH3-6)
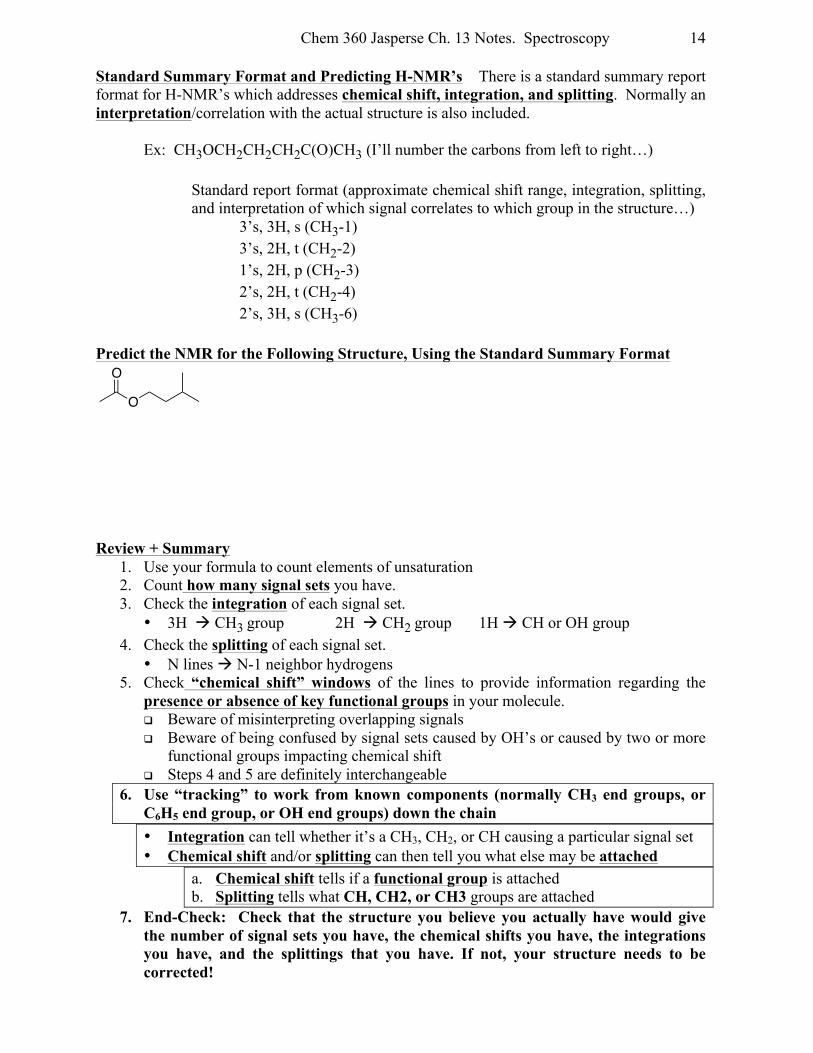
Predict the NMR for the Following Structure, Using the Standard Summary Format
Review + Summary
1. Use your formula to count elements of unsaturation 2. Count how many signal sets you have. 3. Check the integration of each signal set.
• 3H à CH3 group 2H à CH2 group 1H à CH or OH group 4. Check the splitting of each signal set.
• N lines à N-1 neighbor hydrogens 5. Check “chemical shift” windows of the lines to provide information regarding the
presence or absence of key functional groups in your molecule. q Beware of misinterpreting overlapping signals q Beware of being confused by signal sets caused by OH’s or caused by two or more
functional groups impacting chemical shift q Steps 4 and 5 are definitely interchangeable
6. Use “tracking” to work from known components (normally CH3 end groups, or C6H5 end group, or OH end groups) down the chain • Integration can tell whether it’s a CH3, CH2, or CH causing a particular signal set • Chemical shift and/or splitting can then tell you what else may be attached
a. Chemical shift tells if a functional group is attached b. Splitting tells what CH, CH2, or CH3 groups are attached
7. End-Check: Check that the structure you believe you actually have would give the number of signal sets you have, the chemical shifts you have, the integrations you have, and the splittings that you have. If not, your structure needs to be corrected!
O
O
Chem 360 Jasperse Ch. 13 Notes. Spectroscopy
15
13C NMR (Sections 13.13,14) • 13C is NMR active, 12C is not • Signals are much weaker, C-13 spectra are harder to get
o C-13 gives about 1/10,000th as strong a signal as H-NMR o Because the natural abundance is only 1%, and the inherent sensitivity is only 1%
• A result is that for C-13 NMR, one or more of the following is usually true: 1. Take longer 2. Not as clean a baseline 3. Higher sample/solvent concentration used 4. Data processing tricks used in order to shorten the process. These often result in:
o Loss of splitting information (“decoupled” C-13 NMR’s in lab…) o Loss of integration information (our C-13 NMR’s in lab…)
Summary of C-13 NMR Interpretation:
1. Count how many lines you have in a decoupled carbon spectrum. This will tell you how many types of carbons you have. (Symmetry equivalent carbons can at times cause the number of lines to be less than the number of carbons in your structure.)
2. Check diagnostic frequency windows (“chemical shift windows”) of the lines to provide yes-or-no answers regarding the presence or absence of key functional groups in your molecule.
3. If splitting information is provided via a coupled carbon spectrum, or a DEPT NMR spectrum is provided, or a phase-sensitive 2-dimensional NMR is provided, use tools like these to decide which carbons are CH3, CH2, CH, and no-H C’s.
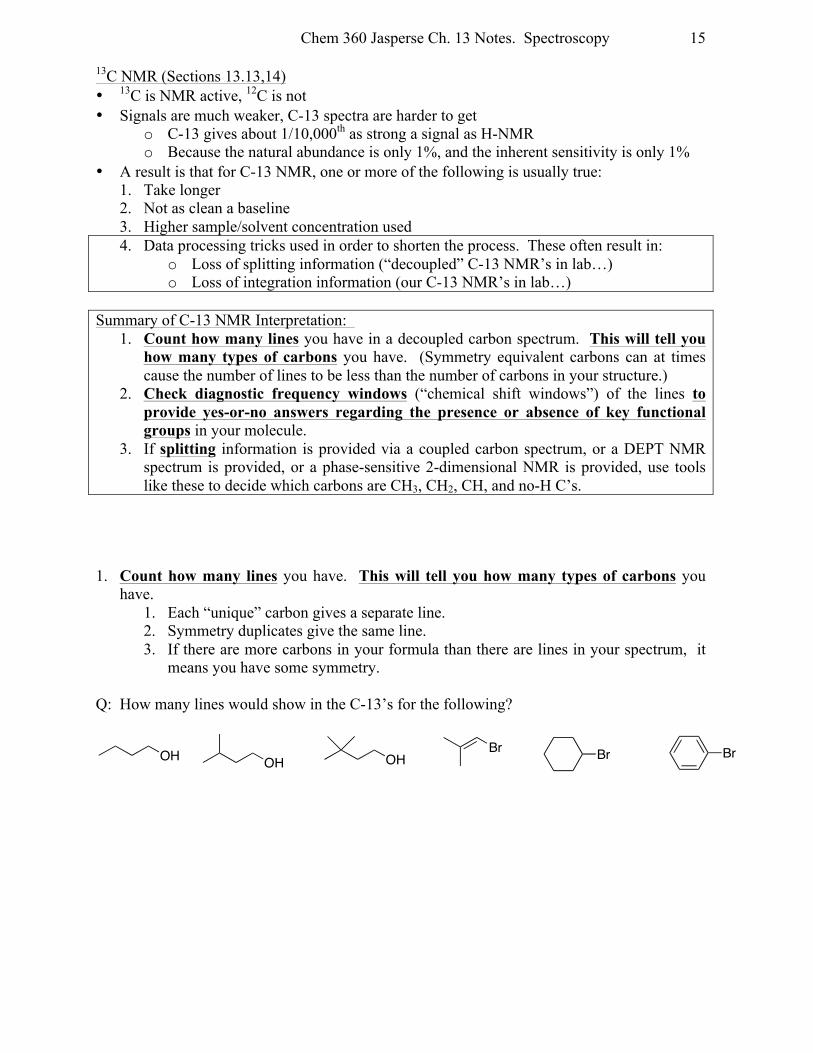
1. Count how many lines you have. This will tell you how many types of carbons you
have. 1. Each “unique” carbon gives a separate line. 2. Symmetry duplicates give the same line. 3. If there are more carbons in your formula than there are lines in your spectrum, it
means you have some symmetry. Q: How many lines would show in the C-13’s for the following?
OH OH OHBr Br Br
Chem 360 Jasperse Ch. 13 Notes. Spectroscopy
16
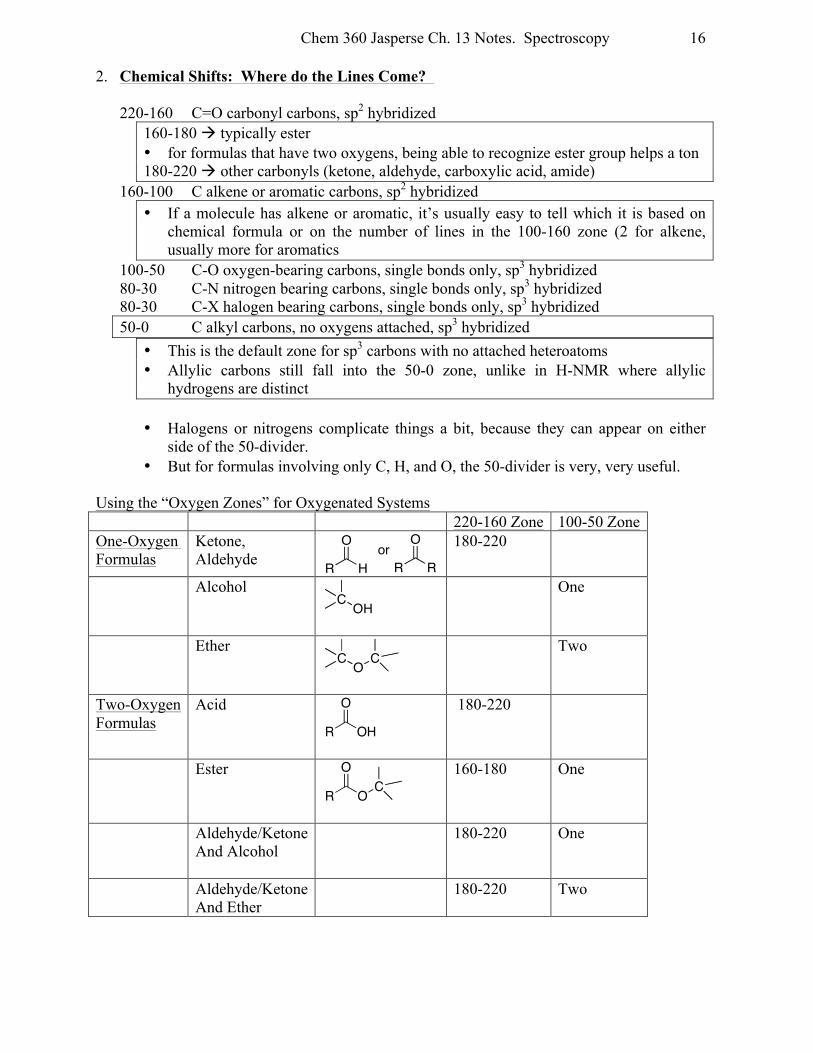
2. Chemical Shifts: Where do the Lines Come?
220-160 C=O carbonyl carbons, sp2 hybridized 160-180 à typically ester • for formulas that have two oxygens, being able to recognize ester group helps a ton 180-220 à other carbonyls (ketone, aldehyde, carboxylic acid, amide)
160-100 C alkene or aromatic carbons, sp2 hybridized • If a molecule has alkene or aromatic, it’s usually easy to tell which it is based on
chemical formula or on the number of lines in the 100-160 zone (2 for alkene, usually more for aromatics
100-50 C-O oxygen-bearing carbons, single bonds only, sp3 hybridized 80-30 C-N nitrogen bearing carbons, single bonds only, sp3 hybridized 80-30 C-X halogen bearing carbons, single bonds only, sp3 hybridized 50-0 C alkyl carbons, no oxygens attached, sp3 hybridized
• This is the default zone for sp3 carbons with no attached heteroatoms • Allylic carbons still fall into the 50-0 zone, unlike in H-NMR where allylic
hydrogens are distinct
• Halogens or nitrogens complicate things a bit, because they can appear on either side of the 50-divider.
• But for formulas involving only C, H, and O, the 50-divider is very, very useful.
Using the “Oxygen Zones” for Oxygenated Systems 220-160 Zone 100-50 Zone One-Oxygen Formulas
Ketone, Aldehyde
180-220
Alcohol
One
Ether
Two
Two-Oxygen Formulas
Acid
180-220
Ester
160-180 One
Aldehyde/Ketone And Alcohol
180-220 One
Aldehyde/Ketone And Ether
180-220 Two
R R
O
R H
O or
C OH
C O C
R OH
O
R O
OC
Chem 360 Jasperse Ch. 13 Notes. Spectroscopy
17
3. Splitting in a coupled carbon NMR spectrum. • C13 NMR’s are normally acquired as “decoupled” spectra, in which each carbon signal
appears as a singlet, for reasons of speed and simplicity. • However, at the cost of extra time and at the expense of some simplicity, it is also
possible to get “coupled” C13 NMR’s with splitting. The C-13 atoms are split by directly attached hydrogens.
• These splitting values are very useful, and follow the N+1/N-1 rules (the number of lines is one greater than the number of attached H’s).
Quartert (q) CH3 Triplet (t) CH2 Doublet (d) CH Singlet (s) C (no attached hydrogens)
• Coupled C-13 has at last two drawbacks:
1. The signal to noise ratio and thus the sensitivity is a lot worse. 2. Overlap: With coupled C-13 NMR, there are a lot more lines, and overlapping
of lines becomes normal and confusing for non- simple molecules. 4. DEPT NMR.
• “Distortionless Enhanced Polarization Transfer” is another technique that can unambiguously assign carbons as methyl (CH3), methylene (CH2), methyne (CH), or quaternary (no attached hydrogens).
• One or two DEPT experiments are done in conjunction with a decoupled C-13 NMR.
• DEPT 90: only methine (CH) carbons show, and they point up • DEPT 135: both methine (CH) and methyl (CH3) carbons point up, and methylene
(CH2) carbons point down. • Quaternary carbons won’t appear in DEPT 90 or DEPT 135. • By combining information from a decoupled, DEPT90, and DEPT135 NMR, you
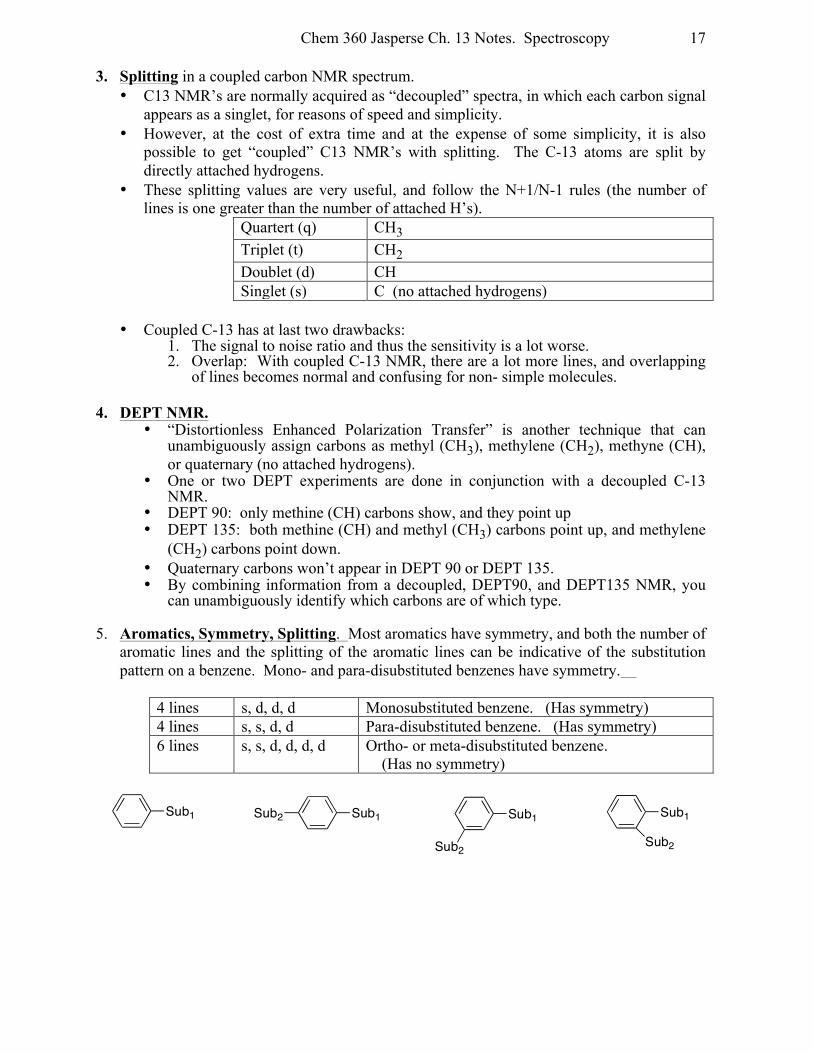
can unambiguously identify which carbons are of which type. 5. Aromatics, Symmetry, Splitting. Most aromatics have symmetry, and both the number of
aromatic lines and the splitting of the aromatic lines can be indicative of the substitution pattern on a benzene. Mono- and para-disubstituted benzenes have symmetry.
4 lines s, d, d, d Monosubstituted benzene. (Has symmetry) 4 lines s, s, d, d Para-disubstituted benzene. (Has symmetry) 6 lines s, s, d, d, d, d Ortho- or meta-disubstituted benzene.
(Has no symmetry)
Sub1 Sub1 Sub1 Sub1Sub2
Sub2 Sub2
Chem 360 Jasperse Ch. 13 Notes. Spectroscopy
18
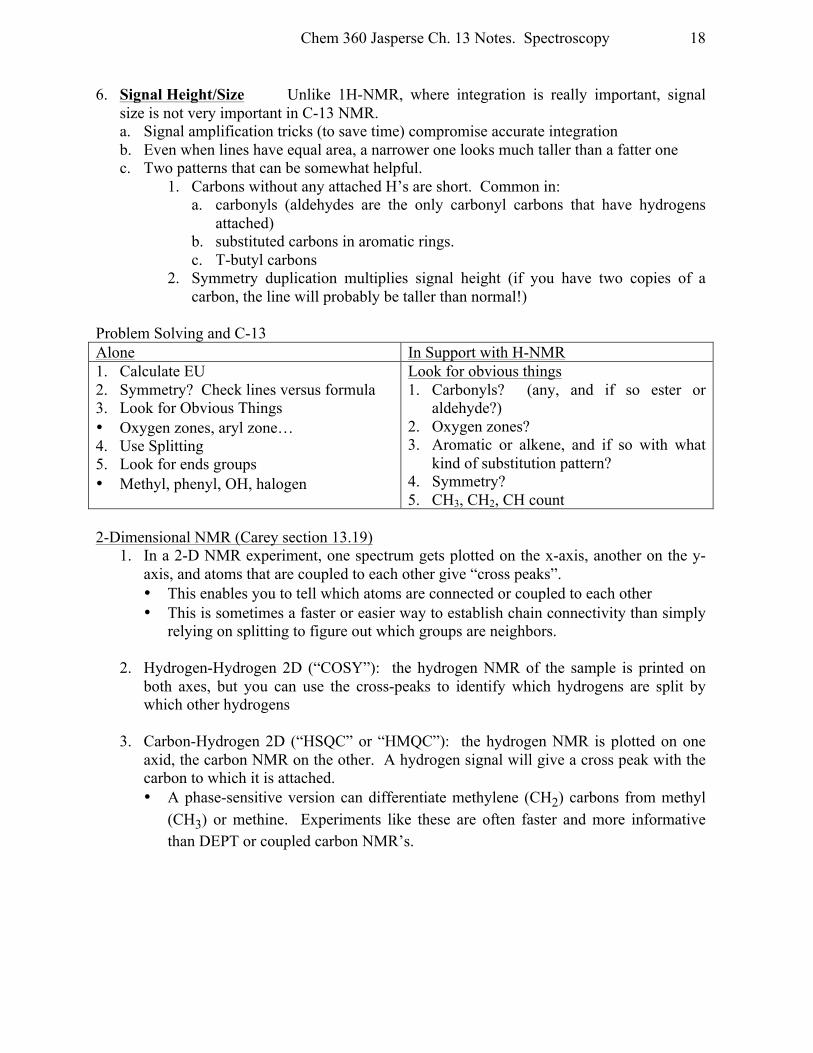
6. Signal Height/Size Unlike 1H-NMR, where integration is really important, signal
size is not very important in C-13 NMR. a. Signal amplification tricks (to save time) compromise accurate integration b. Even when lines have equal area, a narrower one looks much taller than a fatter one c. Two patterns that can be somewhat helpful.
1. Carbons without any attached H’s are short. Common in: a. carbonyls (aldehydes are the only carbonyl carbons that have hydrogens
attached) b. substituted carbons in aromatic rings. c. T-butyl carbons
2. Symmetry duplication multiplies signal height (if you have two copies of a carbon, the line will probably be taller than normal!)
Problem Solving and C-13 Alone In Support with H-NMR 1. Calculate EU 2. Symmetry? Check lines versus formula 3. Look for Obvious Things • Oxygen zones, aryl zone… 4. Use Splitting 5. Look for ends groups • Methyl, phenyl, OH, halogen
Look for obvious things 1. Carbonyls? (any, and if so ester or
aldehyde?) 2. Oxygen zones? 3. Aromatic or alkene, and if so with what
kind of substitution pattern? 4. Symmetry? 5. CH3, CH2, CH count
2-Dimensional NMR (Carey section 13.19)
1. In a 2-D NMR experiment, one spectrum gets plotted on the x-axis, another on the y-axis, and atoms that are coupled to each other give “cross peaks”. • This enables you to tell which atoms are connected or coupled to each other • This is sometimes a faster or easier way to establish chain connectivity than simply
relying on splitting to figure out which groups are neighbors.
2. Hydrogen-Hydrogen 2D (“COSY”): the hydrogen NMR of the sample is printed on both axes, but you can use the cross-peaks to identify which hydrogens are split by which other hydrogens
3. Carbon-Hydrogen 2D (“HSQC” or “HMQC”): the hydrogen NMR is plotted on one
axid, the carbon NMR on the other. A hydrogen signal will give a cross peak with the carbon to which it is attached. • A phase-sensitive version can differentiate methylene (CH2) carbons from methyl
(CH3) or methine. Experiments like these are often faster and more informative than DEPT or coupled carbon NMR’s.
Chem 360 Jasperse Ch. 13 Notes. Spectroscopy
19
Infrared Spectroscopy (Chapter 12, Nice Summary in Section 12-11) • Examples, Contrast to NMR • Much more complex than NMR
• In NMR, we expect to explain everything, and we can solve full structures • In IR, two typical uses:
a. Functional Group Identification: focus on a few key zones (our use) b. “Fingerprint” matchups of unknowns to knowns (we won’t do)
Major overall zones: 1600-3600 useful (stretching, useful for functional group ID) 1600-600 vibrations “fingerprint”, always busy, not very useful for function group ID Major Bands that are of some Functional Group Interest 3500-2700 N-H, O-H, C-H single bonds 2300-2100 CN, CC triple bonds 1800-1580 C=O, C=N, C=C double bonds Practical Feature Groups 1. O-H/N-H Zone (except when O-H is a carboxylic acid O-H): 3500-3200
• Alcohol Recognition • Amines or amides • Signals are sometimes rather broad due to hydrogen-bonding • Note: when looking at an actual spectrum, focus in specifically on the 3500-3200
range, don’t just look generally around 3000 o Because every organic molecule will have a big C-H signal around 2900-3000 o That is *not* interesting or informative, and should *not* be mistaken for proof of
alcohol • In contrast to alcohol O-H, carboxylic acid O-H signals are extremely broad, ranging
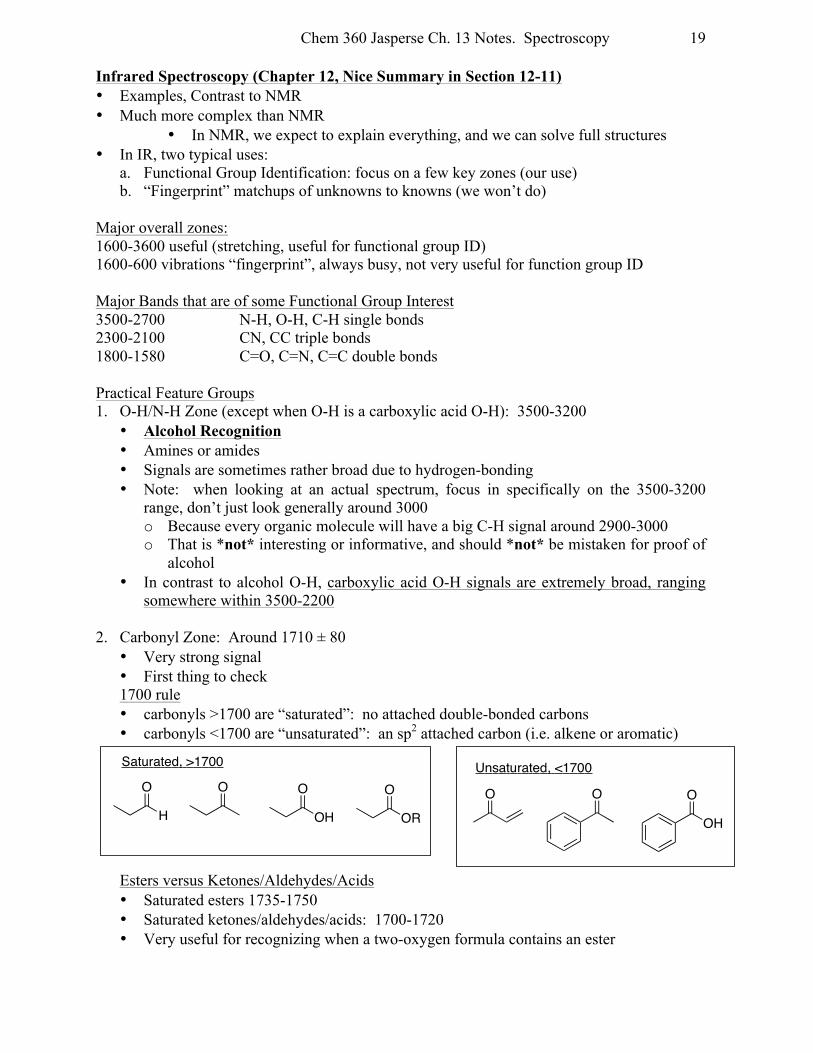
somewhere within 3500-2200 2. Carbonyl Zone: Around 1710 ± 80
• Very strong signal • First thing to check 1700 rule • carbonyls >1700 are “saturated”: no attached double-bonded carbons • carbonyls <1700 are “unsaturated”: an sp2 attached carbon (i.e. alkene or aromatic)
Esters versus Ketones/Aldehydes/Acids • Saturated esters 1735-1750 • Saturated ketones/aldehydes/acids: 1700-1720 • Very useful for recognizing when a two-oxygen formula contains an ester
H
O O
OH
O
OR
O OO
OH
O
Saturated, >1700 Unsaturated, <1700
Chem 360 Jasperse Ch. 13 Notes. Spectroscopy
20
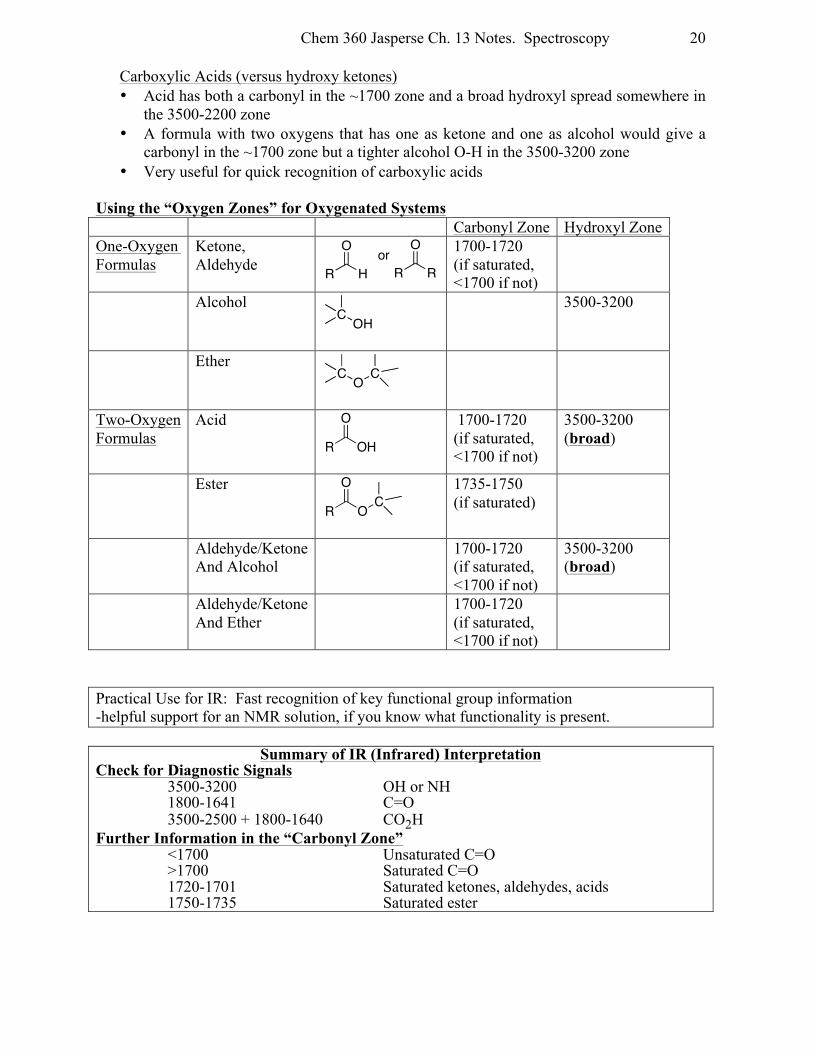
Carboxylic Acids (versus hydroxy ketones) • Acid has both a carbonyl in the ~1700 zone and a broad hydroxyl spread somewhere in
the 3500-2200 zone • A formula with two oxygens that has one as ketone and one as alcohol would give a
carbonyl in the ~1700 zone but a tighter alcohol O-H in the 3500-3200 zone • Very useful for quick recognition of carboxylic acids
Using the “Oxygen Zones” for Oxygenated Systems Carbonyl Zone Hydroxyl Zone One-Oxygen Formulas
Ketone, Aldehyde
1700-1720 (if saturated, <1700 if not)
Alcohol
3500-3200
Ether
Two-Oxygen Formulas
Acid
1700-1720 (if saturated, <1700 if not)
3500-3200 (broad)
Ester
1735-1750 (if saturated)
Aldehyde/Ketone And Alcohol
1700-1720 (if saturated, <1700 if not)
3500-3200 (broad)
Aldehyde/Ketone And Ether
1700-1720 (if saturated, <1700 if not)
Practical Use for IR: Fast recognition of key functional group information -helpful support for an NMR solution, if you know what functionality is present.
Summary of IR (Infrared) Interpretation Check for Diagnostic Signals
3500-3200 OH or NH 1800-1641 C=O 3500-2500 + 1800-1640 CO2H
Further Information in the “Carbonyl Zone” <1700 Unsaturated C=O >1700 Saturated C=O 1720-1701 Saturated ketones, aldehydes, acids 1750-1735 Saturated ester
R R
O
R H
O or
C OH
C O C
R OH
O
R O
OC
Chem 360 Jasperse NMR Practice Problems
1
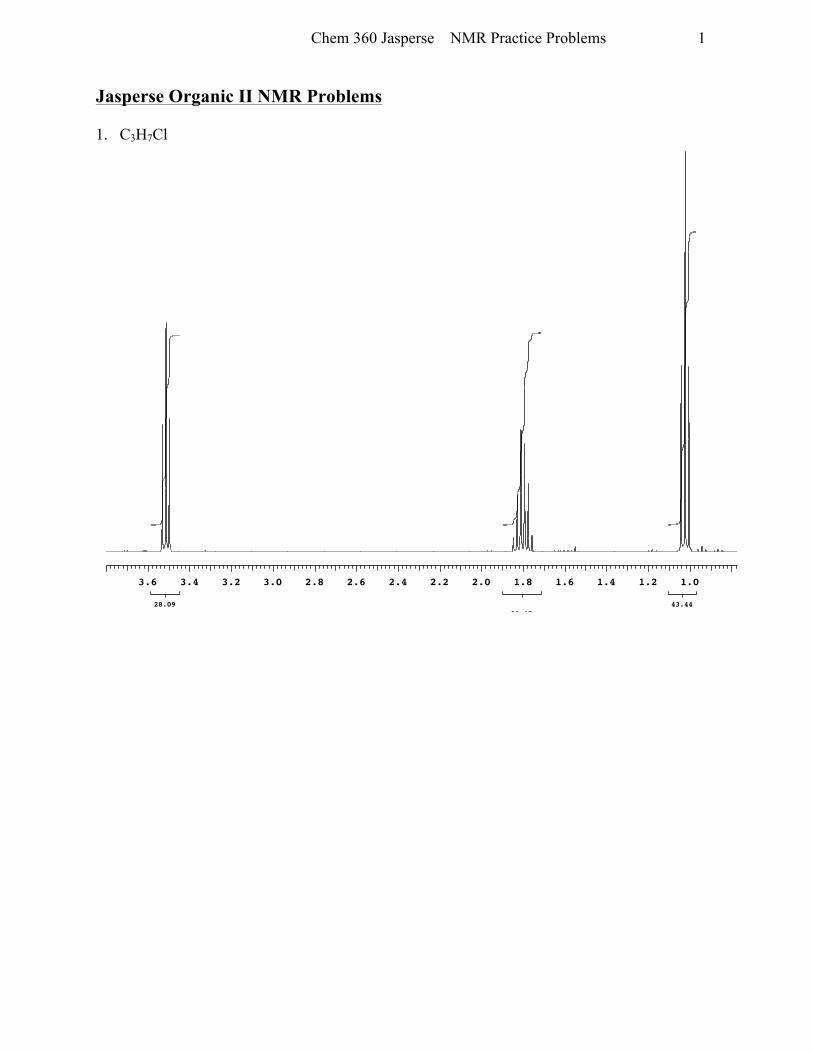
Jasperse Organic II NMR Problems 1. C3H7Cl
Sat Feb 4 18:00:16 2012: Experiment started
28.0928.47
43.44
ppm1.01.21.41.61.82.02.22.42.62.83.03.23.43.6
Plotname: 1-Chloropropane_PROTON_01_plot03
Chem 360 Jasperse NMR Practice Problems
2
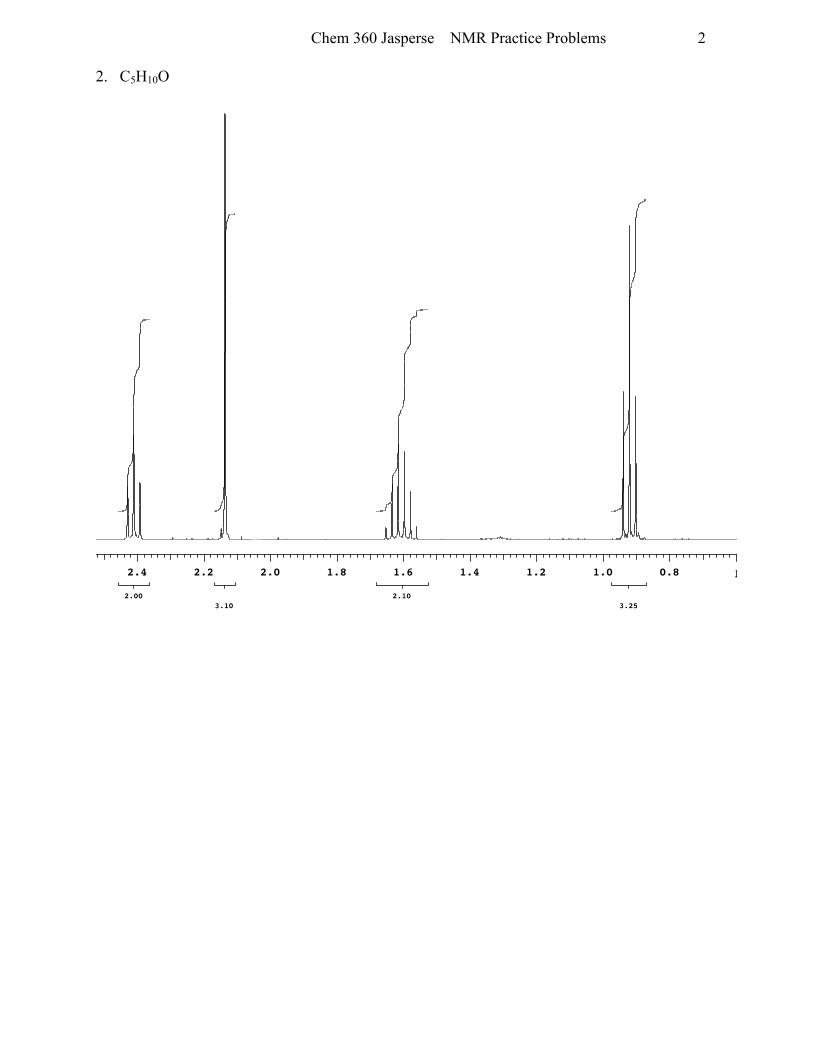
2. C5H10O
Sat Feb 4 15:37:38 2012: Experiment started
2.003.10
2.103.25
ppm0.81.01.21.41.61.82.02.22.42.6
Plotname: 2-pentanone_PROTON_01_plot02
Chem 360 Jasperse NMR Practice Problems
3
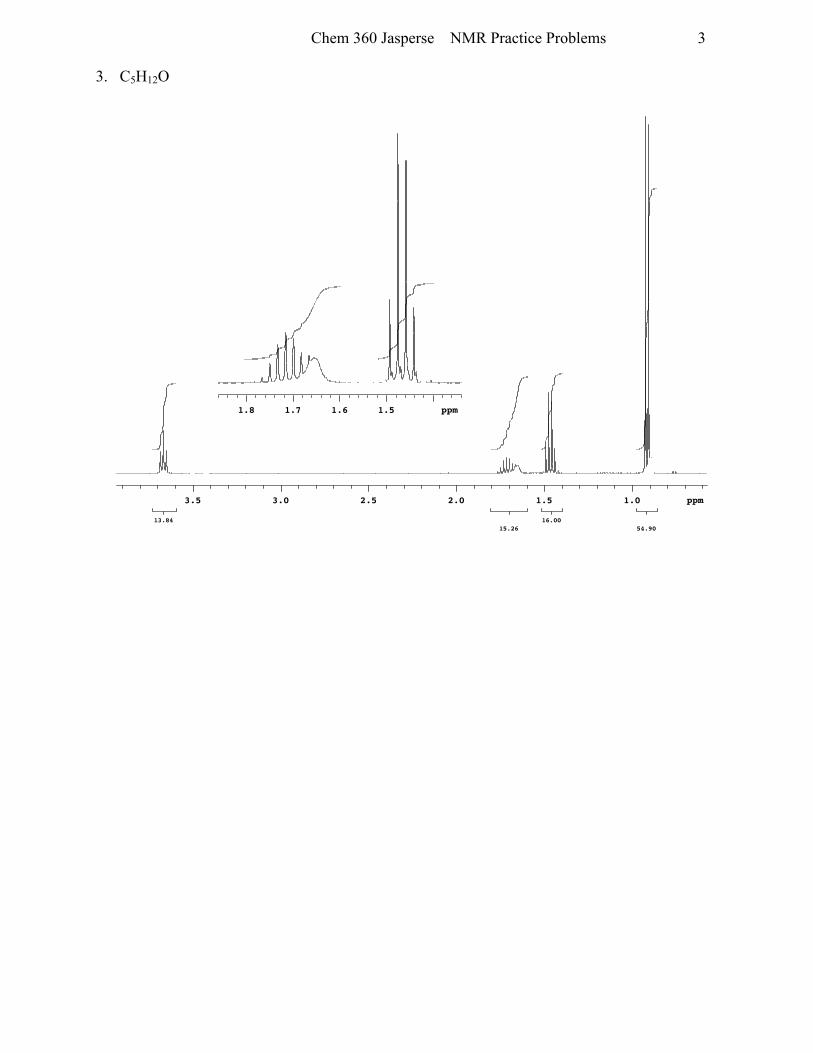
3. C5H12O
ppm1.51.61.71.8
Sat Feb 4 15:57:12 2012: Experiment started
13.8415.26
16.0054.90
ppm1.01.52.02.53.03.5
Plotname: Isopentyl_alcohol_PROTON_01_plot02
Chem 360 Jasperse NMR Practice Problems
4
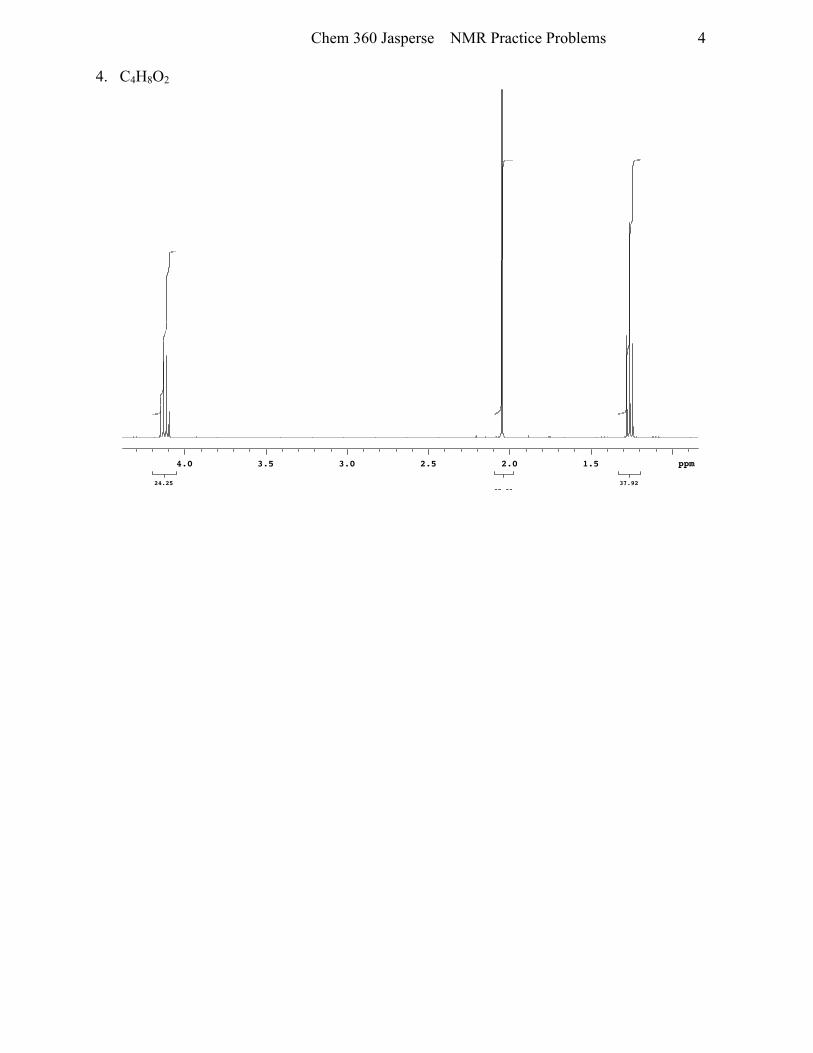
4. C4H8O2
Sat Feb 4 15:45:19 2012: Experiment started
24.2537.83
37.92
ppm1.52.02.53.03.54.0
Plotname: Ethyl_acetate_PROTON_01_plot02
Chem 360 Jasperse NMR Practice Problems
5
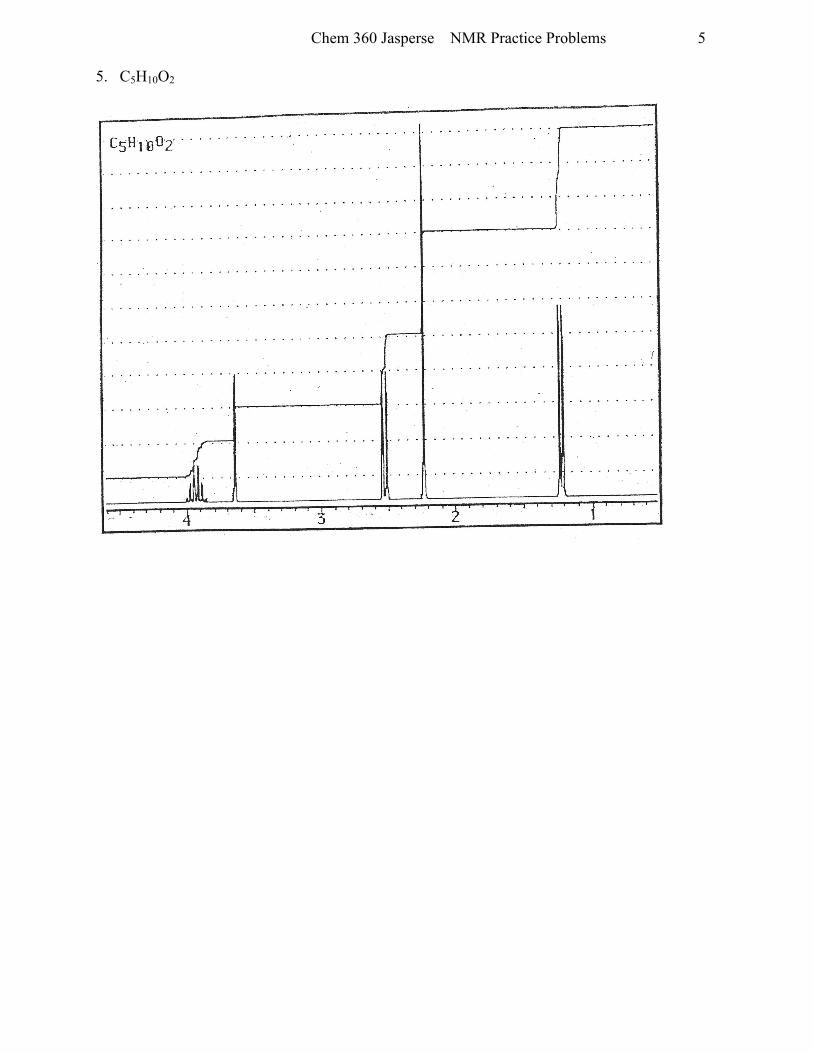
5. C5H10O2
C5H1 602'
Chem 360 Jasperse NMR Practice Problems
6
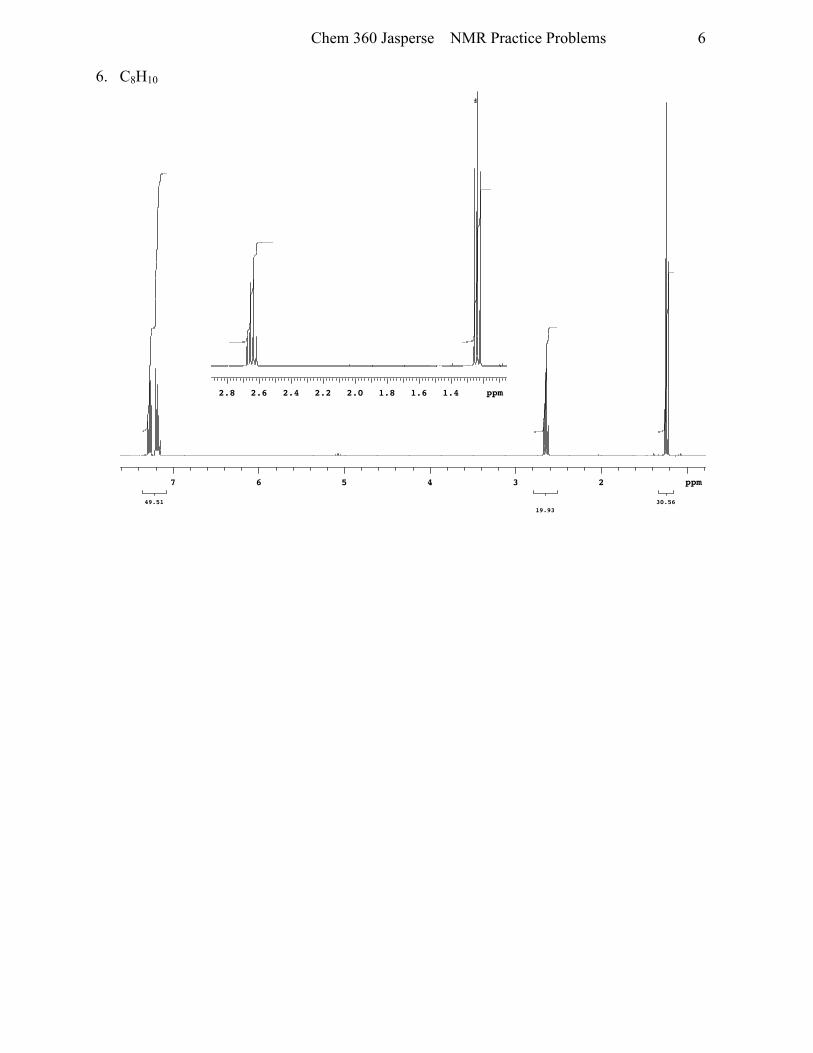
6. C8H10
ppm1.41.61.82.02.22.42.62.8
Sat Feb 4 15:49:21 2012: Experiment started
49.5119.93
30.56
ppm234567
Plotname: EthylBenzene_PROTON_01_plot02
Chem 360 Jasperse NMR Practice Problems
7
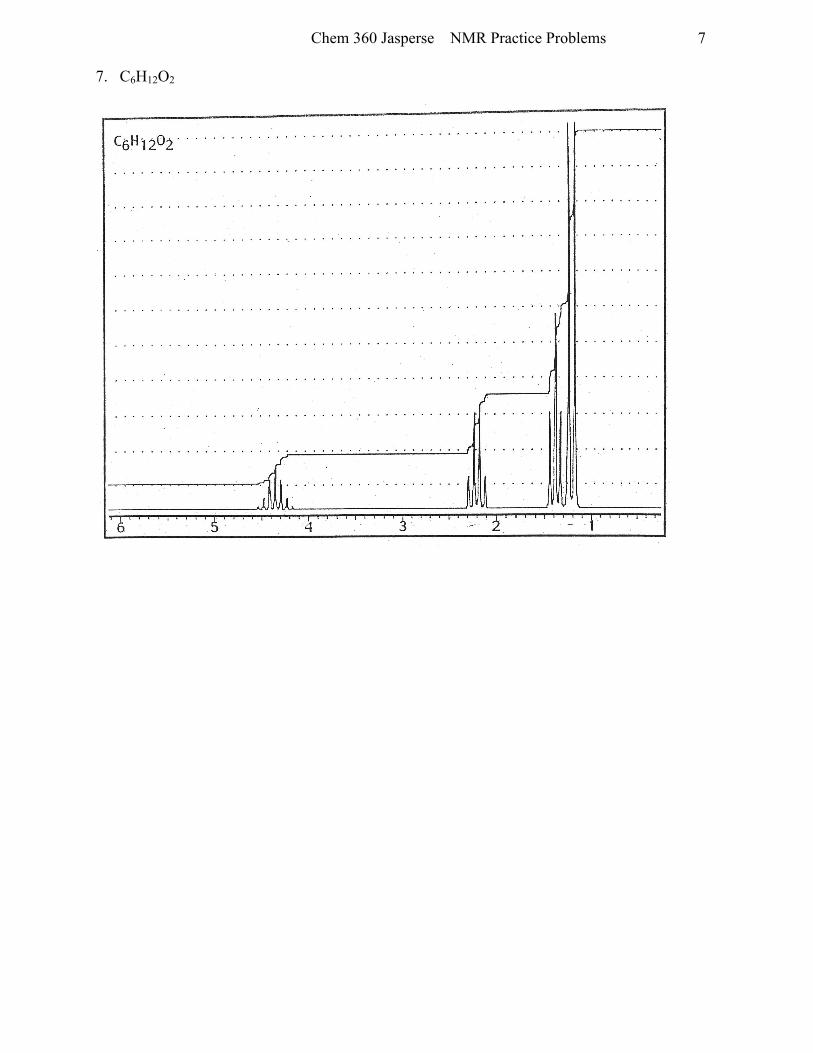
7. C6H12O2
,Uci;H1202
Chem 360 Jasperse NMR Practice Problems
8
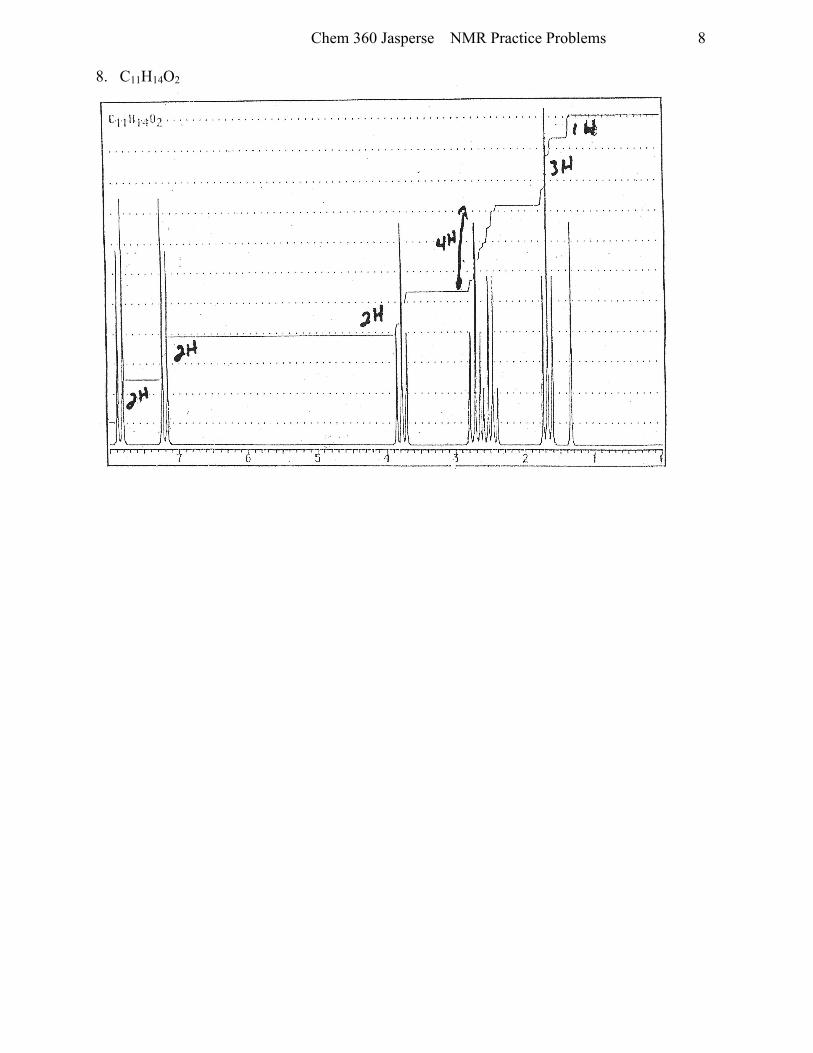
8. C11H14O2
@lJ.1.1. l l1,a{J2
t l- . 1 . - . l
I
3rfJl'rL rli l
Chem 360 Jasperse NMR Practice Problems
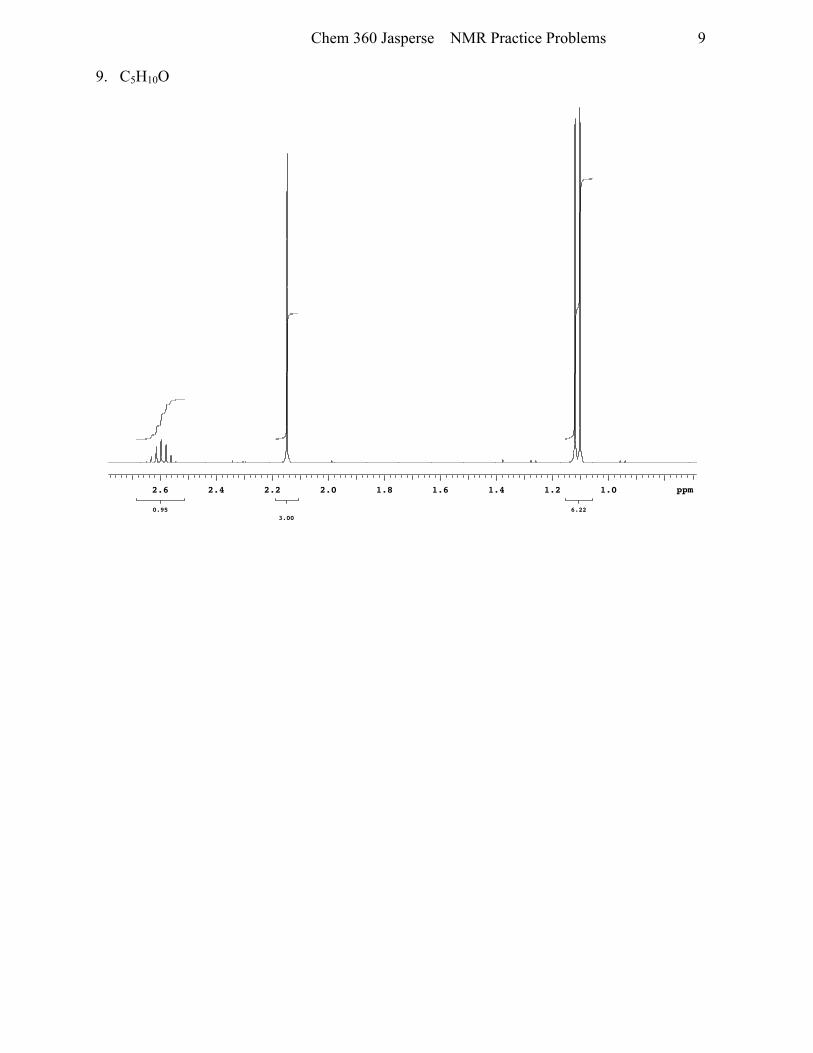
9
9. C5H10O
Sat Feb 4 15:53:12 2012: Experiment started
0.953.00
6.22
ppm1.01.21.41.61.82.02.22.42.6
Plotname: 3-Methyl-2-butanone_PROTON_01_plot02
Chem 360 Jasperse NMR Practice Problems
10
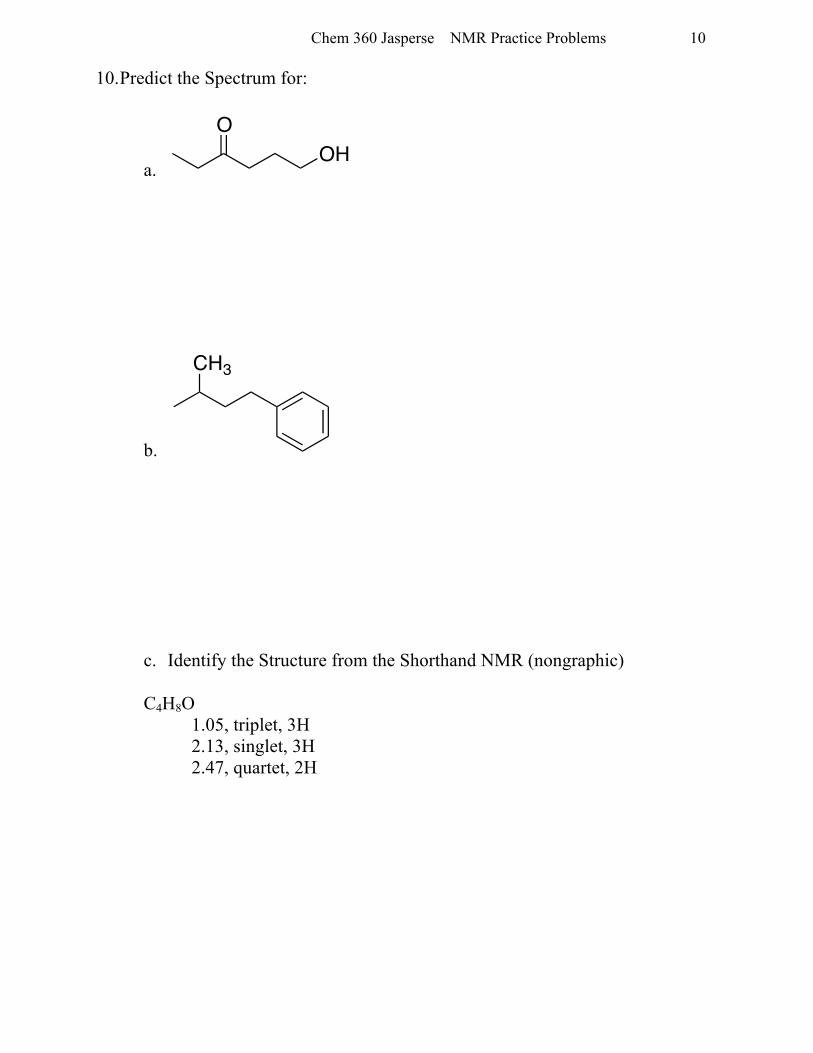
10. Predict the Spectrum for:
a.
b.
c. Identify the Structure from the Shorthand NMR (nongraphic)
C4H8O 1.05, triplet, 3H 2.13, singlet, 3H 2.47, quartet, 2H
OHO
CH3
Chem 360 Jasperse NMR Practice Problems
11
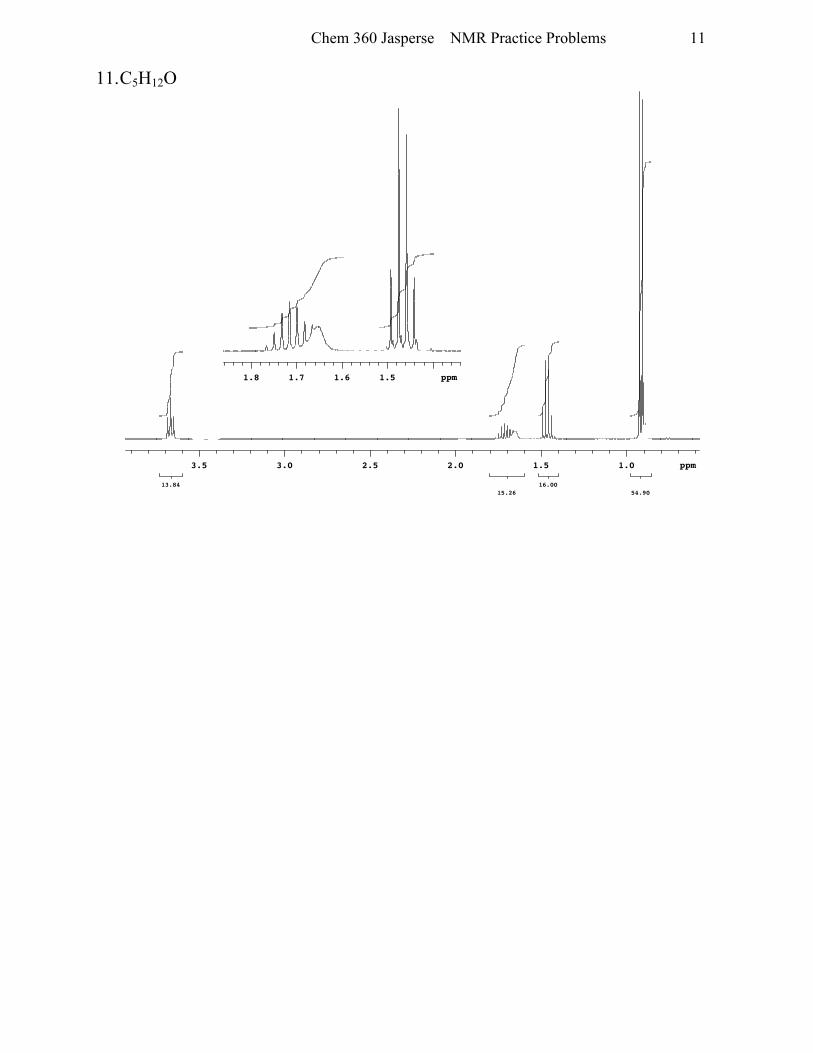
11. C5H12O
ppm1.51.61.71.8
Sat Feb 4 15:57:12 2012: Experiment started
13.8415.26
16.0054.90
ppm1.01.52.02.53.03.5
Plotname: Isopentyl_alcohol_PROTON_01_plot02
Chem 360 Jasperse NMR Practice Problems
12
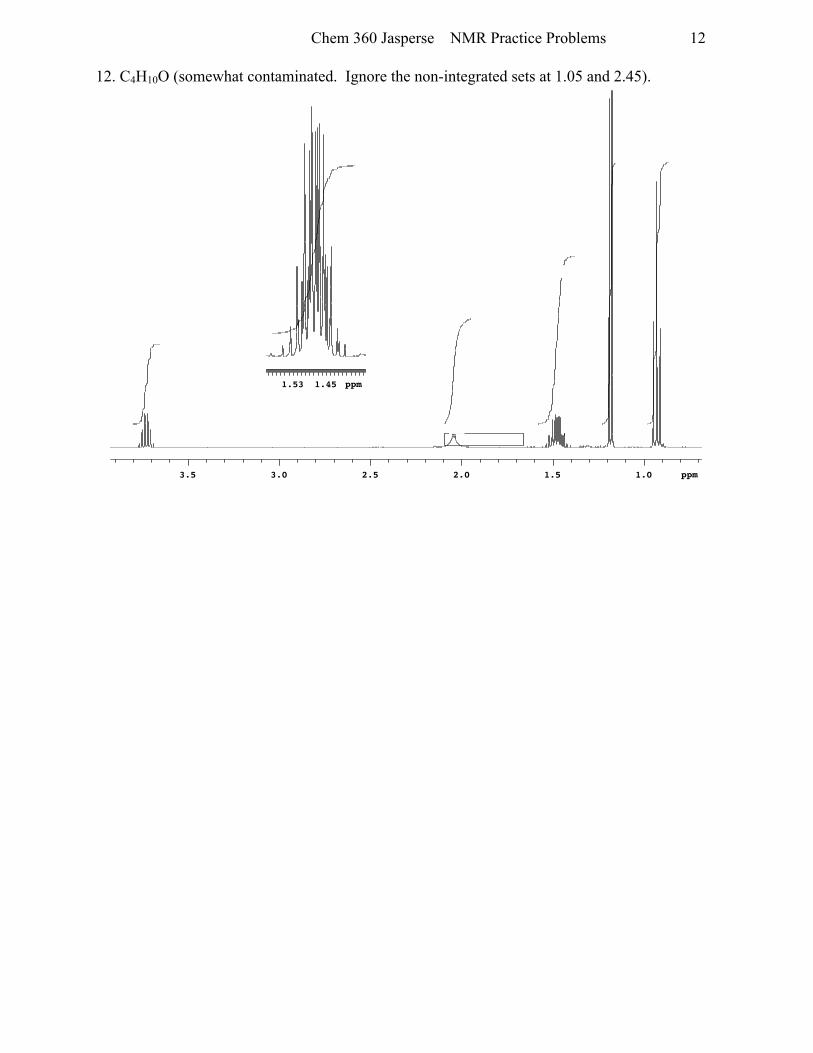
12. C4H10O (somewhat contaminated. Ignore the non-integrated sets at 1.05 and 2.45).
ppm1.451.53
Sat Feb 4 16:01:18 2012: Experiment started
0.000.00
0.000.00
0.00
ppm1.01.52.02.53.03.5
Plotname: 2-butanol_PROTON_01_plot03
Chem 360 Jasperse NMR Practice Problems
13
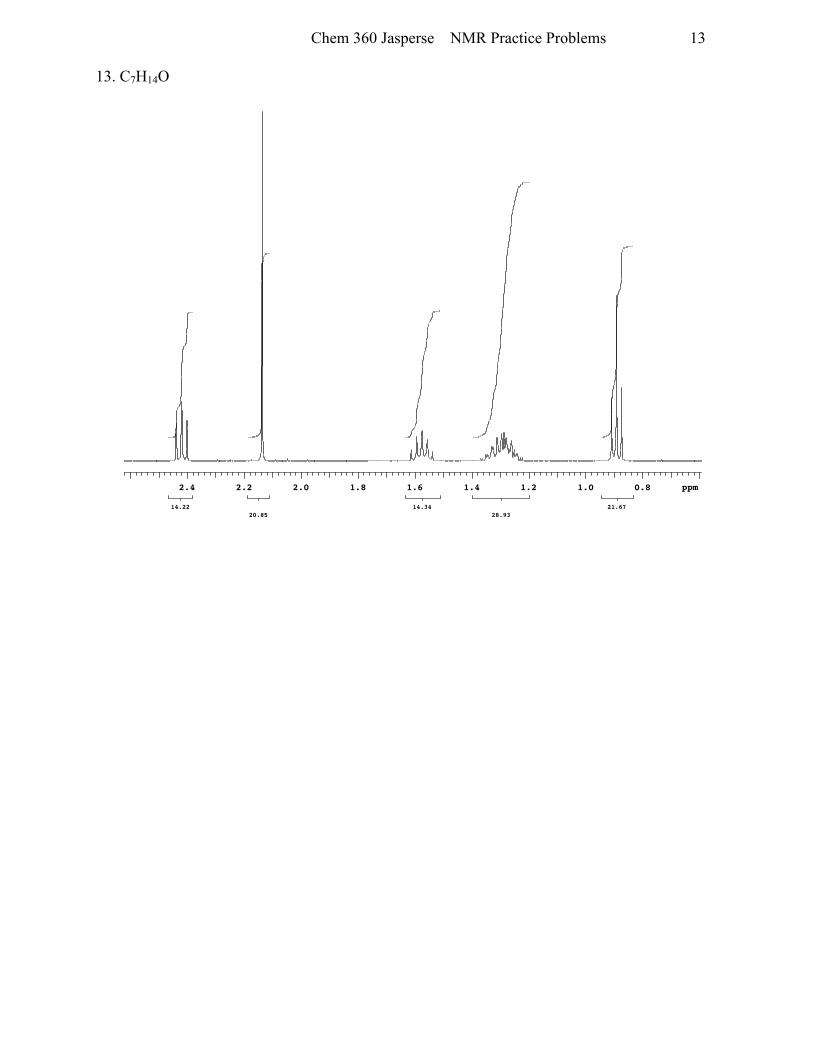
13. C7H14O
Sat Feb 4 16:05:17 2012: Experiment started
14.2220.85
14.3428.93
21.67
ppm0.81.01.21.41.61.82.02.22.4
Plotname: 2-Heptanone_PROTON_01_plot02
Chem 360 Jasperse NMR Practice Problems
14
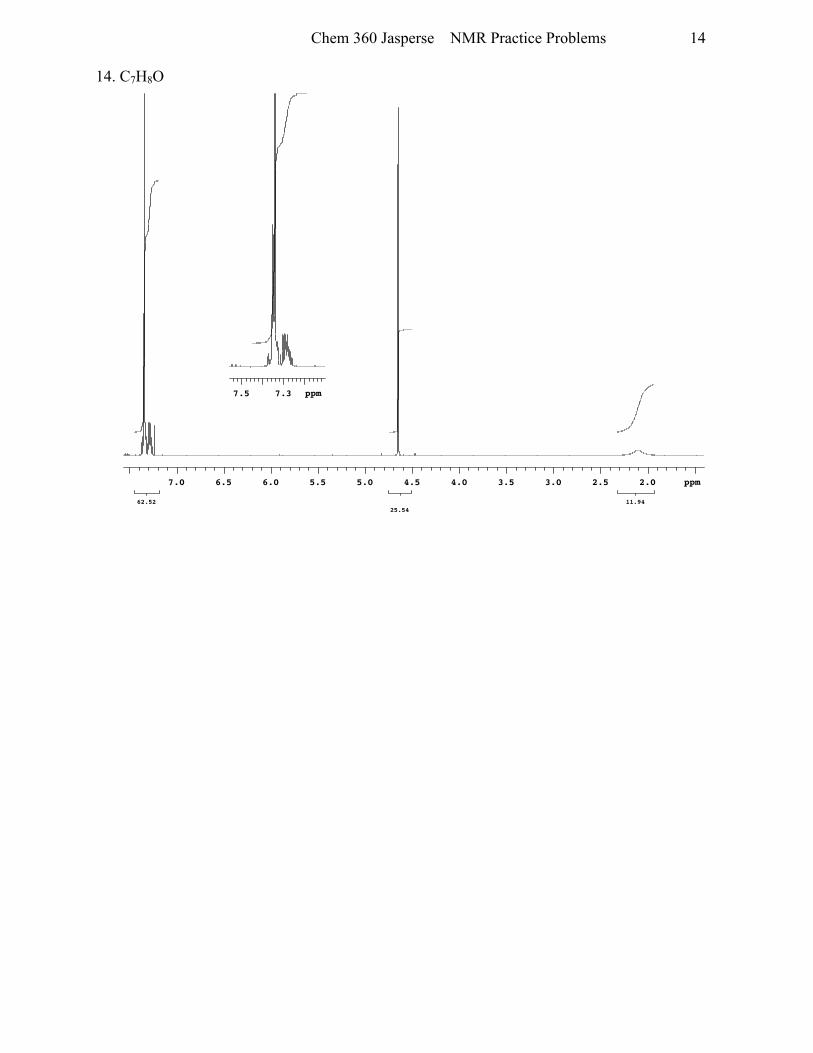
14. C7H8O
ppm7.37.5
Sat Feb 4 16:09:16 2012: Experiment started
62.5225.54
11.94
ppm2.02.53.03.54.04.55.05.56.06.57.0
Plotname: Benzyl_alcohol_PROTON_01_plot02
Chem 360 Jasperse NMR Practice Problems
15
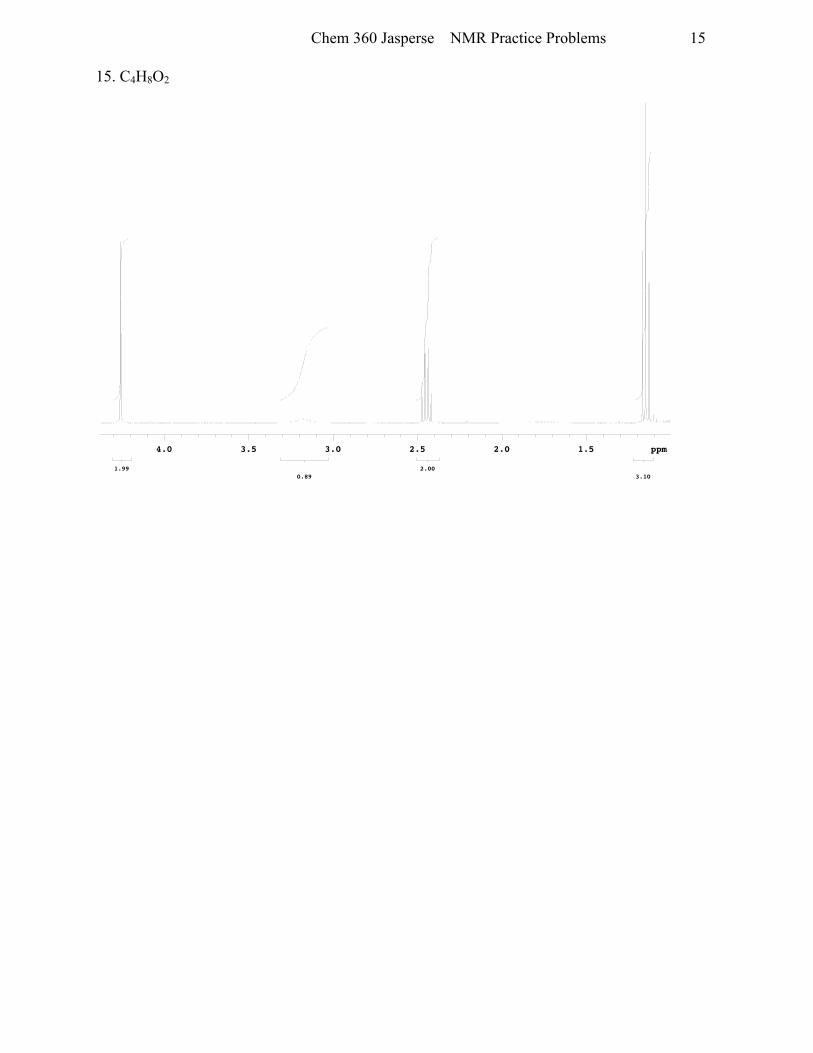
15. C4H8O2
Thu Feb 3 16:52:05 2011: Experiment started
Thu Feb 3 16:52:13 2011: BS 1 completed
1.990.89
2.003.10
ppm1.52.02.53.03.54.0
Plotname: Chem360_Spectra_PROTON_01_plot02
Chem 360 Jasperse NMR Practice Problems
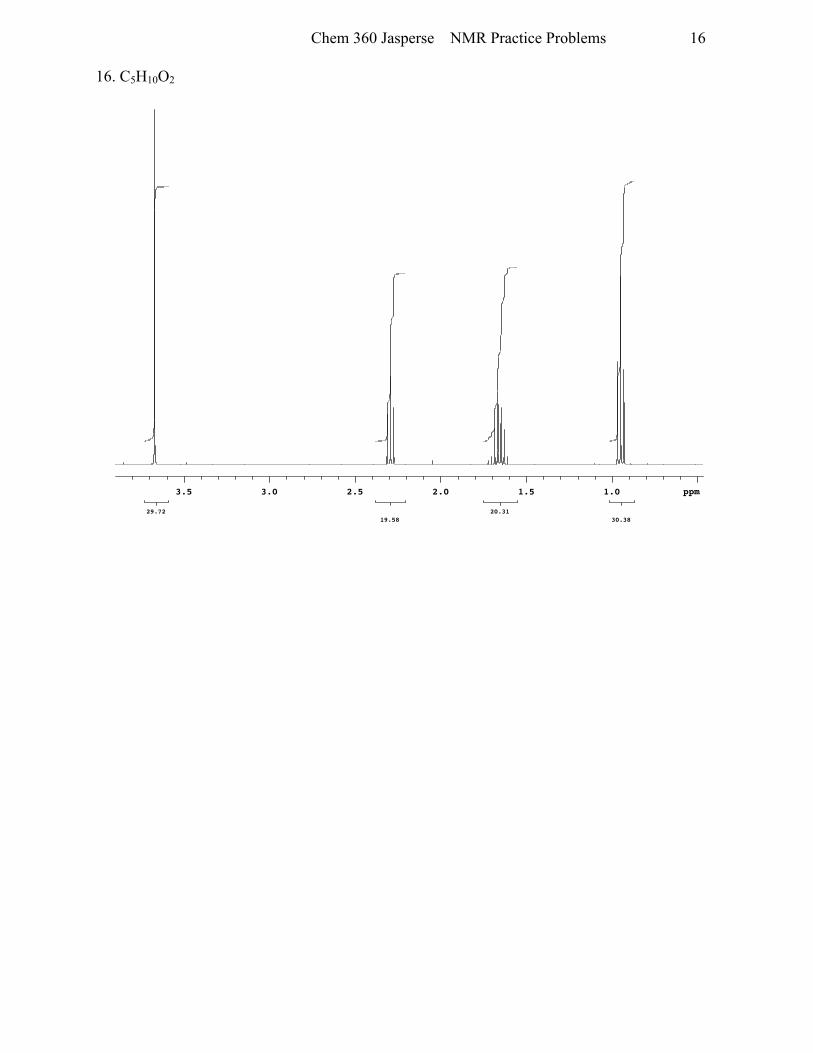
16
16. C5H10O2
Sat Feb 4 16:13:15 2012: Experiment started
29.7219.58
20.3130.38
ppm1.01.52.02.53.03.5
Plotname: Methyl_Butyrate_PROTON_01_plot02
Chem 360 Jasperse NMR Practice Problems
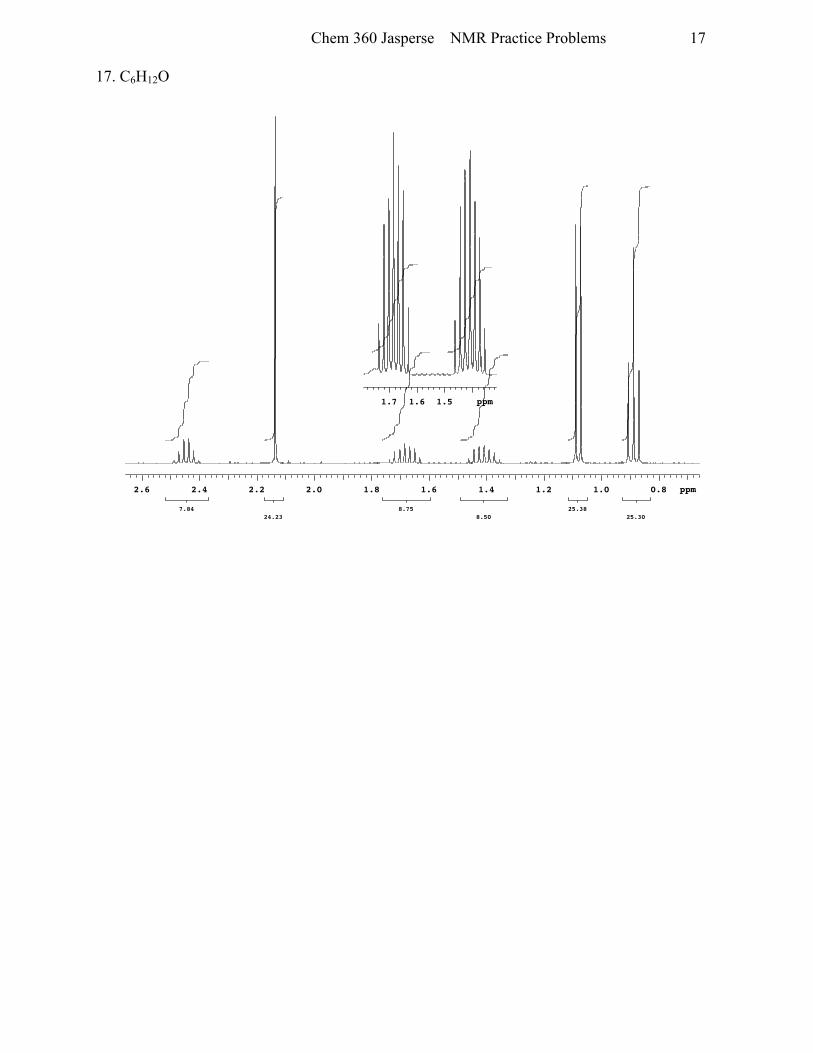
17
17. C6H12O
ppm1.51.61.7
Sat Feb 4 16:17:16 2012: Experiment started
7.8424.23
8.758.50
25.3825.30
ppm0.81.01.21.41.61.82.02.22.42.6
Plotname: 3-Methyl-2-pentanone_PROTON_01_plot02
Chem 360 Jasperse NMR Practice Problems
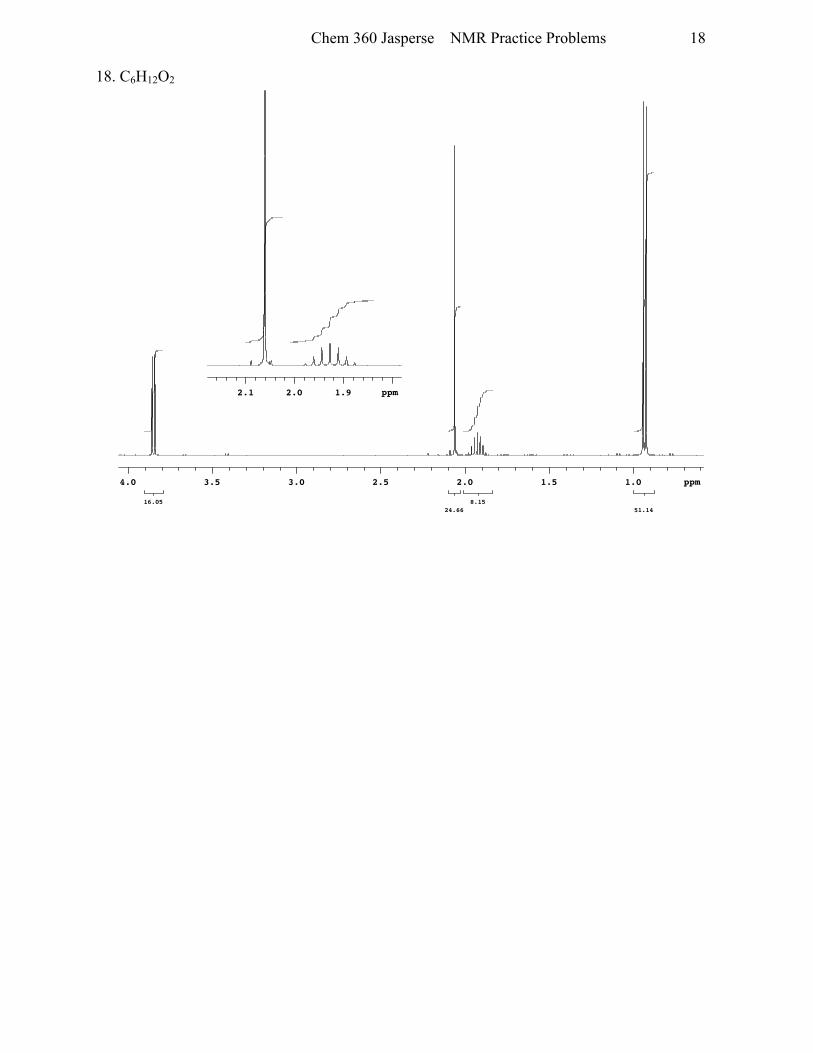
18
18. C6H12O2
ppm1.92.02.1
Sat Feb 4 16:21:16 2012: Experiment started
16.0524.66
8.1551.14
ppm1.01.52.02.53.03.54.0
Plotname: Isobutyl_acetate_PROTON_01_plot02
Chem 360 Jasperse NMR Practice Problems
19
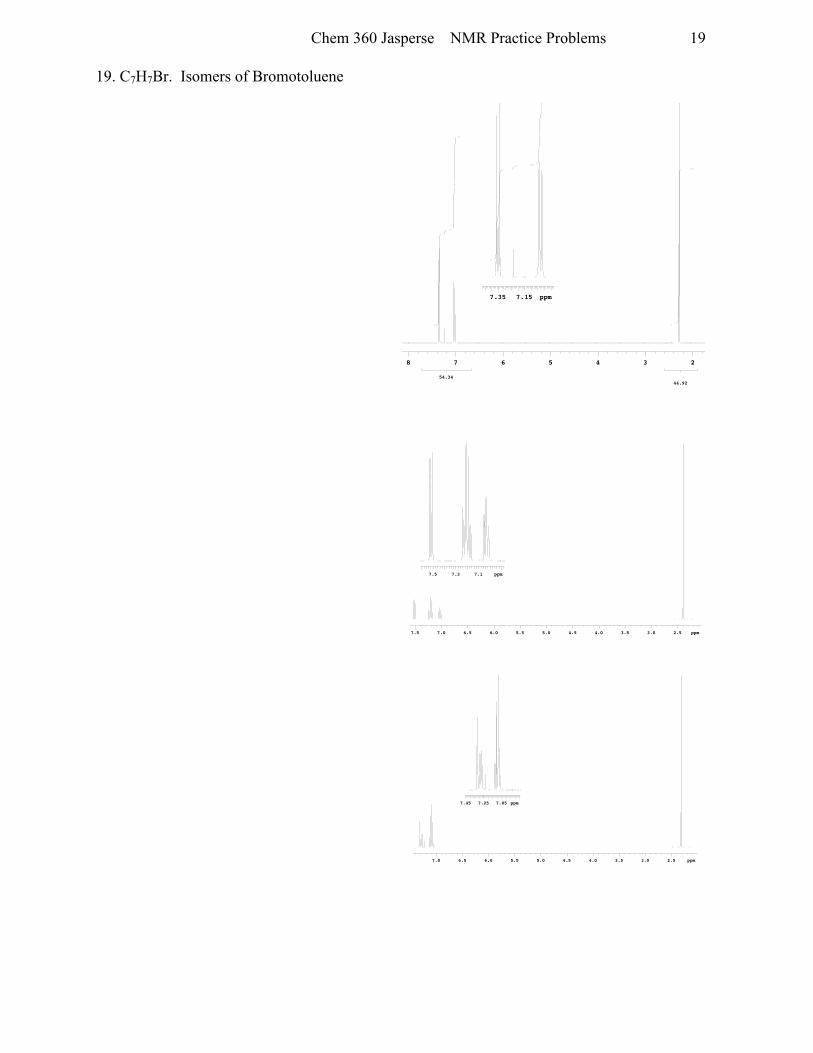
19. C7H7Br. Isomers of Bromotoluene
ppm7.157.35
Thu Feb 3 20:41:31 2011: Experiment started
Thu Feb 3 20:41:39 2011: BS 1 completed
54.3444.92
0.230.01
0.51
ppm012345678
Plotname: Problem_19A_PROTON
ppm7.17.37.5
Thu Feb 3 20:30:14 2011: Experiment started
Thu Feb 3 20:30:22 2011: BS 1 completed
ppm2.53.03.54.04.55.05.56.06.57.07.5Plotname: Problem_19c_PROTON
ppm7.057.257.45
Thu Feb 3 20:35:32 2011: Experiment started
Thu Feb 3 20:35:40 2011: BS 1 completed
ppm2.53.03.54.04.55.05.56.06.57.0Plotname: Problem_19B_or_C_PROTON
Chem 360 Jasperse NMR Practice Problems
20
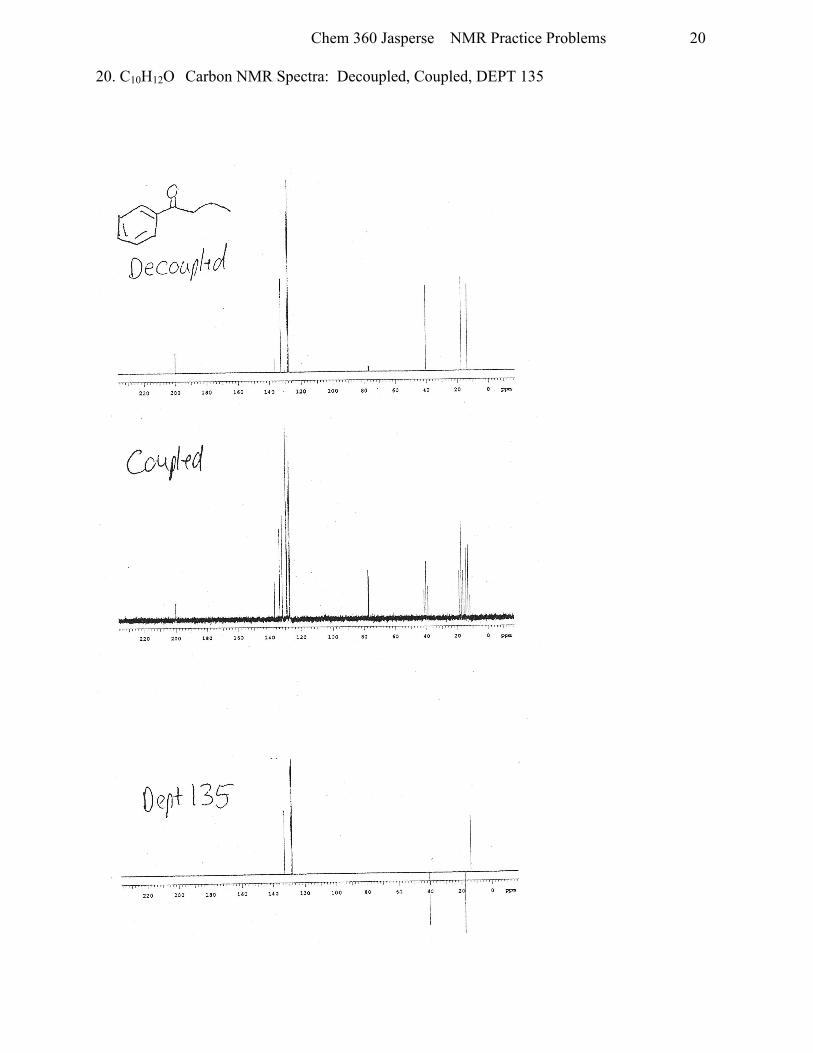
20. C10H12O Carbon NMR Spectra: Decoupled, Coupled, DEPT 135
Decou/tol
22O 2OO t lo 160 lao 120 100 0o ao l0 20 0 F
butrkd
22O zoo l lo 160 1lo .120 loo !O 'a lo 20 0 F
0af+ 135
Chem 360 Jasperse NMR Practice Problems
21
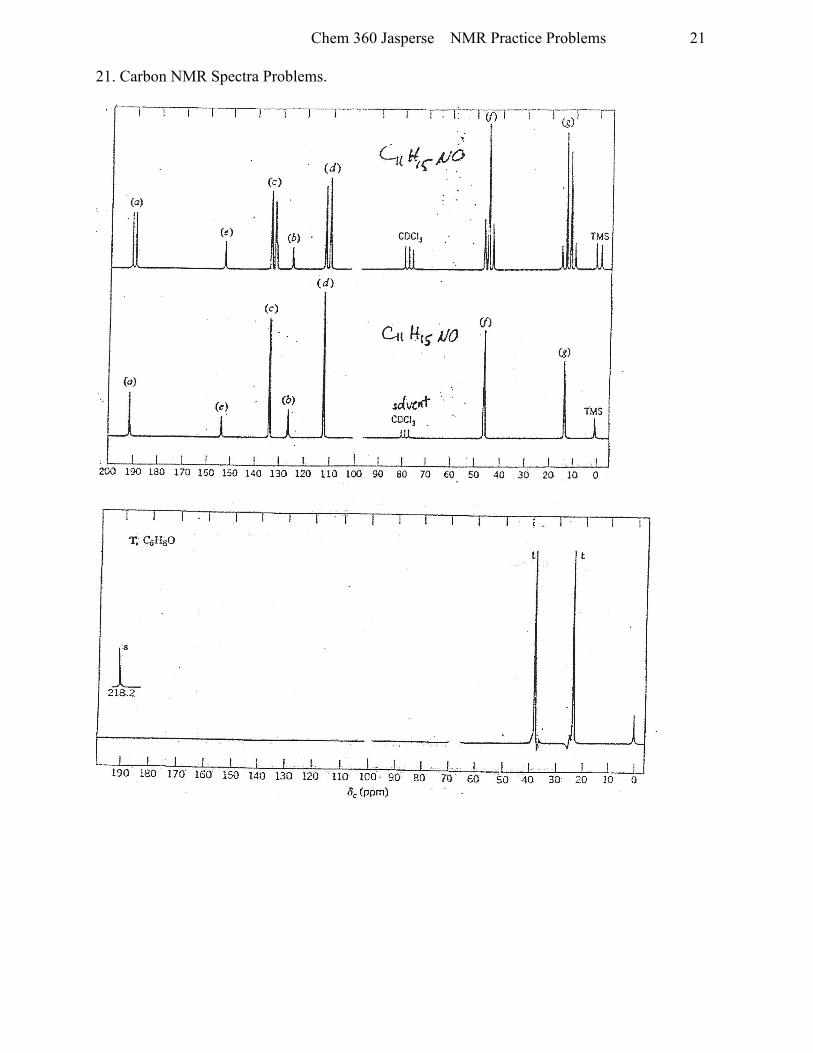
21. Carbon NMR Spectra Problems.
@
r j t T , ' , n ,
( - , U t t f t I(d't
-.IL 17{ Y': I{ c ) , 1 ' l( a ) l | l l : l
("1 ll ,,, ll cDc,J
(c)
Crr Hes tly ?( o ) l l l
t l l t | *t ' , ' TMS
-L. . l
d (pprn), 200 rgo 1Bo lz0 160 r50 r4o r3o 1zo r1o roo 90 80 70 ao-5ffi
llo too. 90.
T; qlls0q t r
l "I-t_zLA.2
d,{ptm)
190 t70 150 40
Chem 360 Jasperse NMR Practice Problems
22
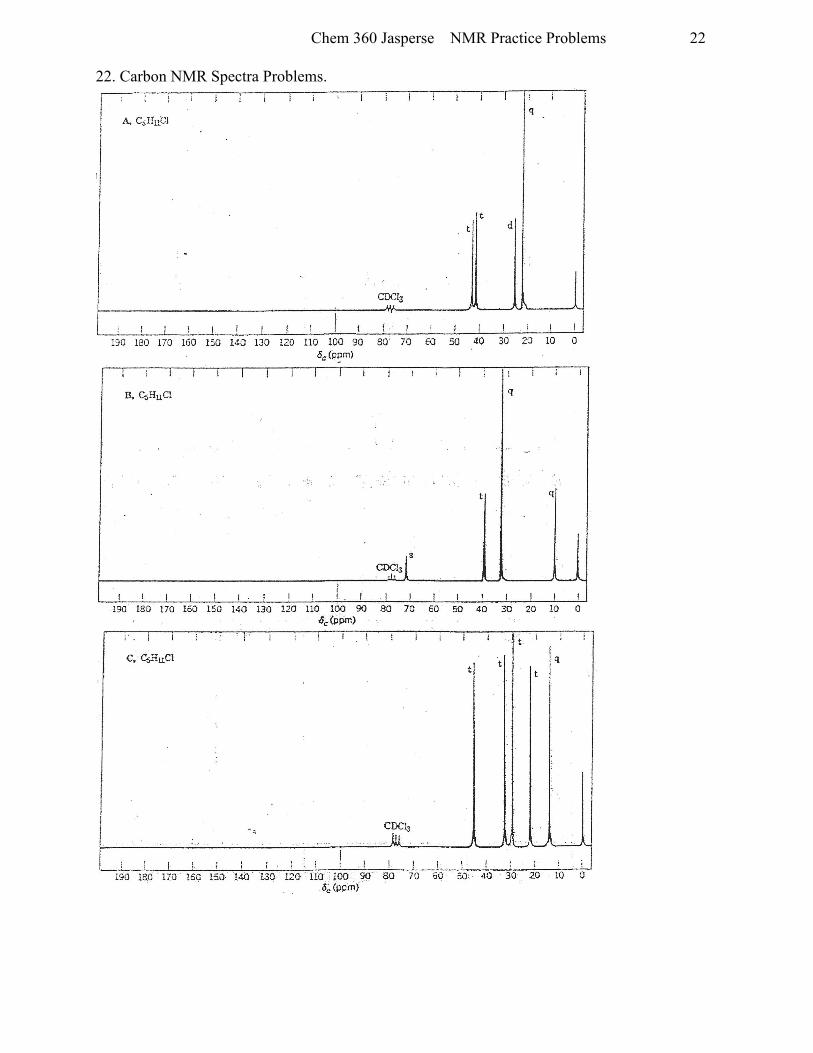
22. Carbon NMR Spectra Problems.
6;t-/r--c;"
14i\J
l i i i l i l l i ' l i l l l i
A, CsHuCl
I t+ l l' t lt lt lt ll tilcDCr3 lt*
Ti f I | | | | { ; t I r ! | ! f I
r90 r80 r70 160 150 t40 130 I20 110 100 90 80' 70 50 50 406r(ptt)
l9o t8o 17o I5O r50 l4o 13o 12O Uq lOO. 90' da/lPuttl
FTGURE 1q.sz fiz
{ l i
qB, %H&Ct
r90 t80 r70 t60 I50
Copytlgtrt O Johtr W$ay & Sons, Iac
Chem 360 Jasperse NMR Practice Problems
23
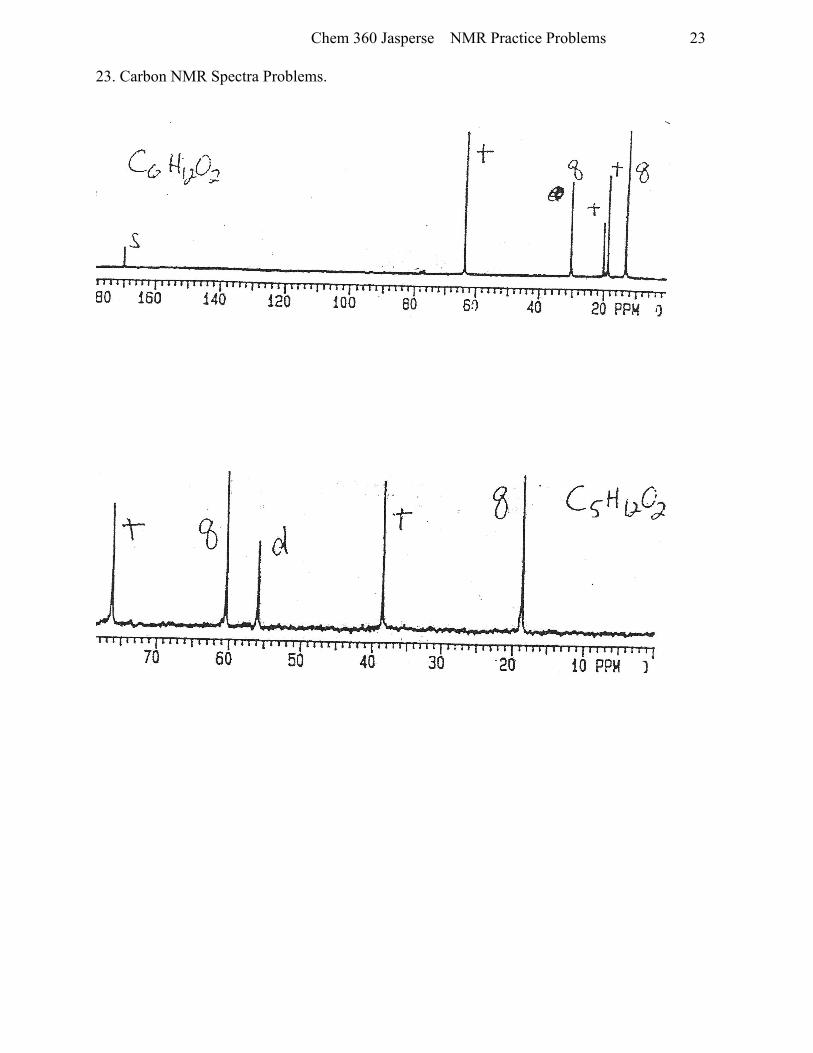
23. Carbon NMR Spectra Problems.
oo
Chem 360 Jasperse NMR Practice Problems
24
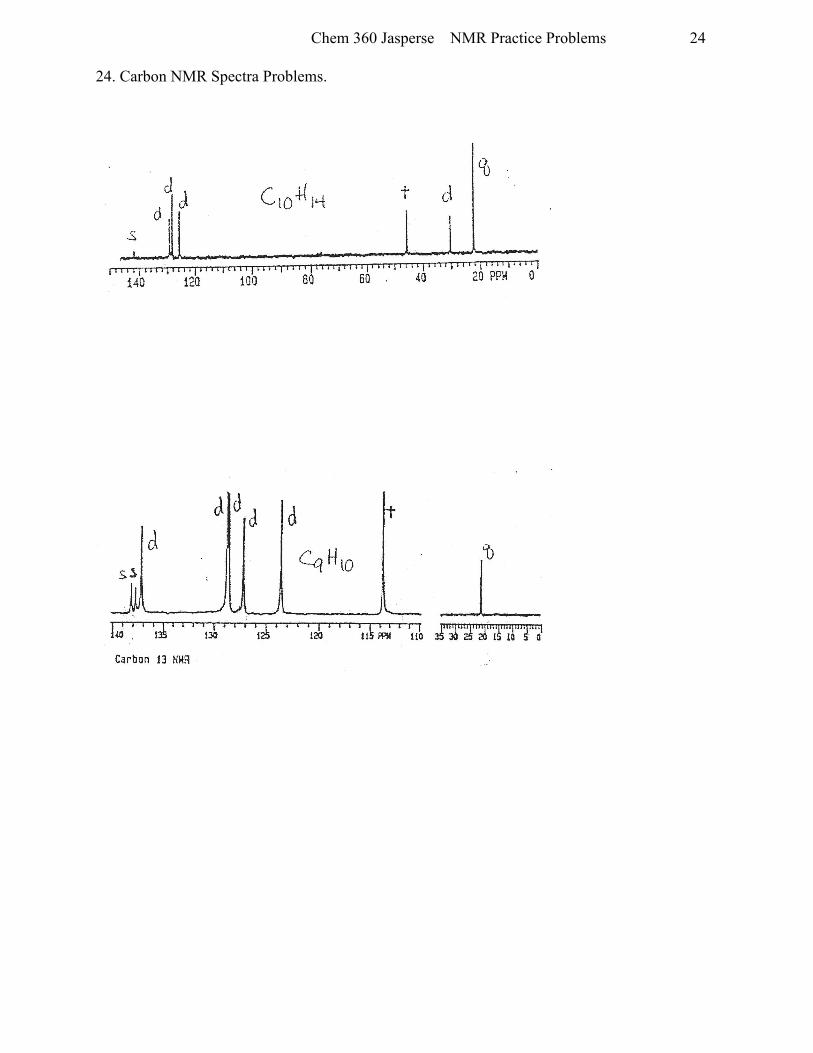
24. Carbon NMR Spectra Problems.
(1 6)
/
J-f,J"$rffimCarlon 13 l{XH
C,o{,+
(1 6)
/
J-f,J"$rffimCarlon 13 l{XH
C,o{,+
Chem 360 Jasperse NMR Practice Problems
25
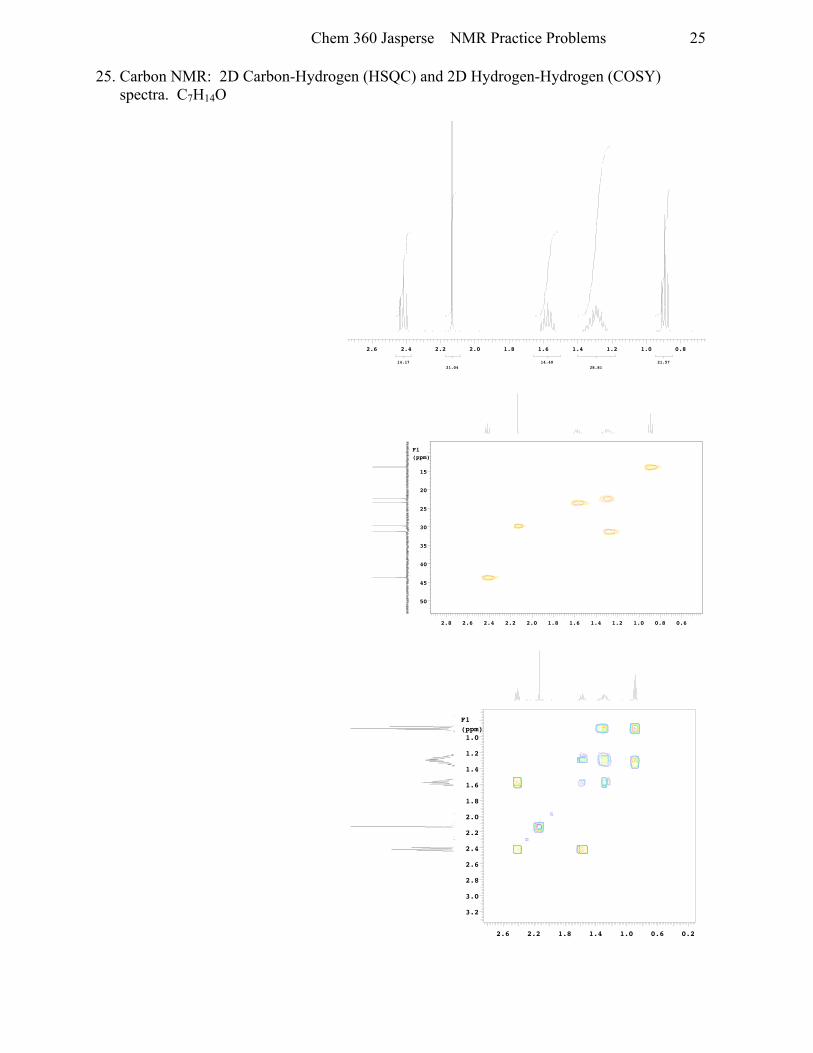
25. Carbon NMR: 2D Carbon-Hydrogen (HSQC) and 2D Hydrogen-Hydrogen (COSY) spectra. C7H14O
Fri Feb 4 23:53:02 2011: Experiment started
Fri Feb 4 23:53:33 2011: Acquisition complete
14.1721.04
14.4028.81
21.57
ppm0.81.01.21.41.61.82.02.22.42.6
Plotname: 2-Heptanone_PROTON_01_plot02
Fri Feb 4 23:53:40 2011: Experiment started
Fri Feb 4 23:54:41 2011: Acquisition complete
F2 (ppm)
0.60.81.01.21.41.61.82.02.22.42.62.8
F1(ppm)
15
20
25
30
35
40
45
50
Plotname: 2-Heptanone_ASAPHMQC_01_plot02
Fri Feb 4 23:54:49 2011: Experiment started
Fri Feb 4 23:58:03 2011: Acquisition complete
F2 (ppm)
0.20.61.01.41.82.22.6
F1(ppm)1.0
1.2
1.4
1.6
1.8
2.0
2.2
2.4
2.6
2.8
3.0
3.2
Plotname: 2-Heptanone_gCOSY_01_plot02
Chem 360 Jasperse NMR Practice Problems
26
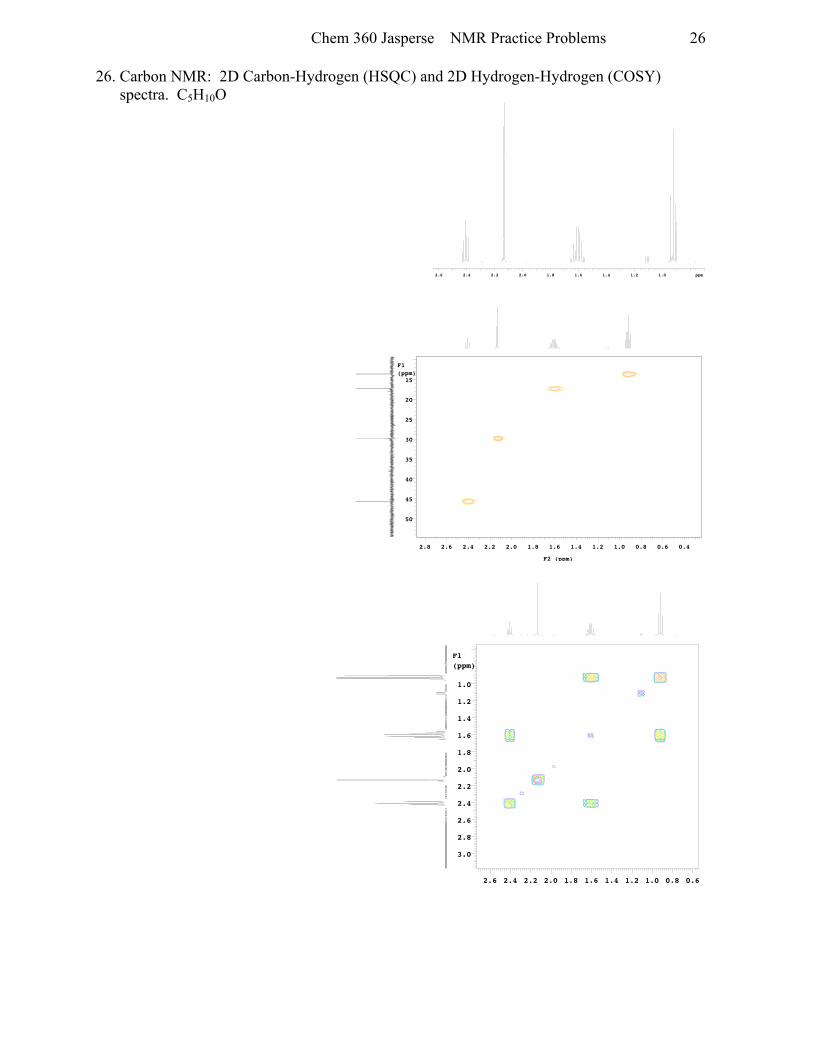
26. Carbon NMR: 2D Carbon-Hydrogen (HSQC) and 2D Hydrogen-Hydrogen (COSY) spectra. C5H10O
Fri Feb 4 21:37:32 2011: Experiment started
Fri Feb 4 21:38:04 2011: Acquisition complete
ppm1.01.21.41.61.82.02.22.42.6Plotname: 2-Pentanone_PROTON_Fri Feb 4 21:38:11 2011: Experiment started
Fri Feb 4 21:39:12 2011: Acquisition complete
F2 (ppm)
0.40.60.81.01.21.41.61.82.02.22.42.62.8
F1(ppm)
15
20
25
30
35
40
45
50
Plotname: 2-Pentanone_ASAPHMQC_01_plot02
Fri Feb 4 21:37:32 2011: Experiment started
Fri Feb 4 21:38:04 2011: Acquisition complete
F2 (ppm)
0.60.81.01.21.41.61.82.02.22.42.6
F1(ppm)
1.0
1.2
1.4
1.6
1.8
2.0
2.2
2.4
2.6
2.8
3.0
Plotname: 2-Pentanone_gCOSY_01_plot02
Chem 360 Jasperse NMR Practice Problems
27
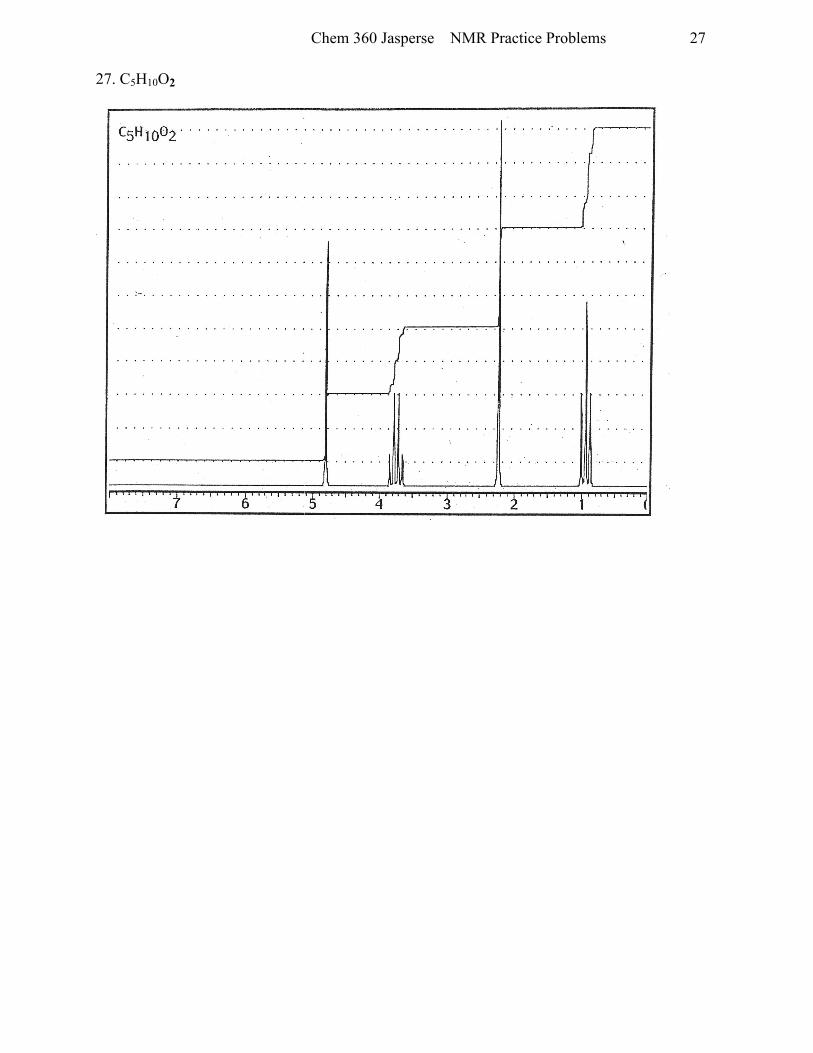
27. C5H10O2
c5H1602
\
Chem 360 Jasperse NMR Practice Problems
28
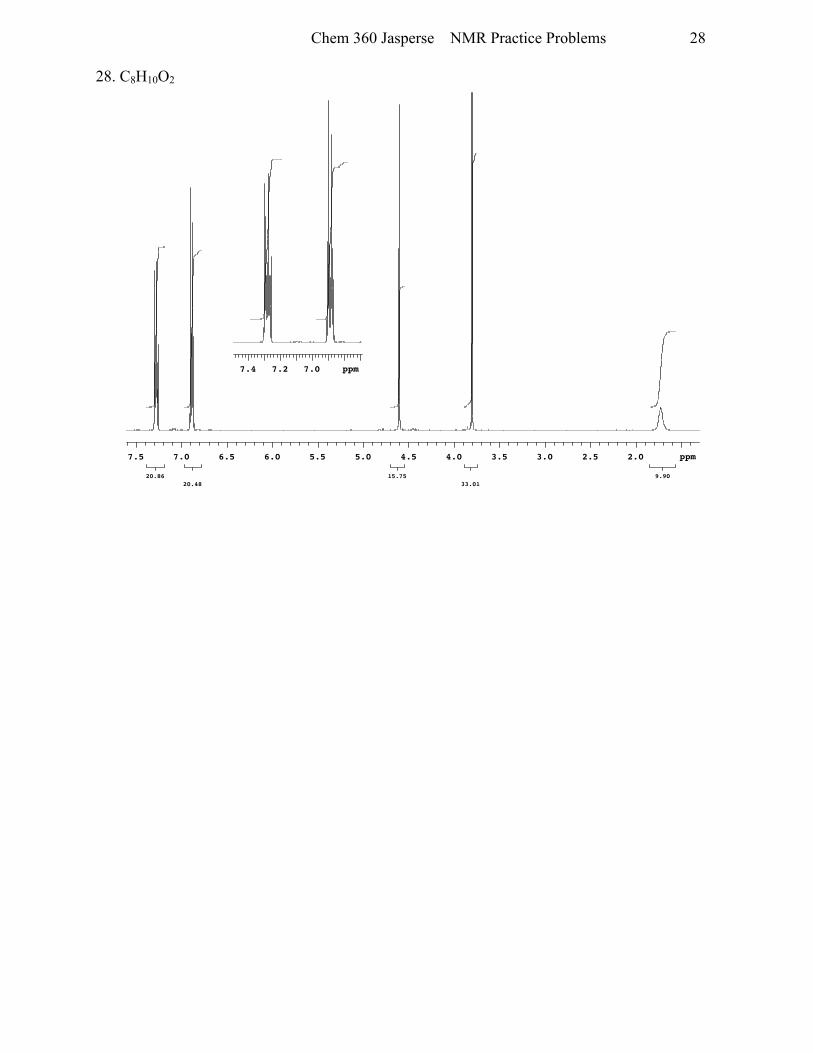
28. C8H10O2
ppm7.07.27.4
Sat Feb 4 16:25:17 2012: Experiment started
20.8620.48
15.7533.01
9.90
ppm2.02.53.03.54.04.55.05.56.06.57.07.5
Plotname: 4-Methoxybenzyl_alcohol_PROTON_01_plot02
Chem 360 Jasperse NMR Practice Problems
29
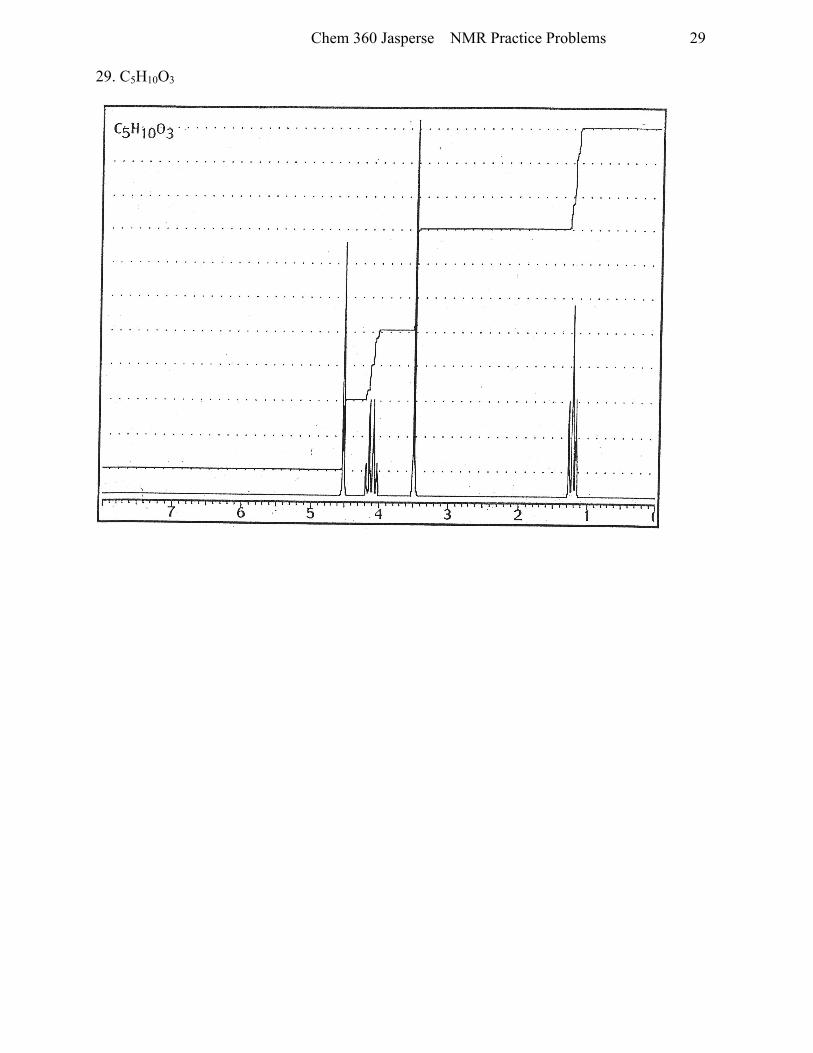
29. C5H10O3
@c5Hi603
Chem 360 Jasperse NMR Practice Problems
30
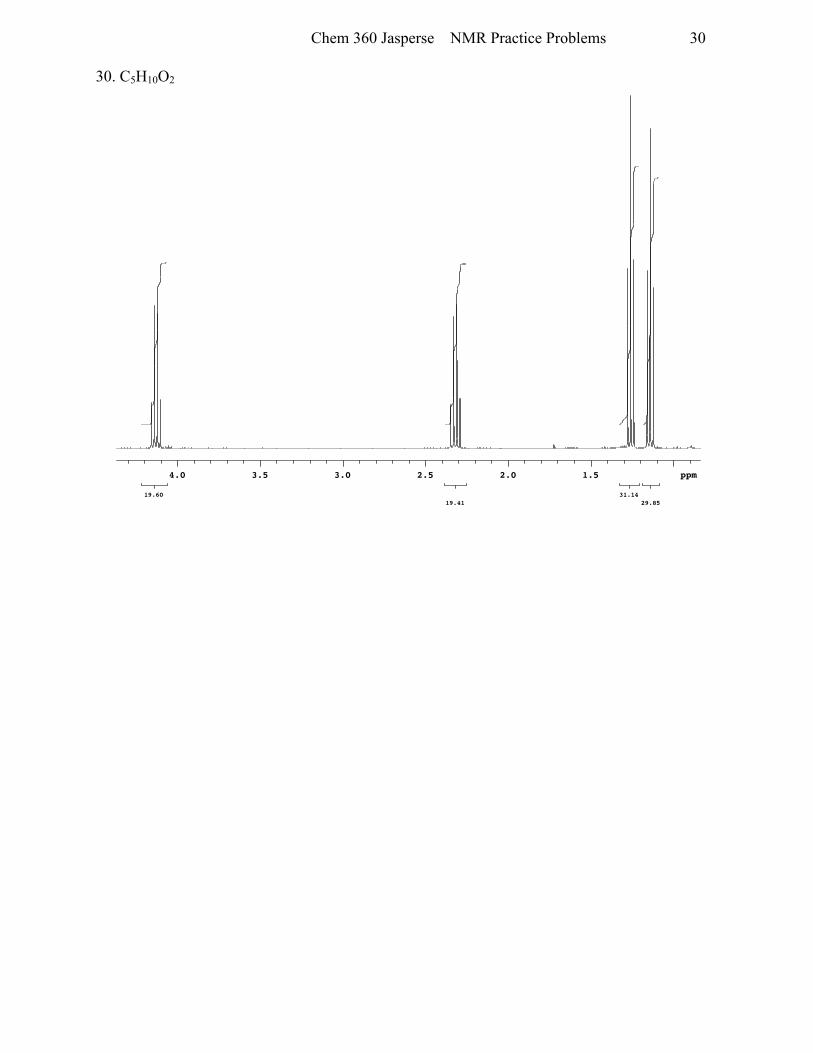
30. C5H10O2
Sat Feb 4 16:29:17 2012: Experiment started
19.6019.41
31.1429.85
ppm1.52.02.53.03.54.0
Plotname: ethyl_propionate_PROTON_01_plot02
Chem 360 Jasperse NMR Practice Problems
31
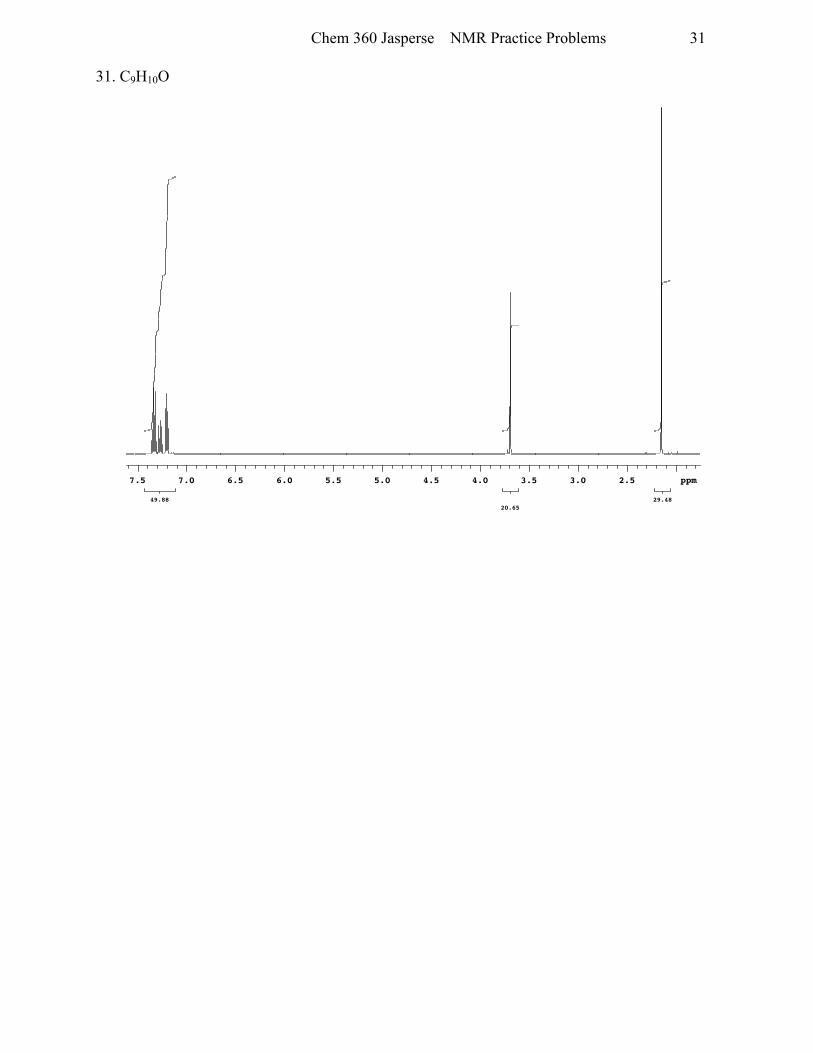
31. C9H10O
Sat Feb 4 16:33:45 2012: Experiment started
49.8820.65
29.48
ppm2.53.03.54.04.55.05.56.06.57.07.5
Plotname: Phenyl_acetone_PROTON_01_plot02
Chem 360 Jasperse NMR Practice Problems
32
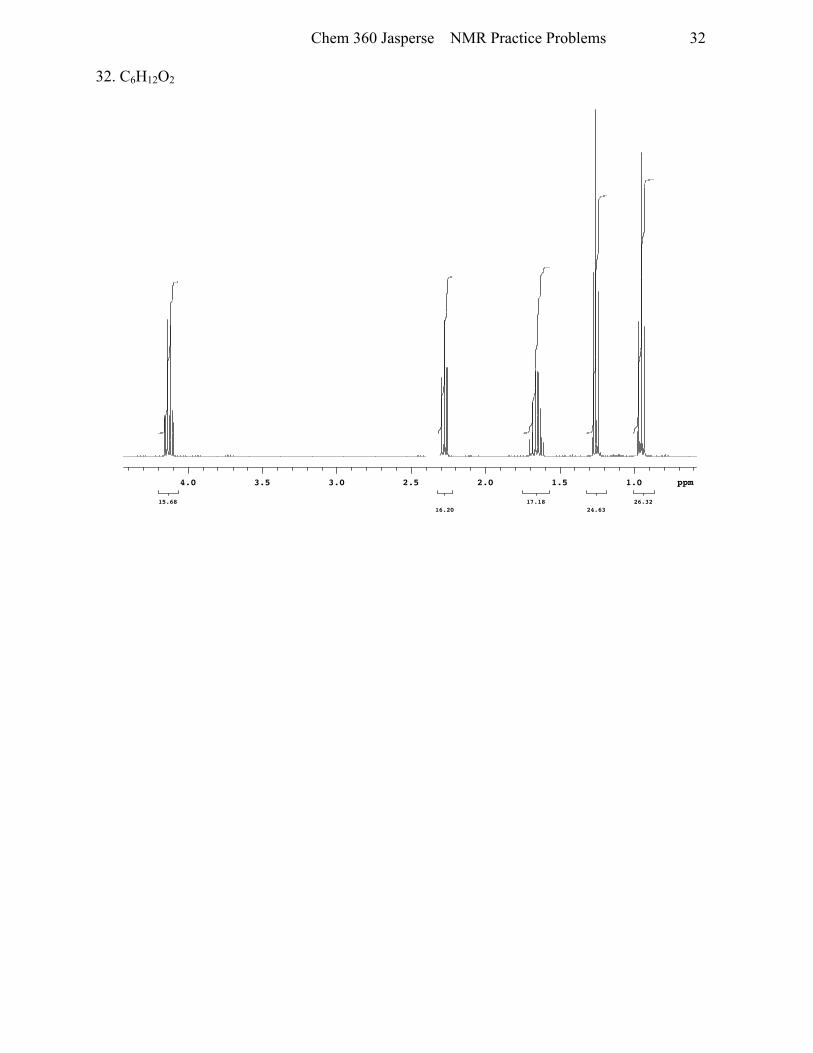
32. C6H12O2
Sat Feb 4 17:52:44 2012: Experiment started
15.6816.20
17.1824.63
26.32
ppm1.01.52.02.53.03.54.0
Plotname: Ethyl_Butyrate_PROTON_01_plot02
Chem 360 Jasperse NMR Practice Problems
33
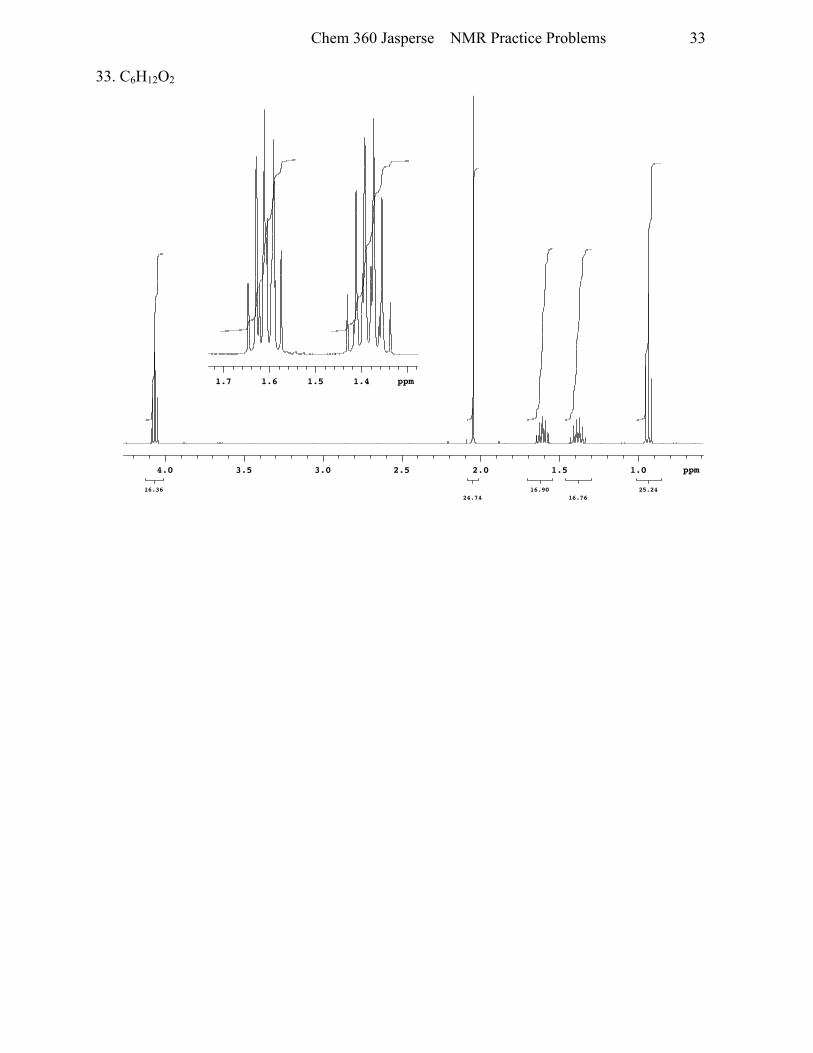
33. C6H12O2
ppm1.41.51.61.7
Sat Feb 4 16:45:37 2012: Experiment started
16.3624.74
16.9016.76
25.24
ppm1.01.52.02.53.03.54.0
Plotname: Butyl_Acetate_PROTON_01_plot02
Chem 360 Jasperse NMR Practice Problems
34
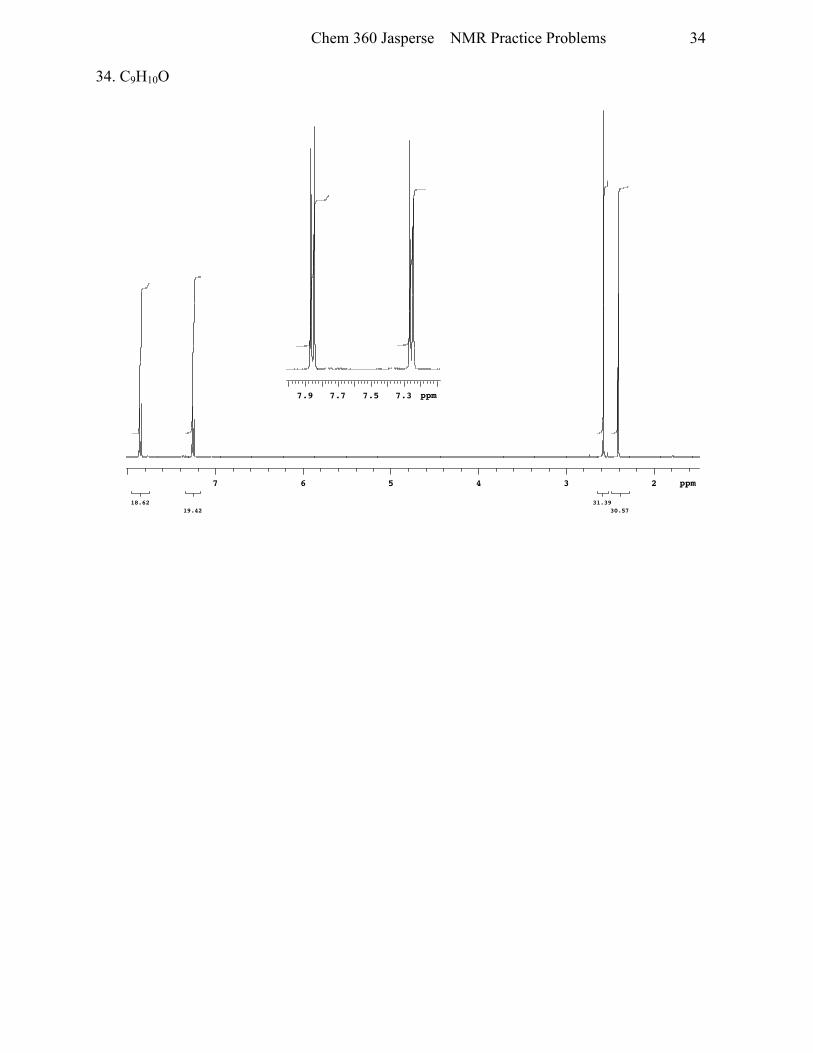
34. C9H10O
ppm7.37.57.77.9
Sat Feb 4 16:49:40 2012: Experiment started
18.6219.42
31.3930.57
ppm234567
Plotname: 4-Methylacetophenone_PROTON_01_plot02
Chem 360 Jasperse NMR Practice Problems
35
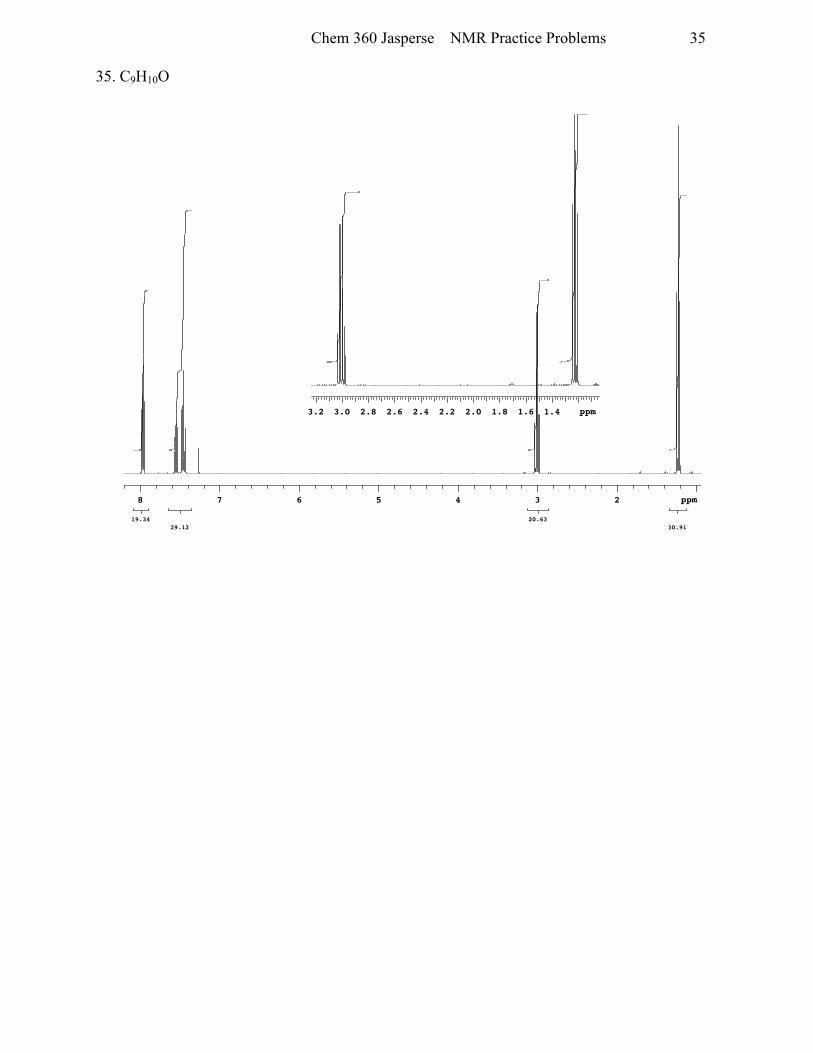
35. C9H10O
ppm1.41.61.82.02.22.42.62.83.03.2
Sat Feb 4 16:53:40 2012: Experiment started
19.3429.12
20.6330.91
ppm2345678
Plotname: Propiophenone_PROTON_01_plot02
Chem 360 Jasperse NMR Practice Problems
36
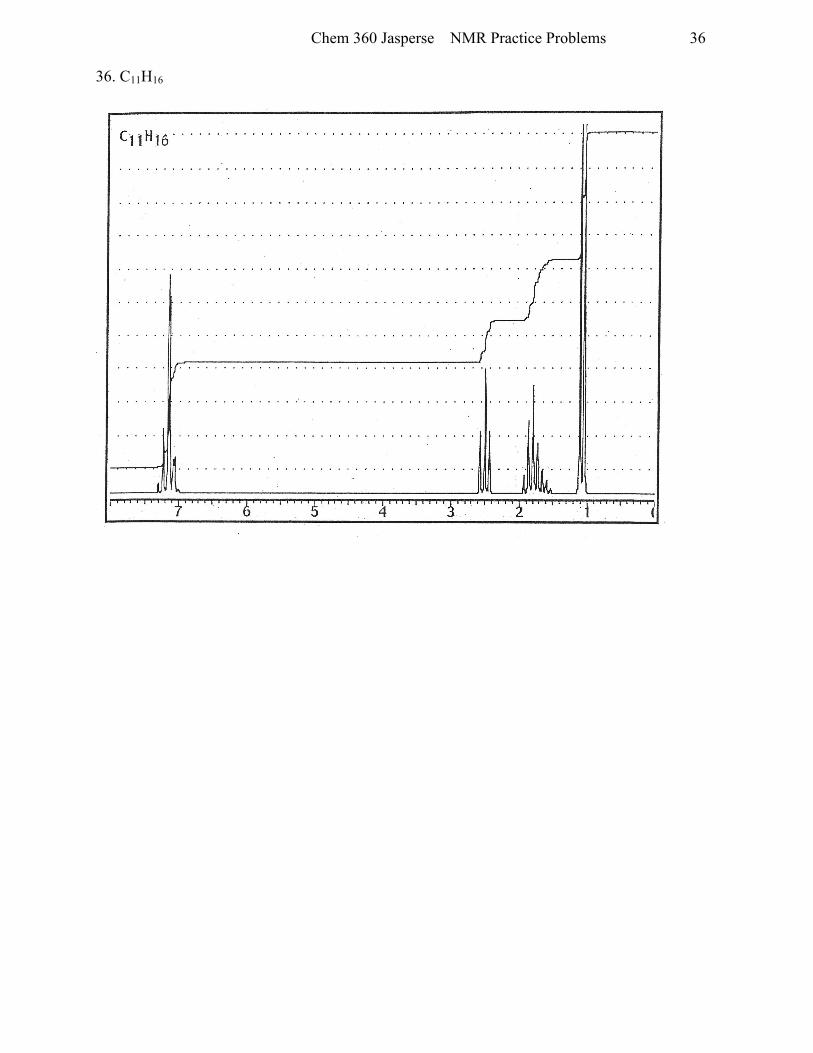
36. C11H16
@ci t l l iO
Chem 360 Jasperse NMR Practice Problems
37
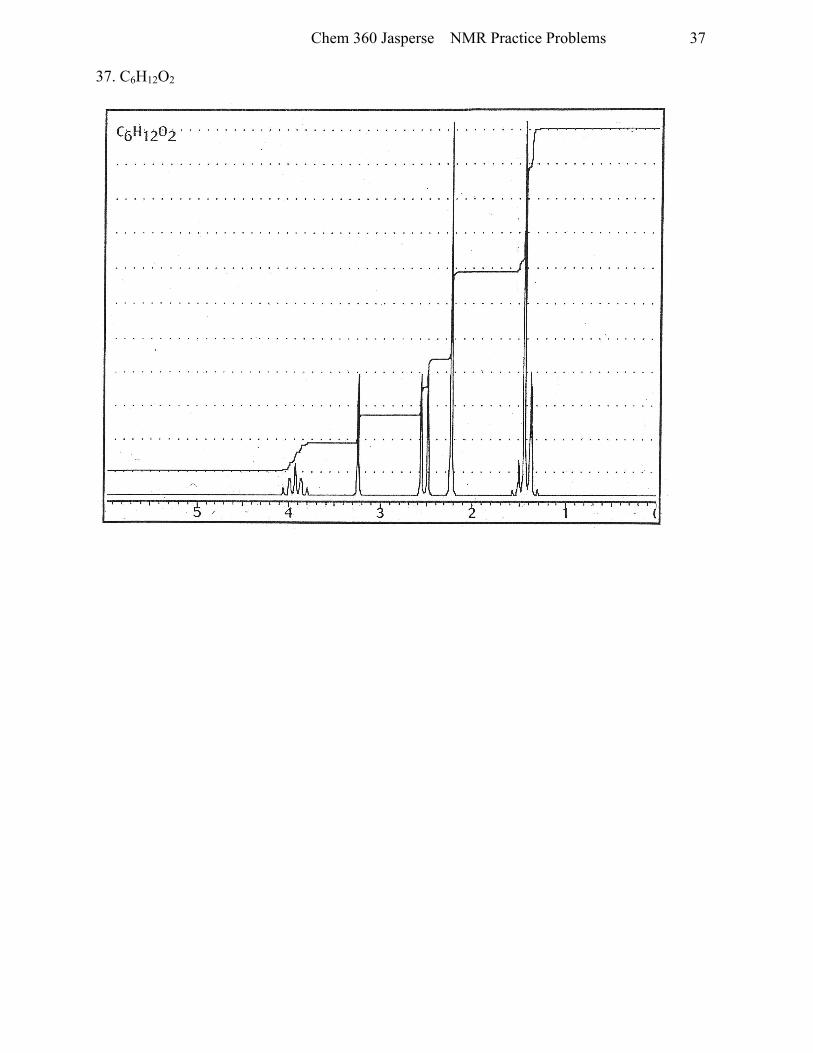
37. C6H12O2
A/ lffiLtlt t / 2-, 't v / t ) t /\_/ l_/
c6H12o2
Chem 360 Jasperse NMR Practice Problems
38
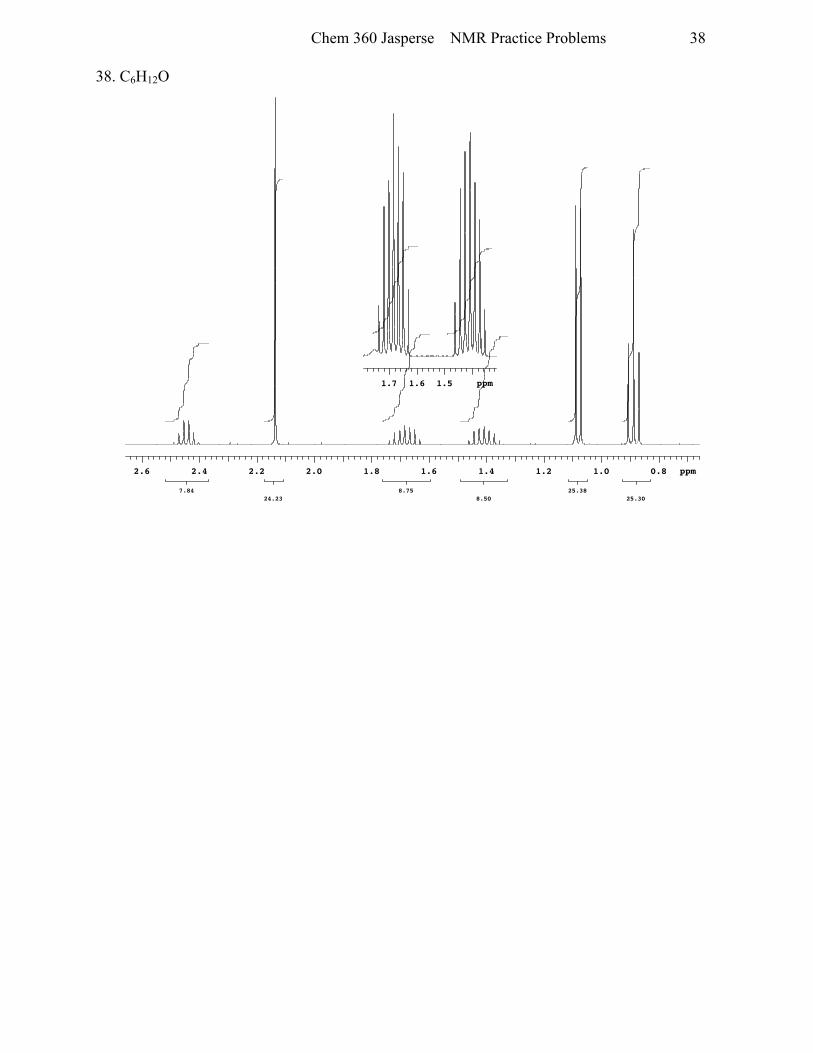
38. C6H12O
ppm1.51.61.7
Sat Feb 4 16:17:16 2012: Experiment started
7.8424.23
8.758.50
25.3825.30
ppm0.81.01.21.41.61.82.02.22.42.6
Plotname: 3-Methyl-2-pentanone_PROTON_01_plot02
Chem 360 Jasperse NMR Practice Problems
39
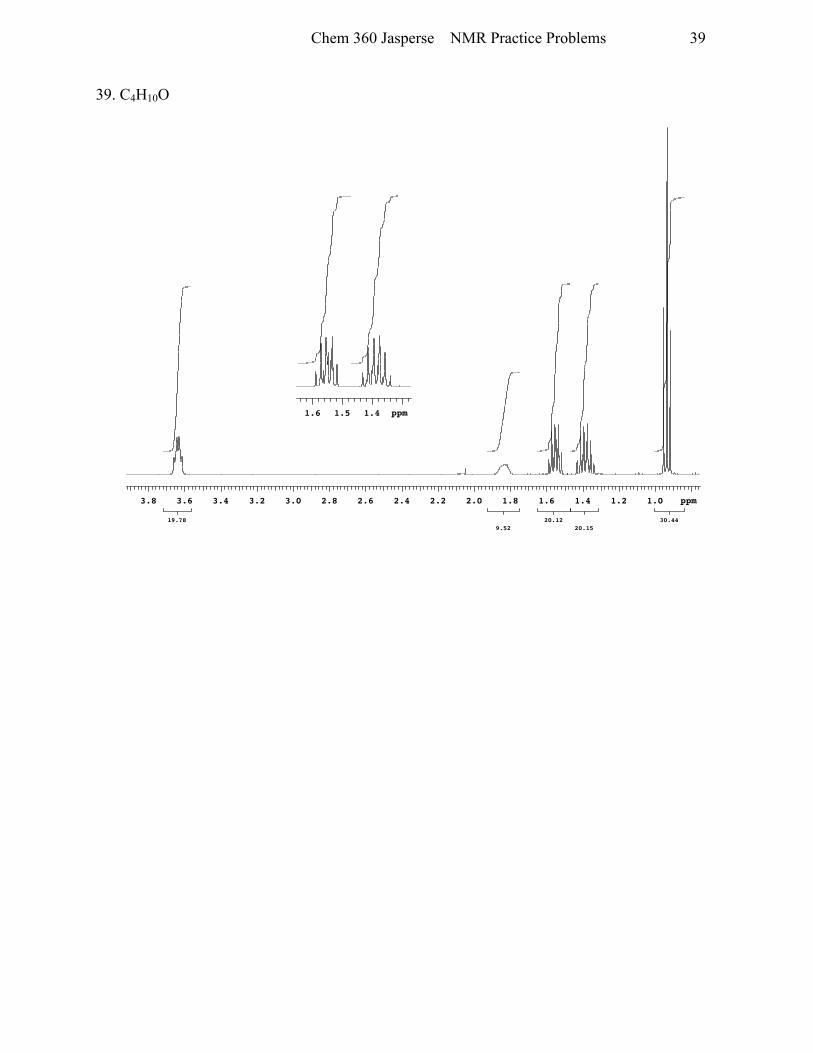
39. C4H10O
ppm1.41.51.6
Sat Feb 4 17:09:42 2012: Experiment started
19.789.52
20.1220.15
30.44
ppm1.01.21.41.61.82.02.22.42.62.83.03.23.43.63.8
Plotname: 1-butanol_PROTON_01_plot02
Chem 360 Jasperse NMR Practice Problems
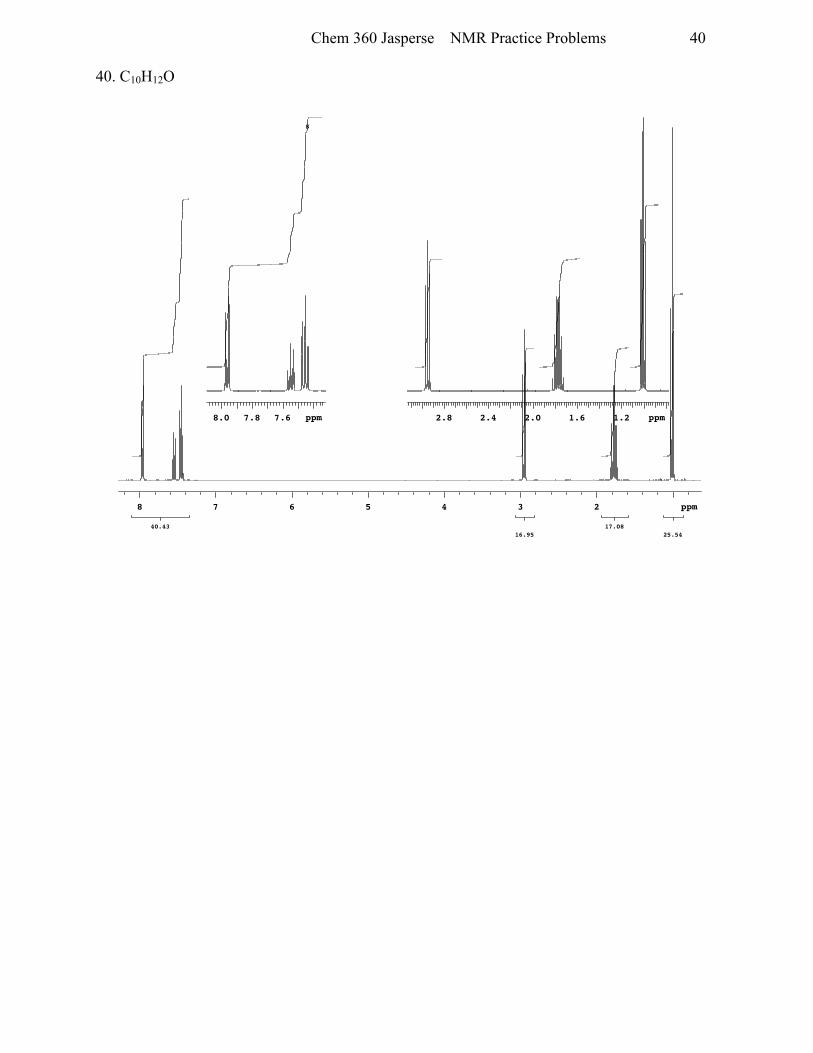
40
40. C10H12O
ppm1.21.62.02.42.8ppm7.67.88.0
Sat Feb 4 17:13:44 2012: Experiment started
40.4316.95
17.0825.54
ppm2345678
Plotname: Butyrophenone_PROTON_01_plot02
Chem 360 Jasperse NMR Practice Problems
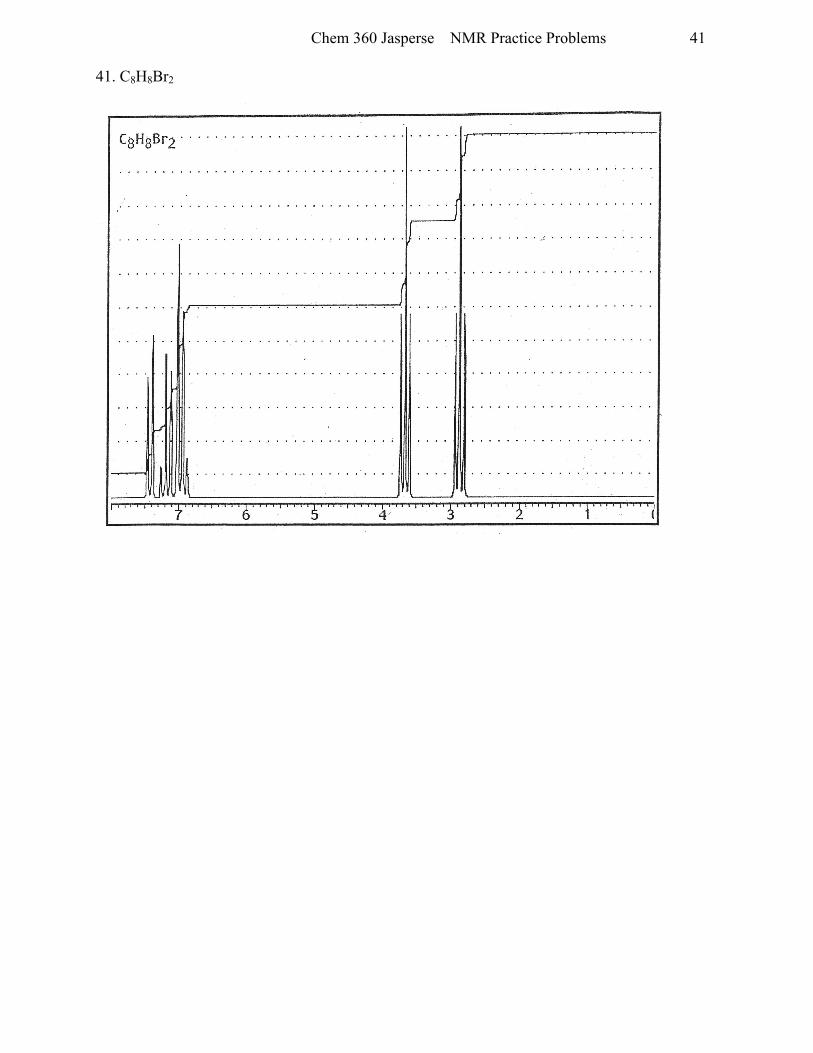
41
41. C8H8Br2
oCBHgB12
Chem 360 Jasperse NMR Practice Problems
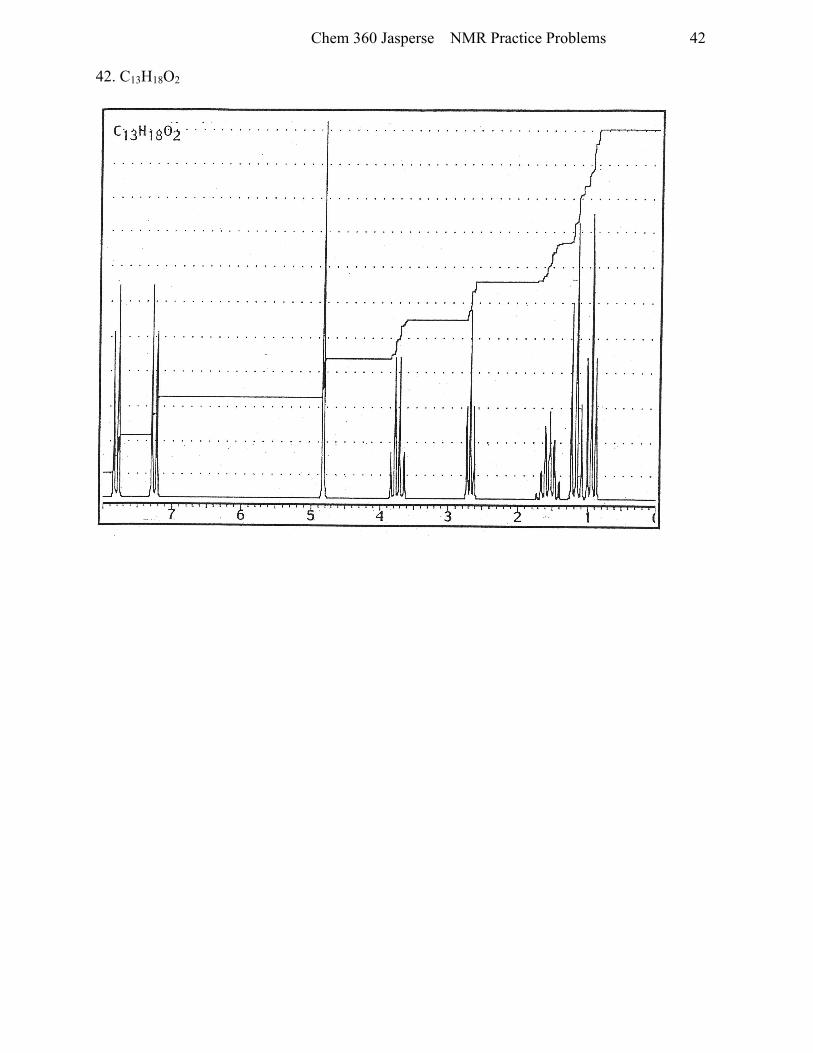
42
42. C13H18O2
6D
ci3H igo2