Embed Size (px)
Citation preview
Short Run Trade Off Between Inflation and UnemploymentETP Economics 102Jack Wu
Unemployment and Inflation
•The natural rate of unemployment depends on various features of the labor market.
•Examples include minimum-wage laws, the market power of unions, the role of efficiency wages, and the effectiveness of job search.
•The inflation rate depends primarily on growth in the quantity of money, controlled by the Fed.
Trade Off•Society faces a short-run tradeoff between
unemployment and inflation.•If policymakers expand aggregate
demand, they can lower unemployment, but only at the cost of higher inflation.
•If they contract aggregate demand, they can lower inflation, but at the cost of temporarily higher unemployment.
Phillips Curve
•The Phillips curve illustrates the short-run relationship between inflation and unemployment.

The Phillips Curve
UnemploymentRate (percent)
0
InflationRate
(percentper year)
Phillips curve
4
B6
7
A2
Copyright © 2004 South-Western
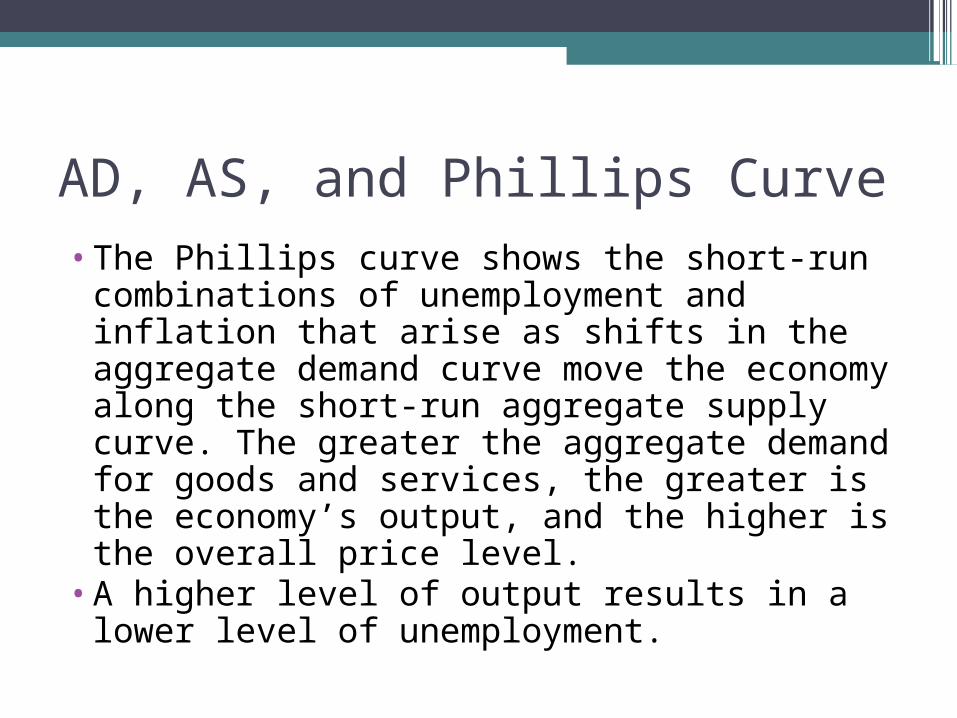
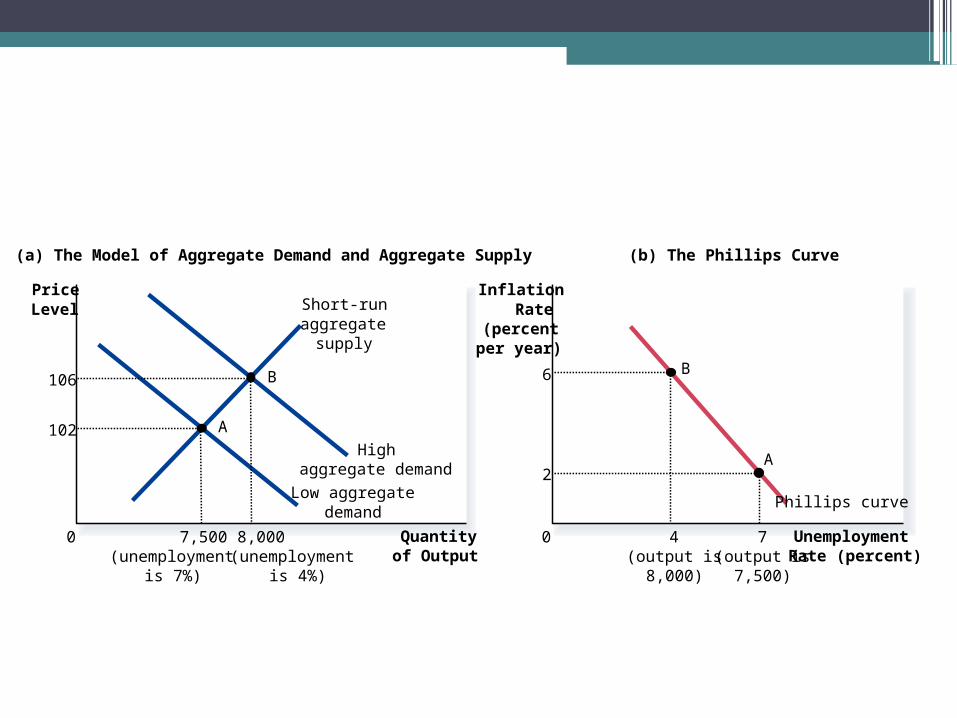
AD, AS, and Phillips Curve•The Phillips curve shows the short-run
combinations of unemployment and inflation that arise as shifts in the aggregate demand curve move the economy along the short-run aggregate supply curve. The greater the aggregate demand for goods and services, the greater is the economy’s output, and the higher is the overall price level.
•A higher level of output results in a lower level of unemployment.
Quantityof Output
0
Short-runaggregate
supply
(a) The Model of Aggregate Demand and Aggregate Supply
UnemploymentRate (percent)
0
InflationRate
(percentper year)
PriceLevel
(b) The Phillips Curve
Phillips curveLow aggregate
demand
Highaggregate demand
(output is8,000)
B
4
6
(output is7,500)
A
7
2
8,000(unemployment
is 4%)
106 B
(unemploymentis 7%)
7,500
102 A
Copyright © 2004 South-Western
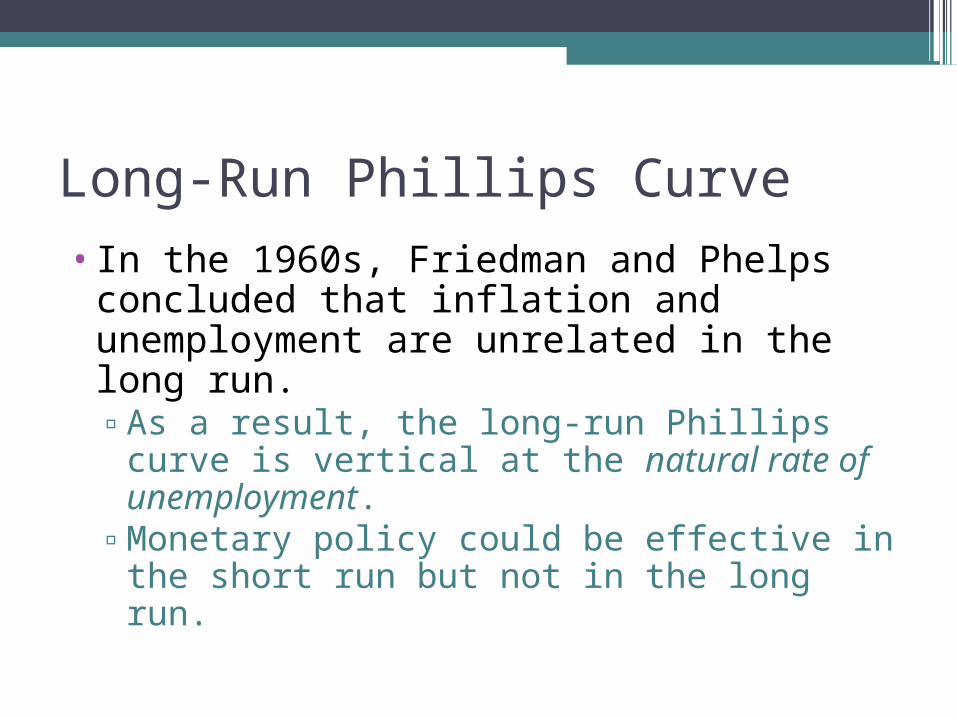
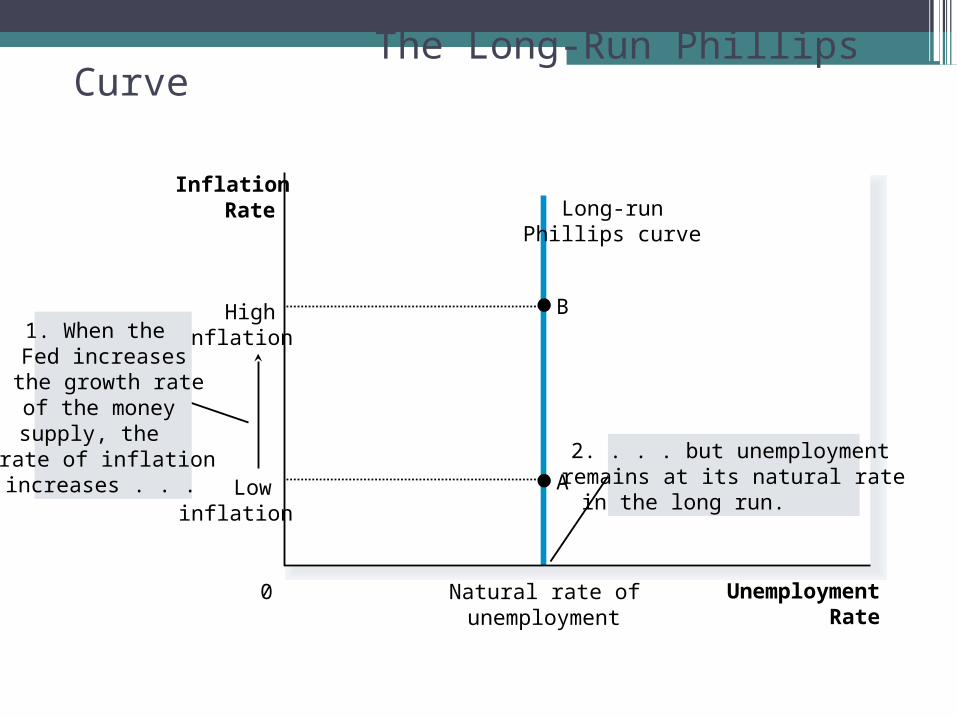
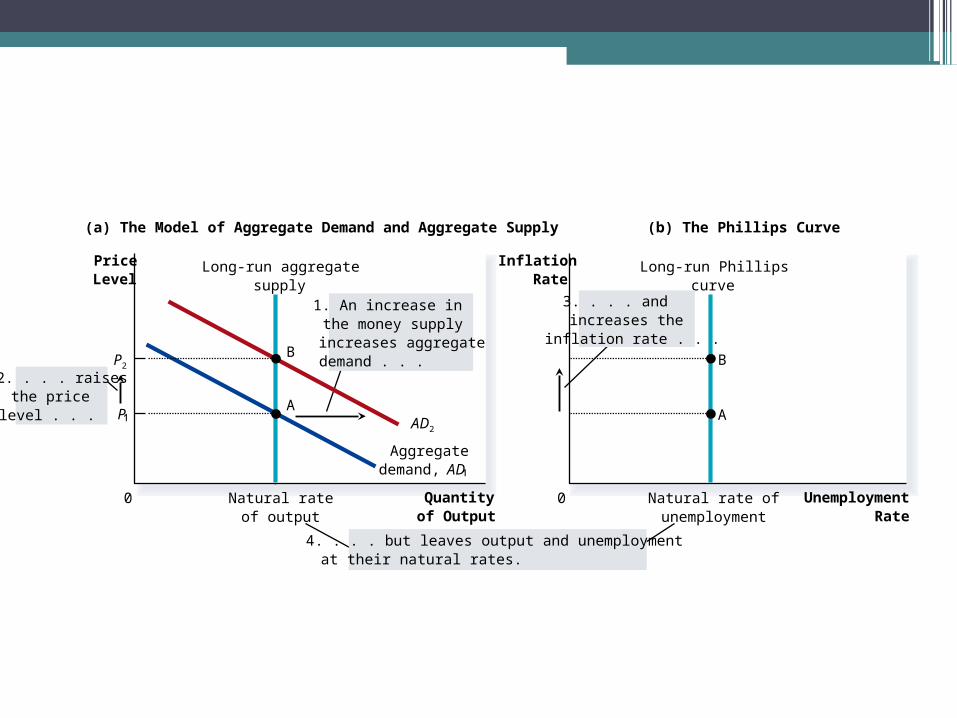
Long-Run Phillips Curve•In the 1960s, Friedman and Phelps
concluded that inflation and unemployment are unrelated in the long run.▫As a result, the long-run Phillips curve is
vertical at the natural rate of unemployment.
▫Monetary policy could be effective in the short run but not in the long run.
The Long-Run Phillips Curve
UnemploymentRate
0 Natural rate ofunemployment
InflationRate Long-run
Phillips curve
BHighinflation
Lowinflation
A
2. . . . but unemploymentremains at its natural ratein the long run.
1. When the Fed increases the growth rate of the money supply, the rate of inflation increases . . .
Copyright © 2004 South-Western
Quantityof Output
Natural rateof output
Natural rate ofunemployment
0
PriceLevel
P
Aggregatedemand, AD
Long-run aggregatesupply
Long-run Phillipscurve
(a) The Model of Aggregate Demand and Aggregate Supply
UnemploymentRate
0
InflationRate
(b) The Phillips Curve
2. . . . raisesthe pricelevel . . .
1. An increase in the money supplyincreases aggregatedemand . . .
AAD2
B
A
4. . . . but leaves output and unemploymentat their natural rates.
3. . . . andincreases theinflation rate . . .
P2B
Copyright © 2004 South-Western
Expectations and Short-Run Phillips Curve•Expected inflation measures how much
people expect the overall price level to change.
•In the long run, expected inflation adjusts to changes in actual inflation.
•The Fed’s ability to create unexpected inflation exists only in the short run.▫Once people anticipate inflation, the only
way to get unemployment below the natural rate is for actual inflation to be above the anticipated rate.
Formula
•Unemployment Rate=Natural Rate of Unemployment- a {Actual Inflation –Expected Inflation}
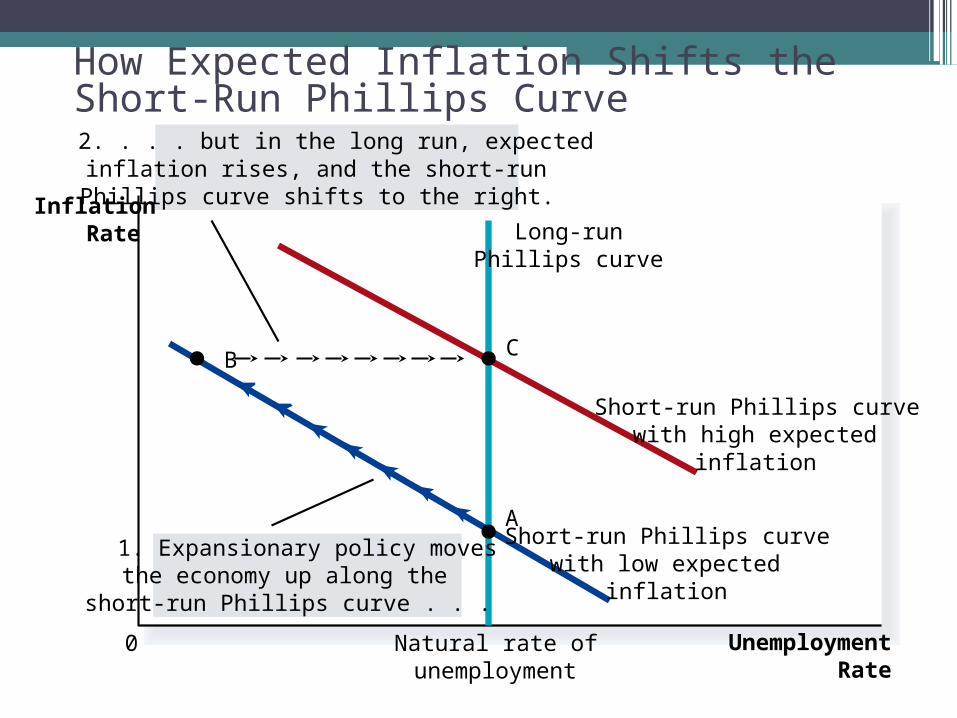
How Expected Inflation Shifts the Short-Run Phillips Curve
UnemploymentRate
0 Natural rate ofunemployment
InflationRate Long-run
Phillips curve
Short-run Phillips curvewith high expected
inflation
Short-run Phillips curvewith low expected
inflation
1. Expansionary policy movesthe economy up along the short-run Phillips curve . . .
2. . . . but in the long run, expectedinflation rises, and the short-run Phillips curve shifts to the right.
CB
A
Copyright © 2004 South-Western
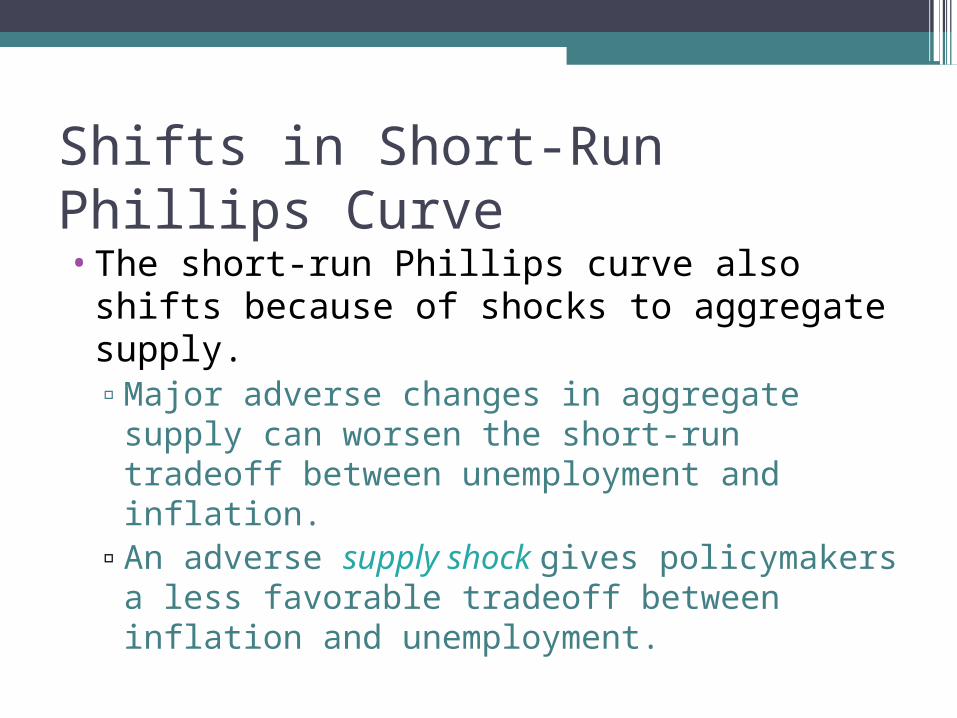
Shifts in Short-Run Phillips Curve•The short-run Phillips curve also shifts
because of shocks to aggregate supply. ▫Major adverse changes in aggregate supply
can worsen the short-run tradeoff between unemployment and inflation.
▫An adverse supply shock gives policymakers a less favorable tradeoff between inflation and unemployment.
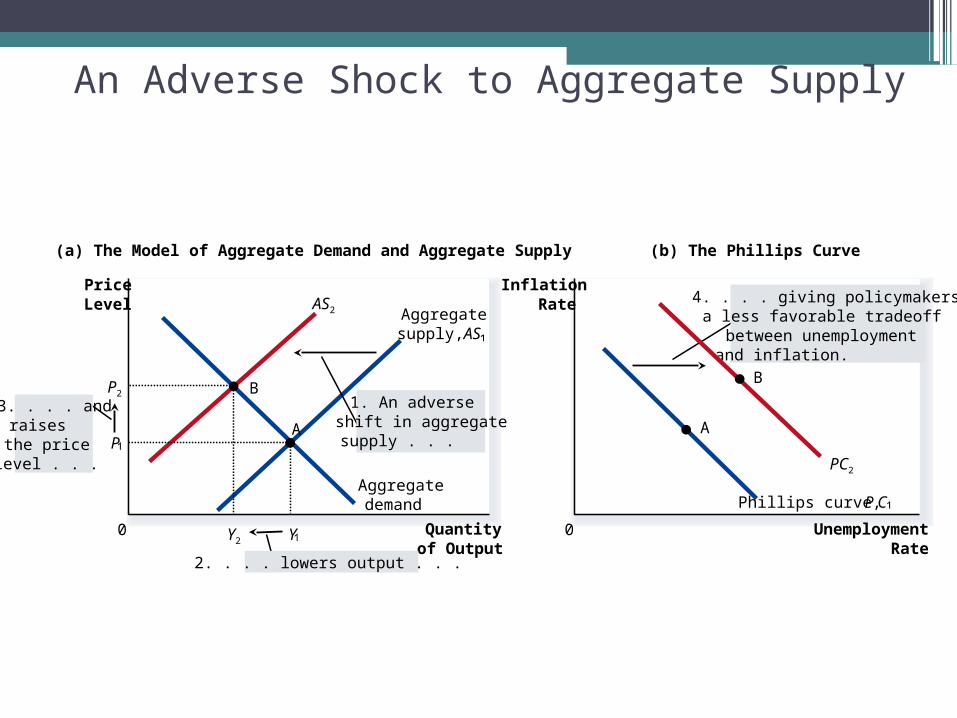
An Adverse Shock to Aggregate Supply
Quantityof Output
0
PriceLevel
Aggregatedemand
(a) The Model of Aggregate Demand and Aggregate Supply
UnemploymentRate
0
InflationRate
(b) The Phillips Curve
3. . . . andraises the price level . . .
AS2 Aggregatesupply, AS
A
1. An adverseshift in aggregate supply . . .
4. . . . giving policymakers a less favorable tradeoffbetween unemploymentand inflation.
BP2
Y2
PA
Y
Phillips curve, PC
2. . . . lowers output . . .
PC2
B
Copyright © 2004 South-Western
Cost of Reducing InflationTo reduce inflation, the Fed has to pursue contractionary
monetary policy policy. When the Fed slows the rate of money growth, it
contracts aggregate demand.This reduces the quantity of goods and services that
firms produce.This leads to a rise in unemployment. To reduce inflation, an economy must endure a period of
high unemployment and low output.When the Fed combats inflation, the economy moves
down the short-run Phillips curve.The economy experiences lower inflation but at the cost
of higher unemployment.
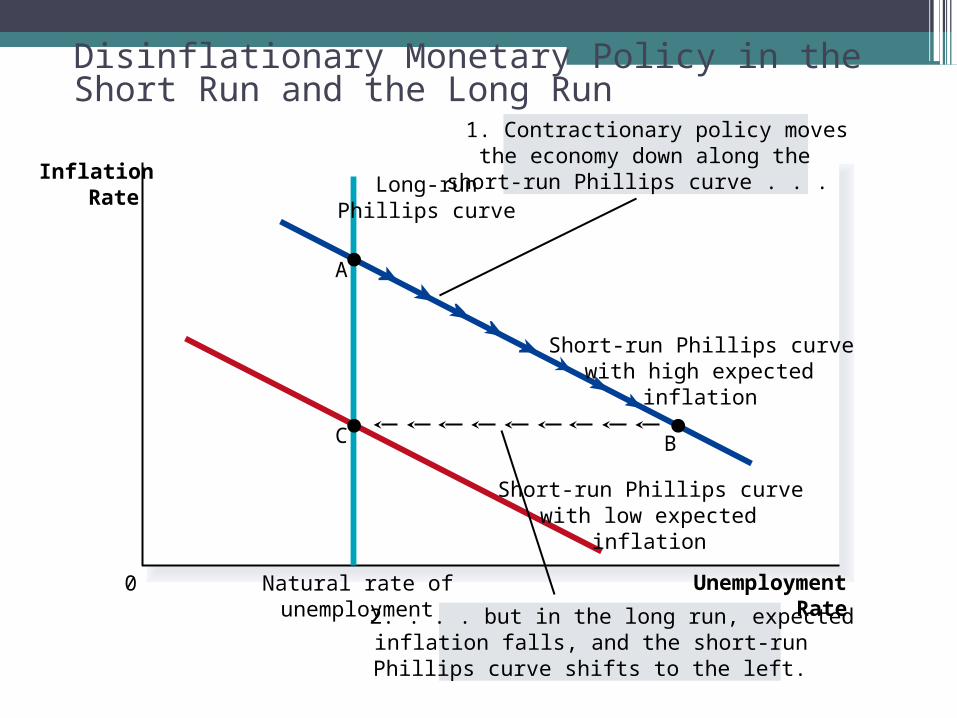
Disinflationary Monetary Policy in the Short Run and the Long Run
UnemploymentRate
0 Natural rate ofunemployment
InflationRate
Long-runPhillips curve
Short-run Phillips curvewith high expected
inflation
Short-run Phillips curvewith low expected
inflation
1. Contractionary policy movesthe economy down along the short-run Phillips curve . . .
2. . . . but in the long run, expectedinflation falls, and the short-run Phillips curve shifts to the left.
BC
A
Copyright © 2004 South-Western
Sacrifice Ratio
•The sacrifice ratio is the number of percentage points of annual output that is lost in the process of reducing inflation by one percentage point.▫An estimate of the sacrifice ratio is five.

Rational Expectations and Possibility of Costless Disinflation• The theory of rational expectations suggests that people
optimally use all the information they have, including information about government policies, when forecasting the future.
• Expected inflation explains why there is a tradeoff between inflation and unemployment in the short run but not in the long run.
• How quickly the short-run tradeoff disappears depends on how quickly expectations adjust.
• The theory of rational expectations suggests that the sacrifice-ratio could be much smaller than estimated.