Embed Size (px)
Citation preview

Shock: An Overview Michael L. Cheatham, MD
Ernest F.J. Block, MD
Howard G. Smith, MD
John T. Promes, MD
Surgical Critical Care Service
Department of Surgical Education Orlando Regional Medical Center
Orlando, Florida
Shock: An Overview – Cheatham, Block, Smith, & Promes 1
Shock is one of the most frequently
diagnosed, yet poorly understood clinical
conditions encountered in the critically ill. The
very definition of what constitutes "shock"
remains controversial, largely due to its variable
presentation and multifactorial etiology. Ongoing
investigations have identified the origins and
mechanisms of the various shock states to be
complex and based within the cellular foundation
of normal everyday existence. Despite advances
in critical care management, patients who
previously would have died from their initial
physiologic insult are surviving, only to succumb
to the late effects of shock. Although mortality
from the shock states remains high, recent
advances in hemodynamic monitoring technology
have significantly enhanced a clinician's ability to
improve patient outcome following the
development of shock.
DEFINITION Although early definitions of shock lack
scientific terminology and reveal the inadequate
understanding of pathophysiology prevalent at
the time, they compensate for it in simplicity and
accuracy. John Collins Warren described shock
as “a momentary pause in the act of death” while
Samuel Gross defined it as “a rude unhinging of
the machinery of life.” With improved
understanding of cellular physiology and function,
we now recognize Gross' "machinery of life" to be
the delivery and utilization of oxygen at the
cellular level. As a result, shock is currently best
defined as a multifactorial syndrome resulting in
inadequate tissue perfusion and cellular
oxygenation affecting multiple organ systems.
The importance of regional blood flow to
individual organ systems is the singular concept
for recognizing both the obvious and subtler
shock states. Perfusion may be decreased either
systemically (as in hypotension) or limited to
regional maldistribution (as in septic shock,
where global perfusion is normal or even
elevated). Regardless of etiology or severity, all
forms of shock have the commonality of perfusion
inadequate to meet metabolic demands at the
cellular level. Decreased organ perfusion leads
to tissue hypoxia, anaerobic metabolism,
activation of an inflammatory cascade, and
eventual vital organ dysfunction. The ultimate
consequences of such malperfusion vary from
patient to patient depending upon the degree and
duration of hypoperfusion, the number of organ
systems affected, and the presence of prior organ
dysfunction. The challenge to the intensivist is
identification of the hypoperfused state,
quantification of its severity and prognosis, and
rapid restoration of cellular perfusion to avoid
organ dysfunction and failure. This chapter
reviews the current methods for diagnosing,
monitoring, and treating the various shock states.
PHYSIOLOGY Over the past decade, significant progress
has been made in elucidating the cellular basis
for shock. Whereas hypoperfusion and cellular
ischemia were previously thought to be sufficient
to cause shock, they are now recognized as
being solely the initiating triggers for a complex
physiologic cascade. Cellular hypoxia
predisposes tissues to "reperfusion injury"
leading to local vasoconstriction, thrombosis,
regional malperfusion, release of superoxide
radicals, and direct cellular damage. Subsequent
2 Shock: An Overview – Cheatham, Block, Smith, & Promes
activation of neutrophils and release of
proinflammatory cytokines such as tumor
necrosis factor (TNF), interleukin-1 (IL-1), and
platelet activating factor result in cellular injury,
organ dysfunction and failure, and frequently
death.
Early diagnosis of cellular ischemia with
prompt restoration of tissue perfusion and
oxygenation is essential to preventing this
inflammatory process and improving patient
outcome from shock. The underlying etiology
may be quite evident, as in the case of upper
gastrointestinal hemorrhage, or may be occult, as
in the case of intra-abdominal solid viscus injury
from blunt trauma. Due to the significant
morbidity and mortality associated with delayed
shock resuscitation, the intensivist must
commonly begin appropriate management before
all clinical information or diagnostic studies are
available. As a result, the intensivist must
possess a solid understanding of the most likely
shock states, their clinical presentation, and the
necessary therapeutic interventions.
Recognition of shock may occur through
basic physical findings and physiologic
measurements. Although a normal systemic
blood pressure cannot be used to rule out shock,
an abnormally low blood pressure may be all that
is needed to document hypoperfusion and
explain a patient's shock state. The presence of
shock is more likely to be occult, however, and to
require more indepth investigation and utilization
of advanced hemodynamic monitoring
techniques. Assessment of regional tissue
perfusion by review of end-organ function can
help to document the presence of shock before
the late signs of systemic malperfusion are
evident with their associated detrimental impact
on patient outcome. Readily identifiable clinical
changes in three vital organ systems may serve
to identify the presence of shock: the brain, the
heart, and the kidneys.
Decline in higher cortical function (mentation)
may indicate diminished perfusion of the brain.
This may be due to either decreased arterial
blood pressure, the presence of flow-limiting
lesions, or increased intracranial pressure.
Although the brain can compensate to a certain
degree for decreased perfusion, this ability
appears to be lost when mean systemic arterial
blood pressure falls below 60 to 70 mmHg (1).
For patients used to higher systemic blood
pressures or those with flow-limiting carotid
lesions, the ability to compensate may be lost at
even higher pressures.
Cardiac dysfunction due to shock may be one
of the earliest signs of hypoperfusion. The heart
plays a central role not only in early detection of
hypoperfusion, but also in the perpetuation of
shock. Depressed coronary perfusion as a
consequence of systemic arterial hypotension or
flow-limiting atherosclerotic stenoses leads to
worsening cardiac dysfunction and a self-
perpetuating progression of global hypoperfusion
and pulmonary failure. Secondary cardiac
dysrhythmias, a consequence of myocardial
hypoxia, may further impair cardiac function and
accelerate the process.
Renal compensation for reduced perfusion is
well known. Although mild changes in arterial
pressure may be tolerated, significant renal
Shock: An Overview – Cheatham, Block, Smith, & Promes 3
hypoperfusion reduces glomerular filtration rate
resulting in decreased hourly urinary output. As
such, oliguria in the patient without prior renal
insufficiency can be a valuable indirect indicator
of shock that mandates close observation of
urinary output in patients who are at risk for
hypoperfusion.
CLASSIFICATION Although the definition of shock is complex,
clinicians require a conceptual framework for the
purposes of communication and research on the
topic. Hinshaw and Cox (proposed a
classification of shock in 1972 that still holds
merit (2). The four categories of shock included
were: a) hypovolemic (shock as a consequence
of inadequate circulating volume, as may be seen
in hemorrhage), b) obstructive (shock caused by
extracardiac obstruction of blood flow, as seen in
cardiac tamponade), c) cardiogenic (shock
caused by primary pump failure, as in decreased
myocardial contractility after myocardial
infarction), and d) distributive (shock associated
with maldistribution of blood flow and volume, as
in sepsis). Recently, this historical classification
was supplemented with the category of e)
endocrine (shock as a result of hormonal
pathology, either through underproduction or
overproduction), an entity whose importance has
recently been increasingly recognized and
diagnosed in the critically ill patient. Regardless
of the classification into which the patient's shock
state is placed, the intensivist must
simultaneously resuscitate while searching for an
inciting event to control.
Hypovolemic Shock Hypovolemic shock is often the first
consideration in the resuscitation of a patient with
evidence of hypoperfusion. It is likely the most
common form of shock, and almost all forms of
shock include some component of hypovolemia,
as a result of decreased preload. Physical
findings include general systemic manifestations,
such as cold, clammy skin from central nervous
system stimulation (leading to sweat gland
activation) and peripheral hypoperfusion
(shunting blood volume centrally). These
physical findings stem from the various
compensatory mechanisms associated with the
shock state. The sympathetic response includes
arterial constriction, which diverts blood from the
splanchnic viscera, skin, and skeletal muscle.
Other sympathetic responses include
venoconstriction to augment venous return to the
right atrium and activation of the renin-
angiotensin system. The latter results in the
release of angiotensin II, which has a dual
function as a vasoconstrictor and promoter of
sodium and water retention. Vasopressin,
released by the posterior pituitary, also acts as a
vasoconstrictor and stimulus to sodium retention.
A critical difference in the neurohumoral reaction
to shock compared to the other reflexes is that
their effects are delayed (10-60 minutes) while
the cardiovascular responses are almost
instantaneous (3).
Attention to objective data such as vital signs
and urinary output are of value in categorizing the
severity of shock. Hypovolemic shock is stratified
into four classes based on the degree of
circulating volume loss (TABLE I). It is important
to recognize that significant blood volume may be
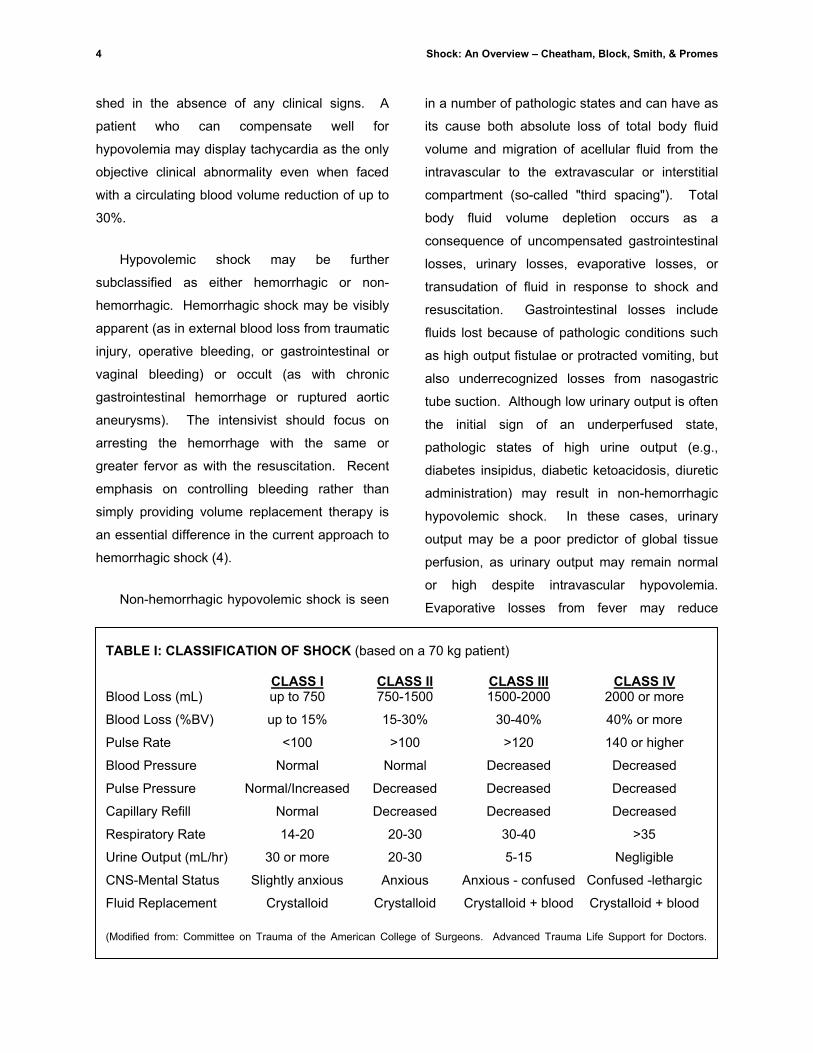
4 Shock: An Overview – Cheatham, Block, Smith, & Promes
shed in the absence of any clinical signs. A
patient who can compensate well for
hypovolemia may display tachycardia as the only
objective clinical abnormality even when faced
with a circulating blood volume reduction of up to
30%.
Hypovolemic shock may be further
subclassified as either hemorrhagic or non-
hemorrhagic. Hemorrhagic shock may be visibly
apparent (as in external blood loss from traumatic
injury, operative bleeding, or gastrointestinal or
vaginal bleeding) or occult (as with chronic
gastrointestinal hemorrhage or ruptured aortic
aneurysms). The intensivist should focus on
arresting the hemorrhage with the same or
greater fervor as with the resuscitation. Recent
emphasis on controlling bleeding rather than
simply providing volume replacement therapy is
an essential difference in the current approach to
hemorrhagic shock (4).
Non-hemorrhagic hypovolemic shock is seen
in a number of pathologic states and can have as
its cause both absolute loss of total body fluid
volume and migration of acellular fluid from the
intravascular to the extravascular or interstitial
compartment (so-called "third spacing"). Total
body fluid volume depletion occurs as a
consequence of uncompensated gastrointestinal
losses, urinary losses, evaporative losses, or
transudation of fluid in response to shock and
resuscitation. Gastrointestinal losses include
fluids lost because of pathologic conditions such
as high output fistulae or protracted vomiting, but
also underrecognized losses from nasogastric
tube suction. Although low urinary output is often
the initial sign of an underperfused state,
pathologic states of high urine output (e.g.,
diabetes insipidus, diabetic ketoacidosis, diuretic
administration) may result in non-hemorrhagic
hypovolemic shock. In these cases, urinary
output may be a poor predictor of global tissue
perfusion, as urinary output may remain normal
or high despite intravascular hypovolemia.
Evaporative losses from fever may reduce
TABLE I: CLASSIFICATION OF SHOCK (based on a 70 kg patient) CLASS I CLASS II CLASS III CLASS IV Blood Loss (mL) up to 750 750-1500 1500-2000 2000 or more
Blood Loss (%BV) up to 15% 15-30% 30-40% 40% or more
Pulse Rate <100 >100 >120 140 or higher
Blood Pressure Normal Normal Decreased Decreased
Pulse Pressure Normal/Increased Decreased Decreased Decreased
Capillary Refill Normal Decreased Decreased Decreased
Respiratory Rate 14-20 20-30 30-40 >35
Urine Output (mL/hr) 30 or more 20-30 5-15 Negligible
CNS-Mental Status Slightly anxious Anxious Anxious - confused Confused -lethargic
Fluid Replacement Crystalloid Crystalloid Crystalloid + blood Crystalloid + blood (Modified from: Committee on Trauma of the American College of Surgeons. Advanced Trauma Life Support for Doctors.

Shock: An Overview – Cheatham, Block, Smith, & Promes 5
intravascular volume, but iatrogenic causes of
evaporation, such as prolonged open body cavity
surgery, are a greater cause of significant volume
loss. Shock may still exist despite normal or
increased total body fluid volume when such
volume is not intravascular and capable of
participating in end-organ perfusion.
Transudation of fluid occurs predictably in severe
illnesses such as trauma, pancreatitis, and small
bowel obstruction. The absence of such fluid
from the functional intravascular space as a result
of shock-induced "capillary leak" must be
recognized. Such is especially the case in the
severely burned patient. Significant fluid
sequestration occurs in both the burned and
nonburned tissue. This is the result of both
microcirculatory failure as well as the effect of
inflammatory mediators such as interleukins,
leukotrienes, serotonin, kinins and free radicals.
It is imperative that the intensivist focus on
resuscitation of the patient's intravascular volume
as opposed to their total body volume. Failure to
do so will uniformly result in underresuscitation,
continued end-organ malperfusion, continued
shock, and poor patient outcome.
Obstructive Shock Obstructive forms of shock are those in which
the underlying pathology is a mechanical
obstruction to normal cardiac output and a
subsequent diminution in systemic perfusion. As
such, this form of shock could be considered a
locally induced hypovolemic state. Cardiac
tamponade is a common cause of obstructive
shock. The distinction between a pericardial
effusion and cardiac tamponade is open to some
debate (5,6). The pericardium resists sudden
stretching, and in acute tamponade the cardiac
silhouette may appear normal in size. As a result
of the noncompliance of the pericardium, a small
amount of fluid (usually less than 200 mL) is all
that is necessary to produce tamponade. With
chronic distention, however, large volumes of
pericardial fluid may accumulate with little to no
effect on cardiac physiology. The volume of the
effusion alone, therefore, does not dictate the
clinical course as much as the acuity of its
development. Causes of acute pericardial
effusion include trauma, ischemic myocardial
rupture and aortic dissection.
Clinical signs of tamponade include jugular
venous distention and a central venous pressure
(CVP) waveform demonstrating a rapid X descent
and a blunted Y descent because of the inability
of the heart to fill in diastole. Pulsus paradoxus,
an exaggerated fluctuation in arterial pressure
from changes in intrathoracic pressure during
respiration, may be present. Echocardiography
may further support the diagnosis. Recent
advances in the use of ultrasonography by non-
cardiologists to determine the presence of
pericardial fluid has demonstrated excellent
sensitivity and rapid performance of the
examination (7).
Pulmonary thromboembolus may
occasionally present as profound circulatory
collapse. Cardiac output is restricted either by
mechanical obstruction of the pulmonary arterial
tree or by pulmonary hypertension induced by the
release of secondary mediators. This vascular
obstruction results in a low cardiac output state
with elevated CVP and pulmonary hypertension,
but with a normal pulmonary artery occlusion
pressure (PAOP).

6 Shock: An Overview – Cheatham, Block, Smith, & Promes
Through similar mechanisms, venous air
embolism can completely obstruct pulmonary
arterial blood flow with ensuing cardiac arrest.
Central hemodynamics are similar to those of
thromboembolic disease. Although numerous
causes exist, of greatest concern are placement
of central venous access catheters and surgical
procedures in which the operative site is greater
than 5 cm above the right atrium (8,9). Venous
air embolism is diagnosed clinically by
auscultation of a characteristic "mill wheel" heart
murmur. Immediate placement of the patient in a
slightly head down, left lateral decubitus position
is advocated as are attempts to aspirate air from
the right ventricle through a central venous
catheter.
Finally, venous obstruction leading to shock
may be seen with tension pneumothorax. In this
condition, elevated intrapleural pressure from an
injury to the lung or airways collapses the
intrathoracic great veins, resulting in inadequate
venous filling and shock. Tension pneumothorax
should be diagnosed by physical examination
and not chest radiography. Needle
decompression often restores venous filling
sufficiently to reverse the shock state until a
thoracostomy tube can be placed. In many
patients, the length of some venous cannulas
may be insufficient to reach the pleural space
(10). If suspicion of the diagnosis is significant, a
lack of response to needle decompression should
prompt immediate tube thoracostomy.
Cardiogenic Shock In cardiogenic shock, the underlying defect is
primary pump failure, but this is not always due to
myocardial dysfunction. The causes of pump
failure include myocardial infarction with loss of
myocardium, reduced contractility
(cardiomyopathy), ventricular outflow obstruction
(aortic valvular stenosis, aortic dissection),
ventricular filling anomalies (atrial myxoma, mitral
stenosis), acute valvular failure (aortic or mitral
regurgitation), cardiac dysrhythmias and
ventriculoseptal defects. Most often, cardiogenic
shock is a direct or indirect consequence of acute
myocardial infarction.
Cardiogenic shock due to left ventricular
infarction suggests that more than 40% of the left
ventricle is involved (11,12). Unless a lesion
amenable to surgical correction is discovered
(e.g., valvular dysfunction), associated mortality
exceeds 75%. On physical examination, signs of
peripheral vasoconstriction are evident and
oliguria is common. The hemodynamic profile
typical in this condition includes decreased
cardiac output with elevated PAOP and systemic
hypotension. When diastolic dysfunction exists,
actual preload (end diastolic volume) may be
decreased, although physical examination
reveals findings of "volume overload" including
pulmonary and peripheral edema, and
hepatomegaly. This conundrum is explained by
the fact that hydrostatic pressure does not
reliably reflect intravascular volume status.
Nevertheless, the pulmonary artery catheter may
provide additional diagnostic information. A
marked increase in oxygen saturation of blood
from the right atrium versus the pulmonary artery
in the face of cardiogenic shock and infarction
strongly supports a diagnosis of ventricular septal
rupture. Large V-waves seen while the catheter
balloon is in occlusion suggests mitral
regurgitation from papillary muscle rupture, which
Shock: An Overview – Cheatham, Block, Smith, & Promes 7
may occur following inferoposterior myocardial
infarction. Equalization of diastolic pressures is
diagnostic for cardiac tamponade.
Right ventricular dysfunction as a
consequence of inferior wall myocardial infarction
carries a better prognosis than left-sided failure.
Diagnosis may be suggested by a right
ventricular diastolic pressure elevation in the face
of a decreased pulmonary artery pressure (13).
Hypotension caused by right-sided heart failure
must be distinguished from left-sided failure
because of significant differences in their
management. Shock from right-sided failure is
corrected with volume resuscitation to maintain
right ventricular preload. If inotropes are
indicated, agents that do not increase pulmonary
vascular resistance should be chosen.
Cardiac dysrhythmias are another source of
cardiogenic shock. In addition to malignant
dysrhythmias such as ventricular fibrillation that
have associated shock, other dysrhythmias may
result in hypotension in patients with coexisting
myocardial disease. Atrial dysrhythmias or the
"pacemaker syndrome" (where the set rate of a
ventricular pacemaker is set above the atrial rate)
may make a previously normotensive patient with
an abnormal ventricle become hypoperfused.
Distributive Shock
The classic hemodynamic profile of septic
shock (high cardiac output and systemic
hypotension) has prompted some clinicians to
institute antimicrobial therapy and to search for
an infectious source in any patient who exhibits
these cardiac parameters. Such hyperdynamic
patterns are seen in other conditions, however,
including acute injury, anaphylaxis, spinal cord
injury, and severe liver dysfunction. The term
distributive shock was introduced to account for
these dissimilar diseases with a common clinical
hemodynamic picture.
The management of septic shock
(maldistribution of blood flow in the face of
documented or suspected infection) remains a
major challenge to the intensivist. The
hemodynamic profile in septic shock is protean,
and relates not only to preexisting cardiovascular
pathology, but also to the point at which
hemodynamic measurements are made. Early in
its course, septic shock is manifest by decreased
systemic vascular resistance, normal to low
cardiac filling pressures, and increased cardiac
output (14). Despite elevated cardiac output,
abnormalities exist in tissue oxygen extraction.
The exact cause of this maldistribution is unclear,
but may relate to excessive blood flow to areas of
normal metabolic demand and hypoperfusion of
areas of increased demand (15). Despite
elevated cardiac output, myocardial depression in
sepsis may be demonstrated through decreased
ejection fraction, right ventricular dysfunction, and
left ventricular dilation. Cardiac function
deteriorates further in later stages of septic
shock, and the patient’s hemodynamic status
mimics that of cardiogenic shock (16,17).
The maldistribution of substrate delivery is
complicated by conflicting clinical data. In most
forms of shock, the initial illness leads to a low
cardiac output state, and reduced SaO2. In septic
shock, both cardiac output and SaO2 are
elevated. Despite these data, evidence exists to
support tissue oxygen deficit despite adequate
8 Shock: An Overview – Cheatham, Block, Smith, & Promes
systemic oxygen delivery (18-20). Conflicting
data suggest that tissue oxygenation in sepsis is
not impaired (21). Additional data has come forth
to explain the lactic acidosis and end-organ
dysfunction seen in septic shock, suggesting that
the substrate utilization derangement occurs at
the cellular level, perhaps through disruption of
normal mitochondrial metabolic pathways (22-
24).
A complex immunologic sequence initiates
septic shock. A variety of potentially inciting toxic
stimuli are currently under investigation,
especially the role of endotoxin, a
lipopolysaccharide cell wall constituent of gram-
negative bacteria. TNF and IL-1 are released in
response to endotoxin, stimulating release of
other mediators of acute inflammation. The
combined effects of these mediators result in the
complex hemodynamic pattern characteristic of
septic shock.
In addition, a well-documented myocardial
depression has been demonstrated, despite a
cardiac output that would be considered elevated.
More specific investigation has also noted that
these patients have reduced left ventricular
ejection fractions with increased end diastolic and
end systolic volumes. Whether the reduced
cardiac performance is related to direct
myocardial depression or cardiac ischemia
remains a matter of scientific debate (25-27).
Anaphylaxis represents another form of
distributive shock that is seen following diagnostic
studies, medication administration, and insect
envenomation (28). Anaphylactic reactions
severe enough to result in shock usually occur
shortly after exposure to the offending agent.
Physical findings associated with anaphylaxis
include a dermatologic reaction (erythema,
urticaria, etc.) and respiratory obstructive
processes. Occasionally, reaction is severe
enough to produce shock through myocardial
depression. Hemodynamic parameters to
support the diagnosis include low CVP and
PAOP, an elevated hematocrit, and reduced
cardiac output.
Neurogenic shock, another type of
distributive shock, should be distinguished from
spinal shock. Neurogenic shock results in
autonomic dysfunction as a result of spinal cord
injury above the upper thoracic level, with
consequent hypotension, bradycardia and warm,
dry skin. Spinal shock is a neurologic condition:
a transient reflex depression below the level of
spinal cord injury due to the abrupt withdrawal of
descending excitatory influences from higher
centers as well as persistent inhibition from below
the injury. In the trauma patient, other sources of
hemodynamic instability, such as occult
hemorrhage, should be excluded before
attributing shock to a neurogenic source (29,30).
The abnormal blood flow distribution in
neurogenic shock stems from the fall in
peripheral vascular tone. Although euvolemic,
the patient has a relative expansion of the
intravascular space through vasodilatation.
Because initial volume status is normal, fluid
resuscitation should proceed with caution. If
hypotension does not respond to sequential
volume infusions, it may be treated with alpha-
adrenergic agents, and concomitant bradycardia
may be corrected with atropine to block the
Shock: An Overview – Cheatham, Block, Smith, & Promes 9
predominant parasympathetic influences. In
most cases of neurogenic shock, hypotension
resolves within 24 to 48 hours.
Endocrine Shock
In the outpatient setting, patients with
hypothyroidism demonstrable by laboratory
testing may have mild systemic symptoms. In the
intensive care environment, however, these
patients may manifest respiratory and
cardiovascular symptoms that can impact on both
their management and possibly survival. Cardiac
effects of hypothyroidism include diminished
cardiac output as a result of lower inotropic
activity in association with bradycardia. Although
hypotension may be seen, more commonly
hypertension as a consequence of increased
vascular resistance is encountered (31). The
hypothyroid patient has a decreased ventilatory
drive in response to hypoxemia and hypercapnia
that may result in difficult ventilatory weaning
(32). Drug metabolism is generally slowed in
hypothyroidism and accelerated in
hyperthyroidism (33).
Diagnosis of hypothyroidism may be made by
demonstration of an elevated serum thyroid
stimulating hormone level. In borderline cases,
the free thyroxine index may also be measured.
A depressed free thyroxine index may be seen
despite normal thyroid stimulating hormone in
patients with hypothalamic disease. In such
patients, consideration of panhypopituitarism
should be given. This is especially important
since rapid thyroid replacement in patients with
adrenal insufficiency may lead to Addisonian
crisis. If the possibility of a panhypopituitary state
exists, concomitant empiric treatment with
glucocorticoids should be instituted along with
thyroid hormone replacement. Secondary
hypothyroidism may be further supported by
evidence of hypogonadism.
Myxedema coma is an uncommon
presentation of the hypothyroid state that may
include hypotension. The cardiovascular picture
of this disease is of a flabby, enlarged heart with
global hypokinesia. Pericardial effusion may be
present, and may be of such degree as to cause
tamponade. Sinus bradycardia may also be seen
(34). Appropriate therapy for patients with
myxedema coma who present in shock includes
isotonic volume resuscitation, rewarming, and
thyroid hormone replacement.
Paradoxically, patients with thyrotoxicosis
may also present with shock. The
cardiomyopathy of hyperthyroidism is often a
reversible condition. High output heart failure
may be of particular concern, however, in the
older patient who may have preexisting cardiac or
coronary artery disease, increased heart rate,
ejection fraction and cardiac output can lead to
myocardial ischemia. Tachycardia may not
always be present, as other indications for beta-
blockade may have led to masking of this clinical
sign. Tachyarrhythmias, including atrial
fibrillation and supraventricular tachycardia, may
be seen and should be treated appropriately. In
patients with hyperthyroidism whose clinical
picture includes congestive heart failure, beta-
blockade may worsen their condition.
The development of relative adrenal
insufficiency in response to certain
pathophysiologic states has received increased
10 Shock: An Overview – Cheatham, Block, Smith, & Promes
attention recently (35,36). Unrecognized adrenal
insufficiency in the critically ill patient whose
adrenal response fails to meet their physiologic
needs may contribute to the need for prolonged
mechanical ventilation and ICU length of stay. A
lower threshold for testing of adrenal insufficiency
and administration of titrated levels of
corticosteroid therapy to achieve a "euthyroid
state" has been advocated (35,36).
PHYSIOLOGIC MONITORING Perhaps more than for any other disease
process in the intensive care unit, physiologic
monitoring is essential to the accurate diagnosis
and appropriate management of the patient
presenting with shock. Such monitoring typically
begins with use of common “vital signs”, but
rapidly progresses to application of advanced and
frequently invasive monitoring devices such as:
indwelling arterial, central venous, intracranial,
and intravesicular pressure catheters; pulse
oximeters; end-tidal carbon dioxide monitors;
respiratory function monitors; and pulmonary
artery catheters.
VITAL SIGNS
The diagnosis of shock was originally based
on abnormalities in a patient’s physiologic
variables or “vital signs” (i.e., heart rate, blood
pressure, temperature, urinary output, and, more
recently, pulse oximetry). Until the late 1960s,
the presence of tachycardia and hypotension was
considered synonymous with shock. As
clinicians gained more experience in treating
critically ill patients it became apparent that
normalization of heart rate, blood pressure,
temperature, and urinary output was not
necessarily sufficient to reverse a patient’s shock
state. Critically ill patients continued to have a
high incidence of multiple organ failure and
mortality despite seemingly adequate
resuscitation based upon restoration of vital signs
to “normal” ranges.
Vital signs alone are not sufficient to
diagnose the presence of shock. Shock is
defined by the adequacy of end-organ function
rather than derangements in global vital signs.
Nevertheless, vital signs remain the foundation
for screening for shock, and completely normal
vital signs in the absence of confounding factors
eliminate shock from the differential diagnosis.
Heart Rate
Alterations in heart rate are common in
patients in shock. Tachycardia is most commonly
encountered, and is predominantly a direct effect
of intravascular volume loss, as in hypovolemic or
distributive shock, where heart rate increases to
maintain adequate cardiac output and oxygen
delivery to injured tissues. These increases may
become pathologic, however, when heart rate
exceeds 120-130 beats per minute (37). Above
this rate, diastolic filling time decreases to the
point that insufficient ventricular filling decreases
stroke volume. The presence of tachycardia can
be used to predict the presence of intravascular
volume depletion and its resolution to suggest the
adequacy of volume resuscitation (38). A
decrease in heart rate in response to a rapidly
administered volume challenge can be a simple
and useful test for diagnosing hypovolemia.
Bradycardia is usually representative of
severe physiologic derangement and impending
cardiovascular collapse. Its presence in a
Shock: An Overview – Cheatham, Block, Smith, & Promes 11
critically ill patient demands immediate attention.
Bradycardia may also be encountered in patients
with neurogenic shock as a result of injury to the
sympathetic cardioacceleratory fibers arising from
the upper thoracic region of the spinal cord.
Elderly patients, those receiving beta-blocker
therapy, high spinal cord injuries, and patients
with transvenous pacemakers may not be able to
increase heart rate in response to shock.
Patients with an inappropriately low heart rate
and inadequate cardiac output will benefit from
increasing heart rate by withholding beta-blocker
therapy, use of chronotropic medications, or
reprogramming of their transvenous pacemaker
to a higher rate.
Blood Pressure
Hypertension is an uncommon finding in
shock. Patients are typically hypotensive due to
hypovolemia, decreased cardiac contractility, or
systemic vasodilatation. Hypotension results in
inadequate tissue perfusion and promotes the
development of anaerobic metabolism and
ongoing shock. Normotension should be
restored as soon as possible to improve tissue
perfusion.
Blood pressure may be measured
noninvasively by sphygmomanometry or
invasively by indwelling arterial catheter. Both
techniques are subject to mechanical and
physiologic measurement errors, or “dynamic
response artifacts”, that can be misleading and
result in inappropriate therapy. (39) Due to these
intrinsic monitoring errors, systolic blood pressure
(SBP) and diastolic blood pressure (DBP)
measurements may vary widely from one
measurement technique to another. The mean
arterial pressure (MAP), however, will remain
fairly consistent regardless of the measurement
method and any artifact present. Because of its
increased reliability, MAP should be used to
titrate cardioactive infusions and other
resuscitative therapies. MAP is calculated as:
MAP = (SBP + 2(DBP))/3
Temperature
Patient temperature, although not indicative
of either the presence or absence of shock, may
help define the etiology and can have significant
prognostic value. (40-42) Temperature is most
accurately measured by an intravascular
thermistor (i.e., from a pulmonary artery
catheter), although tympanic, esophageal, oral,
and rectal measurements may be acceptable in
appropriate patients. Axillary temperatures
should not be utilized due to their poor accuracy
(43).
The presence of hypothermia (core
temperature < 96.8° F or 36.0° C) is of significant
importance in the definition and treatment of
shock as it suggests severe physiologic
derangement and has a significant impact on
patient survival (40-42,44,45). Hypothermia
places the patient at risk for cardiac
dysrhythmias, acute renal failure, and refractory
coagulopathy (44,45). When hypothermia is not
rapidly corrected, mortality is extremely high
(41,42). While hypothermia reduces metabolic
activity of the body, rewarming significantly
increases global metabolic demands and oxygen
consumption. Such demands may exceed the
patient’s oxygen delivery capacity resulting in an
oxygen transport imbalance. Care must be taken
12 Shock: An Overview – Cheatham, Block, Smith, & Promes
to ensure adequate oxygen delivery and tissue
perfusion during the rewarming process.
Because of its significant morbidity and mortality,
hypothermia should be avoided or rapidly
corrected in critically ill patients.
Hyperthermia (core temperature > 101.0° F
or 38.3° C) represents the body's response to
injury, inflammation, and infection. It may
suggest the presence of an infectious process as
the etiology for shock (i.e., septic shock).
Hyperthermia should result in a careful clinical
assessment and physical examination of the
patient rather than automatic orders for costly
radiologic and laboratory tests commonly
associated with a low diagnostic yield. Empiric
antibiotic therapy may be warranted based upon
the patient’s condition. It must be kept in mind,
however, that there are many causes of fever in
the critically ill patient and that an elevated
temperature alone does not define the presence
of infection.
Urine Output
Renal function is an important predictor of the
presence of shock. Inadequate renal blood flow
results in decreased urine output. Of the four
traditional vital signs, oliguria is one of the earliest
signs of inadequate perfusion at the tissue level.
Decreases in urine output as a result of
hypovolemia are seen before changes in heart
rate or blood pressure (TABLE I). Reponses of
urine output to therapeutic interventions can
guide shock resuscitation as long as confounding
factors are not present (i.e., diabetes insipidus,
diabetic ketoacidosis, diuretic therapy, renal
tubular dysfunction).
Pulse Oximetry
Technological advances in the 1970s and
1980s led to the introduction of what some have
coined the “fifth vital sign” (46). Pulse oximetry is
now widely utilized as a noninvasive and cost-
effective method of continuously monitoring
arterial oxygen saturation in both the intensive
care unit and operating room settings. Based on
the principles of spectrophotometry and
plethysmography, this technique uses the
differential light absorption characteristics of oxy-
and deoxyhemoglobin to calculate the
percentage of hemoglobin in the blood which is
saturated with oxygen. This addition to the
traditional four vital signs serves two purposes.
First, it provides an early warning of hypoxemia
allowing corrective interventions to be made.
Second, it can be used as an endpoint in the
resuscitation of patients in shock and in the
assessment of oxygen transport balance. For
these reasons, continuous pulse oximetry should
be considered the standard of care in any
intensive care setting (47,48).
INVASIVE HEMODYNAMIC MONITORING
In 1970, Swan and Ganz introduced the flow-
directed pulmonary artery catheter allowing
clinicians to measure pulmonary artery pressures
at the bedside (49). In 1972, addition of a
thermistor near the tip of the catheter provided
the ability to calculate cardiac output using the
thermodilution technique. This revolutionary
advance in physiologic monitoring became the
standard of care by the late 1970s in patients with
multisystem organ dysfunction or refractory
shock. In the 1980s, continuous mixed venous
oximetry capability was added as the importance

Shock: An Overview – Cheatham, Block, Smith, & Promes 13
of oxygen delivery, oxygen consumption, and
oxygen transport balance in the diagnosis and
management of shock states became clear. In
the early 1990s, catheters capable of calculating
right ventricular volumes became available
further improving preload assessment in the
critically ill. Recently, “fourth-generation”
pulmonary artery catheters designed to
continuously assess hemodynamic function and
oxygen transport have become commonplace in
the intensive care unit setting. Although a variety
of other hemodynamic monitoring techniques
have been developed over the years (including
bioimpedance, pressure-wave contour analysis,
esophageal Doppler, and transesophageal
echocardiography), pulmonary artery
catheterization remains the “gold standard” for
bedside hemodynamic monitoring of the patient
in shock.
The circulatory system consists of two circuits
connected in series: the systemic and pulmonary
vasculature. Two pressures are present in each
circuit, generated by either the left or right
ventricle; an "outgoing pressure" (MAP or MPAP)
and an "incoming pressure" or estimate of
"preload" (PAOP or CVP) (FIGURE 1). These
pressures can be used to calculate the resistance
or "afterload" of each circuit (SVRI or PVRI) as
well as the work (LVSWI or RVSWI) done for
each circuit. The pulmonary artery catheter thus
provides three different types of variables:
pressure, volume, and flow. Combining these
variables in various calculations provides a
wealth of physiologic data that can be utilized to
diagnose a patient’s shock state and guide
appropriate resuscitative therapy. These
calculated parameters play an integral role in the
assessment and treatment of all critically ill
patients. (TABLE II).
SYSTEMIC
PULMONARY
LEFTVENTRICLE
RIGHTVENTRICLE
PAOPMPAP
PVRI
MAPCVP
SVRI
LVSWIRVSWI
FIGURE 1: Measured and calculated hemodynamic variables in the assessment of vascular resistance and cardiac work. MAP - mean arterial pressure; MPAP - mean pulmonary artery pressure; PAOP - pulmonary artery occlusion pressure; CVP - central venous pressure; SVRI - systemic vascular resistance index; PVRI - pulmonary vascular resistance index; LVSWI - left ventricular stroke work index; RVSWI - right ventricular stroke work index

14 Shock: An Overview – Cheatham, Block, Smith, & Promes
Pressure and Pressure-Derived Variables
Pressure variables form the foundation for
physiologic monitoring in the assessment of
shock. Typically, however, the absolute value of
any single pressure variable is not as important
as the trend, calculated variables, and perfusion
pressures that can be identified using this
pressure.
Mean Arterial and Mean Pulmonary Arterial Pressure Mean arterial pressure (MAP) has been
discussed previously as the calculated average of
SBP and DBP. Mean pulmonary arterial
pressure (MPAP) is the equivalent pressure for
the pulmonary circuit and is calculated using
pulmonary arterial systolic (PAS) and diastolic
(PAD) pressure:
TABLE II: HEMODYNAMIC VARIABLES Measured Variables
Variable (abbreviation) Unit Normal Range Systolic Blood Pressure (SBP) Torr 90-140 Diastolic Blood Pressure (DBP) Torr 60-90 Systolic Pulmonary Artery Pressure (PAS) Torr 15-30 Diastolic Pulmonary Artery Pressure (PAD) Torr 4-12 Pulmonary Artery Occlusion Pressure (PAOP) Torr 2-12 Central Venous Pressure (CVP) Torr 0-8 Heart Rate (HR) beats/min (varies by patient) Cardiac Output (CO) L/min (varies by patient) Right Ventricular Ejection Fraction (RVEF) (fraction) 0.40-0.60
Calculated Variables Variable (abbreviation) Unit Normal Range Mean Arterial Pressure (MAP) Torr 70-105 Mean Pulmonary Artery Pressure (MPAP) Torr 9-16 Cardiac Index (CI) L/min/m2 2.8-4.2 Stroke Volume (SV) mL/beat (varies by patient) Stroke Volume Index (SVI) mL/beat/m2 30-65 Systemic Vascular Resistance Index (SVRI) dyne⋅sec⋅cm-5 1600-2400 Pulmonary Vascular Resistance Index (PVRI) dyne⋅sec⋅cm-5 250-340 Left Ventricular Stroke Work Index (LVSWI) gm⋅m/m2 43-62 Right Ventricular Stroke Work Index (RVSWI) gm⋅m/m2 7-12 Coronary Perfusion Pressure (Coronary PP) Torr >60 Cerebral Perfusion Pressure (Cerebral PP) Torr >60 Abdominal Perfusion Pressure (Abdominal PP) Torr >50 Right Ventricular End-Diastolic Volume Index (RVEDVI) mL/m2 60-100 Body Surface Area (BSA) m2 (varies by patient)
MPAP = (PAS + 2(PAD))/3
Mean pressures should be utilized to guide
decision making and resuscitative therapy
whenever possible as they are less subject to
monitoring artifacts (39). They are also essential
components to calculate vascular resistance and
cardiac work.

Shock: An Overview – Cheatham, Block, Smith, & Promes 15
Pulmonary Artery Occlusion and Central Venous Pressures Intracardiac filling pressure measurements
such as PAOP or “wedge” and CVP are
commonly used to estimate intravascular volume
or “preload”. Preload augmentation is an
essential element in the initial resuscitation of all
forms of shock. Preload, by the Frank-Starling
Law, is defined in terms of myocardial fibril length
at end-diastole. Because this is clinically
unmeasurable, several assumptions are made to
utilize PAOP to clinically assess the preload
status of the left ventricle (FIGURE 2). First, for a
given geometric shape, left ventricular end-
diastolic volume (LVEDV) is assumed to be
proportional to myofibril length. Second, in the
absence of changing ventricular compliance end-
diastolic volume is proportional to end-diastolic
pressure. Third, in the absence of mitral valve
disease, left ventricular end-diastolic pressure
(LVEDP) is equal to mean left atrial pressure
(LAP). Fourth, properly transduced PAOP is
equal to LAP. Similar assumptions must be
made with the use of CVP in estimating preload
status of the right ventricle.
If each of the above assumptions is valid,
transmural PAOP will reflect left ventricular
preload status. Unfortunately, these assumptions
are frequently invalid in critically ill patients due to
changing ventricular compliance caused by
shock, myocardial ischemia, changing ventricular
afterload and intravascular volume, changes in
contractile state caused by inotropes,
vasopressors, and vasodilators, changes in
intrathoracic pressure caused by mechanical
ventilation, changes in intra-abdominal pressure
due to edema, blood, and space occupying
lesions, and changes in lung and chest wall
compliance and airway resistance. PAOP
measurements, therefore, cannot be assumed to
accurately reflect a critically ill patient’s
Preload ≡ LVEDV ≡ LVEDP ≡ LAP ≡ PAOP
FIGURE 2: POTENTIAL CAUSES FOR ERROR IN PAOP MEASUREMENTS LVEDV - left ventricular end-diastolic volume, LVEDP - left ventricular end-diastolic pressure, LAP - left atrial pressure, PAOP - pulmonary artery occlusion pressure
Mitral valve
disease
Changing ventricular compliance Catheter position
Elevated intrathoracic or intra-abdominal pressure

16 Shock: An Overview – Cheatham, Block, Smith, & Promes
intravascular volume (50-54). In fact, reliance
upon PAOP measurements for preload
assessment in the critically ill may lead to
inappropriate interventions in over 50% of
patients (55). The trend, rather than absolute
value, of such measurements in response to
therapeutic interventions is of greater value. The
optimal PAOP is that value which, through careful
evaluation of the patient's hemodynamic status, is
determined to maximize cardiac output, oxygen
delivery, and oxygen consumption.
CVP is frequently misused as an estimate of
left ventricular preload and overall intravascular
volume status. For similar reasons to those just
described, absolute CVP measurements do not
accurately portray left ventricular volume status
or ventricular function (50,53,54). As with PAOP,
the trend of CVP measurements in response to
therapeutic measures may be of value.
Coronary Perfusion Pressure Maintaining adequate coronary perfusion
should be a primary goal in resuscitation of any
patient in shock. Patients with preexisting
coronary artery disease who may have marginal
myocardial blood flow can develop ischemia or
infarction if coronary perfusion pressure falls
below a critical threshold. Coronary perfusion
pressure is calculated as the pressure change
across the coronary artery during maximal blood
flow (diastole). DBP, and not SBP, is the most
important determinant in maintaining adequate
myocardial perfusion. PAOP estimates
myocardial wall tension and resistance to
perfusion by approximating the end-diastolic
pressure in the left ventricle (LVEDP).
Coronary perfusion pressure = DBP - PAOP
Coronary perfusion pressure should be
maintained above 50 mm Hg. Below this critical
value, the myocardium may not receive adequate
blood flow and the risk for myocardial ischemia
and infarction increases (37). Thus, every
attempt should be made to maintain an adequate
DBP during resuscitation of shock. Vasodilators
with a primary effect on the venous vasculature
must always be used with caution to avoid
decreasing DBP to the point that myocardial
perfusion is compromised.
Cerebral Perfusion Pressure
Monitoring of cerebral perfusion pressure is
important in the head-injured patient with
increased ICP. Because the brain is enclosed
within the skull with little room for expansion,
cerebral edema and pathologic masses (such as
hematomas and tumors) can increase ICP,
causing significant and detrimental effects on
cerebral blood flow and oxygenation. Monitoring
of ICP is an important component of the
hemodynamic monitoring of patients with brain
injury and shock. Cerebral perfusion pressure is
calculated as the pressure change across the
brain:
Cerebral perfusion pressure = MAP - ICP (or CVP, whichever is higher)
The goal is to maintain a cerebral perfusion
pressure greater than 60 to 70 mm Hg (56). This
may be accomplished by either increasing MAP
(using vasopressors such as the alpha-agonists
neosynephrine or norepineprhine) or decreasing
intracerebral volume (through the use of mannitol
and hypertonic fluids) thereby decreasing ICP.

Shock: An Overview – Cheatham, Block, Smith, & Promes 17
Blood Flow and Flow-Derived Variables
The pulmonary artery catheter is also used to
calculate blood flow-related variables such as
cardiac output and stroke volume to diagnose
and treat shock more accurately. Flow-related
variables are used with pressure variables to
calculate vascular resistance and estimate the
work performed by the left and right ventricles.
Interpatient variability makes it difficult to
assign a “normal” range to flow-derived variables.
What might be an adequate cardiac output for a
50-kg woman is inadequate for a 150-kg man.
To normalize these measurements and allow
comparison from patient to patient, flow-derived
variables are indexed to body surface area (BSA)
obtained from a nomogram. Indexed variables,
such as cardiac index and stroke volume index,
are more meaningful since normal ranges aid in
interpretation. All flow-derived hemodynamics
should be indexed to facilitate comparison with
accepted normal ranges.
Cardiac Index and Stroke Volume Index
Cardiac index (CI) is the total blood flow from
the heart (in liters per minute) divided by BSA.
Stroke volume index (SVI) is the volume of blood
ejected from the heart per beat divided by BSA:
CI = Cardiac output / BSA SVI = CI / heart rate
Most shock states have a decreased CI as a
result of intravascular volume depletion or
increased vascular resistance. In order to
maintain cardiac output, tachycardia is the usual
response to a low stroke volume. Therapy is to
restore intravascular volume and increase SVI,
thus improving CI. An increased CI may be seen
in early septic shock, but may also be seen with
other non-shock hyperdynamic states such as
cirrhosis, pregnancy, and in high performance
athletes.
Systemic vascular resistance index
According to Ohm’s law, the resistance of an
electrical circuit is equal to the voltage difference
across the circuit divided by the current. A
simplified view of the circulatory system is likened
to an electrical circuit in which the resistance
across the systemic or pulmonary vascular beds
can be calculated using Ohm’s law (FIGURE 1):
Resistance = Voltage difference / current
Vascular resistance = Pressure change / total blood flow
Systemic Vascular Resistance Index (SVRI) =
Change in pressure across the systemic circuit
(mm Hg) / total blood flow L/min/m2)
SVRI (in dynes•sec•cm –5) =
(MAP-CVP)(79.9)/CI
Pulmonary Vascular Resistance Index (PVRI) =
Change in pressure across the pulmonary circuit
(mm Hg)/ total blood flow (L/min/m2)
PVRI (in dynes•sec•cm –5) = (MPAP-PAOP)(79.9)/CI
The constant, 79.9, is used to convert mm
Hg•L/min to the more physiologic units of
dyne•seconds•cm-5.

18 Shock: An Overview – Cheatham, Block, Smith, & Promes
Increased SVRI is commonly seen in
obstructive, hypovolemic, late septic, and
cardiogenic shock. Systemic resistance may also
rise in non-shock states such as
pheochromocytoma (secondary to increased
endogenous catecholamine output). Decreased
SVRI is common in distributive shock states
(neurogenic or early septic shock). Vasodilators
such as sodium nitroprusside, nitroglycerin, and
other antihypertensives reduce SVRI. Increased
PVRI (pulmonary hypertension) is encountered in
patients with acute respiratory distress syndrome
(ARDS), increased intra-abdominal pressure
(intra-abdominal hypertension), mitral stenosis, or
aortic stenosis.
Perfusion pressure and vascular resistance
determine total blood flow to an organ, but
absolute values of these determining factors do
not define the shock state. For example, a high
vascular resistance is commonly compensatory
for reduced systemic perfusion pressure. The
same numeric value of high resistance may
contribute to organ dysfunction when it is so high
that perfusion pressure cannot overcome it.
When organ blood flow is maldistributed, as in
septic shock, multiple organ dysfunction may
occur despite normal systemic perfusion
pressure.
Ventricular Stroke Work Indices
The ventricular stroke work indices describe
how much work the ventricles perform and can
identify patients with poor cardiac function. They
are useful to construct ventricular function curves
to assess a patient’s response to therapy. As
with the vascular resistances, the work performed
by the heart can also be calculated using the
laws of physics. Work is calculated as the force
generated multiplied by the distance over which
the work is performed. Clinically, the force
generated (per area) by each ventricle is the
change in pressure it creates. The distance (per
area) is the volume of blood ejected with each
beat (stroke volume).
Ventricular Stroke Work Index =
Change in pressure x change in volume
LVSWI = (MAP-PAOP)(SVI)(0.0136) (g•m/m2)
RVSWI = (MPAP-CVP)(SVI)(0.0136) (g•m/m2)
The constant (0.0136) converts mm Hg-
liters/beat-m2 to g•m/m2.
Causes of increased left and right ventricular
stroke work index include ventricular hypertrophy
and physiologic conditioning (as in athletes).
More commonly encountered is a decreased
ventricular stroke work index as occurs in various
shock states, heart failure, aortic or mitral
stenosis, myocardial
depression/ischemia/infarction, pulmonary
hypertension, and advanced age. When
evaluating decreased ventricular stroke work it is
important to keep in mind that the decreased
function may be due to decreased intravascular
volume (decreased SVI), changes in vascular
resistance (increased MAP or MPAP) or
decreased contractility. If preload and afterload
remain constant, decreases in stroke work
indicate decreases in ventricular contractility (57).

Shock: An Overview – Cheatham, Block, Smith, & Promes 19
Volumetric Variables
In the 1980s, improvements in technology led
to the introduction of a new generation of
pulmonary artery catheters known as “volumetric”
catheters (38,55,58-73). A combination of
physical changes to the catheter and a
specialized cardiac output computer allow
measurement of the right ventricular ejection
fraction (RVEF), providing an online
measurement of right ventricular contractility and
afterload. The RVEF can be used to calculate
the right ventricular end-diastolic volume index
(RVEDVI) providing a volumetric, as opposed to
pressure-based, estimate of intravascular volume
status.
RVEDVI = SVI / RVEF
RVEDVI is an accurate indicator of right
ventricular preload and "preload recruitable"
increases in cardiac index in a wide range of
patient populations including general surgery,
major trauma, respiratory failure, pulmonary
hypertension, and sepsis (38,55,64-73). Each of
these studies has demonstrated that volumetric
assessment of cardiac preload using RVEDVI is
significantly more accurate than reliance upon
pressure-based variables such as PAOP or CVP.
Further, both Miller et al. and Cheatham et al.
have demonstrated a significant decrease in the
incidence of both multiple organ system failure
and mortality in surgical patients where RVEDVI
was used as the end-point of resuscitation
(70,71). Volumetric pulmonary artery catheters
are particularly useful in patients receiving
mechanical ventilation with positive end-
expiratory pressure (PEEP) and those with
increased intraabdominal pressure where
increases in intrathoracic pressure may
artifactually increase PAOP and CVP
measurements (71-73).
With recognition of the limitations of
pressure-based estimates of cardiac preload and
concern over the safety of right heart
catheterization, several additional methods of
volumetric preload assessment have been
developed. Pulse contour analysis measures
cardiac output by integration of the area beneath
the arterial pressure waveform. It requires only
an indwelling arterial pressure catheter and
central venous catheter, thus avoiding the need
for pulmonary artery catheterization. This
monitoring technique allows calculation of global
end-diastolic volume (GEDV), an estimate of right
and left end-diastolic volumes, as well as
intrathoracic blood volume (ITBV). This
technology has been demonstrated to correlate
well with hemodynamic measurements obtained
via pulmonary artery catheter (74). The
disadvantage of this technique is that a manual
thermodilution bolus injection is required for each
volume measurement, a requirement made
obsolete by the new volumetric continuous
cardiac output pulmonary artery catheters.
Esophageal Doppler ultrasonography and
transesophageal echocardiography (TEE) have
also been advocated for hemodynamic
assessment and monitoring of cardiac preload
status in the critically ill (75). Although
comparable accuracy with pulmonary artery
catheter-derived measurements of hemodynamic
function has been demonstrated, neither of these
techniques has been found to be more
efficacious nor do they allow continuous
20 Shock: An Overview – Cheatham, Block, Smith, & Promes
assessment of cardiopulmonary function as
discussed below.
Oxygen Transport
With the recognition of the importance of
oxygen delivery and consumption in the
treatment of the various shock states, monitoring
of a patient's oxygen transport balance has
become commonplace. The foremost question in
critical care is whether oxygen transport to the
tissues is sufficient to meet the demand for
oxygen at the cellular level. Oxygen transport
represents the balance between "supply" (oxygen
delivery) and "demand" (oxygen consumption).
When shock-induced systemic or regional
malperfusion exists, oxygen demand exceeds
oxygen supply and anaerobic metabolism, lactic
acidosis, and cellular death result. Left
unchecked, this imbalance in oxygen transport
will lead to organ dysfunction and failure. The
intensivist's role is to recognize the presence of
such an imbalance in oxygen supply at the
cellular level and initiate therapeutic interventions
aimed to increase oxygen delivery, prevent
further organ dysfunction, and improve patient
outcome from shock. Since it is difficult to control
tissue oxygen demand, most clinical efforts have
focused on augmenting oxygen delivery to the
tissue.
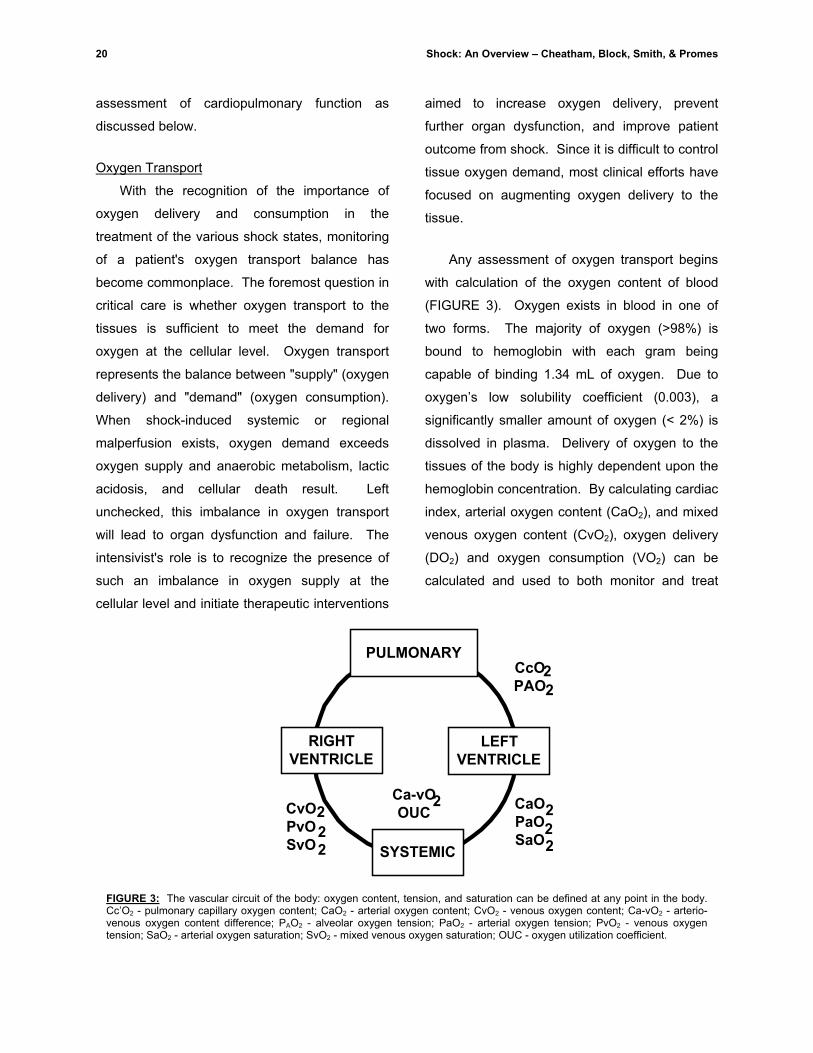
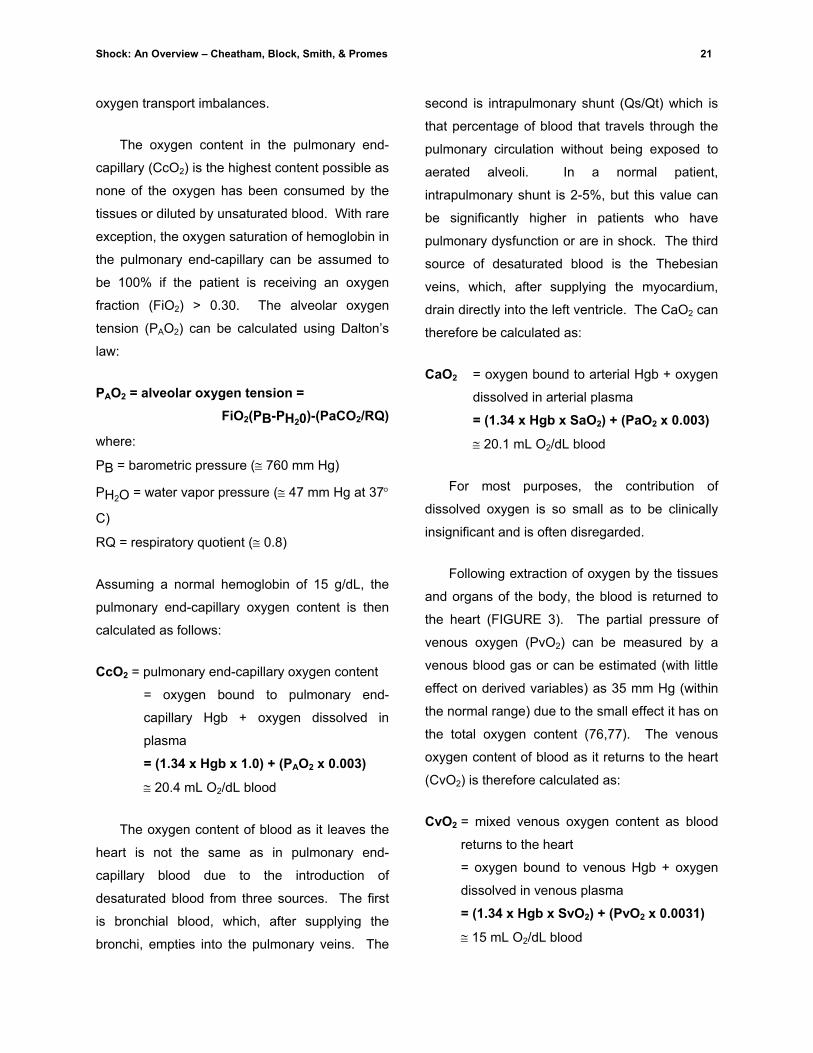
Any assessment of oxygen transport begins
with calculation of the oxygen content of blood
(FIGURE 3). Oxygen exists in blood in one of
two forms. The majority of oxygen (>98%) is
bound to hemoglobin with each gram being
capable of binding 1.34 mL of oxygen. Due to
oxygen’s low solubility coefficient (0.003), a
significantly smaller amount of oxygen (< 2%) is
dissolved in plasma. Delivery of oxygen to the
tissues of the body is highly dependent upon the
hemoglobin concentration. By calculating cardiac
index, arterial oxygen content (CaO2), and mixed
venous oxygen content (CvO2), oxygen delivery
(DO2) and oxygen consumption (VO2) can be
calculated and used to both monitor and treat
SYSTEMIC
PULMONARY
LEFTVENTRICLE
CcOPAO
RIGHTVENTRICLE
2
CaOPaOSaO
2CvOPvOSvO
2
Ca-vOOUC
2
2
2
2
2
2
FIGURE 3: The vascular circuit of the body: oxygen content, tension, and saturation can be defined at any point in the body.Cc’O2 - pulmonary capillary oxygen content; CaO2 - arterial oxygen content; CvO2 - venous oxygen content; Ca-vO2 - arterio-venous oxygen content difference; PAO2 - alveolar oxygen tension; PaO2 - arterial oxygen tension; PvO2 - venous oxygentension; SaO2 - arterial oxygen saturation; SvO2 - mixed venous oxygen saturation; OUC - oxygen utilization coefficient.
Shock: An Overview – Cheatham, Block, Smith, & Promes 21
oxygen transport imbalances.
The oxygen content in the pulmonary end-
capillary (CcO2) is the highest content possible as
none of the oxygen has been consumed by the
tissues or diluted by unsaturated blood. With rare
exception, the oxygen saturation of hemoglobin in
the pulmonary end-capillary can be assumed to
be 100% if the patient is receiving an oxygen
fraction (FiO2) > 0.30. The alveolar oxygen
tension (PAO2) can be calculated using Dalton’s
law:
PAO2 = alveolar oxygen tension = FiO2(PB-PH20)-(PaCO2/RQ)
where:
PB = barometric pressure (≅ 760 mm Hg)
PH2O = water vapor pressure (≅ 47 mm Hg at 37°
C)
RQ = respiratory quotient (≅ 0.8)
Assuming a normal hemoglobin of 15 g/dL, the
pulmonary end-capillary oxygen content is then
calculated as follows:
CcO2 = pulmonary end-capillary oxygen content
= oxygen bound to pulmonary end-
capillary Hgb + oxygen dissolved in
plasma
= (1.34 x Hgb x 1.0) + (PAO2 x 0.003)
≅ 20.4 mL O2/dL blood
The oxygen content of blood as it leaves the
heart is not the same as in pulmonary end-
capillary blood due to the introduction of
desaturated blood from three sources. The first
is bronchial blood, which, after supplying the
bronchi, empties into the pulmonary veins. The
second is intrapulmonary shunt (Qs/Qt) which is
that percentage of blood that travels through the
pulmonary circulation without being exposed to
aerated alveoli. In a normal patient,
intrapulmonary shunt is 2-5%, but this value can
be significantly higher in patients who have
pulmonary dysfunction or are in shock. The third
source of desaturated blood is the Thebesian
veins, which, after supplying the myocardium,
drain directly into the left ventricle. The CaO2 can
therefore be calculated as:
CaO2 = oxygen bound to arterial Hgb + oxygen
dissolved in arterial plasma
= (1.34 x Hgb x SaO2) + (PaO2 x 0.003)
≅ 20.1 mL O2/dL blood
For most purposes, the contribution of
dissolved oxygen is so small as to be clinically
insignificant and is often disregarded.
Following extraction of oxygen by the tissues
and organs of the body, the blood is returned to
the heart (FIGURE 3). The partial pressure of
venous oxygen (PvO2) can be measured by a
venous blood gas or can be estimated (with little
effect on derived variables) as 35 mm Hg (within
the normal range) due to the small effect it has on
the total oxygen content (76,77). The venous
oxygen content of blood as it returns to the heart
(CvO2) is therefore calculated as:
CvO2 = mixed venous oxygen content as blood
returns to the heart
= oxygen bound to venous Hgb + oxygen
dissolved in venous plasma
= (1.34 x Hgb x SvO2) + (PvO2 x 0.0031)
≅ 15 mL O2/dL blood
22 Shock: An Overview – Cheatham, Block, Smith, & Promes
The arterial-venous oxygen content
difference (Ca-vO2) represents the amount of
oxygen extracted by the tissues and organs of
the body. It is frequently elevated in shock due to
the increased oxygen demands of injured tissue.
The Ca-vO2 is calculated as:
Ca-vO2 = arterial-venous oxygen content
difference
= CaO2 - CvO2 ≅ 5 mL O2/dL blood
Ca-vO2 is an important indicator of the
relative balance between cardiac output and
oxygen consumption (VO2). A Ca-vO2 in excess
of 5.5 mL O2/dL suggests that cardiac output is
inadequate to meet cellular oxygen demands and
that anaerobic metabolism and lactic acidosis
may result. Maneuvers to improve cardiac output
and oxygen delivery should be performed with
the goal of meeting cellular oxygen demand and
reducing Ca-vO2 to a normal range (76).
The volume of oxygen delivered from the left
ventricle (DO2) and the amount of oxygen
consumed by the tissues (VO2) provide the
clinician with vital information by which to assess
the patient’s overall oxygen transport balance.
DO2 is determined by two factors: the volume of
oxygen in blood (CaO2) and the blood flow
delivered (cardiac output). Values indexed to
body surface area allow comparison across
patients of differing body habitus, so that:
DO2 = oxygen delivery index
= volume of oxygen pumped from the left
ventricle per min per m2
= (CaO2)(CI)(10 dL/L)
≅ 600 mL O2/min/m2
VO2 is calculated similarly utilizing Ca-vO2 to
account for the oxygen consumed by the body:
VO2 = oxygen consumption index
= volume of oxygen consumed by the body
per min per m2
= volume of oxygen delivered - volume of
oxygen returned per min per m2
= (Ca-vO2)(CI)(10 dL/L)
≅ 150 mL O2/min/m2
One of the most important determinants of
tissue oxygen delivery is hemoglobin
concentration. The optimal hemoglobin
concentration to maximize tissue oxygen delivery
has traditionally been thought to be 10-13 g/dL.
Several recent studies, however, have suggested
that transfusion to such levels in critically ill
patients provides no survival benefit in the
absence of recent acute myocardial infarction,
unstable angina, or acute blood loss (78,79).
These studies have advocated maintenance of a
hemoglobin concentration of 7.0-9.0 g/dL in the
critically ill. Although a subject of continued
controversy, the optimal hemoglobin
concentration can be appropriately considered to
be the concentration that maximizes oxygen
delivery and restores a patient’s oxygen transport
balance while minimizing the potentially
detrimental infectious and immunosuppressive
effects of allogeneic blood. Since the oxygen
affinity of hemoglobin is high, even subnormal
hemoglobin concentrations may be capable of
carrying adequate volumes of oxygen to the
tissues, especially if attention is turned to factors
that will aid in the unloading of oxygen from

Shock: An Overview – Cheatham, Block, Smith, & Promes 23
hemoglobin at the cellular level. Judicious
amounts of acidemia, hypercarbia, and fever all
produce a right shift in the oxyhemoglobin
association curve which may improve tissue
unloading of oxygen.
Two additional oxygenation variables
characterize the relative balance between oxygen
delivery and oxygen consumption (“supply"
versus "demand”): the oxygen utilization
coefficient (OUC) and the mixed venous oxygen
saturation (SvO2) (discussed below). The OUC,
also known as the oxygen extraction ratio
(O2ER), is the fraction of delivered oxygen that is
consumed by the body and is calculated as
follows:
OUC = oxygen utilization coefficient
= VO2 / DO2 ≅ 0.25
If the arterial oxygen saturation (SaO2) is
maintained at a high level, the OUC can be
approximated as 1- SvO2. SvO2 and OUC
quantitate the global oxygen transport balance of
perfused tissues.
Once these variables have been derived,
various calculations can be performed which
provide important physiologic data that can be
utilized to diagnose a patient’s the severity of the
patient’s shock state and ensure that oxygen
delivery can be optimized (TABLE III).
Intermittent vs. Continuous Monitoring
In the early 1990s, continuous cardiac output
pulmonary artery catheters were introduced.
Instead of using cold injectate boluses, these
catheters have heating coils on their surface that
allow precise pulses of thermal energy to be
transferred to pulmonary artery blood. A
dedicated computer system measures the
resulting blood temperature changes and
correlates the applied thermal energy pulses to
TABLE III: OXYGENATION VARIABLES
Measured Variables Variable (abbreviation) Unit Normal Range Arterial oxygen tension (PaO2) Torr 70-100 Arterial carbon dioxide tension (PaCO2) Torr 35-50 Arterial oxygen saturation (SaO2 or SpO2) (fraction) 0.93-0.98 Mixed venous oxygen saturation (SvO2) (fraction) 0.70-0.78 Mixed venous oxygen tension (PvO2) Torr 36-42 Hemoglobin (Hgb) gm 13-17
Calculated Variables Variable (abbreviation) Unit Normal Range Oxygen delivery index (DO2) mL/min/m2 500-650 Oxygen consumption index (VO2) mL/min/m2 110-150 Arterial oxygen content (CaO2) mL O2/dL blood 16-22 Mixed venous oxygen content (CvO2) mL O2/dL blood 12-17 Arterial-venous oxygen content difference (Ca-vO2) mL O2/dL blood 3.5-5.5 Oxygen utilization coefficient (OUC) (fraction) 0.22-0.30 Respiratory quotient (RQ) (fraction) 0.7-1.0 Intrapulmonary shunt (Qsp/Qt) (fraction) 0.03-0.08

24 Shock: An Overview – Cheatham, Block, Smith, & Promes
calculate cardiac output. Continuous cardiac
output measurements have been shown to be
equal in accuracy to intermittent cold indicator
injections as well as indocyanine green dye
dilution techniques (80-83).
Continuous cardiac output technology has
several advantages over previous
cardiopulmonary assessment techniques. First,
many of the factors which may alter the accuracy
of intermittent thermodilution measurements
(such as injectate volume and temperature,
injection technique, and injectate timing with
regards to ventilation) do not play a role in the
determination of continuous cardiac output
measurements. Thus, continuous cardiac output
techniques may be more accurate than standard
thermodilution methods (84). Second,
measurement of cardiac output is possible
without the potentially significant volume load
incurred by thermodilution fluid injection methods
(80,81). Third, continuous assessment of cardiac
output allows a near real-time indication of a
patient's response to hemodynamic interventions,
which is not possible with intermittent techniques.
Such monitoring advances have identified that
the critically ill patient exhibits significant
physiologic variability not previously recognized
with existing monitoring techniques (73) (FIGURE
4). In addition to cardiac output, these catheters
are able to continuously measure volumetric
variables such as RVEF and RVEDVI. With the
addition of continuous arterial pulse oximetry and
mixed venous oximetry, these catheters provide
the intensivist with a minute-to-minute
assessment of hemodynamic function and
oxygen transport balance not previously
available. These capabilities allow earlier
identification of potentially untoward changes in
cardiopulmonary function, allowing appropriate
interventions to be made before potentially
0
1
2
3
4
5
6
7
8
0:00 3:00 6:00 9:00 12:00
Time (hours)
Car
diac
Out
put (
L/m
in)
FIGURE 4: Continuous cardiac output monitoring allows detection of hemodynamic changes missed by use ofconventional intermittent cardiac output techniques (diamonds).
Shock: An Overview – Cheatham, Block, Smith, & Promes 25
devastating events can occur.
SHOCK RESUSCITATION ADEQUACY Resuscitation of the critically ill patient who
has developed one of the shock states is an
ongoing process. It requires constant
assessment of patient response to therapy
administered. In the patient whose shock state
and oxygen transport balance fails to improve,
these interventions must be reconsidered and
adjusted as necessary to achieve the desired
result. To guide this dynamic resuscitation, a
variety of "resuscitation adequacy" endpoints
may be utilized.
Mixed Venous Oximetry
In 1980, fiberoptic technology was introduced
to the pulmonary artery catheter allowing
continuous measurement of SvO2 using the
technique of reflectance spectrophotometry.
Continuously measured SvO2 correlates well with
oxygen extraction ratios calculated by laboratory
measurements of arterial and mixed venous
oxygen saturation and tension, hemoglobin
concentration, and cardiac output (85). The four
factors affecting SvO2 are: SaO2, hemoglobin
concentration, cardiac output, and VO2.
Increases in any of the three variables affecting
oxygen delivery (SaO2, hemoglobin
concentration, and cardiac output) result in an
increase in SvO2 while uncompensated increases
in VO2 result in a decrease in SvO2. The SvO2
measured in the proximal pulmonary artery is a
flow-weighted average of the effluent blood from
all perfused vascular beds. SvO2 does not reflect
the oxygen transport adequacy of non-perfused
vascular beds nor does a normal SvO2 mean that
all tissues are adequately oxygenated. SvO2 is a
global indicator of oxygen supply - demand
balance, but does not yield information about the
adequacy of perfusion of any individual vascular
bed.
A low SvO2 (< 0.65) virtually always indicates
an unfavorable disturbance in the normal balance
between the delivery and consumption of oxygen.
Normal or high values of SvO2 are more difficult
to interpret. A normal SvO2 in a patient with
otherwise normal hemodynamics generally
indicates a stable condition with a satisfactory
oxygen supply - demand balance. A high SvO2 (>
0.78) is difficult to interpret and implies a
maldistribution of peripheral blood flow, providing
some vascular beds with oxygen delivery in
excess of consumption. This state of
vasoderegulation is often associated with high
flow states such as cirrhosis, sepsis, pregnancy,
and inflammation.
There are two common sources of error in
venous oximetry measurements. Continuous
venous oximetry relies upon the reflectance of
infrared light from passing red blood cells. If the
catheter is not properly calibrated via either an in
vitro calibration prior to catheter insertion or an in
vivo calibration via a mixed venous blood gas
analysis, the SvO2 values obtained may not
accurately reflect the true SvO2. Careful attention
should be given to catheter calibration to prevent
such errors. The second source of error is
catheter malposition. If the catheter tip is against
the wall of the pulmonary artery, the additional
light reflected back to the catheter will artificially
increase the SvO2 measurement. Proper
catheter positioning is essential to obtaining
reliable SvO2 values.
26 Shock: An Overview – Cheatham, Block, Smith, & Promes
In intensive care units where pulmonary
artery catheter derived hemodynamic and
oxygenation variables are used in the minute-to-
minute management of patients, continuous SvO2
monitoring is cost effective (85-88). Although not
a specific indicator of the cause of hemodynamic
and oxygen transport compromise, continuous
SvO2 is a sensitive “on-line” monitor of the
adequacy of oxygen transport balance and can
be used to: a) provide an "early warning signal" to
detect the onset of oxygen transport imbalance
before physiologic deterioration is clinically
apparent; b) evaluate the efficacy of therapeutic
interventions directed towards improving oxygen
transport balance such that physiologic end-
points are reached more quickly; and c) identify
potentially detrimental consequences of “patient
care” (suctioning, positioning, etc.) that might
otherwise go unnoticed.
“Supranormalization” of Oxygen Delivery and
Oxygen Consumption
In 1977, Shoemaker et al. retrospectively
reviewed the hemodynamic and oxygen transport
variables of patients felt to be at high risk for
post-operative complications (89). They
discovered that patients who survived such
operations had higher cardiac indices, oxygen
delivery, and oxygen consumption than did non-
survivors (90). They hypothesized that
increasing CI,, DO2, and VO2 would lead to
improved survival. This hypothesis was tested in
1988 in a prospective, randomized trial of high-
risk surgical patients (91). Study patients were
treated with fluid infusions, blood products, and
inotropes with the goal of increasing CI to 4.5
L/min/m2, DO2 to 600 mL/min/m2, and VO2 to 170
mL/min/m2. Control patients were treated
identically, but with the goal of simply normalizing
their CI, DO2, and VO2. Patients treated to these
“supranormal” goals had a significantly lower
mortality rate (4% vs. 33%), fewer complications,
fewer days of mechanical ventilation, lower
intensive care unit length of stay, and decreased
hospital charges (91).
These findings generated significant interest
and controversy. Edwards et al. confirmed in a
non-randomized study of septic shock patients
that supranormal levels of oxygen transport could
be achieved with an acceptable mortality rate
using a goal-directed protocol (92).
Tuschschmidt et al. performed a prospective,
randomized study of supranormal oxygen
transport in septic shock patients and confirmed
many of Shoemaker’s findings including a
decreased mortality rate and intensive care unit
length of stay (93). Yu et al. performed a
prospective, randomized trial of
supranormalization in a combined
surgical/medical patient population and further
confirmed that patients with higher cardiac
indices and oxygen transport variables had a
lower mortality rate (94). Both Yu and
Tuschschmidt recognized that some patients
cannot be “optimized”, and despite all
interventions are never able to achieve
supranormal levels of oxygen transport. These
patients have a higher mortality rate. Similarly,
some patients spontaneously achieve
supranormal values without any intervention
being applied. These patients, like those who are
optimized, have a better prognosis. This has led
some to argue that a patient’s ability to achieve
supranormal levels of oxygen transport simply
indicates a larger physiologic reserve and

Shock: An Overview – Cheatham, Block, Smith, & Promes 27
improved ability to survive their injuries rather
than a benefit from an applied intervention (95-
97). This is supported by a recent prospective,
randomized study from Shoemaker's group which
identified that the patient's ability to achieve
supranormal levels of DO2 and VO2 was
prognostic of survival whereas the resuscitation
strategy applied was not (98). Thus, although
DO2 and VO2 should not be considered to be
resuscitation endpoints per se, they are
prognostic indicators for improved survival from
critical illness.
Arterial Lactate
Shock is hypoperfusion resulting in
inadequate oxygen delivery to meet tissue
oxygen demand at the cellular level. The
resulting oxygen debt forces cells to switch to
anaerobic metabolism to make adenosine
triphosphate (ATP), albeit by the grossly
inefficient method of glycolysis. The by-products
of glycolysis are hydrogen ion, pyruvate, and
lactate. If aerobic metabolism is restored through
resuscitation and improved tissue oxygen
delivery, the excess hydrogen ion is buffered and
pyruvate and lactate are both metabolized to
yield ATP, carbon dioxide, and water. Under
continued anaerobic conditions, however,
hydrogen ion and lactate accumulate resulting in
acidosis, injury, and cellular death. Serum lactate
levels provide the clinician with an excellent
laboratory marker of resuscitation adequacy.
Elevated serum lactate concentrations occur
as a result of any combination of four processes.
First, excess production of lactate may be due to
the presence of ongoing anaerobic metabolism.
Second, decreased lactate metabolism may
result from hypoperfusion or dysfunction of the
liver and/or kidneys. Third, lactate may
accumulate in tissues during periods of
hypoperfusion and wash out into the central
circulation when perfusion to these relatively
hypoxic tissues is restored. Fourth, excessive
lactate production may occur in tissues that
depend primarily upon aerobic glycolysis for
energy production (such as the brain), giving the
false impression of perfusion inadequacy.
Severe elevations in serum lactate concentration
may occur when any of these four processes are
combined (i.e., shock resulting in hepatic
hypoperfusion).
While serum lactate levels identify the
presence of anaerobic metabolism, they are not
specific in detecting abnormal regional perfusion.
Profound hypoperfusion can exist with normal
lactate levels when there is inadequate blood flow
from ischemic tissue. Some septic patients have
increased serum lactate levels in the absence of
hypoperfusion as a result of increased aerobic
glycolysis. In this situation, the elevated lactate
continues to be significant despite resuscitation
and is an indicator of a potentially severe
pathologic process.
Elevated lactate concentrations predict an
increased mortality rate (99-102). Abramson et
al. demonstrated a low mortality rate in patients
whose lactate level normalized within 24 hours,
but mortality rates of 25 and 86 percent if lactate
had not normalized by 24 and 48 hours
respectively (100). The magnitude of the
elevation correlates with mortality and reversal of
hyperlactatemia suggests a better prognosis (99-
101). While elevated lactate concentration is

28 Shock: An Overview – Cheatham, Block, Smith, & Promes
strongly suggestive of a period of hypoperfusion,
severe hypoxemia, or reduced oxygen delivery,
correction of lactic acidosis per se will not
improve patient outcome. The treatment of
patients with elevated lactate concentrations
should be directed at restoring perfusion and
allowing spontaneous resolution of
hyperlactatemia and normalization of arterial pH.
Serial measurements of lactate during
resuscitation from circulatory shock correlate with
the effectiveness of the resuscitation. Worsening
lactic acidosis occurring during aggressive
therapy is generally associated with a poor
prognosis whereas an improvement in lactate
concentration with therapy is associated with a
better prognosis (100-102).
Normal lactate clearance is a subject of
considerable controversy. It is believed that the
half-life of lactate in patients with normal hepatic
and renal function is between two and four hours.
The half-life of lactate in the presence of shock,
ongoing anaerobic metabolism, and inadequate
tissue perfusion may be significantly longer (103).
Often following aggressive restoration of
peripheral perfusion, there will be a slight
increase in the lactate concentration due to
peripheral washout. This generally corrects in a
short period of time and the observed trend in
lactate levels in adequately resuscitated patients
should show a steady decrease. Only arterial or
central venous lactate levels should be
measured, as peripheral venous lactate levels
may be reflective of regional malperfusion and
not global resuscitation adequacy.
Base Deficit
Base deficit is the amount of base, in
millimoles/liter, required to titrate whole blood to
normal pH at normal physiologic values of
temperature, PaCO2, and PaO2. The normal
range for base deficit is +3 to -3 mmol/L. The
presence of an elevated base deficit correlates
with the presence and severity of shock
(104,105). It predicts fluid resuscitation
requirements and is a rapidly obtainable monitor
of resuscitation adequacy (104). Further, it
normalizes rapidly with restoration of aerobic
metabolism making it a useful physiologic marker
by which to guide resuscitation. Base deficit
must be interpreted with caution in the patient
who has received exogenous sodium bicarbonate
as it will no longer be useful as a predictor of
resuscitation adequacy.
Several authors have documented the
usefulness of base deficit as a predictor of
morbidity and mortality in trauma patients
(104,105). Rutherford et al. identified that young
patients (< 55 years of age) without a head injury
who demonstrate a base deficit of -15 mmol/L
have a 25% mortality rate (105). Patients with a
head injury or patients > 55 years without a head
injury have a 25% mortality at a base deficit of -8
mmol/L. Rutherford recommended that base
deficit could be used to identify patients in severe
shock who might benefit from having operative
procedures terminated early (so-called “damage
control” laparotomy) to facilitate resuscitation in
the ICU. Davis et al. has demonstrated a
significant correlation between an increasing
(more negative) base deficit and the presence of
ongoing hemorrhage (104).
Shock: An Overview – Cheatham, Block, Smith, & Promes 29
Intramucosal pH Monitoring (pHi)
Because shock is defined at the cellular level,
global measurements of oxygen delivery do not
always detect regional blood flow abnormalities.
Measurements of SvO2, base deficit, and arterial
lactate reflect global oxygen supply - demand
balance, and are not specific for malperfusion at
the cellular level. Interest in monitoring individual
tissue beds as a method of detecting inadequate
tissue perfusion has therefore become
widespread.
The splanchnic circulation appears to be
affected early in any of the shock states. Blood
flow is redistributed to vital organs such as the
brain and heart at the expense of the
gastrointestinal tract. In states of severe shock,
this survival mechanism may lead to intestinal
ischemia and infarction. Ischemic intestine, and
especially the highly sensitive mucosa, may be a
source of infection, sepsis, and multiple system
organ failure (106).
Although originally developed in the 1950s,
gastrointestinal tonometry has recently been
applied to measure malperfusion of the
splanchnic circulation affording clinicians with
information regarding a single vascular bed.
Tonometry utilizes a tissue’s high permeability to
carbon dioxide (CO2) and the rapid equilibration
of intraluminal fluid CO2 with that of tissue fluid to
predict the “intramucosal pH” or pHi of the
adjacent tissues (107,108). Intramucosal
acidosis, as determined via tonometry, appears
to predict inadequate oxygen delivery to the
intestinal mucosa and has been advocated as an
endpoint by which to guide resuscitation (109-
114).
Several early studies demonstrated that a pHi
<7.32 correlated with mortality and the
development of multiple system organ failure
(109,115,116) In recent years, emphasis has
been placed on the gastric mucosal-arterial PCO2
gradient or "PCO2 gap", although the clinical
value of this endpoint, like that of pHi, remains
unclear (117). The difficulty of the technology
and interpretation of the data have resulted in
less than widespread utilization of gastric
tonometry. As a monitoring technology, however,
gastric tonometry represents a first step toward
monitoring tissue perfusion at the cellular level.
Further studies are needed to prove the
usefulness of gastric tonometry in resuscitation of
shock.
Abdominal Perfusion Pressure
In recent years, the prevalence and impact of
elevated intra-abdominal pressures in the
critically ill has been increasingly recognized
(118). The high mortality associated with so-
called "intra-abdominal hypertension" and
"abdominal compartment syndrome" has been
well-documented (71,73,118). The significant
reduction in patient morbidity and mortality
afforded through use of abdominal
decompression and temporary abdominal closure
techniques is now widely recognized and
practiced (71,118).
Interest in assessment of regional perfusion
inadequacy in the patient with intra-abdominal
hypertension has led to the development of
"abdominal perfusion pressure" (APP) as a
resuscitation endpoint (73). Calculated as the
perfusion pressure across the abdominal viscera
(MAP minus intra-abdominal pressure), APP has
30 Shock: An Overview – Cheatham, Block, Smith, & Promes
been found to significantly correlate with survival
in patients with elevated intra-abdominal
pressures as a result of intra-abdominal
hemorrhage, visceral edema, or space-occupying
lesions such as intra-abdominal tumors or ascites
(73). Maintenance of an APP greater than 50
mmHg through use of abdominal decompression
techniques and administration of vasoactive
medications has been demonstrated to improve
mortality in surgical and trauma patients.
Although further investigation is necessary to
completely validate this parameter, APP appears
to be a useful endpoint in guiding the
resuscitation of patients with elevated intra-
abdominal pressures.
TREATMENT PRINCIPLES Patient morbidity and mortality following
development of one of the shock syndromes
correlates directly with the duration and severity
of malperfusion. The intensivist has three goals
in treating the patient in shock. First, to promptly
diagnose the presence and etiology of shock.
Second, to rapidly restore systemic and regional
perfusion in order to prevent ongoing shock and
cellular injury. Third, to prevent the development
of end-organ failure. In reality, the intensivist
must often begin resuscitation prior to identifying
the etiology of shock. For this reason, the
intensivist must command a strong understanding
of the various therapeutic options for each of the
shock states. Utilizing the hemodynamic
variables and calculations described above,
shock resuscitation should focus on assessment
of each individual patient’s preload, contractility,
afterload, and oxygen transport balance with the
intent to optimize the patient's end-organ
perfusion and cellular oxygenation.
Preload
In almost all shock states, a component of
diminished preload, either relative or absolute,
exists. Therefore, the initial therapeutic
intervention for almost all patients in shock
should be administration of an intravenous
balanced salt solution. The amount of fluid
necessary to fully resuscitate a patient varies, but
an initial bolus of 20 mL/kg is reasonable in
profound hypotension. Additional crystalloid
infusions should be guided by monitoring the
patient for signs of improved organ perfusion:
reduction in tachycardia, restoration of
normotension, maintenance of adequate urine
output, return of normal mentation, and
improvement in oxygen transport variables.
Invasive hemodynamic monitoring may be of
significant value in achieving these goals.
Appropriate venous access is essential for
rapid volume replacement. Optimal access is
through short, thin-walled large-bore intravenous
catheters. Since resistance is inversely
proportional to the radius to the fourth power,
even small increments in catheter diameter will
significantly reduce resistance to flow of
crystalloid and blood infusions. When peripheral
sites are unavailable, central venous
catheterization of either the internal jugular or
subclavian veins via the Seldinger can be utilized.
Enthusiasm for femoral vein catheterization
should be tempered by the increased rate of
deep venous thrombosis seen on the side of
catheter placement as compared to the
contralateral vein (119).
The crystalloid versus colloid debate
continues to be waged despite abundant

Shock: An Overview – Cheatham, Block, Smith, & Promes 31
research demonstrating minimal differences in
patient outcome (120-123). Advocates of colloid
resuscitation point to studies that document the
lower volumes of colloid necessary to achieve the
same therapeutic end-point. Recent meta-
analyses of the numerous prospective, clinical
trials in this area have consistently supported the
use of crystalloid infusions during resuscitation
with colloids being restricted to specific
indications (120-122). No survival benefit is
associated with colloid resuscitation, and the
meta-analyses have suggested a consistent
survival advantage of crystalloid over colloid
(120-122). Given the increased costs of colloid
administration and the lack of data supporting its
use, crystalloid resuscitation is preferred (120-
123). Miller et al investigated the use of large
volume crystalloid resuscitation versus a more
moderate fluid resuscitation in combination with
inotropic medications in surgical and trauma
patients (124). Large volume crystalloid
resuscitation alone was found to significantly
improve patient survival and organ failure.
During large volume resuscitation, the patient
is at risk for iatrogenic hypothermia.
Consequences of significant hypothermia (<35°
C) include delayed drug metabolism and a
reversible platelet dysfunction that is of particular
concern in the postoperative patient (125).
Cardiac dysrhythmias may present with
progressive hypothermia that are refractory to
chemical correction until the patient is made
normothermic. Compensatory thermogenesis by
shivering increases oxygen consumption and
adds to metabolic acidosis, thereby complicating
resuscitation from shock. Prevention of
hypothermia is more easily accomplished than
correction. Warmed intravenous fluids, warming
blankets and a warm ambient environment may
prevent shock-induced hypothermia.
Use of the Trendelenburg position was
historically touted to treat shock prior to
establishment of venous access. The theory was
to divert blood from the venous capacitance to
the central circulation, improving cardiac filling
and augmenting cardiac output. Recently, this
technique has fallen into disfavor, because
studies fail to demonstrate consistent
redistribution of blood volume to the central
circulation (126). The Trendelenburg position
also may cause respiratory embarrassment,
impaired gas exchange, and complicate the
management of shock. This effect may be even
more pronounced in the morbidly obese.
Contractility
Resuscitative therapy aimed to alter
contractility should begin with optimization of the
patient's heart rate. While tachycardia may
partially compensate for low perfusion, further
increases in heart rate may only diminish diastolic
filling of the heart and reduce cardiac output.
Treatment of pain and anxiety as well as control
of supraventricular tachyarrhythmias in the
volume resuscitated patient can improve cardiac
output. In bradycardia from neurogenic shock,
atropine induced blockage of parasympathetic
stimulation may help ameliorate the
hypoperfusion by raising heart rate and cardiac
output. Patients on beta-blockers who have an
inappropriately low heart rate may benefit from
administration of both calcium and glucagon.
Patients with pacemakers who are unable to
raise their own heart rate in response to shock
32 Shock: An Overview – Cheatham, Block, Smith, & Promes
will frequently benefit from resetting their
pacemaker to a higher rate.
Contractility agents should be considered
only after adequate attempts to improve preload
and afterload (where appropriate) have been
made. Dopamine, a naturally occurring
catecholamine that is the immediate precursor of
norepinephrine, is a widely used agent with a
variable response based on dosing. Classically,
low rates of infusion (0-3 mcg/kg/min) have been
considered “renal dose” in that dopamine
increases glomerular filtration rate (GFR) and
renal blood flow in healthy volunteers. However,
the clinical effects on improved GFR and urine
output in the critically ill have been questioned
(127,128) In addition, systemic hemodynamic
effects have been observed in patients with
doses in this low range. (129) In modest doses
(5-10 mcg/kg/min), cardiac contractility and heart
rate are increased through stimulation of cardiac
beta receptors. High dose therapy (10
mcg/kg/min and higher) results in increasing
stimulation of alpha adrenergic receptors and
elevations in systemic blood pressure. Although
a valuable tool in improving cardiac performance,
dopamine should be used with caution in patients
with coronary artery stenosis because of the
potential side effect of tachycardia and overall
increases in myocardial oxygen demand.
Dobutamine is a synthetic catecholamine that
also acts on beta-1 receptors, but unlike
dopamine, does not directly release
norepinephrine. When its chronotropic effects
are minimal and heart rate does not increase, the
primary inotropic effects of dobutamine have little
effect on myocardial oxygen demand (130). This
may be due to the systemic vasodilation that
accompanies dobutamine therapy. This afterload
reduction may increase cardiac output in the
weakened heart, but may also decrease blood
pressure leading to reduced systemic perfusion
overall. Dobutamine should therefore be used
with caution in hypovolemic, vasodilated states.
Norepinephrine is a naturally occurring
catecholamine with both alpha and beta
adrenergic activity. As a potent vasoconstrictor,
there is some reluctance to use this agent
because of its possible effects on mesenteric and
renal blood flow. However, in the setting of an
appropriately volume repleted patient who
remains hypotensive, norepinephrine has been
shown to be effective and safe and may have
beneficial effects on renal function (129,131,132).
Amrinone is a noncatecholamine intravenous
inotrope that, like dobutamine, has vasodilatory
effects. Its mechanism of action is as a
phosphodiesterase III inhibitor, raising
intracellular cyclic AMP. In patients with
congestive heart failure, amrinone increases
stroke volume without an effect on heart rate
(133). In some patients, its vasodilatory
properties preclude its use because of dramatic
hypotension.
Afterload
Once preload is optimized and hemodynamic
goals have still not been met, afterload should be
assessed and corrected as needed. The
persistently hypotensive patient cannot be
considered a candidate for afterload reduction. In
patients with hypertension or even normotension,
however, afterload reduction may allow for

Shock: An Overview – Cheatham, Block, Smith, & Promes 33
improved cardiac output and hence improved
resuscitation, especially in patients with
decreased contractility.
Sodium nitroprusside is a commonly used
agent with advantages of rapid onset and short
duration, making it ideal for titration in the
hemodynamically labile patient. Nitroprusside
acts as both a venous and arterial vasodilator in
essentially equal amounts. However, it should be
used with caution in patients with coronary artery
disease where concerns of coronary steal and
myocardial ischemia exist. Alternatively,
intravenous nitroglycerin may be used. Although
primarily affecting venous capacitance,
nitroglycerin also decreases arterial resistance
and may improve cardiac output. Angiotensin
converting enzyme (ACE) inhibiting agents may
also be of significant value in reducing afterload
in the normovolemic patient with poor cardiac
function.
Afterload may also be reduced mechanically
using a percutaneously placed intra-aortic balloon
counterpulsation pump (IABP) (134). IABP is
commonly used in myocardial infarction and in
the immediate postoperative period after
coronary artery bypass. IABP both provides
mechanical afterload reduction and improves
coronary artery perfusion. IABP demonstrates
survival benefit primarily in myocardial infarction
patients who have reversible pathology and has
been used successfully in high risk patients
undergoing noncardiac surgery (135).
Although afterload reduction may be
beneficial in improving cardiac performance, the
patient with aortic stenosis leading to shock may
be harmed by use of these agents. In this
disease, left ventricular wall tension remains high,
and afterload reduction only serves to reduce
coronary perfusion by reducing coronary
perfusion pressure.
Oxygen Transport
Optimizing oxygen carrying capacity, arterial
oxygenation, heart rate and increasing stroke
volume will all improve oxygen delivery from the
left ventricle. The goal of shock resuscitation is
to improve tissue oxygenation so that oxygen
consumption can increase to meet the oxygen
demand of the cells to function aerobically.
Normalization of anaerobic markers such as base
deficit and excess arterial lactate should be one
of the goals of shock resuscitation. Further
increases in therapy to avoid “flow-dependence”
of oxygen consumption would seem to be a
minimal therapeutic goal.
Restitution of adequate levels of hemoglobin
increases oxygen carrying capacity and expands
intravascular volume (preload). The arguments
for optimization of hemoglobin consider the
relative benefits of increasing oxygen delivery
weighed against the hazards of allogeneic blood
transfusion. Transfusion of red blood cells can
significantly improve oxygen transport.
Increasing hemoglobin concentration from 8 g/dL
to 12 g/dL will increase oxygen delivery by 50%,
if cardiac output and gas exchange remain
unchanged. Similar improvements in oxygen
delivery by increasing myocardial contractility
alone would require increases in cardiac output
that would be challenging to produce with
pharmacologic interventions. Transfusion of red
blood cells to increase oxygen delivery is limited

34 Shock: An Overview – Cheatham, Block, Smith, & Promes
by increases in blood viscosity that adversely
affect tissue oxygenation. When hemoglobin
concentration exceeds about 16 g/dL, cardiac
output can decrease countering the beneficial
effects of increased oxygen carrying capacity.
Sludging of blood at high hematocrit in the
capillaries may further decrease tissue
oxygenation. Further compounding the
controversy are studies that demonstrate the
failure of blood transfusion to improve outcome in
critically ill patients (78,79). Such studies,
however, have tended to exclude certain
populations of patients and further study is
necessary to identify which subpopulations of the
critically ill may benefit from maintenance of
higher hemoglobin levels.
SUMMARY Shock is a common and highly lethal
condition that is being increasingly encountered
in the critically ill. Its etiology is varied and
complex. It may present in a spectrum from
subclinical laboratory abnormalities to complete
cardiovascular collapse. A high degree of clinical
suspicion and thorough evaluation is essential to
both making the diagnosis and initiating timely
resuscitative therapy. Inadequate tissue
perfusion that is unresponsive to initial treatment
should lead to aggressive, goal-directed therapy.
Correction of abnormalities in ventricular preload,
contractility, afterload, and systemic oxygenation
are the first steps to breaking the cycle of cellular
injury and microcirculatory failure. Correction of
the precipitating, underlying condition is essential
for patient survival. Early treatment to predefined
physiologic endpoints reduces the potentially
devastating complication of end-organ
dysfunction and failure.

Shock: An Overview – Cheatham, Block, Smith, & Promes 35
REFERENCES 1. Lassen NA. Cerebral blood flow and oxygen
consumption in man. Physiol Rev 1959; 39:183-238.
2. Hinshaw LB, Cox BG. The fundamental mechanisms of shock. New York, Plenum Press, 1972, p. 13.
3. Takhar S, Rosentahl M. Shock. In: O'Donnell JM and Nacul FE (eds), Surgical Intensive Care Medicine. Boston, Kluwer Academic Publishers, 2001, p.78.
4. Bickell WH, Wall MJ Jr, Pepe PE, et al. Immediate versus delayed fluid resuscitation for hypotensive patients with penetrating torso injuries. N Engl J Med 1994; 331;1105-1109.
5. Eisenberg MJ, de Romeral LM, Heidenreich PA, et al. The diagnosis of pericardial effusion and cardiac tamponade by 12-lead ECG: a technology assessment. Chest 1996; 110(2):318-324.
6. Shabetai R. Cardiac tamponade. In: Shaberai R (ed): The pericardium, New York, Grune and Sutton, 1981, p. 224.
7. Rozycki GS, Feliciano DV, Schmidt JA, et al. The role of surgeon-performed ultrasound in patients with possible cardiac wounds. Ann Surg 1996; 223(6):737-744.
8. Feliciano DV, Mattox KL, Graham JM, et al. Major complications of percutaneous subclavian vein catheters. Am J Surg 1979; 138(6):869-874.
9. Temple AP, Katz J. Air embolization: a potentially lethal surgical complication. AORN Journal 1987; 45:387-389.
10. Britten S, Palmer SH, Snow TM. Needle thoracocentesis in tension pneumothorax: insufficient cannula length and potential failure. Injury 1996; 27(5):321-322.
11. Alonso DR, Scheidt S., Post M et al. Pathophysiology of cardiogenic shock: quantification of myocardial necrosis: clinical, pathologic and electrocardiographic correlation. Circulation 1973: 48:588-596.
12. Page DL, Caulfield JB, Kastor JA et al. Myocardial changes associated with cardiogenic shock. N Engl J Med 1971; 285:133-137.
13. Shah PK, Maddahi J, Berman DS et al. Scintigraphically detected predominant right ventricular dysfunction in acute myocardial
infarction: clinical, hemodynamic correlates and implications for therapy and prognosis. J Am Coll Cardiol 1985; 6:1264-1272.
14. Wilson RF, Sarver EJ, Leblanc PL. Factors affecting hemodynamics in shock with sepsis. Annals of Surgery. 1971; 174(6):939-43.
15. Bone RC. The pathogenesis of sepsis. Ann Intern Med 1991; 115(6):457-469.
16. Parker MM, McCarthy KE, Ognibene FP, et al. Right ventricular dysfunction and dilatation, similar to left ventricular changes, characterize the cardiac depression of septic shock in humans. Chest 1990; 97: 126-131.
17. Mitsuo T, Shimazaki S, Matsuda H. Right ventricular dysfunction in septic patients. Crit Care Med 1992; 20(5):630-634.
18. Wolf YG, Cotev S, Perel A, et al. Dependence of oxygen consumption on cardiac output in sepsis. Crit Care Med 1987; 15:198-203.
19. Astiz ME, Rackow EC, Falk JL, et al. Oxygen delivery and consumption in patients with hyperdynamic septic shock. Crit Care Med 1987; 15:26-28.
20. Ruokonen E, Takala J, Kari A, et al. Regional blood flow and oxygen transport in septic shock. Crit Care Med 1993; 21(9):1296-1303.
21. Hotchkiss RS, Karl IE. Reevaluation of the role of cellular hypoxia and bioenergetic failure in sepsis. JAMA 1992; 267:1503-1510.
22. Mela L, Belcazo LV, Miller LD. Defective oxidative metabolism of rat liver mitochondria in hemorrhagic and endotoxin shock. Am J Physiol 1971; 220:571-577.
23. Stadler J, Bentz BG, Harbrecht BG, et al. Tumor necrosis factor alpha inhibits mitochondrial respiration of rat hepatocytes. Ann Surg 1992; 216:539-546.
24. Vary TC, Siegel JH, Nakatani T, et al. Effect of sepsis on activity of pyruvate dehydrogenase complex in skeletal muscle and liver. Am J Physiol 1986; 250:E634-640.
25. Carpati CM, Astiz ME, Rackow EC. Mechanisms and management of myocardial dysfunction in septic shock. Crit Care Med 1999 Feb;27(2):231-2.

36 Shock: An Overview – Cheatham, Block, Smith, & Promes
26. Cain BS, Meldrum DR, Dinarello CA, Meng X, Joo KS, Banerjee A, Harken AH. Tumor necrosis factor-alpha and interleukin-1beta synergistically depress human myocardial function. Crit Care Med 1999 Jul;27(7):1309-18.
27. Turner A, Tsamitros M, Bellomo R. Myocardial cell injury in septic shock. Crit Care Med 1999 Sep;27(9):1775-80
28. Marquardt DL, Wasserman SI. Anaphylaxis. In: Allergy Principles and Practice, 4th ed., St. Louis, Mosby 1993: 1525-1536.
29. Soderstrom CA, McArdle DQ, Ducker TB, et al. The diagnosis of intra-abdominal injury in patients with cervical cord trauma. J Trauma 1983;23:1061-1065.
30. Zipnick RI, Scalea TM, Trooskin SZ, et al. Hemodynamic responses to penetrating spinal cord injuries. J Trauma 1993; 35:578-582.
31. Laderson PW. Recognition and management of cardiovascular disease related to thyroid dysfunction. Am J Med 1990; 88:638-641.
32. Zwillich CW, Pierson DJ, Hofeldt F, et al. Ventilatory control in myxedema and hypothyroidism. N Engl J Med 1975; 292(13): 662-665.
33. Shenfield GM. Influence of thyroid dysfunction on drug pharmacokinetics. Clin Pharmacokinet 1981; 6(4): 275-297.
34. McBrien DJ, Hindle W. Myxoedema and heart failure. Lancet 1963; 1:1065-1068.
35. Barquist E, Kirton O. Adrenal insufficiency in the surgical intensive care unit patient. J Trauma 1997;42(1):27-31.
36. Burchard K. A review of the adrenal cortex and severe inflammation: Quest of the "Eucorticoid" state. J Trauma 2001:800-814.
37. Canty JM, Giglia J, Kandath D. Effect of tachycardia on regional function and transmural myocardial perfusion during graded coronary pressure reduction in conscious dogs. Circ Res 1990; 82:1815-1825.
38. Chang MC, Meredith JW. Cardiac preload, splanchnic perfusion, and their relationship during resuscitation in trauma patients. J Trauma 1997; 42:577-584.
39. Gardner RM. Direct blood pressure measurement - dynamic response requirements. Anesthesiology 1981; 54:227-236.
40. Gentilello LM, Rifley WJ. Continuous arteriovenous rewarming: Report of a new technique for treating hypothermia. J Trauma 1991; 31:1151-1154.
41. Gentilello LM. Advances in the management of hypothermia. Surg Clin N Am 1995; 75(2):243-256.
42. Jurkovich GJ, Greiser WB, Luterman A, Curreri PW. Hypothermia in trauma victims: An ominous predictor of survival. J Trauma 1987; 27:1019-1024.
43. Erickson RS, Kirklin SK. Comparison of ear-based, bladder, oral, and axillary methods for core temperature measurement. Crit Care Med 1993; 21: 1528-1534.
44. Zell SC, Kurtz KJ. Severe exposure hypothermia: A resuscitative protocol. Ann Emerg Med 1985; 14:339-345.
45. Weinberg AD. Hypothermia. Ann Emerg Med 1993; 22:370-377.
46. Neff TA. Routine oximetry: A fifth vital sign? Chest 1988; 94:227.
47. The Technology Assessment Task Force of the Society of Critical Care Medicine. A model for technology assessment applied to pulse oximetry. Crit Care Med 1993; 21:615-624.
48. Bierman MI, Stein KL, Snyder JV. Pulse oximetry in the postoperative care of cardiac surgical patients: A randomized controlled trial. Chest 1992; 102:1367-1370.
49. Swan HJC, Ganz W, Forrester J, et al. Catheterization of the heart in man with use of a flow-directed balloon-tipped catheter. N Engl J Med 1970; 283:447-451.
50. Hoffman MJ, Greenfield LJ, Sugerman HJ, Tatum JL. Unsuspected right ventricular dysfunction in shock and sepsis. Ann Surg 1983; 198:307-319.
51. Calvin JE, Driedger AA, Sibbald WJ. The hemodynamic effect of rapid fluid infusion in critically ill patients. Surgery 1981; 90:61-76.
52. Calvin JE, Driedger AA, Sibbald WJ. Does the pulmonary capillary wedge pressure predict left ventricular preload in critically ill patients? Crit Care Med 1981; 9:437-443.
Shock: An Overview – Cheatham, Block, Smith, & Promes 37
53. Baek SM, Makabali GG, Bryan-Brown CW, Kusek JM, Shoemaker WC. Plasma expansion in surgical patients with high central venous pressure (CVP); the relationship of blood volume to hematocrit, CVP, pulmonary wedge pressure, and cardiorespiratory changes. Surgery 1975; 78:304-315.
54. Packman MI, Rackow EC. Optimum left heart filling pressure during fluid resuscitation of patients with hypovolemic and septic shock. Crit Care Med 1983; 11:165-169.
55. Diebel LN, Wilson RF, Tagett MG, Kline RA: End-diastolic volume: a better indicator of preload in the critically ill. Arch Surg 1992; 127:817-822.
56. Unterberg AW, Kiening KL, Hartl R, et al. Multimodal monitoring in patients with head injury: Evaluation of the effects of treatment on cerebral oxygenation. J Trauma 1997; 42:S32-S37.
57. Nelson LD, Rutherford EJ. Principles of hemodynamic monitoring. In: Pinsky MR, Dhainaut JF (Eds): Pathophysiologic foundations of critical care. Baltimore: Williams and Wilkins, 1993:3-22.
58. Vincent JL, Thirion M, Brimioulle S, et al. Thermodilution measurement of right ventricular ejection fraction with a modified pulmonary artery catheter. Intensive Care Med 1986;12:33-38.
59. Dhainaut JF, Brunet F, Monsallier JF, et al. Bedside evaluation of right ventricular performance using a rapid computerized thermodilution method. Crit Care Med 1987; 15:148-152.
60. Jardin F, Brun-Ney D, Hardy A, et al. Combined thermodilution and two-dimensional echocardiographic evaluation of right ventricular function during respiratory support with PEEP. Chest 1991; 99:162-168.
61. Jardin F, Gueret P, Dubourg O, et al. Right ventricular volumes by thermodilution in the adult respiratory distress syndrome. Chest 1988; 88:34-39.
62. Martyn JA, Snider MT, Farago LF, Burke JF: Thermodilution right ventricular volume: a novel and better predictor of volume replacement in acute thermal injury. J Trauma 1981; 21:619-626.
63. Reuse C, Vincent JL, Pinsky MR: Measurements of right ventricular volumes during fluid challenge. Chest 1990; 98:1450-1454.
64. Diebel L, Wilson RF, Heins J, et al. End-diastolic volume versus pulmonary artery wedge pressure in evaluating cardiac preload in trauma patients. J Trauma 1994; 37:950-955.
65. Diebel LN, Myers T, Dulchavsky S. Effects of increasing airway pressure and PEEP on the assessment of cardiac preload. J Trauma 1997; 42:585-591.
66. Cheatham ML, Safcsak K, Nelson LD. Right ventricular end-diastolic volume index is superior to cardiac filling pressures in determining preload status. Surg Forum 1994; pp. 79-81.
67. Safcsak K, Fusco MA, Miles WS, et al. Does transmural pulmonary artery occlusion pressure (PAOP) via esophageal balloon improve prediction of ventricular preload in patients receiving positive end-expiratory pressure (PEEP)? Crit Care Med 1995; 23(1):A244.
68. Chang MC, Blinman TA, Rutherford EJ, et al. Preload assessment in trauma patients during large-volume shock resuscitation. Arch Surg 1996;131:728-731.
69. Durham R, Neunaber K, Vogler G, et al. Right ventricular end-diastolic volume as a measure of preload. J Trauma 1995; 39:218-224.
70. Miller PR, Meredith JW, Chang MC. Randomized, prospective comparison of increased preload versus inotropes in the resuscitation of trauma patients: Effects on cardiopulmonary function and visceral perfusion. J Trauma 1998; 44:107-113.
71. Cheatham ML, Safcsak K, Block EFJ, Nelson LD. Preload assessment in patients with an open abdomen. J Trauma 1999; 46:16-22.
72. Cheatham ML, Nelson LD, Chang MC, Safcsak K. Right ventricular end-diastolic volume index as a predictor of preload status in patients on positive end-expiratory pressure. Crit Care Med 1998; 26: 1801-1806.
73. Cheatham ML. Right ventricular end-diastolic volume measurements in the

38 Shock: An Overview – Cheatham, Block, Smith, & Promes
resuscitation of trauma victims. Int J Crit Care 2000; 1-6.
74. Goedje O, Hoeke K, Lichtwarck-Aschoff M, et al. Continuous cardiac output by femoral arterial thermodilution calibrated pulse contour analysis: comparison with pulmonary arterial thermodilution. Crit Care Med 1999; 27:2578-2579.
75. Singer M, Bennett ED. Noninvasive optimization of left ventricular filling using esophageal Doppler. Crit Care Med 1991; 19:1132-1137.
76. Nelson LD, Rutherford EJ. Monitoring mixed venous oxygen. Respir Care 1992; 92:154-164.
77. Nelson LD. Assessment of oxygenation: Oxygenation indices. Resp Care 1993; 38:631-645.
78. Hébert PC, Wells G, Blajchman MA, et al. A multicenter, randomized, controlled clinical trial of transfusion requirements in critical care. N Engl J Med 1999; 340;409-417.
79. Hébert PC, Blajchman MA, Cook DJ, et al. Do blood transfusions improve outcomes related to mechanical ventilation? Chest 2001; 119:1850-1857.
80. Boldt J, Menges T, Wollbruck M, et al. Is continuous cardiac output measurement using thermodilution reliable in the critically ill patient? Crit Care Med 1994; 22:1913-1918.
81. Yelderman M: Continuous measurement of cardiac output with use of stochastic identification techniques. J Clin Mon 1990; 6:322-332.
82. Munro HM, Wood CE, Taylor BL, Smith GB. Continuous invasive cardiac output monitoring - the Baxter/Edwards Critical-Care Swan Ganz( Intellicath( and Vigilance( system. Clinical Intensive Care 1994; 5:52-55.
83. Haller M, Zollner C, Briegel J, Forst H. Evaluation of a new continuous thermodilution cardiac output monitor in critically ill patients: A prospective criterion standard study. Crit Care Med 1995; 23:860-866.
84. Burchell SA, Yu Mihae, Takiguchi SA, et al. Evaluation of a continuous cardiac output and mixed venous oxygen saturation
catheter in critically ill surgical patients. Crit Care Med 1997; 25:388-391.
85. Nelson LD. Continuous venous oximetry in surgical patients. Ann Surg 1986; 203:329-333.
86. Cernaianu AC, Nelson LD. The significance of mixed venous oxygen saturation and technical aspects of continuous measurement. In: Edwards JD, Shoemaker WC, Vincent JL (Eds). Oxygen Transport: Principles and Practice. Philadelphia, PA, W.B. Saunders Company, Ltd. 1993 pp 99-124.
87. Cernaianu AC: Cost-effectiveness of oximetric PAC: A fair evaluation? J Cardiothor Anesth 1990; 4:300-301.
88. Orlando R: Continuous mixed venous oximetry in critically ill surgical patients. Arch Surg 1986; 121:470-471.
90. Shoemaker WC, Pierchala C, Chang P, et al. Prediction of outcome and severity of illness by analysis of the frequency distributions of cardiorespiratory variables. Crit Care Med 1977; 5:82-88. �Bland RD, Shoemaker WC, Abraham E, Cobo JC. Hemodynamic and oxygen transport patterns in surviving and nonsurviving postoperative patients. Crit Care Med 1985; 13: 85-90.
91. Shoemaker WC, Appel PL, Kram HB, et al. Prospective trial of supranormal values of survivors as therapeutic goals in high-risk surgical patients. Chest 1988; 94:1176-1186.
92. Edwards JD, Brown GCS, Nightingale P, et al. Use of survivor's cardiorespiratory values as therapeutic goals in septic shock. Crit Care Med 1989; 17:1098-1103.
93. Tuchschmidt J, Fired J, Astiz M, Rackow E. Elevation of cardiac output and oxygen delivery improves outcome in septic shock. Chest 1992; 102:216-220.
94. Yu M, Levy MM, Smith P, et al. Effect of maximizing oxygen delivery on morbidity and mortality rates in critically ill patients: A prospective, randomized, controlled study. Crit Care Med 1993; 21:830-837.
95. Hayes MA, Timmins AC, Yau EHS, et al. Elevation of systemic oxygen delivery in the treatment of critically ill patients. N Engl J Med 1994; 330:1717-1722.
Shock: An Overview – Cheatham, Block, Smith, & Promes 39
96. Kelly KM. Does increasing oxygen delivery improve outcome? Yes. Crit Care Clin 1996; 12(3):635-644.
97. Ronco JJ, Fenwick JC, Tweeddale MG. Does increasing oxygen delivery improve outcome in the critically ill? No. Crit Care Clin 1996; 12(3):645-659.
98. Velmahos GC, Demetriades D, Shoemaker WC, Chan LS, Tatevossian R, et al. Endpoints of resuscitation of critically injured patients: normal or supranormal? A prospective randomized trial. Ann Surg 2000; 232:409-418.
99. Kruse JA, Zaidi SAJ, Carlson RW: Significance of blood lactate levels in critically ill patients with liver disease. Am J Med 1987; 83:77-82.
100. Abramson D, Scalea TM, Hitchcock R, et al. Lactate clearance and survival following injury. J Trauma 1993; 35:584-589.
101. Kruse JA, Haupt MT, Puri VK, et al. Lactate levels as predictors of the relationship between oxygen delivery and consumption in ARDS. Chest 1990; 98:959-962.
102. Bakker J, Coffernils M, Leon M, et al. Blood lactate levels are superior to oxygen-derived variables in predicting outcome in human septic shock. Chest 1991; 99:956-962.
103. Mizock BA, Falk JL. Lactic acidosis in critical illness. Crit Care Med 1992; 20:80-93.
104. Davis JW, Shackford SR, Mackersie RC, Hoyt DB. Base deficit as a guide to volume resuscitation. J Trauma 1988; 28:1464-1467.
105. Rutherford EJ, Morris JA, Reed G, Hall KS. Base deficit stratifies mortality and determines therapy. J Trauma 1992; 33:417-423.
106. Deitch EA. Multiple organ failure: Pathophysiology and potential future therapy. Ann Surg 1992, 216:117-134.
107. Fiddian-Green GB. Studies in splanchnic ischemia and multiple organ failure. In: Splanchnic ischemia and multiple organ failure. Marston A, Bulkley GB, Fiddian-Green RG, Haglund U (eds). Mosby Co: St. Louis, 1989.
108. Taylor DE, Gutierrez G. Tonometry: A review of clinical studies. Crit Care Clin 1996; 12(4):1007-1018.
109. Chang MC, Cheatham ML, Nelson LD, et al. Gastric tonometry supplements information provided by systemic indicators of oxygen transport. J Trauma 1994; 37:488-494.
110. Guttierrez G, Palizas F, Doglio G, et al. Gastric intramucosal pH as a therapeutic index of tissue oxygenation in critically ill patients. Lancet 1992; 339:195-99.
111. Gutierrez G, Bismar H, Dantzker DR, Silva N. Comparison of gastric intramucosal pH with measures of oxygen transport and consumption in critically ill patients. Crit Care Med 1992; 20:451-457.
112. Doglio GR, Pusajo JF, Egurrola MA, et al. Gastric mucosal pH as a prognostic index of mortality in critically ill patients. Crit Care Med 1991; 19:1037-1040.
113. Ivatury RR, Simon RJ, Havriliak D, et al. Gastric mucosal pH and oxygen delivery and oxygen consumption indices in the assessment of adequacy of resuscitation after trauma: a prospective, randomized study. J Trauma 1995; 39:128-136.
114. Marik PE. Gastric Mucosal pH: A better predictor of multiorgan dysfunction syndrome and death than oxygen-derived variables in patients with sepsis. Chest 1993; 104:225-229.
115. Roumen RM, Vreugde JPC, Goris RJA. Gastric tonometry in multiple trauma patients. J Trauma 1994; 36:313-316.
116. Boyd O, Mackay CJ, Lamb G, et al. Comparison of clinical information gained from routine blood-gas analysis and from gastric tonometry for intramural pH. Lancet 1993; 341:142-146.
117. Creteur J, DeBacker D, Vincent JL. Does gastric tonometry monitor splanchnic perfusion? Crit Care Med 1999; 27:2480-2484.
118. Cheatham ML. Intra-abdominal hypertension and abdominal compartment syndrome. New Horizons 1999; 7:96-115.
119. Meredith HW, Young JS, O'Neil EA, et al. Femoral catheters and deep venous thrombosis: a prospective evaluation with venous duplex sonography. J Trauma 1993; 35:187-190.
120. Schierhout G, Roberts I. Fluid resuscitation with colloid or crystalloid solutions in

40 Shock: An Overview – Cheatham, Block, Smith, & Promes
critically ill patients: a systematic review of randomized trials. BMJ 1998; 316:961-964.
121. Cochrane Injuries Group Albumin Reviewers. Human albumin administration in critically ill patients: systematic review of randomized controlled trials. BMJ 1998; 317:235-240.
122. Choi PTL, Yip G, Quinonez LG, et al. Crystalloids vs. colloids in fluid resuscitation: A systematic review. Crit Care Med 1999; 27:200-210.
123. Vermeulen LC Jr, Ratko TA, Erstad BL, et al. A paradigm for concensus. The university Hospital Consoritum guidelines for the use of albumin, nonprotein colloid, and crystalloid solutions. Arch Intern Med 1995; 155:373-379.
124. Miller PR, Meredith JW, Chang MC. Randomized, prospective comparison of increased preload versus inotropes in the resuscitation of trauma patients: effects on cardiopulmonary function and visceral perfusion. J Trauma 1998; 44:107-113.
125. Valeri CR, Feingold H, Cassidy G, et al. Hypothermia induced reversible platelet dysfunction. Ann Surg 1987; 205:175-181.
126. Reich DL, Konstadt SN, Raissi S, et al. Trendelenburg position and passive leg raising do not significantly improve cardiopulmonary performance in the anesthetized patient with coronary artery disease. Crit Care Med 1989; 17:313-317.
127. Kellum JA, Decker J. Use of dopamine in acute renal failure: a meta-analysis. Crit Care Med 2001; 29:1526-1531.
128. Bellomo R, Chapman M, Finfer S, et al. Low-dose dopamine in patients with early renal dysfunction: a placebo-controlled randomised trial. Lancet 2000; ,356:2112-2113.
129. Richer M, Robert S, Lebel M. Renal hemodynamics during norepinephrine and low-dose dopamine infusions in man. Crit Care Med 1996: 24(7): 1150-1156.
130. Rude RE, Izquierdo C, Buja LM. Effects of inotropic and chronotropic stimuli on acute myocardial ischemic injury. I. Studies with dobutamine in the anesthetized dog. Circulation 1982; 65(7):1321-1328.
131. Hesselvik JF, Brodin B. Low dose norepinephrine in patients with septic shock
and oliguria: effects on afterload, urine flow, and oxygen transport. Crit Care Med 1989; 17:179-180.
132. Marin C, Eon B, Saux P, et al. Renal effects of norepinephrine used to treat septic shock patients. Crit Care Med 1990; (18):282-285.
133. Benotti JR, Grossman W, Braunwald E, et al. Effects of amrinone on myocardial energy metabolism and hemodynamics in patients with severe congestive heart failure due to coronary artery disease. Circulation 1982; 62:28-34.
134. Torchiana DF, Hirsch G, Buckley MJ, et al. Intra-aortic balloon pumping for cardiovascular support; Trends in practice and outcome, 1968 - 1995. J Thoracic Cardiovasc Surg 1997; 113(4):758-754.
135. Grotz RL, Yeston NS. Intra-aortic balloon counterpulsation in high-risk cardiac patients undergoing noncardiac surgery. Surgery 1989; 106:1-5.


