Embed Size (px)
Citation preview

Nine-component (9-C) 3-D seismicreflection data are acquired usingorthogonal shear-wave sources andorthogonal horizontal geophones.Shear-wave sources are oriented inlineand crossline (SI and SX) to the receiverlines, as are the horizontal geophones(RI and RX). Four shear-wave data setsresult (SI,RI; SI,RX; SX,RI,SX,RX). Theseinline-crossline coordinates arereferred to as field coordinates. Amaininterpretation emphasis for these datahas been to infer the presence of ver-tical cracks using shear-wave birefrin-gence. Nonzero crossterms (SI,RX;SX,RI) have been used as an indicatorthat shear-wave birefringence (split-ting) is present.
It does not seem to be widely rec-ognized that field coordinates implic-itly record a mixture of SH, SV, andP-waves. The degree of mixingdepends on source-receiver azimuth.Shear-wave data processing, signalrecovery, and interpretation are unnec-essarily complicated (and often ques-tionable) in field coordinates becauseof this spatially variable mixing ofwave modes.
Shear-wave data analysis is sim-plified if prestack data are rotated to aradial-transverse coordinate systemusing the measured source-receiverazimuth. The radial-source radial-receiver component (SR,RR) containspredominantly SV waves and P-waves, while the transverse-sourcetransverse-receiver component (ST,RT)contains only SH waves in an isotropicflat-layered earth. SH data are simpli-fied in that SH waves convert only toSH upon reflection and transmission,unlike SV propagation, which is cou-pled with P. The amplitude-versus-offset (AVO) response for SHreflections is generally very differentfrom that of SV reflections. SV reflec-tions generally reverse polarity at localincidence angles of 20-30°, while SHreflections are much more constant atprecritical angles.
A 9-C–3-D data set acquired witha square recording template illustratesthe azimuthal (source-receiver) depen-dence of field-coordinate data. Datacontain a rich distribution of source-
receiver azimuths. An azimuth of 0°(and 180°) corresponds to 2-D dataacquisition, whereby SI,RI is SV, SX,RXis SH, and crossterms SI,RX and SX,RIhave minimal response. At 90° (and
270°) azimuth (also 2-D acquisition),SI,RI is SH and SX,RX is SV, while SI,RXand SX,RI are again at a minimum. Atall other azimuths, the four field-coor-dinate data sets contain a mixture of
604 THE LEADING EDGE JUNE 2001 JUNE 2001 THE LEADING EDGE 0000
Shear waves from 3-D–9-C seismic reflection data
Have we been looking for signal in all the wrong places?JIM SIMMONS, 4th Wave Imaging Corp., Laguna Beach, California, U.S.MILO BACKUS, Bureau of Economic Geology, The University of Texas at Austin, U.S.
Figure 1. (a) SV and SH shot records for 2-D acquisition. SV data areobtained from SI,RI and SH data from SX, RX. (b) Field-coordinate datarecorded on the bottom line of receivers (purple) from sources SI and SXlocated at the upper center (red arrows). Distinctions between SV wavesand SH waves are not apparent in these data.
a) b)
Figure 2. Shear-wave AVO. SH and SV reflection coefficients as a functionof incidence angle for a shale-brine sand interface from earth models inCastagna and Smith (1994).

SH, SV, and P-waves in varying pro-portions that is azimuth dependent.SI,RX and SX,RI reach maximum ampli-tude (as large as SI,RI and SX,RX) atazimuths of 45° and 135° (also 225°and 315°).
In radial-transverse coordinates,SV data are contained on SR,RR, SHdata are contained on ST,RT at allazimuths, and crossterms SR,RT andST,RR are always at a minimum.
2-D versus 3-D shear-wave dataacquisition. Separation of SV (and P)waves from SH waves occurs implic-itly for two-dimensional 9-C dataacquisition in an isotropic, flat-layeredearth. Shear-wave vibrators shakeinline and crossline (SI and SX) and thehorizontal geophones also are orientedinline and crossline (RI and RX). SHdata are taken from the SX,RX compo-nent, and the SV data are taken fromthe SI,RI component (Figure 1a).
Common shot gathers show dis-tinct differences between SV and SHwaves. SV wave propagation is cou-pled with P-waves as evidenced byrefraction events having P-wavemoveouts (i.e., 1.5 s at the far offset).SH waves propagate uncoupled fromSV and P in a flat-layered isotropicearth. SH data exhibit true SH headwaves. Meanwhile, SV data show first-arrivals that have P-wave moveouts,with very different slopes and inter-cepts from those of SH. Surface wavesare different for SV and SH withRayleigh waves on SV and Lovewaves on SH. SH and SV first-arrivaltimes are different, suggesting thepresence of transverse anisotropy witha vertical axis of symmetry (VTI) thatmay be due to horizontal layering.
Three-dimensional acquisitionrecords data at a range of offsets andazimuths for each shotpoint (Figure1b). We assume that a source-receiverazimuth of 0° (and 180°) correspondsto the inline (I) direction. The line ofreceivers shown in red (source-receiverazimuth = 0°) corresponds to the 2-Dacquisition shown in Figure 1a (SH=SX,RX and SV= SI,RI). Data recorded atan azimuth of 90° (receivers shown ingreen) also correspond to 2-D acquisi-tion; however, the SV data are nowcontained on the SX,RX component andthe SH data are contained on the SI,RIcomponent. Note that the crosstermsSI,RX and Sx,RI will be zero for flat,isotropic layers at azimuths of 0° and90°. These two limiting cases of 2-Dacquisition within a 3-D grid ofreceivers clearly show that field coor-dinates SX,RX and SI,RI record a mix-ture of SH waves, SV (and P) waves.
This mixing is spatially dependent inthat if the source position moves, thelimiting cases of 2-D acquisition alsomove to the inline and crossline thatintersect the source location.
Now consider the data recorded infield coordinates along a particularreceiver line for a shotpoint locatedoff-line (purple receivers). Real dataassociated with this type of source-receiver geometry are shown in Figure1b. The near offset is roughly 4300 ft.Distinct differences between SV andSH waves are not obvious in field coor-dinates. Refractions with P-wavemoveouts are seen in each data set. Areceiver at an arbitrary azimuth fromthe source records a mixture of SH, SV(and P) waves on each horizontal com-ponent. The degree of mixing dependson the source-receiver azimuth. As aresult of this wave-mode mixing, it islikely that estimation of shear-wavestatics, recovery of the shear-wavereflection signal, and subsequent seis-mic interpretation are unnecessarilyconfused.
AVO: SH versus SV. The amplitude-versus-offset responses of SH and SVreflections are very different, even inan isotropic medium. Intuitively, weexpect the behavior of an SV reflectionto be more complicated because SVwave propagation is coupled with P-wave propagation. This distinctionbetween SH and SVAVO is a main rea-son why these wave modes should beseparated, as is done by the transfor-mation to radial-transverse coordi-nates.
Reflection coefficients for SV andSH reflections as a function of the localangle of incidence for several earthmodels are shown in Figure 2. Thegeneral earth model is that of a shalebrine-sand interface, and the actualrock properties are taken from the lit-erature.
Note the agreement at incidentangles near zero. At normal incidencethere is no distinction between SH andSV; all particle motion is horizontal. Asthe angle of incidence increases, thereflection coefficients become very dif-ferent. Note the polarity reversal thatoccurs for SV. We see that RSH can beexpected to remain strong at large pre-critical angles, while RSV can be gen-erally expected to reverse sign in the20-30° angle range. In general, Figure2 suggests that SH CDP stacked datamay be very different from SV CDPstacked data, depending on the angu-lar range included in the stacks. Thispolarity reversal for SV suggests thata CDP stack produced from all offsets
would degrade and possibly cancel anSV reflection. SH reflections tend to bemuch more constant in amplitude asa function of local incidence angle (off-set), and stacking over the full-offsetrange would tend to enhance thestacked signal.
SH waves behave similarly toacoustic P-waves. As a result, multiplereflections are often stronger on SHthan on SV or P because SH wavesconvert only to SH waves upon reflec-tion and transmission in an isotropic,flat-layered medium.
Field coordinates and radial-trans-verse coordinates. A base map of theacquisition geometry used to acquirethe 9-C–3-D seismic data set is shownin Figure 3. Shear-wave vibrators andhorizontal geophones are oriented par-allel (inline) and perpendicular(crossline) to the receiver lines shownin blue. All data were recorded withpoint geophones (three elements perstring) and point sources. Source posi-tions are indicated in red. Alignmenterror of the sources and geophonesrelative to the inline and crosslinedirections is unknown. The entirerecording patch was live for each shot.As a result, the survey contains a rel-atively full offset-azimuth distribution.
Field coordinates implicitly recorda mixture of SH, SV (and P) waves for3-D acquisition geometries. The full-prospect field-coordinate supergath-ers are shown in Figure 4. Data havehad elevation statics, and two passesof source and receiver reflection stat-ics have been applied. Reflection stat-ics were estimated from the SH data.Gain proportional to t2 (t = two-waytraveltime) was applied to the dataafter static correction. Supergatherswere formed after application of thestatics. Prestack data are sorted into100-ft offset bins and then summedwithin each offset bin. Stacking thedata within 100-ft offset bins reducesthe size of the data set and increasesthe signal-to-noise ratio in the case offlat geology (which exists here) andadequate static corrections over that ofindividual shot gathers. The actual off-set distribution within each offset binis not uniform. As a result, the extentto which surface waves and eventsthat have residual normal moveoutare attenuated is not uniform.
SI,RI and SX,RX look remarkablysimilar. Head waves having P-wavemoveouts are apparent preceding theshear-wave first arrival at the largeroffsets. The shear-wave first arrivalhas the same traveltime at the far off-set. Crossterms SI,RX and Sx,RI have
606 THE LEADING EDGE JUNE 2001 JUNE 2001 THE LEADING EDGE 0000

significant energy at the larger offsetsand also show the head waves havingP-wave moveouts.
Rotation of receivers and sourcesbased on source-receiver azimuth isnecessary to obtain separation of SVand SH waves. Rotation of 3-Creceivers to radial and transverse isquite common in ocean-bottom-cable(OBC), vertical-seismic-profile (VSP),and 3-C seismic data processing.Rotation of orthogonal shear-wavesources does not appear to be com-mon.
Transformation from field coordi-nates to radial-transverse coordinatesis obtained by rotating the four hori-zontal components of data (SI,RI; SI,RX;SX,RI,SX,RX) for each source-receiverpair by the measured source-receiverazimuth. SV data are obtained fromthe radial-source, radial-receiver com-ponent (SR,RR) and SH data areobtained from the transverse-source,transverse-receiver component (ST,RT).Rotation to radial-transverse coordi-nates is the first data-processing stepapplied to the data.
The SI,RI and SX,RX supergathersare shown in Figure 5, along with theSV and SH supergathers. Data areshown with t2 gain applied, and thedisplay gain is the same for all panels.Although SI,RI and SX,RX are essen-tially identical, the SV and SH data arevery different and show the distinc-tions discussed in Figure 1a for thecase of 2-D acquisition. Head waveswith P-wave moveouts are absentfrom SH and contained solely in theSV data. The shear-wave first arrivalhas a very different far-offset travel-time, arriving roughly 300 ms later onSV than on SH. Surface waves andmultiply reflected refractions also arevery different.
We also see that SI,RI and SX,RX are
roughly the arithmetic average of SVand SH (Figure 5, center panel). In thiscase, the presence of a full range ofsource-receiver azimuths (0-360°)causes SI,RI and SX,RX to resemble theaverage of SH and SV. In general, wewill see that field coordinates are aweighted stack of SH and SV, wherethe weights vary, depending on thesource-receiver azimuth.
Three-dimensional acquisitiongeometry is the main cause ofcrossterm energy and wave-modemixing in field coordinates. We fur-ther examine these issues with super-gathers as a function of source-receiverazimuth.
Supergathers and source-receiverazimuth. Prestack data are sorted into10° azimuth bins (Figure 6a) and 100-ft offset bins and then summed to pro-duce supergathers as a function ofsource-receiver azimuth and offset.Azimuths are measured relative to theinline direction (refer to Figure 3). Dataat azimuths of ϑ+180° are includedwith the data at azimuth ϑ.
Supergathers are displayed inreduced traveltime using a reducingvelocity of 4650 ft/s, which is approx-imately the SH-wave refraction veloc-ity. Reflection events curve upwardfrom the near offsets to the far offsetsin reduced traveltime (Figure 6b).These reduced traveltime displays
0000 THE LEADING EDGE JUNE 2001 JUNE 2001 THE LEADING EDGE 607
Figure 3. Base map for Survey A.Source locations (red) and receiverlocations (blue) are indicated. Allreceivers were active for each shot.
Figure 4. Full-prospect supergathers in field coordinates.
Figure 5. Full-prospect supergathers. Because the recording patch is essen-tially square, field coordinates SI,RI and SX,RX are roughly the average ofSH and SV, as shown.

show several shallow reflections moreclearly. We note that data displayed inreduced traveltime have been filteredto enhance the shallow reflection sig-nal relative to the lower-frequencycoherent noise.
Supergathers are shown in fieldcoordinates (Figure 7) and in radial-transverse coordinates (Figure 8) as afunction of source-receiver azimuth.At 0° azimuth, crossterms SI,RX andSX,RI are at a minimum, and SI,RI is SV,and SX,RX is SH. This subset is essen-tially a 2-D acquisition experiment inthe inline direction. Note that at 90°azimuth (2-D acquisition in thecrossline direction), SI,RX and SX,RI areagain at a minimum, but now the SHdata appear on SI,RI and the SV dataappear on SX,RX.
Shallow shear-wave reflections areseen in the SH data at 0° azimuth.These events are apparent in the SVdata only on the mid-offsets. Therealso is a large difference in traveltimeand appearance of the first arrivalsbetween SH and SV. Events dippingsteeply from lower left to upper rightalong the SV-wave first arrivals andextending upward to time zero are P-wave refractions.
As the source-receiver azimuthincreases from zero, crossterms SI,RXand SX,RI increase in amplitude, reacha maximum at 45°, and along withSI,RI and SX,RX become a mixture of
SH, SV, and P-waves. The amount ofmixing increases and reaches a maxi-mum at 45°. There is little visible dif-ference between the four field-coordinate data sets at 40° and 50°. Asthe azimuth increases from 50° to 90°,the SH data now appear on SI,RI andthe SV data appear on SX,RX, whileSI,RX and SX,RI decrease in amplitude.
It is important to note that as thesource-receiver azimuth ϑ increasesbeyond 90°, crossterms SI,RX and SX,RIhave opposite algebraic sign from SI,RX
and SX,RI at ϑ-90. This has importantimplications for binning strategies thatinclude and subsequently stack datahaving widely varying source-receiverazimuths, as is required in common-midpoint (CMP) data processing. Insupergather or CMP stacks, thecrossterms will generally be of lowamplitude when a wide range ofazimuths are included in the stackbecause of the opposite algebraic signsat azimuths ϑ and ϑ-90.
After rotation to radial-transverse
608 THE LEADING EDGE JUNE 2001 JUNE 2001 THE LEADING EDGE 0000
Figure 6. (a) Azimuth bins for creat-ing full-prospect prestack super-gathers as a function of source-receiver azimuth. Bin size is 10°.Data at azimuth θ are binned withdata at azimuth θ+180°. (b)Illustration of reduced traveltime.Linear moveout correctiondescribed by the reducing velocityVred flattens events having a slopeof 1/Vred. Hyperbolic reflectionsappear as shown to the right.
a)
Figure 7. Full-prospect supergather in field coordinates as a function ofsource-receiver azimuth. Data are displayed in reduced time. Source-receiver offset increases to the right in each subpanel. Source-receiverazimuth is noted in the upper right.
b)
Figure 8. Full-prospect supergather in radial-transverse coordinates as afunction of source-receiver azimuth. Data are displayed in reduced time.Offset increases to the right in each subpanel. Source-receiver azimuth isnoted in the upper right.
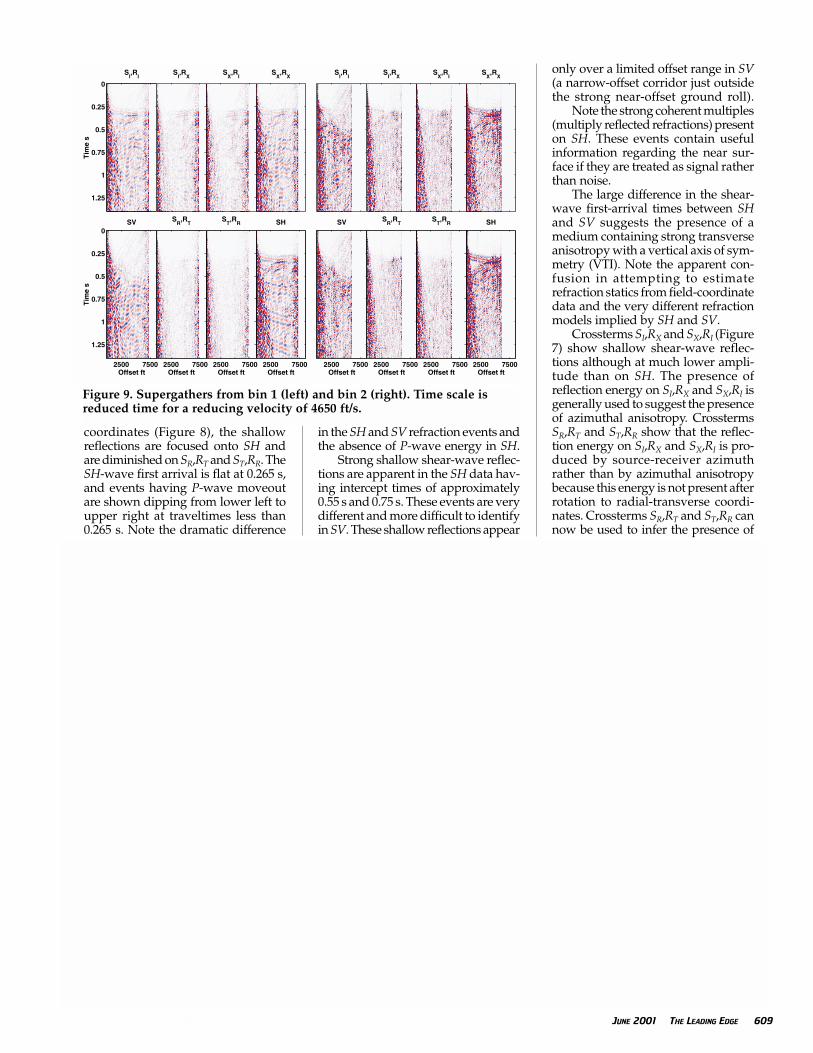
coordinates (Figure 8), the shallowreflections are focused onto SH andare diminished on SR,RT and ST,RR. TheSH-wave first arrival is flat at 0.265 s,and events having P-wave moveoutare shown dipping from lower left toupper right at traveltimes less than0.265 s. Note the dramatic difference
in the SH and SV refraction events andthe absence of P-wave energy in SH.
Strong shallow shear-wave reflec-tions are apparent in the SH data hav-ing intercept times of approximately0.55 s and 0.75 s. These events are verydifferent and more difficult to identifyin SV. These shallow reflections appear
only over a limited offset range in SV(a narrow-offset corridor just outsidethe strong near-offset ground roll).
Note the strong coherent multiples(multiply reflected refractions) presenton SH. These events contain usefulinformation regarding the near sur-face if they are treated as signal ratherthan noise.
The large difference in the shear-wave first-arrival times between SHand SV suggests the presence of amedium containing strong transverseanisotropy with a vertical axis of sym-metry (VTI). Note the apparent con-fusion in attempting to estimaterefraction statics from field-coordinatedata and the very different refractionmodels implied by SH and SV.
Crossterms SI,RX and SX,RI (Figure7) show shallow shear-wave reflec-tions although at much lower ampli-tude than on SH. The presence ofreflection energy on SI,RX and SX,RI isgenerally used to suggest the presenceof azimuthal anisotropy. CrosstermsSR,RT and ST,RR show that the reflec-tion energy on SI,RX and SX,RI is pro-duced by source-receiver azimuthrather than by azimuthal anisotropybecause this energy is not present afterrotation to radial-transverse coordi-nates. Crossterms SR,RT and ST,RR cannow be used to infer the presence of
0000 THE LEADING EDGE JUNE 2001 JUNE 2001 THE LEADING EDGE 609
Figure 9. Supergathers from bin 1 (left) and bin 2 (right). Time scale isreduced time for a reducing velocity of 4650 ft/s.

azimuthal anisotropy. Note that inOBC data processing, RR and RT areused to infer the presence of azimuthalanisotropy, not RI and RX.
Supergathers and spatial location.Mixing of SH, SV, and P-waves isdirectly dependent on source-receiverazimuth. CMP binning produces aspatially variable azimuth (and offset)distribution. As a result, SI,RX andSX,RI, as well as SI,RI and SX,RX varyas a function of spatial location for 3-D acquisition geometries.
We now examine supergathersfrom Survey A as a function of spatiallocation. Data that have a commonmidpoint within a 1000 � 1000 ft bin(bins numbered 1 and 2 in Figure 3)are included in the supergathersshown in Figure 9.
Data from the middle of the sur-vey contain a wide range of source-receiver azimuths in each bin. As aresult, for Bin 1 SI,RI is very similar toSX,RX. Both components contain SH,SV, and P-wave energy in roughlyequal proportions. As a result, identi-fication of the shallow reflections isdifficult.
SI,RX and SX,RI are low amplitudebecause of the wide range of azimuthsincluded. Field-coordinate crosstermshave opposite algebraic sign forsource-receiver azimuths separated by90°. Consequently, when a wideazimuthal range is contained in asupergather bin (or CMP bin), thecrossterms tend to cancel and are loweramplitude.
Rotation to radial-transverse coor-dinates exposes the distinctions
between SH waves and SV waves.Shear-wave reflections are clearly
apparent and enhanced on SH butapparent only over a limited offsetrange on SV. It should be noted thatin these supergathers, we are lookingat a large offset/depth (x/z) range forthe shallow data. In general, at largeincident angles the reflection coeffi-cients of SH and SV are very different,as seen in Figure 2. At small incidenceangles (x/z < 0.5), we expect SV andSH to be more nearly comparable. SHmultiply reflected refractions whichroughly parallel the flattened first-arrival trajectory are obvious.
A wide range of azimuths isinvolved in producing the field-coor-dinate supergathers from bin 1, thusaccounting for the similarity betweenSI,RI and SX,RX. For data obtained froma supergather near the bottom of theprospect (bin 2), field coordinates areessentially the same as radial-trans-verse coordinates due to the limitedsource-receiver azimuth distributionwithin the supergather bin; SI,RI is SV,and SX,RX is SH. Comparison with bin1 shows that wave-mode mixing isindeed dependent on spatial locationof the bin.
Features to note are the very dif-ferent first-arrival times, more identi-fiable reflections on SH, stronger andmore coherent multiples on SH, andreduction of the crossterm energy.Once again, it is difficult to interpretreflection signal on SV, while the SHdata show good-quality reflections.
In Survey A (Figure 3), CMP binsalong the top and bottom of the basemap will have SI,RI as approximately
SV, and SX,RX as approximately SH. Ifthe source distribution extended to theleft and right edges of the base map,the bins along the left and right edgeswould show SI,RI as approximatelySH and SX,RX as approximately SV.Bins interior to the grid would have awider range of source-receiverazimuths, and consequently SI,RI andSX,RX would resemble each other andbe weighted sums of SH, SV, and P-waves. The weights vary as a functionof spatial location (i.e., source-receiverazimuths contained in each bin).Crossterms SI,RX and SX,RI also varywith spatial location and tend to can-cel when a wide range of azimuths iscontained in each bin.
SI,RI and SX,RX vary as a functionof spatial location; SI,RI is SV at somelocations, SH at others, and a weightedsum of SH, SV, and P at yet others. Asimilar situation exists for SX,RX. It hasbeen common to estimate shear-wavestatics and velocities from SI,RI(and/or SX,RX). Clearly, processingshear-wave data in field coordinatesbecomes unnecessarily complicatedbecause of the spatially variable mix-ing of SH, SV, and P-waves.
The SH and SV supergathers fromtwo locations (1000 � 1000 ft bins) arecompared with the corresponding P-wave supergathers (vertical source,vertical receiver) in Figure 10. The SHdata correlate nicely with the P-wavedata; shallow reflections are obvious,high-reflection amplitudes occur whenthe critical angles are reached, and thefirst breaks are quite simple and sug-gest a two-layer refraction model.Multiples in the form of multiplyreflected refractions are much strongerin the SH data than in the P-wave data.
The SV data, meanwhile, aremarkedly more complicated. Shallowreflections are apparent over only anarrow offset/time corridor occurringat offsets just outside of the surface-wave noise cone.
Alford rotation; issues and implica-tions. Alford rotation is strictly validfor only normal-incidence data. At nor-mal incidence, there is no distinctionbetween SV and SH; all particle motionis in the horizontal plane. In theabsence of azimuthal anisotropy, shearwaves generated in orthogonal direc-tions at normal incidence are identicalwaves. In the presence of azimuthalanisotropy, these shear waves are splitwith the vector component parallel tothe principal anisotropy axes travelingfaster and the perpendicular compo-nent traveling slower. Crosstermenergy is produced when the two
610 THE LEADING EDGE JUNE 2001 JUNE 2001 THE LEADING EDGE 0000
Figure 10. P-wave, SH-wave, and SV-wave supergathers from two locations(1000 � 1000 ft bins). Reducing velocities of 9000 and 4650 ft/s are appliedto the P-wave and S-wave data, respectively. P-wave time is shown at theleft, S-wave time at the right.

shear-wave polarizations are at anarbitrary angle (not parallel and per-pendicular) relative to the principalaxes.
Conventionally, coherent energyon crossterms SI,RX and SX,RI has beenused to suggest the presence of shear-wave splitting produced by azimuthalanisotropy. Alford rotation estimatesan anisotropy orientation angle thatproduces a minimization of the energyon SI,RX and SX,RI. The Alfordapproach attempts to estimate theamount of shear-wave splitting in thetransmission path (overburden).
Despite the normal-incidenceassumption, Alford rotation has com-monly been applied to data pre-processed and stacked in fieldcoordinates (with all the inherent prob-lems), as well as to prestack data.
Prestack crossterms (SI,RX andSX,RI) vary greatly as a function ofsource-receiver azimuth for 3-D acqui-sition geometries. This geometry effectis much greater than effects that maybe due to azimuthal anisotropy. It ismost improbable that crosstermenergy caused by azimuthalanisotropy can be detected in fieldcoordinates when the data arerecorded at nonnormal angles of inci-dence.
Field-coordinate data binned as a
function of spatial location (super-gathers, CMP gathers, or CMP stacks)have variable strength crossterms thatvary as a function of spatial location.For example, the supergather data ofFigure 9 yield Alford rotation anglesof 44° for bin 1 and 1° for bin 2. Thefield-coordinate data from bin 1 are aheavy mix of SH, SV, and P-waves.After rotation by 44°, the data resem-ble the field-coordinate data of Figure9 with a slight reduction in thecrossterm energy. Confusion reignsbecause Alford rotation is applied todata binned (and stacked) by spatialposition rather than constant azimuth.
Supergathers in radial-transversecoordinates show that SV data are con-tained on SR,RR at all azimuths andSH data are contained on ST,RT at allazimuths. Crossterms SR,RT and ST,RRare low in amplitude at all azimuthswhen azimuthal anisotropy is not pre-sent. If azimuthal anisotropy is pre-sent, reflections affected by the crackedinterval will produce energy on SR,RTand ST,RR.
The potential now exists to detectand interpret crossterm energy pro-duced by azimuthal anisotropy bymonitoring the SH and SV (along withP and P-SV) reflections from the topand base of the cracked interval (hope-fully, the reservoir!) as a function of off-
set and source-receiver azimuth.Crossterms SR,RT and ST,RR will havemaximum amplitude when thesource-receiver azimuth is at an angleof 45° relative to the orientation of thecracks.
Discussion. Field coordinates mix SH,SV, and P-waves together in variableproportions, confusing attempts atprocessing and interpretation. Field-coordinate processing has emphasizeduse of the Alford rotation for detect-ing the presence of azimuthalanisotropy produced by verticalcracks. Note that Alford rotation isstrictly valid only at normal incidencewhere there is no distinction betweenSH waves and SV waves. Unfortun-ately, the near normal-incidence datareside in the surface wave noise-conein which extraction of the reflectionsignal is most difficult. In field coor-dinates, isolation of the reflection sig-nal is made even more difficultbecause of the mixing of SV-waves, P-waves, and SH-waves (primaries, mul-tiples, and surface waves). Fieldcoordinates are a weighted stack of SHand SV. The weights vary as a func-tion of spatial location because of thevariable source-receiver azimuth of thedata being considered.
Proponents of shear-wave splitting
0000 THE LEADING EDGE JUNE 2001 JUNE 2001 THE LEADING EDGE 611

argue that data found on thecrossterms (SI,RX and SX,RI) are indica-tive of vertical cracks. Our work showsthat source-receiver azimuth, notanisotropy, is the dominant effect.
Supergathers show that the mixinginherent to field coordinates is depen-dent on spatial location within the seis-mic survey. Note that a commonapproach to interpretation is to esti-mate an Alford rotation angle (pre-ferred trend of vertical cracks) as afunction of spatial location. It is diffi-cult to defend this type of analysis if3-D nonzero offset data are used andprocessed in field coordinates unlessthe data used are near-normal inci-dence.
Processing parameters (statics andvelocities) estimated from field coor-dinate data (SI,RI and SX,RX most com-monly) are questionable at best,especially when a wide distribution ofsource-receiver azimuths and offsets ispresent.
We have illustrated some of thebenefits of rotating prestack 3-D shear-wave data into radial-transverse (SV-SH) coordinates on a real 9-C–3-D dataset. SH reflections and SV reflectionsare very different and should betreated as such. Data processing andinterpretation of SH and SV data aremuch more straightforward than treat-ing the data in field coordinates. Shear-wave statics are more easily estimatedfrom SH and found to be much smallerthan those estimated by commercialprocessing shops that processed thesedata sets in field coordinates. In ourwork to date with three 3-D–9-C datasets, we have not seen a need to esti-mate independent static solutions forSH and SV.
Rotation of field-coordinate datainto radial-transverse coordinates pro-duces true separation of SH data fromSV data in the context of an isotropic,flat-layered earth. One of our 3-D–9-Cdata sets was acquired in a structurallycomplex area. A geophysical contrac-tor processed the SI,RI; SX,RX, SV, andSH data volumes through to CDPstack. The SH data (strictly the ST,RTdata) were much more interpretablethan any of the other shear-wave data.
Prior researchers of 9-C–3-D datahave stated that the optimum shear-wave “reflection window” occurs atthe nearer source-receiver offsets. Thisobservation likely arises because offield coordinates and the relatively vio-lent AVO behavior of SV reflections (ascompared with SH).
When azimuthal anisotropy isunimportant, initial rotation to SV andSH is clearly suggested. When
azimuthal anisotropy is important, wesuggest two choices. If signal to noiseis adequate at short offsets and theincidence angle is near zero, we canattempt a conventional approach torotate to the symmetry axis (Alfordrotation). We note that preprocessingof such data in field coordinates is gen-erally not recommended, for reasonsdiscussed above. This will likelyrequire the use of powerful source andreceiver arrays to reduce the groundroll and expose the shear-wave reflec-tion signal on the near-offset data.
Second, we can make use of the fulloffset range, rotate to SH and SV coor-dinates, and retain all nine data com-ponents in a set of limited azimuthand offset bins. This latter approach isthat conventionally used in 3-D marineconverted wave surveys. Atest of thesesuggestions on real data with signifi-cant azimuthal anisotropy remains tobe completed.
Summary. We have observed strikingdifferences between the radial shear-wave response (SV) and the transverse(SH) response in the 9-C 3-D sets thatwe have begun to analyze. Initial rota-tion of field data from field coordi-nates to radial-transverse coordinatesis a key initial step in the analysis, pro-cessing, and interpretation of thesedata. The transverse, or SH, data aresimple, robust, and responsive to sim-ple analysis and processing. We sug-gest that the analysis and processingof 3-D P-wave and SH-wave data arethe logical first steps in dealing with9-C–3-D data. Given those results, oneshould be better positioned to dealwith the other components (SV andconverted waves), and with other com-plications, such as azimuthalanisotropy.
The SH wave response is not avail-able from offshore data. We feel that9-C onshore data can be beneficial invalidating converted-wave processingand interpretation methodologiesbecause the SH data are available.
The potential added value of theSH response to subsurface definitionremains to be evaluated. There areintriguing possibilities, but the mostsignificant issue to be addressed is thevertical resolution available for SHwave response. In our data sets, sim-ple approaches have yielded effectivevertical resolution that is a factor of twoworse than that for P waves. This res-olution problem should be less severefor converted waves and might bereversed in some applications forlocally converted waves (convertedwaves that propagate as S over a lim-
ited depth interval).Azimuthal anisotropy presents a
particular challenge and opportunity.On land, some have approached theproblem by restricting the data to verysmall offsets and have attempted todeal with the overwhelming groundroll interference by the use of sourceand receiver arrays and/or abundanttrace mixing in data processing. Thealternative approach is to produce databinned in range and azimuth (vectoroffset) and midpoint, such that it canbe combined into appropriate sub-stacks for analysis and interpretation.Azimuthal anisotropy effects can thenbe recognized and analyzed by mon-itoring the reflection signal (in radial-transverse coordinates) from the topand the base of the fractured reservoirinterval as a function of offset andazimuth. Reflections from the base ofa fractured interval may be more sen-sitive to the fractures than reflectionsfrom the top because the base reflec-tions have traveled through thecracked interval. We anticipate that SHdata may be most responsive whenanalyzed in this manner.
There are many important issuesto be addressed in the effective uti-lization of 9-C–3-D data in particularand multicomponent seismic data ingeneral. At this point, a rich and fairlyuniform distribution of data in vectorrange (azimuth and offset) is sug-gested for each depth-point bin.
There is much work to do, and itshould be fun.
Suggested reading. “Comparison ofAVO indicators: A modeling study” byCastagna and Smith (GEOPHYSICS, 1994).“Applications of vector coordinate sys-tems of 3-D converted wave data” byGaiser (TLE, 1999). “Case history: 3-Dshear-wave processing and interpreta-tion in radial-transverse (SV-SH) coor-dinates” by Simmons et al. (SEGExpanded Abstracts, 1999). “The 3-D shearexperiment over the Natih Field inOman: Reservoir geology, data acquisi-tion, and anisotropy analysis” by Potterset al. (Geophysical Prospecting, 1999).
Acknowledgments: Thanks to GuillaumeCambois for reviewing the manuscript. BobHardage and Bob Graebner developed theresearch program under which these data wererecorded. Data were provided to the Bureau ofEconomic Geology by Visos Exploration andPGS Onshore. Thanks are extended to the spon-sors of the Seismic Vector Wavefield Consortiumat the Bureau of Economic Geology, TheUniversity of Texas at Austin, for their finan-cial support.
Corresponding author: [email protected]
612 THE LEADING EDGE JUNE 2001 JUNE 2001 THE LEADING EDGE 0000


![FINITE REFLECTION GROUPS · 1959] FINITE REFLECTION GROUPS 497 Proof. By 3.1, S leaves each point of £(2) fixed and maps each point orthogonal to £(2) on its antipode. Hence if](https://img.dokumen.tips/doc/110x75/5f481d909e50be6f657d29e8/finite-reflection-1959-finite-reflection-groups-497-proof-by-31-s-leaves-each.jpg)