Embed Size (px)
Citation preview

Steben & Company, Inc. 4/25/2017
Shattering Illusions 1
Shattering Illusions:Which Alternatives Have Actually Delivered in Bull versus Bear Markets?
FOR BROKER DEALER AND RIA USE ONLY. NOT TO BE USED WITH THE GENERAL PUBLIC.
Agenda
• Asymmetric Market Risks
• Return Enhancers vs.
John DolfinChief Investment Officer
Return Enhancers vs. Diversifiers in Bull & Bear Markets
• The Impact of A Rise in Volatility
• Steben & Company’s Diversifiers
• Joined Steben in 2011
• Formerly Managing Director at SAFANAD, Inc. and Head of Macro & CTA Strategies at Merrill Lynch
• BA in Philosophy, Politics and Economics from the University of Oxford; MPhil in Economics from Yale University
• Chartered Financial Analyst®
FOOTER “FOR USE” DISCLOSURE 2THIS PRESENTATION IS FOR USE ONLY BY BROKER DEALERS AND REGISTERED INVESTMENT ADVISORS WITH THEIR ACCREDITED CLIENTS. 2FOR BROKER DEALER AND RIA USE ONLY. 2

Steben & Company, Inc. 4/25/2017
Shattering Illusions 2
Asymmetric Market Risks
2500
S&P 500 IndexMarch 1962 – March 2017
Stock Bull 16
18US 10Y Treasury Yield
March 1962 – March 2017
Bull Markets: Entering 9th Year for Stocks, 36th Year for Bonds
1000
1500
2000Market Since
2009
6
8
10
12
14
Bo
nd
Yie
ld %
Bond Bull Market (Declining Yields)
Since 1981
FOOTER “FOR USE” DISCLOSURE 4THIS PRESENTATION IS FOR USE ONLY BY BROKER DEALERS AND REGISTERED INVESTMENT ADVISORS WITH THEIR ACCREDITED CLIENTS. 4FOR BROKER DEALER AND RIA USE ONLY. 4
0
500
1962
1967
1972
1977
1982
1987
1992
1997
2002
2007
2012
2017
0
2
4
1962
1967
1972
1977
1982
1987
1992
1997
2002
2007
2012
2017
PAST PERFORMANCE IS NOT NECESSARILY INDICATIVE OF FUTURE RESULTS. DIVERSIFICATION DOES NOT ASSURE A PROFIT ORGUARANTEE A LOSS. Source: Bloomberg. See Glossary for definitions.

Steben & Company, Inc. 4/25/2017
Shattering Illusions 3
Should Equity Return Expectations Be Set at Zero?
20%
S&P 500 Shiller P/E Valuation Decile &Average Subsequent 5-Year Annualized Returns
January 1928 – March 2017
5%
10%
15%
bse
qu
ent
5Y
An
nu
aliz
ed R
OR
We are in the mostexpensive decile today
FOOTER “FOR USE” DISCLOSURE 5THIS PRESENTATION IS FOR USE ONLY BY BROKER DEALERS AND REGISTERED INVESTMENT ADVISORS WITH THEIR ACCREDITED CLIENTS. 5FOR BROKER DEALER AND RIA USE ONLY. 5
PAST PERFORMANCE IS NOT NECESSARILY INDICATIVE OF FUTURE RESULTS. DIVERSIFICATION DOES NOT ASSURE A PROFIT ORGUARANTEE A LOSS. Source: Yale University, Bloomberg. Each monthly date from 1928–2017 is assigned to an S&P 500 valuation decile based on theShiller P/E ratio in that month compared to the historical range. For each decile, the average annualized return for a subsequent 5 year investment in theS&P 500 is then computed. See Glossary for definitions.
-5%
0%1 2 3 4 5 6 7 8 9 10
Su
S&P 500 Shiller P/E Decile
Stocks Cheap Stocks Expensive
Higher Equity P/Es May Be Followed by Larger Drawdowns
S&P 500 Shiller P/E Decile
S&P 500 Shiller P/E Valuation Decile &Average Subsequent 5 Year Max Drawdown
January 1928 – March 2017
Stocks Cheap Stocks Expensive
-25%
-20%
-15%
-10%
-5%
0%1 2 3 4 5 6 7 8 9 10
eq
uen
t 5
Y M
ax D
raw
do
wn
S&P 500 Shiller P/E Decile
FOOTER “FOR USE” DISCLOSURE 6THIS PRESENTATION IS FOR USE ONLY BY BROKER DEALERS AND REGISTERED INVESTMENT ADVISORS WITH THEIR ACCREDITED CLIENTS. 6FOR BROKER DEALER AND RIA USE ONLY. 6
PAST PERFORMANCE IS NOT NECESSARILY INDICATIVE OF FUTURE RESULTS. DIVERSIFICATION DOES NOT ASSURE A PROFIT ORGUARANTEE A LOSS. Source: Yale University, Bloomberg. Each monthly date from 1928–2017 is assigned to an S&P 500 valuation decile based on theShiller P/E ratio in that month compared to the historical range. For each decile, we then compute the average size of the inception-to-valley loss experiencedfor an investment in the S&P 500 held over the subsequent 5 years. See Glossary for definitions.
-40%
-35%
-30%
25%
Su
bs
e
We are in the most expensive
decile today

Steben & Company, Inc. 4/25/2017
Shattering Illusions 4
Recent Positive Economic News Led by Sentiment, Not Hard Data
1.5
2.0
2.5
Da
ta
Bloomberg US Economic SurpriseSentiment vs. Hard Data Sub-Indices
January 2000 – March 2017
Recent strengthhas come only from
-1.5
-1.0
-0.5
0.0
0.5
1.0
d D
evia
tio
ns
bet
we
en E
con
om
ice
lea
se
s &
An
aly
st
Ex
pe
cta
tio
ns sentiment surveys, not
hard data
FOOTER “FOR USE” DISCLOSURE 7THIS PRESENTATION IS FOR USE ONLY BY BROKER DEALERS AND REGISTERED INVESTMENT ADVISORS WITH THEIR ACCREDITED CLIENTS. 7FOR BROKER DEALER AND RIA USE ONLY. 7
PAST PERFORMANCE IS NOT NECESSARILY INDICATIVE OF FUTURE RESULTS. DIVERSIFICATION DOES NOT ASSURE A PROFIT ORGUARANTEE A LOSS. Source: Bloomberg. The Bloomberg Economic Surprise Index shows the difference, in standard deviations, between analystforecasts and the published value of economic data releases. The Bloomberg Economic Surprise Index includes the Sentiment Surprise Index and the HardData Surprise Index. The Sentiment Surprise measure uses the Surveys and Business Cycle Indicators sub-index. The Hard Data Surprise measureaverages the sub-indices for the Industrial Sector, Housing and Real Estate Market, Labor Market, Personal/Household Sector and Retail & WholesaleSector. See Glossary for definitions.
-2.5
-2.0
2000 2001 2002 2003 2004 2005 2006 2007 2008 2009 2010 2011 2012 2013 2014 2015 2016 2017
Sta
nd
ard
Re
Bloomberg Sentiment Surprise
Bloomberg Hard Data Surprise
Stocks Not Reflecting Global Policy Risk
Policy risk has risen dramatically, while
60
70
300
350 Global Policy Uncertainty Index vs. VIX IndexJanuary 1997 – March 2017
Global Policy Uncertainty Index (LHS)
VIX (RHS)investor risk aversion
has fallen
20
30
40
50
100
150
200
250
VIX
Ind
ex
Glo
bal
Po
licy
Un
cert
ain
ty I
nd
ex
FOOTER “FOR USE” DISCLOSURE 8THIS PRESENTATION IS FOR USE ONLY BY BROKER DEALERS AND REGISTERED INVESTMENT ADVISORS WITH THEIR ACCREDITED CLIENTS. 8FOR BROKER DEALER AND RIA USE ONLY. 8
PAST PERFORMANCE IS NOT NECESSARILY INDICATIVE OF FUTURE RESULTS. DIVERSIFICATION DOES NOT ASSURE A PROFIT ORGUARANTEE A LOSS. Source: Bloomberg. The Global Policy Uncertainty Index tracks news media keywords related to economic policy uncertainty indeveloped markets. The VIX Index is a market implied volatility measure for the S&P 500, reflecting the price investors are willing to pay to buy optioninsurance. See Glossary for definitions.
0
10
0
50
1997
1998
1999
2000
2001
2002
2003
2004
2005
2006
2007
2008
2009
2010
2011
2012
2013
2014
2015
2016
2017
G

Steben & Company, Inc. 4/25/2017
Shattering Illusions 5
Key Takeaways
• Asymmetric risks in extended stock and bond bull markets
• High valuations suggest long term stock performance may be flat from h ith i k f l d dhere, with risk of large drawdowns
• Positive economic data has been driven by sentiment, which can reverse if there is policy disappointment
• Market volatility and investor risk aversion are abnormally low given high levels of policy risk
FOOTER “FOR USE” DISCLOSURE 9THIS PRESENTATION IS FOR USE ONLY BY BROKER DEALERS AND REGISTERED INVESTMENT ADVISORS WITH THEIR ACCREDITED CLIENTS. 9FOR BROKER DEALER AND RIA USE ONLY. 9
Return Enhancers vs. Diversifiers in Bull & Bear Markets

Steben & Company, Inc. 4/25/2017
Shattering Illusions 6
Long-Only Alts Have Risks Highly Correlated to Equities
1.00
1.20
1.40Beta of Alternative Investment Asset Classes to S&P 500
Since Inception or All Available Data | January 1990 – February 2017
Since Inception or All Available Data Since Jan 1990
-0.20
0.00
0.20
0.40
0.60
0.80
BDC REIT C diti MLP P i t E it H d F d M d
Be
ta t
o S
&P
50
0
Last 10 Years
FOOTER “FOR USE” DISCLOSURE 11THIS PRESENTATION IS FOR USE ONLY BY BROKER DEALERS AND REGISTERED INVESTMENT ADVISORS WITH THEIR ACCREDITED CLIENTS. 11FOR BROKER DEALER AND RIA USE ONLY. 11
PAST PERFORMANCE IS NOT NECESSARILY INDICATIVE OF FUTURE RESULTS. DIVERSIFICATION DOES NOT ASSURE A PROFIT ORGUARANTEE A LOSS. Source: Bloomberg, Pertrac. Index returns are for illustrative purposes only and do not represent the performance of any fund. Weuse monthly data from January 1990 through February 2017, except where index commenced after January 1990 as noted below. BDCs are representedby the Wells Fargo BDC Index, which begins in October 2004. REITs are represented by the Dow Jones REIT Index, which begins in February 1990.Commodities are represented by the S&P GSCI® TR Index. MLPs are represented by the Alerian MLP Index, which begins in January 1996. PrivateEquity is represented by the Cambridge Associates US Private Equity Index, which is quarterly and ends in September 2016. Hedge Funds arerepresented by the HFRI Fund Weighted Composite. Managed Futures are represented by the Barclay Systematic Traders Index. See Glossary fordetailed index information.
BDCs REITs Commodities MLPs Private Equity Hedge Funds Managed Futures
Long-Only Alternatives L/S Alternatives
Hedge Funds Are Not Identical: Correlated Equity Risk Varies
0.80
1.00 Beta of Hedge Fund Strategies to S&P 500January 1990 – February 2017
0 00
0.20
0.40
0.60
Since 1990
Last 10 Years
FOOTER “FOR USE” DISCLOSURE 12THIS PRESENTATION IS FOR USE ONLY BY BROKER DEALERS AND REGISTERED INVESTMENT ADVISORS WITH THEIR ACCREDITED CLIENTS. 12FOR BROKER DEALER AND RIA USE ONLY. 12
PAST PERFORMANCE IS NOT NECESSARILY INDICATIVE OF FUTURE RESULTS. DIVERSIFICATION DOES NOT ASSURE A PROFIT ORGUARANTEE A LOSS. Source: Bloomberg. Index returns are for illustrative purposes only and do not represent the performance of any fund. We usemonthly data beginning from January 1990 to February 2017. HFRI Strategy Indices are used in all cases except for Managed Futures, which uses theBarclay Systematic Traders Index. See Glossary for detailed index information.
-0.20
0.00
Equity L/S Event Driven Relative Value Equity Market Neutral
Global Macro Managed Futures

Steben & Company, Inc. 4/25/2017
Shattering Illusions 7
E it M k t N t l
Managed Futures
Average Performance in Positive / Negative S&P 500 MonthsSince Inception or All Available Data January 1990 – February 2017
Positive S&P Months
Return Enhancers vs. Diversifiers in Up/Down Equity Months
REITs
MLPs
Equity L/S
Private Equity
Event Driven
Commodities
Global Macro
Relative Value
Equity Market Neutral Negative S&P MonthsDiversifiers
ReturnEnhancers
FOOTER “FOR USE” DISCLOSURE 13THIS PRESENTATION IS FOR USE ONLY BY BROKER DEALERS AND REGISTERED INVESTMENT ADVISORS WITH THEIR ACCREDITED CLIENTS. 13FOR BROKER DEALER AND RIA USE ONLY. 13
-5% -4% -3% -2% -1% 0% 1% 2% 3% 4% 5%
BDCs
PAST PERFORMANCE IS NOT NECESSARILY INDICATIVE OF FUTURE RESULTS. DIVERSIFICATION DOES NOT ASSURE A PROFIT ORGUARANTEE A LOSS. Source: Bloomberg, Pertrac. Index returns are for illustrative purposes only and do not represent the performance of any fund. Weuse monthly data from January 1990 through February 2017, except where index commenced after January 1990 as noted below. BDCs are representedby the Wells Fargo BDC Index, which begins in October 2004. REITs are represented by the Dow Jones REIT Index, which begins in February 1990.Commodities are represented by the Goldman Sachs Commodities Index. MLPs are represented by the Alerian MLP Index, which begins in January 1996.Private Equity is represented by the Cambridge Associates US Private Equity Index, which is quarterly and ends in September 2016. Equity L/S. EventDriven, Global Macro, Relative Value and Equity Market Neutral are represented by the respective HFRI Strategy Indices. Managed Futures arerepresented by the Barclay Systematic Traders Index. See Glossary for detailed index information.
Performance During Equity Crises Stronger for Diversifiers
16%20%BDCs REITs Commodities Equity L/S Event Driven Private Equity MLPs Relative Value
Equity Market Neutral Global Macro
Managed Futures
od
s
Annualized ROR in Periods When S&P 500 Falls More than 10%Since Inception or All Available Data January 1990 – February 2017
-56%
-27%
-20%-14%
-11% -11%-7%
-3%
1% 3%
-60%
-50%
-40%
-30%
-20%
-10%
0%
10%
nu
aliz
ed R
OR
in
S&
P C
risi
s P
erio
FOOTER “FOR USE” DISCLOSURE 14THIS PRESENTATION IS FOR USE ONLY BY BROKER DEALERS AND REGISTERED INVESTMENT ADVISORS WITH THEIR ACCREDITED CLIENTS. 14FOR BROKER DEALER AND RIA USE ONLY. 14
PAST PERFORMANCE IS NOT NECESSARILY INDICATIVE OF FUTURE RESULTS. DIVERSIFICATION DOES NOT ASSURE A PROFIT ORGUARANTEE A LOSS. Source: Bloomberg, Pertrac. Index returns are for illustrative purposes only and do not represent the performance of any fund. Weuse monthly data from January 1990 through February 2017, except where index commenced after January 1990 as noted below. S&P 500 Crisis Periodsinclude Nov 2007 – Feb 2009, Sep 2000 – Sep 2002, May 2011 – Sep 2011, Jul 1998 – Aug 1998, Jan 1990 – Oct 1990, May 2010 – Jun 2010. BDCs arerepresented by the Wells Fargo BDC Index, which begins in October 2004. REITs are represented by the Dow Jones REIT Index, which begins in February1990. Commodities are represented by the Goldman Sachs Commodities Index. MLPs are represented by the Alerian MLP Index, which begins in January1996. Private Equity is represented by the Cambridge Associates US Private Equity Index, which is quarterly and ends in September 2016. Equity L/S.Event Driven, Global Macro, Relative Value and Equity Market Neutral are represented by the respective HFRI Strategy Indices. Managed Futures arerepresented by the Barclay Systematic Traders Index. See Glossary for detailed index information.
An
n
Return Enhancers Diversifiers

Steben & Company, Inc. 4/25/2017
Shattering Illusions 8
Return Enhancers Have Bigger Drawdowns than Diversifiers
8%11% 11% 10% 12% 11% 9%
6%10%
6%
20%Commodities BDCs REITs MLPs Private Equity Equity L/S Event Driven
Relative Value
Managed Futures Global Macro
Equity Market Neutral
Worst Peak-to-Valley Drawdown vs. Annualized RORSince Inception or All Available Data January 1990 – February 2017
An
nu
aliz
edR
OR
%
-73%-68%
-48%-46%
-31%
-25%
-18%-12% -11% -9%
1%6% 6%
-80%
-60%
-40%
-20%
0%
Wo
rst
Pea
k-to
-Val
ley
Dra
wd
ow
n %
FOOTER “FOR USE” DISCLOSURE 15THIS PRESENTATION IS FOR USE ONLY BY BROKER DEALERS AND REGISTERED INVESTMENT ADVISORS WITH THEIR ACCREDITED CLIENTS. 15FOR BROKER DEALER AND RIA USE ONLY. 15
PAST PERFORMANCE IS NOT NECESSARILY INDICATIVE OF FUTURE RESULTS. DIVERSIFICATION DOES NOT ASSURE A PROFIT ORGUARANTEE A LOSS. Source: Bloomberg, Pertrac. Index returns are for illustrative purposes only and do not represent the performance of any fund. Weuse monthly data from January 1990 through February 2017, except where index commenced after January 1990 as noted below. BDCs are represented bythe Wells Fargo BDC Index, which begins in October 2004. REITs are represented by the Dow Jones REIT Index, which begins in February 1990.Commodities are represented by the S&P 500 GSCI® TR Index. MLPs are represented by the Alerian MLP Index, which begins in January 1996. PrivateEquity is represented by the Cambridge Associates US Private Equity Index, which is quarterly and ends in September 2016. Equity L/S. Event Driven,Global Macro, Relative Value and Equity Market Neutral are represented by the respective HFRI Strategy Indices. Managed Futures are represented by theBarclay Systematic Traders Index. See Glossary for detailed index information.
-81%
-100%
W
Return Enhancers Diversifiers
10%
Rate of Return on Alts Needed to ImproveTraditional Portfolio Sharpe vs. Correlations
Low correlation Diversifiers improve
High correlation Return Enhancers need a
higher return to
Modern Portfolio TheoryLow Correlation Diversifiers May Improve Portfolio Sharpe
-2%
0%
2%
4%
6%
8%
-1.0 -0.8 -0.6 -0.4 -0.2 0.0 0.2 0.4 0.6 0.8 1.0
RO
R %
Diversifiers improve Sharpe even with a
gimprove Sharpe
Breakeven Line
FOOTER “FOR USE” DISCLOSURE 16THIS PRESENTATION IS FOR USE ONLY BY BROKER DEALERS AND REGISTERED INVESTMENT ADVISORS WITH THEIR ACCREDITED CLIENTS. 16FOR BROKER DEALER AND RIA USE ONLY. 16
-4%
Correlation to Traditional Portfolio
NOTE: The analysis uses a traditional 60/40 stock and bond portfolio, consisting of the S&P 500 TR Index and the Barclays Aggregate Bond Index. Over theperiod Jan 1990 – Feb 2017, this traditional portfolio would have achieved an ROR of 8.4%, with a volatility of 9.0% and a Sharpe ratio of 0.60. We combinethe traditional 60/40 portfolio with a hypothetical Alternative Investment with volatility of 8.9%, assigning 80% weight to the Traditional portfolio and 20%weight to the Alternative Investment. We compute the minimum ROR that the Alternative Investment would need to generate to improve the Sharpe ratio ofthe combined Traditional/Alternative portfolio (y-axis), under varying correlation assumptions between the Traditional portfolio and Alternative investment(x-axis). PAST PERFORMANCE IS NOT NECESSARILY INDICATIVE OF FUTURE RESULTS. DIVERSIFICATION DOES NOT ASSURE A PROFIT ORGUARANTEE A LOSS. Source: Bloomberg. See Glossary for definitions.
Breakeven Line

Steben & Company, Inc. 4/25/2017
Shattering Illusions 9
Key Takeaways
• Return Enhancers: bull market performers, but high drawdown risk in bear markets. Higher return threshold before they improve portfolio Sharpe, due to high correlation
• Diversifiers: moderate gains in bull markets, often flat/positive in bear markets, with l d d i k L t th h ld b f th i tf li Sh dlower drawdown risk. Lower return threshold before they improve portfolio Sharpe, due to low correlation
• Return Enhancer Examples:
‒ Long Only Alts: BDCs, REITs, MLPs, Private Equity, Commodities
‒ L/S Strategies with Long-Bias: Equity L/S, Event Driven
• Diversifier Examples:
FOOTER “FOR USE” DISCLOSURE 17THIS PRESENTATION IS FOR USE ONLY BY BROKER DEALERS AND REGISTERED INVESTMENT ADVISORS WITH THEIR ACCREDITED CLIENTS. 17FOR BROKER DEALER AND RIA USE ONLY. 17
‒ Balanced L/S strategies: Equity Market Neutral, Relative Value
‒ Tactical L/S strategies: Managed Futures, Global Macro
‒ Balanced Versions of Return Enhancer Strategies: Low Beta Managers within Equity L/S, Event Driven

Steben & Company, Inc. 4/25/2017
Shattering Illusions 10
Is the Current Low Equity Volatility Sustainable?
3.5%
0Average Absolute Daily % Change in S&P 500
By Quarter | Q1 1928 – Q1 2017
Q1 2017 : 0 32%
1.0%
1.5%
2.0%
2.5%
3.0%
olu
te D
aily
% C
han
ge
in S
&P
50
0 Q1 2017 : 0.32%Lowest Quarter
Since 1967
FOOTER “FOR USE” DISCLOSURE 19THIS PRESENTATION IS FOR USE ONLY BY BROKER DEALERS AND REGISTERED INVESTMENT ADVISORS WITH THEIR ACCREDITED CLIENTS. 19FOR BROKER DEALER AND RIA USE ONLY. 19
PAST PERFORMANCE IS NOT NECESSARILY INDICATIVE OF FUTURE RESULTS. DIVERSIFICATION DOES NOT ASSURE A PROFIT ORGUARANTEE A LOSS. We use daily S&P 500 data to calculate the average absolute daily percentage change for each quarter starting in Q1 1928. Source:Bloomberg. See Glossary for definitions.
0.0%
0.5%
1928 1938 1948 1958 1968 1978 1988 1998 2008 2018
Ave
rag
e A
bs
o
Which Alts Perform Best In Rising and Falling Volatility
4%
6%
3 Month Alt Index % ROR vs. VIX Index % Change: Line of Best FitAll Available Data January 1990 – February 2017
Managed Futures
-4%
-2%
0%
2%
4%
-50% -25% 0% 25% 50% 75% 100%
Mo
nth
Alt
In
dex
Per
form
ance
Other Diversifiers
Return Enhancers
FOOTER “FOR USE” DISCLOSURE 20THIS PRESENTATION IS FOR USE ONLY BY BROKER DEALERS AND REGISTERED INVESTMENT ADVISORS WITH THEIR ACCREDITED CLIENTS. 20FOR BROKER DEALER AND RIA USE ONLY. 20
Source: Bloomberg, Pertrac. This data represents past performance and is no guarantee of future results. Index returns are for illustrative purposes only anddo not represent the performance of any fund. Using monthly data, we measure percentage changes in the VIX Index and coinciding returns for variousAlternative Indices over rolling 3-month windows from Jan 1990 to Feb 2017. Managed Futures is represented by the Barclay Systematic Traders Index.Other Diversifiers are represented by an equally weighted average of the HFRI Relative Value, Equity Market Neutral and Macro Indices. Return Enhancersare represented by an equally weighted average of the Wells Fargo BDC Index, Dow Jones REIT Index, Alerian MLP Index, GSCI Index, CambridgeAssociates US Private Equity Index, and HFRI Equity Hedge and Event Driven Indices. A 2nd-order polynomial line of best fit is used to represent therelationship between changing volatility and performance. See Glossary for definitions.
-6%
3-M
3-Month % Change in VIX Index
Falling Volatility Rising Volatility

Steben & Company, Inc. 4/25/2017
Shattering Illusions 11
“Long Vol” Trading Strategy ExampleEquity Market Neutral | ETF Arbitrage
$4
$5
NA
ViShares MSCI Japan ETF Premium/Discount to NAV
March 1996 – March 2017
LargerArbitrage Profit
Potential
$3
-$2
-$1
$0
$1
$2
$3
er S
har
e P
rem
ium
/ D
isco
un
t to
SmallerArbitrage Profit
L
FOOTER “FOR USE” DISCLOSURE 21THIS PRESENTATION IS FOR USE ONLY BY BROKER DEALERS AND REGISTERED INVESTMENT ADVISORS WITH THEIR ACCREDITED CLIENTS. 21FOR BROKER DEALER AND RIA USE ONLY. 21
Source: Bloomberg. This data represents past performance and is no guarantee of future results. Trade examples are for illustrative purposes only and do notnecessarily reflect actual positions in manager portfolios.
-$5
-$4
-$3
1996
1997
1998
1999
2000
2001
2002
2003
2004
2005
2006
2007
2008
2009
2010
2011
2012
2013
2014
2015
2016
2017
ET
F P
rice
P LargerArbitrage Profit
Potential
Key Takeaways
• In flat or falling equity market volatility environments, Return Enhancer strategies outperform Diversifiers
H l tilit i t lti d d l t d th b• However, volatility is at multi-decade lows today, so there may be an asymmetric probability of rising volatility in the future
• In rising volatility environments, Diversifiers (particularly Managed Futures) tend to outperform
• When constructing client portfolios, “long volatility” Diversifier strategies could balance “short volatility” risk from Return Enhancer strategies
FOOTER “FOR USE” DISCLOSURE 22THIS PRESENTATION IS FOR USE ONLY BY BROKER DEALERS AND REGISTERED INVESTMENT ADVISORS WITH THEIR ACCREDITED CLIENTS. 22FOR BROKER DEALER AND RIA USE ONLY. 22
y g

Steben & Company, Inc. 4/25/2017
Shattering Illusions 12
Steben Select Multi-Strategy Fund
IMPORTANT DISCLOSURES & RISK CONSIDERATIONS Risks include the possible loss of principal. Steben Select Multi-StrategyFund is part of a master-feeder structure and invests in a closed-end, non-diversified investment company with the same objectives andstrategies (Master Fund), which in turn invests in hedge funds (Portfolio Funds). Fund investors will bear fees and expenses of the Fund,which includes the Fund’s pro rata portion of the fees and expenses of the Master Fund and indirectly of the Portfolio Funds (includingwhich includes the Fund s pro rata portion of the fees and expenses of the Master Fund and, indirectly, of the Portfolio Funds (includingperformance fees). An investment in the Fund is speculative. There is no guarantee that the Fund will achieve its investmentobjectives. Any investment should be viewed as part of an overall investment program and should only be made by investors willing toundertake the risk involved. Diversification among multiple hedge funds does not assure profit or guarantee against a loss. ThePortfolio Funds may be highly leveraged, be highly illiquid and invest substantially in a particular market or sector. As a result, thePortfolio Funds (as well as the Fund) may be subject to greater risk and volatility than if investments had been made in the securities orderivatives of a broader range of issuers. The Fund’s performance depends on the performance of the Portfolio Funds and theInvestment Manager’s ability to allocate Fund assets among Portfolio Funds. The Fund’s shares are not listed on any securitiesexchange, and it is not anticipated that a secondary market for shares will develop. The Fund cannot guarantee that investorswill be able to effect repurchases of as many shares as they request. For other risks and investor concerns and suitability, pleasesee Important Disclosures & Risks for Steben Select Multi-Strategy Fund.
Foreside Fund Services, LLC, Distributor
Steben & Company, Inc. 4/25/2017
Shattering Illusions 13
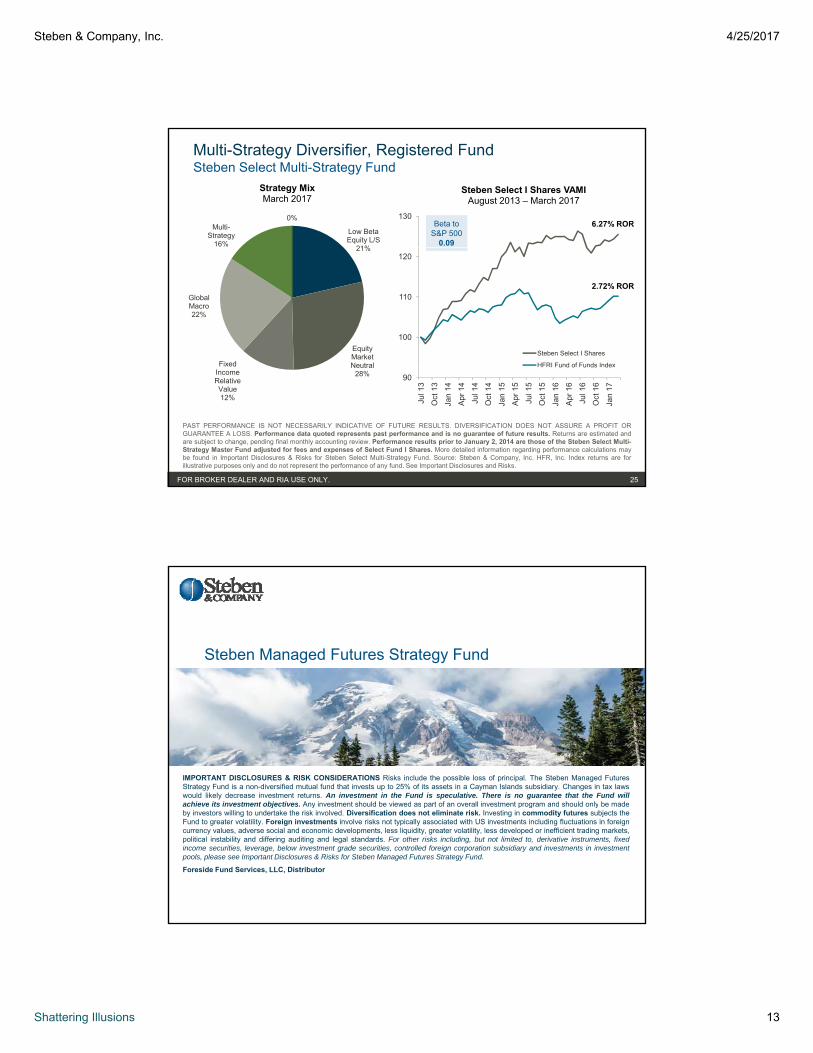
Multi-Strategy Diversifier, Registered FundSteben Select Multi-Strategy Fund
130
Steben Select I Shares VAMIAugust 2013 – March 2017
Low Beta Equity L/S
21%
Multi-Strategy
16%
0%
Strategy MixMarch 2017
Beta to S&P 500
0.09
6.27% ROR
100
110
120
Steben Select I Shares
HFRI Fund of Funds Index
21%
Equity Market NeutralFixed
Global Macro22%
2.72% ROR
FOOTER “FOR USE” DISCLOSURE 25THIS PRESENTATION IS FOR USE ONLY BY BROKER DEALERS AND REGISTERED INVESTMENT ADVISORS WITH THEIR ACCREDITED CLIENTS. 25FOR BROKER DEALER AND RIA USE ONLY. 25
90
Jul 1
3
Oct
13
Jan
14
Ap
r 1
4
Jul 1
4
Oct
14
Jan
15
Ap
r 1
5
Jul 1
5
Oct
15
Jan
16
Ap
r 1
6
Jul 1
6
Oct
16
Jan
17
u d o u ds deNeutral28%Income
Relative Value12%
PAST PERFORMANCE IS NOT NECESSARILY INDICATIVE OF FUTURE RESULTS. DIVERSIFICATION DOES NOT ASSURE A PROFIT ORGUARANTEE A LOSS. Performance data quoted represents past performance and is no guarantee of future results. Returns are estimated andare subject to change, pending final monthly accounting review. Performance results prior to January 2, 2014 are those of the Steben Select Multi-Strategy Master Fund adjusted for fees and expenses of Select Fund I Shares. More detailed information regarding performance calculations maybe found in Important Disclosures & Risks for Steben Select Multi-Strategy Fund. Source: Steben & Company, Inc. HFR, Inc. Index returns are forillustrative purposes only and do not represent the performance of any fund. See Important Disclosures and Risks.
Steben Managed Futures Strategy Fund
IMPORTANT DISCLOSURES & RISK CONSIDERATIONS Risks include the possible loss of principal. The Steben Managed FuturesStrategy Fund is a non-diversified mutual fund that invests up to 25% of its assets in a Cayman Islands subsidiary. Changes in tax lawswould likely decrease investment returns. An investment in the Fund is speculative. There is no guarantee that the Fund willachieve its investment objectives Any investment should be viewed as part of an overall investment program and should only be madeachieve its investment objectives. Any investment should be viewed as part of an overall investment program and should only be madeby investors willing to undertake the risk involved. Diversification does not eliminate risk. Investing in commodity futures subjects theFund to greater volatility. Foreign investments involve risks not typically associated with US investments including fluctuations in foreigncurrency values, adverse social and economic developments, less liquidity, greater volatility, less developed or inefficient trading markets,political instability and differing auditing and legal standards. For other risks including, but not limited to, derivative instruments, fixedincome securities, leverage, below investment grade securities, controlled foreign corporation subsidiary and investments in investmentpools, please see Important Disclosures & Risks for Steben Managed Futures Strategy Fund.
Foreside Fund Services, LLC, Distributor

Steben & Company, Inc. 4/25/2017
Shattering Illusions 14
Managed Futures Diversifier, Mutual FundSteben Managed Futures Strategy Fund
Non-Trend25%
Strategy MixMarch 2017
115
120
SKLIX VAMIApril 2014 – March 2017
Beta to S&P 500
0.13
Trend-Following
75%
100
105
110
115
SKLIX
Barclay Systematic Traders Index
QTD 1 Year
Since Inception
(Annualized)April 1, 2014
Fund Performance | As of March 31, 2017
FOOTER “FOR USE” DISCLOSURE 27THIS PRESENTATION IS FOR USE ONLY BY BROKER DEALERS AND REGISTERED INVESTMENT ADVISORS WITH THEIR ACCREDITED CLIENTS. 27FOR BROKER DEALER AND RIA USE ONLY. 27
95
Mar
14
Jun
14
Sep
14
Dec
14
Mar
15
Jun
15
Sep
15
Dec
15
Mar
16
Jun
16
Sep
16
Dec
16
Mar
17
y y
PAST PERFORMANCE IS NOT NECESSARILY INDICATIVE OF FUTURE RESULTS. DIVERSIFICATION DOES NOT ASSURE A PROFIT ORGUARANTEE A LOSS. Performance data quoted represents past performance and is no guarantee of future results. Current performance maybe lower or higher than the performance quoted. Investment return and principal value will fluctuate so that an investor’s shares, when redeemed, may beworth more or less than their original cost. For the most recent month-end performance, please visit www.steben.com. As stated in the currentprospectus, the Fund’s annual operating expense ratio (gross) for Class I shares are 1.99%. Class I shares impose a 1.00% redemption fee on sharessold within 30 days, which is not reflected in the quoted returns. Source: Steben & Company, Inc., Pertrac. Index returns are for illustrative purposes onlyand do not represent the performance of any fund. See Important Disclosures and Risks. *Estimated for March 2017.
Class I 0.10% 0.10% 3.79%
Barclay Systematic Traders Index*
-1.02% -4.39% 1.69%
Futures Portfolio Fund, L.P.
IMPORTANT DISCLOSURES & RISK CONSIDERATIONS Risks include the possible loss of principal. Futures Portfolio Fund is aprivately offered managed futures fund. An investment in the Fund is speculative. There is no guarantee that the Fund will achieveits investment objectives. Any investment should be viewed as part of an overall investment program and should only be made byinvestors willing to undertake the risk involved Diversification does not eliminate risk Futures and forward trading is speculative andinvestors willing to undertake the risk involved. Diversification does not eliminate risk. Futures and forward trading is speculative andleveraged and can be volatile. Trading may occur on foreign exchanges which could mean higher risk. Currency forward transactions arenot regulated and are subject to credit risk. The Fund limits the ability to liquidate investment units only on a monthly basis. There is nosecondary market for Fund units. Fund units are not listed on any securities exchange. Fees and expenses are substantial and will offsetthe Fund’s trading profits. Global price movements of futures and forwards trading are caused by many unpredictable factors, which mayresult in substantial fluctuations of the value of Fund units. For other risks, please see Important Disclosures & Risks for Futures PortfolioFund.

Steben & Company, Inc. 4/25/2017
Shattering Illusions 15
Managed Futures Diversifier, Private FundFutures Portfolio Fund, L.P.
600
Futures Portfolio Fund B Units VAMIMay 1995 – March 2017
Beta to S&P 500
0
Strategy MixMarch 2017
7.14% ROR
100
200
300
400
500
Futures Portfolio Fund B
-0.11
Trend-Following
67%
Non-Trend33%
4.29% ROR
FOOTER “FOR USE” DISCLOSURE 29THIS PRESENTATION IS FOR USE ONLY BY BROKER DEALERS AND REGISTERED INVESTMENT ADVISORS WITH THEIR ACCREDITED CLIENTS. 29FOR BROKER DEALER AND RIA USE ONLY. 29
0
1995
1997
1999
2001
2003
2005
2007
2009
2011
2013
2015
2017
Barclay Systematic Traders Index67%
PAST PERFORMANCE IS NOT NECESSARILY INDICATIVE OF FUTURE RESULTS. DIVERSIFICATION DOES NOT ASSURE A PROFIT ORGUARANTEE A LOSS. Returns are estimated and are subject to change, pending final monthly accounting review. Source: Steben & Company, Inc.,Pertrac. Index returns are for illustrative purposes only and do not represent the performance of any fund. See Important Disclosures and Risks.
Key Takeaways
• Asymmetric downside risks for equity markets given top decilevaluations and historic levels of policy risk
• Equity volatility could rise from current multi-decade lows
• Return enhancing strategies such as long-only or long-biased alternatives have outperformed in the benign post-crisis environment
• Going forward low beta Diversifier strategies may be more additive to portfolio Sharpe ratios. These include Managed Futures, Global Macro, E it M k t N t l Fi d I R l ti V l d L B t
FOOTER “FOR USE” DISCLOSURE 30THIS PRESENTATION IS FOR USE ONLY BY BROKER DEALERS AND REGISTERED INVESTMENT ADVISORS WITH THEIR ACCREDITED CLIENTS. 30FOR BROKER DEALER AND RIA USE ONLY. 30
Equity Market Neutral, Fixed Income Relative Value and Low Beta Equity L/S

Steben & Company, Inc. 4/25/2017
Shattering Illusions 16
Glossary of Terms
Alerian MLP Index*: The leading gauge of energyMaster Limited Partnerships (MLPs). The float-adjusted,capitalization-weighted index, whose constituentsrepresent approximately 85% of total float-adjustedmarket capitalization, is disseminated real-time on aprice-return basis (AMZ) and on a total-return basis(AMZX). Inception 12/29/1995
Cambridge Associates US Private Equity Index*:The index and benchmark statistics are based ondata compiled from more than 1,200 institutional-quality buyout, growth equity, private equity energy,and mezzanine funds formed between 1986 and2015. Inception 4/1/86
Private Equity investments are subject to risks
The indices described below are used in the graphs of this presentation. There are limitations in using financial indices for comparison purposes becausethe Funds may have different volatility, credit and other material characteristics. Generally, indices are unmanaged and are not available for directinvestment.
levels of net exposure, leverage employed, holdingperiod, concentrations of market capitalizations andvaluation ranges of typical portfolios. EH managerswould typically maintain at least 50% exposure to,and may in some cases be entirely invested in,equities, both long and short. Inception 12/31/1989
HFRI EH E it M k t N t l I d * E it( ) p
MLP investments are subject to risks, including but notlimited to Commodity Price risk, Interest Rate risk, andLegislative and Regulatory risk.
Performance Source: Bloomberg
Barclay Systematic Traders Index*: An equal weightedcomposite of managed futures programs whoseapproach is at least 95% systematic. In 2017 there are409 systematic programs included in the index. Theperformance of the index is net of management andincentive fees from the individual trading managers.Inception: 1/1987
Managed futures investments are subject to risks,including illiquidity, lack of a secondary market, and thevolatility of the underlying commodities or futures marketstraded by a particular program.
Private Equity investments are subject to risks,including but not limited to Funding Risk, LiquidityRisk, Market Risk, and Capital Risk.
Performance Source: Cambridge Associates LLC.
Dow Jones Equity REIT Total Return Index*:Comprised of REITs that directly own all or part ofthe properties in their portfolios. Inception 1/2/1990
REITs are subject to risks similar to those associatedwith direct investments in real estate: property valuefluctuations, lack of liquidity, limited diversificationand sensitivity to economic factors such as interestrate changes and market recessions.
Performance Source: Bloomberg
Global Policy Uncertainty Index*: Tracks news media keywords related to economic policy
• HFRI EH-Equity Market Neutral Index*: EquityMarket Neutral strategies employ sophisticatedquantitative techniques of analyzing price data toascertain information about future price movementand relationships between securities, selectsecurities for purchase and sale. These can includeboth Factor-based and Statistical Arbitrage/Tradingstrategies. Factor-based investment strategiesinclude strategies in which the investment thesis ispredicated on the systematic analysis of commonrelationships between securities. In many but notall cases, portfolios are constructed to be neutral toone or multiple variables, such as broader equitymarkets in dollar or beta terms, and leverage isfrequently employed to enhance the return profileof the positions identified. StatisticalArbitrage/Trading strategies consist of strategies in
FOOTER “FOR USE” DISCLOSURE 31THIS PRESENTATION IS FOR USE ONLY BY BROKER DEALERS AND REGISTERED INVESTMENT ADVISORS WITH THEIR ACCREDITED CLIENTS. 31FOR BROKER DEALER AND RIA USE ONLY. 31
*It is not possible to invest directly in an index.
y p p g
Performance Source: BarclayHedge
Bloomberg US Economic Surprise Index*: Shows thepercentage difference between analyst forecasts and thepublished value of economic data releases. TheSentiment Surprise measure uses the Surveys andBusiness Cycle Indicators sub-index. The Hard DataSurprise measure averages the sub-indices for theIndustrial Sector, Housing and Real Estate Market, LaborMarket, Personal/Household Sector and Retail &Wholesale Sector.
Performance Source: Bloomberg
media keywords related to economic policy uncertainty in developed markets.
Performance Source: Bloomberg
HEDGE FUND RESEARCH INC. (HFRI) INDICES
• HFRI Equity Hedge (Total) Index*: Equity L/S:Investment Managers who maintain positions bothlong and short in primarily equity and equityderivative securities. A wide variety of investmentprocesses can be employed to arrive at aninvestment decision, including both quantitativeand fundamental techniques; strategies can bebroadly diversified or narrowly focused on specificsectors and can range broadly in terms of
g g g gwhich the investment thesis is predicated onexploiting pricing anomalies which may occur as afunction of expected mean reversion inherent insecurity prices; high frequency techniques may beemployed and trading strategies may also beemployed on the basis on technical analysis oropportunistically to exploit new information theinvestment manager believes has not been fully,completely or accurately discounted into currentsecurity prices. Equity Market Neutral Strategiestypically maintain characteristic net equity marketexposure no greater than 10% long or short.
Glossary of Terms (Continued)• HFRI Event-Driven*: Investment Managers
who maintain positions in companies currentlyor prospectively involved in corporatetransactions of a wide variety including but notlimited to mergers, restructurings, financialdistress, tender offers, shareholder buybacks,debt exchanges, security issuance or othercapital structure adjustments. Security typescan range from most senior in the capitalstructure to most junior or subordinated, and
• HFRI Relative Value*: Investment Managers whomaintain positions in which the investment thesis ispredicated on realization of a valuation discrepancy inthe relationship between multiple securities. Managersemploy a variety of fundamental and quantitativetechniques to establish investment theses, andsecurity types range broadly across equity, fixedincome, derivative or other security types. Fixedincome strategies are typically quantitatively driven tomeasure the existing relationship between
under management or a 12-month track record ofactive performance. The HFRI Fund WeightedComposite Index does not include funds of hedgefunds. The current month and the prior threemonths returns of the Index are estimates and aresubject to change. All performance prior to that islocked and is no longer subject to change.
• HFRI Global (Total) Index*: Global Macro:Investment Managers which trade a broad range
f t t i i hi h th i t t ij ,
frequently involve additional derivativesecurities. Event Driven exposure includes acombination of sensitivities to equity markets,credit markets and idiosyncratic, companyspecific developments. Investment theses aretypically predicated on fundamental charac-teristics (as opposed to quantitative), with therealization of the thesis predicated on a specificdevelopment exogenous to the existing capitalstructure.
• HFRI Fund of Funds Composite Index*:Currently comprised of over 500 domestic andoffshore funds of hedge funds that have aminimum of $50 million under management ora 12-month track record of active performance.All fund performance is equally weighted and is
g pinstruments and, in some cases, identify attractivepositions in which the risk adjusted spread betweenthese instruments represents an attractive opportunityfor the investment manager. RV position may beinvolved in corporate transactions also, but asopposed to ED exposures, the investment thesis ispredicated on realization of a pricing discrepancybetween related securities, as opposed to theoutcome of the corporate transaction.
HFRI Indices Inception: 1/1990
Performance Source: Hedge Fund Research, Inc.
Investments in hedge funds involve the risk of (i) loss ofall or a substantial portion of the investment due toleveraging, short-selling, or other speculative practicesof hedge funds, (ii) lack of liquidity of their shares, (iii)
of strategies in which the investment process ispredicated on movements in underlying economicvariables and the impact these have on equity,fixed income, hard currency and commoditymarkets. Managers employ a variety oftechniques, both discretionary and systematicanalysis, combinations of top down and bottom uptheses, quantitative and fundamental approachesand long and short term holding periods. Althoughsome strategies employ RV techniques, Macrostrategies are distinct from RV strategies in thatthe primary investment thesis is predicated onpredicted or future movements in the underlyinginstruments, rather than realization of a valuationdiscrepancy between securities. In a similar way,while both Macro and equity hedge managers mayhold equity securities, the overriding investment
FOOTER “FOR USE” DISCLOSURE 32THIS PRESENTATION IS FOR USE ONLY BY BROKER DEALERS AND REGISTERED INVESTMENT ADVISORS WITH THEIR ACCREDITED CLIENTS. 32FOR BROKER DEALER AND RIA USE ONLY. 32
*It is not possible to invest directly in an index.
p q y gnet of all fee returns on a monthly basis. Thecurrent month and the prior three monthsreturns of the Index are estimates and aresubject to change. All performance prior to thatis locked and is no longer subject to change.
• HFRI Fund Weighted Composite Index*: TheHFRI Fund Weighted Composite Index is aglobal, equal-weighted index of over 2,000single-manager hedge funds that report to theHFR Database. Constituent funds reportmonthly performance net of all fees in USdollars and have a minimum of $50 million
g , ( ) q y , ( )volatility of returns, (iv) limited information regardingvaluations and pricing, and (v) complex tax structuresand delays in tax reporting. Hedge funds are generallysubject to less regulation and higher fees than mutualfunds.
q y , gthesis is predicated on the impact movements inunderlying macroeconomic variables may have onsecurity prices, as opposes to EH, in which thefundamental characteristics on the company arethe most significant are integral to investmentthesis.

Steben & Company, Inc. 4/25/2017
Shattering Illusions 17
Glossary of Terms (Continued)iShares MSCI Japan ETF*: A type of exchange-traded fund that invests the majority of its assetsin Japanese equities that trade on local stockexchanges. The performance of Japan ETFsdoes not correlate to the performance of theunderlying index when measured in U.S. dollars,because the change in the exchange ratebetween the yen and the dollar must be takeninto consideration. The performance of JapanETFs is thus dependent on two things: the
US 10 Year Treasury Note*: A debt obligationissued by the US government that matures in 10years. 10-year Treasury notes pay a fixed rate ofinterest semi-annually and pay the principal or facevalue amount to the Note holder upon maturity.
Performance Source: Bloomberg
VIX Index*: A market implied volatility measure forthe S&P 500, reflecting the price investors arewilling to pay to buy option insurance
S&P 500 Total Return Index (TR)*: The 500stocks in the S&P 500 are chosen by Standardand Poor’s based on market size, industryrepresentation, liquidity and stability. The stocksin the S&P 500 are not the 500 largestcompanies; rather the Index is designed to be aleading indicator of US equities and is meant toreflect the risk/return characteristics of the largecap universe. Inception 3/1957.
P f S St d d & P ’p g
performance of the underlying equities and theeffect of changing yen into dollars.
S&P GSCI® Total Return Index*: A compositeindex of commodity sector returns representing abroadly diversified, unleveraged, long-onlyinvestment in commodity futures. The returns arecalculated on a fully collateralized basis with fullreinvestment. Inception 1/1970
Commodity prices may be affected by a variety offactors at any time, including but not limited to, (i)changes in supply and demand relationships, (ii)governmental programs and policies, (iii) nationaland international political and economic events,war and terrorist events, (iv) changes in interestand exchange rates, (v) trading activities incommodities and related contracts (vi)
willing to pay to buy option insurance.
Performance Source: Bloomberg
The Wells Fargo Business DevelopmentCompany Index*: Intended to measure theperformance of all Business DevelopmentCompanies (BDC) listed on the New York StockExchange (NYSE AMEX) or NASDAQ that satisfiedmarket capitalization and other eligibilityrequirements. This index is a total return index. Theindex was created to yield a benchmark value of1,000.00 on September 30, 2004. Inception 9/30/04
Business Development Company investments aresubject to risks, including but not limited to Portfoliocompany credit and investment risk, Leverage risk,Market and valuation risk, Price volatility andliquidity risk Capital markets risk Interest Rate risk
Performance Source: Standard & Poor’s
US equity index investments are subject to risks,including price fluctuations in response to newson companies, industries, government policiesand the general economic environment.
FOOTER “FOR USE” DISCLOSURE 33THIS PRESENTATION IS FOR USE ONLY BY BROKER DEALERS AND REGISTERED INVESTMENT ADVISORS WITH THEIR ACCREDITED CLIENTS. 33FOR BROKER DEALER AND RIA USE ONLY. 33
*It is not possible to invest directly in an index.
commodities and related contracts, (vi)pestilence, technological change and weather,and (vii) the price volatility of a commodity. Inaddition, the commodities markets are subject totemporary distortions or other disruptions due tovarious factors, including lack of liquidity,participation of speculators and governmentintervention.
Performance Source: Standard & Poor’s
liquidity risk, Capital markets risk, Interest Rate risk,Dependence on key personnel, and Structural andRegulatory risk.
Performance Source: Bloomberg
Glossary of TermsAlpha: A measure of risk-adjusted performance. A higher alphaindicates a security has performed better than expected with its givenbeta (or volatility.) See Beta.
Alternative Investment: An investment product other than traditionalinvestments such as stocks, bonds, cash or property.
Beta: Measures a fund’s sensitivity to market movements bycomparing a fund’s excess return (over a benchmark) to the market’s
Real Estate Investment Trust (REIT): A security that sells like astock on the major exchanges and invests in real estate directly,either through properties or mortgages. REITs receive special taxconsiderations and typically offer investors high yields, as well as ahighly liquid method of investing in real estate. REITs are subject torisks similar to those associated with direct investments in realestate: property value fluctuations, lack of liquidity, limiteddiversification and sensitivity to economic factors such as interestrate changes and market recessions.p g ( )
excess return. By definition, the beta of the market is 1.00. Forexample, a beta that is lower than 1.00 would normally indicate that afund’s excess return is expected to be above the market’s excessreturn in a down year and below in an up year. However, beta is ameasure of historical volatility and cannot predict a fund’s actualperformance.
Correlation: A measure of the degree to which two variables relateto each other.
Equity Market Neutral: A hedge fund strategy that seeks to exploitdifferences in stock prices by being long and short in stocks withinthe same sector, industry, market capitalization, country, etc. Thisstrategy creates a hedge against market factors.
g
Sharpe Ratio: A calculation meant to illustrate the amount of returnone is achieving per unit of risk. It is derived by dividing the averageannual return by the standard deviation of an investment. A highernumber tends to signify a better return/risk relationship, whereas alower number may be seen as unfavorable.
Shiller P/E Ratio: A valuation measure, generally applied to broadequity indices, that uses real per-share earnings over a 10-yearperiod. The ratio uses smoothed real earnings to eliminate thefluctuations in net income caused by variations in profit margins overa typical business cycle. The ratio was popularized by Yale Universityprofessor Robert Shiller.
Standard Deviation: Measures the dispersal or uncertainty in a
FOOTER “FOR USE” DISCLOSURE 34THIS PRESENTATION IS FOR USE ONLY BY BROKER DEALERS AND REGISTERED INVESTMENT ADVISORS WITH THEIR ACCREDITED CLIENTS. 34FOR BROKER DEALER AND RIA USE ONLY. 34
Peak-to-Valley Drawdown: The peak-to-trough decline during aspecific period of an investment, fund or commodity. A drawdown isusually quoted as the percentage between the peak and the trough.
Rate of Return (ROR): Profit on an investment. It comprises anychange in value, and interest or dividends or other such cash flows,which the investor receives from the investment.
p yrandom variable (in this case, investment returns). It measures thedegree of variation of returns around the mean (average) return. Thehigher the volatility of the investment returns, the higher the standarddeviation will be.
Value Added Monthly Index (VAMI): An index that tracks themonthly performance of a hypothetical $1000 investment. Thecalculation for the current month's VAMI is: = Previous VAMI x (1 +Current Rate of Return)
Volatility: The relative rate at which the price of a security moves upand down.

Steben & Company, Inc. 4/25/2017
Shattering Illusions 18
RISK CONSIDERATIONS Steben Select Multi-Strategy Fund is part ofa master-feeder structure and invests in a closed-end, non-diversifiedinvestment company with the same objectives and strategies (MasterFund), which in turn invests in hedge funds (Portfolio Funds). Fundinvestors will bear asset-based fees and expenses of the Fund, whichincludes the Fund’s pro rata portion of the fees and expenses of theMaster Fund and, indirectly, of the Portfolio Funds. Those fees may
The Portfolio Funds may be highly leveraged. A portfolio of hedge fundsmay increase the potential for losses and gains. One or moreunderlying managers may, from time to time, invest a substantialportion of the assets managed in a particular market or sector. As aresult, the Portfolio Funds (as well as the Fund) may be subject togreater risk and volatility than if investments had been made in thesecurities or derivatives of a broader range of issuers. There can be no
Important Disclosures & Risks
Steben Select Multi-Strategy Fund
Master Fund and, indirectly, of the Portfolio Funds. Those fees mayinclude performance-based compensation of the underlying managers.An investment in the Fund is speculative and there is noguarantee that the Fund will achieve its investment objectives. Aninvestment in the Fund should be viewed as part of an overallinvestment program and should only be made by investors willing toundertake the risks involved.
Investments in securities involve risk of the loss of capital. Aninvestment in the Fund includes the risks inherent in an investment insecurities, as well as specific risks associated with limited liquidity,restricted liquidity of certain investments, distressed securities andother high risk investments, foreign currency translation, long-biasedstrategies, sector specific risks, counterparty risk, convertibles, use ofderivatives for hedging and non-hedging purposes, leverage/borrowing,purchases of initial public offerings, valuation, master-feeder structure,
f h t lli i t t i “j k b d ” hi h tf li t
securities or derivatives of a broader range of issuers. There can be noassurance that an underlying manager’s strategy will be successful orthat it will employ such strategies with respect to its entire portfolio.
The Portfolio Funds in which the Fund invests can be highly illiquid andmay not be required to provide periodic pricing or valuation to investors.The overall performance of the Fund is dependent not only on theinvestment performance of individual managers, but also on the abilityof the Fund’s Investment Manager to effectively select and allocate theFund’s assets among such managers on an ongoing basis. The Fundmay be less diversified and more subject to concentration risk thanother funds of hedge funds. The value of the Fund’s portfolioinvestments should be expected to fluctuate. The Fund’s shares arenot listed on any securities exchange, and it is not anticipated thata secondary market for shares will develop. The Fund cannotguarantee that investors will be able to effect repurchases of as
h th t St b & C d th d l i
FOOTER “FOR USE” DISCLOSURE 35THIS PRESENTATION IS FOR USE ONLY BY BROKER DEALERS AND REGISTERED INVESTMENT ADVISORS WITH THEIR ACCREDITED CLIENTS. 35FOR BROKER DEALER AND RIA USE ONLY. 35
use of short selling, investment in “junk bonds”, high portfolio turnoverrate, conflicts of interest, options, futures, commodities, real assets andinvestment in non-US securities.
Both the Fund and the Master Fund are registered as investmentcompanies with the Securities and Exchange Commission (SEC).However, the Portfolio Funds are not registered with the SEC. Althoughregistered as investment companies, both the Fund and Master Fundhave limited liquidity and do not provide daily net asset values.
many shares as they request. Steben & Company and the underlyingportfolio fund managers may face conflicts of interest. Shares areoffered pursuant to the terms of the prospectus and (i) are not FDIC-insured, (ii) are not deposits or other obligations of, or guaranteed by,any bank and (iii) involve investment risks, including possible loss ofprincipal. Diversification among multiple hedge funds does not assureprofit or guarantee against losses.
Foreside Fund Services, LLC, Distributor
INVESTOR CONCERNS AND SUITABILITY The Fund is appropriateonly for investors who can bear the risks associated with limited liquidityand should be considered a long-term investment. Investors may losesome or all of their investment and should carefully consider theirinvestment objectives, personal situation, and other factors such as networth, income, age, risk tolerance and liquidity needs before investingin the Fund. The information presented does not represent investment
PERFORMANCE DISCLOSURES Performance data presentedherein is the historical performance data of Select Fund and theMaster Fund. There can be no assurance that Select Fund and theMaster Fund will achieve their objectives or avoid significant losses.Investment results will fluctuate so that an investor’s shares, ifrepurchased in a tender offer, may be worth more or less than theoriginal cost. Select Fund’s shares are subject to legal restrictions on
Important Disclosures & Risks
Steben Select Multi-Strategy Fund
in the Fund. The information presented does not represent investmentrestrictions or guidelines for the Fund, and is current through the datesherein.
Before investing, you should carefully consider the Fund’s investmentobjectives, risks, charges and expenses. For a prospectus that containsthis and other information about the Fund, please contact Steben &Company at 800.726.3400 or [email protected]. Please read theprospectus carefully before you invest.
g j gtransfer and resale and investors should not assume they will be ableto resell their shares. The Fund however, intends to conduct quarterlyshare repurchases, subject to an early withdrawal fee of 2% within thefirst 9 months of an investor’s subscription. Final and currentperformance may be higher or lower than the performance dataquoted. Diversification does not assure a profit or protection againstlosses.
The Fund invests all of its investable assets in the Master Fund,except those restricted for regulatory reasons, liquidation purposes orforced redemptions.
The Master Fund pays the Investment Manager a monthly investmentmanagement fee equal to 1.25% (on an annualized basis) of itsmonth-end net asset value of outstanding Shares of the Master Funddetermined as of the last calendar day of that month before giving
FOOTER “FOR USE” DISCLOSURE 36THIS PRESENTATION IS FOR USE ONLY BY BROKER DEALERS AND REGISTERED INVESTMENT ADVISORS WITH THEIR ACCREDITED CLIENTS. 36FOR BROKER DEALER AND RIA USE ONLY. 36
y g geffect to any purchases or repurchases of Shares or any distributionsby the Fund.
Foreside Fund Services, LLC, Distributor

Steben & Company, Inc. 4/25/2017
Shattering Illusions 19
RISK CONSIDERATIONS The Steben Managed Futures StrategyFund is a non-diversified mutual fund that invests up to 25% of itsassets in a subsidiary organized in the Cayman Islands. Changes intax laws would likely decrease investment returns.
Investments in securities involve risk of the loss of capital. Aninvestment in the Fund is speculative and there is no guaranteeh h F d ill hi i i bj i A
Important Disclosures & Risks
Steben Managed Futures Strategy Fund
• Investment pools in which the subsidiary seeks exposure to throughswap arrangements will pay management fees, commissions,operating expenses and performance based fees to each manager itretains. As a result, the cost of investing in the Fund may be higherthan a mutual fund that invests directly in securities.
• The Steben Managed Futures Strategy Fund has an annual operatingti ( ) f 2 00% f Cl A d 1 75% f Cl Ithat the Fund will achieve its investment objectives. An
investment in the Fund should be viewed as part of an overallinvestment program and should only be made by investors willing toundertake the risk involved. Diversification does not eliminate risk.
• Investing in commodity futures subjects the Fund to greatervolatility.
• Trading on foreign exchanges and foreign investments includingexposure to foreign currencies, involves risks not typicallyassociated with U.S. investments, including fluctuations in foreigncurrency values, adverse social and economic developments,less liquidity, greater volatility, less developed or inefficienttrading markets, political instability and differing auditing and legalstandards.
• Derivative instruments can be highly volatile, illiquid and difficult
expense ratio (gross) of 2.00% of Class A and 1.75% for Class I.Performance shown at NAV does not reflect any redemption fees orsales charges and would be lower if it did. A redemption fee of 1.00%of the then-current value of Class I shares redeemed is imposed onredemptions of shares made within 30 days of purchase (i.e., theredemption is effective on or before the 30th day following the date ofpurchase), subject to certain exceptions. The redemption fee is notreflected in the performance shown.
• For other risks including, but not limited to, leverage, fixed incomesecurities, and below investment grade securities, please read theprospectus.
Before investing, you should carefully consider the Fund’s investmentobjectives, risks, charges and expenses. This and other importantinformation about the Fund is contained in the Fund’s prospectus which
b bt i d b lli 855 775 5571 i iti t b
FOOTER “FOR USE” DISCLOSURE 37THIS PRESENTATION IS FOR USE ONLY BY BROKER DEALERS AND REGISTERED INVESTMENT ADVISORS WITH THEIR ACCREDITED CLIENTS. 37FOR BROKER DEALER AND RIA USE ONLY. 37
Derivative instruments can be highly volatile, illiquid and difficultto value. The Fund’s use of derivatives such as futures, swaps,forward contracts and options contracts exposes the Fund toadditional risks such as leverage risk, tracking risk, liquidity riskand counterparty default risk that it may not be subject to if itinvested directly in the underlying securities.
• Investing in commodities through a controlled foreign corporationsubsidiary involves taxation and regulatory risk. Whereapplicable, income received from commodities-relatedinvestments will be passed through to the Fund as ordinaryincome.
can be obtained by calling 855.775.5571 or visiting www.steben.com.Please read the prospectus carefully before investing.
Foreside Fund Services, LLC, Distributor
• Futures and forward trading is speculative and leveraged and can be volatile.
• Trading may occur on foreign exchanges which could mean higher risk.
• Futures and forward markets can be illiquid or disrupted.
• Diversification does not assure a profit or guarantee against loss in a declining market
Important Disclosures & Risks
Futures Portfolio Fund
Diversification does not assure a profit or guarantee against loss in a declining market.
• Currency forward transactions are not regulated and are subject to credit risk.
• Limited ability to liquidate investment units (monthly).
• Fees and expenses are substantial and will offset the Fund’s trading profits.
• The Fund is subject to actual and potential conflicts of interest involving the General Partner and the trading advisors. This includes the risk of owing substantial compensation to the General Partner and the trading advisors regardless of the Fund’s investment performance.
• Global price movements of futures and forwards trading are caused by many unpredictable factors, such as currency fluctuations, interest rate changes and general economic and political conditions. In turn the value of your Units may fluctuate substantially This risk may be accentuated should trading
FOOTER “FOR USE” DISCLOSURE 38THIS PRESENTATION IS FOR USE ONLY BY BROKER DEALERS AND REGISTERED INVESTMENT ADVISORS WITH THEIR ACCREDITED CLIENTS. 38FOR BROKER DEALER AND RIA USE ONLY. 38
turn, the value of your Units may fluctuate substantially. This risk may be accentuated should trading occur in emerging markets.
• Units may be redeemed on a monthly basis upon 5 business days’ prior written notice. Units, when redeemed, may be worth more or less than their original purchase price. There is no secondary market for the Units, and none is expected to develop. There are restrictions on transferring interests in the Fund.

Steben & Company, Inc. 4/25/2017
Shattering Illusions 20
For additional information, contact us at 800.726.3400 or visit www.steben.com


![Markt Bad Steben – Website der Marktgemeinde Bad Steben[T] STa [TcicT] F\i-VT \XcWP[ cT] ZP]] G^] HXacbWPdb\dbX ZP]cT] QXb id\ Z[PbbXbRWT]](https://img.dokumen.tips/doc/110x75/5f41e7d90ca495537d2a5b36/markt-bad-steben-a-website-der-marktgemeinde-bad-steben-t-sta-tcict-fi-vt.jpg)