Embed Size (px)
Citation preview

American Finance Association
Shareholder Activism by Institutional Investors: Evidence from CalPERSAuthor(s): Michael P. SmithSource: The Journal of Finance, Vol. 51, No. 1 (Mar., 1996), pp. 227-252Published by: Wiley for the American Finance AssociationStable URL: http://www.jstor.org/stable/2329308 .
Accessed: 30/04/2013 05:01
Your use of the JSTOR archive indicates your acceptance of the Terms & Conditions of Use, available at .http://www.jstor.org/page/info/about/policies/terms.jsp
.JSTOR is a not-for-profit service that helps scholars, researchers, and students discover, use, and build upon a wide range ofcontent in a trusted digital archive. We use information technology and tools to increase productivity and facilitate new formsof scholarship. For more information about JSTOR, please contact [email protected].
.
Wiley and American Finance Association are collaborating with JSTOR to digitize, preserve and extend accessto The Journal of Finance.
http://www.jstor.org
This content downloaded from 128.197.27.9 on Tue, 30 Apr 2013 05:01:04 AMAll use subject to JSTOR Terms and Conditions

THE JOURNAL OF FINANCE * VOL. LI, NO. 1 * MARCH 1996
Shareholder Activism by Institutional Investors: Evidence from CalPERS
MICHAEL P. SMITH*
ABSTRACT
This study examines firm characteristics that lead to shareholder activism and analyzes the effects of activism on target firm governance structure, shareholder wealth, and operating performance for the 51 firms targeted by CalPERS over the 1987-93 period. Firm size and level of institutional holdings are found to be positively related to the probability of being targeted, and 72 percent of firms targeted af- ter 1988 adopt proposed changes or make changes resulting in a settlement with CalPERS. Shareholder wealth increases for firms that adopt or settle and decreases for firms that resist. No statistically significant change in operating performance is found.
INSTITUTIONAL OWNERSHIP OF DOMESTIC equities has grown rapidly in recent years and in 1992 surpassed the 50 percent level of aggregate ownership.1 At the same time, the market for corporate control that was active in the 1970s and 1980s, and that served effectively to discipline managers, has weakened sub- stantially.2 The rise in institutional holdings and corresponding decline of the market for corporate control have focused attention on the role and importance of institutional investors as monitors of corporate management. The recent increase in monitoring by traditionally passive institutional investors has been described as "shareholder activism." For this study, shareholder activism is defined to include monitoring and attempting to bring about changes in the organizational control structure of firms (targets) not perceived to be pursuing shareholder-wealth-maximizing goals.
The emergence of shareholder activism raises questions about the practices of activist institutional investors and particularly whether activism is benefi- cial for shareholders of targeted firms and possibly firms that are not targeted
* Economic Analysis Corporation, Los Angeles. This article is based on my dissertation at Arizona State University. I thank DeWitt Bowman (Chief Investments Officer), Kayla Gillan (Assistant General Counsel), Jose Arau (Director of Corporate Relations) and Hilda Applbaum (Director of Research) of CalPERS for providing valuable data and information. I also thank Hank Bessembinder, Jim Booth, Jay Coughenour, Dan Deli, Stu Gillan, Mike Joehnk, Herb Kaufman, Frank Kerins, Ken Lehn, Paul Seguin, Janet Smith, Susan Woodward, Rene Stulz, the editor, and two referees for helpful comments. I especially thank my dissertation chair, Rick Smith, for invaluable guidance and suggestions. Financial support was provided by the Arizona State Unversity Regents Dissertation Scholarship.
' Flow of Funds Accounts, Financial Assets and Liabilities 1966-1989, Federal Reserve Board, and the Wall Street Journal, November 13, 1992, Cl.
2 See Martin and McConnell (1991) on the disciplinary role of takeovers and Jensen (1989) on the decline of takeover activity.
227
This content downloaded from 128.197.27.9 on Tue, 30 Apr 2013 05:01:04 AMAll use subject to JSTOR Terms and Conditions

228 The Journal of Finance
but could have been. Questions regarding the effects of shareholder activism on targeted firms include the following: What types of firms are subject to shareholder activism? Is shareholder activism effective in changing target firm governance structures? Does shareholder activism increase shareholder wealth for targeted firms? Are the positive expectations of the market "con- firmed" by subsequent improvements in performance of targeted firms? And, is there a spillover effect of activism for other firms that also are likely targets for shareholder activism? Answers to these questions indicate whether shareholder activism is an effective monitoring mechanism and whether effectiveness is limited by constraints on institutional behavior. An empir- ical analysis of firms subject to shareholder activism can provide these answers.
This study analyzes whether shareholder activism is effective as a source of monitoring. The focus of the analysis is on what firm characteristics lead to activism and whether shareholder activism results in changes in target firm governance structures and performance and whether these changes appear to give rise to changes in shareholder wealth. This is done by focusing on targets of the institutional investor regarded as a leader in shareholder activism-the California Public Employees' Retirement System ("CalPERS" or the "System"). The focus is on the targets of CalPERS to cleanly investigate a comprehensive set of activism targets (targeted publicly and privately) and to control for activist attributes. Since CalPERS is regarded as a leader in activism, if effects are not found from its activism, effects are not likely to be found for other activists. The primary sample consists of 51 target firms involved in the 78 targeting events of CalPERS over the 1987 to 1993 period. In addition, firm characteristics and changes in operating performance for control samples are used to analyze target selection and possible spillover effects of activism.
Firms targeted for activism are firms with poor stock price performance (for firms targeted after 1988) that are larger and have higher levels of institu- tional ownership relative to control samples. Results show that over the period 1987 to 1988, only one of 15 firms targeted (7 percent) adopted proposed governance structure changes outright or made changes sufficient to warrant a settlement the first year targeted, but over the period 1989 to 1993 the success rate was higher, 26 of 36 firms (72 percent). The effect of shareholder activism on shareholder wealth differs depending on the outcome of targeting. For the sample of firms that settled with CalPERS and that have public announcements of targeting, the mean change in shareholder wealth at initial announcement is 1.06 percent (z = 2.56). For the-sample of firms that did not settle, the mean change in wealth is -1.16 percent (z = -2.43). Results for effects on accounting measures of performance do not allow me to reject the null hypothesis that activism does not improve operating performance.
The remainder of the article is organized as follows. Section I develops testable hypotheses regarding factors affecting target selection and the effects of shareholder activism on target firm shareholder wealth and operating performance. Section II provides background on CalPERS and shareholder
This content downloaded from 128.197.27.9 on Tue, 30 Apr 2013 05:01:04 AMAll use subject to JSTOR Terms and Conditions

Shareholder Activism by Institutional Investors 229
activism. Section III describes the data. Section IV conducts the analysis of target selection and the effects of shareholder activism on target firm gover- nance structure, shareholder wealth and operating performance. Section V provides conclusions.
I. Hypotheses
Rational shareholders will become "active" if the expected benefits of activ- ism exceed the expected costs of activism, where the expected benefits are equal to the probability of successful targeting times the shareholder's private gain if successful.3 This is modeled formally in Admati, Pfleiderer, and Zechner (1992) where large shareholders with diversified portfolios are shown to have an incentive to expend resources in monitoring management even though there is free-riding by other shareholders. In their model, activism arises as an equilibrium condition when the expected gains from monitoring exceed the expected costs. Ayres and Cramton (1993) argue that through multiperiod relationships, institutional investors that commit to holding a firm's equity have increased credibility and influence in monitoring management. There- fore, by increasing the probability of success, they increase the expected benefits of activism. The expected benefits and expected costs framework and findings from the takeover literature can be used to develop hypotheses about which firms are more likely to be targeted for activism.
For example, ownership structure has been shown to affect the likelihood that a firm receives a tender offer. Stulz (1988) argues and Shivdasani (1993) finds that the level of inside holdings is negatively related to the probability that a firm is subject to a takeover as higher levels of holdings reduce the probability of success. Mikkelson and Partch (1989) find that the level of inside ownership has a negative relation to the probability of being targeted but a positive relation to the proba- bility of being acquired. Inside ownership may have the same effects for share- holder activism, and hence the level of inside ownership should have a negative relation to the probability of being targeted by an activist, but perhaps a positive relation to the probability of successful targeting if activism serves as a substitute for takeovers. On the other hand, the presence of large outside blockholders can increase the likelihood that a firm is targeted (Shleifer and Vishny (1986)). Shivdasani (1993) finds a positive (negative) relation between ownership by block- holders unaffiliated (affiliated) with management and the likelihood of a hostile takeover attempt. If activism is an alternative form of corporate control and institutional investors act as large unaffiliated blockholders, then the level of institutional ownership will be positively related to the probability that a firm becomes subject to shareholder activism. If institutional investors behave more like affiliated blockholders, as some evidence indicates (Pound (1988) and Roe (1990)), there may be a negative relation between activism targeting and the level of institutional ownership.
3"Active" in this study refers to the involvement in monitoring the management of portfolio firms as opposed to active security selection (i.e., stock picking) without taking an active role in monitoring.
This content downloaded from 128.197.27.9 on Tue, 30 Apr 2013 05:01:04 AMAll use subject to JSTOR Terms and Conditions
230 The Journal of Finance
Firm size may affect the likelihood of being targeted. If larger firms comprise a larger percentage of an institution's investment portfolio (perhaps due to indexing strategies), the expected benefits may be larger from targeting these firms since the private gain to the activist, if targeting is successful, is larger. Therefore, firm size and likelihood of targeting should be positively related. Martin and McCon- nell (1991) find an inverse relation between stock price performance prior to takeover and management turnover following takeover. If stock price perfor- mance reflects managerial performance and firms with poor stock price perfor- mance are more likely to be disciplined, then there should be a negative relation between stock price performance and probability of being targeted through activ- ism. Finally, Tobin's q or a market-to-book ratio of firm value may be related to the probability of being targeted with shareholder activism. This follows from the findings of Lang, Stulz, and Walkling (1989) and Servaes (1991), which show a relation between Tobin's q and gains to takeovers. Firms with lower Tobin's q or market-to-book ratios should have a higher probability of targeting. Analysis of characteristics of firms targeted and firms not targeted by an activist shareholder will allow for investigation of these hypotheses.
Apart from determining which factors may influence target selection, the ques- tion of whether shareholder activism benefits shareholders of targeted firms by aligning managerial incentives has not yet been answered. If shareholder activ- ism is beneficial for shareholders of targeted firms, there should be observable effects for firms when they are targeted by an activist institutional investor. The argument parallels that of Kaplan (1989) and Jensen (1986, 1988) who study bonding activity. If activism, like bonding, aligns incentives, then improvements in operating performance should follow targeting by an activist institution. If investors perceive that targeting is likely to improve operating performance, then firm market value is expected to increase with unanticipated activism. Firm market value could also increase if activism targeting is associated with an increase in the probability that the firm will be subject to a takeover attempt. On the other hand, if the practices of activist institutions or regulatory constraints of institutional investors make shareholder activism ineffective, then there would be no expected improvement in operating performance and no associated increase in shareholder wealth. The initial stock price reaction could still be positive if investors incorrectly perceive benefits from activism, but the initial reaction would be corrected over time.
This study also examines whether activism has spillover effects on firms not targeted. If firms perceive themselves to be candidates for activism, the threat of activism may align incentives of managers with shareholders and there may be observable changes in potential activism targets similar to actual targets.
IT. CalPERS and the Practice of Shareholder Activism
The institutional investor widely regarded as the leader in shareholder activism in the U.S. equities market is the California Public Employees' Retirement System ("CalPERS" or the "System"). CalPERS is the largest public pension fund in the United States (second largest pension fund) with
This content downloaded from 128.197.27.9 on Tue, 30 Apr 2013 05:01:04 AMAll use subject to JSTOR Terms and Conditions

Shareholder Activism by Institutional Investors 231
$72 billion in assets in 1993 including $24 billion in domestic equities, $19 billion of which is managed internally by CalPERS staff (the rest is managed by external money managers).4 CalPERS has had an organized shareholder activism campaign since 1986.
To encourage shareholder activism by interested institutional investors, CalPERS was a primary participant in the creation of the Council of Institu- tional Investors in 1984.5 The Council serves as a clearinghouse for activist institutional investors and provides information to members on firms with poor stock price performance, and as of June 1993 represented 80 institutional investors with a total of approximately $600 billion in assets. CalPERS also has been involved in public policy formation on the federal and state levels. For example, in 1989 CalPERS proposed Securities and Exchange Commission (SEC) proxy reform that was enacted in 1992.6 CalPERS was chosen for this study due to the prominent role it plays in shareholder activism, because it has a longer history of activism than other organizations, is large enough as a shareholder to potentially have an impact by itself, and is open about its practices.7
Firms the System considers for activism are in the System's internally managed portfolio and according to CalPERS officials, the target selection process can be divided into two regimes. The first covers the 1987 and 1988 proxy seasons during which the primary criterion was corporate governance structure (e.g., presence of a poison pill). The second covers the 1989 to 1993 proxy seasons during which stock price performance was the primary criterion.
During the 1987 and 1988 proxy seasons CalPERS targeted firms based primarily on their corporate governance structures. In Fall 1986, CalPERS identified 47 firms held in its portfolio (portfolio firms) that had implemented poison pills without shareholder approval. Of those 47, CalPERS identified the subset in which it was one of the largest shareholders and in which the level of institutional ownership was high (typically above 60 percent). Ten firms met these criteria and were selected to be targets of shareholder resolutions re- questing rescission of the poison pills. In Fall 1987, the System expanded its governance structure criteria to include firms making greenmail payments and firms not using confidential shareholder voting systems. The governance structure and ownership structure (CalPERS and institutional holdings) cri-
4 CalPERS Asset Allocation Report, 1/21/93. 5 Information on the Council of Institutional Investors is based on documents from the Council,
discussions with CalPERS officials, and Chernoff, Joel, "CII Greets Newcomers Cautiously," Pensions & Investments, April 5, 1993, pp. 16,22.
6 Prior to the October 1992 changes to the proxy rules, if more than ten shareholders as a group discussed a company's business, they were required to send information to the other shareholders. This communication restriction was eased with the 1992 proxy reform such that an unlimited number of shareholders can communicate as long as written materials are provided to the SEC.
7 Most information has been obtained from personal meetings with CalPERS officials including the Chief Investments Officer, Director of Research, Assistant General Counsel, and Senior Officer in Charge of Corporate Relations.
This content downloaded from 128.197.27.9 on Tue, 30 Apr 2013 05:01:04 AMAll use subject to JSTOR Terms and Conditions
232 The Journal of Finance
teria resulted in identification of seven target firms for the 1988 proxy season (two of which were also targets in 1987).
The target selection process changed in Fall 1988, when the primary selec- tion criterion shifted from governance structure to firm performance and the selection process became more sophisticated. The process begins in June of each year by ranking portfolio firms based on five-year stock returns ending the previous calendar year. From this ranking, the bottom quartile of firms (approximately 250 firms referred to internally as the "Bottom 250") is chosen for further analysis. Firms in the Bottom 250 are eliminated as potential targets if they have high levels of inside ownership, large employee stock ownership plans (ESOPs), low levels of institutional ownership, or if CalPERS is not one of the largest shareholders.
The result of the above filtering each year is a list of approximately 50 firms which is referred to internally as the "Failing Fifty." Firms in the Failing Fifty are then analyzed further and the Investment Committee identifies approxi- mately 12 targets and one corporate governance structure issue (for each target) that it will pursue in the form of a shareholder resolution.8 Shareholder resolutions have included creating shareholder advisory committees, changing the composition of the board of directors and its committees, and restructuring executive compensation.
Because many firms have fall filing deadlines for shareholder resolutions, the first step in notifying targets is to file shareholder resolutions with the target firms. In 1992 CalPERS tested what it considered to be a less adver- sarial approach, in which resolutions were not filed with target firms. At the same time a resolution is filed, a letter is sent to the Chairman of the Board, CEO, or both, requesting a meeting with CalPERS officials to discuss ways in which the governance structure goals of CalPERS can be met without the need for shareholder resolutions to reach a vote. If management is persuaded to adopt the proposal or if a suitable compromise is reached, CalPERS withdraws the resolution and it does not appear in the proxy statement and hence is not voted on. For this reason, studies examining only firms with proposals in their proxy statements exclude many firms that are subject to activism. Proposal adoption or settlement is the desired outcome for CalPERS because even if shareholder resolutions receive a majority of votes, they often are nonbinding.9
III. Data
The primary sample used in this study is the comprehensive set of activism targets of CalPERS from 1987 to 1993. Since CalPERS is a leader in activism,
8 In many instances, the Investment Committee will coordinate its targeting activity with other activists. This coordination typically takes the form of obtaining cosponsorship of shareholder resolutions. For example, resolutions filed at ten of the twelve firms targeted in 1989 were cosponsored by the Treasurer of the State of Connecticut and/or the Pennsylvania Public School Employees' Retirement System.
9 See Gordon and Pound (1993), Loss (1988), and Clark (1986) on the limitations of shareholder proposals (SEC Rule 14A-8).
This content downloaded from 128.197.27.9 on Tue, 30 Apr 2013 05:01:04 AMAll use subject to JSTOR Terms and Conditions

Shareholder Activism by Institutional Investors 233
if significant results are not found, results are not likely to be found for other activists. The total number of target firms used in the study is 51. For each target year 1987 to 1993, names of firms targeted, descriptions of shareholder resolutions filed with targets, percents of target firm's outstanding common stock held, and outcomes of targeting are obtained from CalPERS. Analysis is conducted relative to the first year a firm is targeted by CalPERS.10
To test for factors that may affect target selection and to examine changes in operating performance, three control samples are constructed. First, following Kaplan (1989), an industry-matched sample was created. Each target firm's 4-digit SIC code is identified from COMPUSTAT and a matched firm with the same 4-digit SIC code and nearest sales level in the year prior to being targeted is selected from firms listed on COMPUSTAT. In all cases a match is found at the four-digit level, and there is no difference statistically between the samples in terms of sales level (not reported). This sample will serve as a control group of firms not targeted and should reflect any industry-wide changes in operat- ing performance for target firms.
The second control sample is made up of firms that, according to CalPERS officials, are considered potential targets. These firms are in the "Failing Fifty" group over the period 1991 to 1993 but were not targeted. This control sample (Remaining Failing Fifty) is useful because it is made up of firms that should be similar to target firms in terms of the performance and ownership structure characteristics that CalPERS says are important in the target selection pro- cess, but differ from targets along some dimensions. This sample is used to examine target selection factors and possible spillover effects of activism. The Remaining Failing Fifty sample is comprised of 95 firms.
The third control sample is comprised of firms that appear to be candidates for activism in terms of performance but are or consider themselves to be insulated from activism. One definition for this sample is firms in the bottom quartile of CalPERS's portfolio when ranked by previous five-year stock re- turns (exclusive of targets and firms in the Remaining Failing Fifty). These firms (Remaining Bottom 250) should be similar to targets and firms in the Remaining Failing Fifty in terms of stock price performance, but differ along some dimensions (e.g., level of inside ownership or institutional ownership) which precludes them from appearing in the Failing Fifty and consequently reduces the probability that the firms would become activism targets. This sample is created by replicating CalPERS's internally managed portfolio for each year 1985 to 1991 based on market value of equity and identifying the 250 firms with the lowest returns over the previous five years. Firms are included only for the first year they appeared in the Bottom 250. Firms that were targeted or appeared in the Remaining Failing Fifty sample are eliminated from this sample. The result is a sample of 578 firms. This sample is used also for target selection and spillover effects analysis.
10 A search is conducted using the Dow Jones News Retrieval for evidence that firms were targeted before the first year they were targeted by CalPERS, and no such evidence is found.
This content downloaded from 128.197.27.9 on Tue, 30 Apr 2013 05:01:04 AMAll use subject to JSTOR Terms and Conditions

234 The Journal of Finance
Table I
Shareholder
Activism
Events
by
Governance
Structure
Resolution
Number of
shareholder
activism
targeting
events by
target
year
and
governance
structure
change
sought by
CalPERS
over
the
period
1987 to
1993.
Also
included in
brackets
are
number of
firms
targeted for
the
first
time
and
number of
those
firms
that
either
adopted
the
proposed
resolution or
made
changes
sufficient to
warrant a
settlement
with
CalPERS. In
the
Fall of
1993
specific
resolutions
were
not
identified for
targeted
firms
but
were all
performance-
related.
Takeover-related
Resolutions
Performance-related
Resolutions
Create
Redeem
"Opt
Out"
Implement
Shareholder
Reduce
Poison
of
State
Rein-
Prohibit
Confidential
Advisory
Alter
Board
Executive
Count
Voting
-
Not
Year
Pill'
Law2
corporate3
Greenmail4
Voting5
Committee6
Composition7
Compensation8
Abstentions9
Identifiedl'
Total
1987
10
[10,0]
10
[10,0]
1988
5
[3,1]
1
[1,0]
1
[1,0]
7
[5,1]
1989
5
[1,0]
1
[1,0]
1
[1,1]
4
[3,2]
1
[1,1]
12
[7,4]
1990
3
[0,0]
1
[0,0]
4
[2,1]
4
[3,3]
1
[1,1]
13
[6,5]
1991
1
[1,0]
2
[2,2]
3
[1,0]
2
[1,1]
1
[1,1]
2
[2,2]
1
[1,1]
12
[9,7]
1992
5
[3,1]
4
[2,1]
3
[3,2]
12
[8,4]
1993
12
[6,6]
12
[6,6]
Total
23
[14,1]
3
[2,0]
3
[3,3]
1
[1,0]
12
[7,3]
11
[7,5]
6
[4,3]
5
[5,4]
2
[2,2]
12
[6,6]
78
[51,27]
'Resolution
calling for
the
board of
directors to
redeem a
poison
pill
that
had
been
implemented.
2
Resolution to
have
the
targeted
firm
"opt
out" of
coverage by
Delaware's
state
antitakeover
laws.
3
Resolution for
the
targeted
firm to
change
state of
incorporation
from
Delaware to
California
(1989) or
Pennsylvania to
Delaware
(1991).
4
Resolution to
amend
company
bylaws to
prohibit
repurchase of
shares at
price
above
market
from 3
percent or
greater
equityholder.
5
Resolution to
change
proxy
voting
process so
that
management
cannot
identify
how
individual
shareholders
vote.
6
Resolution for the
creation of a
shareholder
advisory
committee
with
representatives
from
shareholder
groups to
provide
input in
major
decisions
(e.g.,
nominating
candidates
for
the
board of
directors,
compensating
managers,
financial
restructuring,
etc.).
7
Resolution to
change
the
composition of
the
board of
directors by
increasing
the
proportion of
independent or
outside
directors.
8
Resolution to
decrease
the
level of
compensation to
executive
officers of
the
targeted
company.
9
Resolution to
count
abstentions
from
voting at
annual
meetings as
"no" or
"against"
votes on all
voting
matters.
10
Specific
resolutions
not
identified
for
each
target
but
were
related to
shareholder
advisory
committees,
board
composition,
and
compensation.
This content downloaded from 128.197.27.9 on Tue, 30 Apr 2013 05:01:04 AMAll use subject to JSTOR Terms and Conditions

Shareholder Activism by Institutional Investors 235
Data used for empirical analysis are obtained from CalPERS documents (targeting information and CalPERS holdings data), COMPUSTAT (company financial data), Center for Research in Security Prices (CRSP) (stock returns), Standard & Poor's Stock Reports (institutional ownership figures), company proxy statements (inside ownership figures, and proxy mailing and annual meeting dates), the Dow Jones News Retrieval System (public announcements of targeting and outcomes) and Standard & Poor's Register of Corporations, Directors, and Executives (management turnover, board of directors composi- tion, and number of SIC codes).
Table I shows the distribution of the 78 targeting events and 51 target sample firms by year and type of shareholder resolution. The resolutions are categorized by takeover-related and performance-related issues. The decline in takeover-related resolutions after 1988 coincides with the decline of the mar- ket for corporate control. One interpretation is that the market for corporate control over this period is perceived to be ineffective regardless of firm gover- nance structure.
IV. Empirical Results
A. Target Selection Factors
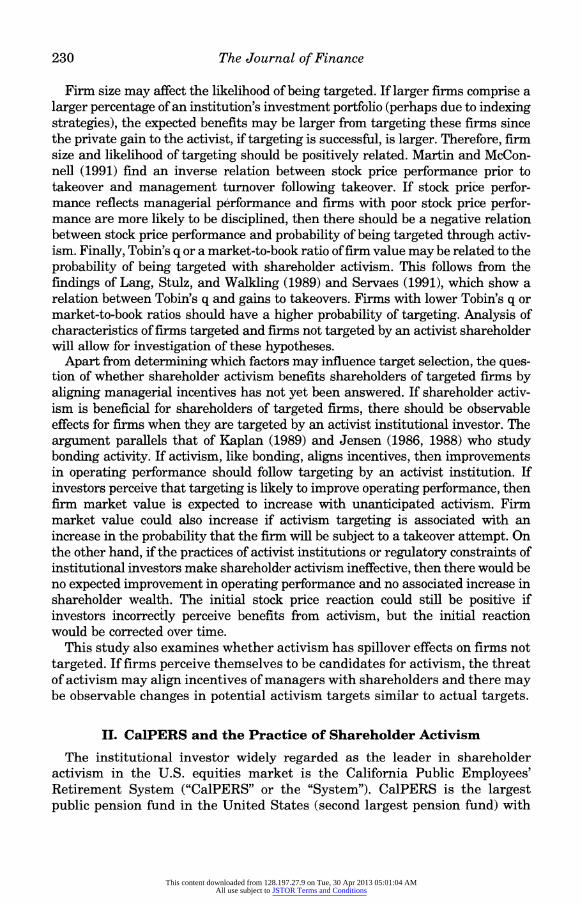
A primary selection criterion over the most recent portion of the sample period appears to be stock price performance. Table II presents summary statistics on pretargeting stock price performance for the entire sample and various subsamples.1" The table reflects the shift to stock price performance in 1989. Overall, the median abnormal return is negative and significant, with significant differences between the two sample periods and the two general types of proposals and a marginally significant difference between successful and unsuccessful outcomes. These results are consistent with the hypothesis that stock price performance and probability of being targeted for activism are inversely related. Figure 1 presents the returns over the entire five-year period and reflects that most of the poor performance actually occurs in the two or three years preceding targeting.
To examine other factors leading to targeting, I run two sets of probit regressions - one looking at the probability of being targeted, and the other the probability of success. Table III presents results from probit regressions of target selection where the dependent variable is equal to one if the firm was targeted by CalPERS and zero otherwise. The independent variables are those factors hypothesized in Section II to affect the likelihood of targeting. Firm size is measured as the log of the market value of equity. Ownership structure is measured by both level of inside (officer and director) and institutional own- ership. Prior period stock price performance is measured as five-year market- adjusted holding period return using the CRSP equal-weighted index. Market-
" Returns are calculated as holding period abnormal (market-adjusted) returns using the CRSP value-weighted index. Returns are also calculated using the equal-weighted index (reported in an earlier draft of this paper) with similar, although more negative, results.
This content downloaded from 128.197.27.9 on Tue, 30 Apr 2013 05:01:04 AMAll use subject to JSTOR Terms and Conditions

236 The Journal of Finance
Table II
Target
Sample
Pretargeting
Performance
Mean
and
median
five-year
holding
period
abnormal
stock
returns
ending
the
calendar
year
prior to
being
selected as a
target.
Abnormal
returns
are
market-adjusted
returns
compounded
daily
from
CRSP
using
the
value-weighted
index.
Numbers in
parentheses
are
p-values for
t-tests
(means)
and
Wilcoxon
signed
rank
tests
(medians)
for
difference
from
zero.
Firms
targeted by
CalPERS
are
divided
into
samples by
period
they
were
targeted
(1987-88 or
1989-93),
type of
shareholder
resolution
(takeover-related or
performance-related),
and
outcome of
targeting
(successful or
unsuccessful)
where a
successful
outcome is
defined as
one
where
the
targeted
firm
either
adopts
the
resolution or
makes
changes
sufficient to
warrant
withdrawal
of
the
resolution by
CalPERS.
Difference-in-means
tests
are
conducted
for
time
period,
resolution
type,
and
outcome
sub-samples.
Takeover
Performance
Successful
Unsuccessful
Sample
Resolution
Resolution
Outcome
Outcome
Totals
1987-88
Mean
49.75%
(0.12)
81.97%
(na)
66.75%
(na)
50.84%
(0.11)
51.90%
(0.08)
Median
20.68%
(0.14) n =
14
81.97%
(na) n = 1
66.75%
(na) n = 1
20.68%
(0.12) n =
14
33.30%
(0.07) n =
15
1989-93
Mean
0.44%
(0.99)
-34.25%
(0.00)
-25.12%
(0.00)
-37.16%
(0.00)
-28.47%
(0.00)
Median
-4.68%
(1.00) n = 6
-34.19%
(0.00) n =
30
-33.32%
(0.00) n = 26
-31.28%
(0.00) n =
10
-32.82%
(0.00) n =
36
Takeover
Mean
50.45%
(0.06)
31.09%
(0.28)
resolution
Median
48.09%
(0.13) n = 4
-1.29%
(0.60) n =
16
Performance
Mean
-34.27%
(0.00)
-19.66%
(0.24)
resolution
Median
-34.69%
(0.00) n = 23
-29.42%
(0.20) n = 8
Totals
Mean
34.96%
(0.13)
-30.50%
(0.00)
-21.72%
(0.00)
14.17%
(0.47)
-4.83%
(0.64)
Median
11.07%
(0.18) n =
20
-33.68%
(0.00) n =
31
-32.95%
(0.00) n = 27
-15.07%
(0.76) n =
24
-22.69%
(0.02) n =
51
Difference-in-Means
Tests:
Samples
Difference
t-statistic
1987-88 v.
1989-93
80.37%
2.85
Takeover v.
Performance
65.46%
2.87
Successful v.
Unsuccessful
35.89%
1.73
This content downloaded from 128.197.27.9 on Tue, 30 Apr 2013 05:01:04 AMAll use subject to JSTOR Terms and Conditions

Shareholder Activism by Institutional Investors 237
50%
AllTargets /
40% - - - -1987-88 Targets '_ 1989-93 Targets /
,/
30% - _ v v
/, a ,/ ; 20%
Zs 10% . . ._ . ..
7...,~~~.
-10% .......
-20%
-30%
-1260 -1008 -756 -504 -252 -1
Days Relative to Target Identification
Figure 1. Pretargeting stock price performance of firms targeted by CalPERS 1987-93. Cumulative abnormal returns for 51 firms targeted by CalPERS over the 1987-93 period and for subsamples of firms targeted during the 1987-88 (15 firms) and 1989-93 (36 firms) periods. Cumulative abnormal returns are compounded daily market-adjusted returns using the Center for Research in Security Prices (CRSP) value-weighted index. Returns are calculated over the five year period ending the calendar year prior to being selected as a target.
to-book is measured following Smith and Watts (1992) as the ratio of firm market value (market value of equity plus book value of assets minus book value of equity) and book value of assets.
The first regression model in Table III includes the target, Remaining Failing Fifty, and Remaining Bottom 250 samples for all years 1987 to 1993. Results suggest that firm size and level of institutional ownership are posi- tively related to target selection. In other words, the larger the firm and the higher the level of institutional ownership, the greater the probability of being targeted given the firm appears in the Bottom 250. The relation between firm size and probability of being targeted may be due to CalPERS's investment policy of indexing its internally managed portfolio and the institutional con- straints on its ability to alter positions in portfolio firms. That is, since CalPERS is required to hold the largest firms in the market in its portfolio (the result of indexing), these firms are more likely to be targeted given poor performance since these firms represent larger portions of CalPERS's portfolio and hence can provide the largest gains to CalPERS. Interestingly, the level of inside ownership does not appear to be a significant factor in target selection. Market-to-book is negatively related to probability of being targeted, as ex- pected, but not significant. As CalPERS did not select targets based on prior performance until 1989, however, including targets (and firms in the Bot-
This content downloaded from 128.197.27.9 on Tue, 30 Apr 2013 05:01:04 AMAll use subject to JSTOR Terms and Conditions

238 The Journal of Finance
Table III
Target Selection Model Probit model estimates of target selection where the dependent variable is equal to one if the firm was selected as a target and zero otherwise. The sample is comprised of firms targeted by CalPERS, firms in the Remaining Failing Fifty sample, and firms in the Remaining Bottom 250 sample. The independent variables are log of the market value of equity for the firm (LMVE), percent of outstanding shares held by officers and directors (INSIDE), percent of shares held by institutional investors (INST), the five-year cumulative abnormal return (market-adjusted) end- ing the year prior to appearing in the samples (CUMABN) and market-to-book (MKT/BK). All variables are measured as of the fiscal year end prior to the firms appearing in their respective samples.
Full Sample 1989-93 Sample
Variable Mean Coefficient (p-value) Coefficient (p-value)
Intercept 1.0000 -6.5711 -9.1334 (0.0000) (0.0000)
LMVE 6.9570 0.6200 0.8346 (0.0000) (0.0000)
INSIDE 0.0602 -0.5282 0.2626 (0.8028) (0.9036)
INST 0.5383 2.9580 3.9082 (0.0005) (0.0006)
CUMABN -0.4226 1.4107 0.0535 (0.0000) (0.9067)
MKT/BK 0.9690 -0.2128 -0.1404 (0.3426) (0.5814)
N 327 199 Log-Likelihood -95.679 -62.987 Restricted Log-Likelihood -141.560 -94.080 Chi-Squared 91.768 62.186 (p-value) (0.0000) (0.0000)
tom 250) from 1987 and 1988 for this model may not be appropriate. This would explain the positive coefficient for pretargeting abnormal stock re- turns (CUMABN). The second regression includes only firms appearing in the samples after 1988, and the results from this regression are very similar to those for the full sample, with the exception of the coefficient for CUMABN which is not significantly different from zero. LMVE and INST have significant positive coefficients. The statistically insignificant coefficient for CUMABN suggests that prior performance of firms among the Bottom 250 is not a significant factor in target selection. Market-to-book is not significantly re- lated to targeting.
Table IV reports results from probit regressions of targeting outcome where the dependent variable is equal to one if the outcome of targeting was success- ful and zero otherwise and the sample is firms targeted by CalPERS. This analysis may reflect which variables affect the probability of success and therefore expected benefits from targeting. The table includes results for four different model specifications. In the first model, the statistically insignificant coefficient estimate for each independent variable suggests that although at
This content downloaded from 128.197.27.9 on Tue, 30 Apr 2013 05:01:04 AMAll use subject to JSTOR Terms and Conditions

Shareholder Activism by Institutional Investors 239
Table IV
Model Estimation for Targeting Outcome Probit model estimates of targeting event outcome where the dependent variable is equal to one if the targeted firm adopted the shareholder resolution or made changes sufficient to warrant a settlement and zero otherwise. The independent variables are log of the market value of equity for the firm (LMVE), percent of outstanding shares held by officers and directors (INSIDE), percent of shares held by institutional investors (INST), the five-year cumulative abnormal return (mar- ket-adjusted) ending the year prior to being selected for targeting (CUMABN), market-to-book (MKT/BK), a dummy variable (TYPE) equal to one if the shareholder resolution was takeover- related and zero if the resolution was performance-related, and the two-day abnormal return (CPE) at initial public announcement of targeting. LMVE, INSIDE, and INST are measured as of the year end prior to target selection. The sample is comprised of 51 firms targeted by CalPERS between 1987 and 1993 (Full Sample) and the 39 targeted firms with public announcements of targeting (Announcement Sample).
Full Sample Announcement Sample
Coefficient Coefficient Coefficient Coefficient Variable Mean (p-value) (p-value) (p-value) (p-value)
Intercept 1.0000 1.2698 5.8969 0.1102 0.6278 (0.6741) (0.1119) (0.9786) (0.8894)
LMVE 7.8331 -0.0168 -0.3532 0.3296 0.2731 (0.9440) (0.2094) (0.3154) (0.4727)
INSIDE 0.0261 9.5340 2.4759 9.1748 8.4332 (0.1981) (0.7331) (0.2519) (0.3166)
INST 0.6422 -1.1082 -2.8996 -1.8232 -1.9676 (0.5974) (0.2435) (0.5264) (0.5026)
CUMABN -0.1519 -0.5124 0.1467 -0.4262 -0.3522 (0.1617) (0.7222) (0.3721) (0.5150)
MKT/BK 0.8351 -0.7952 -0.7009 -2.5150 -2.3497 (0.1321) (0.2355) (0.0370) (0.0741)
TYPE 0.3922 -1.6512 -0.2190 (0.0010) (0.7731)
CPE -0.0003 31.2642 29.2641 (0.0119) (0.0374)
N 51 51 39 39 Log-Likelihood -32.056 -25.785 -15.314 -15.273 Restricted Log-Likelihood -35.262 -35.262 -25.525 -25.525 Chi-Squared 6.412 18.955 20.421 20.503 (p-value) (0.2682) (0.0042) (0.0023) (0.0046)
least some of these factors (firm size and institutional ownership) are impor- tant in the target selection process, they do not affect the likelihood of success in targeting. In the second model an indicator variable (TYPE) equal to one for takeover-related and zero for performance-related resolutions is added. The negative and statistically significant coefficient estimated for TYPE suggests that performance-related resolutions have a higher probability of success than takeover-related resolutions after controlling for firm size, ownership struc- ture, pretargeting abnormal return, and market-to-book.
The other two model specifications reported in Table IV include only the 39 firms for which initial public announcements of targeting and corresponding
This content downloaded from 128.197.27.9 on Tue, 30 Apr 2013 05:01:04 AMAll use subject to JSTOR Terms and Conditions

240 The Journal of Finance
two-day abnormal returns (CPE) are available (described below). The results suggest that CPE is positively related to targeting success and given that when TYPE and CPE are included, TYPE loses its statistical significance, CPE appears to be more important than TYPE. For the announcement sample, market-to-book has a significant negative relation to success. It does not appear that firm size, ownership structure, or pretargeting abnormal return explain targeting outcome. This finding, along with the results from target selection analysis, suggests ownership structure and firm size affect expected benefits from targeting through the shareholder's private gain rather than through the probability of success, while market-to-book ratio may affect expected benefits through probability of success. Overall, the results on target selection are consistent with the hypotheses that firm size and level of insti- tutional ownership affect the expected benefits from activism.
These results are largely consistent with recent studies of activism through shareholder proposal filings. Karpoff, Malatesta, and Walkling (1994), in a study of shareholder proposal filings during the 1986 to 1990 proxy seasons, most of which were made by individuals (as opposed to institutions), find level of institutional ownership to be positively related and prior firm performance to be negatively related to the likelihood of receiving a shareholder proposal. John and Klein (1994) find similar results in their study of proposal filings between July 1991 and June 1992 made by individual and institutional inves- tors. Namely, prior accounting performance is negatively and firm size is positively related to probability of receiving a shareholder proposal.
Also of interest is whether firms targeted for activism are different than control firms in terms of board of director composition and level of firm diversification. Data is collected from Standard & Poor's Register of Corpora- tions, Directors and Executives on board size and percent that are insiders (employees of the firm) for the year before targeting for the target sample and the industry-matched sample, and the year before the firms appeared in the sample for the Remaining Failing Fifty. Targets have the same number of directors as their industry matches (median of 13 for both) and more than firms in the Remaining Failing Fifty (median of 11). The difference between the medians for targets and Remaining Failing Fifty is statistically significant (z = 4.34). Targets have a lower percent of insiders on the board (median of 18.5 percent) than either their industry matches (median of 22.2 percent) or the Remaining Failing Fifty (median of 22.2 percent), although the differences are not statistically significant at conventional levels (z = -1.84 and z = -1.39, respectively). Targets are also in more SIC codes than their industry matches or firms in the Remaining Failing Fifty. Targets are in an average (median) of 7.76 (6) codes versus 6.84 (4) for industry matches and 5.21 (3) for firms in the Remaining Failing Fifty. The average and median for targets are not statistically different from the average and median for the industry matches (t = 0.72 for difference in means, z = 1.16 for difference in medians). The average and median for.targets are significantly larger than the average and median for the Remaining Failing Fifty, however (t = 2.53 for means and
This content downloaded from 128.197.27.9 on Tue, 30 Apr 2013 05:01:04 AMAll use subject to JSTOR Terms and Conditions

Shareholder Activism by Institutional Investors 241
z = 2.76 for medians). These results suggest that activism targets have slightly different board composition and are more diversified than control firms.
B. Effect of Shareholder Activism on Corporate Governance Structure
One measure of the effectiveness of shareholder activism is the success rate of achieving desired changes in corporate governance structures. Table I shows the distribution across target year and resolution type of the number of firms that either adopted the CalPERS shareholder resolution or made changes sufficient to warrant a settlement with CalPERS the first year they were targeted. During the first two years, when CalPERS was selecting targets based on governance structure, only one of the 15 firms targeted for the first time (7 percent) adopted the resolution or made changes sufficient to warrant a settlement. These numbers may provide another interpretation of the decline of takeover-related resolution filings. That is, in response to little success getting takeover-related resolutions adopted, CalPERS shifted to perfor- mance-related resolutions. Over the 1989 to 1993 period, 26 of the 36 targeted firms (72 percent) either adopted the resolution or settled the first year targeted. While results from the probit analysis indicate that performance- related resolutions have higher success rates than takeover-related resolu- tions, this table reflects that the success rate also has increased over time. Over the entire time period, 72 percent of performance-related targeting was successful, with 100 percent successful in 1993.
Another measure of the effect of activism on governance structure is whether activism results in changes in management, as found in hostile takeovers. Following Martin and McConnell (1991), annual CEO turnover for each of the target, industry-matched, and Remaining Failing Fifty samples from two years before targeting to three years following targeting is calculated. Target firms generally have higher CEO turnover throughout the event period than industry-matched or Remaining Failing Fifty firms. While the industry- matched sample has turnover ranging from 10 to 12 percent, the target sample ranges from 11 to 16 percent, fluctuating around 16 percent from years -2 to +2. Firms in the Remaining Failing Fifty experience a spike in turnover the year before first appearing in the sample to 26 percent, but have between 9 and 14 percent in the other years. This increase in turnover for the Remaining Failing Fifty may reflect that for these firms, other forces were disciplining poor managers. While CEO turnover is generally higher for the target sample, it is not statistically different than that for either the industry-matched or Remaining Failing Fifty samples. Overall, the results on the effect of activism on governance structure indicate that activism is reasonably successful in getting governance structure changes adopted, particularly performance-re- lated changes, but there is no marked effect on management turnover from activism.
This content downloaded from 128.197.27.9 on Tue, 30 Apr 2013 05:01:04 AMAll use subject to JSTOR Terms and Conditions

242 The Journal of Finance
C. Effect of Shareholder Activism on Stock Price
To test whether targeting results in stock price increases, stock returns are examined two ways, both of which follow Partch (1987). First, abnormal returns are measured around the initial public announcement of targeting by CalPERS. Wall Street Journal, Barrons, and Dow Jones News Wire articles and company press releases by target firms and CalPERS are searched over a one-year period centered on the mailing date of the targeting letter to each targeted firm. In addition to news articles and press releases, company proxy statements are searched for CalPERS-sponsored shareholder proposals. Of the 51 firms targeted, public announcements of targeting are found for 39 firms through 1993.12
Second, abnormal returns are measured over the period from initial public announcement to public announcement of the outcome of targeting (settlement or the annual meeting date). This event window includes more information about the targeting event but also adds noise, and thus reduces the power of statistical tests. In 16 cases the outcome date is the annual meeting, in 14 cases it is a Wall Street Journal or Dow Jones News Wire date when a settlement is announced, and in nine cases no outcome announcement is identified. This longer event window has an average length of 21.1 trading days and a median length of 22 trading days.
Table V presents evidence of the effects of shareholder activism on firm market value. The finding of no effect on stock price for the entire sample is consistent with (i) activism having no effect on firm value, (ii) activism having an effect but it is anticipated, and (iii) activism having mixed effects -positive and negative. In an effort to detect anticipation, abnormal returns over a 60-day period preceding the initial public announcement of targeting is exam- ined (not reported). No significant abnormal returns during this pre-announce- ment period are found, so it does not appear that targeting is anticipated in a systematic fashion. To examine the possibility that targeting has mixed effects on targeted firms, stock price reactions for sub-samples of targeted firms are evaluated to identify any systematic patterns.
Given the change in targeting policy in 1988, there may have been a corre- sponding change in the effects of targeting. For this reason, an examination of subperiods of 1987-1988 and 1989-1993 is done. These results suggest that targeting during 1987 and 1988 had the effect of reducing firm market value. One possible explanation is that CalPERS produces information that has not been incorporated in the stock price prior to targeting (e.g., these firms are more resistant to takeovers than previously believed). Another possible expla- nation is that the market anticipates resistance by management to changes sought by the activist and capitalizes costs, which reduces market value. Over the 1989-1993 period, targeting caused no significant change in firm market
12 In 24 cases the first public announcement of targeting appears in the Wall Street Journal (six of these are announcements that the firm has been targeted and has reached a settlement). In 14 cases the first announcement appears as a shareholder proposal included in the company's proxy statement, and in one case the annual meeting is the first identifiable date.
This content downloaded from 128.197.27.9 on Tue, 30 Apr 2013 05:01:04 AMAll use subject to JSTOR Terms and Conditions

Shareholder Activism by Institutional Investors 243
Table V
Effect of Shareholder Activism on Stock Price Mean and median two-day cumulative abnormal returns around initial public announcement of targeting for 39 firms that were targeted by CalPERS between 1987 and 1993. The two-day period begins the day before an announcement in the Wall Street Journal or the day of a proxy mailing or annual meeting. Abnormal returns are estimated using the market model, the Center for Research in Security Prices (CRSP) value-weighted index, and a 200-day estimation period beginning 260 days prior to initial announcement. The "successful" sample is comprised of firms that either adopt CalPERS's shareholder resolution or make governance changes sufficient to warrant a settlement by CalPERS. Firms in the "takeover" and "performance" samples were targeted with takeover- and performance-related resolutions, respectively. Test statistics for difference from zero for the mean (z-statistic) and median (Wilcoxon signed rank) are also reported (p-values for signed rank statistics in parentheses).
Sample Mean z Median Signed Rank % Positive N
Panel A: Entire Sample
1987-93 -0.08% 0.05 -0.30% -14.00 (0.85) 41.0% 39
Panel B: Divided by Time Period
1987-88 -1.39% -1.86 - 1.31% -19.50 (0.05) 20.0% 10 1989-93 0.37% 1.15 -0.19% 43.50 (0.36) 48.3% 29
Panel C: Divided by Outcome
Successful 1.06% 2.56 1.43% 42.00 (0.09) 57.9% 19 Unsuccessful -1.16% -2.43 -1.59% -57.00 (0.03) 25.0% 20
Panel D: Divided by Type of Resolution
Takeover -1.44% -2.61 -1.31% -32.50 (0.04) 21.4% 14 Performance 0.68% 2.01 0.96% 52.50 (0.16) 52.0% 25
Panel E: 1989-93 Targets
Successful 1.06% 2.56 1.43% 42.00 (0.09) 57.9% 19 Unsuccessful -0.93% -1.58 -1.62% -7.50 (0.49) 30.0% 10 Takeover -1.65% -2.09 -1.75% -3.50 (0.44) 20.0% 5 Performance 0.79% 2.22 1.19% 56.00 (0.11) 54.2% 24
value. Again, these results are consistent with activism having no effect on firm value or mixed effects for different sets of firms.
The results from splitting the sample into successful and unsuccessful out- comes indicate that the effects of activism on firm value may depend on the result of targeting. This would explain the negative abnormal return for firms targeted in the 1987-1988 period since none of those targeting events resulted in adoption or settlement. The results suggest that activism is beneficial to shareholders if the activist is able to change the organizational control struc- ture of targeted firms and may be detrimental to shareholders if unsuccessful (again, possibly due to the capitalization of costs incurred by management in rebuffing the activist).
This content downloaded from 128.197.27.9 on Tue, 30 Apr 2013 05:01:04 AMAll use subject to JSTOR Terms and Conditions

244 The Journal of Finance
Table VI
Effect of Shareholder Activism on Stock Price Mean and median cumulative abnormal returns from initial public announcement of targeting to public announcement of the outcome for 39 firms that were targeted by CalPERS between 1987 and 1993. The event window begins the day before an announcement in the Wall Street Journal or the day of a proxy mailing or annual meeting and ends the day of the Wall Street Journal announcement of the outcome or the annual meeting. Abnormal returns are estimated using the market model, the Center for Research in Security Prices (CRSP) value-weighted index, and a 200 day estimation period beginning 260 days prior to initial announcement. The "successful" sample is comprised of firms that either adopt CalPERS's shareholder resolution or make governance changes sufficient to warrant a settlement by CalPERS. Firms in the "takeover" and "perfor- mance" samples were targeted with takeover- and performance-related resolutions, respectively. Test statistics for difference from zero for the mean (z-statistic) and median (Wilcoxon signed rank) are also reported (p-values for signed rank statistics in parentheses).
Sample Mean z Median Signed Rank % Positive N
Panel A: Entire Sample
1987-93 2.84% 2.19 1.34% 88.00 (0.22) 53.8% 39
Panel B: Divided by Time Period
1987-88 -2.02% -0.26 -2.56% -5.50 (0.63) 50.0% 10 1989-93 4.52% 2.70 2.12% 94.50 (0.04) 55.2% 29
Panel C: Divided by Outcome
Successful 1.91% 2.27 2.12% 51.00 (0.04) 57.9% 19 Unsuccessful 3.73% 0.84 -0.07% 3.00 (0.93) 50.0% 20
Panel D: Divided by Type of Resolution
Takeover 2.21% 0.90 -0.90% -2.50 (0.90) 50.0% 14 Performance 3.20% 2.07 2.12% 77.50 (0.03) 56.0% 25
Panel E: 1989-93 Targets
Successful 1.91% 2.27 2.12% 51.00 (0.04) 57.9% 19 Unsuccessful 9.48% 1.46 0.48% 7.50 (0.49) 50.0% 10 Takeover 8.94% 1.56 -3.14% 0.50 (1.00) 40.0% 5 Performance 3.60% 2.25 2.28% 88.00 (0.01) 58.3% 24
Panel D of Table V divides the sample into takeover- and performance- related resolutions as defined in Table I. These returns are consistent with the argument that the market capitalizes expected costs of resisting the activist since takeover-related resolutions probably are filed with firms believed to have "entrenched" management (i.e., firms with poison pills).
To control for any time-period effects, the abnormal returns for firms tar- geted in the 1989-1993 period are evaluated. The results suggest that the effects of activism are not dependent on the target selection criterion or time period of targeting, but rather the outcome or type of resolution.
This content downloaded from 128.197.27.9 on Tue, 30 Apr 2013 05:01:04 AMAll use subject to JSTOR Terms and Conditions

Shareholder Activism by Institutional Investors 245
18% l l
16%
,~~~~~~~~~~ .' I I
154% g \_ ,
12% % \ ,
~ 10%
8%
6%
Da4%ys All Targets S t w a Successful Targets
("unsuccessful /argets," 24firms).Cumulativeabnormalreturnsarecompo-----Unsuccessful Targets
-2% 1 252 504 756
Days Relative to Targeting
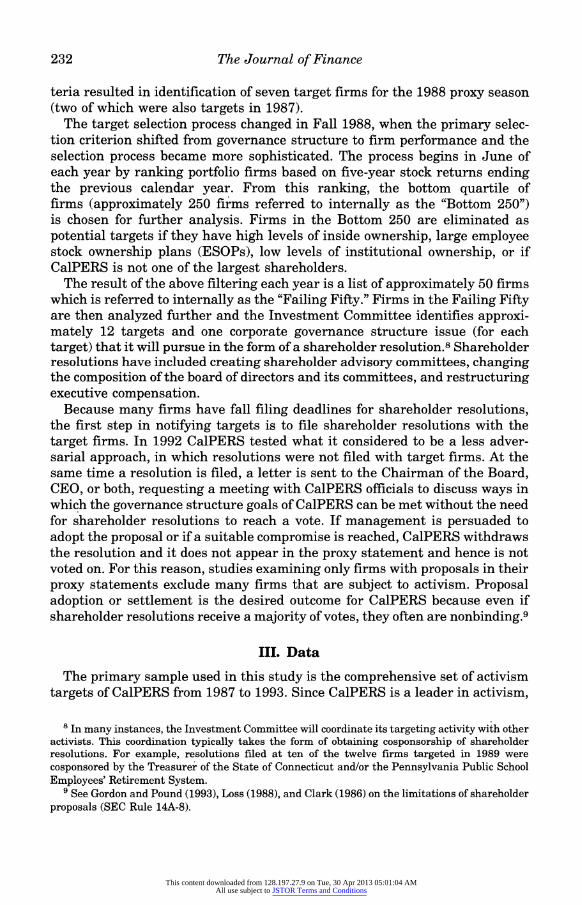
Figure 2. Posttargeting stock price performance of firms targeted by CalPERS 1987-93. Cumulative abnormal returns for 51 firms targeted by CalPERS over the 1987-93 period and for subsamples of firms that either adopt CalPERS's shareholder proposals or make changes suffi- cient to warrant a settlement ("successful targets," 27 firms) and firms that do not adopt or settle ("unsuccessful targets," 24 firms). Cumulative abnormal returns are compounded daily market- adjusted returns using the Center for Research in Security Prices (CRSP) value-weighted index. Returns are calculated over the three-year period beginning the calendar year of targeting. When three years of returns are not available, returns are calculated through December 31, 1993.
The results for the longer event window are reported in Table VI and are similar to those for the initial announcement period. However, the average return for the entire sample becomes significantly positive (2.84 percent, z = 2.19) and the significant negative returns for the subsamples become insignif- icantly different from zero.
An alternative way of examining wealth effects of activism is to estimate dollar value changes in activist holdings. Using abnormal returns for the longer event window (initial announcement to outcome announcement) for the entire sample for which public announcements and CalPERS holdings data is available (34 firms), the total wealth increase for CalPERS from activism is $18,880,817. Given that CalPERS officials have estimated total annual costs of activism at approximately $500,000, activism appears to provide a net benefit to the activist.
Long-term (three-year) stock price performance is examined for evidence of continued underperformance by target firms. Figure 2 shows cumulative ab- normal returns (market-adjusted) for all targets and samples of successful and unsuccessful targets. Targets overall do not underperform the market, with successful targets slightly outperforming unsuccessful targets. This indicates that activism may be effective in stemming poor stock price performance.
This content downloaded from 128.197.27.9 on Tue, 30 Apr 2013 05:01:04 AMAll use subject to JSTOR Terms and Conditions

246 The Journal of Finance
The results on the effect of activism on stock price are consistent with the hypothesis that activism improves operating performance by aligning incentives and with findings of recent studies. Gillan and Starks (1995) find significant positive stock price reaction around proxy mailing dates for first-time targets receiving governance-related proposals from pension funds over the 1990-91 period. Results for an earlier period suggest no wealth changes. They also find negative but insignificant abnormal returns over the three years following tar- geting. Wahal (1995) finds significant positive abnormal returns around targeting announcements (letter mailing and press announcement dates) for post-1989 targets and performance-related targets of nine pension funds. He also finds significant abnormal returns for his sample of some of the firms targeted by CalPERS. Nesbitt (1994) finds significant positive abnormal long-term stock price performance following targeting for a sample of firms targeted by CalPERS.
D. Effect of Shareholder Activism on Operating Performance
One measure of managerial performance, in addition to stock price, is accounting earnings. Since stock price measures the present discounted value of the expected future cash flows of the company, it incorporates expectations that ineffective management will be replaced. Accounting earnings, on the other hand, measure short-term profitability and therefore may be a better measure of managerial performance than stock price, as stock price perfor- mance may understate the effects of external monitoring. This argument is suggested by Weisbach (1988) in a study of monitoring by outside directors.
To test whether target firms experience changes in operating performance following targeting, the methodology of Kaplan (1989) is followed. Specifically, median percent changes in operating income (before depreciation), operating income as a percent of sales, and operating income as a percent of assets are measured.13 Since the empirical literature on the time series properties of earn- ings indicates that earnings follow a random walk, changes in earnings are an unbiased estimate of unexpected earnings and should measure unexpected changes in operating performance. Changes are measured relative to the fiscal year prior to being targeted (e.g., fiscal year-end 1986 is used as the base for firms selected in Fall 1986 and targeted in the 1987 proxy season). In addition to earnings changes, median percent changes in capital expenditures, undistributed cash flow, and asset sales are examined for alternative sources of shareholder wealth gains.
To control for possible market- and industry-wide changes in the accounting measures, changes are adjusted by changes for the industry-matched sam- ple.14 To test for possible spillover effects of activism, changes are compared to
13 Operating income is defined as net sales less cost of goods sold and selling, general, and administrative expenses before depreciation, depletion; and amortization are deducted. Using a measure of earnings before interest and tax expenses reduces the effects of changes in capital structure or tax treatment on earnings.
14 Kaplan (1989) uses median industry changes to adjust, whereas matched-sample changes are used here.
This content downloaded from 128.197.27.9 on Tue, 30 Apr 2013 05:01:04 AMAll use subject to JSTOR Terms and Conditions

Shareholder Activism by Institutional Investors 247
Table VII
Effect of Shareholder Activism on Operating Performance Median percent change in operating income, operating income/sales, and operating income/assets for targets, industry-adjusted targets, Remaining Failing Fifty, and Remaining 250 samples over the period 1987-1993. Year - 1 is the fiscal year-end prior to being targeted or appearing in either control sample and year + 1 is the target year or year appearing in either control sample. Two-tailed Wilcoxon signed rank test p-values for difference from zero are reported for the target and industry-adjusted target samples in parentheses, and Wilcoxon rank sum test p-values for difference from target sample median are reported for the Remaining Failing Fifty and Remaining Bottom 250 samples in parentheses. The number of observations is reported in brackets.
Sample -6 to -1 -1 to +1 -1 to +2 -1 to +3
Panel A: Operating Income'
Targets 42.56% 6.95% 2.39% 9.38% (0.00) [47] (0.09) [46] (0.35) [41] (0.19) [35]
Industry-adjusted Targets -8.83% -8.92% - 19.92% -21.31% (0.28) [47] (0.14) [45] (0.11) [39] (0.25) [35]
Remaining Failing Fifty -12.74% 2.42% 13.29% 25.29% (0.00) [83] (0.66) [80] (0.56) [55] (0.48) [28]
Remaining Bottom 250 21.16% 10.11% 20.95% 24.73% (0.21) [428] (0.54) [450] (0.05) [383] (0.13) [303]
Panel B: Operating Income/Sales2
Targets 4.07% 1.88% -2.46% -2.30% (0.29) [47] (0.99) [46] (0.69) [41] (0.59) [35]
Industry-adjusted Targets 4.07% 1.88% -2.46% -2.30% (0.74)) [47] (0.22) [45] (0.39) [39] (0.38) [35]
Remaining Failing Fifty -28.79% 2.71% 5.11% 6.72% (0.00) [83] (0.39) [80] (0.32) [55] (0.23) [28]
Remaining Bottom 250 -8.14% 1.84% 2.91% 0.38% (0.02) [428] (0.39) [449] (0.16) [382] (0.52) [303]
Panel C: Operating Income/Assets3
Targets -16.13% 2.46% -5.49% -4.07% (0.01) [47] (0.36) [46] (0.93) [41] (0.64) [35]
Industry-adjusted Targets 0.11% -0.39% -7.71% -0.20% (0.40) [47] (0.73) [45] (0.58) [39] (0.86) [35]
Remaining Failing Fifty -28.41% 1.51% -2.71% 8.12% (0.08) [83] (0.99) [80] (0.84) [55] (0.32) [28]
Remaining Bottom 250 -20.89% 2.44% 2.91% 0.84% (0.39) [428] (0.84) [449] (0.40) [383] (0.45) [303]
'Operating income before depreciation (COMPUSTAT variable A13). 2 Operating income before depreciation divided by net sales (COMPUSTAT variables A13 and A12). 3 Operating income before depreciation divided by book value of assets (COMPUSTAT variables
A13 and A6).
changes for firms in the Remaining Failing Fifty and Remaining Bottom 250 samples.
Results for the effect of shareholder activism on operating performance are presented in Table VII. Results are reported for the five-year pretargeting
This content downloaded from 128.197.27.9 on Tue, 30 Apr 2013 05:01:04 AMAll use subject to JSTOR Terms and Conditions

248 The Journal of Finance
period and one, two, and three year posttargeting periods. Over the pretarget- ing period, targets outperform firms in the Remaining Failing Fifty in terms of all three measures (operating income, operating income/sales, and operating income/assets). However, the targets do not perform significantly differently than their respective industries. There is some evidence that targets have significant positive increases in operating income, especially over the year they are targeted, but the changes do not differ from changes for the industry matched sample or either the Remaining Failing Fifty or Remaining Bottom 250. These results suggest that any positive expectations of the market at the time of targeting announcement are not "confirmed" by significant increases in operating performance relative to control samples. This is consistent with Wahal (1995), who finds that operating performance (measured as operating income/assets and net income/assets) does not improve after targeting.
Table VIII presents results of analysis involving alternative accounting measures that may reflect sources of shareholder wealth gains from targeting. Target firms have a significant positive increase in capital expenditures over the pretargeting period that is greater than firms in the Remaining Failing Fifty. This suggests that given the low market-to-book ratios for target firms, targets may be investing in negative net present value projects. However, the changes in target firm capital expenditures are significantly lower than changes in their industry matches. Posttargeting changes for targets are not different than for their industry matches but are lower than for firms in the Remaining Bottom 250. These results suggest that possibly over-investing targets do not significantly reduce their level of investment following targeting.
Panel B of Table VIII shows changes in Lehn and Poulsen's (1989) measure of undistributed cash flow. If undistributed cash flow is higher for high agency cost firms and targeting helps align incentives, then significant reductions in undistributed cash flow may signal incentive alignment and be the source of shareholder wealth gains at initial targeting announcement. From the table it appears that target firms do not have different pretargeting changes in undis- tributed cash flow than their industries and less negative changes than firms in either the Remaining Failing Fifty or Remaining Bottom 250 samples. Although target firms have reductions in cash flow following targeting, they are not statistically significant, nor are they different from any of the control samples. Therefore, it does not appear that wealth gains arise from reductions in undistributed cash flow.
Finally, Panel C of Table VIII examines asset sales for targets and control samples. Over the pretargeting period, targets do not have changes in the level of asset sales different than any of the control samples. In the first year of targeting, however, targets do have a significant increase in asset sales which is significantly higher than either the Remaining Failing Fifty or Remaining Bottom 250 samples and insignificantly higher than the industry matches. Over the three years following targeting, the increase in asset sales is greater than the industry matches or Remaining Bottom 250 sample. This suggests that targets may be divesting poorly performing assets in the posttargeting period.
This content downloaded from 128.197.27.9 on Tue, 30 Apr 2013 05:01:04 AMAll use subject to JSTOR Terms and Conditions

Shareholder Activism by Institutional Investors 249
Table VIII
Effect of Shareholder Activism on Expenditures, Undistributed Cash Flow, and Divestitures
Median percent change in capital expenditures, undistributed cash flow and asset sales for firms in the target, industry-adjusted target, Remaining Failing Fifty, and Remaining 250 samples over the period 1987-1993. Year - 1 is the fiscal year-end prior to being targeted or appearing in either control sample and year + 1 is the target year or year appearing in either control sample. Two-tailed Wilcoxon signed rank test p-values for difference from zero are reported for the target and industry-adjusted target samples in parentheses, and Wilcoxon rank sum test p-values for difference from target sample median are reported for the Remaining Failing Fifty and Remaining Bottom 250 samples in parentheses. The number of observations is reported in brackets.
Sample -6 to -1 -1 to +1 -1 to +2 -1 to +3
Panel A: Capital Expenditures'
Targets 15.45% 2.03% -2.13% 10.56% (0.01) [47] (0.43) [46] (0.52) [41] (0.25) [33]
Industry-adjusted Targets -31.30% -6.14% -8.17% -19.69% (0.02) [44] (0.94) [42] (0.31) [36] (0.50) [30]
Remaining Failing Fifty -8.03% -4.12% 1.65% 21.53% (0.02) [80] (0.24) [77] (0.94) [52] (0.47) [26]
Remaining Bottom 250 3.40% 6.00% 17.56% 27.16% (0.19) [363] (0.57) [389] (0.05) [328] (0.07) [269]
Panel B: Undistributed Cash Flow2
Targets -10.47% -4.09% -6.61% -2.81% (0.53) [44] (0.87) [43] (0.83) [39] (0.66) [33]
Industry-adjusted Targets -3.09% 14.72% 17.23% 5.24% (0.99) [42] (0.62) [40] (0.15) [35] (0.20) [31]
Remaining Failing Fifty -35.11% -15.33% -12.76% 11.17% (0.01) [79] (0.17) [77] (0.97) [53] (0.16) [26]
Remaining Bottom 250 -26.10% -2.67% -3.69% -14.43% (0.02) [361] (0.74) [388] (0.96) [325] (0.51) [271]
Panel C: Asset Sales3
Targets 48.53% 52.92% 40.42% 31.93% (0.19) [16] (0.01) [22] (0.18) [18] (0.19) [14]
Industry-adjusted Targets 0.00% 87.55% 154.59% 374.97% (0.84) [7] (0.38) [7] (0.31) [5] (0.06) [5]
Remaining Failing Fifty -46.78% -22.39% -3.24% 140.96% (0.34) [30] (0.04) [37] (0.58) [26] (0.18) [14]
Remaining Bottom 250 1.22% -16.33% -27.15% -43.81% (0.92) [147] (0.02) [184] (0.37) [141] (0.07) [100]
'Capital expenditures (COMPUSTAT variable A128). 2 Undistributed cash flow (operating income before depreciation minus interest expense, taxes,
preferred and common dividends) divided by assets. 3 Sale of property, plant and equipment (COMPUSTAT variable A107).
In summary, although some evidence is found that activism is followed by increases in operating income, reductions in undistributed cash flow, and increases in asset sales, it does not appear that shareholder activism has a
This content downloaded from 128.197.27.9 on Tue, 30 Apr 2013 05:01:04 AMAll use subject to JSTOR Terms and Conditions

250 The Journal of Finance
statistically significant impact on these measures. This is somewhat puzzling in light of stock price reactions to announcements of targeting. There are several possible reasons for these apparent conflicting results. First, the mar- ket may correctly anticipate improvements in operating performance of tar- geted firms but improvements do not appear within three years following targeting. That is, improvements may occur over a longer period of, say, five years and thus are not measurable in this analysis. Second, the market may correctly anticipate improvements, but the improvements are not re- flected in the accounting measures used, or the improvements are so small and spread over such a long period that they are not detected. This would seem a reasonable explanation given the relatively small gains in shareholder wealth (roughly one percent) which, if spread over several years would be virtually undetectable. What would be an economically meaningful change in operating performance, given the large size of these firms and CalPERS's stake in them, may not be statistically significant. Third, the market may incorrectly antici- pate improvements, in which case a correction in stock price would be ex- pected. Since no systematic correction in long-term stock price performance is found, even though the size of the correction would be small and perhaps undetectable, this seems an unlikely explanation. Or finally, the market may be reacting to some factor other than anticipated operating improvements.
To more directly examine the relation between stock price reactions at targeting and subsequent changes in operating performance, two tests are conducted. The first conducts the analysis of Tables VII and VIII, but only for targets with successful outcomes. The results (not reported) are not signifi- cantly different from those reported for the full sample. Thus, it does not appear that successful targets respond differently than unsuccessful targets. As a second test, the two-day targeting announcement abnormal returns are regressed on posttargeting changes in all the measures reported in Tables VII and VIII, run separately for each measure and for each posttargeting period (one, two, and three years). No significant relation between stock price reaction and any of the accounting measures is found. These results suggest either no relation between change in operating performance and stock price reaction or that sufficient noise exists in the performance measures to make a relation undetectable.
An alternative explanation for the positive stock price reaction to targeting is that activism targeting increases the probability that a firm is subject to a takeover. To examine this possibility, a search is done of the Dow Jones News Retrieval for takeover activity involving the 51 activism targets. Two of the 1987 targets were takeover targets within three years after activism targeting, and one of the 1988 targets was a proxy contest target over the three years following targeting. Other than these instances, no other activism target in the sample was a takeover target for the three years following activism targeting. This result, combined with the fact that shareholder wealth gains are associ- ated with performance-related as opposed to takeover-related targeting, indi- cates that the source of wealth gains is not increased probability of a takeover.
This content downloaded from 128.197.27.9 on Tue, 30 Apr 2013 05:01:04 AMAll use subject to JSTOR Terms and Conditions

Shareholder Activism by Institutional Investors 251
V. Conclusion
This study examines the emerging role of institutional investors as active monitors of corporate management. The characteristics that lead to targeting and the effects of activism on governance structure, shareholder wealth, and operating performance are examined. The study shows that level of institu- tional ownership and firm size affect the probability of being targeted, after controlling for prior stock price performance. It is shown that over the last five years of the sample period (1989-93), 72 percent of targets either adopted proposed governance structure resolutions or made changes sufficient to war- rant a settlement. There is a significant positive stock price reaction for successful targeting events and a significant negative reaction for unsuccessful events. Changes in operating performance do not reflect statistically signifi- cant improvement. Overall, the evidence indicates that shareholder activism is largely successful in changing governance structure and, when successful, results in a statistically significant increase in shareholder wealth. However, if the source of the wealth increase is improved operating performance, it is not statistically significant. On net, activism appears to be beneficial to CalPERS, as the value increase of its holdings from activism is almost $19 million over the 1987-93 period (for the 34 firms with sufficient data), while its estimated costs of activism over the same period were approximately $3.5 million ($500,000 per year).
REFERENCES
Admati, Anat R., Paul Pfleiderer, and Josef Zechner, 1992, Large shareholder activism, risk sharing, and financial market equilibrium, Unpublished manuscript, University of British Columbia.
Ayres, Ian, and Peter Cramton, 1993, An agency perspective on relational investing, Unpublished manuscript, Stanford Law School.
Clark, R., 1986, Corporate law, Boston: Little, Brown, and Co. Gillan, Stuart, and Laura Starks, 1995, Relationship investing and shareholder activism by
institutional investors, Unpublished manuscript, University of Texas at Austin. Gordon, Lilli, and John Pound, 1993, Information, ownership structure, and shareholder voting:
Evidence from shareholder-sponsored corporate governance proposals, Journal of Finance 48, 697-718.
Jensen, Michael C., 1986, Agency costs of free cash flow, corporate finance and takeovers, American Economic Review 76, 323-329.
Jensen, Michael C., 1988, Takeovers: Their causes and consequences, Journal of Economic Per- spectives 2, 21-48.
Jensen, Michael C., 1989, The eclipse of the public corporation, Harvard Business Review 5, 61-75. John, Kose, and April Klein, 1994, Shareholder proposals and corporate governance, Unpublished
manuscript, New York University. Kaplan, Steven, 1989, The effects of management buyouts on operating performance and value,
Journal of Financial Economics 24, 217-254. Karpoff, Jonathan, Paul Malatesta, and Ralph Walkling, 1994, Corporate governance and share-
holder initiatives: Empirical evidence, Unpublished manuscript, University of Washington. Lang, Larry, Ren6 M. Stulz, and Ralph A. Walkling, 1989, Managerial performance, Tobin's q, and
the gains from successful tender offers, Journal of Financial Economics 24, 137-154. Lehn, Kenneth, and Annette Poulsen, 1989, Free cash flow and stockholder gains in going private
transactions, Journal of Finance 44, 771-789.
This content downloaded from 128.197.27.9 on Tue, 30 Apr 2013 05:01:04 AMAll use subject to JSTOR Terms and Conditions

252 The Journal of Finance
Loss, L., 1988, Fundamentals of security regulation, Boston: Little, Brown, and Co. Martin, K., and John J. McConnell, 1991, Corporate performance, corporate takeovers, and
management turnover, Journal of Finance 46, 671-687. Mikkelson, Wayne H., and M. Megan Partch, 1989, Managers' voting rights and corporate control,
Journal of Financial Economics 25, 263-290. Nesbitt, Stephen L., 1994, Long-term rewards from shareholder activism: A study of the "CalPERS
effect", Journal of Applied Corporate Finance 6, 75-80. Partch, M. Megan, 1987, The creation of a class of limited voting common stock and shareholder
wealth, Journal of Financial Economics 18, 313-339. Pound, John, 1988, Proxy contests and the efficiency of shareholder oversight, Journal of Finan-
cial Economics 20, 237-265. Roe, Mark, 1990, Political and legal restraints on ownership and control of public companies,
Journal of Financial Economics 27, 7-42. Servaes, Henri, 1991, Tobin's q and the gains from takeovers, Journal of Finance 46, 409-419. Shivdasani, Anil, 1993, Board composition, ownership structure, and hostile takeovers, Journal of
Accounting and Economics 16, 167-198. Shleifer, Andrei, and Robert Vishny, 1986, Large shareholders and corporate control, Journal of
Political Economy 94, 461-488. Smith, C. W., and R. L. Watts, 1992, The investment opportunity set and corporate financing,
dividend, and compensation policies, Journal of Financial Economics 32, 263-292. Stulz, Ren6 M., 1988, Managerial control of voting rights; Financing policies and the market for
corporate control, Journal of Financial Economics 20, 25-54. Wahal, Sunil, 1995, Public fund activism and firm performance, Unpublished manuscript, Uni-
versity of North Carolina at Chapel Hill. Weisbach, Michael S., 1988, Outside directors and CEO turnover, Journal of Financial Economics
20, 431-460.
This content downloaded from 128.197.27.9 on Tue, 30 Apr 2013 05:01:04 AMAll use subject to JSTOR Terms and Conditions