Embed Size (px)
Citation preview

SHAPE MEMORY BEHAVIOR OF ULTRAFINE GRAINED NiTi
AND TiNiPd SHAPE MEMORY ALLOYS
A Dissertation
by
BENAT KOCKAR
Submitted to the Office of Graduate Studies of Texas A&M University
in partial fulfillment of the requirements for the degree of
DOCTOR OF PHILOSOPHY
December 2007
Major Subject: Mechanical Engineering

SHAPE MEMORY BEHAVIOR OF ULTRAFINE GRAINED NiTi
AND TiNiPd SHAPE MEMORY ALLOYS
A Dissertation
by
BENAT KOCKAR
Submitted to the Office of Graduate Studies of Texas A&M University
in partial fulfillment of the requirements for the degree of
DOCTOR OF PHILOSOPHY
Approved by:
Chair of Committee, Ibrahim Karaman Committee Members, Dimitris C. Lagoudas
K. Ted Hartwig Richard Griffin
Head of Department, Dennis L. O’Neal
December 2007
Major Subject: Mechanical Engineering

iii
ABSTRACT
Shape Memory Behavior of Ultrafine Grained NiTi and TiNiPd
Shape Memory Alloys.
(December 2007)
Benat Kockar, B.S., Middle East Technical University;
M.S., Middle East Technical University
Chair of Advisory Committee: Dr. Ibrahim Karaman
The cyclic instability in shape memory characteristics of NiTi-based shape
memory alloys (SMAs), such as transformation temperatures, transformation and
irrecoverable strains and transformation hysteresis upon thermal and mechanical cycling
limits their applications requiring high number of cycles. The main reasons for these
instabilities are lattice incompatibility between transforming phases and relatively low
lattice resistance against dislocation motion. The objective of this study is to increase the
slip resistance and thus, to minimize the plastic accommodation upon phase
transformation in NiTi and TiNiPd SMAs. The effects of grain refinement down to
submicron to nanorange through Equal Channel Angular Extrusion (ECAE) on the
cyclic stability were investigated as potential remedies. The influence of ECAE
parameters, such as processing temperature and strain path on the microstructural
refinement was explored as well as the corresponding evolution in the stress differential
between the yield strength of martensite and the critical stress to induce martensite and
SMA characteristics of Ni49.7Ti50.3, Ti50Ni30Pd20, and Ti50.3Ni33.7Pd16 SMAs.
Severe plastic deformation via ECAE at temperatures from 300°C up to 450°C
refined the grains from 50μm down to a range between 0.03μm and 0.3μm in Ni49.7Ti50.3
and 0.5μm and 1μm in TiNiPd alloys. Regardless of the material, the lower the ECAE
temperature and the higher the ECAE strain path, the better the cyclic stability. ECAE
led to an increase in the stress differential between the yield strength of martensite and
critical stress to induce martensite due to observed microstructural refinement and this

iv
increase is responsible for the improvement in the cyclic stability of the aforementioned
SMA characteristics in all investigated materials. Addition of Pd to the NiTi alloy
reduced the thermal hysteresis from 36°C down to 11°C, and enhanced the cyclic
stability of the SMA characteristics. In additions to positive influence of ECAE on cyclic
stability, it also led to an increase in the fracture stress levels of the TiNiPd alloys due to
the fragmentation or dissolution of the precipitates responsible for the premature
failures. ECAE caused a slight reduction in the work output; however it was possible to
obtain large stable work outputs under higher stress levels than unprocessed materials.

v
TO
MY MOTHER-NIHAL BILCEN, MY AUNT-MUHSINE GENC
AND
MY SON-BARKAN E. KOCKAR

vi
ACKNOWLEDGEMENTS
I would first like to thank my advisor Professor Ibrahim Karaman for his support,
guidance and excellent training for experimental and analytical skills. In addition, his
incredible vision in the general philosophy of research led me produce results that are
worthy of writing this dissertation and internationally recognized journal papers. He is
also thanked for his never ending patience and motivating me in the research subject.
I would also like to thank to Professor Dimitris Lagoudas, Professor K. Ted
Hartwig and Professor Richard Griffin for serving in my committee and offering their
valuable suggestions throughout my study.
Mr. Robert Barber is gratefully thanked for working with me on one of the most
challenging parts of this research subject which is the severe plastic deformation of NiTi
and TiNiPd alloys via Equal Channel Angular Extrusion. He is not only a very
hardworker but also a great friend and person. I would also like to thank to Professor
Yuriy Chumlyakov for our discussions which have greatly furthered my knowledge on
the subject. Professor Hans Maier is also thanked for his precious help in the
microstructural investigations of the TiNiPd alloys. I would also like to thank Professor
Ray Guilemette for working with me on the microstructural analysis of the TiNiPd
alloys using electronmicroprobe. Dr. Jae Il Kim, Dr. Zhipping Luo and Dr. Irina Kireeva
are acknowledged for their great job in taking the transmission electron microscope
images of NiTi and TiNiPd samples.
My officemates, Mr. Burak Basaran and Dr. Ersin Karaca are gratefully thanked
for their precious help, especially during my pregnancy. In addition, I would also like to
thank my other officemates, Dr. Mohammed Haouaoui, Dr. Guven Yapici, Mr. James
Monroe, Mr. Ji Ma and Mr. Kadri Can Atli for their valuable friendship and support
during my studies. I am hoping great scientific jobs which will create an impact in the
world from Ji, Kadri Can and James.
I would also thank my dear friend, Dr. Yakut Gazi Price, for being a sister to me,

vii
and making me hang in there in my hard times during my studies. My close friends,
Diane Pruiett, Dr. Burcu Baris Keskin, Ezgi Can Eren and Arzu Karaer are also thanked
for making my stay at Texas A&M University a memorable one and for being a second
family in College Station.
I would thank my husband, Dr. Mustafa Kerem Kockar, for his never-ending
patience during my stay at Texas A&M University and living apart from him for more
than 3 years. It has been a very difficult experience for both of us and for our marriage. I
would also thank to my brother Baran Bilcen, his wife Sumru Bilcen and their lovely
daughter-my beautiful niece Azra Bilcen for always encouraging me to finish my Ph.D
in long distance phone talks. My brother’s never-ending drive and ability to always be
the best at what he does has never ceased to amaze me.
Last but not least, I am gratefully thankful to my mother and my aunt, Nihal
Bilcen and Muhsine Genc, for the unconditional support that they have always given to
me. Their strong motivations are the reason for my successes in every part of my life.
They always showed the right directions in my life and were able to provide me with the
vision that college was important to me- without them I would have never started.
Finally, I would like to dedicate this work to my mother, my aunt and my dear son
Barkan Efe Kockar. He was sent to me to lighten my life and world. My son will always
be my motivation in my dreams that I will continue to follow.

viii
TABLE OF CONTENTS Page ABSTRACT .............................................................................................................. iii
DEDICATION .......................................................................................................... v
ACKNOWLEDGEMENTS ...................................................................................... vi
TABLE OF CONTENTS .......................................................................................... viii
LIST OF FIGURES................................................................................................... xi
LIST OF TABLES .................................................................................................... xviii
CHAPTER I INTRODUCTION......................................................................................... 1 1.1 Motivation ............................................................................................... 1 1.2 Objectives................................................................................................ 6 II THEORETICAL BACKGROUND .............................................................. 8 2.1 Martensitic Transformations ................................................................... 8 2.2 Shape Memory Effect.............................................................................. 12 2.3 Conventional Shape Memory Alloys ...................................................... 16 2.3.1 Cu-based Shape Memory Alloys .................................................. 16 2.3.2 TiNi Shape Memory Alloys .......................................................... 18
2.3.2.1 Self Accommodation and Twinning in NiTi Alloys ........ 20 2.3.2.2 The Effect of Thermo-Mechanical Treatments on NiTi Alloys....................................................................... 21
2.3.2.2.1 The Effect of Thermo-Mechanical Treatments on Transformation Temperatures...................... 22 2.3.2.2.2 The Effect of Thermo-Mechanical Treatments
on Twinning Mode and Grain Size in NiTi Alloys ............................................................... 24
2.3.2.2.3 The Effect of Thermo-Mechanical Treatments on Texture ......................................................... 26
2.3.2.2.4 The Effect of Thermo-Mechanical Treatments on Thermal Cyclic Response of NiTi Alloys ....................................................... 27
2.4 High Temperature Shape Memory Alloys (HTSMAs) ........................... 28 2.4.1 NiTi HTSMAs with Pd, Pt, Zr and Hf .......................................... 30 2.5 Principles of ECAE ................................................................................. 33

ix
Page CHAPTER III EXPERIMENTAL PROCEDURE ............................................................... 37 3.1 As-Received Materials ............................................................................ 37 3.2 ECAE Processing .................................................................................... 38 3.2.1 ECAE Processing of NiTi ............................................................. 39 3.2.2 ECAE Processing of TiNiPd......................................................... 41 3.3. Microstructure Evaluation Methods....................................................... 44 3.4 Measurement of Phase Transformation Temperatures............................ 45 3.5 Mechanical Testing ................................................................................. 45 IV THERMO-MECHANICAL, MONOTONIC AND CYCLIC RESPONSE OF AN ULTRAFINE-GRAINED NiTi SHAPE MEMORY ALLOY ........ 49 4.1 Preamble.................................................................................................. 49 4.2 Differential Scanning Calorimetry (DSC) Experiments ......................... 50 4.3 Microstructural Evolution ....................................................................... 55 4.4 Monotonic Mechanical Response under Tension ................................... 62 4.5 Isobaric Thermal Cyclic Experiments..................................................... 65 4.6 Critical Stress vs. Critical Temperature Response for Inelastic Deformation ............................................................................................ 71 4.7 Thermal Cyclic Experiments under Constant Stress............................... 74 4.8 Discussion of the Results ........................................................................ 83 4.8.1 Grain Size, Twin Formation and Microstructural Evolution
during ECAE................................................................................. 84 4.8.2 Effect of ECAE and Grain Refinement on Martensitic
Transformation Temperatures ....................................................... 86 4.8.3 Effect of ECAE on Monotonic Response under Tension ............. 90 4.8.4 Effect of ECAE on Cyclic Stability and
Critical Stress vs. Critical Temperature Behavior ........................ 91 V SHAPE MEMORY BEHAVIOR OF THERMO-MECHANICALLY PROCESSED TiNiPd HIGH TEMPERATURE SHAPE MEMORY ALLOYS ....................................................................................................... 95 5.1 Preamble.................................................................................................. 95 5.2 Differential Scanning Calorimetry (DSC) Experiments ......................... 95
5.3 Microstructural Evolution ....................................................................... 102 5.4 Monotonic Response under Tension ....................................................... 106 5.5 Isobaric Thermal Cyclic Experiments..................................................... 108 5.6 Microstructural Investigation of Failure Samples ................................... 119

x
Page CHAPTER 5.7 Thermal Cyclic Experiments under Constant Stress............................... 123 5.8 Discussion of the Results ........................................................................ 127 5.8.1 Grain Size and Microstructural Evolution during ECAE ............. 128 5.8.2 Effect of ECAE Processing on Martensitic Transformation
Temperatures................................................................................. 129 5.8.3 Effect of ECAE on Monotonic Mechanical Response
under Tension ............................................................................... 131 5.8.4 Effect of ECAE on Fracture Strength, Cyclic Stability
and Critical Stress vs. Critical Temperature Behavior ................. 131
VI COMPARISON OF SHAPE MEMORY CHARACTERISTICS OF THERMO-MECHANICALLY PROCESSED NiTi AND TiNiPd SMAs .............................................................................................. 135 6.1 Preamble.................................................................................................. 135 6.2 Comparison of Microstructural Evolution in NiTi and TiNiPd Alloy after ECAE............................................................................................. 136 6.3 The Effect of Pd Addition on Transformation Temperatures, Thermal Hysteresis and Cyclic Stability of NiTi Alloys ....................... 138 6.4 The Effect of Pd Addition on Transformation and Irrecoverable Strain
Levels in Isobaric Cooling Heating experiments ................................... 140 6.5 Comparison of Thermal Hysteresis in NiTi and TiNiPd Alloys............. 141 6.6 Comparison of the Work Outputs in NiTi and TiNiPd Alloys ............... 143 VII SUMMARY OF RESULTS AND CONCLUSIONS ................................... 149 VIII FUTURE WORK .......................................................................................... 153 REFERENCES.......................................................................................................... 156 VITA ......................................................................................................................... 163

xi
LIST OF FIGURES
Page
Figure 2.1 a) Shape change upon phase transformation, b) represents the accommodation of external strain by slip, c) represents the accommodation of external strain by twin...................................... 9
Figure 2.2 Schematic representation of free energy curves of parent and
martensite phases, and their relationship to the Ms and As............. 10 Figure 2.3 Electrical resistivity vs temperature curves for thermoelastic
and non-thermoelastic martensite ................................................... 12 Figure 2.4 Schematic representation for the thermo-mechanical
conditions of shape memory effect and superelasticity .................. 14 Figure 2.5 Schematic stress-strain behavior of shape memory alloys ............. 15 Figure 2.6 Phase diagram of binary NiTi......................................................... 19 Figure 2.7 a) Schematic representation of triangular morphology and b)
crystallographic relationships between the variants in the triangular morphology ................................................................... 20
Figure 2.8 The deformation of a sphere into an ellipsoid and the
definition of K1, η1, K2 and η2 ........................................................ 21 Figure 2.9 Effect of aging time on Ms temperature of Ni-rich and Ti-rich
NiTi SMAs ..................................................................................... 23 Figure 2.10 Schematic of ECAE process .......................................................... 34 Figure 2.11 The description of the ECAE routes .............................................. 35 Figure 3.1 250 ton extrusion press at Texas A&M University........................ 38 Figure 3.2 a) Replaceable inserts for ECAE processing of billets with
different cross sections b) ECAE furnace for isothermal extrusions up to 600°C................................................................... 40

xii
Page
Figure 3.3 Digital images of a Ni30Ti50Pd20 ECAE billet a) before and b) after 4 ECAE passes at 400°C using Route C................................ 43
Figure 3.4 The MTS high temperature extensometer used to measure the
axial strain ...................................................................................... 46 Figure 3.5 A schematic showing the dimensions of the tension test
samples ........................................................................................... 47 Figure 4.1 Cyclic DSC response of the hot rolled and ECAE processed
Ni49.7Ti50.3 alloy samples demonstrating the improvement in the cyclic stability of the transformation temperatures upon ECAE processing (a) Hot rolled, (b) ECAE 4E at 450°C, (c) ECAE 4Bc at 425°C, (d) ECAE 4Bc at 400°C, (e) ECAE 1A at 300°C samples............................................................................ 52
Figure 4.2 Optical micrograph of the hot-rolled Ni49.7Ti50.3 alloy
demonstrating the initial grain size ................................................ 55 Figure 4.3 Bright field TEM images taken above Af at 175°C showing
the grain size reduction due to ECAE processing. Four ECAE passes following (a) route Bc at 400°C b) route Bc at 425°C and (c) route E at 450°C................................................................. 56
Figure 4.4 a) Bright field (BF) TEM images taken at room temperature
showing the grains containing R-phase and martensite in the ECAE 4Bc sample processed at 400°C SAD patterns of the circled areas in BF showing (b) the R-phase and (c) B19’ martensite .............................................................................. 58
M[100]
Figure 4.5 Bright field TEM images taken at room temperature from
ECAE 4Bc sample processed at 425°C showing (a), (c) twins in martensite, (b) SAD pattern taken from the circled area in (a) showing the ><011 Type II twin, and (d), (e) SAD patterns taken from the circled areas in (b) showing the
compound twinning and
)001(
}111{−
Type I twinning, respectively...... 59

xiii
Page
Figure 4.6 Bright field TEM images taken at 200°C from ECAE 1A sample processed at 300°C showing (a) twins in austenite and the relatively heavy dislocation density (b) SAD pattern
taken from the circled area in (a) showing the deformation twin ............................................................................ 60
)131(−
Figure 4.7 Bright field TEM image taken at room temperature from the
ECAE 4Bc sample processed at 425°C showing “herring bone” m(001) type twins having an average size of 3nm ............ 61
Figure 4.8 Schematic of a different deformation stage in a typical SMA
at temperatures below Md. and σ show the critical stress level to induce martensite and the yield stress of stress induced martensite, respectively .................................................... 63
SIMσ My
Figure 4.9 Monotonic mechanical response of the hot rolled and ECAE
processed Ni49.7Ti50.3 samples under tension at to be thermodynamically same
condition......................................................................................... 64 C1550MPaσ
sM °+=
Figure 4.10 Schematic illustration of transformation and irrecoverable
strain, Ms and Mf temperatures and thermal hysteresis.................. 66 Figure 4.11 Strain vs. temperature response of the Ni49.3Ti50.7 alloy under
various constant stress levels during isobaric cooling-heating experiments: (a) Hot rolled, (b) ECAE 4E at 450°C, (c) ECAE 4Bc at 425°C, (d) ECAE 4Bc at 400°C, (e) ECAE 1A at 300°C samples............................................................................ 68
Figure 4.12 Transformation and irrecoverable strain response as a
function of constant tensile stress levels in the Ni49.7Ti50.3 samples from the isobaric cooling-heating experiments under increasing applied stress levels of Figure 4.5.2.............................. 70
Figure 4.13 Effect of temperature on the critical stress for martensitic
reorientation, stress-induced martensitic transformation and plastic yielding of austenite of ECAE processed and hot rolled samples................................................................................. 73

xiv
Page Figure 4.14 Strain vs. temperature response of the Ni49.3Ti50.7 alloy under
50MPa. (a) Hot rolled, (b) ECAE 4E at 450°C, (c) ECAE 4Bc at 425°C, (d) ECAE 4Bc at 400°C, (e) ECAE 1A at 300°C samples ........................................................................................... 74
Figure 4.15 Strain vs. temperature response of the Ni49.3Ti50.7 alloy under
150MPa. (a) Hot rolled, (b) ECAE 4E at 450°C, (c) ECAE 4Bc at 425°C, (d) ECAE 4Bc at 400°C, (e) ECAE 1A at 300°C samples................................................................................ 77
Figure 4.16 Transformation strain evolution of the hot rolled and ECAE
processed Ni49.3Ti50.7 samples with the number of cycles under (a) 50MPa and (b) 150MPa.................................................. 81
Figure 4.17 Irrecoverable strain evolution of the hot rolled and ECAE
processed Ni49.3Ti50.7 samples with the number of cycles under 150MPa. ............................................................................... 82
Figure 4.18 Thermal hysteresis comparison of the sample ECAE
processed at 400°C and the hot rolled sample under 50MPa and 150MPa.................................................................................... 83
Figure 5.1 Cyclic DSC response of the solutionized and ECAE
processed Ti50Ni30Pd20 demonstrating the effect of ECAE processing and ECAE temperatures on the transformation temperatures, (a) solutionized, (b) ECAE 4C at 600°C, (c) ECAE 2C at 500°C, (d) ECAE 4C at 400°C.................................. 97
Figure 5.2 Cyclic DSC response of the hot-rolled and ECAE processed
Ti50.3Ni33.7Pd16. demonstrating the effect of ECAE processing and ECAE temperatures on the transformation temperatures, (a) Hot-rolled, (b) ECAE 4Bc at 450°C, (c) ECAE 2B at 400°C.............................................................................................. 99
Figure 5.3 Ms temperatures of all TiNiPd samples extracted from the
DSC data showing the effect of ECAE processing, ECAE temperature and Pd content (a) Ti50Ni30Pd20, (b) Ti50.3Ni33.7Pd16 ................................................................................ 100
xv
Page
Figure 5.4 Hysteresis of all TiNiPd samples extracted from the DSC data showing the effect of ECAE processing, ECAE temperature and Pd content (a) Ti50Ni30Pd20 (b) Ti50.3Ni33.7Pd16 ................................................................................ 101
Figure 5.5 Optical micrograph of the solutionized Ti50Ni30Pd20 alloy
demonstrating the microstructure. Dotted lines are included to distinguish some of the grains and grain size............................. 103
Figure 5.6 Bright field TEM images taken above Af at 200°C showing
the grain size reduction in Ti50Ni30Pd20 due to ECAE processing for four passes following route C at 400°C.................. 103
Figure 5.7 Bright field TEM image from the solutionized Ti50Ni30Pd20
sample taken at room temperature in martensite and the corresponding diffraction pattern showing the martensite and [110] Type I twin............................................................................ 104
Figure 5.8 Room temperature bright field TEM image of Ti50Ni30Pd20
sample ECAE processed at 400°C and the corresponding diffraction pattern showing the martensite b) <011> Type II and c) [110] Type I twins ............................................................... 105
Figure 5.9 Room temperature bright field TEM image of Ti50Ni30Pd20
sample ECAE processed at 400°C showing the high dislocation density.......................................................................... 106
Figure 5.10 Monotonic tensile response of the hot rolled and ECAE
processed Ti50.3Ni33.7Pd16 samples ................................................. 107 Figure 5.11 Strain vs. temperature response of the Ti50Ni30Pd20 alloy
under various constant stress levels: (a) solutionized, (b) ECAE 4C at 600°C, (c) ECAE 2C at 500°C, (d) ECAE 4C at 400°C.............................................................................................. 109
Figure 5.12 Strain vs. temperature response of the Ti50.3Ni33.7Pd16 alloy
under various constant stress levels: (a) hot rolled, (b) ECAE 4Bc at 450°C, (c) ECAE 2B at 400°C............................................ 111
xvi
Page
Figure 5.13 Transformation and irrecoverable strain response as a function of constant tensile stress levels in the (a) Ti50Ni30Pd20, (b) Ti50.3Ni33.7Pd16 samples during isobaric thermal cyclic experiments............................................................. 112
Figure 5.14 Critical stress versus Ms temperatures of (a) Ti50Ni30Pd20 and
(b) Ti50.3Ni33.7Pd16 samples before and after ECAE determined from the isobaric heating-cooling shown in Figure 5.13. For the sake of the completeness the Ms temperatures from the DSC experiments (Figure 5.3) are also included in the figure...................................................................... 116
Figure 5.15 Thermal hysteresis as a function of constant tensile stress
levels in the (a) Ti50Ni30Pd20, (b) Ti50.3Ni33.7Pd16 samples during isobaric thermal cyclic experiments ................................... 118
Figure 5.16 Back scattered electron SEM images showing the precipitate
size and distribution within the matrix of Ti50Ni30Pd20 samples (a) solutionized, (b) ECAE processed at 600°C and (c) ECAE processed at 400°C ........................................................ 120
Figure 5.17 EDS and WDS analyses of the second phase particles in the
matrix of Ti50Ni30Pd20 samples for (a) dark particles Ti(C, O) in Figure 5.16 and (b) light gray particles Ti2(Ni, Pd) in Figure 5.16 (c) WDS analysis showing the carbon and oxygen in dark particles Ti(C, O)................................................... 121
Figure 5.18 Secondary electron SEM image of solutionized Ti50Ni30Pd20
sample showing one of the porosity in the matrix ......................... 122 Figure 5.19 Strain vs. temperature response of the ECAE processed
Ti50Ni30Pd20 alloy under 150MPa (a) ECAE 4C at 600°C, (b) ECAE 2C at 500°C......................................................................... 124
Figure 5.20 Strain vs. temperature response of the ECAE processed
Ti50Ni30Pd20 alloy under 250MPa (a) ECAE 2C at 500°C, (b) ECAE 4C at 400°C......................................................................... 125

xvii
Page Figure 5.21 Transformation and irrecoverable strain evolution during
thermal cyclic experiments in the ECAE processed Ti50Ni30Pd20 samples as a function of number of cycles (a) ECAE 4C at 600°C and ECAE 2C at 500°C under 150MPa for 10 cycles and (b) ECAE 2C at 500°C and ECAE 4C at 400°C under 250MPa..................................................................... 126
Figure 6.1 Bright field TEM images taken above Af temperature of the
samples showing the grain size reduction due to ECAE processing, (a) Ti50Ni30Pd20 ECAE 4C at 400°C, and (b) Ni49.7Ti50.3 ECAE 4Bc at 400°C...................................................... 137
Figure 6.2 Cyclic DSC response of the hot rolled Ni49.7Ti50.3 and
solutionized Ti50Ni30Pd20 alloys demonstrating the increase in transformation temperatures, decrease in thermal hysteresis and improvement in the cyclic stability of the transformation temperatures upon Pd addition....................................................... 139
Figure 6.3 Transformation and irrecoverable strain response as a
function of constant tensile stress levels in the hot rolled Ni49.7Ti50.3 and solutionized Ti50Ni30Pd20 samples, ECAE processed Ni49.7Ti50.3 and Ti50Ni30Pd20 samples from the isobaric cooling-heating experiments under increasing applied stress levels ........................................................................ 141
Figure 6.4 Comparison of the thermal hysteresis of the hot rolled
Ni49.7Ti50.3 and the solutionized Ti50Ni30Pd20 samples ................... 142 Figure 6.5 Comparison of the thermal hysteresis of the Ni49.7Ti50.3 and
Ti50Ni30Pd20 samples ECAE processed at 400°C........................... 143 Figure 6.6 Work output as a function of applied stress in hot rolled
Ni49.7Ti50.3, solutionized Ti50Ni30Pd20, and hot rolled Ti50.3Ni33.7Pd16 alloys...................................................................... 144
Figure 6.7 Work output as a function of applied stress in the ECAE
processed Ni49.7Ti50.3, Ti50Ni30Pd20, Ti50.3Ni33.7Pd16 samples......... 144 Figure 6.8 Carnot efficiencies of Ni49.7Ti50.3, Ti50.3Ni33.7Pd16 and
Ti50Ni30Pd20 before and after ECAE .............................................. 147

xviii
LIST OF TABLES Page Table 3.1 Carbon and oxygen impurity levels in Ni49.7Ti50.3 and Ti50Ni30Pd20 ....... 37 Table 3.2 Summary of the equiatomic Ni49.7Ti50.3 ECAE processing detail ........... 41 Table 3.3 Summary of the NiTiPd ECAE processing detail ................................... 44 Table 4.1 Martensitic transformation temperatures and thermal hysteresis of
hot rolled and ECAE processed Ni49.7Ti50.3 alloy at the first and fifth thermal cycles from DSC ................................................................ 54
Table 4.2 and stresses and the stress differential determined from
monotonic mechanical response experiment under tension of hot rolled and ECAE processed Ni49.7Ti50.3 samples..................................... 64
SIMσ σMy
Table 4.3 The changes in the elastic and irreversible energies under no stress
and 150MPa for the Ni49.7Ti50.3 samples hot rolled and ECAE processed at 425°C and 400°C................................................................ 88
Table 5.1 Critical stresses for the onset of phase transformation and plastic
yielding and the stress differential of the Ti50.3Ni33.7Pd16 samples determined from the monotonic experiments under tension................. 107
Table 5.2 The slopes of the critical stress vs. temperature curves (
dTdσ ) shown
in Figure 5.14. ........................................................................................117 Table 5.3 The average size of the precipitates in Ti50Ni30Pd20 samples before
and after ECAE ......................................................................................122
1
CHAPTER I
INTRODUCTION
1.1 Motivation
NiTi alloys which undergo thermoelastic martensitic phase transformation are the
most popular shape memory alloys (SMAs) owing to their ability to recover their initial
shape after deformation and due to high actuation work outputs per unit volume [1, 2]. In
addition to these superior shape memory properties, NiTi alloys are exceptional due to
their biocompatibility and good corrosion resistance [3]. Many practical applications of
these alloys require a large number of thermo-mechanical cycles, as well as a stable and
reliable shape memory effect. However, there are problems frequently reported in the
literature associated with cyclic stability of the shape memory effect in NiTi alloys. For
instance, Miyazaki et al. [4, 5] and Lexcellent et al. [6] have reported that pseudoelastic
hysteresis loops drift down with cycles and settle to a stable loop [7]. In addition, poor
cyclic stability during isobaric thermal cycling experiments has been observed [8-10]. It
is reported that the martensite start temperature (Ms) decreases and the irrecoverable
(plastic) strain levels increase with increasing number of thermal cycles [8-11].
Sehitoglu et al. [12] demonstrated large variations in the temperature hysteresis with
external stress under thermal cycling conditions. The main reason for the cyclic
instability of the parameters important for shape memory response is the accommodation
of the incompatibility between austenite and martensite phases with dislocation
formation, in addition to transformation twinning and elastic accommodation, which
leads to plastic strain formation, martensite stabilization and variation in transformation
temperatures, thermal and stress hysteresis upon thermo-mechanical cycling. Miyazaki
et al. [5] showed that during thermo-mechanical cycling, the austenite/martensite
interface travels forward and backward, during which deformation induced defects such
This dissertation follows the style and format of Acta Materialia.

2
as dislocations form and these dislocations hinder the austenite/martensite interface
movement. The accumulation of microscopic residual stresses and retained martensites
eventually influences the macroscopic shape memory behavior of NiTi alloys.
A possible way to tackle the cyclic instability problem is to increase the critical
shear stress (CSS) for slip and thus to minimize the plastic accommodation and
martensite stabilization upon phase transformation through small precipitation, grain
refinement, specific texture formation and strain hardening via introducing dislocation
substructures [13]. Hornbogen et al. [14] proposed that the cyclic stability can be
improved by increasing the stress differential between the critical stress for stress-
induced martensitic transformation and the yield stress of the stress induced martensite.
All the aforementioned studies showed that the cyclic response of these alloys depends
on the thermo-mechanical history such as ausforming, aging, cold deformation and
annealing treatments [5, 15].
There have been many works performed on producing coherent Ti3Ni4
precipitates in Ni-rich NiTi alloys which generally improves the cyclic stability of NiTi
as compared to other heat treatments such as solutionizing or overaging [15, 16].
However, on the Ni-rich side of TiNi alloys, the transformation temperatures decrease to
subzero levels with the increase in Ni-content. Formation of Ti3Ni4 precipitates
somewhat increases the transformation temperatures due to depletion of Ni in the matrix,
yet, the transformation temperatures of the aged Ni-rich TiNi are still below room
temperature and depend on the amount and size of the precipitates. Superelasticity is
available in the aged Ni-rich alloys in a narrow temperature range and the shape memory
effect is observed with some permanent strain [15].
Single crystal studies on TiNi alloys showed that the transformation behavior
highly depends on crystallographic orientation. For instance, the [111] orientation shows
poor cyclic degradation resistance and rapid increase in permanent strain with cycles
[15]. In addition, the [111] orientation demonstrates a large stress hysteresis in
pseudoleastic cyclic experiments [15]. On the other hand, in NiTi, the slip systems were
reported to be {100}<001> and {110}<001>, therefore, NiTi single crystals with the

3
loading axis near the [001] pole have superior fatigue response as compared to other
orientations because they demonstrate less irreversible slip [17]. The disadvantages of
single crystals are high cost, difficulty of mass production and fabricating different
forms such as wires and plates. In the light of these studies on the orientation
dependence of shape memory properties in NiTi alloys, crystallographic texture is one of
the important parameters that determines the shape memory response of polycrystalline
NiTi alloys.
Conventional deformation techniques such as cold rolling, drawing and extrusion
can impart large strains to materials. However, one or more dimensions of the material
are reduced. It is reported that cold deformation without annealing usually suppresses
phase transformation to very low temperatures [18]. Therefore, annealing below the
recrystallization temperature is needed to increase the transformation temperatures and
rearrange the tangled dislocations to observe a smooth martensitic transformation upon
heating and cooling. Cold drawn polycrystalline NiTi alloys have a strong texture of
[111] type at which the cyclic degradation is mostly expected [19]. Miyazaki et al. [18]
has found that annealing cold worked NiTi alloy at 673K establishes cyclic stability;
however, it is reported that plastic strain accumulation with cyclic deformation is still an
important issue in cold worked NiTi alloys under high stress levels [9].
Recently, the effect of ausforming on the martensitic transformation of
equiatomic NiTi alloys was investigated extensively [15, 20]. Ausforming is a technique
in which the dislocations are introduced into austenite phase. Severe plastic deformation
(SPD) via ausforming might be advantageous in achieving the stable cyclic stability.
Dislocation density increases and grain size decreases down to nano range using SPD
techniques such as high pressure torsion (HPT) and equal channel angular extrusion
(ECAE). HPT leads to amorphization and nanograin formation after subsequent
annealing. The sample size that can be obtained from HPT is very small such that
extensive investigation on the sample is not possible. In addition, the strain is not
uniform throughout the sample in HPT. On the other hand, ECAE permits the
application of large uniform strain without reduction in the cross-section of the work

4
piece [21]. ECAE offers several advantages over other competing processes such as HPT
and conventional area-reduction extrusion, including larger sample sizes, and some
control on grain morphology and crystallographic texture [22]. Therefore, ECAE is
selected as the SPD process of choice in this study.
Most SMAs are intermetallics and suffer from low ductility due to the lack of
sufficient slip systems [23]. Although NiTi alloys exhibit relatively better ductility than
many intermetallic alloys due to mechanical twinning as an additional deformation
mechanism both in martensite and austenite, SPD via ECAE of NiTi based SMAs is
challenging because they have high flow strength in austenite. The ECAE tool to be used
during processing should be able to handle high stress levels, and the friction between
the work piece and the walls should be as low as possible.
Only a limited number of studies have been undertaken on the severe plastically
deformed NiTi alloys because of the difficulty in processing. Waitz et al. [24-26]
focused on the stabilization of austenite with the decrease in grain size to nano range
after HPT. He also investigated twinning mechanisms in martensite as a function of
grain size [24-26]. Valiev and his colleagues [27-29] demonstrated the effect of SPD via
HPT and ECAE on the microstructural evolution and conventional mechanical
properties such as strength and ductility but did not report any extensive shape memory
properties such as transformation and irrecoverable strains and thermal cyclic stability
after SPD processes. Therefore, in this study, the affect of ECAE parameters, such as
processing temperature, strain magnitude and strain path, on the microstructural
refinement and dislocation substructure formation were investigated, as well as the
corresponding evolution in the shape memory, of monotonic and thermo-mechanical
response for near equiatomic NiTi SMAs.
For the applications beyond 100°C, there is a strong need to develop new alloys
other than NiTi. The addition of ternary elements such as Au, Pd, Pt, Hf and Zr was
shown to increase the transformation temperatures above 100°C [30, 31]. High-
temperature SMA compositions in the NiTiPd and NiTiPt systems have attracted great
interest for use in compact solid-state actuators for the aerospace, automotive, and power
5
generation industries [32]. Zr and Hf could be more favorable because of their relatively
low cost, however, thermal and stress hysteresis of these alloys is large [13, 33].
Moreover, transformation-induced plasticity and creep have limited the level and
stability of the shape memory effect and superelasticity in these ternary alloys more than
that in binary NiTi [13]. On the other hand, NiTiPd and NiTiPt SMAs have very small
thermal hysteresis and high transformation temperatures depending on their
compositions [32, 34].
Martensitic transformation in NiTiPd and NiTiPt SMAs was first reported by
Donkersloot and Van Vucht [35]. The addititon of more than 10at.% Pd or Pt to the NiTi
system with substitution Ni increases the transformation temperature to above 100°C
[36]. The disadvantage of these ternary alloys is their brittleness due to intrinsic low
ductility and oxygen stabilized precipitates. Additionally, Cai et.al [37] reported that the
shape memory behavior of TiNiPd alloys is fairly good at room temperature however
becoming poor with increasing temperature due to the decrease in the critical shear stress
for slip. To date, much of the published work is on the shape memory effect of these
alloys under stress free conditions [38-40]. Golberg et al. [41] studied the effect of cold
rolling and post annealing on the shape memory behavior of Ti50Ni30Pd20 alloy. They
were able to achieve 100% recovery up to a given strain of 5.3% in tensile experiments
at 443K in cold rolled and annealed Ti50Ni30Pd20 alloy. However, they did not study the
thermal cyclic behavior of the alloy after cold deformation. Noebe and his co-workers
have recently investigated the shape memory characteristics of hot extruded TiNiPd
alloys with different compositions [32, 34]. They have reported the results of actuator-
type constant-load thermal cycling tests (load-biased tests). The results showed that
permanent deformation occurs at every stress level and increases with the stress level
[32, 34]. They also investigated the work output of the TiNiPd alloys which is another
important parameter in actuation type applications. It was found that the work capability
of the TiNiPd alloys diminishes due to the permanent deformations occuring during
thermal cycling [34].
To date, there is no published study on the severe plastic deformation of TiNiPd

6
alloys. It is expected that grain refinement and the introduction of dislocations using
SPD via ECAE should improve the shape memory properties, work capability and
thermal cyclic stability of the TiNiPd alloys. For instance, ECAE might lead to a
decrease in the permanent deformations determined at even low stress levels in the
aforementioned studies upon grain refinement and dislocation substructure formation.
Ti50Ni30Pd20 and Ti50.3Ni33.7Pd16 are chosen due to their transformation temperatures.
The temperature range for the target application which is the actuator part in
reconfigurable airplane rotor blades is 100-150°C.
1.2 Objectives
In the light of this motivation, the present study focused on the ECAE of
equiatomic NiTi, and Ti50Ni30Pd20 and Ti50.3Ni33.7Pd16 high temperature shape memory
alloys. The equiatomic NiTi alloy was chosen due to its high transformation temperature
as compared to other NiTi compositions [42]. In addition, there is no expectation to have
second phase precipitation in this composition which should allow investigating only the
SPD effect on microstucture, conventional mechanical properties and shape memory
behavior of the alloy. The initial part of the study on the equiatomic NiTi alloy also
provides a base line for the investigation of TiNiPd high temperature shape memory
alloys. For instance, the lowest possible ECAE temperature that TiNiPd alloys can be
deformed, or types of experiments to evaluate the shape memory response of TiNiPd
alloys, are important beginning steps to start an investigation.
The overall objectives of this research with specific details are to:
1. Determine the uniform formability limits (i.e. temperature and strain rate)
of the equiatomic NiTi, Ti50Ni30Pd20 and Ti50.3Ni33.7Pd16 alloys. The purity level of the
materials is an important factor which dictates the ease of the deformation processing
and the lowest possible ECAE temperature.
2. Identify better ECAE routes and ECAE temperatures for obtaining the
most microstructural refinement in the presence of recovery-recrystallization tendencies.

7
3. Identify the affects of ECAE on the microstructural evolution of the
alloys such as on possible twinning modes in refined grains, dislocation substructures,
precipitate size and morphology.
4. Characterize the mechanical properties such as critical stress to induce
martensite and yield strength of stress induced martensite of the unprocessed and ECAE
processed materials. The purpose of this characterization is to identify the increase in
critical shear stress for slip due to microstructural evolution such as grain refinement,
dislocation density increase and the change in precipitate size and morphology upon
ECAE.
5. Determine the affect of the microstructural evolution on certain shape
memory characteristics including transformation temperature, transformation and
irrecoverable strain levels, and thermal hysteresis.
6. Identify the mechanisms responsible for brittleness of TiNiPd ternary
alloys.
7. Characterize the influences of microstructural refinement on thermal
cyclic stability of the alloys. The purpose of this investigation is to determine the
transformation temperature and thermal hysteresis stability and transformation and
irrecoverable strain evolution with the number of thermal cycles under constant stress
levels.
8. Develop a thermodynamical framework to understand irreversible and
elastic energy contributions which trigger the phase transformation in the unprocessed
and ECAE processed equiatomic NiTi alloys. The purpose of this thermodynamical
approach is to understand why the irreversible and elastic energy change with
microstructural refinement/evolution and the effect of this change on the shape memory
characteristics.
To accomplish these objectives, a well planned/executed experimental study was
undertaken to demonstrate that ECAE processing can be a viable method to improve the
shape memory response of equiatomic NiTi and TiNiPd alloys.
8
CHAPTER II
THEORETICAL BACKGROUND
2.1 Martensitic Transformations
Since shape memory effect is related to thermoelastic martensitic transformations
(MT), the basic information about MT is introduced in this section in a simplified
manner before going into details about shape memory effect. The martensitic
transformation is a diffusionless, military type phase transformation in solids, in which
atoms move by a shear-like mechanism [1]. The transformation is schematically
described in Figure 2.1. Parent phase or austenite which is the high temperature phase is
usually cubic and martensite which is the low temperature phase has a lower symmetry
crystal structure. When the temperature is lowered below martensite start (Ms)
temperature, MT starts by a shear like mechanism. When temperature is raised
martensite becomes unstable, reverse transformation begins, and martensite transforms
back to parent phase with the same orientation if the transformation is
crystallographically reversible.

9
(a)
(b)
(c)
Martensite Parent Phase
A B
Figure 2.1 a) Shape change upon phase transformation b) represents the accommodation
of external strain by slip, c) represents the accommodation of external strain by twin
[44].
MT is associated with a shape change as shown in Figure 2.1.a; hence, a large
strain occurs around the martensite phase within the parent phase. There are two ways to
decrease the large strain around martensite; either by introducing slip as in Figure 2.1.b
or by introducing twinning as in Figure 2.1.c. These are called lattice invariant shears
because neither slip nor twinning changes the structure of martensite. The introduction
of slip or twinning in martensite depends on the alloy system, however, in shape
memory alloys the strain relieve mechanism is usually twinning. The martensites in
region A and in region B in figure 2.1.c have the same structure; however, their
orientations are twin related. These are called correspondence variants. Since martensite
phase has lower symmetry than parent phase many variants can be formed from the
same parent phase.
Martensitic transformations are not associated with the compositional change,
thus the free energy curves of parent and martensite phases can be represented as in
Figure 2.2. T0, Gm and Gp are defined as the thermodynamic equilibrium temperature
between two phases, Gibbs free energy of martensite and Gibbs free energy of parent

10
phase, respectively. ΔGp→m= Gm – Gp represents the driving force for the nucleation of
martensite. The Gibbs free energy change of a system upon martensite transformation
can be written as [43]:
ΔG = ΔGc + ΔGnc = ΔGc + ΔGirr + ΔGe (2.1.1)
ΔGc is the chemical free energy difference between parent phase and martensite,
ΔGirr is the irreversible energy term which is associated with the frictional energy
required to propagate the transforming interface between parent phase and martensite,
and ΔGe is the elastic energy around the martensite. ΔGnc is the non-chemical energy
term which is equal to the sum of elastic energy and irreversible energy terms.
Temperatures where parent phase starts and stops to transform martensite are
martensite start (Ms) and martensite finish (Mf) temperatures, respectively, and
temperatures where martensite starts and stops to transform back to parent phase is
austenite start (As) and austenite finish (Af) temperatures, respectively.
Ms T0 As
ΔTs
Gm
Gp
ΔGp→m
ΔGm→p
T
G
Figure 2.2 Schematic representation of free energy curves of parent and martensite
phases, and their relationship to the Ms and As [44].

11
In most martensitic transformations, the non chemical free energy term is non-
zero, hence, supercooling of ΔTs is needed for the nucleation of martensite and
superheating is necessary for the back transformation. Because of the elastic energy
storage around martensite further undercooling is necessary to overcome the resistance
to the growth of martensite.
Martensitic transformations can be classified in two categories, thermoelastic and
non-thermoelastic. If the non-chemical energy term is small which means the interface
between martensite and austenite is mobile, energy dissipation is low and transformation
is crystallographically reversible, then martensite is thermoelastic. On the other hand, if
the non-chemical energy term is large which means the interface between martensite and
austenite is immobile and energy dissipation is large the reverse transformation occurs
by the renucleation of austenite, and then martensite is non-thermoelastic [45]. The
difference between thermoelastic and non-thermoelastic martensite is presented in
Figure 2.3 in terms of their thermal hysteresis. Shape memory alloys show
characteristics of thermoelastic martensitic transformations. The notion “thermoelastic
transformations” in SMAs were first introduced by Kurdjumov and Khandros who
observed the behavior in Cu-Al-Ni alloys [46]. In Figure 2.3, Au-Cd alloy represents the
thermoelastic shape memory alloy.

12
Figure 2.3 Electrical resistivity vs temperature curves for thermoelastic and non-
thermoelastic martensite [1].
2.2 Shape Memory Effect
The shape memory effect (SME) is a property which covers two basic
requirements; thermoelastic martensitic transformation and twinning as a deformation
mode. The defomation processes that are mainly responsible for shape memory effect
are deformation of martensite or stress induced martensitic transformation. As discussed
in section 2.1, the deformation of martensite should occur by twinning to realize the
shape memory effect, because slip is an irreversible process. The martensitic
transformation occurs in self accommodating manner to keep the same shape upon
cooling (upon transformation) and to minimize the energy change. Further deformation
proceeds with twin boundary motion which is the reorientation process of one martensite
variant to another. Saburi et al. [47] demonstrated that the most favorable
correspondence variant grows at the expense of the others and gives the largest strain
under the applied stress. Martensite transform back to austenite upon heating above Af.
When the temperature is below Mf the specimen is in complete martensitic state, thus the
deformation is the deformation of martensite, however if the temperature is above Mf a
part or whole of the deformation is by stress-induced martensitic transformation. The

13
superelasticity or transformation pseudoelasticity concept arises from the stress induced
martensitic transformations. Superelasticity occurs by the stress induced transformation
upon loading and transforms back to austenite upon unloading. The condition of
observing superelasticity and shape memory effect in the same specimen depends on the
test temperature. The required conditions for each mechanism are demonstrated in
Figure 2.4.
The line with positive slope in Figure 2.4 represents the critical stress to induce
martensitic transformation and the lines with negative slopes represent the critical stress
for slip. The hatched region is the region that if the stress is applied above Af, the stress
induced martensite transformation occurs at a stress above the critical stress for inducing
martensite. Upon unloading the martensite transforms back to austenite since martensite
is unstable above Af in the absence of stress. If the stress is applied at temperatures
below As, martensite stays deformed after unloading and the strain can be recovered only
by heating the specimen above Af. Therefore, in the region between As and Af, both
superelasticity and shape memory effect coexist. Deformation at temperatures above Md
do not lead to stress induced transformation since the main mechanism taking place is
deformation by slip. Figure 2.5 demonstrates schematic stress-strain response of a shape
memory alloy. There are three possible deformation mechanisms which are explained
below and represented in Figure 2.5.
1st Case: If the material is in the austenitic phase, in Stage I, elastic deformation
of austenite occurs, in Stage II, stress induced martensite forms and in Stage III, slip
deformation occurs.
2nd Case: If the material is in the martensitic phase, in Stage I, elastic
deformation of martensite occurs, in Stage II, detwinning of martensite proceeds with
the growing of some favored variants at the expense of others, in Stage III, slip
deformation of martensite occurs.
3rd Case: If the initial material is a mixture of austenite and martensite phases
mixture of the 1st and 2nd mechanisms take place.
Upon unloading, the martensite phase unloads elastically in all mechanisms and
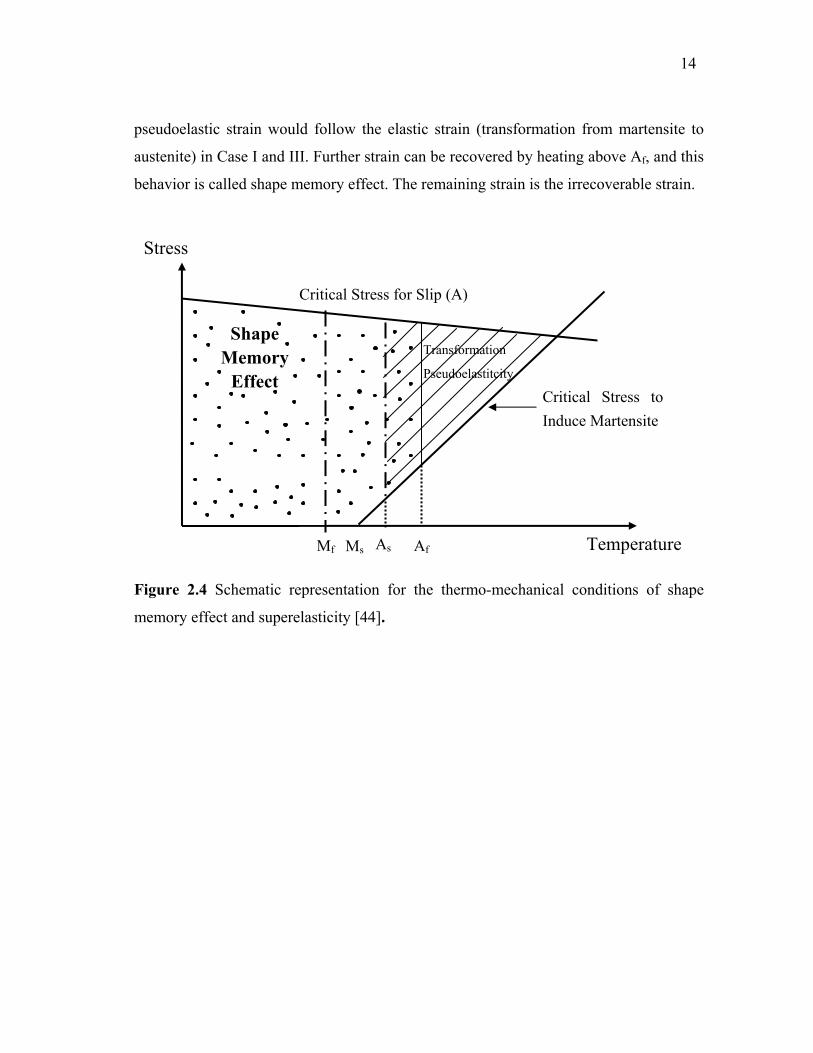
14
pseudoelastic strain would follow the elastic strain (transformation from martensite to
austenite) in Case I and III. Further strain can be recovered by heating above Af, and this
behavior is called shape memory effect. The remaining strain is the irrecoverable strain.
Transformation
Pseudoelastitcity
Temperature Mf Ms As Af
Critical Stress for Slip (A)
Critical Stress to Induce Martensite
Stress
Shape Memory
Effect
Figure 2.4 Schematic representation for the thermo-mechanical conditions of shape
memory effect and superelasticity [44].

15
StrainRecoverable Strain
Elastic StrainPseudoelasticStrain
SME StrainIrrecoverable Strain
Heated above Af
Stage I Elastic Behavior
Stage IIISlip of Martensite
Stage IIT>Ms Stress Induced MartensiteT<Ms Detwinning of MartensiteThen elastic loading of martensite
Stre
ss
StrainRecoverable Strain
Elastic StrainPseudoelasticStrain
SME StrainIrrecoverable Strain
Heated above Af
Stage I Elastic Behavior
Stage IIISlip of Martensite
Stage IIT>Ms Stress Induced MartensiteT<Ms Detwinning of MartensiteThen elastic loading of martensite
Stre
ss
Figure 2.5 Schematic stress-strain behavior of shape memory alloys [48].
In shape memory effect, the remembered shape is the shape of parent phase.
Remembering the shape of both parent and martensite phases under certain conditions is
known as two-way shape memory effect (TWSME). TWSME occurs if internal stress
fields due to microstructure bias certain martensite variants to lower the energy of the
system and leads to external shape change. The first report of two-way shape memory
effect on TiNi alloys was published by Wang and Buehler [49]. The required conditions
necessary for TWSME are; 1) introduction of plastic deformation [50, 51], 2) constraint
aging [52], 3) thermal cycling [53], and 4) martensite aging due to symmetry-
conforming short range order [54]. Certain stress sources are created during these
processes such as dislocation configurations and precipitates which produce internal
stress fields to choose specific martensite variants to lower the energy of the system and
create the certain shape of martensite.

16
2.3 Conventional Shape Memory Alloys
Shape memory alloys (SMAs) which demonstrate thermoelastic martensitic phase
transformations have revolutionized the development and use of active materials in the
last 40 years by providing large reversible shape changes and very high actuation forces.
The unique shape memory behavior was publicized in 1963 [55] when the equiatomic
NiTi binary alloy, the most well-known SMA, was shown to exhibit shape memory
effect at the U.S. Naval Ordinance Laboratory, that brought the true scientific and
technological value of these alloys into realization. After 1960s, especially in late 70s
and early 80s when extensive research on Cu and NiTi based alloys started in the U.S.
and Japan, processing-microstructure-functional property relationships in these unique
alloys were revealed and several commercial applications have been attained since then.
After all these work and development, shape memory alloys are now being used as
functional materials for pipe couplings, electrical connectors, various actuators and
sensors, biomedical devices, springs, and glass frames.
Conventional SMAs display superelasticity and shape memory effect behaviors
usually at temperatures near or below ambient temperature. Among many SMAs, NiTi
and Cu-based alloys are the most utilized ones due to their excellent mechanical and
functional properties. Phase transformation temperatures of available binary NiTi and
ternary Cu-based alloys (CuZnAl, CuNiAl, CuNiBe, etc.) are usually below 100 °C [56]
and 200 °C [57], respectively.
2.3.1 Cu-based Shape Memory Alloys
Among Cu-based SMAs, Cu-Zn based have actually been used and Cu-Al based
SMAs have shown promise. Many Cu-based SMAs posses martensitic transformation
from body centered cubic ordered parent phase to a mixture of monoclinic β’ and
orthorhombic γ’ martensitic phases [58]. The martensitic transformation start
temperature of Cu-40at%Zn alloy is far below room temperature [59]. Thus, to increase
the Ms temperature and to stabilize the parent phase, ternary elements such as Al, Ga, Si
and Sn are added. CuZnAl ternary alloys exhibit the most excellent properties as

17
compared to other Cu-based SMAs due to their higher ductility and resistance to grain
boundary fracture properties. Ms temperature of Cu-Al alloy is a little above room
temperature when the Al content is 14wt%. The alloys with Al content higher that
14wt% are susceptible to precipitation of a second phase γ2 which does not undergo
phase transformation. When Ni is added as a ternary element, precipitation of γ2 is
suppressed. However, as the Ni content increases the alloy becomes brittle [60].
Excellent SME is observed in CuAlNi alloys with Al content close to 14wt% and with
4.5wt%Ni content.
The mechanical properties of Cu-based shape memory alloys highly depend on the
resistance to grain boundary fracture since it occurs very easily. For instance, the
fracture stress of single crystal CuAlNi alloys is about 600MPa while that in the
polycrytals is 280MPa [61]. Therefore, above Af, no superelasticity is observed in
polycrystalline CuAlNi alloys since grain boundary fracture occurs before the martensite
is stress induced, however, they exhibit superelasticity as large as 18% in the single
crystalline state [62]. The intergranular cracking occurs not because of the impurities at
the grain boundaries such as Bi, Sb, S, P, O and Pb which are known to cause
intergranular embrittlement of Cu [60], but instead, takes place due to elastic and plastic
incompatibilities between grains, a consequence of high elastic anisotropy [63].
The detailed studies on CuAlNi alloys have shown that the formation of stress
induce martensite along grain boundaries upon quenching is the main reason for
intergranular cracking. If the stress due to the displacement associated with the
formation of stress induced martensite is not accommodated by a deformation mode, to
maintain compatibility at a grain boundary, the displacement causes a crack of a width
which depends on the orientation mismatch between two adjacent grains [64]. Small
grain size, small orientation dependence of transformation strain and ease of plastic
deformation might be the conditions to reduce the crack size. CuZnAl alloys are rather
ductile in polycrystalline state due small orientation dependence of transformation strain,
thus, they exhibit pseudoelasticity (superelasticity) at stresses as high as 300MPa [1].

18
2.3.2 TiNi Shape Memory Alloys
As opposed to Cu-based SMAs TiNi alloys show good ductility eventhough they
are intermetallic compounds. Such unique feature is the result of their low elastic
anisotropy. In addition to their high ductility, they have superior corrosion resistance and
ability to recover their initial shape after deformation [1, 2].
Many researches studied the phase diagram of NiTI systems since thermal
treatments are important to improve the shape memory properties NiTi alloys. Laves and
Laves et al. [65] first reported the single phase TiNi at near equiatomic composition.
Poole and Hume-Rothery confirmed the decomposition of TiNi into Ti2Ni and TiNi3
which was first determined by Duwez and Taylor [66, 67]. It was found that TiNi phase
extends to lower temperatures, however, the solubility range decreases with lowering
temperature on Ni-rich side [66, 68]. Purdy et al. [68] first determined that the
martensitic transformation proceeds with a diffusionless process at low temperatures
although they did not use the term “martensitic transformation”. After the discovery of
martensitic transformation in TiNi alloys in 1963, Wasilewski et al. [69] determined a
new phase, Ti2Ni3, and noticed that there is a vertical boundary on the Ti-rich side and
solubility range of TiNi phase is very narrow at 500°C and below.
Up to this point, although some of the basics of the phase diagram were
established, there were some difficulties in understanding all the phase transformations
and the presence of some of the phases like Ti2Ni3. Nishida and his co-workers [70]
studied extensively the transformations at high temperatures in the Ti-52at%Ni alloy.
They found that at lower aging temperatures and shorter aging times Ti3Ni4 phase
appears, at higher aging temperatures and longer aging times TiNi3 phase forms and at
intermediate aging temperatures and times Ti2Ni3 phase nucleates. The phase diagram of
Ti-Ni alloys by Massalski [71] can be found in Figure 2.6.
The solubility limit on the Ti-rich side of the binary TiNi alloy is almost vertical
and precipitation of Ti2Ni phase preferentially appears at grain boundaries in bulk NiTi
alloys. These precipitates decrease the fracture strength and degrade the shape memory
behavior of the NiTi alloys. The possible solution to this problem is producing the Ti-

19
rich NiTi alloy in thin film forms and heat treating the thin films at high temperatures
like 700°C for 1 hour or longer times like 10 hours at 500°C for the equilibrium
distribution of Ti2Ni precipitates in the grains [72]. Since the amorphous thin film
supersaturates Ti atoms at high temperatures or during longer heating times excess Ti
can precipitate upon crystallization [73].
Figure 2.6 Phase diagram of binary NiTi [71].
Fully annealed near-equiatomic NiTi alloys transform from B2 to monoclinic
B19’ phase martensitically upon cooling. If near equiatomic TiNi alloys is thermally
cycled or thermo-mechanically treated, the martensitic transformation occurs in two
steps, i.e., B2 to R-phase and then to monoclinic B19’ phase [74]. B2 to R transition is
also martensitic. The R-phase was first reported as tetragonal phase, however,
rhombohedral distortion was recognized later [75, 76]. Ni-rich TiNi alloys which are
aged at an appropriate temperature and ternary TiNiFe and TiNiAl also show two-step

20
phase transition [77-79].
2.3.2.1 Self Accommodation and Twinning in NiTi Alloys
In NiTi SMAs, martensite variants form self accommodated structure to
minimize the energy of the system. Between B19’ martensite and B2 parent phase, there
are 12 lattice correspondences resulting in 24 martensite variants. Self accommodation
NiTi alloys can be characterized by triangular morphology which is presented in Figure
2.7 [80]. When TiNi alloys are cooled down below Ms temperature, the martensite can
transform to 24 possible internally twinned variants to form self accommodating
structure. The interphase between each two of three variants is a twin plane. There are 16
subgroups forming the triangular self accommodating morphology around each of the
[001]B2 poles, indicating 48 possible combination of variants can form such triangles
[80].
(a) (b)
Figure 2.7 a) Schematic representation of triangular morphology and b) crystallographic
relationships between the variants in the triangular morphology [80].

21
In all self accommodating structures martensite variants have twin relations with
each other and when an external force is applied the most favorable variant grows at the
expense of others, resulting in net shape change. As discussed in section 2.1 the lattice
invariant shear in SMAs is twinning which is schematically shown in Figure 2.8. K1 is
invariant plane and K2 is the other undistorted plane. The plane which is normal to K1
and parallel to η1 shear direction is the shear plane. η2 is the intersection of K2 and the
other shear plane. If K1 and η2 are rational and K2 and η1 are irrational the type of
twinning is called type I twinning, if it is the opposite then the twinning is called type II
twinning. If all of them are irrational, compound twinning takes place [1].
Figure 2.8 The deformation of a sphere into an ellipsoid and the definition of K1, η1, K2
and η2 [1].
2.3.2.2 The Effect of Thermo-Mechanical Treatments on NiTi Alloys
All the aforementioned studies showed that the shape memory behaviors of NiTi
alloys depend on the thermo-mechanical history such as aging, cold deformation and

22
severe plastic deformation [5]. In this section, the effect of the thermo-mechanical
treatments (TTs) on shape memory characteristics of NiTi alloys such as transformation
temperatures, transformation and irrecoverable strains will be revealed. In addition, the
effect of the thermo-mechanical treatments on the microstructural evolution such as
twinning mode evolution and grain size refinement will be summarized.
2.3.2.2.1 The Effect of Thermo-Mechanical Treatments on Transformation
Temperatures
The transformation temperatures of the NiTi alloys are highly dependant on the
composition of the alloy and the thermo-mechanical treatments. For instance, on the Ni-
rich side of TiNi alloys, the transformation temperatures decrease to subzero levels with
the increase in Ni-content. Aging treatments cause the formation of Ti3Ni4 precipitates
which increase the transformation temperatures due to depletion of Ni in the matrix. The
transformation temperatures of the aged Ni-rich TiNi are still below room temperature
and depend on the amount and size of the precipitates while Ti-rich NiTi alloys are less
sensitive to the aging treatments, because the formation of Ti2Ni precipitates keeps the
Ni-content of the matrix to be of equilibrium. Figure 2.9 shows the aging time effect on
the Ms temperatures of one Ni-rich and one Ti-rich NiTi alloys [84]. Ms temperatures are
not affected from heat treatments in near equiatomic NiTi alloys since precipitates do not
form upon aging [77].
The transformation treatments of NiTi alloys are also affected from the cold
deformation or severe plastic deformation. It is known that cold deformation suppresses
the transformation temperatures to very low temperatures such that no transformations
were detected down to -60°C in Ni-rich NiTi alloys and equiatomic NiTi alloys [9, 82].
The transformation temperatures of cold deformed NiTi alloys can be increased by
subsequent annealing at intermediate temperature like 350°C. Ms temperature of the cold
deformed Ti-50.9at%Ni alloy at 350°C was determined as slightly above room
temperature [82]. The increase in Ms temperature in Ni-rich NiTi alloys can be attributed
to rearranging and annihilating the tangled dislocations and the formation of Ti3Ni4

23
precipitates. The increase in transformation temperatures was also observed in cold
deformed and annealed equiatomic NiTi alloys [9].
Figure 2.9 Effect of aging time on Ms temperature of Ni-rich and Ti-rich NiTi SMAs
[81].
The transformation temperatures of equiatomic NiTi alloys are also affected from
thermal cycling while they are not affected from thermal cycling in Ni-rich NiTi alloys.
This implies that the precipitates in Ni-rich NiTi alloys suppress the cyclic effect. On the
other hand, the transformation temperatures of equiatomic NiTi alloys decreases with the
number of cycles which can be attributed the dislocation formation. The dislocations
which are formed during thermal cycles suppress the martensitic transformation.
Severe plastic deformation also affects the transformation temperatures of NiTi
alloys. It was found that Ms temperature of the equiatomic NiTi alloy which is deformed
at 300°C only for 1 pass decreased down to 72°C while Ms of the solutionized
equiatomic NiTi alloy is around 80°C. The R-phase start temperature (Rs) of Ti-
50.8at%Ni alloy which is ECAE processed at room temperature is detected as 40°C only

24
after annealing at 350°Cfor 30mins while martensite transformation is still not clear [20].
The affect of severe plastic deformation can be attributed to the formation of
dislocations.
2.3.2.2.2 The Effect of Thermo-Mechanical Treatments on Twinning Mode and
Grain Size in NiTi Alloys
The mechanisms to accommodate the shape change which occurs through the
deformation of NiTi alloys differ according to the deformation mode and amount. The
most common twinning system in solutionized NiTi is <011> type II twinning which
was first found by Knowles and Smith [83, 84]. Zheng et al. [84] studied the studied the
effect of amount of cold rolling on the twinning modes in Ti-49.8 %at Ni alloy and
revealed that up to 12% area reduction (AR), coalescence of martensite variants is the
mechanism for accommodation of the shape change. The dominant twinning mode is
still type II twinning but some type I twinning is also observed. The intervariant
boundaries became curved, distorted and blurred eventually. After 16% AR, the
deformation took place mainly inside the variants; formation and rearrangement of
structural bands and formation of new twins would occur. Type I and compound
twinnings operate and consume type II twinning. Otsuka et al. [85] determined m1}11{−−
type I twins. Gupta and Johnson found m(001) compound twins and type I twins
[86]. Onda et al. [87] determined the conjugate pair of
m}011{
m(001) compound twin which is
m(100) and Nishida et al. [88] found m}1{20−
twins although they cannot be lattice
invariant shear. Waitz et al. [24-26] studied the effect of severe plastic deformation via
high pressure torsion on the twinning modes of NiTi alloy and showed that martensitic
transformation causes a unique “herring-bone” morphology of the martensite composed
of fine lamellae containing nanotwins. Strain energy calculations and high resolution
transmission electron microscope analysis lead to the conclusion that compensation of
the transformation strains occurs by the m(001) nanotwins [26]. m(001) and m(001)
compound twinnings can be considered as the deformation twinning in martensite since

25
one of the slip systems of NiTi is [100](001) and it is proposed that <100> compound
twin is created by the slip of a/2 on the (001) plane because of the presence of a partial
pseudo-mirror [89, 90]. Kockar et al. [9] found deformation twins in the austenite in
heavily deformed equiatomic NiTi alloys and revealed the formation of highly refined
twins which have twinning plane and high dislocation density in the equiatomic
NiTi samples which were ECAE processed at 300°C. Severe plastic deformation leads to
the formation of compound twins in martensite and deformation twins in austenite.
1)3(1−
Waitz et al. [25] studied the effect of severe plastic deformation using high
pressure torsion on the grain size and the corresponding transformation behavior of Ni-
50.3at%Ti alloys. The range of the grain size is from 5 to 350nm in the HPT processed
and then annealed samples. It was found that the martensitic transformation is
suppressed in the grains smaller than 60nm and the R-phase transformation only causes
small transformation strains in the grains between 15 and 60nm. Large transformation
strains which occur in B2 parent phase to B19’ martensite transformations are reduced
with the formation of very fine (001) compound twins [25]. It was also proposed that the
grain size refinement changes the transformation sequence from B2→R phase→B19’ to
minimize the overall energy which opposed the transformation. Martensitic phase
transformation of nanostructures NiTi alloys, high density of grain boundaries acts as
transformation barrier and causes austenite stability in the grains and change the
transformation path [24-26].
The grain size refinement also affects the other shape memory properties of NiTi
alloys such as transformation temperatures and superelasticity. There are two approaches
to the effect of grain size on the Ms temperature. One of them is the decrease in grain
size increases Ms which is attributed to the homogeneous nucleation of martensite phase
caused by internal stress arising from high anisotropy of nanoscale grain size [91]. The
other approach is the decrease in grain size decreases the Ms temperature due to the
increase in density of grain boundaries which act as transformation barriers and cause
austenite stabilization.

26
Grain size refinement has influence on the pseudoelastic behavior of NiTi alloys.
It was reported that small grain size is effective to improve pseudoelasticity since grain
boundaries would support the back stress needed for back transformation and act as
nucleation sites for martensite. Saburi et al. [92] demonstrated that Ti-50.5at%Ni alloy
with 50μm grain size shows complete pseudoleasticity, however the alloy with 1mm
grain size shows 85% recovery when the samples are tested at 40°C.
2.3.2.2.3 The Effect of Thermo-Mechanical Treatments on Texture
Single crystals and cold rolled polycrystals studies showed that mechanical
response and transformation behavior of NiTi alloys are highly orientation dependent
[93]. For instance, tensile stress-strain curves of a cold rolled NiTi sheet show a flat
stress-plateu during tension along the rolling direction while along the transverse
direction the material strain hardens quickly [93]. This is attributed to the deformation
behavior of the three types of twins which are , )001( )111(−
type I and type II
twins differs along rolling and transverse directions. Gall et al. [19] showed that [111]
orientation showed poor cyclic degradation resistance and rapid increase in the
permanent strain with cycles [15] and revealed that cold rolled Ni-rich NiTi polycystals
has a strong texture of type [19]. It was also found that the critical
resolved shear stress depends (CRSS) on orientation in aged NiTi single crystals which
demonstrate tension-compression asymmetry. These deviations are attributed to the
strong local stress fields surrounding the coherent Ti3Ni4 precipitates which alter the
orientation relationship of CRSS [19].
>< 011
}110{111 ><
[001] orientation in single crystalline NiTi alloys show the superior fatique
response as compared to the other orientations, because in NiTi alloys, the slip systems
were reported to be {100}<001> and {110}<001> [17].
In the literature, there is a lack of knowledge on the texture evolution of
polycrystal NiTi alloys with severe plastic deformation. The texture evolution with
ECAE studies focus on generally one element materials like Cu, Ti and W. These studies
showed that texture highly depends on the processing routes and number of passes in

27
ECAE. The definitions of the routes will be given in section 2.5. It is found that after the
first pass of ECAE the typical shear-type texture >< 110}111{ is dominated, however
after three passes, texture type can be seen [94]. Since the preferred
austenite texture formation near [001] pole in NiTi alloys can suppress the dislocation
formation, NiTi alloys are generally ECAE processed for more than three passes to
achieve 001 texture. However, texture formation also depends on the ECAE temperature
and at relatively higher processing temperatures strong texture is not expected [9].
>< 110}001{
2.3.2.2.4 The Effect of Thermo-Mechanical Treatments on Thermal Cyclic
Response of NiTi Alloys
NiTi SMAs as actuation devices produce large forces/stresses up to 500MPa over
4-8% strains; however their thermo-mechanical responses may vary significantly due to
change in chemical compositions, material processing and thermo-mechanical cycling.
There are vast amount of work on the stress-induced martensitic transformations in NiTi
at temperatures above As revealing the effects of stress and strain level, cycle,
prestraining and strain rate on the transformation characteristics. For instance, thermo-
mechanical cycling leads to evolution of plastic strain which imparts internal stresses
such that martensite stabilization occurs during transformation back to austenite.
Miyazaki et al. [18] studied large plastic deformations above As in Ni50.6Ti alloy. It was
found that if the material was deformed to the range of 4-7% level the strain is not
recovered completely, since the deformation is accompanied both by twinning and
dislocations. Miller et al [8] studied the effect of cold working and annealing
temperature on the transformation and plastic strain of equiatomic NiTi alloy under
applied stress. They found that the increase in the level of cold working raises stress
level for the onset of plastic deformation and decreases the additional development of
plastic strain with cycling. The maximum transformation strain levels of the alloy cold
worked 20%, 30% and 40% and annealed at different temperatures for various time
ranges do not change much and are 5-5.5%. The sample 10% cold worked shows
maximum level of 6.1% transformation strain.

28
Several studies have been conducted on SPD of NiTi SMAs by Valiev and his
colleagues [27, 29] and Karaman et al [20]. The former group studied the mechanical
properties of HPT and ECAE processed NiTi alloys. They reported that NiTi alloy
processed by HPT and subsequent annealing leads to an increase in the strength at
failure up to 2650MPa with an elongation to failure of 5% [28]. However, they only
investigated the microstructural evolution and mechanical properties of the alloys. The
later group studied the effect of ECAE on shape memory properties transformation and
irrecoverable strain levels of NiTi alloys [9, 20]. They reported that thermal cyclic
stability is improved in the ECAE processed samples which is attributed to the refined
microstucture and nanometer range deformation twins [9]. They revealed that under
200MPa, the irrecoverable strain level of equiatomic NiTi alloy, ECAE processed at
300°C, decreased down to 0.2% from 0.8% which is irrecoverable strain level of the
30% cold drawn and subsequently annealed equiatomic NiTi alloy.
2.4 High Temperature Shape Memory Alloys (HTSMAs)
The existing HTSMAs can be classified in three regimes in terms of their
transformation temperature ranges: 100°C to 400 °C, 400°C to 700°C, and 700°C and
over. Such classification is a result of different issues and operative microstructural
mechanisms associated with each temperature range and available alloy systems. Some
of the known HTSMAs are NiTi with Pd, Pt, Zr, and Hf additions, Ti-Pd, Ti-Pt, Ni-Al,
Ni-Mn, TaRu, NbRu, TiIrPt and ZrCu-based binary and ternary systems. In addition,
there are few new alloy systems with transformation temperatures lower than 100°C but
demonstrating superelasticity at high temperatures. These high temperature superelastic
alloys are CoNiGa, CoNiAl, NiFeGa.
NiTi alloys with Pd, Pt Zr and Hf and Zr-based intermetallics are the most
common HTSMAs in the first temperature regime. Firstov and his coworkers studied the
Zr-based quasibinary intermetallics [95, 96]. They reported that these alloys suffer from
transformation-induced plasticity and are significantly more brittle than the NiTi based
ternary alloys. Thin films, on the other hand, have demonstrated improved high

29
temperature shape recovery as compared to their bulk counterparts [96]. The shape
memory behavior and further information about NiTi alloys with Pd, Pt, Zr and Hf will
be summarized in subsection 2.4.1.
The challenge on the high temperature superelastic alloy systems such as CoNiGa,
CoNiAl and NiFeGa is poor workability because these alloys suffer from poor ductility,
thus the practical use of these new alloys depends highly on the solution to this problem
[97-98]. It was reported that introduction of γ second phase improves the workability of
the alloys both at high temperatures and at room temperature as well [97-98].
The number of HTSMA systems with transformation temperatures higher than 400
°C is quite limited. The martensitic transformation in binary and ternary Au-Ti and Ti-
Pd alloys occurs in the second temperature regime and has been extensively studied by
Donkersloot and Van Vucht [35]. They have also explored the phase transformation
characteristics of equiatomic binary Ti-Pt system for which the transformation
temperature is around 1000 °C, in the third temperature regime. The main issue with the
alloys in the second regime is dynamic recrystallization and martensite aging effect in
the course of forward and reverse phase transformation. Otsuka and his co-workers have
focused on the recrystallization process in TiPd alloys which appears to be directly
affecting the high temperature shape memory response and transformation stability [99,
100]. The ordinary martensite aging, recovery and recrystallization, and other diffusional
processes occur at temperatures below reverse transformation start temperature (As),
even in very short times, competes with diffusionless martensitic transformation, and
cause an increase in As. Such degradation in transformation and cyclic degradation
response prevent the long term use of these alloys.
The binary Ta-Ru and Nb-Ru intermetallics which have transformation
temperatures higher than 700°C demonstrate multistage phase transformations and
undergo B2 to tetragonal to monoclinic martensitic transformations [101, 102]. The
equiatomic compositions result in the best shape recovery with low thermal hysteresis
[101]. TaRu and NbRu exhibit low strain recovery, 2% under compression and around
5% and 4% under tension, respectively [102]. They are based on equilibrium phases and

30
transitions as opposed to metastable phases in conventional SMAs, thus, they don’t show
overaging effects caused by decomposition and precipitation at elevated temperatures.
2.4.1 NiTi HTSMAs with Pd, Pt, Zr and Hf
NiTi-based ternary alloys with the addition of one of Pd, Pt, Zr, and Hf have been
the most studied HTSMAs up-to-date. Although the transformation temperatures of
NiTiAu are higher than NiTiPd for a given composition, there is not much work
performed on this alloy. It was found that AuTi binary alloys exhibit B2 to orthorhombic
B19 martensitic transformation [35]. Wu and Wayman studied the ternary TiNiAu alloys
and found that NiTi alloy with 5-10at% Au transforms from B2 to B19’ monoclinic
structure and NiTi with 40-50at%Au transforms form B2 to B19 orthorhombic structure.
The later two alloys have transformation temperatures higher than 450°C [103, 104].
The other alloy system which has received little attention like the TiNiAu alloys is
TiNiPt since they are very expensive materials. Ms temperature of TiNi alloy with 0-
10at%Pt decreases slightly, however at higher levels of Pt, Ms temperature increases
linearly up to 1040°C for 50at%Pt addition [35, 36]. TiNi alloys with 16at%Pt or greater,
it is found that there is a one step transformation which is B2 to B19 orthorhombic
martensite [36]. Zr is added to TiNi alloys at the expense of Ti which is opposite to Au
and Pt additions for Ni. Mulder et al. determined that Ms temperature of NiTiZr alloys
increases with a rate of 18°C/at% of rate [105]. It was also observed that the
transformation temperatures decrease during thermal cycling which was attributed to the
precipitation on the alloy. Basically, TiNiZr alloys are the least potential ones in high
temperature shape memory alloys because they exhibit poor ductility and unstable shape
memory response.
Hf is added to NiTi alloys at the expense of Ti, however, the amount of Hf addition
is limited since there is no continuous solid solution between NiTi and NiHf. The
transformation temperatures of the alloy do not increase much up to 10at% Hf but at
concentrations higher than 10at%, transformation temperatures increase linearly up to
525°C at 30at%Hf. [106, 107]. TiNiHf alloys show B2 to B19’ monoclinic martensitic

31
transformation as in binary NiTi, if the Hf content is less than 15at%. The alloys which
contain higher than 15at%Hf show B2 to orthorhombic B19 martensitic transformation
[109, 109]. The second phases suh as (Ti,Hf)2Ni and (Ti+Hf)4Ni2Ox were identified in
NiTiHf alloys [110, 33]. Although the former may be desirable for improving the shape
memory properties, the latter is not desirable as it may influence the workability and
shape memory properties [111]. The disadvantages of TiNiHf alloys are the large
hysteresis and poor shape memory behaviour. It was reported that the hysteresis is on the
order of 40-50°C and sometimes even larger. It was observed that shape recovery is 80%
when the Ni50Ti38Hf12 is deformed at room temperature to a strain of 2.5% which is
attributed to the high stress for the reorientation of martensite and detwinning but the
low critical stress for slip [33]. Meng et al. [108, 110] examined the tensile properties of
Ni49Ti36Hf15 at room temperature and above Af temperature and observed significant
strain hardening which means martensite reorientation is not easy. To increase the
critical shear stress for slip, Karaman’s group studied severe plastic deformation of
NiTiHf alloys and they observed an increase in the recoverable transformation strain
(recoverable strain) and a decrease in the irrecoverable strain levels under constant stress
experiments [13]. They also investigated the thermal cyclic behavior of the
Ni49.8Ti42.2Hf8 alloy after severe plastic deformation via equal channel extrusion and
found that cyclic stability is improved and thermal hysteresis is decreased [13].
NiTi alloys with 10at%Pd or less transform from B2 to B19’ monoclinic martensite
with significantly reduced transformation temperatures, for instance, Ms is -26°C in NiTi
alloy with 10at%Pd. [36]. In contrast, the addition of Pd more than 10at% increases
transformation temperatures and changes the martensite type to orthorhombic martensite
[36]. The transformation temperatures increase with the Pd content almost linearly
reaching 510-563°C for Ti50Pd50 binary alloy [35, 112].
PdTi and NiTi binary alloys form a continuous solid solution with a serious
decrease in transformation temperature by the amount of Ni content in the ternary alloy
[36]. The intermetallic phase Ti2(Ni,Pd) which is isostructural to the face-centered-cubic
Ti2Ni phase in binary titanium-rich NiTi alloys was found in ternary NiTiPd alloys

32
[113]. The other phase detected in NiTiPd alloys is titanium carbides or oxycarbides
(TiC or Ti(C,O)) [34]. The size of the intermetallics is usually several microns while the
sizes of carbides and oxycarbides are average of 0.5μm.
Otsuka et al. has reported that the shape memory behavior of TiNiPd alloys is
fairly good at room temperature however becomes poor with increasing temperature due
to the decrease in critical shear stress for slip [114]. Lindquist and Wayman reported 6%
unconstrained shape recovery [36]. Khachin et al. reported 4% complete strain recovery
which is introduced by applying 200MPa stress in torsion for Ni13Ti50Pd37 [115]. Otsuka
and his co-workers studied the shape memory effect in Ti50Pd50 alloys and reported poor
shape memory behavior which can be attributed to the low critical stress for slip such
that high density of slip is introduced in addition to twinning in martensite [116]. NiTi
alloys with 40-50at%Pd shows 0.5% shape recovery when loaded in tension.
The first requirement for being high temperature shape memory alloys is having
high transformation temperatures, however; this is not sufficient for desirable SME. As
explained above NiTiPd alloys also suffer from low critical stress for slip especially at
high temperatures which causes plastic deformation during phase transformation and
thus, poor shape memory behavior. Thus, to improve the shape memory response of the
NiTiPd alloys different approaches has been used such as alloying with a fourth element,
precipitation hardening or thermo-mechanical treatments. Yang and Mikkola examined
the effect of boron addition to the shape memory characteristics of Ni22.3Ti50.7Pd27 alloy
and found 90% shape recovery for 2-3% applied deformation under compression [38].
Boron has no real effect on the shape memory characteristics; however, they determined
an increase in the ductility of the alloy at room temperature and attributed this increase
to the grain refinement due to boron addition. The other method to improve the shape
memory characteristics of the NiTiPd alloys is using alloy which slightly deviates from
stoichiometry to generate homogeneously distributed Ti2Ni precipitates as in
Ni19.4Ti50.6Pd30 alloy [39]. It was observed that 90% recovery rate when the material is
deformed to total strain of 6% at 100°C which is about 10% higher than Ti50Ni30Pd20
[39]. The improvement of shape recovery was attributed to the hardening effect by the

33
homogeneously distributed Ti2Ni precipitates. In addition, some thermo-mechanical
treatments were applied to modify the microstructure and strengthen the material by
grain refinement and dislocation formation. Goldberg and his coworkers reported the
improvement of shape memory properties of Ti50Ni30Pd20 after cold rolling and
subsequent heat treatment. They claimed superelasticity for the first time in Ti50Ni30Pd20
after annealing the alloy at 673K and testing at 535K [41]. Cai et al. [114] studied the
effect of thermal cycling on the shape memory properties of Ni19.4Ti50.6Pd30 alloys. It
was found that Ms temperature, total transformation strain and irrecoverable plastic
strain increase with the number of cycles. The change in these parameters occurs quickly
in the first 40 cycles and tends to stabilize after then. Thus, thermal cycling may be one
of the thermo-mechanical treatments to stabilize the shape memory response of NiTiPd
alloys.
The previous works on TiNiPd alloys mostly demonstrated the shape recovery of
these alloys under free stress conditions, isothermal mechanical properties and the
corresponding microstructural analysis. Most of the applications, however, require shape
recovery under applied stress. A research group at NASA Glenn Research Center
recently reported the shape recovery of several NiTiPd and NiTiPt alloys and
corresponding work outputs [32, 34]. They determined the strain-temperature response
of Ni19.5Ti50.5Pd30 alloy under various tensile and compressive loads [32]. They observed
that there is a slight difference between the tensile and compressive responses and work
output first increases, reaches a maximum and then start decreasing with increasing
stress level. They also observed an irrecoverable plastic deformation at each stress level
[34]. They proposed that before using this alloy in cyclic actuation applications the
resistance of the alloy to dislocation slip should be enhanced with promoting the twin
formation and motion by the similar methods summarized above.
2.5 Principles of ECAE
In this study, ECAE is chosen as the severe plastic deformation technique to
improve the mechanical, shape memory behavior and cyclic response of the equiatomic

34
NiTi SMAs and NiTiPd HTSMAs. The purpose of choosing ECAE instead of any other
severe plastic deformation techniques was revealed in Chapter I. Thus, in this section,
the principles of this deformation technique will be presented.
ECAE is a novel technique which permits the application of a large uniform
strain without reduction in the cross-section of the work piece [21]. The intersecting
angle of the channels is 2φ which is 90°C in our study as denoted in Figure 2.10. The
billet is inserted into one of the channels and the punch presses the billet into second
channel, thus the work piece passes through two intersecting channels which are 90° to
each other. After the extrusion stops, the billet is withdrawn from the channel. The
extrusion of a billet through these channels produces simple shear at the channel
intersection plane and the billets can be deformed in the same uniform manner
repeatedlyexcept the small part of the end regions.
Punch
Shear Plane
Billet
Extrusion Direction
φ
Figure 2.10 Schematic of ECAE process.
ECAE offers several advantages over the other competing processes such as HPT
and conventional extrusion. Some of these are the possibility of processing much larger

35
sample sizes, the ability to control the grain morphology and crystallographic texture,
the possibility to apply uniform strain throughout the billet [22].
Multiple passes are possible in ECAE without changing the cross-section. In
addition, ECAE permits a variety of deformation configurations by changing the
orientation of the billet with respect to the extrusion axis after each pass. This allows the
modification of shear planes and directions to develop different structures and textures
[117]. There are several possible ECAE routes. The main ECAE routes and their
schematics are given in Figure 2.11.
90° 270° 180°
Route A Route B: N=3, 5, 9… Route C: all passes Route Bc: all passes Route B: N=2, 4, 6… i
Figure 2.11 The description of the ECAE routes.
Route A: The billet rotation is the same at each pass. The distortion of the
material continuously increases and the laminar grain structure is developed.
Route B: The billet is deformed alternatively by rotating about the extrusion axis
counter clockwise 90°after every odd numbered passes and clockwise 90° after every
even numbered passes.
Route C: The billet is rotated 180° after each pass.
Route Bc: The billet is rotated 90° counter clockwise at each pass. Route Bc is the
most effective route to obtain equiaxed grains [118].
Route E: This is a hybrid route which is the combination of two passes of Route
C, rotating the billet 90°, and then two more passes following Route C. Following Route

36
E, the materials are highly worked with uniform refined microstructure and high density
of high angle grain boundaries [119].
The microstructural evolution and grain refinement mechanism during ECAE,
for a common material can be summarized as follows. In the first ECAE pass, the
dislocations are introduced. After then, the dislocations start to arrange to decrease the
internal energy of the system. In the following passes, subgrains are formed via
dislocation arrangement inside original grains with low angle grain boundary
configurations. More dislocations are introduced into the material in the subsequent
passes and these dislocations are absorbed by the low angle grain boundaries, hence their
misorientations increase. As a result, low angle grain boundaries evolve into high angle
grain boundaries and grains are refined [120]. Among the five previously defined routes,
route Bc is generally the most effective route for grain refinement because there are two
sets of available shear planes which intersect and cause grain subdivision [121] and
shear bands with different orientations create a uniform network in the materials [121].

37
CHAPTER III
EXPERIMENTAL PROCEDURE
3.1 As-Received Materials
The fabrication details and initial states of materials used in this study are
summarized below. The compositions of the alloys are given in atomic percentages.
Equiatomic NiTi alloy: The Ni49.7Ti50.3 alloy was prepared using vacuum
induction melting and then hot rolled at 900°C. The initial grain size and Ms temperature
of the hot rolled Ni49.7Ti50.3 alloy are determined as 40μm and 79°C, respectively.
TiNiPd alloys: The Ti50Ni30Pd20 alloys was prepared using vacuum induction
melting and solutionized at 1000°C for 1 hour in evacuated quartz tubes to homogenize
the as cast structure. Solutionizing was followed by water quenching. The initial grain
size and Ms temperature of the solutionized Ti50Ni30Pd20 alloy are determined as 30-
40μm and 135°C.
Ti50.3Ni33.7Pd16 was prepared using vacuum induction melting and hot rolled at
1700°F. Ms temperature of the hot rolled Ti50.3Ni33.7Pd16 alloy is determined as 90°C
The carbon and oxygen contents of NiTi and Ti50Ni30Pd20 were analyzed by standard combustion methods. For carbon content, ASTM E 350-90e1 was applied using a LECO C-200 analyzer and a calibration was performed using a NIST-traceable standard. For oxygen content, a LECO TC136/EF-100 was used according to ASTM E1409-04 standard procedure. The results are summarized in Table 3.1. Table 3.1 Carbon and oxygen impurity levels in Ni49.7Ti50.3 and Ti50Ni30Pd20.
Materials Carbon (wt%) Oxygen (wt%) Ni49.7Ti50.3 0.031 0.02 Ti50Ni30Pd20 0.051 0.047

38
3.2 ECAE Processing
ECAE of the initial materials were carried out following different processing
routes, temperatures and rates using a 250 ton press as shown in Figure 3.1. Higher
ECAE temperatures were necessary due to the limited ductility of the materials.
However, the materials were ECAE processed at different temperatures to achieve
minimum possible deformation temperatures for each material. This is because of the
desire to achieve the maximum possible microstructural refinement by avoiding
recovery/recrystallization.
The details of the ECAE schedules are given in Table 3.2 for NiTi and Table 3.3
for NiTiPd and the details of ECAE processes for each material are summarized in
sections 3.2.a, and 3.2.b.
Figure 3.1 250 ton extrusion press at Texas A&M University.
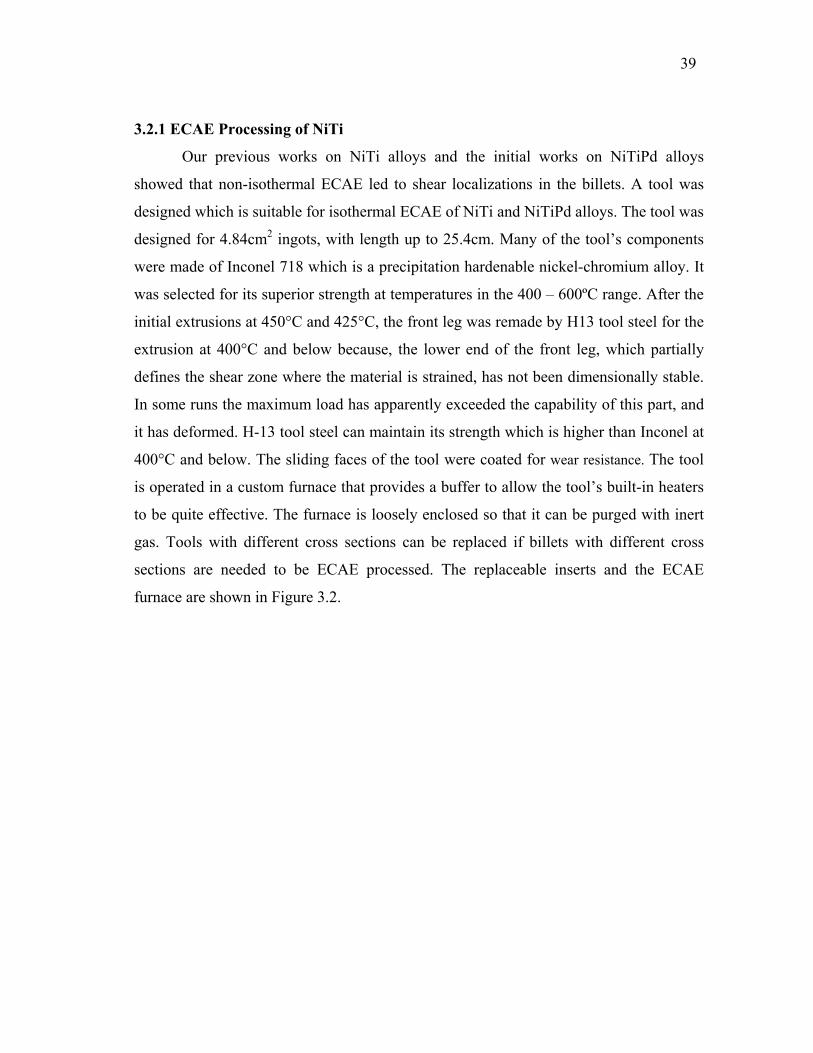
39
3.2.1 ECAE Processing of NiTi
Our previous works on NiTi alloys and the initial works on NiTiPd alloys
showed that non-isothermal ECAE led to shear localizations in the billets. A tool was
designed which is suitable for isothermal ECAE of NiTi and NiTiPd alloys. The tool was
designed for 4.84cm2 ingots, with length up to 25.4cm. Many of the tool’s components
were made of Inconel 718 which is a precipitation hardenable nickel-chromium alloy. It
was selected for its superior strength at temperatures in the 400 – 600ºC range. After the
initial extrusions at 450°C and 425°C, the front leg was remade by H13 tool steel for the
extrusion at 400°C and below because, the lower end of the front leg, which partially
defines the shear zone where the material is strained, has not been dimensionally stable.
In some runs the maximum load has apparently exceeded the capability of this part, and
it has deformed. H-13 tool steel can maintain its strength which is higher than Inconel at
400°C and below. The sliding faces of the tool were coated for wear resistance. The tool
is operated in a custom furnace that provides a buffer to allow the tool’s built-in heaters
to be quite effective. The furnace is loosely enclosed so that it can be purged with inert
gas. Tools with different cross sections can be replaced if billets with different cross
sections are needed to be ECAE processed. The replaceable inserts and the ECAE
furnace are shown in Figure 3.2.

40
(a) (b)
Figure 3.2 a) Replaceable inserts for ECAE processing of billets with different cross
sections b) ECAE furnace for isothermal extrusions up to 600°C.
The ECAE billets were cut by electron discharge machine (EDM) from the hot
rolled bar into 4.84cm2 cross section and 10.2cm long bars. The bars were wrapped in
brass foil to reduce friction. The ECAE die with a sharp 90° corner angle was preheated
to extrusion temperatures. The samples were kept in the ECAE die for 30 minutes before
the first pass for uniform heat conduction throughout the billets and then extruded
isothermally at 300°C, 400°C, 425°C and 450°C at a rate of 0.005”/sec. The heating
periods in the ECAE tool were decreased to 15 minutes before the successive passes to
prevent recovery/recrystallization as much as possible and in addition, the heat
conduction is easier in the billets which were ECAE processed for one pass than that of
in unprocessed billets. ECAE was conducted in nitrogen atmosphere for preventing
oxidation. The billets extruded at 400°C and 425°C were rotated 90° in between each
pass, (route Bc) and the one extruded at 450°C was processed using route E having billet
rotation sequence: +180°-90°-180°. The billets were water quenched after each ECAE
pass to freeze the ECAE processed microstructure. The bars were straightened and
thinned slightly between the passes so they could be reinserted in the tool. Route E was
chosen in the initial extrusion because of its lower punch load than that of route Bc and
to evaluate the formability of the NiTi alloy at high temperatures before attempting

41
lower extrusion temperatures using route Bc. Route Bc was selected since it usually
results in the most effective refinement with increasing number of passes among all
known routes [118,119]. Usually four ECAE passes were used for each billet due to the
fact that at least four or higher number of passes are required to obtain significant
volume fraction of high angle grain boundaries in body centered cubic structures during
ECAE [122]. However only one ECAE pass was used for the billet extruded at the
lowest deformation temperature possible for not to cause shear localization at higher
number of passes and to obtain sufficient material for further analysis.
Table 3.2 Summary of the equiatomic Ni49.7Ti50.3 ECAE processing detail.
Materials Extrusion Route
ECAE Temperature
(°C)
Ext. Rate (mm/sec)
Ni49.7Ti50.3 4E 450 0.127
Ni49.7Ti50.3 4Bc 425 0.127
Ni49.7Ti50.3 4Bc 400 0.127
Ni49.7Ti50.3 1A 300 0.127
3.2.2 ECAE Processing of TiNiPd
The initial extrusions were conducted on Ti50Ni30Pd20 alloy which were provided
as 2.25cm2 cross section were canned in two-piece Ni cans since the cross section of the
ECAE die is larger than the cross section of the billets. Ni cans were machined into
4.84cm2×10.2cm long bars using conventional techniques. After inserting the
Ti50Ni30Pd20 billets into the cans, the cans were copper coated to reduce the friction
between the work piece and the walls of the die. The canned billets were heated to
ECAE temperature in a furnace for 1 hour before the first pass and 30 minutes before the
successive passes. They were transferred to ECAE die as quick as possible to prevent the
chilling effect and ECAE processed non-isothermally in the die which was preheated to
300°C. Since the initial ECAE of Ti50Ni30Pd20 alloys were conducted non-isothermally

42
only one of them was successful. The successful ECAE on Ti50Ni30Pd20 billets was the
one which was conducted at 400°C using Route C for four passes. The other billets
experienced shear localization during ECAE. Digital image of a Ni30Ti50Pd20 billet
ECAE processed 400°C is shown before and after ECAE in Figure 3.3 as an example.
Later Ti50Ni30Pd20 billets were provided as 0.75in2 cross section rectangular bars.
These billets were wrapped in stainless steel foils and lubricated using stainless steel dye
to reduce friction. The billets were kept in the ECAE die, which was nitrogen purged and
preheated to ECAE temperature, for 45 minutes before the first pass and 30 minutes
before the successive passes. The initial billet was ECAE processed isothermally at
600°C using Route C for four passes and the later one was ECAE processed isothermally
at 500°C using Route C for 2 passes. The extrusion rate of ECAE processed non-
isothermally at 400°C Ti50Ni30Pd20 billet is lower than that of the billets ECAE
processed isothermally at 600°C and 500°C for preventing chilling effect in the ECAE
die which was preheated to 300°C.
Ti50.3Ni33.7Pd16 alloy was provided as rounded bars having diameters of 0.4in. Ni
cans which were used in the initial Ti50Ni30Pd20 extrusions were replaced with
commercial purity grade 2 titanium because in some of the Ti50Ni30Pd20 extrusions, Ni
cans failed in the first or second passes and did not allow running further passes. The
reasons of these inevitable failures could be due to the fact that Ni is softer than the
Ti50Ni30Pd20 alloy. Thus, the rounded bars were canned in commercial purity grade 2
titanium. The canned billets were wrapped in stainless steel foils and lubricated using
stainless steel dye. The billets were kept in the ECAE die, which was preheated to ECAE
temperature, under nitrogen atmosphere for 45 minutes before the first pass and 30
minutes before the successive passes. ECAEs of Ti50.3Ni33.7Pd16 billets were conducted
at 450°C using Route Bc for four passes, 425°C using Route B for 2 passes and 400°
using Route B for 2 passes.

43
(a)
(b)
Figure 3.3 Digital images of a Ni30Ti50Pd20 ECAE billet (a) before and (b) after 4 ECAE
passes at 400°C using Route C.

44
Table 3.3 Summary of the NiTiPd ECAE processing detail
Materials Extrusion Route
ECAE Temperature
(°C)
Ext. Rate (in/sec)
Ni30Ti50Pd20 4C 400 12.7 Ni30Ti50Pd20 4C 600 0.127 Ni30Ti50Pd20 2C 500 0.127
Ni33.7Ti50.3Pd16 4Bc 450 0.127 Ni33.7Ti50.3Pd16 2B 425 0.127 Ni33.7Ti50.3Pd16 2B 400 0.127
3.3 Microstucture Evaluation Methods
The unprocessed materials were examined with optical microscopy (OM) to
determine the grain size. Transmission electron microscope (TEM) and scanning
electron microscope (SEM) have been utilized to investigate the microstructures of
severe plastically deformed materials since the grain boundaries are heavily deformed
and can be poorly delineated by OM due to the high dislocation density and the
formation of submicron grains. It is necessary to keep track of the grain size and
microstructure evolution after ECAE using transmission electron microscope (TEM). All
OM samples were mechanically ground down to 1200 SiC grit paper and then polished
with 3 and 0.05 microns alumina powder sequentially. They were chemically etched
with HF: HNO3: Glycerol solution with the ratio of 1:4:5 to reveal grain boundaries.
JEOL JSM-6400 SEM equipped with energy dispersive spectrometer (EDS) and
Cameca SX-100 electron microprobe equipped with wavelength dispersive spectrometer
(WDS) were used to examine the second phase particles in NiTiPd materials. Secondary
electron and back scattered electron images were taken to represent the size of particles
in the NiTiPd materials. The same OM sample preparation recipe is used to prepare
samples for SEM; however, they were not etched in order to investigate only the second
phase particles without mixing them with the matrix microstructure. The compositions
of the precipitates were determined using wave dispersive spectrometer since WDS

45
analysis allows a more spectral resolution and more sensitivity than EDS analysis does.
The detection limits of WDS ordinarily varies between 300 and 30 parts per million.
TEM studies were conducted using a JEOL JEM-2010 microscope operated at an
accelerating voltage of 200 kV. The TEM samples were mechanically ground down to a
thickness of 100μm and twin jet electro-polished with a 20vol.% Nitric Acid and
80vol.% Methanol solution at -10°C. In order to examine the parent phase, the sample
was heated above austenite finish (Af) temperature (i.e: 200°C) using an in-situ TEM
heating stage. Bright Field, dark field and electron diffraction patterns were recorded.
3.4 Measurement of Phase Transformation Temperatures
The specimens were thermally cycled for 5 cycles during which transformation
characteristics was monitored using a Perkin-Elmer Pyris I differential scanning
calorimeter (DSC) in nitrogen atmosphere. The heating-cooling rate during the
experiments was set to 10°C/min in all experiments. Ni49.7Ti50.3 samples were cycled
between 20°C and 160°C, Ni30Ti50Pd20 and Ni33.7Ti50.3Pd16 samples were cycled between
20°C and 200°C.
3.5 Mechanical Testing
The thermo-mechanical experiments were conducted using an MTS 810
servohydraulic test frame. The heating and cooling of the samples was achieved by
conduction through the grips which were heated by heating bands and cooled by liquid
nitrogen flowing through copper tubing wrapped around the grips with a heating-cooling
rate of 10°C/min. Temperature gradient on the sample was kept 2°C/min at maximum
during the heating-cooling experiments. An extensometer for high temperature
applications with a gauge length of 12.54mm was used to record the axial strains by
attaching its ceramic extension rods directly to the tension samples. The digital image of
the high temperature extensometer is shown in Figure 3.4. Small dog-bone shaped
tension samples with a gauge section of 1.5 mm x 3 mm x 8 mm wire electro-discharge
machined (wire EDM) from the billets. The thickness of the tension samples reduced

46
down to 1.0mm for the monotonic failure experiments for preventing the pins, which are
used to attach the tension samples to the MTS test machine, from failure before the
sample fails. The sample dimensions are presented in Figure 3.5. Before the
experiments, the samples were ground to remove the residue layers formed during EDM.
The temperature was measured using a thermocouple directly attached to the samples.
Figure 3.4 The MTS high temperature extensometer used to measure the axial strain.

47
9.00 mm
8.00 mm3.00 mm
R2.00mm
7.00 mm
7.00 mm
3.50 mm
DIA 1.56 2X DRILL THROUGH
Figure 3.5 A schematic showing the dimensions of the tension test samples.
Three types of experiments were conducted on hot rolled and ECAE processed
samples:
1) Tensile failure experiments at Ms+15°C in austenite (to assure
thermodynamically equivalent conditions in all samples) in order to determine the effect
of ECAE on the flow strength and ductility.
2) Isobaric cooling-heating experiments under increasing stress levels from 50
MPa to 400 MPa with a 50MPa increments to determine the shape memory
characteristics such as transformation temperatures, transformation and irrecoverable
strain levels as a function of stress and find out the threshold stress level for the onset of
irrecoverable strain.

48
3) Isobaric thermal cyclic experiments up to 10 cycles under 50MPa and 150MPa
to evaluate the cyclic stability of the unprocessed and ECAEd samples. 150MPa was
chosen for the isobaric thermal cyclic experiments due to the fact that 150MPa is the
threshold stress level for the onset of irrecoverable strain.
4) Loading-unloading experiments at constant temperatures to verify and extend
the stress-temperature relationships for stress-induced martensitic transformation,
martensite reorientation and plastic yield of martensite.

49
CHAPTER IV
THERMO-MECHANICAL, MONOTONIC AND CYCLIC
RESPONSE OF AN ULTRAFINE-GRAINED NiTi SHAPE
MEMORY ALLOY
4.1 Preamble
As mentioned in the motivation part of the Chapter I, many practical applications
of NiTi alloys require large number of cycles, a stable and reliable shape memory effect.
Understanding the thermal and mechanical cyclic behavior that involves irreversible
changes is important for the design and utility of NiTi SMAs. However, there are
problems frequently reported in the literature associated with cyclic stability of shape
memory effect in NiTi alloys [4-6]. For instance, martensite start temperature (Ms) and
the irrecoverable (plastic) strain level increase with the number of cycles [6-8]. The
cyclic instability in NiTi alloys was attributed to the accommodation of the austenite to
martensite phase transformation with dislocation formation in addition to transformation
twinning which leads, upon thermo-mechanical cycling, to plastic strain, martensite
stabilization and variation in transformation temperature, thermal and stress hysteresis.
A possible solution to the cyclic instability problem is to increase the critical
shear stress (CSS) for slip and thus to minimize the dislocation formation upon phase
transformation [11]. Major thermo-mechanical treatments in the literature which
improve the cyclic stability of NiTi alloys are reported are cold rolling, cold rolling and
annealing, thermo-mechanical cycling (training) and severe plastic deformation via HPT
and ECAE. The reports on HPT and ECAE usually demonstrate the microstructural
evolution and the enhancement of the mechanical properties of NiTi alloys [28]. There is
a lack of information on the cyclic behavior of severe plastically deformed ECAE
processed NiTi alloys.
In this chapter, the effect of ECAE on microstructural refinement and dislocation

50
substructure and the corresponding thermo-mechanical, monotonic and thermal cyclic
response of the equiatomic NiTi alloy will be investigated. The particular shape memory
characteristics such as transformation temperatures, thermal hysteresis, transformation
and irrecoverable strains from thermal cyclic experiments will be revealed.
Thermodynamic energy contributions to the phase transformations such as stored elastic
and irreversible energy will be investigated in consideration with the evolution of
microstructure and twin mode. This study constitutes the first systematic work in
understanding and building a bridge between the thermodynamics and mechanics of
martensitic phase transformation in the ultrafine grained NiTi alloys.
The study on Ni49.7Ti50.3 was started by ECAE processing of the alloy. The
ECAE processing of the alloys is summarized briefly to refresh the detailed information
given in Chapter III as following: hot rolled Ni49.7Ti50.3 alloy was ECAE processed at
450°C for four passes using Route E, 425°C for four passes using Route Bc and 400°C
for four passes using Route Bc.
4.2 Differential Scanning Calorimetry (DSC) Experiments
Figure 4.1 shows the DSC response of the hot rolled and ECAE processed
Ni49.7Ti50.3 alloy samples during five thermal cycles. and in Figure 4.1.c
correspond to the peak temperatures in the DSC traces. and simply define the
temperatures at which approximately 50% transformation occurs and the thermal
hysteresis is defined as . There is a notable improvement in the cyclic stability
of the transformation temperatures after the ECAE processing as it can be seen in the
Figure.
*A *M
*A *M
** MA −
The transformation temperatures, As, Ms and Rs, the difference between the first
and fifth cycles of As and Ms ( , ) temperatures and the thermal
hysteresis in the first cycles for all samples are summarized in Table 4.1. A decrease in
transformation temperatures and an increase in thermal hysteresis ( ) after 4
pass ECAE process are observed. The decrease in Ms temperature of the sample ECAE
1sts
5ths AA − 1st
s5ths MM −
1sts
5ths AA −

51
processed at 300°C for 1 pass is not as pronounced as in that of ECAE processed
samples for 4 passes. There is no change in the thermal hysteresis of the sample ECAE
processed at 300°C as compared to the thermal hysteresis of the hot rolled sample. In the
hot rolled sample, the As temperature is 88.1°C and decreases down to 84.5°C after 5
cycles, and Ms drifts from the initial value of 79.3°C down to 69.9°C, resulting in the
temperature shifts about 9.4°C after only 5 cycles. In the sample ECAE processed at
400°C, there is no shift in the Ms temperature after 5 cycles. The shift of Ms temperature
of the sample ECAE processed at 300°C is 2.1°C after 5 cycles.
In equiatomic NiTi alloy the martensitic transformation can occur either directly
from B2 to B19’ or through the intermediate R phase, B2 →R → B19’, depending on
the thermo-mechanical treatment [38]. *R in Figure 4.1 represents the peak temperature
of the austenite to R-phase transformation. The intermediate R phase is observed in all
four pass extruded samples which is common for deformed NiTi alloys since
dislocations introduced during severe plastic deformation process create energy barrier
for martensite formation, making the R-phase formation a lower energy alternative [46].
Austenite to R-phase transformation was not observed in the sample ECAE processed at
300°C which can be attributed to the lower dislocation density than that of in ECAE
processed samples for four times.
The main observations from the DSC results can be summarized as: 1) The
transformation temperatures decrease after ECAE process, however, the effect of ECAE
is less pronounced in the sample ECAE processed at 300°C for 1 pass, 2) The thermal
hysteresis increases after ECAE, however, there is no increase in thermal hysteresis of
the sample ECAE processed sample at 300°C for 1 pass as compared to the thermal
hysteresis of the hot rolled sample, 3) Austenite to R-phase transformation is observed in
ECAE processed samples for four passes, 4) There is a considerable improvement in the
stability of the transformation temperatures after ECAE.

52
Nor
mal
ized
Hea
t Flo
w (W
/g)
16012080400Temperature (ºC)
1st cycle1st cycle
5th cycle
5th cycle
0.5 W/gHot-Rolled
Heating
Cooling
(a)
Nor
mal
ized
Hea
t Flo
w (W
/g)
16012080400Temperature (ºC)
ECAE 4E at 450ºC
5th cycle
1st cycle
5th cycle
1st cycle
0.5 W/gHeating
Cooling
(b)
Figure 4.1 Cyclic DSC response of the hot rolled and ECAE processed Ni49.7Ti50.3 alloy
samples demonstrating the improvement in the cyclic stability of the transformation
temperatures upon ECAE processing (a) Hot rolled, (b) ECAE 4E at 450°C, (c) ECAE
4Bc at 425°C, (d) ECAE 4Bc at 400°C, (e) ECAE 1A at 300°C samples.

53
Nor
mal
ized
Hea
t Flo
w (W
/g)
16012080400Temperature (ºC)
ECAE 4Bc at 425ºC0.5 W/g
5th cycle
1st cycle1st cycle
5th cycle
A*
M*R*
(c)
Nor
mal
ized
Hea
t Flo
w (W
/g)
16012080400Temperature (ºC)
ECAE 4Bc at 400ºC
5th cycle
5th cycle
1st cycle
1st cycle
0.5 W/g
(d)
Figure 4.1 Continued

54
Nor
mal
ized
Hea
t Flo
w (W
/g)
16012080400
Temperature (ºC)
ECAE 1A at 300ºC
0.5 W/g
1st cycle
1st cycle
5th cycle
5th cycle
(e)
Figure 4.1 Continued
Table 4.1 Martensitic transformation temperatures and thermal hysteresis of hot rolled
and ECAE processed Ni49.7Ti50.3 alloy at the first and fifth thermal cycles from DSC.
Material A1sts(°C)
M1sts(°C)
R1sts(°C)
A5ths(°C)
M5ths(°C)
R5ths(°C)
A1stsA5ths −(°C)
M1stsM5ths −(°C)
M*1stA*1st−(°C)
As Received 88.1 79.3 - 84.5 69.9 - 3.6 9.4 36.5
ECAE 4E at
450°C 81 52.1 64 80 49.7 63.4 1 2.4 45.5
ECAE 4Bc
at 425°C 78 44.6 61 77 43.9 61 1 0.7 45
ECAE 4Bc
at 400°C 73.7 38.6 62 73 38.6 62 0.7 0 52
ECAE 1A at
300°C 74.5 66.1 - 75.7 64 - 1.2 2.1 36

55
4.3 Microstructural Evolution
Before presenting the thermo-mechanical response of the hot rolled and ECAE
processed Ni49.7Ti50.3 alloy, it is imperative to understand the microstructural changes
induced by ECAE. Figure 4.2 shows the optical microscopy image of the hot-rolled
Ni49.7Ti50.3 alloy demonstrating the average grain size of about 40μm. Figure 4.3 shows
the bright field TEM images of the ECAEd samples taken above the Af temperature,
approximately at 175°C, illustrating the grain size reduction as a function of the ECAE
temperature. Note that the magnifications of these images are different. It is clear in the
figure that the lower the ECAE temperature is, the refiner the resulting grain size gets.
The average grain size of the sample extruded at 400°C is about 0.1μm (Figure 4.3.a)
while that for the sample extruded at 450°C is around 0.2~0.3μm (Figure 4.3.c).
However, the grain size distribution is relatively wide especially in the samples extruded
at higher temperatures. As shown in Figure 4.3, the grain size varies between 0.05 and
0.3μm.
Figure 4.2 Optical micrograph of the hot-rolled Ni49.7Ti50.3 alloy demonstrating the
initial grain size.

56
Selected area diffraction (SAD) patterns were also recorded to analyze the
existing phases at different grain sizes. Figure 4.4 shows TEM bright field image taken
at room temperature from ECAE processed sample at 400°C and the corresponding SAD
patterns from the indicated areas which demonstrate the simultaneous presence of R and
B19’ martensite phases in one apparent grain. In Figure 4.4.b, weak superlattice
reflections are the indications for the R-phase. It was recently reported that when the
grain size of Ni-50.3at%Ti alloy is in between 0.06 to 0.15μm, the grains mainly contain
R-phase and B19’ martensite [25] confirming our observations. However, the
aforementioned study was conducted on very small HPT processed and heat treated
samples. HPT processed amorphous samples were annealed at different heat treatment
temperatures to achieve various grain sizes via recrystallization, but mainly in an
amorphous matrix.
0.3μm 0.4μm 0.5μm
(a) (b) (c)
Figure 4.3 Bright field TEM images taken above Af at 175°C showing the grain size
reduction due to ECAE processing. Four ECAE passes following (a) route Bc at 400°C
b) route Bc at 425°C and (c) route E at 450°C.
Figures 4.5.a and 4.5.c show TEM bright field images taken at room temperature
from the ECAE 4Bc sample processed at 425°C and Figures 4.5.b, 4.5.d and 4.5.e are the
corresponding SAD patterns from the circled areas in Figures 4.5.a and 4.5.c. Figure

57
4.5.b depicts the formation of >< 011 Type II twins and the size of these twins is
measured as approximately 30nm. Figures 4.5.d and 4.5.e demonstrate two different
twin modes which are m(001) compound twin and }1{11−
Type I twin, respectively.
Type II twins are quite common in solutionized and cold worked plus annealed NiTi
alloys. Nishida et al. [123] showed that compound twinning mode is the most
frequently observed one among the
m(001)
}1{11−
and >< 011 twinning modes in grains
smaller than 4μm. The rationale behind the observation of these twins will be discussed
in detail in section 4.8.1.

58
0.1μm
R-phase
Martensite
001
000
010
(a)
(b) (c)
Figure 4.4 (a) Bright field (BF) TEM images taken at room temperature showing the
grains containing R-phase and martensite in the ECAE 4Bc sample processed at 400°C
SAD patterns of the circled areas in BF showing (b) the R-phase and (c) B19’
martensite.
M[100]

59
(a) 0.1μm0.1μm
111MT
020t
020M111MT
020t
020M
(b)
0.1μm
001M
001t
111M,T-
110M
110t
001M
0.1μm
001M
001t
111M,T-111M,T-
110M
110t
001M
110M
110t
001M
(d)
(e) (c)
Figure 4.5 Bright field TEM images taken at room temperature from ECAE 4Bc sample
processed at 425°C showing (a), (c) twins in martensite, (b) SAD pattern taken from the
circled area in (a) showing the ><011 Type II twin, and (d), (e) SAD patterns taken
from the circled areas in (b) showing the compound twinning and Type I
twinning, respectively.
)001( }111{−

60
Figure 4.6.a shows TEM bright field image taken at 200°C from the ECAE 1A
sample processed at 300°C and Figure 4.6.b demonstrates corresponding SAD pattern
from the circled area in Figure 4.6.a. Figure 4.6.b depicts the formation of )131(−
deformation twins which is a common deformation twinning mode in the high
temperature phase of NiTi alloys having thicknesses around 0.02μm. The grain
boundaries are not well delineated since the microstructure in Figure 4.6.a demonstrates
high dislocation density with high volume fraction of refined twins.
(b)
110t-
110M- -
011t-
110M
-
020M
-
(b)
131
-
Figure 4.6 Bright field TEM images taken at 200°C from ECAE 1A sample processed at
300°C showing (a) twins in austenite and the relatively heavy dislocation density (b)
SAD pattern taken from the circled area in (a) showing the )131(−
deformation twin.
0.2μm
110t-
110M- -
011t-
110M
-
020M
-110t-110t-
110M- -110M- -
011t-
011t-
110M
-110M
-
020M
-020M
-
131-131-
(a) 0.2μm
(b)

61
Figure 4.7 represents the TEM bright field image of a unique microstructure of
B19’ martensite which is observed in the sample ECAE 4Bc processed at 425°C. The
full lines represent the twinned lamellae and the dashed lines represent the junction
planes between the twin variants. This unique microstructure is called as “herring bone”
morphology [26]. Waitz et al. [26] showed that the compound twins observed in
nanograins represent a unique “herring bone’ morphology of the martensite which are
not observed in coarse grained NiTi alloys. The junction planes represented as dashed
lines in Figure 4.7 can be either straight or curved. These junction planes are the
coherent twin boundaries which are formed to reduce the lattice misfit, thus, the lattice
strain at the twin boundary decreases with the formation of these coherent twin
boundaries.
m(001)
0.06μm Figure 4.7 Bright field TEM image taken at room temperature from the ECAE 4Bc
sample processed at 425°C showing “herring bone” type twins having an
average size of 3nm.
m(001)

62
4.4 Monotonic Mechanical Response under Tension
To analyze the effect of severe plastic deformation on the and levels,
tension tests were conducted to failure on hot rolled and ECAE processed at
temperatures 15°C above the Ms of each sample under 50MPa. Ms under 50MPa was
chosen as the test temperature to be at the same thermodynamical conditions in all cases.
The stresses shown as and σ in Figure 4.8 correspond to critical stress level to
induce martensite and the yield stress of stress induced martensite, respectively. Figure
4.8 shows the schematic of a stress-strain curve which is composed of five stages of
different types of deformation in a typical SMA at temperatures below Md. Md is the
maximum temperature at which stress induced martensitic transformation is possible.
These deformation stages can be summarized as: Stage 1: Elastic deformation of
austenite or martensite depending on testing temperature; Stage 2: Stress-induced
martensite formation or martensite reorientation and detwinning of martensite again
depending on testing temperature; Stage 3: Elastic deformation of stress-induced
martensite; Stage 4: Plastic deformation of stress-induced martensite; Stage 5: Fracture
of martensite after necking. Stress dependence of deformation stages was explained
detail in Chapter II.
SIMσ σMy
SIMσ My
Figure 4.9 illustrates the results of monotonic response of the hot rolled and
ECAE processed samples under tension. The stresses, and , and the stress
differential between them (Δσ) obtained from these experiments are summarized in
Table 4.2. and stresses are found using the intersecting slopes technique and
0.2% offset value respectively as shown in Figure 4.8.
SIMσ σMy
SIMσ σMy
The yield stress levels of stress induced martensite notably increase with the
decrease in ECAE temperature for the same number of passes of ECAE process. The
critical stress levels for stress induced martensitic transformation of the samples ECAE
processed for four passes were determined to be decreasing. It can be noticed that the
stress differential increases in all ECAE processed samples, however, the increase in

63
stress differential of ECAE 1A at 300°C case is less pronounced as compared to that of
the ECAE processed for four passes because increases after ECAE process at
300°C for one pass.
SIMσ
Stre
ss (M
Pa)
Strain (%)
Stag
e 1
Stag
e 2
Stag
e 3 St
age
4
Stag
e 5
Stre
ss (M
Pa)
Strain (%)
Stag
e 1
Stag
e 2
Stag
e 3 St
age
4
Stag
e 5
SIMσ
0.2% offset
σΔ
Myσ
Figure 4.8 Schematic of a different deformation stage in a typical SMA at temperatures
below Md. and show the critical stress level to induce martensite and the yield
stress of stress induced martensite, respectively.
SIMσ σMy

64
1400
1200
1000
800
600
400
200
0
Stre
ss (M
Pa)
4035302520151050
Strain (%)
Hot Rolled ECAE 4E at 450ºC ECAE 4Bc at 425ºC ECAE 4Bc at 400ºC ECAE 1A at 300ºC
Figure 4.9 Monotonic mechanical response of the hot rolled and ECAE processed
Ni49.7Ti50.3 samples under tension at to be thermodynamically same
condition.
C15M 50MPaσs °+=
Table 4.2 and stresses and the stress differential determined from monotonic
mechanical response experiment under tension of hot rolled and ECAE processed
Ni49.7Ti50.3 samples.
SIMσ σMy
SIMσ (MPa)
σMy
(MPa) σΔ ( ) SIM
My σσ −
(MPa) Hot Rolled 300 520 220
ECAE 4E at 450°C 220 790 570
ECAE 4Bc at 425°C 150 840 690
ECAE 4Bc at 400°C 120 1020 900
ECAE 1A at 300°C 395 950 555

65
4.5 Isobaric Thermal Cyclic Experiments
Isobaric thermal cyclic experiments were performed, incrementally increasing
the applied stress at each thermal cycle, using the same specimen throughout the test.
From these experiments, transformation strain and irrecoverable strain levels are
determined at each stress level. Transformation strain is determined from the middle of
the temperature range between the extrapolated thermal expansion lines of parent and
martensite phases and irrecoverable strain is the strain difference between the heating
curve and the cooling curve at Af+30°C as shown in Figure 4.10. Thermal Hysteresis
and the transformation temperature intervals (i.e. Ms-Mf) of the hot rolled and ECAE
processed samples are compared. Ms and Mf temperatures are determined from the
intersection points of the extrapolated thermal conduction of martensite and the
martensitic transformation curves and thermal expansion of austenite and the martensitic
transformation curves, respectively. Thermal hysteresis is the temperatue range at the
middle of the points between the martensitic transformation and back (austenite)
transformation curves as shown in Figure 4.10.

66
Stra
in (%
)
20016012080400-40
Temperature (ºC)
Irrecoverable Strain
Tran
sfor
mat
ion
Stra
in
Thermal Hysteresis
Ms
Mf
Figure 4.10 Schematic illustration of transformation and irrecoverable strain, Ms and Mf
temperatures and thermal hysteresis.
Figure 4.11 shows the strain vs. temperature response of the hot rolled and ECAE
processed samples during isobaric heating-cooling experiments. These experiments were
conducted under increasing stress levels from 50 MPa to 400 MPa with 50MPa
increments to find out the threshold stress level for the onset of irrecoverable strain. Ms
temperatures of all samples increase as the applied stress increases which can be
attributed to the stabilization of martensite with the increase in stress level. In addition,
the transformation temperature interval (i.e. Mf-Ms) is low in the samples ECAE
processed for four passes. The samples ECAE processed at 300°C and hot rolled show
larger transformation temperature interval. One can observe that the thermal hystereses
of ECAE processed samples for four times are larger than that of ECAE processed
sample at 300°C for one pass.
Figure 4.12 represents the transformation and irrecoverable strain levels as a
function of applied stress level determined from these experiments. It is clear that there

67
is a significant increase in the irrecoverable strain levels of the hot rolled sample with
increasing stress. The ECAE processed samples, on the other hand, all show stable
response and the irrecoverable strain levels are negligible up to 100MPa. One can
observe a detectable irrecoverable strain only above 200MPa for the samples extruded at
400°C and 300°C. As the extrusion temperature decreases, the irrecoverable strain level
also decreases for the four pass ECAE samples. The transformation strain levels of
samples ECAE processed at 450°C, 425°C and 400°C increase with increasing stress up
to 150MPa and then stabilize above 200MPa and are lower than the transformation strain
level of the hot rolled sample. The transformation strain level of the sample ECAE
processed at 300°C continues to increase with increasing stress up to 400MPa.
Transformation strain levels of the ECAE processed for four passes samples increase up
to maximum values of 4.5% at 200MPa and stabilize at higher stress levels, on the other
hand the transformation strain level of the hot rolled sample never stabilizes and
increases up to 10%. The red markers in Figure 4.12 represent the values determined
from comparison experiments to confirm the repeatability of the results. It was observed
that the transformation and irrecoverable strain values determined from different
experiments are almost the same, except the transformation strain levels of the hot rolled
sample from seperate experiments differ slightly. The reason of this difference might be
due to sample inhomogeneity. Since there are large strains imparted on the ECAEd
samples and the deformation is homogeneous, the similar transformation behavior is
expected.
The main observations from Figures 4.11 and 4.12 can be summarized as: 1) the
transformation interval (i.e. Mf-Ms) of the samples ECAE processed for four passes is
lower than that of the sample ECAE processed at 300°C for one pass, 2) thermal
hysteresis of the samples ECAE processed samples for four passes at each stress level is
larger than that of the sample ECAE processed at 300°C for one pass, 3) irrecoverable
strain levels of the ECAE processed samples are lower than that of the hot rolled sample,
4) the irrecoverable strain levels of the sample ECAE processed at 300°C for one pass at
higher stress levels are lower than that of the sample ECAE processed at 400°C for four

68
passes, 5) the transformation strain levels of the ECAE processed samples are lower than
that of the hot rolled sample, and they are more stable above 200MPa.
Stra
in (%
)
20016012080400-40
Temperature (ºC)
5%
50 MPa
100 MPa
150 MPa
200 MPa
300 MPa
400 MPa Hot Rolled
(a)
Stra
in (%
)
20016012080400-40
Temperature (ºC)
50 MPa
100 MPa
150 MPa
200 MPa
300 MPa
400 MPa5% ECAE 4E at 450ºC
(b)
Figure 4.11 Strain vs. temperature response of the Ni49.3Ti50.7 alloy under various
constant stress levels during isobaric cooling-heating experiments: (a) Hot rolled, (b)
ECAE 4E at 450°C, (c) ECAE 4Bc at 425°C, (d) ECAE 4Bc at 400°C, (e) ECAE 1A at
300°C samples.

69
Stra
in (%
)
20016012080400-40
Temperature (ºC)
50 MPa
100 MPa
150 MPa
200 MPa
300 MPa
400 MPa ECAE 4Bc at 425ºC5%
(c)
Stra
in (%
)
20016012080400-40
Temperature (ºC)
50 MPa
100 MPa
150 MPa
200 MPa
300 MPa
400 MPa ECAE 4Bc at 400ºC5%
(d)
Figure 4.11 Continued

70
Stra
in (%
)
20016012080400-40
Temperature (ºC)
5% ECAE 1A at 300ºC
50MPa
100MPa
150MPa
200MPa
250MPa
300MPa
350MPa
400MPa
(e)
Figure 4.11 Continued
14
12
10
8
6
4
2
0
Stra
in (%
)
400350300250200150100500
Stress (MPa)
Irrecoverable Strain Hot Rolled ECAE 4E at 450ºC ECAE 4Bcat 425ºC ECAE 4Bcat 400ºC ECAE 1A at 300ºC
Transformation Strain Hot Rolled ECAE 4E at 450ºC ECAE 4Bcat 425ºC ECAE 4Bcat 400ºC ECAE 1A at 300ºC
Figure 4.12 Transformation and irrecoverable strain response as a function of constant
tensile stress levels in the Ni49.7Ti50.3 samples from the isobaric cooling-heating
experiments under increasing applied stress levels of Figure 4.5.2.

71
4.6 Critical Stress vs. Critical Temperature Response for Inelastic Deformation
Thermoelastic martensitic transformation is a combination of mechanical and
thermal transformation processes. Thermodynamical conditions have been established to
express the effect of stress and temperature as the external driving forces on the
martensitic phase transformation [129]. The relationship between stress and temperature
to induce martensitic transformation has been expressed using Clausius-Clapeyron
equation [124]:
troεTΔH
dTdσ −= (4.6.1)
ΔH is the enthalpy change of the transforming body, T0 is the chemical equilibrium
temperature of the transformation, and εtr is the transformation strain of the
transformation in the direction of the stress. Basically, the Clausius-Clapeyron equation
defines a linear relationship between stress and temperature required to induce
martensitic transformation.
To determine the complete stress-temperature relationship for hot rolled sample
and the samples ECAE processed at 400°C and 425°C for four passes at three different
deformation modes which were defined in Chapter II and redefined in Figure 4.13.a,
three types of tests were conducted which are:
1) Isothermal loading-unloading experiments in martensite phase to find the
critical stress for martensite reorientation. Critical stress for martensite reorientation was
measured at 0.2% offset strain using the apparent elastic modulus of martensite on the
stress vs. strain curves.
2) Isobaric thermal cyclic experiments to find the critical temperature for the
onset of martensitic transformation.
3) Isothermal loading-unloading experiments in austenite phase to find
plastic yield point of austenite. The critical stress for plastic deformation of austenite
was measured at 0.2% offset strain from the apparent elastic modulus of austenite on the
stress vs. strain curves.
Figure 4.13.a shows three separate regions of stress vs. temperature relationships

72
which are for martensite reorientation, stress induced martensitic transformation and
plastic yielding of austenite for the hot rolled sample and the samples ECAE processed
at 400°C and 425°C. Then, stress vs. temperature curves in Figure 4.13.b are constructed
for martensitic reorientation and stress induced martensitic transformation and the slopes
of these curves are determined for three samples. In each region, the stress vs
temperature relationship is clearly different. Martensitic reorientation and plastic
deformation of austenite show an expected temperature dependence with a negative
slope, however, the critical stress for stress induced-martensitic transformation is highly
dependant on temperature according the Clausius-Clapeyron equation with a positive
slope. σy for austenite, i.e. Region II and Region III intercept at stress levels of 550MPa,
750MPa and 850MPa for the hot rolled sample, ECAE processed samples at 425°C and
400°C, respectively. To better observe Region II behavior and the intersection with
Region I a magnified version of Figure 4.13.a is represented in Figure 4.13.b. Region I
and Region II intercept at stress levels of 110MPa, 100MPa and 80MPa for the hot
rolled sample, ECAE processed samples at 425°C and 400°C, respectively. The critical
stresses for the stress induced martensitic transformations of samples ECAE processed at
400°C and 425°C and hot rolled samples showed a linear dependence on testing
temperature with the dσ/dT values of, 9.4MPa/°C, 8.1MPa/°C and 7.5MPa/°C,
respectively.
Comparing the stress vs. temperature relationship at low stress level, there is an
obvious difference between ECAE processed and hot rolled sample responses in Figure
4.13.a. Extrapolating the Region II response of the hot rolled sample in Figure 4.13.b
gives the temperature of 56°C at zero stress which is 16°C below the Ms temperature
detected using DSC ( ). Similarly, the Ms temperatures under 50 and 100MPa
determined from isobaric cooling/heating experiments are found to be the same as the
, i.e. 72°C. On the other hand, extrapolating Region II response of the ECAE
processed samples results approximately 4-5°C higher Ms temperatures than that of the
Ms temperatures of ECAE processed samples measured using DSC as shown in Figure
4.13.b. The implications of this response and possible rationale for such differences will
M 0σs=
M 0σs=

73
be discussed in section 4.8 in detail considering the role of R-phase, the effect of grain
size and martensite twin type and morphology.
1000
900
800
700
600
500
400
300
200
100
0
Stre
ss (M
Pa)
300250200150100500
Temperature (ºC)
Hot Rolled ECAE 4Bc at 425ºC ECAE 4Bc at 400ºC
Region I Martensite Reorientation
Region II Stress Induced MT
Region III Plastic Deformation of Austenite
(a)
600
500
400
300
200
100
0
Stre
ss (M
Pa)
14012010080604020
Temperature (ºC)
7.5MPa/ºC8.1MPa/ºC9.4MPa/ºC
Hot Rolled ECAE 4Bc 425ºC ECAE 4Bc 400ºC
(b)
Figure 4.13 Effect of temperature on the critical stress for martensitic reorientation,
stress-induced martensitic transformation and plastic yielding of austenite of ECAE
processed and hot rolled samples.

74
4.7 Thermal Cyclic Experiments under Constant Stress
As shown in section 4.5, none of the samples demonstrated irrecoverable strain at
and below 50MPa, however, the samples extruded at 400°C and 300°C show no
irrecoverable strain up to 150MPa. Thus 50MPa and 150MPa were chosen as two stress
levels for thermal cyclic experiments. The main purpose to conduct cyclic tests was to
evaluate the transformation and the irrecoverable strain levels as a function of the
number of cycles. Figures 4.14 and 4.15 represent the cyclic strain temperature response
of the ECAE processed and hot rolled samples under these stress levels, respectively, for
ten cycles.
Stra
in (%
)
20016012080400-40
Temperature (ºC)
Hot Rolled0.5%
(a)
Figure 4.14 Strain vs. temperature response of the Ni49.3Ti50.7 alloy under 50MPa. (a)
Hot rolled, (b) ECAE 4E at 450°C, (c) ECAE 4Bc at 425°C, (d) ECAE 4Bc at 400°C, (e)
ECAE 1A at 300°C samples.

75
Stra
in (%
)
20016012080400-40Temperature (ºC)
0.5% ECAE 4E at 450ºC
(b)
Stra
in (%
)
20016012080400-40
Temperature (ºC)
0.5% ECAE 4Bcat 425ºC
(c)
Figure 4.14 Continued

76
Stra
in (%
)
20016012080400-40
Temperature (ºC)
0.5% ECAE 4Bc at 400ºC
(d)
Stra
in (%
)
20016012080400-40
Temperature (ºC)
ECAE 1A at 300ºC0.5%
(e)
Figure 4.14 Continued
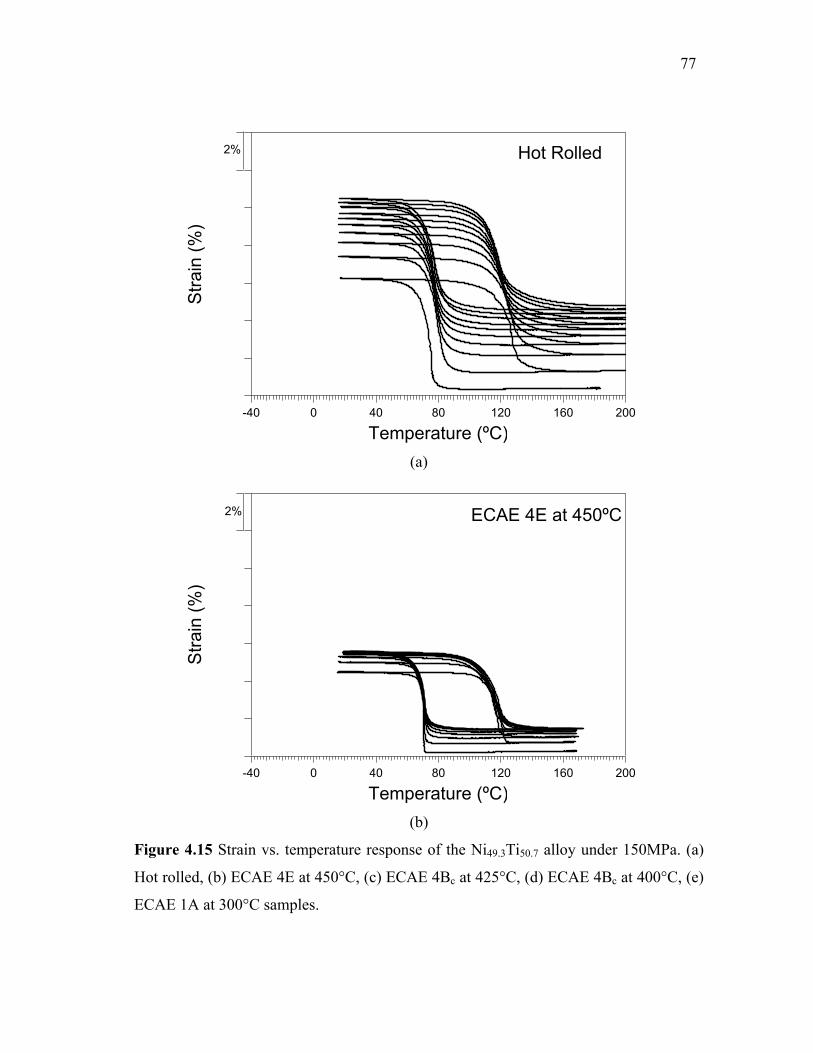
77
Stra
in (%
)
20016012080400-40
Temperature (ºC)
Hot Rolled2%
(a)
Stra
in (%
)
20016012080400-40
Temperature (ºC)
ECAE 4E at 450ºC2%
(b)
Figure 4.15 Strain vs. temperature response of the Ni49.3Ti50.7 alloy under 150MPa. (a)
Hot rolled, (b) ECAE 4E at 450°C, (c) ECAE 4Bc at 425°C, (d) ECAE 4Bc at 400°C, (e)
ECAE 1A at 300°C samples.

78
Stra
in (%
)
20016012080400-40
Temperature (ºC)
ECAE 4Bc at 425ºC2%
(c)
Stra
in (%
)
20016012080400-40
Temperature (ºC)
2% ECAE 4Bc at 400ºC
(d)
Figure 4.15 Continued

79
Stra
in (%
)
20016012080400-40
Temperature (ºC)
2% ECAE 1A at 300ºC
(e)
Figure 4.15 Continued
The main observation from Figure 4.14 and 4.15 is the considerable
improvement in the cyclic stability after ECAE process.
The evolution of transformation strain under 50MPa and 150MPa and
irrecoverable strain levels under 150MPa as a function of the number of cycles is given
in Figures 4.16 and 4.17, respectively. As expected from isobaric heating-cooling
experiments, none of the samples show irrecoverable strain under 50MPa. Under
150MPa, the samples which are ECAE processed at 400°C and 300°C show no
irrecoverable strain respectively and irrecoverable strain levels of the other ECAE
processed samples are much lower than that of the hot rolled sample. In all samples, the
irrecoverable strain decreases with the number of cycles and seems to saturate in the last
few cycles. In the samples ECAE processed at 425°C and 450°C, the irrecoverable strain
values decreases down to 0% after 5th and 8th cycles, respectively, however, certain level
of irrecoverable strain is measured in the hot rolled sample even at 10th cycle. Another
observation from the strain vs. temperature graphs is the improved cyclic stability of the

80
transformation strain levels with ECAE, which enhances further with decreasing ECAE
temperature. The transformation strain levels of the samples ECAE processed at 450°C,
425°C and 400°C under 50MPa are around 1.3% and ECAE processed at 300°C under
50MPa is 0.5%. There is almost no change in the transformation levels of ECAE
processed samples with the number of cycles, however the transformation strain level of
the hot rolled sample is initially 0.6% and continuously increases and becomes 3.4%
after 10 cycles. Under 150MPa, the transformation strain levels of ECAE processed
samples are lower than that of the hot rolled sample. These levels for the samples ECAE
processed at 450°C, 425°C, 400°C and 300°C are approximately 4%, 3.9%, 3.5% and
2.5% respectively at the 1st cycle and none of these samples show distinctive
transformation strain level change after 10 cycles. The transformation strain level of the
hot rolled sample is approximately 6% at the 1st cycle and decreases down to 5.8% after
10th cycle.
The main observations for the thermal cycling under constant stress levels are: 1)
the transformation and irrecoverable strain levels of ECAE processed samples are lower
than that of the hot rolled sample, 2) the transformation strain level decreases with the
decrease in ECAE temperature under 150MPa, 3) the transformation strain levels of
ECAE processed samples are stable with the number of cycles, 4) No irrecoverable
strain is evident in the sample ECAE processed at 400°C under 150MPa, and 5) the
irrecoverable strain levels of other ECAE processed samples seem to saturate at 0% after
few number of cycles.
Another intriguing observation from cyclic experiments under 50MPa and
150MPa is the decrease in thermal hysteresis of the ECAE processed samples with the
increase in applied stress as shown in Figure 4.18. Under 50MPa, the hysteresis of the
hot rolled sample vary between 35°C and 40°C, first slightly decreasing and then
increasing with the number of cycles. Under 150MPa, the hot rolled sample experiences
a decrease in ΔT with the number of cycles from 52°C to 42°C. On the other hand, under
50MPa, the hysteresis of the sample ECAE processed at 400°C is about 42°C and does
not change notably with the number of cycles, More surprisingly, under 150MPa,

81
thermal hysteresis is 39°C at the first cycle and drops down to 32°C after ten cycles of
cooling-heating. In other words, in the hot rolled sample, increasing stress level
increases thermal hysteresis while the opposite is observed in the ECAE processed
sample. Note that, thermal hysteresis is an indication of how much dislocation occurs in
the material during the forward and reverse phase transformation.
4
3
2
1
0
Tran
sfor
mat
ion
Stra
in (%
)
10987654321
Number of Cycles
Hot Rolled ECAE 4E at 450ºC ECAE 4Bc at 425ºC ECAE 4Bc at 400ºC ECAE 1A at 300ºC
(a)
Figure 4.16 Transformation strain evolution of the hot rolled and ECAE processed
Ni49.3Ti50.7 samples with the number of cycles under (a) 50MPa and (b) 150MPa.

82
9
8
7
6
5
4
3
2
Tran
sfor
mat
ion
Stra
in (%
)
10987654321
Number of Cycles
Hot Rolled ECAE 4E at 450ºC ECAE 4Bc at 425ºC ECAE 4Bc at 400ºC ECAE 1A at 300ºC
(b)
Figure 4.16 Continued
1.0
0.9
0.8
0.7
0.6
0.5
0.4
0.3
0.2
0.1
0.0
Irrec
over
able
Stra
in (%
)
10987654321
Number of Cycles
Hot Rolled ECAE 4E at 450ºC ECAE 4Bc at 425ºC ECAE 4Bc at 400ºC ECAE 1A at 300ºC
Figure 4.17 Irrecoverable strain evolution of the hot rolled and ECAE processed
Ni49.3Ti50.7 samples with the number of cycles under 150MPa.

83
70
65
60
55
50
45
40
35
30
Ther
mal
Hys
tere
sis
(ºC
)
10987654321
Number of Cycles
Hot Rolled-50MPa Hot Rolled-150MPa
ECAE 4Bc at 400ºC-50MPa ECAE 4Bc at 400ºC-150MPa
Figure 4.18 Thermal hysteresis comparison of the sample ECAE processed at 400°C
and the hot rolled sample under 50MPa and 150MPa.
4.8 Discussion of the Results
In this part of work, the main goal was to reveal the effect of severe plastic
deformation via ECAE and associated microstructural refinement on the thermo-
mechanical cyclic stability of Ni49.3Ti50.7. The main observations could be summarized
as:
1) The transformation temperatures decrease after ECAE process, however,
the effect of ECAE is less pronounced in the sample ECAE processed at 300°C for 1
pass.
2) The thermal hysteresis of the samples ECAE processed for four passes
are larger than that of hot rolled sample and the sample ECAE processed at 300°C for
one pass. The transformation temperature interval (Mf-Ms) is low in the samples ECAE
processed for four passes while the hot rolled sample and the sample ECAE processed
for one pass have higher transformation temperature interval.
3) The grain sizes of the samples ECAE processed for four passes at 450°C,
84
425°C and 400°C were determined to be on the order of 100 to 300nm. Microstructural
refinement in the sample ECAE processed at 300°C is achieved via deformation
twinning-induced refinement.
4) The twin mode in martensite was found to be a mixture of Type I and
Type II twins in addition to the compound twins in the samples ECAE processed
for four passes.
)001(
5) Austenite to R-phase transformation is observed in ECAE processed
samples for four passes.
6) ECAE led to an increase in the strength differential between the critical
stress to induce martensite and the yield stress of martensite. Such increase was thought
to be responsible for the significant improvement in the thermal cyclic stability and
reduction in the irrecoverable strain levels under constant stresses. The negligible
irrecoverable strain levels under very high stress levels observed in the samples ECAE
processed at 400°C and 300°C is attributed to the increase in critical stress level for
dislocation slip due to grain size and deformation twinning-induced refinement via
ECAE.
The rationale and mechanisms responsible for these main observations are
discussed below in detail.
4.8.1 Grain Size, Twin Formation and Microstructural Evolution during ECAE
Figure 4.3 shows both the grain size refinement and well-delineated grain
boundaries which can be attributed to the dynamic recovery and recrystallization during
ECAE at 400°C and above from the contrast changes across the grain boundaries, it can
be deduced that the volume fraction of high angle grain boundaries is relatively large.
The microstructural evolution in the sample ECAE processed at 300°C does not feature
delineated grain boundaries due to the high volume fraction of deformation twins. The
microstructural refinement in the samples ECAE processed at 400°C, 425°C and 450°C
is achieved through grain refinement. The mechanism of grain refinement is the
continuous dynamic recovery/recrystallization. Severe plastic deformation at slightly

85
high temperatures causes the development of new grains as a result of gradual increase
in the misorientations between the subgrains. Further deformation reduces the grain size
continuously and the volume fraction of newly generated ultrafine grains increases.
Figure 4.6 shows the deformation twins in the austenite. There is a high volume
fraction of deformation twins with a twin size of 20nm, thus, microstructural refinement
in the sample ECAE processed at 300°C is achieved via deformation twinning-induced
refinement. Deformation twinning in B2 nanograins instead of Type I and Type II
twinning modes was also observed in severely plastically deformed NiTi alloys due to
high strength and shear stress applied during room temperature deformation [125].
)131(−
TEM images and diffraction patterns in Figure 4.4 showed that grain size
refinement suppresses the formation of martensite due to the increase in energy barrier.
Grain boundaries act as obstacles such that martensite plate nucleated within the grain is
stopped at the boundary. To initiate the nucleation and growth of martensite in the next
grain the martensite plates in the neighboring grain should induce some stress which
could be a result of the mismatch between transformed and untransformed grains.
However, according to Waitz et al. [25] grains that have sizes less than 60nm, the
stresses are not enough to initiate martensite nucleation in the adjacent grain and the
dislocations in each grain suppress the martensite nucleation and growth.
The grain size of B2 austenite phase affects the twinning mode and the size of the
twin plates of B19’ martensite in Ni49.7Ti50.3 alloys. In the refined grains of the samples
ECAE processed for four passes, compound twins are found in addition to
common Type II and
)001(
>< 011 }111{−
Type I twins. compound twinning with fine
platelet is selected as a internal defect of the matensite to minimize the transformation
strain in nanograins, although compound does not give solution to
crystallographic theory [26, 123, 126]. The constraints of the grain boundaries facilitates
the self accommodation of the martensite with selection of compound twin
formation as an energy minimizing transformation path. The morphological difference
)001(
)001(
)001(

86
between compound, Type II and )001( >< 011 }111{−
Type I twinning is in the twin
plate width. The width of compound twin platelets which show “herring-bone
morphology is 2-3nm while the width of the twin platelets of Type I and Type II twins is
20-30nm.
)001(
4.8.2 Effect of ECAE and Grain Refinement on Martensitic Transformation
Temperatures
In a thermoelastic martensitic transformation, there is a thermodynamic
equilibrium between chemical and non-chemical energies which can be expressed as, for
the forward and reverse transformation, respectively:
irre ΔEΔESTΔΔHΔG ++−= (4.8.2.1)
ΔG, ΔH, ΔS, ΔEe and ΔEirr are the free energy, enthalpy, entropy, elastic free
energy and irreversible energy changes upon phase transformation, respectively. In order
to rationalize the isobaric cooling heating or cyclic under constant stress experiment
results, it is necessary to consider the thermodynamic factors which control the
martensitic transformations. The total free energy change in equation 4.8.2.1 is
comprised of three contributions: the change in chemical free energy which is
, the change in strain energy associated with the transformation induced
elastic stresses and irreversible energy
STΔΔH − eΔE
irrΔE needed to propagate the transforming
interface. The chemical energy is not expected to change because the structure and the
order of the parent and martensite phase remain unaltered. Therefore, the change in total
free energy can be associated with the change in elastic strain energy and the irreversible
energy. The change in elastic strain energy can be expressed as for a tensile loading
[126]:
mpeo
tmpe ΔE/ρσεΔE →→ +−= (4.8.2.2)
Here σ is the applied tensile stress and εt is the transformation strain. is
the summation of and and are transformation induced elastic
mpe0ΔE →
teΔE d
eΔE . teΔE d
eΔE

87
strain energy and elastic strain energy associated with the local stress field at defects.
p→m represents the parent to martensite transformation.
For a single stage martensitic transformation the transformation temperatures of
parent to martensite and the back transformations can be expressed as [126]:
S)/ΔΔEE(ΔTT mpirr
mpe0mp
→→→ ++= (4.8.2.3)
S)/ΔΔEE(ΔTT mpirr
mpe0pm
→→→ −+= (4.8.2.4)
Substituting equation 4.8.2.2 in 4.8.2.3 gives:
mpirr
t0mp
mpe0 EΔ/ρσεS)ΔT(TΔE →
→→ −+−= …….(4.8.2.5)
The irreversible energy which depends on the thermal hysteresis of the
transformation can be determined using equations 4.8.2.2, 4.8.2.3 and 4.8.2.4 as [126]:
)/2T(TSΔΔE pmmpmp
irr →→→ −= (4.8.2.6)
ΔS can be evaluated from the stress dependence of the transformation
temperature via Clausius-Clapeyron equation obtained by differentiating equations
4.8.2.3 or 4.8.2.4.
)ρ/ε/dT)/(σ(dSΔ t−= (4.8.2.7)
The changes in the elastic and the irreversible energies under zero stress and
150MPa are calculated for hot rolled Ni49.7Ti50.3 and the Ni49.7Ti50.3 samples ECAE
processed at 425°C and 400°C and tabulated in Table 4.3. The density of Ni49.7Ti50.3
which is represented as ρ in equation 4.8.2.7 is 6.5g/mm-3. T0 which is the equilibrium
temperature is calculated from the equation in 4.8.2.8 as 100°C for the hot rolled case
and should be unaltered after ECAE and applied stress because T0 is only composition
dependent.
2AMT fs
0+
= (4.8.2.8)
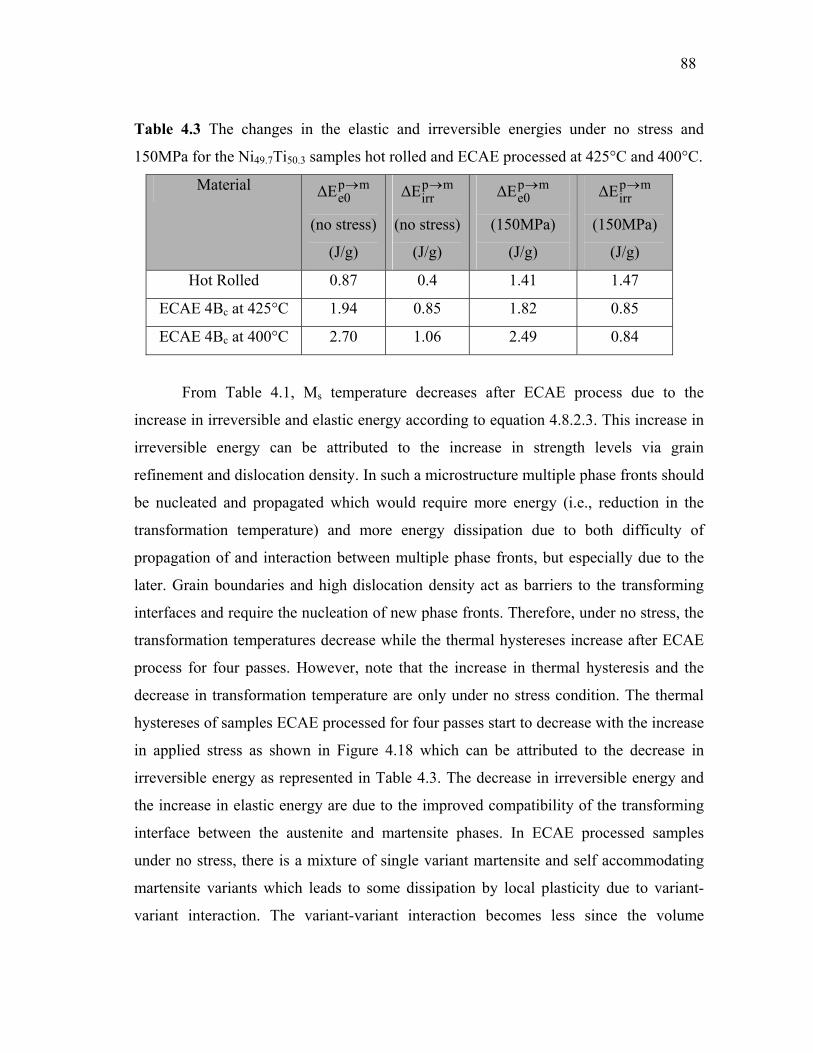
88
Table 4.3 The changes in the elastic and irreversible energies under no stress and
150MPa for the Ni49.7Ti50.3 samples hot rolled and ECAE processed at 425°C and 400°C.
Material mpe0ΔE →
(no stress)
(J/g)
mpirrΔE →
(no stress)
(J/g)
mpe0ΔE →
(150MPa)
(J/g)
mpirrΔE →
(150MPa)
(J/g)
Hot Rolled 0.87 0.4 1.41 1.47
ECAE 4Bc at 425°C 1.94 0.85 1.82 0.85
ECAE 4Bc at 400°C 2.70 1.06 2.49 0.84
From Table 4.1, Ms temperature decreases after ECAE process due to the
increase in irreversible and elastic energy according to equation 4.8.2.3. This increase in
irreversible energy can be attributed to the increase in strength levels via grain
refinement and dislocation density. In such a microstructure multiple phase fronts should
be nucleated and propagated which would require more energy (i.e., reduction in the
transformation temperature) and more energy dissipation due to both difficulty of
propagation of and interaction between multiple phase fronts, but especially due to the
later. Grain boundaries and high dislocation density act as barriers to the transforming
interfaces and require the nucleation of new phase fronts. Therefore, under no stress, the
transformation temperatures decrease while the thermal hystereses increase after ECAE
process for four passes. However, note that the increase in thermal hysteresis and the
decrease in transformation temperature are only under no stress condition. The thermal
hystereses of samples ECAE processed for four passes start to decrease with the increase
in applied stress as shown in Figure 4.18 which can be attributed to the decrease in
irreversible energy as represented in Table 4.3. The decrease in irreversible energy and
the increase in elastic energy are due to the improved compatibility of the transforming
interface between the austenite and martensite phases. In ECAE processed samples
under no stress, there is a mixture of single variant martensite and self accommodating
martensite variants which leads to some dissipation by local plasticity due to variant-
variant interaction. The variant-variant interaction becomes less since the volume

89
fraction of single variant martensite increases which leads to less dissipation thus smaller
thermal hysteresis [128]. In hot rolled sample, the increase in thermal hysteresis with the
increase in applied stress originates from the partial accommodation of martensitic
transformation with dislocations instead of twins. When the stress level increases
dislocation formation becomes easy and thermal hysteresis increases.
One important indication of the improvement in cyclic stability is to compare the
variation in thermal hystereses of ECAE processed and hot rolled samples under 50MPa
and 150MPa. It is clearly seen in Figures 4.14 and 4.15, thermal hysteresis of ECAE
processed samples during 10 cycles are very stable due to the less defect generation with
cycles in ECAE processed samples.
Another observation from the DSC experiments and isobaric cooling-heating
experiments is the decrease in transformation temperature interval (i.e. Ms-Mf) and
increase in the thermal hysteresis in the samples ECAE processed for four passes. The
transformation temperature interval elucidates the stored elastic energy during the phase
transformation. When the stored elastic energy is high the slope of the cooling curve in
isobaric cooling-heating experiment is shallow (i.e. Ms-Mf is high) whereas when the
stored elastic energy is low the slope of the cooling curve is steep (i.e. Ms-Mf is low).
Thus, the stored elastic energy during the phase transformation in the samples ECAE
processed for four times is low, while the samples ECAE processed for one pass shows
higher stored elastic energy during phase transformation. One of the reasons of
observing low stored elastic energy is the dissipation of stored elastic energy during
phase front motion. Increasing energy dissipation leads to higher thermal hysteresis.
Thus, if the stored elastic strain energy is higher, the heating necessary to initiate reverse
transformation is lower and thermal hysteresis will be lower as in the sample ECAE
processed for one pass at 300°C. Therefore, there is an inverse relationship between the
thermal hysteresis and the transformation temperature interval. The increase in
dissipation energy during phase front motion in samples ECAE processed for four passes
can be attributed to the grain refinement. Grain boundaries act as barriers to the
transforming interfaces which require more energy. On the other hand, formation of

90
refined microstructure due to very fine deformation twins in the sample ECAE processed
for one pass may help suppressing energy dissipation. Deformation twins in austenite or
compound twins in martensite are shown to transform into twin boundaries in martensite
or vice versa [20, 129]. Therefore, these twin boundaries in the sample ECAE processed
at 300°C do not affect the elastic energy storage and the energy required for the phase
transformation as much as a grain boundary or dislocation cell walls do.
4.8.3 Effect of ECAE on Monotonic Response under Tension
The increase in yield strength of martensite ( ) and the increase in the stress
differential between yield strength and critical stress to induce martensitic
transformation ( ) after ECAE process can be attributed to the microstructural
refinement (grain refinement and deformation induced twinning refinement) and
hardening due to high dislocation density. , , and
yσ
SIMy σσ −
yσ SIMσ SIMy σσ − levels of all
samples determined from Figure 4.9 are tabulated in Table 4.4.1.
There is a decrease in the critical stress to induce martensitic transformation in
the samples ECAE processed for four passes and an increase in that of the sample ECAE
processed at 300°C for one pass. The critical stress to induce martensitic transformation
levels measured from the isothermal monotonic experiments are in good agreement with
the critical stress levels found in Region II of stress vs. temperature curves in Figure
4.13.b.
There are few possible mechanisms responsible for the reduction in after
ECAE for four passes as compared to that of hot rolled sample. These include: 1) small
internal local stresses which may exist in the ECAE processed samples and help
externally applied stress in triggering martensitic transformation; 2) R-phase
transformation prior to martensitic transformation making martensitic transformation
relatively easier via reducing the direct incompatibility between martensite and austenite,
and the need for an accommodation mechanism which would increase the stress level
required to continue transformation; 3) more significant elastic modulus mismatch
SIMσ
91
between austenite and martensite near Ms due to lattice softening in austenite near Ms
leading to more severe incompatibility and thus, more dissipation, and higher stress
levels for the continuation of transformation in the hot rolled case; and 4) the change in
martensite twinning mode with the grain size in the ECAE processed samples and the
lower nucleation strain energy and interfacial energy needs of compound twins as
compared to Type I and Type II transformation twins. On the other hand, the sample,
ECAE processed for one pass at 300°C does not show a similar reduction in
because, firstly, of the absence of R-phase transformation prior to martensite. Secondly,
due probably to significant difference between 1A 300°C sample and other four pass
ECAE processed samples, the internal local stress may oppose the externally applied
tension. And finally, the martensite twin type might be different than compound
twins in the 1A 300°C sample, even though the microstructure of martensite in this
sample was not studied. Note that the aforementioned possibilities can also shed some
light onto the differences between the critical stress vs. critical temperature responses of
the ECAE processed samples and the hot rolled sample at low stress ranges as shown in
Figure 4.13.b and this will be elaborated on the following section.
)001(
SIMσ
)001(
4.8.4 Effect of ECAE on Cyclic Stability and Critical Stress vs. Critical
Temperature Behavior
In this section the variation in the transformation and irrecoverable strain levels
of ECAE processed and hot rolled samples in the isobaric cooling/heating experiments
and thermal cyclic experiments under 50MPa and 150MPa, and mechanisms responsible
for the improvement in the cyclic stability after ECAE will be introduced. Peculiarities
in the critical stress vs. critical temperature response of the ECAE processed and hot
rolled samples part of which can be expressed using Clausius-Clapeyron equation will
be scrutinized in detail.
The consequence of observing notably lower transformation strain levels in
ECAE processed samples than that of the hot rolled sample under 50MPa and 150MPa is
the increase in slope of the critical stress vs. critical temperature curves of ECAE

92
processed samples in Region II shown in Figure 4.13.b. According to Clausius-
Clapeyron equation introduced in section 4.6, transformation strain is inversely
proportional to the slope of the curve in Region II. There are few possible reasons for the
decrease in the transformation strain and increase in slope after ECAE.
First of all, it is observed that, in the very fine and nano grains, only R-phase
exists. R-phase to martensite transformation leads to observe less transformation strain
than that of B2 to martensite transformation. Secondly, due to very fine and nano grains,
and considering the large elastic mismatch across the grain boundaries of the nanograins,
it is likely to have regions near grain boundaries which are untransformed or with self
accommodated martensite morphology limiting the overall transformation strain.
In the isobaric thermal cyclic experiment, the transformation of the hot rolled
sample under 150MPa is 6.1% and the slope of the critical stress vs. critical temperature
in Region II is 7.5MPa/°C. Using the equation 4.6.1, 0T
ΔH is calculated as
45.75 . Assuming that ECAE has no effect on equilibrium temperature T0, the
transformation strain of the sample ECAE processed at 400°C can be calculated as 4.8%
by using the slope 9.4MPa/°C from Figure 4.13.b and
CJ/cm3°
0TΔH 45.75 . This
calculated transformation strain is higher than the measured strain (i.e. 3.5%) in both
isobaric cooling/heating experiment and thermal cyclic experiment under 150MPa. This
indicates that ΔH should be smaller. Thus, clearly, there should be some untransformed
regions in the ECAE processed samples.
CJ/cm3°
The last reason of observing lower transformation strains in ECAE processed
samples can be crystallographic texture in the ECAE processed samples substantially
different than that of the hot rolled sample. However, since the ECAE temperatures are
high, significant texture evolution would not be expected. In addition, the texture
formation after four passes of ECAE in several BCC and FCC materials is shown to be
not as strong as in the case of what is usually observed after conventional cold working
techniques. Therefore, it is believed that crystallographic texture cannot have a first

93
order effect in the transformation levels in the present cases. Note that texture
measurements are challenging due to the need to measure austenite texture and thus in-
situ heating requirement.
In Figure 4.13.b, extrapolating curve of the hot rolled sample gives the
temperature 56°C which is 16°C below the Ms temperature of the hot rolled sample
measured using DSC. Similarly, the Ms temperatures under 50MPa and 100MPa
determined from the isobaric cooling/heating experiments are found to be the same as
the . On the other hand, extrapolating curves of the ECAE processed
samples gives approximately the same Ms temperatures measured using DSC. This
peculiarity between the hot rolled and ECAE processed samples are in accordance with
the reduction of the levels in the ECAE processed samples as discussed in section
4.8.3, and the similar microstructural factors are thought to be responsible for this
observation. The increase in elastic mismatch between austenite and martensite near Ms
due to austenite softening and inelastic accommodation of this mismatch in the hot rolled
sample lead to the need for higher supercooling or higher stress levels for triggering
martensite nucleis to grow in the hot rolled case. This causes austenite to transform into
martensite at a lower temperature under a given stress or at a higher stress level under a
constant temperature. Similarly, a possible internal local stress, the presence of R-phase,
likelihood of more elastic accommodation due to grain size hardening, and transition in
the martensite twin type to a lower strain and interfacial energy compound twins make
the ECAE processed samples to phase transform earlier and follow the well-known
Clausius-Clapeyron equation down to very low stress levels.
SIMσ
0σsM =
SIMσ
SIMσ
In the isobaric thermal cyclic experiments the transformation strains of the ECAE
processed and hot rolled samples increase as the level of externally applied stress
increase as shown in Figure 4.12. In SMAs, the externally applied stress favors certain
variants over the others upon phase transformation [130]. This helps the formation of the
martensitic variant with the most favorable orientation (single variant martensite
morphology) instead of self accommodation morphology, and thus leads to external
shape change. Transformation strain levels depend on the material’s ability to form

94
single variant martensite morphology as opposed to self accommodating transformation
structure [13]. The transformation strain level observed in ECAE processed and hot
rolled samples is a function of externally applied stress. Note that, the transformation
strain level of the hot rolled sample increases continuously due to the fact plastic
deformation is induced at higher stress levels. The irrecoverable strain level of the hot
rolled sample increases as the externally applied stress increases whereas the increase in
the irrecoverable strain levels of ECAE processed samples is very low as shown in
Figure 4.12. This could be attributed to the increase in critical shear stress for slip in
ECAE processed sample due to microstructural refinement and increase in dislocation
density.
The irrecoverable strain levels of ECAE processed samples in thermal cyclic
experiments under 150MPa are considerably lower than that of hot rolled sample as
shown in Figure 4.17 due to the same reason mentioned above (increase in CSS for slip
after ECAE). Although the irrecoverable strain level of the hot rolled sample decreases
with the number of cycle and stabilizes after 7th cycle, the irrecoverable strain level is
still significant under 150MPa as shown in Figure 4.17. In four pass ECAE processed
samples the irrecoverable strain levels diminish to be zero after 4th, 5th and 8th cycles of
the samples ECAE processed at 400°C, 425°C and 450°C, respectively. Thermal cycling
under constant stress causes a training effect due probably to defect generation, such as
dislocations, at the phase front and/or the rearrangement of existing dislocations in both
the hot rolled and ECAE processed samples. Note that, no irrecoverable strain is
observed under 150MPa in the sample ECAE processed at 300°C.

95
CHAPTER V
SHAPE MEMORY BEHAVIOR OF THERMO-MECHANICALLY
PROCESSED TiNiPd HIGH TEMPERATURE SHAPE MEMORY
ALLOYS
5.1 Preamble
The transformation temperatures of NiTi alloys can be increased with the
addition of Pd, however, Cai et al. [37] reported that the shape memory behavior of
TiNiPd alloys is poor, especially at high temperatures due to the decrease in critical
shear stress for dislocation slip. The other problem in TiNiPd high temperature shape
memory alloys (HTSMAs) is the deterioration of fracture toughness due to the formation
of detrimental precipitates/inclusions. In this chapter, few methods of engineering
microstructure including the grain refinement and precipitate fragmentation using ECAE
are studied. The thermo-mechanical response of the materials processed via ECAE
including transformation strain, irrecoverable strain levels, transformation temperature,
thermal hysteresis, enhanced cyclic reversibility and fracture strength are presented and
the ramifications of the microstructural evolution on these properties are discussed.
ECAE processing schedules conducted on the Ti50Ni30Pd20 and Ti50.3Ni33.7Pd16
alloys are recalled for refreshing as: As-cast Ti50Ni30Pd20 is solutionized at 1000° for one
hour and ECAE processed at 600°C and 400°C for four passes using route C and at
500°C for two passes using route C. Ti50.3Ni33.7Pd16 alloy was received in hot-rolled
condition. Hot-rolled Ti50.3Ni33.7Pd16 alloy was ECAE processed at 450°C for four passes
using route Bc and at 400°C for two passes using route B.
5.2 Differential Scanning Calorimetry (DSC) Experiments
Figures 5.1 and 5.2 show the DSC response of the solutionized and ECAE
processed Ti50Ni30Pd20 samples and hot rolled and ECAE processed Ti50.3Ni33.7Pd16

96
samples, respectively, during five thermal cycles. The transformation temperatures of all
samples are highly stable during cycling. Comparing these figures with Figure 4.2
clearly demonstrates the impact of ternary Pd addition on cyclic stability of
transformation temperatures. In addition, it can be deduced from Figures 5.1 and 5.2 that
ECAE processing does not notably influence the cyclic stability of transformation
temperatures of the TiNiPd alloys under no load.
To compare cyclic stability of the transformation temperatures of all TiNiPd
samples, Ms temperatures are presented with respect to the number of cycle in Figure
5.3. As expected [30, 31], the transformation temperatures increase as the Pd content
increases and the transformation temperatures decrease after ECAE. One intriguing
finding is the effect of number of passes on the transformation temperatures of
Ti50.3Ni33.7Pd16 alloy. The decrease in transformation temperatures of Ti50.3Ni33.7Pd16
sample ECAE processed at 450°C and at 400°C is almost the same since the sample
ECAE processed at 450°C is processed for four passes.
The transformation thermal hysteresis ( ** MA − ) of all TiNiPd samples are
presented in Figure 5.4. The thermal hysteresis decreases as the Pd content increases in
the unprocessed samples. Note that, unprocessed sample means that ECAE processing is
not conducted on the sample. After ECAE the thermal hysteresis increases and as the
ECAE temperature decreases the increase in thermal hysteresis is higher.
The main observations from the transformation temperature measurements of
TiNiPd alloys can be summarized as: 1) transformation temperatures are very stable
before and after ECAE process, 2) transformation temperatures increase as the Pd
content increases, 3) they decrease further with ECAE process, 3) thermal hysteresis
decreases as the Pd content increases, 4) it increases as the ECAE temperature decreases,
5) the effect of number of ECAE passes is similar to the effect of ECAE temperature on
the transformation temperatures.

97
Nor
mal
ized
Hea
t Flo
w (W
/g)
24020016012080400
Temperature (ºC)
0.2W/g
Ti50Ni30Pd20Solutionized at 1000ºC for 1hr
1st cycle
1st cycle
5th cycle
5th cycle
(a)
Nor
mal
ized
Hea
t Flo
w (W
/g)
24020016012080400
Temperature (ºC)
0.2W/gTi50Ni30Pd20ECAE 4C at 600ºC
5th cycle
1st cycle
5th cycle
1st cycle
(b)
Figure 5.1 Cyclic DSC response of the solutionized and ECAE processed Ti50Ni30Pd20
demonstrating the effect of ECAE processing and ECAE temperatures on the
transformation temperatures, (a) solutionized, (b) ECAE 4C at 600°C, (c) ECAE 2C at
500°C, (d) ECAE 4C at 400°C.

98
Nor
mal
ized
Hea
t Flo
w (W
/g)
24020016012080400
Temperature (ºC)
1st cycle
5th cycle
5th cycle
1st cycle
Ti50Ni30Pd20ECAE 2C at 500ºC0.2 W/g
(c)
Nor
mal
ized
Hea
t Flo
w (W
/g)
24020016012080400
Temperature (ºC)
Ti50Ni30Pd20ECAE 4C at 400ºC
0.2 W/g
1st cycle
1st cycle
5th cycle
5th cycle
(d)
Figure 5.1 Continued

99
Nor
mal
ized
Hea
t Flo
w (W
/g)
24020016012080400
Temperature (ºC)
0.2 W/g
1st cycle
1st cycle
5th cycle
5th cycleTi50.3Ni33.7Pd16Hot Rolled
(a)
Nor
mal
ized
Hea
t Flo
w (W
/g)
24020016012080400
Temperature (ºC)
0.2 W/g
Ti50.3Ni33.7Pd16ECAE 4Bc at 450ºC
1st cycle
1st cycle
5th cycle
5th cycleHeating
Cooling
(b)
Figure 5.2 Cyclic DSC response of the hot-rolled and ECAE processed Ti50.3Ni33.7Pd16.
demonstrating the effect of ECAE processing and ECAE temperatures on the
transformation temperatures, (a) Hot-rolled, (b) ECAE 4Bc at 450°C, (c) ECAE 2B at
400°C.

100
Nor
mal
ized
Hea
t Flo
w (W
/g)
24020016012080400
Temperature (ºC)
Ti50.3Ni33.7Pd16ECAE 2B at 400ºC
1st cycle
5th cycle
1st cycle
5th cycle
0.2 W/g
(c)
Figure 5.2 Continued
160
155
150
145
140
135
130
125
120
115
110
105
100
Ms T
empe
ratu
re (º
C)
54321
Number of Thermal Cycles
Ti50Ni30Pd20 Solutionized ECAE 4C at 600ºC ECAE 2C at 500ºC ECAE 4C at 400ºC
(a)
Figure 5.3 Ms temperatures of all TiNiPd samples extracted from the DSC data showing
the effect of ECAE processing, ECAE temperature and Pd content (a) Ti50Ni30Pd20, (b)
Ti50.3Ni33.7Pd16.

101
110
105
100
95
90
85
80
75
70
Ms T
empe
ratu
re (º
C)
54321
Number of Thermal Cycles
Ti50.3Ni33.7Pd16 Hot Rolled ECAE 4Bc at 450ºC ECAE 2B at 400ºC
(b)
Figure 5.3 Continued
35
30
25
20
15
10
5
Hys
tere
sis
(ºC
)
54321
Number of Thermal Cycles
Solutionized ECAE 4C at 600ºC ECAE 2C at 500ºC ECAE 4C at 400ºC
Ti50Ni30Pd20
(a)
Figure 5.4 Hysteresis of all TiNiPd samples extracted from the DSC data showing the
effect of ECAE processing, ECAE temperature and Pd content (a) Ti50Ni30Pd20, (b)
Ti50.3Ni33.7Pd16.

102
35
30
25
20
15
10
5
Hys
tere
sis
(ºC
)
54321
Number of Thermal Cycles
Hot Rolled ECAE 4Bc at 450ºC ECAE 2B at 400ºC
Ti50.3Ni33.7Pd16
(b)
Figure 5.4 Continued
5.3 Microstructural Evolution
Figure 5.5 shows the optical microscopy image of the solutionized Ti50Ni30Pd20
alloy demonstrating the average grain size of about 50μm. Figure 5.6 shows the bright
field TEM images of the sample ECAE processed at 400°C taken at 200°C (above the Af
temperature) illustrating the grain size reduction after ECAE processing the sample at
400°C for four passes following route C. The grains are elongated as seen in Figure 5.6.
The length and width of the grains are 0.5-1μm and 0.2-0.4μm on the average,
respectively.

103
Figure 5.5 Optical micrograph of the solutionized Ti50Ni30Pd20 alloy demonstrating the
microstructure. Dotted lines are included to distinguish some of the grains and grain size.
Figure 5.6 Bright field TEM images taken above Af at 200°C showing the grain size
reduction in Ti50Ni30Pd20 due to ECAE processing for four passes following route C at
400°C.
0.5μm
0.5μm

104
Selected area diffraction (SAD) patterns were also recorded to analyze the
existing phases in the solutionized and ECAE processed Ti50Ni30Pd20 samples. Figure
5.7 shows TEM bright field image taken at room temperature from the solutionized
Ti50Ni30Pd20 sample and the corresponding selected area diffraction pattern (SAD) from
the indicated area which demonstrates B19 martensite phase and Type I twin.
Figure 5.8 shows the bright field TEM image taken at room temperature from
Ti50Ni30Pd20 sample which is ECAE processed at 400° and the corresponding diffraction
patterns recorded from the indicated areas in the bright field image. The SAD patterns in
Figure 5.8.b and 5.8.c demonstrate <011>Type II and [110] Type I twins, respectively.
Although the grain size of Ti50Ni30Pd20 after ECAE process decreases the size of the
martensite twins does not change. Figure 5.9 represents the bright field TEM image of
Ti50Ni30Pd20 sample ECAE processed at 400°C and confirms the dislocation density
increase after ECAE process.
]110[
000
110M
110T
101M,T
000
110M
110T
101M,T
0.2μm
[110]B19,T
Figure 5.7 Bright field TEM image from the solutionized Ti50Ni30Pd20 sample taken at
room temperature in martensite and the corresponding diffraction pattern showing the
martensite and [110] Type I twin.

105
0.5μm
a)
b) c)
c b
020t
020M111M,T 101M,T
110T110M
<011>B19,Type II [110]B19,Type I
Figure 5.8 Room temperature bright field TEM image of Ti50Ni30Pd20 sample ECAE
processed at 400°C and the corresponding diffraction pattern showing the martensite b)
<011> Type II and c) [110] Type I twins.

106
0.5µm
Figure 5.9 Room temperature bright field TEM image of Ti50Ni30Pd20 sample ECAE
processed at 400°C showing the high dislocation density.
5.4 Monotonic Response under Tension
To analyze the effect of severe plastic deformation on the critical stress level to
induce martensite, , and the yield stress of stress induced martensite, levels,
tension tests were conducted until failure on all the Ti50.3Ni33.7Pd16 samples which are
under investigation in this research. The test temperatures were chosen to be the same as
in the equiatomic NiTi failure experiments which is 15°C above the Ms of each sample
under 50MPa. Figure 5.10 illustrates the stress vs. inelastic strain response of the
Ti50.3Ni33.7Pd16 samples. The , and the stress differential (i.e. )
are tabulated in Table 5.1. σ and the stress differential increase after ECAE. The
SIMσ σMy
SIMσ σMy SIM
My σσ −
My

107
change in , on the other hand, is not significant. SIMσ
1200
1100
1000
900
800
700
600
500
400
300
200
100
0
Stre
ss (M
Pa)
6543210
Inelastic Strain (%)
Ti50.3Ni33.7Pd16 Hot Rolled ECAE 4Bc at 450ºC ECAE 2B at 400ºC
T=Ms+15ºC
C15MT 50MPaσs °+= =
Figure 5.10 Monotonic tensile response of the hot rolled and ECAE processed
Ti50.3Ni33.7Pd16 samples.
Table 5.1 Critical stresses for the onset of phase transformation and plastic yielding and
the stress differential of the Ti50.3Ni33.7Pd16 samples determined from the monotonic
experiments under tension.
Materials SIMσ
(MPa)
σMy
(MPa)
SIMMy σσ −
(MPa)
Ti50.3Ni33.7Pd16-Hot Rolled 240 660 420
Ti50.3Ni33.7Pd16-ECAE 4BC at 450°C 260 1130 870
Ti50.3Ni33.7Pd16-ECAE 2B at 400°C 270 1130 860

108
5.5 Isobaric Thermal Cyclic Experiments
Isobaric thermal cyclic experiments were performed, incrementally increasing
the applied stress after each thermal cycle, using the same specimens throughout the
experiment. The transformation and irrecoverable strain levels were determined using
the same procedure described in section 4.5.
Figures 5.11 and 5.12 show the strain vs. temperature response of the
Ti50Ni30Pd20 samples and the Ti50.3Ni33.7Pd16 samples, respectively, before and after
ECAE. Figures 5.13.a and 5.13.b represent the transformation and irrecoverable strain
levels as a function of applied stress determined from the isobaric heating-cooling
experiments of all Ti50Ni30Pd20 and Ti50.3Ni33.7Pd16 samples.
One of the most significant observations from these experiments is that there is a
significant increase in the level of stress at which fracture occurs in the Ti50Ni30Pd20
samples as the ECAE temperature decreases. The solutionized Ti50Ni30Pd20 sample
failed under 250MPa and the hot rolled Ti50.3Ni33.7Pd16 sample failed under 300MPa,
while Ti50Ni30Pd20 sample ECAE processed at 400°C failed under 400MPa all during the
transformation from austenite to martensite. Ti50.3Ni33.7Pd16 sample ECAE processed at
400°C did not fail even at 400MPa. This was attributed to the positive effect of hot
rolling prior to ECAE as it will be discussed in the following section. Clearly, ECAE
affects considerably the fracture stress level of the TiNiPd alloys in this study. The
mechanisms responsible for such improvement will be discussed later.

109
Stra
in (%
)
220200180160140120100806040200
Temperature (ºC)
50 MPa
100 MPa
150 MPa
200 MPa
Ti50Ni30Pd20Solutionized at 1000ºC for 1 hr
2% Failed under 250MPa
(a)
Stra
in (%
)
220200180160140120100806040200
Temperature (ºC)
2% Ti50Ni30Pd20ECAE 4C at 600ºC
50MPa
100MPa
150MPa
200MPa
250MPa
Failed Under 300MPa
(b)
Figure 5.11 Strain vs. temperature response of the Ti50Ni30Pd20 alloy under various
constant stress levels: (a) solutionized, (b) ECAE 4C at 600°C, (c) ECAE 2C at 500°C,
(d) ECAE 4C at 400°C.

110
Stra
in (%
)
220200180160140120100806040200
Temperature (ºC)
Ti50Ni30Pd20ECAE 2C at 500ºC
2%
50MPa
100MPa
150MPa
200MPa
250MPa
300MPa
Failure under 350MPa
(c)
Stra
in (%
)
220200180160140120100806040200
Temperature (ºC)
2% Ti50Ni30Pd20ECAE 4C at 400ºC
50MPa
100MPa
150MPa
200MPa
250MPa
300MPa
350MPa Failed under 400MPa
(d)
Figure 5.11 Continued
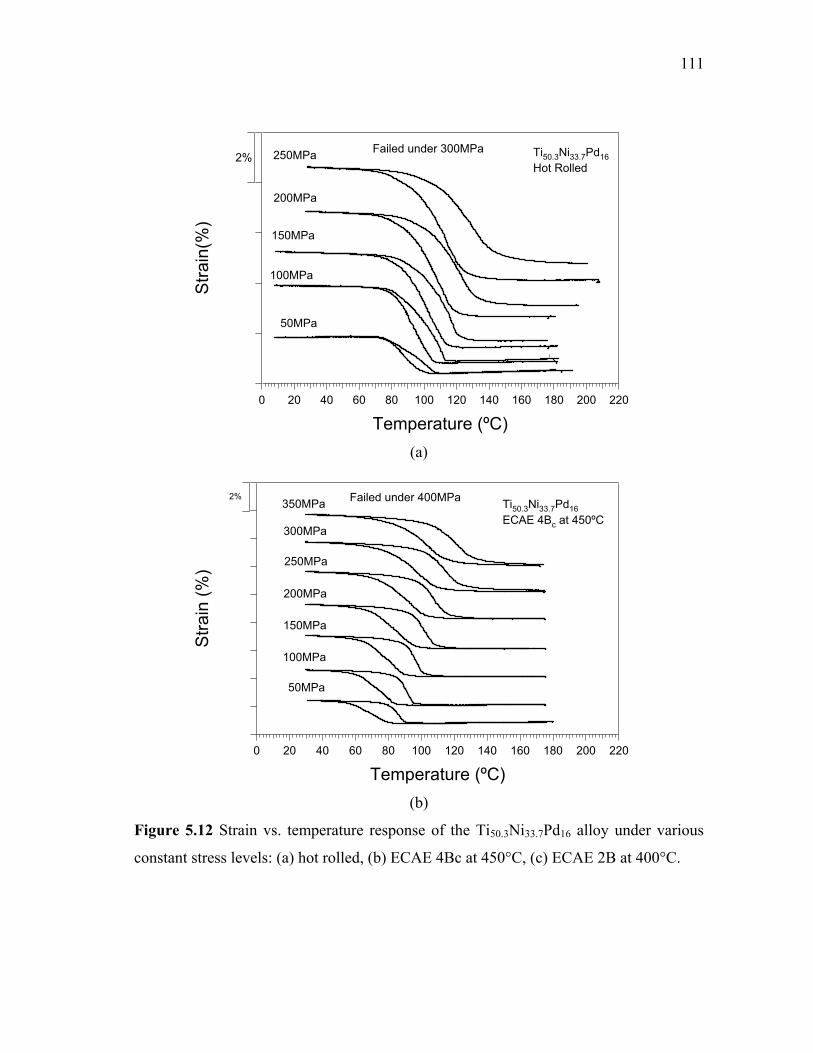
111
Stra
in(%
)
220200180160140120100806040200
Temperature (ºC)
Ti50.3Ni33.7Pd16Hot Rolled
2%
50MPa
100MPa
200MPa
250MPa
150MPa
Failed under 300MPa
(a)
Stra
in (%
)
220200180160140120100806040200
Temperature (ºC)
2%Ti50.3Ni33.7Pd16ECAE 4Bc at 450ºC
50MPa
100MPa
150MPa
200MPa
250MPa
300MPa
350MPa Failed under 400MPa
(b)
Figure 5.12 Strain vs. temperature response of the Ti50.3Ni33.7Pd16 alloy under various
constant stress levels: (a) hot rolled, (b) ECAE 4Bc at 450°C, (c) ECAE 2B at 400°C.

112
Stra
in (%
)
220200180160140120100806040200
Temperature (ºC)
Ti50.3Ni33.7Pd16ECAE 2B at 400ºC
2%
50MPa
100MPa
150MPa
200MPa
300MPa
400MPa
(c)
Figure 5.12 Continued
6.0
5.5
5.0
4.5
4.0
3.5
3.0
2.5
2.0
1.5
1.0
0.5
0.0
Stra
in (%
)
400350300250200150100500
Stress (MPa)
Irrecoverable Strain Solutionized ECAE4C at 600ºC ECAE2C at 500ºC ECAE4C at 400ºC
Transformation Strain Solutionized ECAE4C at 600ºC ECAE2C at 500ºC ECAE4C at 400ºC
Ti50Ni30Pd20 FRACTURED
(a)
Figure 5.13 Transformation and irrecoverable strain response as a function of constant
tensile stress levels in the (a) Ti50Ni30Pd20, (b) Ti50.3Ni33.7Pd16 samples during isobaric
thermal cyclic experiments.

113
6.0
5.5
5.0
4.5
4.0
3.5
3.0
2.5
2.0
1.5
1.0
0.5
0.0
Stra
in (%
)
400350300250200150100500
Stress (MPa)
Transformation Strain Hot Rolled ECAE 4Bc at 450ºC ECAE 2B at 400ºC
Irrecoverable Strain Hot Rolled ECAE 4Bc at 450ºC ECAE 2B at 400ºC
Ti50.3Ni33.7Pd16 FRACTURED
(b)
Figure 5.13 Continued
The irrecoverable and transformation strain levels were extracted from the
isobaric cooling-heating experiments using the same procedure defined in section 4.5
and in Figure 4.10. Figure 5.13.a and 5.13.b represent the transformation and
irrecoverable strain levels as a function of applied stress level determined from the
isobaric cooling-heating experiments conducted on Ti50Ni30Pd20 and Ti50.3Ni33.7Pd16
samples, respectively. In Figure 5.13, the irrecoverable strain levels of the solutionized
Ti50Ni30Pd20 sample are lower than that of the Ti50.3Ni33.7Pd16 hot rolled sample. One can
observe a detectable irrecoverable strain only above 250MPa for the Ti50Ni30Pd20 and
Ti50.3Ni33.7Pd16 samples extruded at 400°C. As the extrusion temperature decreases, the
irrecoverable strain level of Ti50Ni30Pd20 samples also decreases. The effect of number of
passes on the irrecoverable strain can be monitored in the results of Ti50.3Ni33.7Pd16
samples which are shown in Figure 5.13.b. The irrecoverable strain levels of the
Ti50.3Ni33.7Pd16 sample ECAE processed at 400°C do not exceed 0.3% under 400MPa.
The irrecoverable strain levels of Ti50.3Ni33.7Pd16 sample which is ECAE processed at
450°C for four passes are lower than that of Ti50.3Ni33.7Pd16 sample which is processed at

114
400°C for two passes and are almost negligible at all stress levels below 400MPa.
The transformation strain level of the solutionized Ti50Ni30Pd20 increases from
0.5% to 4% up to 200MPa at which the sample failed during cooling. The ECAE
processed Ti50Ni30Pd20 samples show higher transformation strain levels under 50MPa
and 100MPa. Since the solutionized sample failed at 250MPa, it is not possible to
compare the transformation strain levels after this point. However, the trend is the
stabilization of the transformation strain levels of ECAE processed samples at 3.5%
above 200MPa. On the other hand, the transformation strain level of solutionized sample
keeps increasing drastically. The trend in the ECAE processed Ti50.3Ni33.7Pd16 samples is
the same for the ECAE processed Ti50Ni30Pd20 samples. The difference in the
transformation strain levels of Ti50.3Ni33.7Pd16 and Ti50Ni30Pd20 samples is that the
transformation strain levels of ECAE processed Ti50Ni30Pd20 samples are higher than
that of the solutionized sample under 50MPa and 100MPa while the transformation
strain levels of ECAE processed Ti50.3Ni33.7Pd16 samples and hot rolled sample are
almost same under 50MPa and are lower than that of the hot rolled sample under
100MPa and higher stress levels.
The main observations from Figures 5.13 can be summarized as: 1) fracture
stress level of the samples increases as the ECAE temperature decreases, 2)
irrecoverable strain levels of the ECAE processed samples are lower than the
unprocessed samples, 3) the effect of the number of ECAE passes on the irrecoverable
strain levels is similar to the effect of ECAE temperature i.e. the lower the ECAE
temperature and the higher the number of ECAE passes is, the lower the irrecoverable
strain level gets, 4) the transformation strain levels of the ECAE processed Ti50Ni30Pd20
samples are higher than that of the solutionized sample at low stress levels and lower at
high stress levels, and 5) the transformation strain levels of ECAE processed samples
stabilize at 3.5% for Ti50Ni30Pd20 alloy 3.0% for Ti50.3Ni33.7Pd16 alloy above 200MPa.
The fracture stress levels are marked for each case except the Ti50.3Ni33.7Pd16
sample ECAE processed at 400°C for two passes which did not fail even under 400MPa
in Figure 5.13. All the samples were failed during cooling at the particular stress level,

115
i.e. during austenite to martensite transformation.
Figure 5.14 demonstrates the temperature and stress phase diagram for the onset
of martensitic transformation for all Ti50Ni30Pd20 and Ti50.3Ni33.7Pd16 samples determined
from the isobaric heating–cooling experiments. For the sake of completeness, Ms
temperatures from the DSC experiments in Figure 5.3 are also included. Clearly, a linear
relationship between stress and temperature can be observed in this figure for all
samples, as expected from the Clausius-Clapeyron (CsCl) relationship for thermoelastic
martensitic transformations. The CsCl slopes which can also be represented as dTdσ for
each sample are tabulated in Table 5.2. The CsCl slopes of the Ti50Ni30Pd20 alloy
decrease after ECAE and the slopes of the Ti50.3Ni33.7Pd16 alloy slightly increase after
ECAE.
It was observed from Figure 5.14 that there is a mismatch between the
from DSC experiment and M from the extrapolation of CsCl curves in all
Ti50Ni30Pd20 samples. The mismatch gets smaller in Ti50.3Ni33.7Pd16 samples. In hot
rolled Ti50.3Ni33.7Pd16 sample from DSC experiment is similar to from the
extrapolation of CsCl curves. Another observation is the decrease in Ms temperature
under applied stress with the decrease in ECAE temperature in Ti50Ni30Pd20 samples. On
the other hand, in Ti50.3Ni33.7Pd16 samples, the effect of number of ECAE passes on Ms
temperatures is more significant than the effect of ECAE temperature. The implications
of these results and the possible rationale for such observations will be discussed in
section 5.8.
M 0σs=
0σs=
M 0σs= M 0σ
s=

116
400
300
200
100
0
Stre
ss (M
Pa)
1801701601501401301201101009080
Temperature (ºC)
Ti50Ni30Pd20 Solutionized ECAE 4C at 600ºC ECAE 2C at 500ºC ECAE 4C at 400ºC
(a)
400
350
300
250
200
150
100
50
0
Stre
ss (M
Pa)
15014013012011010090807060
Temperature (ºC)
Ti50.3Ni33.7Pd16 Hot Rolled ECAE 4Bc at 450ºC ECAE 2B at 400ºC
(b)
Figure 5.14 Critical stress versus Ms temperatures of (a) Ti50Ni30Pd20 and (b)
Ti50.3Ni33.7Pd16 samples before and after ECAE determined from the isobaric heating-
cooling shown in Figure 5.13. For the sake of the completeness the Ms temperatures
from the DSC experiments (Figure 5.3) are also included in the figure.

117
Table 5.2 The slopes of the critical stress vs. temperature curves (dTdσ ) shown in Figure
5.14.
Material dTdσ
(MPa/°C)
Ti50Ni30Pd20-Solutionized 13.5
Ti50Ni30Pd20-ECAE 4C at 600°C 8.1
Ti50Ni30Pd20-ECAE 2C at 500°C 7.7
Ti50Ni30Pd20-ECAE 4C at 400°C 6.8
Ti50.3Ni33.7Pd16-Hot Rolled 7.2
Ti50.3Ni33.7Pd16-ECAE 4Bc at 450°C 8.1
Ti50.3Ni33.7Pd16-ECAE 2B at 400°C 7.6
Thermal hystresis were extracted from the isobaric cooling-heating experiments
using the same procedure defined in section 4.5 and in Figure 4.10. Figure 5.15.a and
5.15.b represent the thermal hysteresis as a function of applied stress level determined
from the isobaric cooling-heating experiments conducted on Ti50Ni30Pd20 and
Ti50.3Ni33.7Pd16 samples, respectively. Thermal hysteresis increase after ECAE
Ti50Ni30Pd20 and Ti50.3Ni33.7Pd16 samples and increase further with the increase in
applied stress. One intriguing observation is the lower thermal hysteresis under 50MPa
with respect to thermal hysteresis under no load in all samples. The rationale behind this
observation is not clear at this point.

118
32
28
24
20
16
12
8
4
0
Ther
mal
Hys
tere
sis
(ºC
)
400350300250200150100500
Stress (MPa)
Ti50Ni30Pd20 Solutionized ECAE 4C at 600ºC ECAE 2C at 500ºC ECAE 4C at 400ºC
(a)
32
28
24
20
16
12
8
4
0
Ther
mal
Hys
tresi
s (º
C)
400350300250200150100500
Stress (MPa)
Ti50.3Ni33.7Pd16 Hot rolled ECAE 4Bc at 450ºC ECAE 2B at 400ºC
(b)
Figure 5.15 Thermal hysteresis as a function of constant tensile stress levels in the (a)
Ti50Ni30Pd20, (b) Ti50.3Ni33.7Pd16 samples during isobaric thermal cyclic experiments.

119
5.6 Microstructural Investigation of Failure Samples
To reveal the potential reasons for premature failure at low stress levels in
ternary alloys during the isobaric heating-cooling experiments, the microstructure of the
failed samples were studied using scanning electron microscope (SEM) and Electron
Microprobe (EM).
Figure 5.16 represents the back scattered electron SEM images taken from the
Ti50Ni30Pd20 solutionized sample and samples ECAE processed at 600°C and 400°C.
The images demonstrate the second phase particles in the matrix. To analyze the
composition of the precipitates, the wave dispersion spectroscopy (WDS) and energy
dispersion spectroscopy (EDS) analysis were conducted on the selected precipitates. It
was found from both of the analysis that the black precipitates indicated in Figure 5.16.b
are Ti(C,O) precipitates while the light gray precipitates are Ti2(Ni, Pd) intermetallics.
The EDS analyses of the indicated precipitates in Figure 5.16.b are represented in Figure
5.17. The carbon and oxygen elements in Ti(C, O) particles are also analyzed using
WDS since WDS analysis allows a more spectral resolution and more sensitivity on low
atomic number elements than EDS analysis does and this analysis is shown in Figure
5.17.b. The images in Figure 5.16 show the notable decrease in precipitate size and
volume after ECAE at 400°C and the second phase particles are more homogeneously
distributed in ECAE processed at 400°C sample than that of in solutionized sample. The
average size and volume percent of the precipitates before and after ECAE is tabulated
in Table 5.3.

120
10μm10μm
Ti(C,O)
Ti2(Ni, Pd)
10μm10μm
(a) (b)
10μm10μm
(c)
Figure 5.16 Back scattered electron SEM images showing the precipitate size and
distribution within the matrix of Ti50Ni30Pd20 samples (a) solutionized, (b) ECAE
processed at 600°C and (c) ECAE processed at 400°C.

121
(a) (b)
(c)
Figure 5.17 EDS and WDS analyses of the second phase particles in the matrix of
Ti50Ni30Pd20 samples for (a) dark particles Ti(C, O) in Figure 5.16 and (b) light gray
particles Ti2(Ni, Pd) in Figure 5.16 (c) WDS analysis showing the carbon and oxygen in
dark particles Ti(C, O).
Figure 5.18 represents secondary electron SEM image of the solutionized
Ti50Ni30Pd20 sample. The image shows that there are pores in the matrix which might be
responsible for the premature failures in the isobaric cooling-heating experiments. The
length of the pore shown in Figure 5.18 is around 100μm. No pores were observed in the

122
Ti50Ni30Pd20 sample ECAE processed at 400°C.
Figure 5.18 Secondary electron SEM image of solutionized Ti50Ni30Pd20 sample
showing one of the porosity in the matrix.
Table 5.3 The average size of the precipitates in Ti50Ni30Pd20 samples before and after
ECAE.
Materials Average
Size(μm)
Volume
(%)
Solutionized 2.3±1 2.1±0.1 ECAE 4C at 400°C 1.2±0.4 1.6±0.1
It was shown that high strains induced in ECAE not only lead to the grain
refinement but also affect the size and the distribution of the second phase/precipitates
contained within the matrix. The precipitates either fragment into smaller parts or
dissolve in the matrix since both the average size and volume percent of the precipitates
decrease notably after ECAE. Ti2(Ni, Pd) precipitates are probably dissolved in the
matrix since no light gray precipitates were observed in the sample ECAE processed at
400°C as shown in Figure 5.16.c. This observation is not uncommon for ECAE.

123
Langdon et al. showed that ECAE leads to the formation of ultrafine grain size with
finely dispersed precipitates in AlZnMg alloys [131]. In addition, ECAE affects the
porosity content of the Ti50Ni30Pd20 samples.
5.7 Thermal Cyclic Experiments under Constant Stress
As shown in section 5.5, none of the ECAE processed Ti50Ni30Pd20 samples
demonstrate irrecoverable strain at and below 150MPa. Although the solutionized
Ti50Ni30Pd20 sample failed at 250MPa in isobaric heating-cooling experiments, it failed
at the second cycle under 150MPa in the thermal cyclic experiments. Figures 5.19 and
5.20 represent the strain-temperature response of the ECAE processed Ti50Ni30Pd20
samples under 150MPa and 250MPa for ten cycles, respectively. The main purpose to
conduct cyclic tests was to evaluate the transformation and the irrecoverable strain levels
as a function of the number of cycles. The samples ECAE processed at 600°C and 500°C
show no irrecoverable strain under 150MPa, therefore, the sample ECAE processed at
400°C was not thermally cycled under 150MPa.The transformation and irrecoverable
strain levels for ten cycles determined from these thermal cyclic experiments are
presented in Figure 5.21. Under 250MPa, the samples ECAE processed at 500°C and
400°C show no detectable irrecoverable strain after the first cycle. The transformation
strain levels of the samples ECAE processed at 600°C and 500°C under 150MPa are
stable around 3%. Under 250MPa, the transformation strain levels of samples ECAE
processed at 500°C and 400°C are again stable and about 3.2%.

124
Stra
in (%
)
220200180160140120100806040200
Temperature (ºC)
1% Ti50Ni30Pd20ECAE 4C at 600ºC
Under 150MPa
(a)
Stra
in (%
)
220200180160140120100806040200
Temperature (ºC)
Ti50Ni30Pd20ECAE 2C at 500ºC
1%
Under 150MPa
(b)
Figure 5.19 Strain vs. temperature response of the ECAE processed Ti50Ni30Pd20 alloy
under 150MPa (a) ECAE 4C at 600°C, (b) ECAE 2C at 500°C.

125
Stra
in (%
)
220200180160140120100806040200
Temperature (ºC)
Ti50Ni30Pd20ECAE 2C at 500ºC
1%
Under 250MPa
(a)
Stra
in (%
)
220200180160140120100806040200
Temperature (ºC)
1%Ti50Ni30Pd20ECAE 4C at 400ºC
Under 250MPa
(b)
Figure 5.20 Strain vs. temperature response of the ECAE processed Ti50Ni30Pd20 alloy
under 250MPa (a) ECAE 2C at 500°C, (b) ECAE 4C at 400°C.

126
4
3
2
1
0
Stra
in (%
)
10987654321
Number of Cycles
ECAE 4C at 600ºC Transformation Strain Irrecoverable Strain
ECAE 2C at 500ºC Transformation Strain Irrecoverable Strain
Ti50Ni30Pd20
(a)
4
3
2
1
0
Stra
in (%
)
10987654321
Number of Cycles
ECAE 2C at 500ºC Transformation Strain Irrecoverable Strain
ECAE 4C at 400ºC Transformation Strain Irrecoverable Strain
Ti50Ni30Pd20
(b)
Figure 5.21 Transformation and irrecoverable strain evolution during thermal cyclic
experiments in the ECAE processed Ti50Ni30Pd20 samples as a function of number of
cycles (a) ECAE 4C at 600°C and ECAE 2C at 500°C under 150MPa for 10 cycles and
(b) ECAE 2C at 500°C and ECAE 4C at 400°C under 250MPa.

127
The thermal cyclic experiments were not conducted on Ti50.3Ni33.7Pd16 because
the results are expected to be similar to what determined from the thermal cyclic
experiments on Ti50 Ni30Pd20.
The main observations from these experiments are: 1) there is no irrecoverable
strain under 150MPa and insignificant irrecoverable strain under 250MPa; 2) the
transformation strain levels are stable for all samples and vary between 3 to 3.5%, there
is no significant strain evolution.
5.8 Discussion of the Results
In the present study, the main purpose is to investigate the shape memory
characteristics of Ti50Ni30Pd20 and Ti50.7Ni33.7Pd16 alloys since only a limited number of
studies were undertaken on TiNiPd alloys up to date [105, 112]. The experiments
mimicking the real actuator operation (i.e. thermal cycling under load) were performed
only by the NASA Glenn research group very recently, about the same time with the
present work [32]. They have investigated the evolution in transformation temperatures,
work behavior, and dimensional stability of the TiNiPd alloys with different Pd contents.
The main differences between this study and the studies of the NASA group are the Pd
content and in the present case the investigation of the effect of ECAE on microstructure
and the corresponding improvement of the mechanical and shape memory behavior of
the alloys. The present NiTiPd compositions were selected to have all transformation
temperatures in between 100°C and 150°C for a particular target application. Thus, this
is the first study that thoroughly investigates the shape memory and actuator
characteristics of NiTiPd alloys. The main observations could be summarized as follows:
1) The grains are elongated in the ECAE processed samples. The average
grain size of the samples was reduced from 50μm down to 0.5 μm after ECAE. The
length and width of the grains are 0.5-1μm and 0.2-0.4μm, respectively, for the sample
ECAE processed at 400°C.
2) The twin mode in martensite was found to be a mixture of typical Type I

128
and Type II twins. There is no change in the twin type and twin size after ECAE.
3) Addition of Pd to TiNi alloy enhances the shape memory characteristics
of NiTi alloys such as the significant decrease in thermal hysteresis and irrecoverable
strain under constant stress levels, and transformation temperature cyclic stability under
no load condition.
4) ECAE led to increase the strength differential between the critical stress
to induce martensite and the yield stress of martensite and led to a notable improvement
in the thermal cyclic stability by further reducing the irrecoverable strain levels under
constant stresses which can be attributed to the increase in critical stress level for
dislocation slip due to grain size refinement and dislocation density increase via ECAE.
5) ECAE led to decrease the size and volume fraction of the undesirable
precipitates which is thought to be the main reason for the premature failure in the
isobaric heating-cooling experiments.
6) The decrease in size and volume fraction of the precipitates led to the
increase in the stress levels at which the failure occurs during isobaric heating-cooling
experiments.
The possible mechanisms responsible from these observations are discussed below.
5.8.1 Grain Size and Microstructural Evolution during ECAE
The knowledge base gathered from the transmission electron microscopy study
of equiatomic NiTi alloy showed us that the lowest ECAE processing temperature has
the most influence on the grain size refinement. Therefore, the solutionized Ti50Ni30Pd20
sample and the sample ECAE processed at 400°C were chosen for the transmission
electron microscopy study to investigate the grain refinement. Figure 5.6 shows both the
grain size refinement and elongated grain structure after the ECAE process. Langdon et
al. [118] presented the model for grain refinement in ECAE routes A, Bc and C and
confirmed the formation of elongated grains when using route C in ECAE processing.
The development of new refined grains is a result of gradual increase in the
misorientations between subgrains that is caused by the deformation at slightly high

129
temperature and with further deformation, the grain size continues to decrease and the
amount of newly generated ultrafine grains increase.
TEM images and diffraction patterns showed that ECAE has no real effect on
martensite twinning mode observed in TiNiPd alloys. The diffraction patterns taken
from the twins demonstrate the common twinning modes in TiNi based shape memory
alloys. In the literature, none of the previous works showed one of the compound
twinning modes in TiNiPd SMAs which are occasionally observed in NiTi binary alloys.
Madangopal et al. stated that plane cannot be a twinning plane in B19 martensite
as it is a mirror plane of the orthorhombic structure [126]. Similarly, in this study, no
traces of compound twins were detected even after ECAE, although in the binary,
compound twins are in abundance after ECAE. ECAE parameters used in this study
affect neither the twinning mode nor the twin size in NiTiPd. It is known that B19
martensite exists in TiNiPd alloys, which is of higher symmetry than B19’. Therefore
there are less variants in B19 martensite than in B19’ martensite of binary NiTi. This
leads to difficulties in the accommodation of the transformation strain as effectively as
that in B19’ martensite, which might be the reason why compound twinning does not
exist.
)001(
5.8.2 Effect of ECAE Processing on Martensitic Transformation Temperatures
It is quite interesting to observe excellent thermal cyclic stability of the
transformation temperatures in solutionized Ti50Ni30Pd20 and hot rolled Ti50.3Ni33.7Pd16
samples without application of any thermo-mechanical treatment. Previous studies on
equiatomic NiTi and TiNiHf alloys [9, 13] showed that thermal stability of
transformation temperatures is improved after thermo-mechanical treatments. It is found
that addition of Hf to NiTi alloys leads to the degradation of thermal cyclic stability due
to the decrease in critical shear stress for slip [132]. On the contrary, the results of DSC
experiments of TiNiPd alloys in this study showed that addition of Pd to TiNi alloys
improves the thermal cyclic stability possibly due to increase in critical shear stress for
slip and to the improvement in the geometrical lattice compatibility between austenite

130
and martensite upon Pd addition similar to Cu addition [133]. The rationale of the
improvement of geometrical compatibility will be discussed extensively in Chapter VI.
The decrease in transformation temperatures after ECAE in stress free DSC
experiments can be explained using the same approach introduced in section 4.8.2. From
Figure 5.3, the transformation temperatures decrease after ECAE process due to the
increase in irreversible energy. This increase in irreversible energy can be attributed to
the increase in strength levels via grain refinement and dislocation density. In such a
microstructure multiple phase fronts should be nucleated and propagated which would
require more energy (i.e., reduction in the transformation temperature) and more energy
dissipation due to both difficulty of propagation of and interaction between multiple
phase fronts, but especially due to the later. Grain boundaries and high dislocation
density act as barriers to the transforming interfaces and require the nucleation of new
phase fronts. However, note that above is only valid at stress-free conditions. Under
applied stress, the situation is slightly different. From isobaric cooling-heating
experiments in section 5.5, the transformation temperatures increase under the influences
of the external stress. The increase is proportional to the applied stress according to the
equation 4.8.2.3.
The decrease in thermal hysteresis upon Pd addition can be explained using the
same approach for the explanation of improved thermal cyclic stability in stress free
DSC experiments. The geometric lattice compatibility between austenite and martensite
is improved upon Pd addition. This improvement leads to decrease in the required
energy for the propagation of phase front, thus the decrease in dissipation energy for the
phase front propagation leads to a decrease in thermal hysteresis. Thermal hysteresis
increases after ECAE due to the grain size refinement and the increase in dislocation
density. Grain boundaries and high dislocation density act as barriers to the transforming
interfaces and require the nucleation of new phase fronts. Thus, additional energy is
required to overcome this energy barrier. The temperature must be raised above the
transformation temperature on heating and lowered below on cooling. This leads to an
increase in thermal hysteresis.

131
Thermal hysteresis extracted from isobaric cooling-heating experiments alters
from the expected behavior. Thermal hysteresis of all samples initially decreases under
50MPa and the increases upon increasing the external stress. The rationale behind the
initial decrease is not clear at this point. However, the increase in thermal hysteresis with
the increase in external stress levels is due to the increase in dislocation density under
higher stress levels. The dislocations introduced due to thermal cycling under stress act
as barriers to the transforming interface which leads to a further increase in the energy to
overcome this energy barriers. Thus, thermal hysteresis increases as the external stress
level increases.
5.8.3 Effect of ECAE on Monotonic Mechanical Response under Tension
The increase in yield strength of martensite ( ) and the increase in the stress
differential between yield strength and critical stress to induce martensitic
transformation ( ) of ECAE processed Ti50.3Ni33.7Pd16 samples as compared to
the hot rolled sample in the same thermodynamic conditions can be attributed to the
grain size refinement and the increase in dislocation density. The grain refinement and
the increase in dislocation density after ECAE were clearly shown in the TEM
micrographs in Figure 5.2 and Figure 5.4, respectively.
yσ
SIMy σσ −
5.8.4 Effect of ECAE on Fracture Strength, Cyclic Stability and Critical Stress vs.
Critical Temperature Behavior
The premature failures observed in Ti50Ni30Pd20 and Ti50.3Ni33.7Pd16 samples in
isobaric heating-cooling experiments can be attributed to the second phase particles
observed in the matrix. Karaman et al. [20] showed that Ni4Ti3 were found to exist in Ti-
50.8at%Ni alloy after heat treatment at 450°C, but no precipitates were observed after
ECAE processing at 450°C indication that the precipitates dissolved during the ECAE
process or precipitates fragment into small parts such that their sizes are below the
detection limit of TEM (<0.01μm). Langdon et al. [131] also studied the effect of ECAE

132
on precipitate size and shape and found that ECAE helps to fragment the precipitates
into smaller parts and to dissolve the smaller ones in the matrix. From Figure and Table
5.3, there is a notable decrease in precipitate size and volume fraction after ECAE
processing. In addition, it is observed that ECAE leads to the elimination of the
porosities in the matrix. Thus, the increase of the fracture strength in isobaric heating-
cooling experiments can be attributed to the decrease in the precipitate size and volume
fraction and the elimination of the porosities after ECAE, however, whichever has the
most influence is not clear yet.
The stress levels at which hot rolled and ECAE processed at 450°C
Ti50.3Ni33.7Pd16 samples failed in isobaric heating-cooling experiments are lower than the
fracture stress levels obtained from the monotonic failure experiments. The failures in
isobaric experiments occurred during cooling at which the austenite is transforming to
martensite. This might be due to the fact that B19 martensite is of higher symmetry than
B19’ martensite. Therefore, there are less variants in B19 martensite than in B19’
martensite of binary NiTi. This leads to difficulties in the accommodation of the
transformation strain as effectively as that in B19’ martensite [134].
In the isobaric thermal cyclic experiments the transformation strains of the ECAE
processed and hot rolled samples increase as the level of externally applied stress
increase as shown in Figure 5.13. The externally applied stress favors certain variants
over the others upon phase transformation [135]. This helps the formation of the
martensitic variant with the most favorable orientation (single variant martensite
morphology) instead of self accommodation morphology, and thus leads to external
shape change. Note that, the transformation strain levels of ECAE processed
Ti50Ni30Pd20 are higher than that of the solutionized sample under 50, 100 and 150MPa.
It was also observed that Clausius-Clapeyron (CsCl) slopes of ECAE processed
Ti50Ni30Pd20 samples are lower than that of the solutionized sample. The lower CsCl
slopes and higher transformation strains in ECAE processed Ti50Ni30Pd20 samples can be
a consequence of the local internal stress due to the favorable deformation structure
formation, refinement of the grains and increased dislocation density during ECAE. The

133
local internal stress may help externally applied stress to bias the single variant
martensite [13]. On the other hand, the transformation strain levels of ECAE processed
Ti50.7Ni33.7Pd16 samples are lower than that of the hot rolled Ti50.7Ni33.7Pd16 sample under
each stress level in isobaric heating-cooling experiments and CsCl slopes of ECAE
processed Ti50.7Ni33.7Pd16 samples are higher than that of hot rolled sample. The lower
transformation strain levels in ECAE processed can be due to the texture formation
during route Bc and B ECAE processing. This texture might be the one which gives
lower transformation strain as oppose to the texture formed during route C ECAE
processing. Although the texture of austenite could not be studied due to the high
temperature requirement and the lack and difficulty of high temperature texture
measurements it is reasonable to expect deformation texture formation in TiNiPd alloys
during ECAE processing at relatively low temperatures considering the recrystallization
temperature of Ti50Ni30Pd20 alloy around 600°C for is considered [112].
The irrecoverable strain levels of both Ti50Ni30Pd20 and Ti50.3Ni33.7Pd16 decrease
after ECAE which can be attributed to the increase in the difference between the yield
strength of stress induced martensite and the critical stress to induce martensite. This
increase in stress difference leads to an increase in critical shear stress for slip due to the
grain size refinement and the increase in dislocation density. This conclusion is also
consistent with recent the results from the NASA Glenn group [32]. They also found that
TiNiPd alloys with lower Pd content show less permanent deformation since the strength
of austenite is very much higher than the strength of martensite such that transformation
from martensite to austenite occurs without slip formation [34].
In Figure 5.14.a, extrapolating curve of the Ti50Ni30Pd20 samples gives
lower temperatures at 0MPa than that of the Ms temperatures measure from DSC. On the
other hand, extrapolating curves of the Ti50.3Ni33.7Pd16 samples gives
approximately the same Ms temperatures measured using DSC. This peculiarity between
the Ti50Ni30Pd20 and Ti50.3Ni33.7Pd16 samples might be due to the increase in elastic
mismatch between austenite and martensite near Ms due to austenite softening and
inelastic accommodation of this mismatch in the Ti50Ni30Pd20 samples. The increase in
SIMσ
SIMσ

134
elastic mismatch with the increase in Pd content leads to the need for higher
supercooling or higher stress levels for triggering martensite nucleis to grow in the
Ti50Ni30Pd20. This causes austenite to transform into martensite at a lower temperature
under a given stress or at a higher stress level under a constant temperature.

135
CHAPTER VI
COMPARISON OF SHAPE MEMORY CHARACTERISTICS OF
THERMO-MECHANICALLY PROCESSED NiTi AND TiNiPd SMAs
6.1 Preamble
NiTi alloys have become widely used in medical field and have been receiving
increased attention in the aerospace, automotive, and power generation industries,
especially if the application needs actuator type behavior. For example, the actuation
systems in aeronautics and aerospace propulsion technologies can benefit from SMAs
which have transformation temperatures higher than 150° or the SMAs that could be
applicable in and around the engines of automobiles should have transformation
temperatures at least 100°C to 300°C. NiTi can do work equivalent to 10-20 J/cm3 under
biased load [136] and these alloys have the ability to recover 8% strain when
unconstrained [137]. Even though NiTi alloys demonstrate the best known SMAs, its
undesirable cyclic instability response when unconstrained, along with large thermal and
stress hysteresis and low operational temperature range in the aforementioned actuation
type applications leads to investigate ternary alloy systems. The development of new
ternary alloys is largely based on trial and error without a suitable guidance of
theoretical approach. In one of these trial and errors, it is found that the addition of Pd
and Pt increases the transformation temperatures and decreases thermal hysteresis [30,
31, 35]. However, the increase in transformation temperatures and the decrease in
thermal hysteresis come at the expense of diminished work capability [32].
In this chapter, the effect of Pd addition to NiTi on the transformation
temperatures, thermal hysteresis and cyclic stability response will be revealed. In
addition, microstructural evolution with severe plastic deformation in Ti50Ni30Pd20 and
Ni49.7Ti50.3 alloys will be compared since, in the previous chapters, it is shown that, the
microstructural refinement and evolution with thermo-mechanical processing have
influence on the shape memory responses of both of the alloys. Although TiNiPd and

136
NiTi alloys can’t be each others alternative for high temperature applications, it is useful
to compare the shape memory response of TiNiPd with superior shape memory
properties of NiTi alloys in order to show TiNiPd ternary alloys are promising for high
temperature applications and it is worth while to carry out extensive research for further
improvement in the shape memory and cyclic stability response of these ternary alloys.
6.2 Comparison of Microstructural Evolution in NiTi and TiNiPd alloy after ECAE
Severe plastic deformation via ECAE of the Ni49.7Ti50.3 and Ti50Ni30Pd20 showed
that grain size refinement of these alloys was different. The average grain size of the
Ni49.7Ti50.3 and Ti50Ni30Pd20 alloys before ECAE process was determined as 50μm using
optical microscope (OM) images and the OM images of hot rolled Ni49.7Ti50.3 and
solutionized Ti50Ni30Pd20 alloys were demonstrated in Figure 4.2 and 5.5, respectively.
Figure 6.1 represents the grain size reduction in both of these alloys after ECAE
processing at 400°C. It was found that the average grain size of the Ni49.7Ti50.3 sample
ECAE processed at 400°C is 100nm, on the other hand, the grains in the Ti50Ni30Pd20
sample ECAE processed at 400°C are elongated and the average length and width of the
grains are 0.5 and 1μm, respectively. Thus, the grain size refinement using ECAE in
TiNiPd is not as pronounced as that of in NiTi alloy.

137
0.3μm
0.5μm
(a) (b)
Figure 6.1 Bright field TEM images taken above Af temperature of the samples showing
the grain size reduction due to ECAE processing, (a) Ti50Ni30Pd20 ECAE 4C at 400°C,
and (b) Ni49.7Ti50.3 ECAE 4Bc at 400°C.
The mechanism of grain refinement is the continuous dynamic
recovery/recrystallization as mentioned in section 4.8 and 5.8. Severe plastic
deformation using ECAE at slightly high temperatures causes the development of new
grains as a result of gradual increase in the misorientations between the subgrains.
Further deformation reduces the grain size continuously and the volume fraction of
newly generated ultrafine grains increases. Thus, there should be another mechanism
which restricts the misorientation increase between the subgrains. It was found that,
there are Ti rich Ti(C, O) and Ti2(Ni, Pd) precipitates in TiNiPd alloy as mentioned in
section 5.6. These precipitates might play a role during grain size reduction such as
pinning the subgrains and restricting the formation new grains as a result of gradual
increase in the misorientations between the subgrains. Therefore, the grain size
refinement is less pronounced in TiNiPd alloys utilizing ECAE at relatively high
temperatures.

138
Another intriguing observation is the lack of formation of compound twins
in TiNiPd alloys. From the TEM study on TiNiPd alloys, no compound twin formation
was observed. However, it is realized that, plane cannot be a twinning plane in
B19 martensite as it is a mirror plane of the orthorhombic structure [126]. Thus,
compound twin formation in TiNiPd alloys which have B19 martensite structure is not
possible.
)001(
)001(
)001(
6.3 The effect of Pd Addition on Transformation Temperatures, Thermal
Hysteresis and Cyclic Stability of NiTi Alloys
Aforementioned studies showed that the transformation temperatures increase
and thermal hysteresis decrease upon Pd addition to NiTi binary alloys [33-35].
However, the effect of Pd addition on the cyclic response of NiTi as function of thermal
cycles has not been shown up to date. Figure 6.2 demonstrates the increase in
transformation temperatures, the decrease in thermal hysteresis and the improved
stability of the transformation temperatures upon Pd addition.
The main observations upon 20at%Pd addition to NiTi alloy are, 1) The increase
in Ms temperature is 55°C, 2) thermal hysteresis decreases from 36.5°C down to 12°C,
and 2) there is no shift in Ms temperature after 5 cycles (improved cyclic stability).
The decrease in thermal hysteresis and improved stability of transformation
temperatures can be explained by the enhancement of the geometric compatibility of the
martensite-austenite upon addition of Pd [133]. Thermal hysteresis is the direct
indication of the dissipation energy as mentioned in Chapter IV and V. Elastic and
interfacial energy are stored owing to the presence of martensite and austenite at the
transition interface because of the incompatibility between these two phases. This occurs
in both austenite to martensite and martensite to austenite transformation. Thus,
additional energy is required to overcome this energy barrier. In the case of thermally
activated phase transformations, the temperature must be raised above the transformation
temperature on heating and lowered below on cooling. This leads to an increase in
thermal hysteresis. If the stored energy due to the incompatibility between austenite and

139
martensite is reduced, less energy is needed to overcome the dissipation energy which
arises from the incompatibility. Thus, thermal hysteresis decreases upon Pd addition
because of the enhanced geometrical compatibility between austenite and martensite.
The improvement in the cyclic stability upon Pd addition also depends on this
geometrical compatibility. If the compatibility is obtained at the transition interface
dislocation formation, which suppresses Ms temperature, does not occur and this leads to
cyclic stability.
C55)(M)(M NiTi1stsTiNiPd
1sts °=−
Hea
t Flo
w (W
/g)
24020016012080400-40
Temperature (ºC)
1 W/g Hot Rolled-Ni49.7Ti50.3
Figure 6.2 Cyclic DSC response of the hot rolled Ni49.7Ti50.3 and solutionized
Ti50Ni30Pd20 alloys demonstrating the increase in transformation temperatures, decrease
in thermal hysteresis and improvement in the cyclic stability of the transformation
temperatures upon Pd addition.
1st cycle
5th cycle
1st cycle
5th cycle
5th cycle
1st cycle
Solutionized-Ti50Ni30Pd20
ΔT ΔTTiNiPd=12°C NiTi=36.5°C
1st cycle5th cycle
M1stsM5ths − =0°C
M1stsM5ths − =9.4°C

140
6.4 The Effect of Pd Addition on Transformation and Irrecoverable Strain Levels
in Isobaric Cooling Heating Experiments
The transformation and irrecoverable strain levels of the hot rolled and ECAE
processed Ni49.7Ti50.3 and solutionized and ECAE processed Ti50Ni30Pd20 samples are
compared in Figure 6.3. The transformation strain levels of solutionized and ECAE
processed Ti50Ni30Pd20 samples are lower than that of the hot rolled and ECAE
processed Ni49.7Ti50.3 due to the change in lattice parameter and structure. In both of the
alloys, the transformation strain level increases as the applied stress increases due to the
fact that externally applied stress helps the formation of the martensitic variant with the
most favorable orientation (single variant martensite morphology) instead of self
accommodation morphology which leads to external shape change. The most important
observation in isobaric cooling-heating experiments is the decrease in irrecoverable
strain levels at each stress level upon Pd addition. No significant irrecoverable strain is
observed under 200MPa in solutionized Ti50Ni30Pd20 sample, on the other hand, the
irrecoverable strain level of the hot rolled Ni49.7Ti50.3 sample under 200MPa is around
1%. The decrease in irrecoverable strain upon Pd addition can be attributed to the
decrease in elastic modulus mismatch between austenite and martensite due to the
increase in geometrical compatibility between two phases which leads to strengthening
of the alloy. ECAE leads to decrease in irrecoverable strain levels in both of the alloys
due to the grain size refinement and the increase in dislocation density.

141
12
11
10
9
8
7
6
5
4
3
2
1
0
Stra
in (%
)
400350300250200150100500
Stress (MPa)
Transformation Strain Hot rolled-Ni49.7Ti50.3 Solutionized-Ti50Ni30Pd20 ECAE 4Bc at 400ºC-Ni49.7Ti50.3 ECAE 4C at 400ºC-Ti50Ni30Pd20
Irrecoverable Strain Hot rolled-Ni49.7Ti50.3 Solutionized-Ti50Ni30Pd20 ECAE 4Bc at 400ºC-Ni49.7Ti50.3 ECAE 4C at 400ºC-Ti50Ni30Pd20
Figure 6.3 Transformation and irrecoverable strain response as a function of constant
tensile stress levels in the hot rolled Ni49.7Ti50.3 and solutionized Ti50Ni30Pd20 samples,
ECAE processed Ni49.7Ti50.3 and Ti50Ni30Pd20 samples from the isobaric cooling-heating
experiments under increasing applied stress levels.
6.5 Comparison of Thermal Hysteresis in NiTi and TiNiPd Alloys
Thermal hysteresis is another important characteristic of shape memory alloys
for their application since thermal hysteresis is directly related with the energy
dissipation which depends on the irreversible component of the non-chemical energy in
equation 4.8.2.1. There are two energy dissipative mechanisms which are the energy
dissipation in the form of frictional work and the dissipation of the stored elastic energy.
Frictional work is spent in resistance to interface motion during transformation.
Dissipation of stored elastic energy is the relaxation of coherency strains of austenite-
martensite interface.
Figure 6.4 shows the thermal hysteresis decrease with the addition of Pd in the

142
present materials in their initial conditions. Thermal hysteresis of the hot rolled
Ni49.7Ti50.3 and the solutionized Ti50Ni30Pd20 samples under 150MPa are 53°C and 17°C,
respectively. Figure 6.5 represents the comparison of the thermal hysteresis after ECAE
process. Thermal hysteresis of the samples Ni49.7Ti50.3 and Ti50Ni30Pd20 samples ECAE
processed at 400°C under 150MPa are 45°C and 18°C, respectively. The thermal
hystresis of Ni49.7Ti50.3 sample decreases after ECAE which can be attributed to the
improved elastic modulus compatibility of austenite-martensite interface. The improved
compatibility is a result of the strengthening due to grain size refinement and
accommodation of the lattice deformation mostly elastically. The effect is opposite in the
TiNiPd alloy. However, the increase in thermal hysteresis of TiNiPd alloys is not
significant.
Stra
in (%
)
24020016012080400-40
Temperature (ºC)
2% Ti50Ni30Pd20-Solutionized Ni49.7Ti50.3-Hot Rolled
Under 150MPa
Figure 6.4 Comparison of the thermal hysteresis of the hot rolled Ni49.7Ti50.3 and the
solutionized Ti50Ni30Pd20 samples.

143
Stra
in (%
)
24020016012080400-40
Temperature (ºC)
2% Ti50Ni30Pd20-ECAE 4C at 400ºC Ti50.3Ni49.7-ECAE 4Bc at 400ºC
Figure 6.5 Comparison of the thermal hysteresis of the Ni49.7Ti50.3 and Ti50Ni30Pd20
samples ECAE processed at 400°C.
6.6 Comparison of the Work Outputs in NiTi and TiNiPd Alloys
The performance of a thermally activated actuator material is dependent on the
work output of the alloy which is the product of recoverable strain and the applied stress.
In real applications of high temperature shape memory alloys, the material must be able
to perform work against an externally applied load in order to function properly. The
recoverable strain is obtained by subtracting the irrecoverable strain from transformation
strain. The transformation and irrecoverable strains are defined in Figure 4.10.
The work outputs under constrained stress levels of the hot rolled Ni49.7Ti50.3 and
solutionized Ti50Ni30Pd20 alloys were calculated and shown in Figure 6.6. The effect of
ECAE on the work outputs of the alloys is represented in Figure 6.7.

144
16
14
12
10
8
6
4
2
0
Wor
kout
put (
J/cm
3 )
400350300250200150100500
Stress (MPa)
Ni49.7Ti50.3- Hot Rolled Ti50Ni30Pd20
- Solutionized Ti50.3Ni33.7Pd16
- Hot Rolled
Figure 6.6 Work output as a function of applied stress in hot rolled Ni49.7Ti50.3,
solutionized Ti50Ni30Pd20, and hot rolled Ti50.3Ni33.7Pd16 alloys.
16
14
12
10
8
6
4
2
0
Wor
kout
put (
J/cm
3 )
400350300250200150100500
Stress (MPa)
Ni49.7Ti50.3- ECAE 4Bc at 400ºC Ti50Ni30Pd20
- ECAE 4C at 400ºC Ti50.3Ni33.7Pd16
- ECAE 2B at 400ºC
Figure 6.7 Work output as a function of applied stress in the ECAE processed
Ni49.7Ti50.3, Ti50Ni30Pd20 and Ti50.3Ni33.7Pd16 samples.

145
In Figure 6.6, work output of the hot rolled Ni49.7Ti50.3 increases with increasing
stress up to 300MPa, because the higher stresses cause martensite variants to reorient to
form a single martensite variant at the expense of the others, therefore there is more
strain available to be recovered during the transition to austenite which leads an increase
in the work output level. However, above 300MPa, applied stress becomes high enough
to prevent full recovery of the martensite since permanent deformation starts being more
influential. Thus, the recoverable strain level begins to decrease. Since work output is
the product of recoverable strain and applied stress it also starts to decrease above
300MPa. The peak stress at which the highest transformation strain, thus the recoverable
strain, is attained is not observed in the TiNiPd alloys. This is due to premature failure of
the alloys because of the second phase particles in the matrix.
Figure 6.7 compares the work outputs of the Ni49.7Ti50.3 and Ti50Ni30Pd20 and
samples which are ECAE processed at 400°C. The work outputs of the ECAE processed
samples never decrease up to 400MPa and until failure for Ni49.7Ti50.3, Ti50.3Ni33.7Pd16
and Ti50Ni30Pd20, respectively. As the applied stress increases the work output also
increases since there were no irrecoverable strains up to 200MPa and above 200MPa the
levels were negligible as shown in the previous chapters. In addition, the transformation
strain level does not change noticeable above a certain stress level. The work output
levels decrease after ECAE since the transformation strain and the corresponding
recoverable strain levels decrease due to the reasons explained in Chapter IV and V.
Under 200MPa, the work output of the hot rolled Ni49.7Ti50.3 is 10.2 J/cm3 while 8.5
J/cm3 in ECAE processed alloy and for the solutionized Ti50Ni30Pd20, the work output is
7.4 J/cm3 and reduces down to 6.2 J/cm3. One intriguing finding is that higher work
output values are obtained under 200MPa in the present TiNiPd alloys as compared to
earlier work on the TiNiPd alloys having compositions [34]. The main difference
between the samples used in the present study and in this previous work is the thermo-
mechanical treatment applied. In the previous work the Ni34.5Ti50.5Pd15 and
Ni29.5Ti50.5Pd20 alloys were extruded at 900°C which is higher than the recrystallization
temperature of TiNiPd alloys. Such processing might possibly help the homogenization

146
of the samples, however, the grain size would be quite large and dislocation density
would be low. In this study, the work output under 200MPa for the Ti50Ni30Pd20 ECAE
processed at 400°C is 6.2 J/cm3, notably higher than what has been reported before. This
might be due to refined grain size and high dislocation density which lead to decrease in
irrecoverable strain under stress.
In addition to work output analysis, it is very useful to calculate the available
energy efficiency in the design and development of SMA actuators. The proportion of
Carnot efficiency in practical engines is 60% and the way of improving the energy
efficiency of an engine is to increase the Carnot efficiency (i.e. by extension of the
difference in temperature sources of heat between which the engine operates) [138]. The
energy efficiency of an SMA engine is theoretically restricted by Carnot efficiency since
an SMA actuator is a heat engine works at low temperature. Application of stress forces
the martensitic transformations to occur at higher temperatures and provides a method to
increase the Carnot efficiency although the onset of slip above critical stress imposes a
critical limit. The Carnot efficiency of an SMA engine is a function of the dependence of
transformation temperatures on the applied stress and can be represented as:
)(σA0)(σM)(σAη
maxf
fmaxf →−= (6.6.1)
where:
dσdAσ0)(σA)(σA f
fmaxf +== (6.6.2)
The equation shown below can be derived from equations 6.6.1 and 6.6.2:
dσdAσ0)(σA
0)(σM1ηf
maxf
f
+=
→−= (6.6.3)
dσdAf can be found as the ratio of the change in the strain and entropy during the
transformation. Strain can be evaluated from the strain vs temperature curves, however, the entropy change is more elusive because it is not reproducible due to a range of orthogonality resulting from the occurrence of differently deformed crystals in
polycrystalline SMAs [138]. Therefore, dσ
dAf can be determined from the slopes of

147
stress vs Af temperature curves. Using the equation 6.8, the transformation temperatures from differential scanning calorimetry results and Af dependence on the applied stress levels, the Carnot efficiencies are calculated for the hot rolled Ni49.7Ti50.3 and Ti50.3Ni33.7Pd16, solutionized Ti50Ni30Pd20 alloys and for all materials ECAE processed at 400°C. The comparison of the Carnot efficiencies of all materials before and after ECAE is represented in Figure 6.8.
50
45
40
35
30
25
20
15
10
5
0
Car
not E
ffici
ency
(%)
400350300250200150100500
Stress (MPa)
Ni49.7Ti50.3-Hot RolledNi49.7Ti50.3-ECAE 4Bcat 400ºCTi50.3Ni33.7Pd16-Hot RolledTi50.3Ni33.7Pd16-ECAE 2B at 400ºCTi50Ni30Pd20-SolutionizedTi50Ni30Pd20-ECAE 4C at 400ºC
Figure 6.8 Carnot efficiencies of Ni49.7Ti50.3, Ti50.3Ni33.7Pd16 and Ti50Ni30Pd20 before and
after ECAE.
It was shown that the Carnot efficiencies increase after ECAE in TiNiPd samples
which might be due to the increase in resistance to dislocation formation by increasing
the stress differential between yield strength of martensite and critical stress to induce
martensite. Since the applied stress forces the martensitic transformation to occur at
higher temperatures the Carnot efficiencies increase with the increase in applied stress
levels in all alloys. The Carnot efficiencies of the TiNiPd samples are lower than that of
NiTi alloy because of the lower transformation strain levels.
TiNiPd alloy can be considered as a very good candidate for high temperature
shape memory applications in the light of the results presented in this chapter.

148
Transformation temperatures increase, thermal hysteresis and irrecoverable strains
decrease with the addition of Pd to NiTi binary shape memory alloys. In addition, work
outputs and the Carnot efficiencies of the TiNiPd alloys used in this study are close to
the work outputs and Carnot efficiencies compiled from equiatomic NiTi alloy at higher
temperatures. The increase in transformation temperatures with the addition of Pd does
not come at the expense of diminished work capability. TiNiPd alloys demonstrate good
work capability with dimensional stability under thermal cycling conditions, especially
after ECAE process.

149
CHAPTER VII
SUMMARY OF THE RESULTS AND CONCLUSIONS
The present work investigated the effect of severe plastic deformation via ECAE on the microstructural refinement and dislocation substructure, and the corresponding evolution in the mechanical properties such as yield strength and stress differential between the yield strength of martensite and critical stress for stress induced martensitic transformation of Ni49.7Ti50.3, Ti50Ni30Pd20 and Ti50.3Ni33.7Pd16 shape memory alloys. The effect of microstructural evolution such as grain refinement, deformation twinning induced refinement and dislocation density increase the transformation temperatures, transformation temperature interval and thermal hysteresis under isobaric conditions was revealed. Possible effects of microstructural evolution on the transformation thermodynamics, in particular the elastic and irreversible energy, were introduced and their ramifications on the shape memory properties such as transformation and irrecoverable strain levels and thermal hysteresis were discussed. Thermal cyclic stability responses of the ECAE processed and unprocessed alloys at stress free and under isobaric conditions were investigated. The isobaric thermal cyclic stability of transformation temperatures, thermal hysteresis, transformation and irrecoverable strain levels of unprocessed and ECAE processed Ni49.7Ti50.3, Ti50Ni30Pd20 and Ti50.3Ni33.7Pd16 SMAs was compared. The effect of ECAE on the premature failure of the TiNiPd alloys was investigated. The evolution in transformation temperatures, thermal hysteresis, irrecoverable strain levels and the corresponding work outputs of the NiTi alloy with the addition of Pd was also revealed. Due to the limited ductility of the alloys which is partially a consequence of their purity level, Ni49.7Ti50.3 alloy was ECAE processed at 400°C, 425°C and 450°C for four passes and at a relatively lower temperature, i.e. 300°C, for one pass, Ti50Ni30Pd20 alloy was ECAE processed at 400°C, and 600°C for four passes and at 500°C for two passes and Ti50.3Ni33.7Pd16 alloy was ECAE processed at 450°C for four passes and 400°C for two passes.

150
The following conclusions can be drawn from the study on Ni49.7Ti50.3 alloy: 1) It is shown that severe plastic deformation via ECAE can lead to grain
refinement in NiTi alloys at relatively high temperatures such as 400°C and above, and deformation-twinning induced refinement at relatively low temperatures such as 300°C.
2) ECAE microstructure triggers the formation of compound twins
with fine platelets in martensite in addition to common
)001(
>< 011 Type II and Type I twins. compound twinning with fine platelet is selected as an internal martensite
defect to minimize the transformation energy in nanograins, although it does not result in a solution to the crystallographic theory of martensitic transformation.
}111{−
)001(
3) Grain refinement via ECAE led to R-phase stabilization in some of the submicron/nanosize grains.
4) The transformation temperatures at stress free condition decrease while the thermal cyclic stability of them is improved after ECAE process due to high dislocation density and grain refinement.
5) The transformation temperature interval, which is the indication of stored elastic energy, decreases in the ECAE processed NiTi due to the increase in energy dissipation. The increase in energy dissipation causes an increase in thermal hysteresis.
6) ECAE leads to an increase in strength differential between the critical stress to induce martensite and the yield stress of martensite upon grain refinement and dislocation substructure formation.
7) ECAE improves the thermal cyclic stability of transformation temperatures, thermal hysteresis and transformation strains and significantly reduces irrecoverable strain levels under constant stress. The negligible irrecoverable strain levels even under very high stress levels in the samples ECAE processed at 300°C and 400°C is attributed to the increase in critical stress level for dislocation slip due to grain size and deformation twinning-induced refinement via ECAE.

151
The following conclusions can be drawn from the study on Ti50Ni30Pd20 and Ti50.3Ni33.7Pd16 alloy:
1) Severe plastic deformation via ECAE refines the grains down to
submicron size and increase the dislocation density in the Ti50Ni30Pd20. 2) Pd addition to NiTi alloy significantly increases transformation
temperatures and decreases thermal hysteresis. The enhancement of lattice compatibility between transforming phase upon addition of Pd and less need for plastic accommodation and energy dissipation is the reason for shrinking thermal hysteresis. The transformation temperatures of ternary alloys decrease and thermal hysteresis increases after ECAE due to the grain refinement and increase in dislocation density.
3) Unexpected premature failures are observed in non-SPD processed Ti50Ni30Pd20 and Ti50.3Ni33.7Pd16 alloys in isobaric cooling-heating experiments due to the presence of Ti-rich Ti(C, O) and Ti2(Ni, Pd) precipitates in the matrix. The fracture stress levels increase after ECAE due to the fact that fragmentation and partial dissolution of the precipitates. The increase in fracture stress levels is also due to the elimination of large pores observed in the solutionized Ti50Ni30Pd20 sample after ECAE.
4) Addition of Pd to NiTi alloy enhances thermal cyclic stability of transformation temperatures and thermal hysteresis at stress free conditions.
5) It also decreases irrecoverable strain levels under isobaric heating-cooling.
6) ECAE improves the thermal cyclic stability notably by further reducing and stabilizing the irrecoverable strain levels under isobaric heating-cooling. This is due to the increase in critical stress for dislocation slip upon grain size refinement and dislocation density increase via ECAE.
7) The work output of NiTi alloys decreases with the addition of Pd due to the decrease in transformation strain.
8) TiNiPd alloys are very good candidates for high temperature shape memory applications due to the fact that transformation temperatures increase, thermal hysteresis and irrecoverable strain decrease, the former two are due to the Pd addition and the later is due to microstructural refinement via ECAE.
9) TiNiPd alloys in this study demonstrate good work capability and dimensional stability under thermal cyclic conditions, especially after ECAE.

152
Therefore, it can be concluded that the increase in transformation temperatures with the addition of Pd does not come at the expense of diminished work capability with the help of microstructural refinement.

153
CHAPTER VIII
FUTURE WORK
ECAE processing leads to thermo-mechanical strengthening by increasing
critical shear stress for slip via grain size refinement and increase in dislocation density.
ECAE processed shape memory alloys show cyclic thermal cyclic stability under no
load and biased load conditions. The parameter for thermal cyclic stability includes
stable transformation temperatures, transformation and irrecoverable strain and thermal
hysteresis as a function of the number of cycles. ECAE has advantages in terms of ease
of processing, control on grain morphology, evolution of microstructure and formation
of specific texture. In addition, ECAE permits the application of large amount of
uniform strain without changing the cross section of the work piece. However, in this
study, the limited ductility of TiNi, especially very low ductility of TiNiPd alloys made
ECAE processing challenging. In the light of the results gathered in this study, future
recommendations can be divided into three different parts: recommendations on (1)
severe plastic deformation and post processing treatments, (2) different ternary alloys,
and, (3) characterization experiments.
1) Recommendations on severe plastic deformation and post processing treatments:
1) Higher number of passes following different routes can be conducted at
different temperature ranges such as from room temperature to 300°C.
2) Marforming (deformation in martensite) via ECAE can be conducted on
extremely pure alloys due to ductility limitations. Marforming might be a more efficient
method in microstructural refinement.
3) The effect of cold rolling after ECAE can be studied to investigate the
effectiveness strain path changes on the microstructural evolution and corresponding
change in the shape memory characteristics of the NiTi and TiNiPd alloys.

154
4) Low temperature annealing after ECAE should be investigated on TiNiPd
alloys because it was found in our previous study that short time low temperature
annealing improves the thermal cyclic stability of TiNiHf shape memory alloys due to
the rearrangement of dislocations upon annealing, polygonization and/or
vacancy/interstitial pair formation [19].
5) Large diameter billets can be used to obtain large product cross sections
not to have difficulties of having limited number of samples for experimentation.
6) Lubrication of the work piece is a very important parameter in ECAE
processing in terms of decreasing the friction between the die walls and the work piece.
Different high temperature lubricants should be searched and evaluated in terms of
improvement in the ECAE performance.
2) Recommendations on different ternary alloys:
1) TiNiPd alloys with different compositions can be investigated
considering different target applications (target transformation temperatures). Addition
of different amounts of Pd definitely changes the shape memory behavior of the TiNiPd
alloys.
2) In this study, the second phase particles in the TiNiPd alloys were the
most challenging problem in terms of processability of the alloys and the resulting shape
memory response due to their brittle nature. Therefore, TiNiPd alloys should be obtained
from another source which provides more clean alloys in terms of oxygen and carbon
contents.
3) TiNiPt ternary alloy system which is another promising high temperature
shape memory alloy system can be ECAE processed and then compared with the TiNiPd
alloys.

155
3) Recommendations on characterization experiments:
1) One of the expected consequences of using different ECAE routes is
certain texture evolution. Thus, it should be examined and the effect of texture on the
shape memory characteristics of NiTi and TiNiPd alloys should be investigated.
2) Monotonic response of the alloys should be determined for investigating
the deformation behavior of martensite and austenite at different temperatures.
3) Pseudoelastic cyclic behavior of TiNiPd alloys should be investigated.
There is no report of high temperature pseudoleasticity in these alloys, thus, it is a great
interest to find out the effect of ECAE on whether high temperature pseudoelasticity
would be possible in ECAE processed NiTiPd alloys.
4) Incremental strain loading experiments in other words, incremental step
loading experiments should be conducted to investigate the evolution of irrecoverable
strain which is the amount of strain remaining in the sample after loading to a particular
strain and then unloading back to zero stress at a constant temperature and to determine
the permanent strain which is the amount of this irrecoverable strain remaining after the
sample is thermally cycled at zero stress. The irrecoverable and permeanent strain values
could be different at each cycle unless the irrecoverable strain is zero after unloading.
This experimental technique could be useful in understanding the reason of irrecoverable
strain observed in thermal cyclic experiments in this study whether it is due to slip or
due to retained martensite after heating the sample above Af temperature.
156
REFERENCES
[1] Otsuka K, Wayman CM. Shape Memory Materials. London: Cambridge
University Press; 1998.
[2] Melton KN. In: Duerig TW, Melton KN, Stöckel D, Wayman CM. editors.
Engineering Aspects of Shape Memory Alloys. Boston: Butterworth-Heinemann
Ltd; 1990.
[3] Duerig T, Pelton A, Stockel D. Mater Sci Eng A 1999;273-275:149.
[4] Miyazaki S. Engineering Aspects of Shape Memory Alloys. Boston:
Butterworth-Heinemann Ltd; 1990.
[5] Miyazaki S, Imai T, Igo Y, Otsuka K. Metall Trans 1986;17A:115.
[6] Lexcellent C, Bourbon G. Mech of Mat 1996;24:59.
[7] Tobushi H, Iwanaga N, Tanaka K, Hori T, Sawada T. Cont Mech Therm
1991;3:79.
[8] Miller DA, Lagoudas DC, Mat Sci and Engr A 2001;308:161.
[9] Kockar B, Karaman I, Kulkarni A, Chumlyakov Y, Kirieva IV. J of Nuclear
Mater 2007;361:298.
[10] Wada K, Liu Y, Smart Mater Struct 2005;14:273.
[11] Tanaka K, Hayashi T, Itoh Y, Tobushi H. Mechanics of Materials 1992;13:207.
[12] Sehitoglu H, Hamilton R, Maier HJ, Chumlyakov Y. J. Phys. IV France
2005;115:3.
[13] Kockar B, Karaman I, Kim JI, Chumlyakov Y. Scripta Mater 2006;54:2208.
[14] Hornbogen E. J of Mat Sci 1999;34:599.
[15] Gall K, Maier HJ. Acta Mater 2002;50:4643.
[16] Hornbogen E, Mertinger V, Wurzel D. Scripta Mater 2001;44:171-178.
[17] Gall K, Sehitoglu H, Anderson R, Karaman I, Chumlyakov YI. Mat Sci and Engr
A 2001;317:85.
[18] Miyazaki S, Igo Y, Otsuka K. Acta Metall 1986;34:2045.

157
[19] Gall K, Sehitoglu H, Chumlyakov YI, Kireeva IV. Acta Mater 1999;47:1203.
[20] Karaman I, Kulkarni A, Luo ZP. Philos Mag 2005;85:1729.
[21] Segal VM, Hartwig KT, Goforth RE. Mat Sci and Engr A 1997;224:107.
[22] Valiev RZ, Islamgaliev RK, Alexandrov IV. Progress in Mat Sci 2000;45:103.
[23] Moberly WJ, Proft JL, Duerig TW. Acta Metal Mater 1990;38:1601.
[24] Waitz T, Antretter T, Fischer FD, Simha NK, Karnthaler HP. J of the Mech and
Phys of Solids 2007;55:419.
[25] Waitz T, Kazykhanov V, Karnthaler HP. Acta Mater 2004;52:137.
[26] Waitz T. Acta Materialia 2005;53:2273.
[27] Pushin VG, Stolyarov VV, Valiev RZ, Kourov NI, Kuranova NN, Prokofiev EA,
Yurchenko LI. Ann Chim Sci Mat 2002;27:77.
[28] Sergueeva AV, Song C, Valiev RZ, Mukherjee AK. Mater Sci Eng A 2003;
339:159.
[29] Pushin VG, Stolyarov VV, Valiev RZ, Lowe TC, Zhu YT. Mater Sci Eng A
2005;410-411:386.
[30] Lo YC, Wu SK, Wayman CM. Scripta Metall Mater 1990;24:1571.
[31] Eckelmeyer KH. Scripta Metall Mater 1976;10:667.
[32] Noebe R, Padula II S, Bigelow G, Rios G, Garg A and Lerch B, SPIE
Conference Proceedings: Smart Structures and Materials 2006: Active Materials;
Behavior and Mechanics San Diego, CA, 2006;6170. p. 279-291.
[33] Olier P, Brachet J.C, Bechade J.L, Foucher C, and Guenin G, J De Phys IV
1995;8:741.
[34] Padula A, Bigelow G, Noebe R, Gaydosh D, Garg A. In: Mitchell MR, Berg B,
editors. SMST 2006: Proceedings of the International Conference on Shape
Memory and Superelastic Technologies. ASM International, Metals Park, OH,
2006, Article in Press.
[35] Donkersloot HC, Van Vucht JH. J. Less-Common Mets 1970;20:83.

158
[36] Lindquist PG, Wayman CM. In: Duerig TW, Melton KN, Stöckel D, Wayman
CM. editors. Engineering Aspects of Shape Memory Alloys. Boston:
Butterworth-Heinemann Ltd; 1990.
[37] Cai W, Tanaka S, Otsuka K. Mat Sci Forum 2000;279:282
[38] Yang WS, Mikkola DE. Scripta Metal Mater 1993;28:161.
[39] Shimizu S, Xu Y, Okunishi E, Tanaka S, Otsuka K, Mitose K. Mater Lett
1998;34:23.
[40] Goldberg D, Xu Y, Murakami Y, Morito S, Otsuka, K, Ueki T, Horikawas HM.
Scripta Metall Mater 1994;30:1349.
[41] Goldberg D, Xu Y, Murakami Y, Morito S, Otsuka K, Intermetallics 3, 35-46,
1995
[42] Buehler W, Wang F. Ocean Eng 1960;1:105.
[43] Kaufman L, Cohen M. Prog Met Phys 1957;7:169
[44] Funakubo H. Shape Memory Alloys. Amsterdam: Gordon & Breach Publishing
Group 1987.
[45] Kessler H, Pitsch W. Acta Metall 1967;15:401.
[46] Kurdjumov GV, Khandros LG. Dokl Nauk SSSR 1949;66:211.
[47] Saburi T, Nenno S. In: Aaronson HI, Laughlin DE, Sekerka RE, Wayman CM,
editors. Proc Int Conf Solid-Solid Phase transformations, Warrendale, PA:
AIME, 1981.
[48] Otsuka K, Shimizu K. Int Metals Rev 1986;31:93.
[49] Wang FE, Buehler WJ. Appl Phys Letter 1972;21:105.
[50] Nagasawa A, Enami K, Ishino Y, Abe Y, Nenno S. Scripta Metall 1974;8:1055
[51] Saburi T, Nenno S, Scripta Metall 1974;8:1363
[52] Takezawa T, Sato S. Proc 1st JIM Int Symp on new aspects of Martensitic
Transformations, Suppl. Trans JIM 1976;17:233.
[53] Schroeder TA, Wayman CM. Scripta Metall 1977;11:225.
[54] Ren X, Otsuka K. Phys Rev Lett 2000;85:1016.
[55] Buehler WJ, Wiley RC, Gilfrich JV. J of Appl Phys 1963;34:1475.

159
[56] Mulder JH. Ph.D Dissertation, University of Twente, Netherlands;1995.
[57] Font J, Cesari E, Muntasell J, Pons J. Mat Sci and Engr A 2003;354:207.
[58] Segui C, Cesari E, Van Humbeeck J. J Mat Trans JIM 1990;31:375.
[59] Pops H, Massalski TB. Trans AIME 1964;230:1662.
[60] Husain SW, Clapp PC. J Mater Sci 1987;22:2351.
[61] Miyazaki S, Kawai T, Otsuka K. J De Phys 4 1982;43:813.
[62] Oishi K, Brown LC. Metall Trans 1971;2:1971.
[63] Miyazaki S, Otsuka K, Sakamoto H, Shimizu K. Trans Jpn Inst Metals 1981;
22:244.
[64] Sakamoto H, Shimizu K. Trans Jpn Inst Metals 1986;27:601.
[65] Laves F, Wallbaum HJ. Naturwissenschaften 1939;27:674.
[66] Poole DM, Hume-Rothery. J Ist Met (Trans AIME) 1954;83:473.
[67] Duwez P, Taylor JL. Trans AIME 1950;188:1173.
[68] Purdy GR, Parr JG. Trans AIME 1961;221:636.
[69] Wasilewski RJ, Butler SR, Hanlon JE, Worden D. Metall Trans 1971;2:229.
[70] Nishida M. Wayman CM, Honma T. Metall Trans 1986;17A:1505.
[71] Massalski TB, Okamoto H, Subramanian PR, Kacprzak L, editors. Binary alloys
phase diagrams, 2nd edition, vol.3. Materials Park, OH: ASM International; 1990.
[72] Ishida A, Sato M, Takei A, Miyazaki S, Mater Trans JIM 1995;36:1349.
[73] Otsuka K, Ren X. Progress in Materials Science 2005;50:511.
[74] Miyazaki S, Otsuka K. Metall Trans 1986;17A:53.
[75] Khachin VN, Paskal YI, Gunter VE, Monasevich AA, Sivokha VP. Phys Met
Metallogr 1978;46:49.
[76] Salamon MB, Meichle ME, Wayman CM. Phys Rev B 1985;31:7306.
[77] Miyazaki S, Ohmi Y, Otsuka K, Suzuki Y. J De Phys 4 1982;43:255.
[78] Miyazaki S, Otsuka K. Philos Mag A 1984;50:393.
[79] Hwang CM, Wayman CM. Scripta Metall 1983;17:381.
[80] Miyazaki S, Otsuka K, Wayman CM. Acta Metall 1989;37:1873.
[81] Miyazaki S, Ishida A. Mat Sci and Engr A 1999;273-275:106.

160
[82] Frick CP, Ortega AM, Tyber J, Maksound AEM, Maier HJ, Liu Y, Gall K, Mat
Sci and Engr A 2005;405:34.
[83] Knowles KM, Smith DA. Acta Metall 1981;29:101.
[84] Zheng YF, Huang BM, Zhang JX, Zhoa JX, Mat Sci and Engr A 2000;279:25.
[85] Otsuka K, Sawamura T, Shimizu K. Phys Statu Solidi 1971;5:457.
[86] Gupta SP, Johnson AA. Trans JIM 1973;14:292.
[87] Onda T, Bando Y, Ohba T, Otsuka K. Mater Trans JIM 1992;33:354.
[88] Nishida M, Ii S, Kitamura K, Furukawa T, Chiba A, Hara T, Hiraga K. Scripta
Mater 1998;39:1749.
[89] Nishida M, Yamauchi KK, Itai I, Ohgi H, Chiba A. Acta Metall Mater
1995;43:1229.
[90] Kudoh Y, Tokonami M, Miyazaki S, Otsuka K. Acta. Metall 1985;33:2049.
[91] Xu X, Thadhani NN. Scr Mat 2001;44:2477.
[92] Saburi T, Yoshida M, Nenno S. Scr Matell 1984;50:363.
[93] Liu Y, Xie ZL, Humbeeck JV, Delaney L. Acta Mater 1999;47:645.
[94] Li S, Beyerlein IJ, Necker CT, Alexender DJ, Bourke M. Acta Mater
2004;52:4859.
[95] Firstov GS, Van Humbeeck J, Koval YN. Scr Mat 2004;50:243.
[96] Firstov GS, Koval YN, Van Humbeeck J, Portier R, Vermaut P, Ochin P. Mat
Sci and Engr A 2006;438:816.
[97] Oikawa K, Ota T, Gejima F, Ohmori T, Kainuma R, Ishida K, Mat Trans
2001;42:2472.
[98] Kainuma R, Ise M, Jia CC, Ohtani H, Ishida K. Intermetallics 1996;4:151.
[99] Xu Y, Otsuka K, Furubayashi E, Mitose K. Materials Letters 1998;34:14.
[100] Cai W, Otsuka K. Scripta Materialia 1999;41:1311.
[101] Fonda RW, Jones HN, Vandermeer RA, Scripta Mater 1998;39:1031.
[102] Fonda RW, Jones HN. Mat Sci and Engr A 1999;273-275:275.
[103] Wu SK, Wayman CM, Metallography 1987;20:1987.
[104] Wu SK, Wayman CM, Scripta Metall 1987;21:83.

161
[105] Mulder JH, Maas JH, Beyer J. In: Wayman CM, Perkins J. editors. Proceedings
of the International Conference on Martensitic Transformations, Monterey
Institute for Advanced Studies Carmel CA 1993.
[106] Angst DR, Thoma PE, Kao MY. J De Phys 4 1995;5:747.
[107] Besseghini S, Villa E, Tuissi A. Mater Sci Eng A 1999;273-275:390.
[108] Meng XL, Cai W, Wang LM, Zheng YF, Zhao LC, Zhou LM. Scripta Mater
2001;45:1177.
[109] Han XD, Zou WH, Wang R, Zhang Z, Yang DZ, Wu KH, J De Physique IV
1995;5:753.
[110] Meng XL, Zheng YF, Wang Z, Zhao LC. Scripta Mater 2000;42:341.
[111] Thoma PE, Boehm JJ. Mater. Sci. Eng 1999;273-275:385.
[112] Xu Y, Shimizu K, Suzuki Y, Otsuka K, Ueki T, Mitose K. Acta Mater
1997;45:1503.
[113] Bastin GF, Rieck GD. Metall Trans 1974;5:1817.
[114] Cai W, Tanaka S, Otsuka K. Materials Science Forum 2000;327:279.
[115] Khachin VN, Matveeva NM, Sivokha VP, Chernov DB, Yu K. Doklady Akad
Nauk SSSR 1981;257:167.
[116] Otsuka K, Oda K, Ueno Y, Piao M, Ueki T, Horikawa H. Scripta Metall Mater
1993;29:1355.
[117] Segal VM. Mat Sci and Engr A 1995;197:157.
[118] Langdon T. Mat Sci and Engr A 2007;462:3.
[119] Barber RE, Dudo T, Yasskin PB, Hartwig KT. Scripta Mater 2004;51:373.
[120] Hansen N, Huang X, Hughes DA. Mat Sci and Engr A;317:3.
[121] Furukawa M, Iwahashi Y, Horita Z, Nemoto M, Langdon T, Mat Sci and Engr A
1998;257:328.
[122] Niendorf T, Canadinc D, Maier HJ, Karaman I. International Journal of Fatique,
2007, Article in Press
[123] Nishida M, Itai I, Kitamura K, Chiba A, Yamauchi K. J De Phys IV 1995;5:635.
[124] Liu Y, McCormick PG. Acta Metall Mater 1994;42:2401.

162
[125] Karaman I, Yapici GG, Chumlyakov YI, Kireeva IV. Mat Sci and Engr A
2005;410-411:243.
[126] Krishnan M, Singh JB. Acta Mater 2000;48:1325.
[127] McCormick PG, Liu Y. Acta Metall Mater 1994;42:2407
[128] Karaca HE., Karaman I, Chumlyakov YI, Lagoudas DC, Zhang X. Scr Mater
2004;51:261.
[129] Li S, Yamauchi K, Nishida M. Scripta Mater 2003;49:723.
[130] Saburi T, Wayman CM. Acta Metall 1979;27:979
[131] Langdon T, Mat Sci and Engr A 2007;460-461:77.
[132] Meng XL, ZhengYF, Wang Z, Zhao LC. Mater Lett 2000;45:128.
[133] Cui J, Chu YS, Famodu OO, Furuya Y, Hattrick-Simpers J, James RD, Ludwig
A, Thienhaus S, Wuttig M, Zhang Z, Takeuchi I, Nature 2006;5:286.
[134] Tian Q, Wu J. Mat Sci and Engr A 2002;325:249.
[135] Saburi T, Wayman CM, Acta Metall 1979;27:979.
[136] Skrobanek KD. Proc of SPIE 1996;2779:499.
[137] Proft JL, Duerig TW. In: Duerig TW, Melton KN, Stöckel D, Wayman CM.
editors. Butterworth-Heinemann Ltd Boston MA 1990.
[138] Cunningham B, Ashbee KHG. Acta Metallurgica 1977;25:1315

163
VITA
Benat Kockar, daughter of Mehmet Emin Bilcen and Nihal Bilcen and younger
sister of Baran Bilcen, was born in Ankara, Turkey. She graduated from Middle East
Technical University, Department of Metallurgical and Materials Engineering, in May
1998. Following graduation, she continued her studies in the same university to pursue a
graduate degree. She completed her research under the guidance of Prof. Dr. Sakir Bor
and received Master of Science in Metallurgical and Materials Engineering Department
in May of 2001. Benat enrolled in the Mechanical Engineering Department of Texas
A&M University in Fall 2003. She continued her studies at Texas A&M University as a
Doctor of Philosophy candidate in the same department. She held a teaching
assistantship in Fall 2003 and research assistantship in Spring 2004. She has been
sponsored by Hacettepe University in Turkey for her studies in Texas A&M University
for 3 years. During her study, she was an author of two journal publications and more
than five conference presentations. Upon graduation she will be an Assistant Professor in
the Mechanical Engineering Department at Hacettepe University in Turkey. She is
married to Dr. Mustafa K. Kockar and has a son named Barkan E. Kockar.
Her permanent address is:
Mebusevleri Mahallesi
Suslu Sokak, 22/11
Ankara, TURKEY
Email: [email protected]