Embed Size (px)
Citation preview

CHAPTER VI
SERVICE QUALITY, CUSTOMER SATISFACTION AND
PROBLEMS IN INTERNET BANKING
This chapter aims at analyzing the data collected for exploring the service quality
dimensions in IB, the effect of service quality dimensions on customer satisfaction,
exploring the problems encountered during the process of service delivery and the effect
of problems on customer satisfaction. Hence the chapter is divided into three sections.
Section one (6.1) contains service quality dimensions and their effect on customer
satisfaction. Section two (6.2) contains problems and their effect on customer satisfaction
and section three (6.3) presents a discussion of the results from the chapter and their
managerial implications.
6.1 Service Quality Dimensions and their Effect on Customer
Satisfaction
This section presents a brief account of the approach of measuring service quality
used in the study, a description of service quality and customer satisfaction measures,
factor analysis and subsequent labeling of service quality dimensions, relationship and
effect of service quality dimensions on customer satisfaction.
6.1.1 Introduction to Service Quality
The concept of service quality has a journey of number of decades and aroused
attention from the part of researchers owing to lack of consensus in both defining and
measuring it. There has been continued research on the definition and measurement of
service quality concept. Quality represents the degree in which the object (entity) satisfies
user‘s requirements (Batagan et al., 2009). Due to intangible nature of services, quality
plays a pivotal role for the success of service industry. Parasuraman et al., (1985) defined
service quality as the gap between customers‘ expectations of service and their perception
of the service experience. According to Bitner and Hubert (1994) ―service quality is
consumers‘ overall impression of the relative inferiority/superiority of the organization

218
and its services‖. Service quality resides in the ability of the service provider to satisfy the
needs of customers, that is, customer satisfaction (Lewis and Brooms, 1983). Service
quality can be seen as the extent to which a service meets customers‘ needs and
expectations (Lewis and Mitchell, 1994). Traditional service quality refers to the quality
of all non-internet based customer interactions and experiences with companies
(Parasuraman et al., 1988). The advent of internet paved the way for the emergence of the
concept of e-service. E-services have two main characteristics: the service is accessible
with electronic networks and the service is consumed by a person via the internet (Batagan
et al., 2009). Internet Banking satisfies the above two characteristics and therefore service
quality in IB denotes e-service quality. Santos (2003) defined e-service quality ―as the
consumers‘ overall evaluation and judgment of excellence and quality of e-service
offerings in the virtual market place‖. Parasuraman et al., (2005) defined e-service quality
as ―the extent to which a website facilitates efficient and effective shopping, purchasing
and delivery‖.
Two schools of thought concerning the measurement of quality in relation to
services are found in the literature. One is the disconfirmation paradigm of performance-
minus-expectation and the other is performance-based paradigm of a perception only
version service quality. In disconfirmation approach (Gronroos, 1984; Parasuraman et. al.,
1985, 1988) service quality is measured on the basis of disconfirmation between consumer
expectations and perceptions. The first attempt to conceptualize service quality from the
point of view of customers was made by Gronroos and opined that the discrepancy
between expectations and perceptions decides the customers‘ service quality assessment.
Parasuraman et al., (1988) developed SERVQUAL scale and measure service quality as
the difference or disconfirmation between the customers‘ perception (P) and expectations
(E) along 22 variables divided into five dimensions. The problem of measuring
expectation was felt by many researchers in the sense that expectations change from time
to time, and they were also confronted with the problem of when to measure it, either
before or after receiving the service. SERVEQUAL scale as a measure of service quality
has been challenged by several researchers (Babakus and Booler, 1992; Cronin and
Taylor, 1992; Brown et al., 1993; Dabholkar et al., 1996).

219
Babakus and Booler (1992) and Cronin and Taylor (1992) found that perceptions
are a superior predictor of service quality than disconfirmation and subsequently Cronin
and Taylor (1994) developed SERVPERF (SERVice PERFormance) model to measure
service quality based only on customer perceptions. According to this model service
quality is evaluated by perceptions of the customers about the performance of the service
delivered. SERVPERF assumes that customers provide their ratings by automatically
comparing performance perceptions with performance expectations and that measuring
expectations directly as done in SERVQUAL is unnecessary. Many researchers (for e.g.
Jain and Gupta 2004; Andronikidis and Bellou, 2010) proved that SERVPERF is excellent
for measuring service quality and customer satisfaction. Therefore, performance based
paradigm is used in this study to measure service quality and customer satisfaction in the
internet banking context.
There are many measures which determine service quality of internet banking. The
service quality measures used in the study are set out in Table 6.1. A list of 20 statements
related to various service quality dimensions were developed by adding, deleting or
rewording items to ensure suitability for the research context from previous studies
(Nuseir et al, 2010; Khan et al, 2009; Sohail and Shaikh, 2008; Ahangar, 2011; Zarei,
2010) and respondents were asked to rate each statement on a five point likert scale from
‗Strongly agree‘ (5) to ‗Strongly disagree‘ (1).
6.1.1.1 Service Quality Measures
The mean values and standard deviations of service quality measures are given in
Table 6.1.

220
Table 6.1
Service Quality Measures with their Mean and Standard Deviations
Service Quality Measures Item
Acronym
Mean SD
The web site contains useful help facility SQ1 3.87 .753
Website design is attractive SQ2 3.68 .814
Trust in IB services presented on the bank‘s website SQ3 3.96 .612
The bank delivers IB services as promised SQ4 3.84 .756
The website is updated continuously SQ5 3.78 .789
Bank takes care of IB complaints quickly SQ6 3.48 .894
There is quick response from my bank to customer
queries SQ7 3.52 .930
Web pages load promptly SQ8 3.67 .773
Log in to IB website is fast SQ19 3.78 .808
The site provides a confirmation of the service
requested quickly SQ10 3.79 .776
Logout speed of my account is fast SQ11 3.96 .746
Finding what I need is easy and simple SQ12 3.92 .769
Easy options for canceling transactions are provided SQ13 3.48 .880
IB website of my bank always satisfy all my service
needs SQ14 3.67 .858
My personal information is secured and protected in
my bank‘s site SQ15 4.00 .718
The bank will not misuse my personal information SQ16 3.93 .779
Do not feel safe to use IB* SQ17 2.85 1.21
Worried that others may access my IB account * SQ18 3.11 1.19
IB servers may process payments incorrectly * SQ19 3.47 1.20
Banks give no compensation when errors occur* SQ20 3.12 1.19
Source: Primary data. * indicates reverse scale statements. SD– Standard Deviation
Table 6.1 indicates that all the measures except SQ17 are rated by IB users above
three which is the central value in the five point scale. Most of the values are in the

221
neighborhood of four which means that IB users have a favourable response towards the
service quality measures. The standard deviations of service quality measures range from
0.612 to 1.21. In the case of measures from SQ17 to SQ20 which are relating to security
aspects of IB, the standard deviations are comparatively high indicating that IB users‘
opinions are not uniform. This suggests that IB users need much more improved service
quality on these measures.
6.1.2 Customer Satisfaction
Customer satisfaction is a collective outcome of perception, evaluation and
psychological reactions to the consumption experience with a product/service (Yi, 1990).
In the context of IB, customer satisfaction denotes E-customer satisfaction. E-customer
satisfaction is defined as the contentment of the customer with respect to his/her prior
purchasing experience with a given electronic commerce firm (Anderson and Srinivasan,
2003). Researchers have paid much attention to the close relationships between service
quality and customer satisfaction (Parasuraman et al., 1988). Cronin and Taylor (1992, p.
65) pointed out that service quality is an antecedent of consumer satisfaction. High
perceived service quality results in higher customer satisfaction and vice versa. Empirical
studies that examined the relationship between perceived service quality and customer
satisfaction have shown that service quality determines customer satisfaction (Bloemer et
al., 1998; Yavas et al., 2004; Arasli et al., 2005; Culiberg and Rojsek, 2010). Significant
and positive relationship between perceptions of overall service quality and customer
satisfaction is also found in a study conducted by Rod et al., (2009).
The perceived performance based paradigm based on actual performance of a
product or service from customer‘s perspective is used for measuring customer
satisfaction as well. According to Churchill (1987), any single item cannot provide a
perfect representation of the concept and therefore, multi-item measures were used to
capture customer satisfaction of IB services in Kerala. Following Nuseir et al., (2010) who
measured customer satisfaction of e-service quality as a multi-item measure in the context
of commercial banks of Jordan, customer satisfaction is measured as a multi-item measure

222
to indicate the degree of customer contentment with regard to various dimensions of
internet banking service quality. A list of 6 statements as shown in Table 6.2 was used to
measure the level of customer satisfaction in respect of various IB service quality
dimensions and respondents were asked to rate each statement on a five point Likert scale
from ‗Very satisfied‘ (5) to ‗Very dissatisfied‘ (1).
6.1.2.1 Customer Satisfaction Measures
The mean values of customer satisfaction measures given in Table 6.2 indicate that
all the measures are rated above four in the five point scale. It indicates that the
respondents have favourable response towards customer satisfaction measures. Standard
deviations range from 0.643 to 0.751, which indicate that their opinions are almost
uniform.
Table 6.2
Customer Satisfaction Measures with their Mean and Standard Deviations
Customer Satisfaction Measures Item
Acronym
Mean S.D
Fulfillment of service requirements CS1 4.15 .681
Privacy/security of IB transactions CS2 4.14 .699
Reliability and confidence in your bank CS3 4.30 .643
Efficiency of bank‘s website CS4 4.25 .651
Website related to design and ease of use CS5 4.12 .668
Responsiveness of bank CS6 4.06 .751
Source: Primary data. SD – Standard Deviation
6.1.3 Exploratory Factor Analysis
Exploratory Factor Analysis is conducted on 20 measures to validate constructs
that will help analyse the questionnaire responses and explore the service quality
dimensions in IB. The 20 measures are subjected to Principal Component Analysis (PCA)
under the restriction that the Eigen value of each generated factor is more than one.
According to PCA the suitability of data for factor analysis is assessed by computing the
223
correlation matrix (Appendix VI B) and it is found that there is enough correlation
between measures. As shown in Table 6.3, the Kaiser-Meyer-Oklin value reached 0.823,
which is considered meritorious according to Kaiser. The significance level of Bartlett‘s
test of sphericity is extremely small (0.000), supporting the factorability of the correlation
matrix. The communalities of the 20 measures range from 0.570 to 0.830 (Appendix
VII).
Table 6.3
KMO and Bartlett's Test – Service Quality
Kaiser-Meyer-Oklin Measure of Sampling Adequacy. 0.823
Bartlett's Test of Sphericity Approx. Chi-Square 2794.297
Degrees of Freedom 190
Sig. 0.000
As presented in Table 6.4, PCA revealed the presence of seven components that
together explained 70.01 per cent of the variance.
Table 6.4
Total Variance Explained – Service Quality
Component
Initial Eigen Values Rotation Sum of Squared
Loadings
Total Percentage
of variance
Cumulative
Percent
Total Percentage
of variance
Cumulative
Percent
1 5.83 29.18 29.18 2.61 13.05 13.05
2 2.11 10.58 39.76 2.37 11.85 24.91
3 1.50 7.52 47.29 2.02 10.14 35.06
4 1.30 6.53 53.82 1.97 9.84 44.91
5 1.13 5.69 59.52 1.69 8.45 53.36
6 1.09 5.46 64.98 1.68 8.44 61.80
7 1.01 5.03 70.01 1.64 8.20 70.01
Extraction Method: Principal Component Analysis.

224
After reducing the data to seven components, a Varimax rotation is performed to
get a better overview of the seven factors. The Varimax rotated matrix presented in
Table 6.5 revealed the presence of a structure in which all components showed strong
loadings, and all items load to only one component. The rotated factors with their item
constituents and factor loadings are given in Table 6.5
Table 6.5
Rotated Component Matrixa
– Service Quality
Item
Acronym
Component
1 2 3 4 5 6 7
SQ8 .755
SQ9 .773
SQ10 .724
SQ11 .664
SQ17 .757
SQ18 .785
SQ19 .806
SQ20 .665
SQ3 .704
SQ4 .862
SQ5 .718
SQ12 .601
SQ13 .824
SQ14 .726
SQ6 .819
SQ7 .846
SQ1 .868
SQ2 .750
SQ15 .816
SQ16 .837
Extraction Method: Principal Component Analysis.
Rotation Method: Varimax with Kaiser Normalization. aRotation converged in 6 iterations.
225
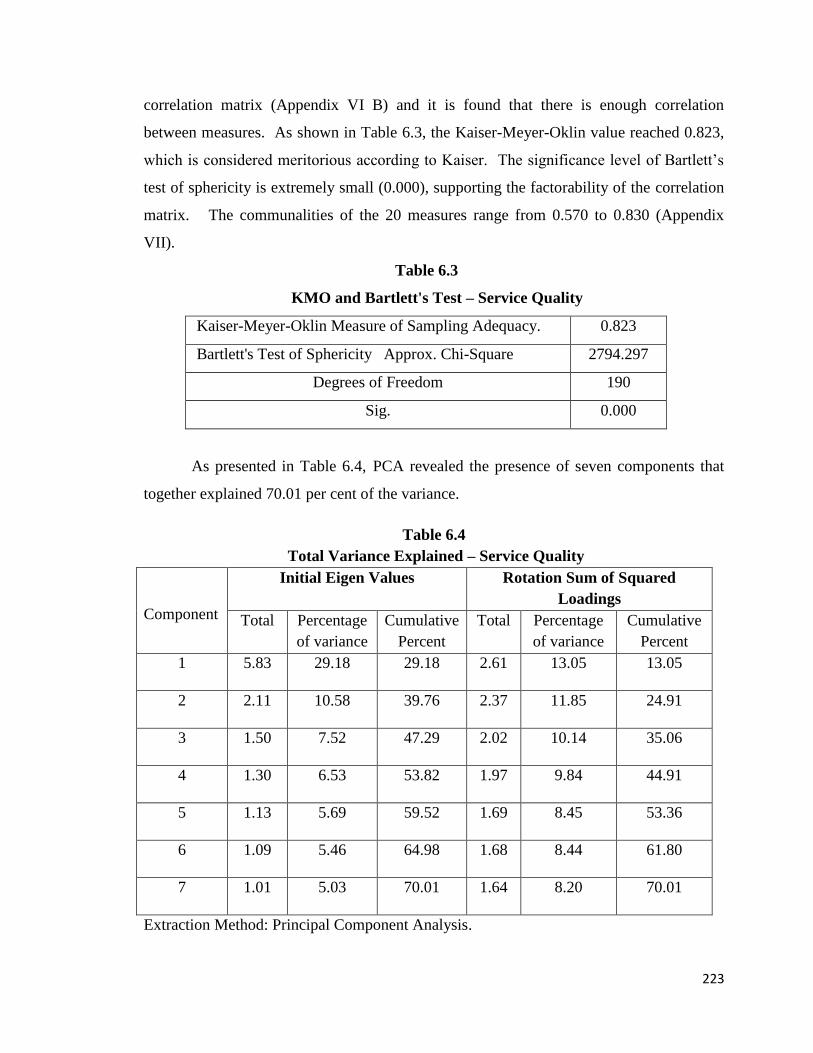
As seen from Table 6.5, all the measures have loadings of more than 0.60 with
most of the loadings above 0.70. Each of the seven factors is suitably labeled based on
the characteristics of its composing measures.
6.1.3.1 Factor 1 – Fulfillment
It is clear from Table 6.5 that measures SQ8, SQ9, SQ10 and SQ11 have loaded
high on factor one and this suggests that factor one is a combination of these four original
measures. The descriptions of these measures are given below.
1. Web pages load promptly (SQ8)
2. Log in to IB website is fast (SQ9)
3. The site provides a confirmation of the service requested quickly (SQ10)
4. Logout speed of my account is fast (SQ11)
Factor 1 explained the maximum variance of 29.18 per cent of the total variance
and had an Eigen value of 5.83. As this factor consists of measures pertaining to
fulfillment of the service requirements of IB users, this factor is labeled as Fulfillment. It
is defined as the extent to which the website meets the requirements of users in terms of
promptness of web page loading, speed of login and logout and confirmation of the
requested service.
6.1.3.2 Factor 2 – Security
This factor is composed of 4 measures SQ17, SQ18, SQ19 and SQ20 and the
descriptions of these measures are given below.
1. Do not feel safe to use IB (SQ17)
2. Worried that others may access my IB account (SQ18)
3. IB servers may process payments incorrectly (SQ19)
4. Banks give no compensation when errors occur (SQ20)
Factor 2 explained 10.58 per cent of the total variance and had an Eigen value of
2.11. This factor is labeled as Security since this factor is a combination of measures

226
relating to security aspect of IB. Security is defined as the extent to which a user believes
that the website is safe from intrusion and that there is very less chance for monetary loss
due to transaction error or server error. As the above measures are negative statements,
the scores are reversed for the purpose of analysis.
6.1.3.3 Factor 3 – Reliability
Three measures SQ3, SQ4 SQ5 are loaded high on this factor and they are the
following.
1. I trust IB services presented on the bank‘s website (SQ3)
2. The bank delivers IB services as promised (SQ4)
3. The website is updated continuously (SQ5)
Factor 3 explained 7.52 per cent of the total variance and had an Eigen value of 1.50.
The measures loaded on this factor are related to reliability of the services provided by
banks and therefore this factor is labeled as Reliability. It is defined as the trust of users
in IB services, delivery of IB services as promised and updating of websites.
6.1.3.4 Factor 4 – Efficiency
This factor is a combination of three measures SQ12, SQ13 and SQ14 and their
descriptions are given below.
1. Finding what I need is easy and simple (SQ12)
2. Easy options for canceling transactions are provided (SQ13)
3. IB website of my bank always satisfy all my service needs (SQ14)
Factor 4 explained 6.53 per cent of the total variance with an Eigen value of 1.30. As
the measures related to efficiency of the bank‘s website are loaded on this factor, this
factor is labeled as Efficiency. It is defined as the ease of using the site and the ability of
banks to satisfy the service needs of customers.

227
6.1.3.5 Factor 5 – Responsiveness
This factor is a combination of two measures SQ6 and SQ7 and they are;
1. Bank takes care of IB complaints quickly (SQ6)
2. There is quick response from my bank to customer queries (SQ7)
Factor 5 explained 5.69 per cent of the total variance with an Eigen value of 1.13.
Since this factor is composed of measures relating to willingness of bank employees to
help customers, this factor is labeled as Responsiveness. It is defined as the ability and
willingness of banks to provide quick response on customer queries and complaints.
6.1.3.6 Factor 6 – Website Attributes
Two measures SQ1 and SQ2 are loaded high on this factor and they are described
below.
1. The web site contains useful help facility (SQ1)
2. Website design is attractive (SQ2)
Factor 6 explained 5.46 per cent of the total variance and had an Eigen value of 1.09.
This factor is labeled as Website attributes since it is composed of measures relating to
bank websites. It is defined as the attractiveness of the website including the provision of
help facility to users.
6.1.3.7 Factor 7 – Privacy
Two measures SQ15 and SQ16 are loaded high on this factor and they are;
1. My personal information is secured and protected in my bank‘s site
(SQ15)
2. The bank will not misuse my personal information (SQ16)

228
They explained 5.03 per cent of the total variance and had the least Eigen value of
1.01. Since the measures are related to confidentiality of customer‘s personal
information, this factor is labeled as Privacy. It is defined as the extent to which a user
believes that his/her personal information is secured and protected.
EFA using Principal Component Analysis applied on six measures of customer
satisfaction indicated that all the measures are loaded on one and only factor with Eigen
value greater than one (KMO=0.847, approx. Chi-square =905.384, df – 15 p< 0.000).
The communalities of the six measures range from 0.544 to 0.671. The factor loadings
range from 0.618 to 0.819 (Appendix VII). The customer satisfaction construct explained
55.87 per cent of the total variance with an Eigen value 3.352.
The Coefficient Alpha of reliability is computed for each factor to see each
dimension‘s internal consistency. Nunnaly (1978) suggests that for any research at its
early stage, a reliable score or alpha that is 0.70 or above is sufficient. As shown in Table
6.6, Cronbach‘s Co-efficient Alpha (α) for all the factors surpassed the required minimum
and ranges from 0.760 to 0.840 and the alpha co-efficient for all the factors taken together
is 0.852. The alpha co-efficient for all the 6 customer satisfaction measures is also
computed and found to be 0.840.

229
Table 6.6
Cronbach’s Alpha for IB Service Quality and Customer Satisfaction Dimensions
IB Service Quality
Dimensions
(Constructs)
Number of
Items
Cronbach’s
Alpha
Cronbach’s
Alpha (all
Dimensions)
Fulfillment 4 0.791
0.852 (20 items)
Security 4 0.776
Reliability 3 0.760
Efficiency 3 0.731
Web site Attributes 2 0.714
Responsiveness 2 0.804
Privacy 2 0.739
Customer Satisfaction 6 0.840
6.1.4 Confirmatory Factor Analysis
The seven dimension model of service quality resulted in EFA is further validated
through Confirmatory Factor Analysis (CFA) using AMOS (Analysis of Moment
Structure).
Besides using the relative/normed Chi-square (Chi-square/ df; df=degrees of
freedom) for the assessment of the model fit, the following additional indices from the
literature are also considered for assessing the model fit. They are CFI, GFI, AGFI, NFI
and RMSEA.
The fit criteria against each index and the 7-dimension model estimated values are
depicted in Table 6.7.

230
Table 6.7
Goodness of Fit Indices – 7-Dimension Model of Service Quality
Goodness of Fit Indices Fit
Criteria
7-Dimension Model
χ2 /df (Normed Chi-square) χ
2 – 312.1, df-147 <5 2.123
GFI (Goodness of Fit Index) >0.90 0.927
AGFI (Adjusted Goodness of Fit Index) >0.80 0.896
CFI (Comparative Fit Index) >0.90 0.939
NFI (Normed Fit Index) >0.90 0.892
RMSEA (Root Mean Square Error of
Approximation)
<0.08 0.053
The model fit indices for the 7-dimension model indicates that the model fits well
in representing the dataset of 20 internet banking service quality measures.
6.1.4.1 Model Estimates
In addition to the model fit indices, standardized regression weights and Critical
Ratio (CR) estimates are also used to evaluate the 7-dimension model. Besides, the
psychometric properties of the model in terms of reliability, convergent validity and
discriminant validity are also evaluated. Reliability and convergent validity of the factors
are estimated by Composite Reliability Co-efficient (CRC) and Average Variance
Extracted (AVE) which are calculated using the formula given in page 155. The model
estimates and psychometric properties of the model are exhibited in Table 6.8

231
Table 6.8
Model Estimates and Psychometric Properties of 7-dimension Model (Service
Quality)
Constructs Indicators SRW CR P
(Sig.level) CRC AVE
Fulfillment
SQ8 0.797 12.081 ***
0.80 0.50 SQ9 0.758 11.745 ***
SQ10 0.606 9.954 ***
SQ11 0.640 *
Security
SQ17 0.597 7.248 ***
0.75 0.44 SQ18 0.823 7.466 ***
SQ19 0.702 9.048 ***
SQ20 0.470 *
Reliability
SQ3 0.689 11.688 ***
0.78 0.54 SQ4 0.800 12.704 ***
SQ5 0.718 *
Efficiency
SQ12 0.697 *
0.68 0.43 SQ13 0.632 9.494 ***
SQ14 0.614 9.270 ***
Responsiveness SQ6 0.916 *
0.82
0.69 SQ7 0.737 11.570 ***
Website
Attributes
SQ1 0.625 8.149 ***
0.71
0.56 SQ2 0.856 *
Privacy SQ15 0.774 *
0.74
0.59 SQ16 0.764 9.448 ***
SRW – Standardized Regression Weight, CR – Critical Ratio
* Unstandardised regression weights assumed as 1
AVE – Average Variance Extracted, CRC – Composite Reliability Co-efficient
***Significant at p < 0.05 level

232
As shown in Table 6.8 all standardized regression weights of indicators (measures)
in the model are greater than 0.50 except SQ 20 (0.47), with most of them close to or
above 0.70. The unstandardised regression weights are significant from the Critical Ratio
(CR) test (CR > ± 1.96, p < 0.05). The CRC of all the constructs are found above the cut
off criteria 0.70 except efficiency construct which is close to 0.70. The AVE of all the
constructs is found above the threshold of 0.50 except security and efficiency constructs.
As the standardized regression weight of SQ 20 is less than 0.50, it is dropped and the
model is re-run. The model fit indices of the final model are χ2 /df = 2.145 (Chi-square –
278.9, df – 130), GFI = 0.932, AGFI = 0.900, CFI = 0.942, NFI = 0.898 and RMSEA =
0.054 all of which indicates good model fit. The final CFA model with standardized
regression weights and correlations between the constructs are depicted in Figure 6.1

233
Figure 6.1
CFA Model of Service Quality Dimensions
234
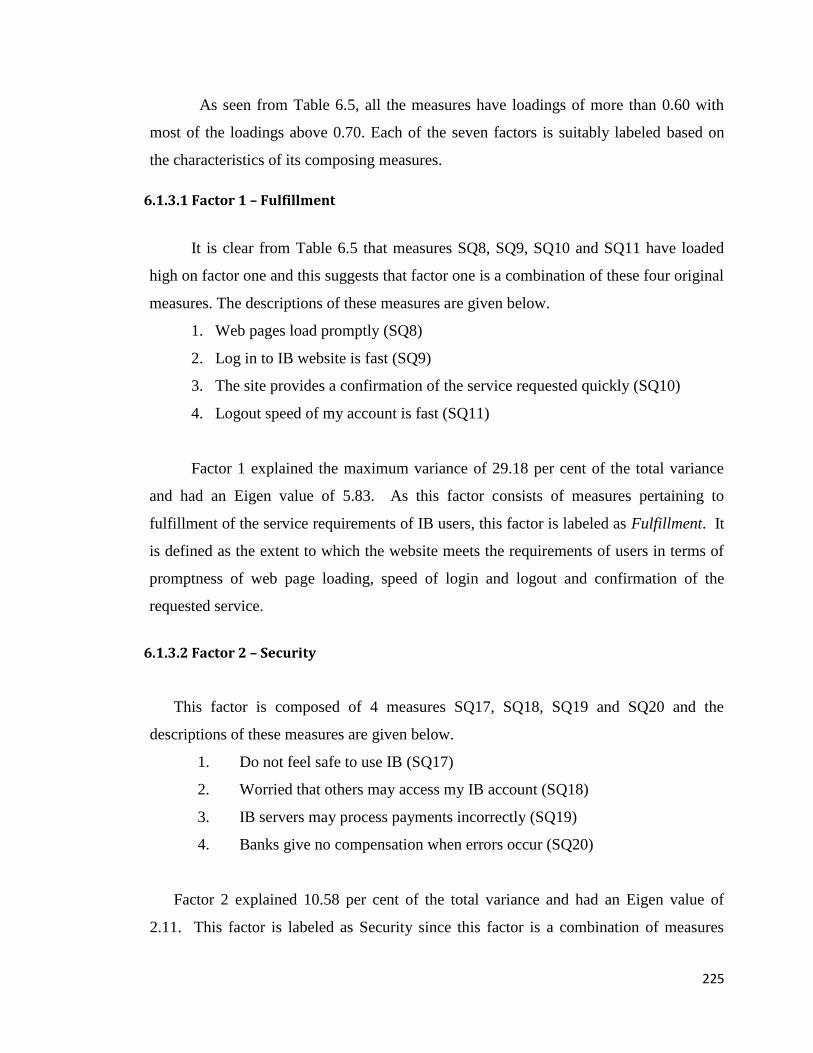
It is clear from Figure 6.1 that all the regression weights are above the cut off
criteria 0.50. The Critical Ratios are found higher than 1.96. The CRC and AVE are
recomputed for the modified model and CRC for security construct remained at 0.75 but
AVE improved from 0.44 to 0.51 and it surpassed the threshold of 0.50. The CRC and
AVE of all other constructs remained unchanged and though the AVE for efficiency
construct is less than 0.50, it is kept in the model due to its content validity.
Standardised factor loadings greater than 0.50, Critical Ratios higher than 1.96 and
AVE close to or above 0.50 indicate convergent validity of the latent constructs used in
the model. Fornell and Larcker (1981) present a method for assessing discriminant validity
of two or more factors (constructs). According to them AVE for each construct should be
greater than its shared variance with any other construct. Shared variance is the square of
the correlation between any two factors. Discriminant validity of the constructs is shown
in Table 6.9
Table 6.9
Discriminant Validity of Service Quality Constructs
Constructs Fulfill-
ment
Secu-
rity
Relia-
bility
Effici
-ency
Respons
-iveness
Website-
Attributes
Privacy
Fulfillment 0.50
Security 0.047 0.51
Reliability 0.287 0.052 0.54
Efficiency 0.425 0.098 0.309 0.43
Responsiveness 0.255 0.013 0.178 0.372 0.69
Website
Attributes
0.235 0.052 0.298 0.153 0.144 0.56
Privacy 0.212 0.049 0.166 0.326 0.193 0.118 0.59
Note: Diagonal values are AVE and off diagonal values are inter-construct squared
correlations

235
It is evident from Table 6.9 that AVE for each construct is larger than their
corresponding squared inter-construct correlations. This indicates high level of
discriminant validity of the constructs used in the model. It means that the measured
items have more in common associated with the latent construct than with other latent
constructs.
In summary, the 7-dimension model of service quality demonstrated good model
fit, adequate reliability, convergent validity and discriminant validity.
The customer satisfaction construct is also validated through CFA. The model fit
indices indicated good model fit. The χ2 /df (Normed Chi-square) χ2
– 18, df-7 is 2.578,
GFI – 0.985, AGFI – 0.956, CFI – 0.986, NFI – 0.977 and RMSEA – 0.063. However,
standardized regression weight of CS5 is 0.46 and for all other measures it is above 0.50.
Therefore CS5 is dropped and the model is re-run. The final uni-dimentional CFA model
of customer satisfaction with standardized regression weights is depicted in Figure 6.2

236
Figure 6.2
Uni-dimensional CFA Model of Customer Satisfaction
The fit indices of the modified model indicated very good model fit. The χ2 /df
(Normed Chi-square) χ2 – 9.6, df-4 is 2.410, GFI – 0.991, AGFI – 0.964, CFI – 0.991, NFI
– 0.986 and RMSEA – 0.060. As shown in Figure 6.2 all the standardized regression

237
weights are above 0.50. The unstandardised regression weights are significant from the
Critical Ratio (CR) test (CR > ± 1.96, p < 0.05). The CRC of customer satisfaction
construct is calculated as 0.82 and AVE 0.49 which is very close to 0.50. In short, the uni-
dimensional model of customer satisfaction demonstrated good model fit, adequate
reliability and convergent validity
6.1.5 Relationship between Service Quality Dimensions and Customer
Satisfaction
The relationship between service quality dimensions and customer satisfaction is
examined using correlation analysis and regression analysis. The construct score is
calculated by adding scores of individual measures in the construct which was validated
through CFA. For example, scores of measures SQ8, SQ9, SQ10 and SQ11 are added to
calculate the construct score for Fulfillment. Similarly the scores of measures CS1, CS2,
CS3, CS4 and CS6 are added to calculate the construct score of Customer Satisfaction.
6.1.5.1 Correlation Analysis
The correlation coefficients between each dimensions of service quality
(independent variables) and customer satisfaction (dependent variable) are shown in
Table 6.10. Various dimensions of service quality are the independent variables (X1…..
X7) and the dependent variable is Customer Satisfaction (Y). The independent variables
are Fulfillment (X1) Security (X2) Reliability (X3) Efficiency (X4) Website attributes (X5)
Responsiveness (X6) Privacy (X7). The dependent variable (Y) is composed of customer
satisfaction relating to Fulfillment (CS1), Privacy/Security (CS2), Reliability (CS3),
Efficiency (CS4), and Responsiveness (CS6).

238
Table 6.10
Correlation Analysis: Service Quality Dimensions and Customer Satisfaction
CS1 CS2 CS3 CS4 CS6 Y
X1 .390*
(.000)
.354*
(.000)
.337*
(.000)
.384*
(.000)
.299*
(.000)
.467*
(.000)
X2 .196*
(.000)
.206*
(.000)
.229*
(.000
.203*
(.000)
.290*
(.000)
.308*
(.000)
X3 .316*
(.000)
.337*
(.000)
.288*
(.000
.288*
(.000)
.314*
(.000)
.412*
(.000)
X4 .382*
(.000)
283*
(.000)
.308*
(.000)
.339*
(.000)
.313*
(.000)
.445*
(.000)
X5 .455*
(.000)
.237*
(.000)
199*
(.000)
.198*
(.000)
.192*
(.000)
.308*
(.000)
X6 409*
(.000)
293*
(.000)
.451*
(.000)
.325*
(.000)
.340*
(.000)
.472*
(.000)
X7 260*
(.000)
.406*
(.000)
.375*
(.000)
.287*
(.000)
.533*
(.000)
483*
(.000)
*Correlation is significant at 0.05 level (2 tailed).
Figures in parentheses indicate p value
It is seen from Table 6.10 that there is positive correlation between each
independent variable (X1….X7) and dependent variable (Y) and also between each
independent variable and each of the measures of dependent variable (CS1….. CS4 and
CS6). The correlations range from 0.192 to 0.533 and the correlations are significant at 5
per cent significance level in all cases.
The conclusion emerging from the above analysis is that there is positive
correlation between various dimensions of service quality and customer satisfaction.
6.1.5.2 Regression Analysis and Hypotheses Testing
In order to understand the effect of IB service quality dimensions on customer
satisfaction the following hypothesis is formulated and tested.

239
H0: Service quality dimensions in internet banking (fulfillment, security, reliability,
efficiency, website attributes, responsiveness and privacy) have no significant effect on
customer satisfaction.
The above hypothesis is tested using multiple regression analysis. Multiple
regression analysis examined the effect of seven dimensions of IB service quality on
customer satisfaction. Multicollinearity, the inter-correlation of independent variables, is
analysed through Tolerance and Variance Inflation Factor (VIF). As shown in Table 6.13,
Tolerance values range from 0.710 to 0.953 and VIF values range from 1.049 to 1.408
(model 5) and therefore multicollinearity is not found in this analysis. The Durbin-Watson
statistic is 1.697 which indicates independence of observations.
The output of the multiple regression analysis is used to test the hypothesis. The
regression model is formed using step-wise method. Table 6.11 shows the model summary
of the step-wise regression analysis.
Table 6.11
Model Summary of Regression Analysis – Service Quality and Customer
Satisfaction
Model R R
Square
Adjusted
R Square
Std. Error of
the Estimate Durbin-Watson
1 .515a .265 .263 .41053
1.697
2 .620b .384 .381 .37638
3 .657c .432 .427 .36185
4 .684d .468 .462 .35068
5 .699e .488 .481 .34435
a. Predictors: (Constant), Privacy
b. Predictors: (Constant), Privacy, Responsiveness
c. Predictors: (Constant), Privacy, Responsiveness, Fulfillment
d. Predictors: (Constant), Privacy, Responsiveness, Fulfillment, Security
e. Predictors: (Constant), Privacy, Responsiveness, Fulfillment, Security, Reliability
f. Dependent Variable: Customer satisfaction

240
Table 6.11 reveals that 26.3 per cent of the variations (model 1) in customer
satisfaction are explained by Privacy dimension of service quality alone. It indicates that
the most prominent independent variable which influences the dependent variable
(customer satisfaction) is ‗Privacy‘. The ANOVA table showing the regression model fit
is given in Table 6.12.
Table 6.12
ANOVA Table Showing the Regression Model Fit – Service Quality and
Customer Satisfaction
Model Sum of
Squares df
Mean
Square F Sig.
1
Regression
Residual
Total
22.908
63.538
86.446
1
377
378
22.908
.169 135.924* .000a
2
Regression
Residual
Total
33.181
53.265
86.446
2
376
378
16.590
.142 117.112* .000b
3
Regression
Residual
Total
37.346
49,100
86.446
3
375
378
12.449
.131 95.076* .000c
4
Regression
Residual
Total
40.454
45.992
86.446
4
374
378
10.113
.123 82.241* .000d
5
Regression
Residual
Total
42.216
42.229
86.446
5
373
378
8.443
.119 71.204* .000e
*Significance at 5 per cent level

241
a. Predictors: (Constant), Privacy
b. Predictors: (Constant), Privacy, Responsiveness
c. Predictors: (Constant), Privacy, Responsiveness, Fulfillment
d. Predictors: (Constant), Privacy, Responsiveness, Fulfillment, Security
e. Predictors: (Constant), Privacy, Responsiveness, Fulfillment, Security, Reliability
f. Dependent Variable: Customer satisfaction
The significance value for model 1 in the ANOVA table 0.000 is significant at 5
per cent significance level. Model 2 incorporates Responsiveness along with Privacy and
it is found that the adjusted R
2 value is increased from 26.3 per cent to 38.1 per cent.
Therefore it is clear that Privacy and Responsiveness together account for 38.1 per cent
variations in customer satisfaction. This model is significant at 5 per cent significance
level. The third model takes into account Fulfillment along with Privacy and
Responsiveness and these three dimensions together account for 42.7 per cent variations in
customer satisfaction and the model is significant at 5 per cent significance level.
Similarly when other independent variables Security and Reliability are included in the
model, the percentage of variance explained by five independent variables, such as
Privacy, Responsiveness, Fulfillment, Security and Reliability, comes up to 48.1 per cent.
All the models are significant at 5 per cent significance level.
The significance of various dimensions of service quality to customer satisfaction
is shown in Table 6.13.

242
Table 6.13
Coefficients – Significance of Service Quality Dimensions
Model Dimensions Beta t Sig Tolerance VIF
1
(Constant)
Privacy
.515
20.790*
11.659*
.000
.000
1.000
1.000
2
(Constant)
Privacy
Responsiveness
.387
.368
18.199*
8.977*
8.516*
.000
.000
.000
.880
.880
1.137
1.137
3
(Constant)
Privacy
Responsiveness
Fulfillment
.319
.292
.249
13.440*
7.387*
6.701*
5.640*
.000
.000
.000
.000
.811
.797
.776
1.233
1.255
1.288
4
(Constant)
Privacy
Responsiveness
Fulfillment
Security
.304
.287
.222
.193
12.103*
7.237*
6.797*
5.140*
5.027*
.000
.000
.000
.000
.000
.807
.797
.764
.960
1.240
1.255
1.309
1.041
5
(Constant)
Privacy
Responsiveness
Fulfillment
Security
Reliability
.278
.260
.177
.181
.163
9.850*
6.662*
6.167*
4.024*
4.772*
3.855*
.000
.000
.000
.000
.000
.000
.786
.774
.710
.953
.764
1.272
1.292
1.408
1.049
1.310
*Significance at 5 per cent level

243
Privacy dimension has the highest beta coefficients followed by Responsiveness,
Security, Fulfillment and Reliability. Out of the predictor variables the β coefficients of
all the dimensions are found to be statistically significant (p <0.05) and hence the null
hypothesis is rejected and the alternative hypothesis that Service quality dimensions in
internet banking (Privacy, Responsiveness, Security, Reliability and Fulfillment) have
significant effect on customer satisfaction is accepted.
Efficiency and Website attribute dimensions are excluded from the step-wise
regression model and they are not significant at 5 per cent significance level (Efficiency
p=0.056, Website attribute p=0.410). Therefore, the null hypothesis is accepted for
efficiency and website attribute dimensions of service quality and concluded that the effect
of these two dimensions on customer satisfaction is not statistically established.
The findings indicate that service quality dimensions Privacy, Responsiveness,
Security, Fulfillment and Reliability have a positive and significant effect on customer
satisfaction and they are the predictors of customer satisfaction.
6.2 Problems and their Effect on Customer Satisfaction
This section presents the items identified for measuring problems associated with
the use of IB, the methodology used for data analysis, factor analysis and subsequent
labeling of problems, relationship and effect of problems on customer satisfaction.
6.2.1 Problems Encountered During the Process of Service Delivery
IB users are most likely to face various problems because banking services are
availed through the medium of internet and there is no face to face contact and
communication between customers and banking personnel. Following the
recommendation of Ombati et al., (2010) that a study should be carried out to establish the
challenges encountered by the customers in the process of using electronic banking in the
service delivery, an attempt is made to identify the problems encountered by customers in

244
the process of using IB. In order to identify the problems associated with the use of IB, 27
probable problems were identified through literature review and discussions with officials
handling IB in various banks. Respondents were asked to indicate the frequency of each
of the problems faced by them on a five point scale as ‗Always‘ (5), ‗Often‘ (4),
‗Sometimes‘ (3), ‗Rarely‘ (2) and ‗Never‘ (1). The scores assigned to each response are
shown in brackets. Table 6.14 shows the list of problems along with their respective item
acronyms.

245
Table 6.14
Problems Encountered During the Process of Service Delivery
Item
Acronym
Problems
Pm-1 Money lost without my knowledge
Pm-2 Transaction failed but amount is deducted
Pm-3 For a single transaction amount is deducted more than once
Pm-4 Refund amount for cancellation of tickets etc. not received
Pm-5 Money not received into my account but deducted from sender‘s account
Pm-6 Low speed
Pm-7 Connection lost while processing transactions
Pm-8 No access to server/IB site not working
Pm-9 Account temporarily locked by bank
Pm-10 My personal information leaked out
Pm-11 Lack of training and guidance on the use of IB
Pm-12 Inadequate support from bank employees
Pm-13 Poor response from bank on complaints
Pm-14 No/delayed support from complaints redressal agencies (Ombudsman etc.)
Pm-15 Unable to login/operate the account
Pm-16 Transaction details missing
Pm-17 The service I want is not available through IB
Pm-18 The option I want is not working
Pm-19 Non delivery of cheque book/draft/passbook/ATM card etc. ordered online
Pm-20 Non delivery of tickets booked online
Pm-21 Unsuccessful transaction but service charges deducted
Pm-22 Lengthy procedure to complete transactions
Pm-23 Occurrence of transaction errors
Pm-24 Problem of forgetting username/password
Pm-25 Unable to get One Time Password (OTP)
Pm-26 Receipt of unknown e-mails that ask for ID and passwords
Pm-27 Delay in getting new password in place of password forgotten
Source: compiled by the researcher

246
6.2.2 Methodology of Analysis
To achieve the objective of identifying the problems encountered during the
process of service delivery and their influence on customer satisfaction, the following
steps are used.
Step 1: The mean values of each of the 27 problems are calculated and these mean values
are compared with the standards set out on the basis of Q1, Q2 and Q3 values calculated
using the formula mentioned in section 5.13, Precautions for the safe use of IB –
Methodology of data analysis (page 172). The standards used for comparing mean values
are given in Table 6.15.
Table 6.15
The Standards Used for Comparing the Mean Values - Problems
Mean Values Collective Opinion of
Respondents
Significantly Below Q1 (1.5) Never
Significantly not different from Q1 (1.5) or significantly
above Q1 but significantly below Q2 (3.0)
Rarely
Significantly not different from Q2 (3.0) Sometimes
Significantly above Q2 (3.0) but significantly below Q3
(4.5)
Often
Significantly not different from Q3(4.5) or significantly
Above Q3
Always
Source: Compiled by the researcher
One sample t-test with test value equal to 1.5 is used to see if the mean values are
significantly different from 1.5 (two tailed). As per the standards set out in Table 6.15,
those problems whose mean values are found significantly below 1.5 are considered as
problems ‗Never‘ faced by IB users. In other words, these may be considered as frivolous
problems which may not call for serious attention from the part of IB service providers.

247
Those problems whose mean values are not significantly different from 1.5 or
significantly above 1.5 but significantly below 3.0 are considered as problems ‗Rarely‘
faced by IB users. However, these problems may not be considered as frivolous problems
but requires attention from the part of IB service providers. Though the frequency of
occurrence of these problems is rare, efforts to further minimize their occurrence may
result in increased customer satisfaction. As the calculated mean values range from 1.2 to
2.61 (Table 6.16), the occurrence of problems associated with the use of IB fall in either of
the above two frequencies.
Step 2: Those problems whose mean values are significantly below 1.5 are dropped from
further analysis. Factor analysis is used on the remaining problems associated with the
use of IB to reduce them into fewer factors for the purpose of further analysis. The
construct score is calculated by adding scores of individual measures in the construct.
Step 3: In order to understand whether the problems associated with the use of IB have
any effect on customer satisfaction multiple regression analysis is used with customer
satisfaction as dependent variable and problems as independent variable.
6.2.3 Comparison of Mean Values with the Standards
The mean scores of each of the 27 problems along with the results of one sample t-
test are displayed in Table 6.16.

248
Table 6.16
Mean Values of Problems Encountered During Service Delivery
Item
Acronym
Mean
values
t df Sig. (2
tailed)
Mean difference
(Test Value = 1.5)
Pm - 1 1.20 -11.426* 404 .000 -.300
Pm - 2 1.68 4.193* 404 .000 .179
Pm – 3 1.31 -6.048* 404 .000 -.194
Pm – 4 1.36 -3.606* 402 .000 -.140
Pm – 5 1.34 -4.693* 404 .000 -.164
Pm – 6 2.51 21.402* 404 .000 1.011
Pm – 7 2.61 22.666* 404 .000 1.107
Pm – 8 2.39 18.272* 404 .000 .888
Pm – 9 1.54 1.044 404 .148 .043
Pm – 10 1.16 -13.598* 402 .000 -.339
Pm – 11 1.76 5.529* 402 .000 .262
Pm – 12 1.90 7.979* 404 .000 .396
Pm – 13 1.90 8.135* 404 .000 .401
Pm – 14 1.55 1.134 402 .128 .051
Pm – 15 1.84 8.221* 404 .000 .344
Pm - 16 1.35 -4.684* 404 .000 -.154
Pm – 17 1.82 7.147* 404 .000 .317
Pm – 18 1.74 5.497* 404 .000 .241
Pm – 19 1.46 -.966 401 .167 -.040
Pm – 20 1.30 -5.740* 401 .000 -.197
Pm – 21 1.47 -.764 404 .222 -.031
Pm – 22 1.84 7.337* 404 .000 .337
Pm – 23 1.87 8.348* 404 .000 .374
Pm – 24 2.14 12.056* 404 .000 .643
Pm – 25 1.82 6.070* 400 .000 .320
Pm – 26 1.82 5.714* 404 .000 .317
Pm - 27 1.83 6.249* 401 .000 .328
Source: Primary data *Significance at 5 per cent level

249
The mean scores range from 1.2 to 2.61. The mean score is lowest for Pm-1
(Money lost without my knowledge, mean 1.20) and highest for Pm-7 (Connection lost
while processing transactions, mean 2.61).
One sample t-test with test value equal to 1.5 revealed that the mean values of the
following problems are significantly below 1.5 (p<0.05). Hence these may be considered
as frivolous problems which may not call for serious attention from the part of IB service
providers. These problems are, therefore, dropped from further analysis.
1. Money lost without my knowledge (Pm-1)
2. For a single transaction amount is deducted more than once (Pm-3)
3. Refund amount for cancellation of tickets etc. not received (Pm-4)
4. Money not received into my account but deducted from sender‘s account
(Pm-5)
5. My personal information leaked out (Pm-10)
6. Transaction details missing (Pm-16)
7. Non-delivery of tickets booked online(Pm-20)
One sample t-test with test value equal to 1.5 revealed that the mean values of the
following problems are not significantly different from 1.5 (p>0.05). Though the
occurrence of these problems is rare, these may not be considered as frivolous problems
but requires attention from the part of IB service providers.
1. Account temporarily locked by bank (Pm-9)
2. No/delayed support from complaints redressal agencies (Pm-14)
3. Non-delivery of cheque book/draft/passbook/ATM card etc. ordered online (Pm-
19)
4. Unsuccessful transaction but service charges deducted (Pm-21)
One sample t-test with test value equal to 1.5 revealed that the mean values of the
following problems are significantly above 1.5 (p<0.05). These problems require
attention from the part of IB service providers.

250
1. Transaction failed but amount is deducted(Pm-2)
2. Low speed (Pm-6)
3. Connection lost while processing transactions (Pm-7)
4. No access to server/IB site not working (Pm-8)
5. Lack of training and guidance on the use of IB (Pm-11)
6. Inadequate support from bank employees (Pm-12)
7. Poor response from bank on complaints (Pm-13)
8. Unable to login/operate the account (Pm-15)
9. The service I want is not available through IB (Pm-17)
10. The option I want is not working (Pm-18)
11. Lengthy procedure to complete transactions (Pm-22)
12. Occurrence of transaction errors (Pm-23)
13. Problem of forgetting username/password (Pm-24)
14. Unable to get One Time Password (OTP) (Pm-25)
15. Receipt of unknown e-mails that ask for ID and passwords (Pm-26)
16. Delay in getting new password in place of password forgotten (Pm-27)
6.2.4 Exploratory Factor Analysis
Exploratory Factor Analysis is used in order to reduce the 20 problems (whose
mean values are either significantly not different from 1.5 or significantly above 1.5)
associated with the use of IB into fewer factors, which explain much of the original data
more economically. To check whether the data is suitable for factor analysis, the following
steps are taken.
1. The correlation matrices are computed and given in Appendix VI C and it is
found that there is enough correlation between measures to go ahead for factor
analysis.
2. Kaiser-Meyer-Olkin Measure of Sampling Adequacy is 0.887 as shown in
Table 6.17. According to Kaiser, a measure greater than 0.80 is meritorious
(Darren & Paul, 2011), and therefore the sample is big enough to do factor
analysis.

251
3. The significance value of Bartlett‘s test of sphericity 0.000 is less than 0.05
and therefore the data do not produce an identity matrix and are thus
approximately multivariate normal and acceptable for factor analysis.
Table 6.17
KMO and Bartlett's Test - Problems Kaiser-Meyer-Olkin Measure of Sampling
Adequacy
.887
Bartlett's Test of
Sphericity
Approx. Chi-Square 2814.713
df 190
Sig. .000
After the standards indicate that the data is suitable for factor analysis, Principal
Components Analysis is employed for extracting the factors, their Eigen values and the
cumulative percentage of variance. It is seen from Table 6.18 that four factors with
Eigen values greater than one is extracted which together account for 54.17 per cent of
the total variance. After the four factors are extracted, the communalities of the 20
original variables range from 0.443 to 0.736 (Appendix VII) which indicate that the
variance of the original values is captured fairly well by these four factors.

252
Table 6.18
Total Variance Explained - Problems
Initial Eigen values Rotation sum of squared
loadings
Component Total % of
variance
Cumulative
%
Total % of
variance
Cumulative
%
1 6.564 32.822 32.822 3.044 15.222 15.222
2 1.673 8.364 41.186 2.853 14.263 29.485
3 1.448 7.240 48.426 2.717 13.587 43.071
4 1.149 5.743 54.169 2.219 11.097 54.169
Extraction Method: Principal Component Analysis.
Since the extraction technique suggested that there are four factors, the extracted
factors are then rotated using the widely used Varimax rotation method and the rotated
factor matrix is exhibited in Table 6.19. The rotated factor matrix gives the loadings of
each measure on each of the extracted factors. The factor loadings range from 0.460 to
0.818 with most of the factor loadings greater than 0.60.
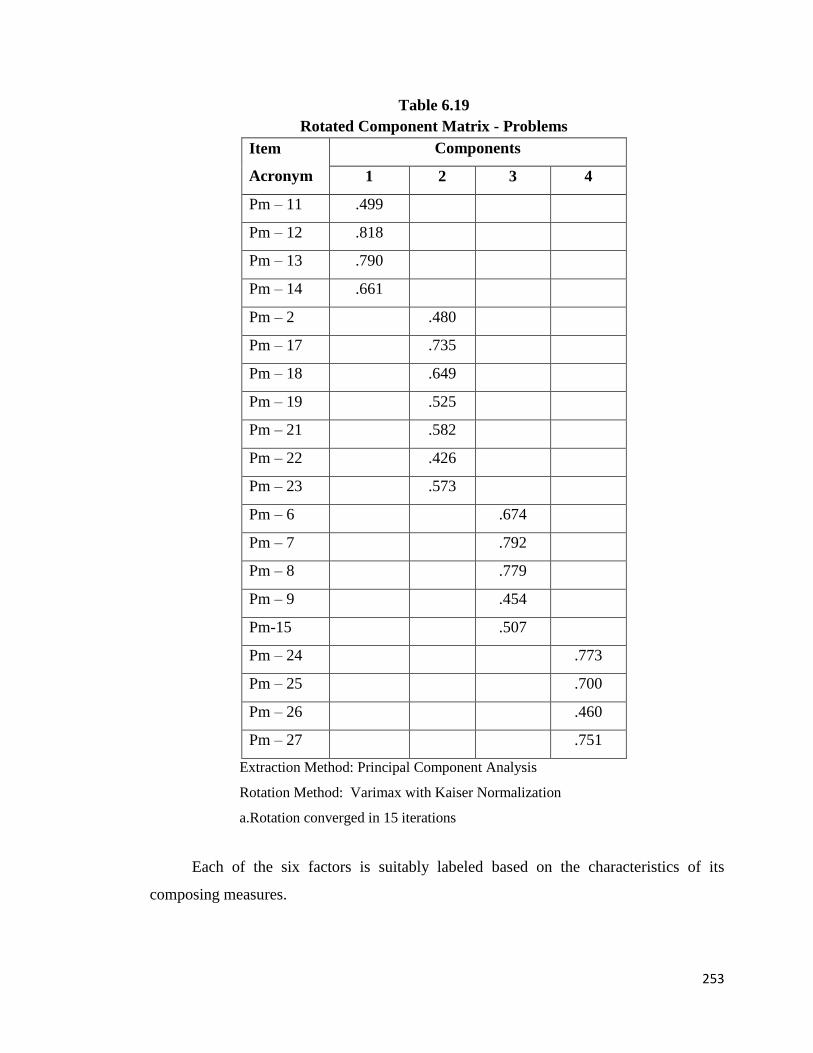
253
Table 6.19
Rotated Component Matrix - Problems
Item
Acronym
Components
1 2 3 4
Pm – 11 .499
Pm – 12 .818
Pm – 13 .790
Pm – 14 .661
Pm – 2 .480
Pm – 17 .735
Pm – 18 .649
Pm – 19 .525
Pm – 21 .582
Pm – 22 .426
Pm – 23 .573
Pm – 6 .674
Pm – 7 .792
Pm – 8 .779
Pm – 9 .454
Pm-15 .507
Pm – 24 .773
Pm – 25 .700
Pm – 26 .460
Pm – 27 .751
Extraction Method: Principal Component Analysis
Rotation Method: Varimax with Kaiser Normalization
a.Rotation converged in 15 iterations
Each of the six factors is suitably labeled based on the characteristics of its
composing measures.

254
6.2.4.1 Factor 1 – Customer Support Problems
This factor is composed of the following 4 problems.
1. Lack of training and guidance on the use of IB (Pm-11)
2. Inadequate support from bank employees (Pm-12)
3. Poor response from bank on complaints (Pm-13)
4. No/delayed support from complaints redressal agencies (Pm-14)
Factor 1 explained 32.82 per cent of the total variance and had an Eigen value of
6.564. This factor is labeled as Customer support problems since this factor is a
combination of measures relating to customer support aspect of IB from the service
providers and grievance redressal agencies like banking ombudsman.
6.2.4.2 Factor 2 –Service Problems
Factor 2 consists of the following 7 problems.
1. Transaction failed but amount is deducted (Pm-2)
2. The service I want is not available through IB (Pm-17)
3. The option I want is not working (Pm-18)
4. Non delivery of cheque book/draft/passbook/ATM card etc. ordered online (Pm-19)
5. Unsuccessful transaction but service charges deducted (Pm-21)
6. Lengthy procedure to complete transactions (Pm-22)
7. Occurrence of transaction errors (Pm-23)
Factor 2 explained the maximum variance of 8.36 per cent of the total variance and
had an Eigen value of 1.67. This factor is labeled as Service problems because this factor
is composed of problems relating to IB service aspects.
6.2.4.3 Factor 3 – Web based Problems
Five measures are loaded on this factor 3. They are;
1. Low speed (Pm-6)
2. Connection lost while processing transactions (Pm-7)

255
3. No access to server/IB site not working (Pm-8)
4. Account temporarily locked by bank (Pm-9)
5. Unable to login/operate the account (Pm-15)
Factor 3 explained 7.24 per cent of the total variance and had an Eigen value of
1.448. This factor is labeled as Web based problems because this factor consists of
problems relating to the website of banks.
6.2.4.4 Factor 4 – Password Problems
This factor is a combination of the following four measures.
1. Problem of forgetting username/password (Pm-24)
2. Unable to get One Time Password (Pm-25)
3. Receipt of unknown e-mails that ask for ID and passwords (Pm-26)
4. Delay in getting new password in place of password forgotten (Pm-27)
This factor explained 5.74 per cent of the total variance with an Eigen value of
1.149. This factor is labeled as Password problems because problems relating to
password are loaded on this factor.
The Coefficient Alpha of reliability is computed for each factor to see the internal
consistency of each factor. As shown in Table 6.20, Cronbach‘s Co-efficient Alphas (α)
for all the factors are above 0.70 and range from 0.701 to 0.799. The Alpha Co-efficient
for all the factors taken together is 0.888.

256
Table 6.20
Cronbach’s Co-efficent Alpha – Problems
Factors (Constructs) Number
of Items
Cronbach’s
Alpha
Cronbach’s
Alpha (All
Factors)
Customer support problems 4 0.792
0.888 (20
items)
Service problems 7 0.799
Web based problems 5 0.743
Password problems 4 0.701
The construct score is calculated by adding scores of individual measures in the
construct. The percentage scores ({Construct score ÷ Maximum possible score} x 100) of
each construct are calculated and the mean of the percentage scores is shown in Figure 6.3
Figure 6.3
Mean of Percentage Scores of Problem Constructs
35.55
33.96
43.58
38.08
0 10 20 30 40 50
Customer support problems
Service problems
Web based problems
Password problems
Mean Percentage Score (%)

257
The mean percentage score is highest for web based problems (43.58 per cent)
followed by password problems (38.08 per cent), customer support problems (35.55 per
cent) and service problems (33.96 per cent).
The conclusions emerging from the above analysis is that, four problems are
associated with the use of IB as perceived by IB users in Kerala. They are web based
problems, password problems, customer support problems and service problems. But IB
users perceive these problems on a lesser gravity.
6.2.5 Effect of Problems on Customer Satisfaction
The problems associated with the use of IB identified through factor analysis are
used as independent variables to understand their effect on customer satisfaction, the
dependent variable. The following null hypothesis is formulated for this purpose.
H0: Problems encountered during internet banking service delivery (web based problems,
password problems, customer support problems and service problems) have no significant
effect on customer satisfaction.
6.2.5.1 Correlation Analysis
Before testing the above hypothesis, it is felt necessary to see the correlation
between dependent variable (Y) and independent variables (X1, X2, X3, X4) and also
between each of the components of dependent variables such as CS1, CS2, CS3, CS4, CS6
and independent variables. The dependent variable, customer satisfaction (Y) and the
measures of customer satisfaction (CS1 ……CS4 and CS6) have been discussed in section
6.1.2.1 (page 222) and validated using CFA (page 236). The independent variables are
Customer Support Problems (X1), Service Problems (X2), Web based Problems (X3) and
Password Problems (X4). The correlations between the variables are shown in Table 6.21.

258
Table 6.21
Correlation Analysis: Problems and Customer Satisfaction
CS1 CS2 CS3 CS4 CS6 Y
X1 -.315*
(.000)
.349*
(.000)
-.374*
(.000)
-.352*
(.000)
-.294*
(.000)
-.444*
(.000)
X2 -.206*
(.000)
-.238*
(.000)
-.277*
(.000
-.316*
(.000)
-.286*
(.000)
-.377*
(.000)
X3 .-234*
(.000)
.-236*
(.000)
.-305*
(.000
.-253*
(.000)
.-194*
(.000)
.-331*
(.000)
X4 .-173*
(.000)
.-171*
(.000)
.-163*
(.000)
.-232*
(.000)
.-140*
(.000)
.-232*
(.000)
*Correlation is significant at 0.05 level (2 tailed).
Figures in parentheses indicate p value
The correlations range from -0.140 to -0.444 and the correlations are significant at 5 per
cent significance level in all cases.
The conclusion emerging from the above analysis is that there is negative
correlation between problems associated with the use of IB and customer satisfaction.
6.2.5.2 Regression Analysis and Hypotheses Testing
In order to understand the variation in customer satisfaction based on problems
associated with the use of IB, multiple regression analysis is used. The output of the
multiple regression analysis is used to test the hypothesis. The regression model is formed
using step-wise method. Table 6.22 shows the model summary of the step-wise regression
analysis.

259
Table 6.22
Model Summary of Regression Analysis – Problems and Customer Satisfaction
Model R R
Square
Adjusted
R Square
Std. Error of
the Estimate
Durbin-Watson
1 .442a .196 .194 .45891
2.01 2 .469b .220 .216 .45248
a. Predictors: (Constant), Customer support problems
b. Predictors: (Constant), Customer support problems, Web based problems
Dependent variable – Customer Satisfaction
Table 6.22 reveals that 19.4 per cent of the variation (model 1) in customer
satisfaction is explained by customer support problems alone. It indicates that the most
prominent independent variable which influences the dependent variable (customer
satisfaction) is customer support problems. The ANOVA table showing the regression
model fit is given in Table 6.23.
Table 6.23
ANOVA Table Showing the Regression Model Fit –Problems and Customer
Satisfaction
Model Sum of
Squares df
Mean
Square F Sig.
1
Regression
Residual
Total
20.375
83.819
104.94
1
398
399
20.375
.211
96.746*
.000a
2
Regression
Residual
Total
22.193
81.281
104.194
2
397
399
11.457
.205
55.958*
.000b
*Significance at 5 per cent level
a. Predictors: (Constant), Customer support problems
b. Predictors: (Constant), Customer support problems, Web based problems
Dependent variable: Customer satisfaction

260
The significance value for model 1 in the ANOVA table 0.000 is significant at 5
per cent significance level. Model 2 incorporates web based problems along with customer
support problems and it is found that web based problems have a nominal impact on the
R2 and the adjusted
R
2 value is increased from 19.4 per cent to only 21.6 per cent. The
model is significant at 5 per cent significance level. Multicollinearity is examined through
Tolerance and Variance Inflation Factor (VIF). As shown in Table 6.24 Tolerance values
and VIF values are .817, 1.224 respectively for both independent variables and therefore
the presence of multicollinearity is not found. The Durbin-Watson statistic 2.01 indicates
independence of observations.
The significance of customer support problems and web based problems to
customer satisfaction is shown in Table 6.24.
Table 6.24
Coefficients – Significance of Problems to Customer Satisfaction
Model Dimensions Beta t Sig Tolerance VIF
1
(Constant)
Customer support problems
-.442
79.851*
-9.836*
.000
.000
1.000
1.000
2
(Constant)
Customer support problems
Web based problems
-.368
-.173
60.164*
-7.508*
-3.521*
.000
.000
.000
.817
.817
1.224
1.224
* Significance at 5 per cent level
Customer support problems have the highest beta coefficient (β = -.368) than web
based problems (β = -.173). It indicates that customer support problems have greater
negative effect on customer satisfaction than web based problems. Out of the
independent variables the β coefficients of both problems are found to be statistically
significant (p <0.05) and hence the null hypothesis is rejected and the alternative
hypothesis that Problems encountered during internet banking service delivery

261
(Customer support problems, Web based problems) have significant effect on customer
satisfaction is accepted.
Service problems and Password problems are excluded from the step-wise
regression model and they are not significant at 5 per cent significance level (Service
problems p=0.090, Password problems p=0.891). Therefore the null hypothesis is
accepted for service problems and password problems and concluded that the effect of
these two problems on customer satisfaction is not statistically established.
6.3 Discussion of the Results and their Implications
Factor analysis segmented 20 IB service quality variables into seven dimensions
labeled Fulfillment, Security, Reliability, Efficiency, Responsiveness, Website attributes
and Privacy. Significant positive correlations were found between various dimensions of
service quality and customer satisfaction. Multiple regression analysis unfolded the
effect of service quality dimensions on customer satisfaction. Privacy dimension
followed by Responsiveness, Security, Fulfillment and Reliability were found to be
predictors of customer satisfaction. However, the effect of Efficiency and Website
attribute dimensions on customer satisfaction was not statistically established.
Among the dimensions, Privacy was the one having the strongest impact followed
by Responsiveness and Security. This finding, combined with the fact that customers
perceived the measures of Security and Responsiveness dimensions as the lowest amid
the measures of various service quality dimensions, may pose a major threat to the wider
embracing of IB in Kerala. Therefore, banks should closely look at how they can
improve the perception of IB users regarding the Security and Responsiveness
dimensions of service quality.
The government and the RBI are taking efforts to bring down the usage of cash in
the society by giving more emphasis on Information and Communication Technology
(ICT) solutions such as mobile and online banking, core banking and electronic fund
transfers (Press Trust of India, 2012, Sept.13). In such a context banks cannot afford to

262
underestimate the importance of any of the above mentioned dimensions that affect
customer satisfaction in IB and should continuously aim to improve them especially at a
time when the usage of IB services are gaining acceptance among the banking customers
in Kerala.
The findings that customer support problems and web based problems have
significant negative effect on customer satisfaction indicate that these factors hinder
customer satisfaction in the use of IB. The finding, that customer support problem exert
comparatively strong negative effect on customer satisfaction than web based problems,
cross validates the finding that responsiveness of bank employees is one of the strongest
predictors of customer satisfaction. The essence of this finding is that IB users in Kerala
may be satisfied about IB services in general but may not be satisfied about specific
dimensions of service quality, for example, responsiveness. In order to maximize
customer satisfaction, banks in Kerala should pay high attention to responsiveness
dimension of service quality so that customer support problems are minimized. The
negative significant correlation between responsiveness dimension of service quality and
customer support problems ( r = -.295, p = 0.000) underscores the above statement.
To create a highly responsive bank for IB services, a bank should have accessible
and responsive employees who can respond to all customers‘ requirements and complaints
quickly and professionally. Skilful and experienced staff who can also handle problems
associated with the use of IB may be devoted for this purpose. In order to provide hands
on training to potential IB users on how to use IB, banks may arrange live demos at
branch offices when the customers approach the banks for IB facility. Though the website
of some of the banks provide demos, demos in the presence of experienced bank staff may
be more beneficial from the point of view of customers.
Most of the web based problems such as low speed, connection lost while
processing transactions etc. may not be within the reach of banks and they may not have
much to solve these problems. However, for problem of ‗account temporarily locked by
bank‘, the bank can make the customers aware that their account will be temporarily

263
locked if they make multiple incorrect password entry, to ensure security. What the banks
can do in this regard is to advice users to choose passwords which are easy to remember
for them but difficult to be guessed by others.


![6. Performance Testing of Bellows - INFLIBNETshodhganga.inflibnet.ac.in/bitstream/10603/40881/15/15_chapter6.pdf · 6. Performance Testing of Bellows ... EJMA.[20] A minimum of ten](https://img.dokumen.tips/doc/110x75/5b2f87bd7f8b9a594c8e6159/6-performance-testing-of-bellows-6-performance-testing-of-bellows-ejma20.jpg)