Embed Size (px)
Citation preview
S E Q U E N T I A L S A M P L I N G AND V A R I A B I L I T Y OF ACID
P R E C I P I T A T I O N IN H A M P T O N , V I R G I N I A
G. L. P E L L E T T , R O B E R T A B U S T I N * , and R. C. H A R R I S S
NASA-Langley Research Center, Mail Stop 168, Hampton, VA 23665, U.S.A.
(Received April 20, 1982; revised January 10, 1983)
Abstract. Rain samples were collected sequentially by amount ( ~ 2.7 mm each) from individual events at a single, relatively isolated, suburban site from August 1977 to July 1980. Rain pH's for < 3 mm samples closely fit a monomodal Gaussian distribution with a median of 4.50 and a standard deviation of 0.39. The variability in pH was primarily interevent as opposed to intraevent. The 3-yr volume-weighted pH was 4.35 + 0.02 for 3.16 m collected; annual pH's were 4.31,4.37, and 4.38, and cumulative H + deposition was 141 mg H + m - 2. Event-averaged rain pH and meteorological and air quality data were correlated. Low pH was associated with low rainfall volume and rate; rain after several dry days; rains with northeast surface winds; high SOz, NO2, and 03 in the ambient atmosphere; and high, strongly correlated, SO 4 and NO;- rainwater concentrations. The lowest 3-yr seasonal average pH (4.31) occurred during summer; values for other seasons were ~ 4.37. Average intraevent H + molarity (volume-weighted) was accurately characterized by 6.89 E - 5 *(mm rain) o.z15 The relative merits of composite (e.g., whole event) and sequential sampling are examined.
1. Introduction
The cause-effect relationships between measured acidity of precipitation and pollution emissions, meteorological conditions, and air quality are not accurately known. To resolve questions concerning the origin and ecological significance of acid precipitation, major research programs have been initiated in most regions of the world, including the development of nationwide and worldwide precipitation chemistry monitoring networks (Wisniewski and Miller, 1977; Galloway and Cowling, 1978; MacCracken, 1978). Most precipitation sampling to date has concentrated on defining spatial patterns in chemical composition, with sampling intervals ranging from total rain events (data are relatively scarce) to weekly composite rainfall (typical), and sometimes to monthly composite samples. Intraevent sequential data are rare.
In this paper we report summary data from a 3-yr (August 1977-July 1980) study of the intraevent volume-resolved variability of pH, sulfate, and nitrate in precipitation at a relatively isolated suburban site in Hampton, Virginia. Each of the 170 precipitation events monitored was sampled with a sequential collector (~2.7 mm rain, average increment) to enable study of chemical variability both within and between events.
Sequential sampling of events may be particularly useful for detailed studies of precipitation scavenging and wet deposition processes, e.g., how they are influenced by atmospheric dynamics, pollution, and rain characteristics. It may also be important to know the composition of different portions of a rain, such as the initial wetting phase
* Permanent address: Arkansas College, Batesville, Arkansas 72501, U.S.A.
Water, Air, and Soil Pollution 21 (1984) 33-49. 0049-6979/84/0211-0033502.55. © 1984 by D. Reidel Publishing Company.

34 G. L. PELLET ET AL.
and/or the final phase which remains on vegetation surfaces, when studying potential ecological effects of acid rain.
Some of the few published results on sequential sampling have emphasized techniques (Gatz etal., 1971; Pickerell etal., 1979; Raynor and McNeil, 1979). Others have featured limited data analyses. For example, the first year of time-resolved (hourly) data obtained at Brookhaven, New York, illustrated the potential for relating intrastorm chemical variability to meteorological conditions (Raynor and Hayes, 1978). Seymour et al. (1978) reported a detailed study of variations in major acid components collected sequentially during five different events. They observed that the strong acid concen- tration increased from very low values to a maximum and then decreased during a single rainfall event. Anderson and Landsberg (1979) collected sequential samples of rainfall near a major powerplant, demonstrating a range in pH from 2.7 to 6.9 during an event. Based on data from 18 events, they found a multimodal frequency distribution of pH values for each 0.25 mm of precipitation with an overall mean value of 4.7 and a standard deviation of 0.7. A more recent paper from Brookhaven which summarizes 3-yr of hourly precipitation composition data (Raynor and Hayes, 1981), presents several correlations among acidity, conductivity, composition and meteorological varia- bles; some features of these results are discussed later.
The purpose of this study is twofold: To characterize interevent variability of precipi- tation pH (and other components) in relation to meteorological and air quality con- ditions for a 3-yr time series, and to examine intraevent precipitation pH variability on a volume-resolved basis in order to assess the potential value of sequential sampling for future studies.
2. Experimental
A sequential rain sampler was constructed for obtaining a series of equal sized samples during a single event. The sampler was located in an open field about 1.5 m above ground and about 30 m from a small, relatively remote, laboratory (Bldg. 1273) at the NASA-Langley Research Center, Hampton, Virginia.
The self-contained, motorized, carousel sampling assembly was enclosed in plexi- glass. A removable funnel module was placed on top. When a raindrop hit a multiwire conductivity detector, a switch was triggered, and the funel lid opened; subsequent closure of the lid was accomplished manually. The stem of the 600 cm 2 tetrahedral- shaped plexiglass funnel extended into the opening of a polypropylene cup directly below. A set of seven 200 ml cups, rainwater-aged and distilled water washed, was held on the carousel. Each cup had a funnel-like plexiglass cap to minimize evaporation and further contact of the sample with air. Small vents allowed unrestricted flow. When a cup was full (2.4 to 3.0 mm rain equivalent) the water's weight triggered a switch and the carousel rotated to the next cup position. If all seven cups were filled additional rain was funneled from the eight cup position to a 21 reservoir.
Samples were transferred to washed polyethylene bottles. The pH of a 40 ml sample was measured after the addition of solid KC1 (to make 0.1 molar), which increased
SEQUENTIAL SAMPLING AND VARIABILITY OF ACID PRECIPITATION 35
solution conductivity and thus eliminated unwanted effects of low and variable conduc- tivity on pH measurement (Galloway et aI., 1979). A glass combination pH electrode and digital pH meter reading to two decimal places was used. The system was calibrated before each measurement set with standard buffer solutions of pH 2 and pH 7, and occasionally pH 5. The samples were refrigerated (1978 samples) and frozen (1979) for later chemical analyses.
Sulfate, N O 3 - , C1 -, F - , Br- , PO4--- , N O f , NH4 + , Na +, K + , Ca + +, and Mg + + concentrations were determined by ion chromatography, atomic absorption, and flame emission analyses on 138 of the rain samples collected during the summer and fall of 1978 and 1979. They were carried out under the precipitationchemistry program at the NASA Kennedy Space Center (Madsen, 1981). Ion balances were usually obtained within + 10 ~o, and calculated pH's agreed quite well with measured values after sea-salt corrections were made. Only sulfate and nitrate data will be reported in this paper.
3. Analysis of Interevent Data
It became apparent that correlations between pH and various meteorological and air quality data were better illustrated by grouping data in histograms than by plotting respective sets of individual values. For each data set, histogram groupings were chosen by observing obvious breaks in the data and allowing for reasonable parameter ranges. All available data were used for each correlation. The number of collections included in each case differed because complete supporting data were not available for all rain events. This was due typically to factors such as variable wind direction, the rain collector remaining open for more than one event, and lack of air quality data due to instrument scheduling or malfunction. In results shown later, the respective numbers of rain event collections and sequential samples are cited for each case; each volume- weighted average pH (denoted pH) is accompanied by a standard error of the mean; the width of each histogram data grouping defines the included range; and the abscissa for pH defines the mean parameter value.
4. Results and Discussion
4.1. STATISTICAL CHARACTERIZATIONS OF RAINWATER pH
Statistical properties of the pH data were examined in order to characterize pH variability. The 3-yr cumulative frequency distribution of pH's on individual sequential samples ( _< 3 mm rain) was plotted on linear probability paper, shown in Figure la. This data set included all samples numbered j = 1 to 7, for each collection i, plus j = 8 samples (funnel overrun) arbitrarily subdivided into n(i, 8) 3-ram increments, each having the appropriate measured value pH(i, 8). (Averaged sequential data, shown later
36 G . L . P E L L E T E T A L .
c l _
I ,--
,::z r , 1
~ 3
m I 1 ] I I I I ] 1 I I I I I I ,0, 3ram RA,N SAMPLES
_ _ _ ~ ,_. pH=4.50. MEDIAN 1"44-,,,~ o = 0.388. STD. DEV.
20 20 i 1 i
_ _ i I I t L l l I i I I I I I I I l
I-=
Z
<~ e-,.-
c) - 1 - 3
I I I I 1 I I I I I I I I (b) VOLUME-WEIGHTED EVENT COMPOSITES
pH : 4.47, MEDIAN - - - I " ~ Q . . . , ~ o = 0.318, STD. DEV.
i "%-<, I I i I
2 0 2,o l
I i li I_ I I L l i I Ij I I
,-, 5 : E
I .--
< 4 Z
,,::E
I I I I I I I I I I I I I (C) UNWEIGHTED EVENT COMPOSITES
p"lll = 4.40, MED IAN o = 0.370, STD. DEV.
1 L '~) . .~ . . ,_ , n = 170. SAMPLENO.
t I 3 20 2"0
l I i . i i l I l l I i i I IL I I
• Ol .1 .5 1 2 5 10 20 50 80 90 95 98 99 99.9
1 0 0 - P c . CUMULATIVE PERCENT OF SAMPLES WITH pH> INDICATED VALUE
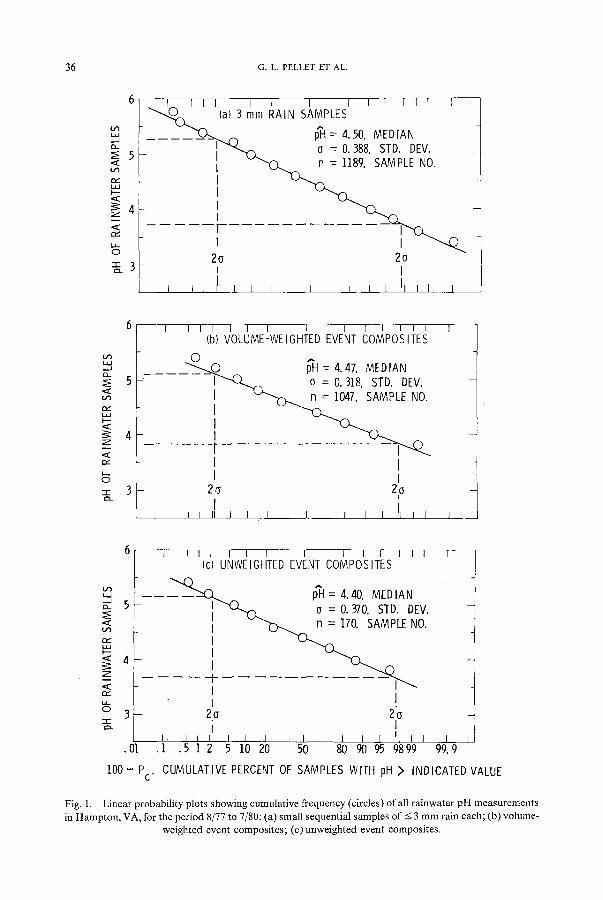
Fig. 1. Linear probability plots showing cumulative frequency (circles) of all rainwater pH measurements in Hampton, VA, for the period 8/77 to 7/80: (a) small sequential samples of -< 3 mm rain each; (b) volume-
weighted event composites; (c) unweighted event composites.
SEQUENTIAL SAMPLING AND VARIABILITY OF ACID PRECIPITATION 37
in Figure 5, illustrate the relative contribution of the funnel overrun.*) It is evident that
these data are very well characterized (out to 3 - a limits) by a unimodal Gaussian
distribution, represented by a straight line in Figure la. The corresponding analytic
expression is
Pc = 50 + 50 erf((pH - p H ) / ( x ~ a)), (1)
where Pc represents the cumulative percent of samples with pH _< (indicated value), pH
is the median pH, ais the standard deviation of individual samples, and erf( ) represents
an error function. The differential frequency distribution is /N
d(Pc)/d(pH) = ( 1 0 0 / ( x / ~ a)) exp( - (pH - pH)2/(2a2)). (2)
Note that conformance to a normal frequency distribution for pH corresponds to a
log-normal distribution for H + concentration. Thus, standard deviations should be calculated in units of pH, not H + concentration. Also, the fact that p'H = 4.50 differs from the volume-weighted average pH** for 3-yr (pH = 4.35) is consistent with the
definition of volume-weighted average H + molarity. The cumulative frequency distribution for sequential samples, Figure la, can be
compared with similar characterizations of whole events in Figures lb and c. The pH
frequencies for events in Figure lb are weighted by rainfall amount; i.e. each event collection i was arbitrarily represented by n(i) samples of 3 mm rain, all having the event
average, pH(i). The event results in Figure lc represent uniformly weighted pH(i) values, for which pH frequency is independent of rainfall amount; i.e. one per event. Both Figures lb and c are good unimodal Gaussian fits. The 18~o decrease in a between
the sequential-sample result in Figure la (a -- 0.388 pH units) and the rainfall-weighted event result in Figure lb (0.318) indicates that the additive contribution of intraevent
pH variability was relatively small compared to interevent variability. Since the a in Figure lc for uniformly weighted events (0.370) is only 5~o less than the sequential- sample result, interevent variability appears to be even more dominant when amount of rain is not considered.
4.2. METEOROLOGICAL FACTORS INFLUENCING pH
Meteorological data were obtained from a nearby (2 km) weather station at Langley Air Force Base, Hampton, Virginia. Values of pH calculated for whole rain events, based
on sequential data, were used in the meteorological comparisons.
* The relative contribution ofthe eighth, funnel-overrun, sample class, which included 57 samples averaging 17 mm of rainfall each, amounted to 31 yo of the rainfall. Since the standard errors in pH (+ 0.33) and pH ( + 0.04) approximated the variability of the first seven sample classes (see error bars in Figure 5), inclusion of a subdivided eighth class should not have an appreciable effect on the derived a in Figure la or the subsequent conclusion regarding dominance of interevent variability. ** pH denotes a volume-weighted average pH throughout this paper. Subscripts are sometimes used to denote sample set.
38 G. L. PELLET ET AL.
4.2.1. Rainfall Rate
A clock and sample-event recorder were used during 18 events, for a total of 102 sequential samples. Although it was readily apparent that rainfall intensity was not the only factor affecting acidity, a significant positive correlation between intensity and pH was found. For example the arithmetic average pH of rains at rates < 2 mm hr- 1 was 4.28, while the average for rains of > 2 mm hr - 1 was 4.65.
These observations are consistent with the results of much more comprehensive model and field studies, which confirm that lower precipitation rates tend to result in higher solute concentrations and, thus, in lower rain pH (Duce et aL, 1969; Hales, 1972, 1978; Garland, 1978; Scott, 1978; Pack, 1979; Wilson et al., 1980; Pellett, 1981). The generalization is most simply rationalized by considering changes in droplet size distri- bution upon washout. Heavy rains tend toward larger droplets than those in light rains (Pruppacher and Klett, 1978); and with larger droplets the net effect of higher terminal velocity, shorter cloud residence time, and smaller ratio of surface area to volume is a systematic reduction of the mass concentration of scavenged species.
4.2.2. Rainfall Amount
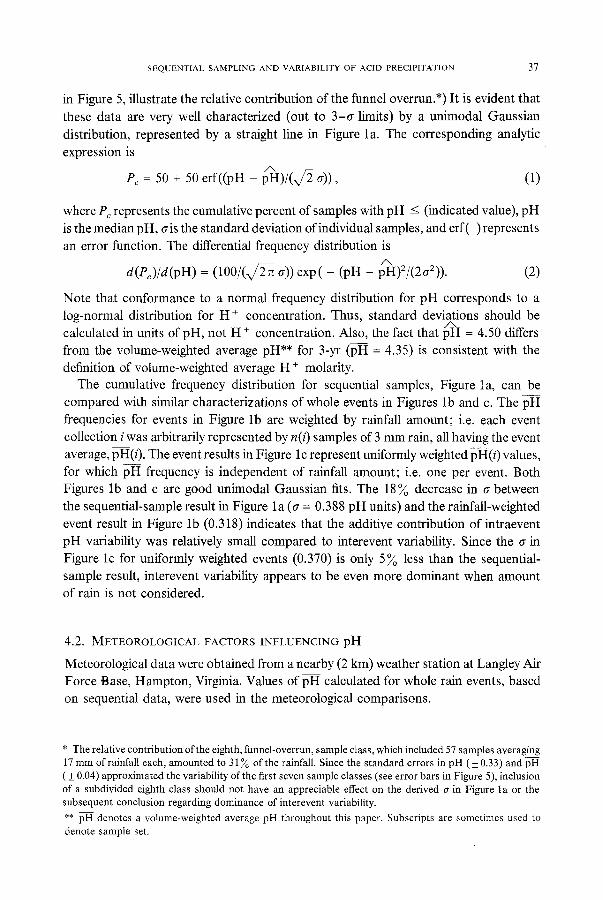
Values of pH for whole events were correlated with event rain volume in Figure 2a, which shows a significant positive trend. The minimum pH observed for an entire collection was 3.52, and it occurred with only a trace of rain. The maximum, 5.43, was observed with 50 mm of rain. These data are similarly consistent with the much more extensive data from the European Atmospheric Chemistry network (Granat, 1978) and the MAP3S stations (Pack, 1979, 1980), which show that H + (and SO4--) concen- trations decrease as the amount of rainfall per event increases.
The three rains associated with hurricanes during this study had unusually high pH values (between 5.0 and 5.6). Wolff et aL (1979) found a maximum pH value of 5.16 associated with Hurricane Belle in a study of 72 event samples in the New York
4.6
4.5
VOL.-WT'D 4"4 pH 4.3
4.2
4.1
4.0
3.9
I (a) (b)
I l I I I I I I I 1 I
0 10 20 30 d0 50 60 70 0 2 4 6 10 12 14 16 18 RAINFALL PER EVENT, mm NO. DRY DAYS PRECEDING RAIN
Fig. 2. Volume-weighted pH's for events as functions of (a) rainfall amount (170 collections of 848 samples), and (b) number of dry days preceeding rain (118 collections of 556 samples). Bar heights equal
one standard error of means, and bar abscissa indicate mean values of histogram groupings.
SEQUENTIAL SAMPLING AND VARIABILITY OF ACID PRECIPITATION 39
metropolitan area. High rainfall volume appears to be a significant factor in these high
pU occurrences.
4.2.3. Antecedent Conditions
During a period of dry weather, pollutants can build up in the atmosphere. Pollutant concentrations are influenced not only by local wind patterns and humidity but also by regional-scale meteorological conditions, prolonged photochemical activity, and simple lack of wet deposition removal. Our data reflect such buildups many times during the 3-yr sampling period. Figure 2b relates event-averaged pH to the number of dry days preceding a rain, and shows a significant inverse trend. A cold frontal rain following the longest dry period (summer, 17 days), had a pH of 3.91; in this case, low pH was accompanied by a large amount of rain, which normally favors high pH.
4.2.4. Wind Direction
Data on upper winds were generally not available for this area during most of the sampling period. Thus, in order to correlate pH with wind direction on rainy days, it was necessary to use surface winds measured 3-m aboveground. Table I shows the relation of pH to 24-hr average surface wind direction. Rains associated with winds from the northeast quadrant had the lowest pH. This was expected because northeast surface winds tend to be associated with flow over areas of high emission density before reaching Hampton. Rains associated with winds from both the southeast and southwest quadrants were least acidic; this is consistent with the flow of re!atively cleaner air into our coastal area from oceanic environments.
TABLE I Variation of pH with surface wind direction
Wind Volume- Standard error direction Wt'd pH of the mean
NE (1 °-90 ° ) 4.25 0.033 SE (91°-180 ° ) 4.39 0.042 SW (181 ° -270 ° ) 4.40 0.023 NW (271 °-360 ° ) 4.35 0.034
4.3. SEASONAL AND ANNUAL TRENDS
The well known existence of seasonal patterns in weather and air quality sugests a priori
that precipitation composition should also vary with season. Such variability is of concern not only in attempts to model the properties of acid rain, but also in efforts to assess impacts on biological systems, which characteristically have strong seasonal activity patterns.
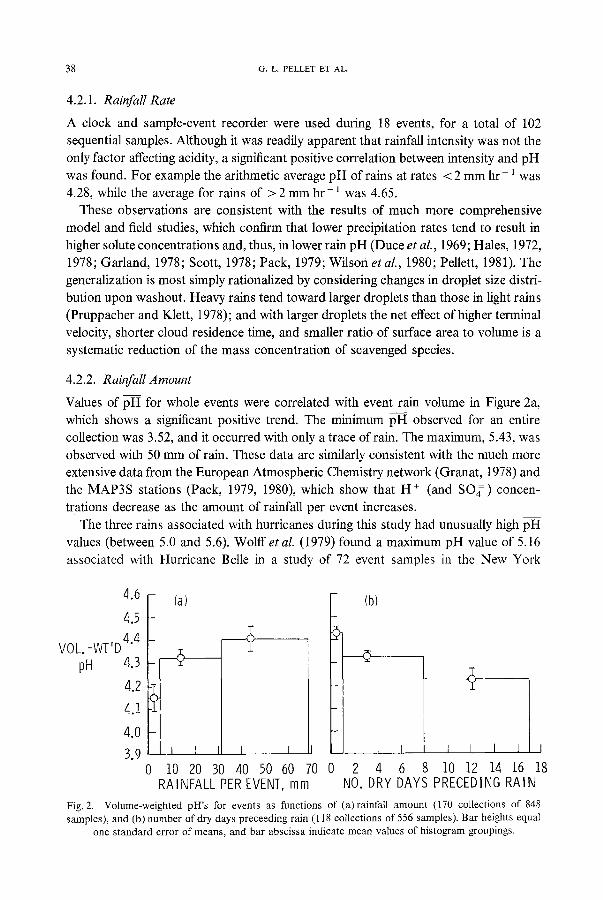
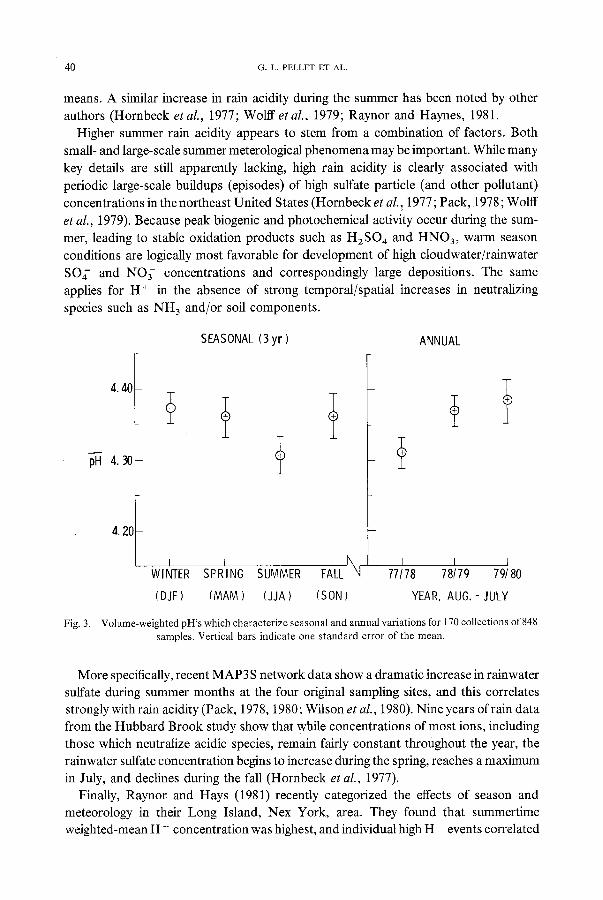
Our 3-yr quarterly average pH for the summer months (4.31) was somewhat lower than those for the other seasons ( ~ 4.37); but, as shown in Figure 3, the difference was not highly significant when compared to standard errors of the seasonal and annual
4 0 G. L. PELLET ET AL.
means. A similar increase in rain acidity during the summer has been noted by other authors (Hornbeck et al., 1977; Wolff etal . , 1979; Raynor and Haynes, 1981.
Higher summer rain acidity appears to stem from a combination of factors. Both small- and large-scale summer meterological phenomena may be important. While many key details are still apparently lacking, high rain acidity is clearly associated with periodic large-scale buildups (episodes) of high sulfate particle (and other pollutant) concentrations in the northeast United States (Hornbeck et al., 1977; Pack, 1978; Wolff et al., 1979). Because peak biogenic and photochemical activity occur during the sum- mer, leading to stable oxidation products such as H z S O 4 and HNO3, warm season conditions are logically most favorable for development of high cloudwater/rainwater SO 4 and NO3 concentrations and correspondingly large depositions. The same applies for H + in the absence of strong temporal/spatial increases in neutralizing species such as NH 3 and/or soil components.
SEASONAL (3 yr ) ANNUAL
4. 40
Fig. 3.
pH 4.30
4.2C
WINTER SPRING SUMMER FALL "q 77/78 78/79 79/80
(DJF) (MAM) (JJA) (SON) YEAR, AUG.-JULY
Volume-weighted pH's which characterize seasonal and annual variations for 170 collections of 848 samples. Vertical bars indicate one standard error of the mean.
More specifically, recent MAP3 S network data show a dramatic increase in rainwater sulfate during summer months at the four original sampling sites, and this correlates strongly with rain acidity (Pack, 1978, 1980; Wilson et al., 1980). Nine years of rain data from the Hubbard Brook study show that while concentrations of most ions, including those which neutralize acidic species, remain fairly constant throughout the year, the rainwater sulfate concentration begins to increase during the spring, reaches a maximum in July, and declines during the fall (Hornbeck et al., 1977).
Finally, Raynor and Hays (1981) recently categorized the effects of season and meteorology in their Long Island, Nex York, area. They found that summertime weighted-mean H + concentration was highest, and individual high H + events correlated
SEQUENTIAL SAMPLING AND VARIABILITY OF ACID PRECIPITATION 41
with cold front and squall line showers and thundershowers. Such events, which typically followed periodic air mass stagnations, high pollution levels, and southwesterly air flow, comprised the bulk of warm season precipitation in their 3-yr study.
4.3.1. Annual Var&tion
The pH's for the consecutive 3-yr of this study (Figure 3) were 4.31, 4.37, and 4.38 based on total rainfall amounts of 119, 118, and 79 cm collected. The respective standard deviations of individual pH measurements were 0.39, 0.39, and 0.45; standard errors of the mean were 0.022, 0.022, and 0.031. These results alone are clearly insufficient to establish a temporal trend, especially in view of the relatively large annual variations observed elsewhere in the country (see, e.g., Hornbeck et al., 1977).
4.4. A I R QUALITY AND PRECIPITATION CHEMISTRY
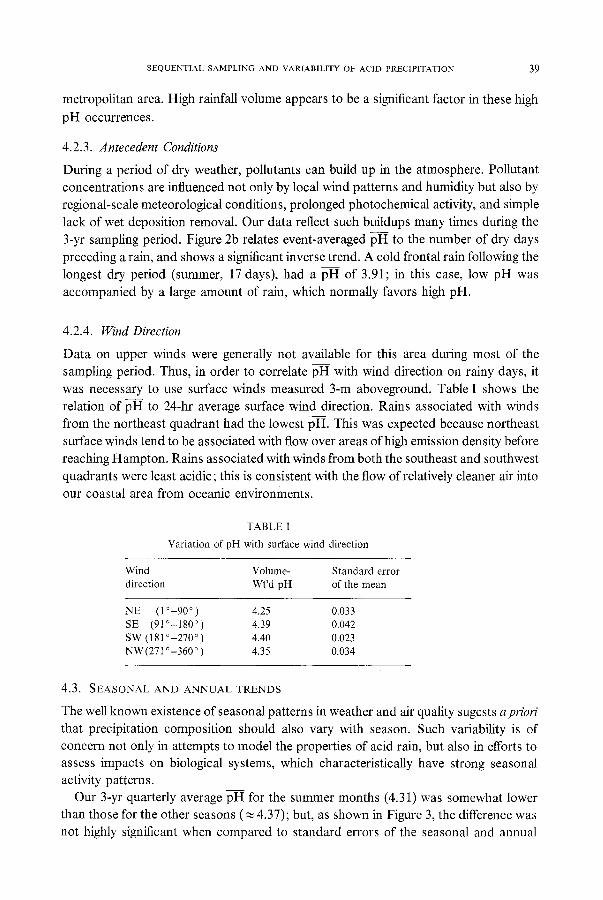
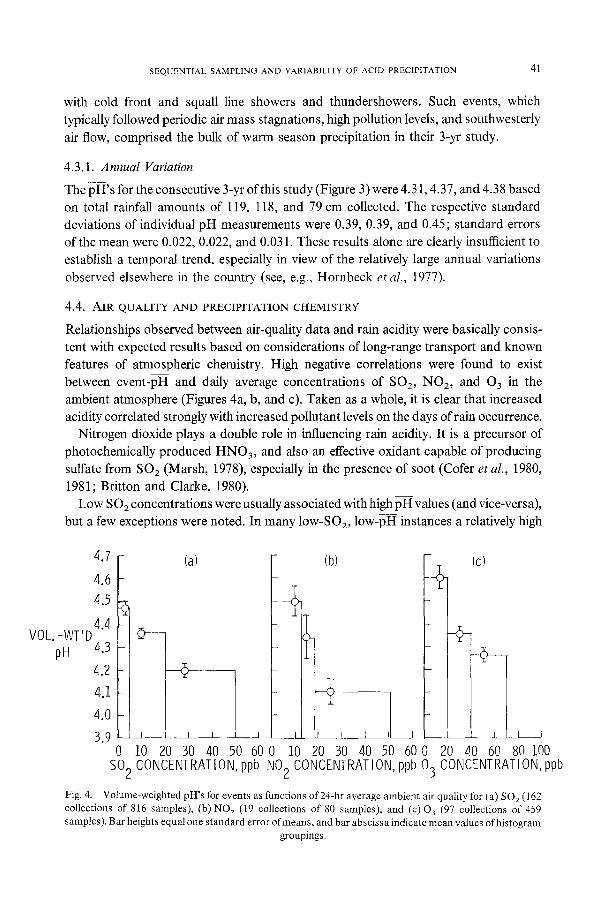
Relationships observed between air-quality data and rain acidity were basically consis- tent with expected results based on considerations of long-range transport and known features of atmospheric chemistry. High negative correlations were found to exist between event-pH and daily average concentrations of SO2, NO2, and 0 3 in the ambient atmosphere (Figures 4a, b, and c). Taken as a whole, it is clear that increased acidity correlated strongly with increased pollutant levels on the days of rain occurrence.
Nitrogen dioxide plays a double role in influencing rain acidity. It is a precursor of photochemically produced HNO3, and also an effective oxidant capable of producing sulfate from SO 2 (Marsh, 1978), especially in the presence of soot (Cofer et al., 1980, 1981; Britton and Clarke, 1980).
Low SO 2 concentrations were usually associated with high pH values (and vice-versa), but a few exceptions were noted. In many low-SO2, low-pH instances a relatively high
4.7 - (a)
4 . 6 -
4.5
4.4 OL. -WT'D -©
pH 4.3 -
4.2
4.1
@ _ _
4 . 0 -
3 . 9 t J I I I0 20 30 40 50 60
SO 2 CONCENTRATION, ppb
I
lO
(b)
i I I
20 30 40 50
L I
60 0 20
(c)
40 60 80 i00 NO 2 CONCENTRATION, ppb 0 3 CONCENTRATION, ppb
Fig. 4. Volume-weighted pH's for events as functions of 24-hr average ambient air quality for (a) SO 2 (162 collections of 816 samples), (b)NO 2 (19 collections of 80 samples), and (c)03 (97 collections of 459 samples). Bar heights equal one standard error of means, and bar abscissa indicate mean values of histogram
groupings.
42 G. L. PELLET ET AL.
concentration of 03 (and other oxidants) was present. Presumably, substantial con- version to sulfate had occurred upwind.
Ozone, H a 02, and other photochemically produced oxidants promote the conversion of SO 2 to sulfate, either by gas-phase photochemical processes (Calvert and Su, 1978), gas to particle conversion, or by aqueous phase oxidation (Penkett etal . , 1979; Middleton et al., 1980; Moller, 1980). While O3-based oxidation of SO2 to H2SO4 is consistent with the high correlation of 03 with acidity, the presence of 03 is not essential for these conversions. This is illustrated experimentally (Penkett et al., 1979), by model studies (Beilke and Gravenhorst, 1978; Eggleton and Cox, 1978; Middleton et al., 1980; Moller, 1980), and is clearly demonstrated by the occurrence of acid rain in winter when 0 3 concentrations tend to be very low. Middleton et al. (1980) emphasize the probable importance of SO2 oxidation by H20 2 during the winter, especially since the net rate increases with decreasing temperature and increasing acidity (Penkett et al., 1979).
Although relatively well defined relationships were observed in Figures 2 and 4 between rain pH and meteorological and air-quality parameters, and these were qualita- tively consistent with our knowledge of air pollution chemistry, there are two important caveats. First, the respective parametric correlations are not statistically independent, or isolated, as treated in analysis of variance or factor analysis. Second, respective parameters are not proven to be causal factors, either individually or collectively; instead they are simply covariant parameters.
4.4.1. Sulfate and Nitrate in Rainwater
Sulfate and nitrate concentrations were determined on two sets of samples for the summer (mostly) and fall of 1978 and 1979 (30 events, 138 samples). As expected, a good correlation existed between acidity and both sulfate and nitrate concentrations. For example, the 19 samples with pH < 4.00, average (SO4) and ( N O j ) were 209 ~teql-1 and 69 geql-~; the 40 samples with pH > 4.60 respectively averaged 19geql -~ and 7.4. g1-1.
A linear regression of log(NOy ) versus log (SO4), for all 138 samples analyzed, led to the empirical power-law expression (geq 1- ~ units),
(NO3-) = 0.428 (SO4-)0.94, (3)
which had a correlation coefficient of 0.85. The respective mean values of (SO4) and (NO3-) were 40.7 and 13.9 geq 1- l, and the standard deviations of individual log concentrations were 0.43 and 0.48. The pH _+ a (individual) for this sample set was 4.26 _+ 0.44. Note that the cr's of individual p (SO2) and p (NO~-) values are comparable to that for pH. When the mean (SO4) and (NO3-) are used to calculate relative contributions to acidity, one obtains 75~o of the H + associated as H 2 S O 4 and 25~o as HNO3. This agrees quite closely with the average distribution of these strong acids in summer rains over the northeastern United States (Likens et al., 1979; Likens and Bormann, 1974; Likens and Butler, 1981 ; Varshney and Dochinger, 1979; Wilson et al., 1980). The sulfate and nitrate data can also be compared with a recent analysis of MAPS and EPRI network data for the period August 1978 through June 1979 (Pack,
SEQUENTIAL SAMPLING AND VARIABILITY OF ACID PRECIPITATION 43
1980). Isopleths of concentration for the Hampton, Virginia area indicate 40 geq SO4 = 1- 1 and 16 geq NO3- 1- 1, which compare favorably with our respective mean values of 40.7 and 13.9 geq 1- 1. The sequential aspects of these pH, SO 4 and NO£ data (Figure 6) are discussed in the next section.
4.5 . C H A R A C T E R I Z A T I O N OF SEQUENTIAL COMPOSITION
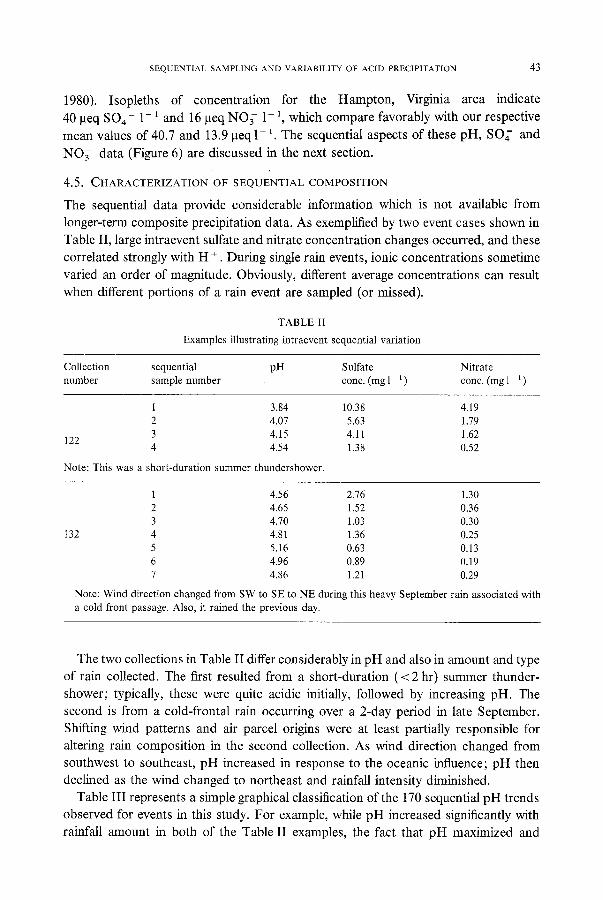
The sequential data provide considerable information which is not available from longer-term composite precipitation data. As exemplified by two event cases shown in Table II, large intraevent sulfate and nitrate concentration changes occurred, and these correlated strongly with H +. During single rain events, ionic concentrations sometime varied an order of magnitude. Obviously, different average concentrations can result when different portions of a rain event are sampled (or missed).
TABLE II
Examples illustrating intraevent sequential variation
Collection sequential pH Sulfate Nitrate number sample number conc. (mg 1 - 1 ) conc. (mg 1 1 )
1 3.84 10.38 4.19 2 4.07 5.63 1.79 3 4.15 4.11 1.62
122 4 4.54 1.38 0.52
Note: This was a short-duration summer thundershower.
132
1 4.56 2.76 1.30 2 4.65 1.52 0.36 3 4.70 1.03 0.30 4 4.81 1.36 0.25 5 5.16 0.63 0.13 6 4.96 0.89 0.19 7 4.86 1.21 0.29
Note: Wind direction changed from SW to SE to NE during this heavy September rain associated with a cold front passage. Also, it rained the previous day.
The two collections in Table II differ considerably in pH and also in amount and type of rain collected. The first resulted from a short-duration (< 2 hr) summer thunder- shower; typically, these were quite acidic initially, followed by increasing pH. The second is from a cold-frontal rain occurring over a 2-day period in late September. Shifting wind patterns and air parcel origins were at least partially responsible for altering rain composition in the second collection. As wind direction changed from southwest to southeast, pH increased in response to the oceanic influence; pH then declined as the wind changed to northeast and rainfall intensity diminished.
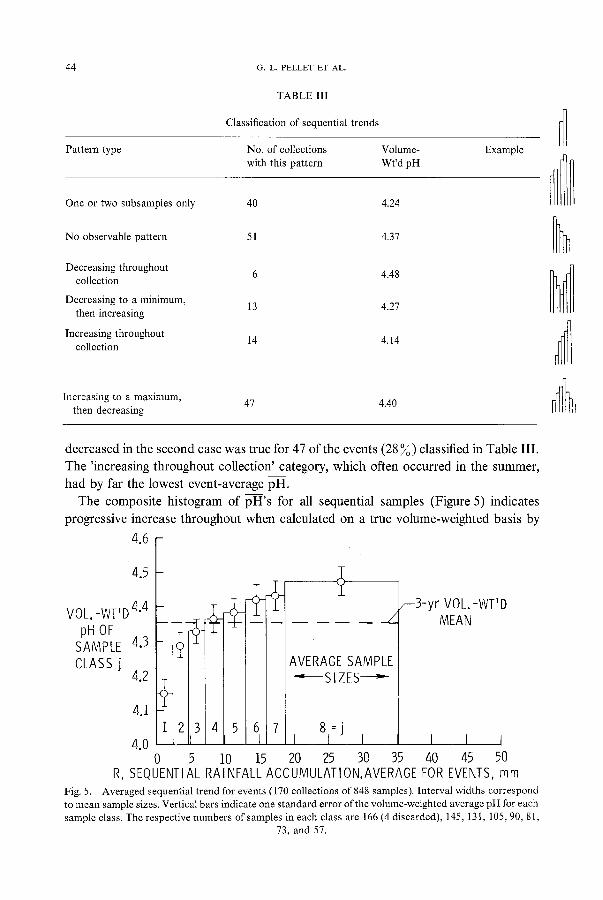
Table III represents a simple graphical classification of the 170 sequential pH trends observed for events in this study. For example, while pH increased significantly with rainfall amount in both of the Table II examples, the fact that pH maximized and
44 G, L, P E L L E T ET AL.
TABLE III
Classification of sequential trends
Pattern type No. of collections Volume- Example with this pattern Wt'd pH l ~ q l
One or two subsamples only
No observable pattern
Decreasing throughout collection
Decreasing to a minimum, then increasing
Increasing throughout collection
Increasing to a maximum, then decreasing
40 4.24
51 4.37 ~]~
6 4.48
13 4.27
14 4.14
47 4.40 ~ - ~
decreased in the second case was true for 47 of the events (28 ~o) classified in Table III. The 'increasing throughout collection' category, which often occurred in the summer, had by far the lowest event-average pH.
The composite histogram of pH's for all sequential samples (Figure 5) indicates progressive increase throughout when calculated on a true volume-weighted basis by
4 . 6 -
4.5
VOL-WT'D 4"4 pH OF
SAMPLE 4.3 CLASS j
4.2
4.1
4.0 1[2 3 4 5 6 7
I I I
O 5 i0 15
_zj/ 3-yr VOL.-WT'D MEAN
AVERAGE SAMPLE - - ~ S I Z E S ~
8--j I I I I I I
20 25 30 35 40 45 50 R, SEQUENTI AL RAI NFALL ACCUMULATI ON, AVERAOE FOR EVENTS, m m
Fig. 5. Averaged sequential trend for events (170 collections of 848 samples). Interval widths correspond to mean sample sizes. Vertical bars indicate one standard error of the volume-weighted average pH for each sample class. The respective numbers of samples in each class are 166 (4 discarded), 145, 131,105, 90, 81,
73, and 57.
SEQUENTIAL SAMPLING AND VARIABILITY OF ACID PRECIPITATION 45
using measured subsample volumes. Further analysis of this averaged sequential trend is given in the next subsection.
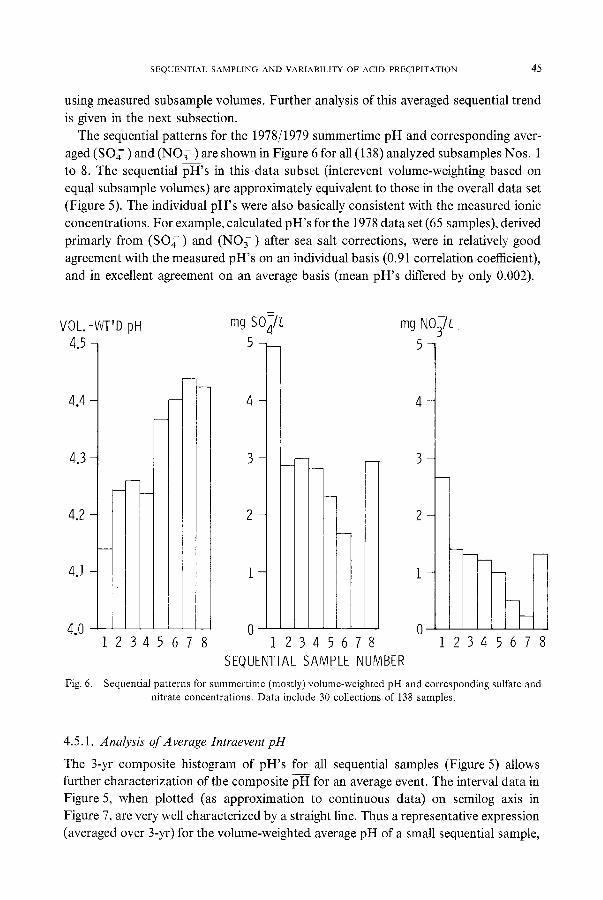
The sequential patterns for the 1978/1979 summertime pH and corresponding aver- aged (SO4) and (NO3) are shown in Figure 6 for all (138) analyzed subsamples Nos. 1 to 8. The sequential pH's in this data subset (interevent volume-weighting based on equal subsample volumes) are approximately equivalent to those in the overall data set (Figure 5). The individual pH's were also basically consistent with the measured ionic concentrations. For example, calculated pH's for the 1978 data set (65 samples), derived primarly from (SO 4 ) and ( N O f ) after sea salt corrections, were in relatively good agreement with the measured pH's on an individual basis (0.91 correlation coefficient), and in excellent agreement on an average basis (mean pH's differed by only 0.002).
VOL.-WT'D pH mg S04/L mg NO3-/L 4.5- 5-- 5-
4.4
4.3
4.2 ~
4.]
4.0 12
Fig. 6.
q _ _
3 / 3
2 -
1 -
0 ' 0 3 4 5 6 7 8 1 2 3 4 5 6 7 8
SEQUENTIAL SAMPLE NUMBER
_
_
1 2 3 4 5 6 7 8
Sequential patterns for summertime (mostly) volume-weighted pH and corresponding sulfate and nitrate concentrations. Data include 30 collections of 138 samples.
4.5.1. Analysis of Average Intraevent pH
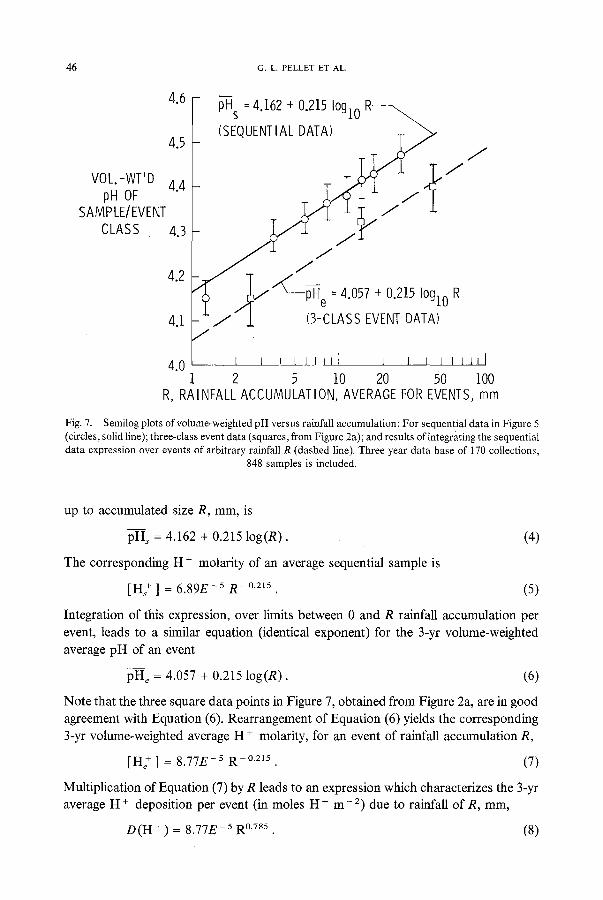
The 3-yr composite histogram of pH's for all sequential samples (Figure 5) allows further characterization of the composite pH for an average event. The interval data in Figure 5, when plotted (as approximation to continuous data) on semilog axis in Figure 7, are very well characterized by a straight line. Thus a representative expression (averaged over 3-yr) for the volume-weighted average pH of a small sequential sample,
46 G . L . PELLET ET AL.
4.6
4..5
VOL.-WT'D 4.4 pH OF
SAMPLE/EVENT CLASS 4.3
4.2
4.1
4.0
R, RA
- ~s : 4.162 + 0.215 loglo R ~ - ~
_ (SEQUENTIAL DATA) -~ ~ . ~ /
/
J
I I i I I l l l ] t I t I I t L l l
2 5 I0 20 50 I00 NFALL ACCUMULATION, AVERAGE FOR EVENTS, mm
Fig. 7. Semilog plots of volume-weighted pH versus rainfall accumulation: For sequential data in Figure 5 (circles, solid line); three-class event data (squares, from Figure 2a); and results of integrating the sequential data expression over events of arbitrary rainfall R (dashed line). Three year data base of 170 collections,
848 samples is included.
up to accumulated size R, mm, is
pHs = 4.162 + 0.215 log(R). (4)
The corresponding H + molarity of an average sequential sample is
[H + ] = 6.89E -5 R -°'2~5 (5)
Integration of this expression, over limits between 0 and R rainfall accumulation per event, leads to a similar equation (identical exponent) for the 3-yr volume-weighted average pH of an event
pHe = 4.057 + 0.215 log(R). (6)
Note that the three square data points in Figure 7, obtained from Figure 2a, are in good agreement with Equation (6). Rearrangement of Equation (6) yields the corresponding 3-yr volume-weighted average H + molarity, for an event of rainfall accumulation R,
[H + ] = 8.77E -5 R - ° a ' 5 (7)
Multiplication of Equation (7)by R leads to an expression which characterizes the 3-yr average H + deposition per event (in moles H + m - 2 ) due to rainfall of R, ram,
D ( H + ) = 8.77E -5 R °785 . (8)
SEQUENTIAL SAMPLING AND VARIABILITY OF ACID PRECIPITATION 47
Thus we can conclude that, in addition to the statistical and climatological characteri- zation of pH variability given by Equations (1) and (2), event-averaged H + concen- tration decreased as R-0.22, and cumulative H + deposition increased as R °78 for an average event in our area.
4 . 6 . I M P L I C A T I O N S F O R P R E C I P I T A T I O N M O N I T O R I N G
The presently established facts that early stages of an event and light rains both tend to have significantly lower pH should be considered when selecting and operating a rain sampler. For accurate results, it is important that automated collection devices include these quantities since small volumes at low pH have a disproportionately large volume- weighting effect.
As new precipitation chemistry programs are started, and additional monitoring stations are established, it is important to consider the relative merits of composite versus sequential sampling and analysis. First. composite sampling is relatively simple and inexpensive, and, in fact, sequential sampling may be considered unnecessary. For example, if a scientific objective is to correlate precipitation composition with certain daily meteorological and airquality data, then daily/event composite sampling may appear to be adequate.
Sequential sampling has several practical advantages over composite sampling, however. First, subsamples can be protected from deterioration, which may be desirable for event or weekly collections. Secondly, samples sometime have to be discarded because certain contaminants (including bird debris) alter the composition. With com- posite sampling, the entire collection may be lost or significantly perturbed; however, sequential sampling allows the option of selectively discarding contaminated sub- samples. Uncompromised subsamples can be subdivided, analyzed, saved, and/or combined after collection, according to program needs.
From a research standpoint, the deposition histories of storms can be traced by sequential data, and certain precipitation scavenging processes can be assessed if sufficient air quality data are available. At a reduced level of effort, sequential monitoring of rain pH (and conductivity) may provide a minimal baseline indicator of intraevent composition variability, as an inexpensive substitute for comprehensive sequential sampling and analysis of all components.
Finally, from an ecological point of view it may be significant to consider both the first and last parts of a rain as well as the whole event. The initial phase wets receiver surfaces, tends to be most acidic, and interacts with accumulated dry deposition residue. The last portion may remain on leaves or other material for some time after rain has subsided, and since acids tend to concentrate during subsequent evaporation, its poten- tial for inflicting damage is also unique.
5. Concluding Remarks
The present 3-yr volume-weighted pH (4.35) agrees very closely with a spatially averaged estimate (4.3) for this location, based on Likens' and Butler's 1981 reassessment of H +
48 G. L. P E L L E T ET AL.
concentration data-isopleths for the eastern United States during the 1975-1976 period. A similar statement applies to our more limited subset of average sulfate and nitrate concentrations, and their ratio, based on 138 summer and early-fall samples out of 848 sequential samples. Taken altogether, the rainwater data from our suburban site are presently indistinguishable from projections of available results from rural clean air sites in adjacent parts of Virginia, North Carolina, and Maryland.
Statistical/analytic simplifications result from the demonstration that pH's of small sequential samples and event composites closely fit unimodal Gaussian distributions, and hence log-normal distributions for H + concentration. Since differences between the sequential-sample a (= 0.39 pH units) and the respective volume-weighted and un- weighted event o's were only 18~ and 5~o, the additive contribution of intraevent variability was relatively small compared to interevent variability, which was surprisingly large.
It is considered climatologically significant that the volume-weighted H + concen- trations of sequential samples, for all events, were very well characterized as a function of cumulative rainfall by a power-law fit (exponent = - 0.22). Furthermore, as a conse- quence, event-averaged H + deposition varied as the 0.78 power of event volume. While the former result differs from the assumption of linear proportionality sometimes used in the literature, it deviates less from unity than a recent plot of MAP3 S data on average SO4 concentration per event, versus rainfall amount (Pack, 1980); i.e., an exponent of -0.40 _+ 0.10 fits these SO4 data, which compares with -0 .22 for our H + data. Further study of this potential means of climtological characterization appears desirable.
Surprisingly, large and well-defined variations were observed between event-pH and 24-hr average meteorological and air quality parameters, and these were qualitatively consistent with our knowledge of air pollution chemistry. However, it should be empha- sized that the respective parametric correlations were not statistically independent and do not demonstrate causality, either individually or collectively.
The facts that initial rain was usually the most acidic, and considerable intraevent variation in pH occurred, emphasize the importance of collecting samples that represent entire rains if the data are to be accurate. For both event and weekly composites, sequential sampling should still be considered since it allows the experimenter to reject dirty samples (or at least isolate portions) without losing an entire collection. Subsequent measurements can be made on combined samples. Finally, volume-resolved sequential sampling with (at least) pH measurements allows one to study the effects of meteoro- logical and air quality parameters on precipitation acidity, in addition to making the usual event/weekly composition measurements and subsequent geographic and tempo- ral comparisons.
Acknowledgments
The authors gratefully acknowledge the assistance of G. C. Purgold, L. W. Spangler, and M. G. Perry for apparatus design and construction; L. W. Spangler, M. G. Perry, M. S. Finch, III and B. R. Adams for sample collection, pH measurements, and data

SEQUENTIAL SAMPLING AND VARIABILITY OF ACID PRECIPITATION 49
p roces s ing ; J o h n Salop, chemis t , S ta te Air Po l lu t ion Con t ro l B o a r d for supplying air
qual i ty da ta ; and P ro fe s so r B r o o k s M a d s e n and Mr . J o h n H o g s e t t o f the Un ive r s i t y
o f Cen t ra l F lo r ida , Or l ando , and Mr . H a n s R u d o l f o f the N A S A K e n n e d y Space
Center , for the chemica l analyses .
References
Anderson, D. E. and Landsberg, H. E.: 1979, Environ. Sci. Tech. 13, 991. Beilke, S. and Gravenhorst, G.: 1978, Atmos. Envir. 12, 231. Britton, L. G. and Clarke, A. G.: 1980, Atmos. Envir. 14, 829. Calvert. J. G. and Fu Su: 1978, Atmos. Envir. 12, 197. Cofer, W. R., III, Schryer, D. R., and Rogowski, R. S.: 1980, Atmos Envir. 14, 571. Cofer, W. R., III, Schryer, D. R., and Rogowski, R. S.: 1981, Atmos Envir. 15, 1281. Duce, R. A., Seto, Y., and Moyers, J. L.: 1969, Pac. Sci. 23, 483. Eggleton, A. E. J. and Cox, R. A.: I978, Atmos. Envir. 12, 227. Galloway, J. N. and Cowling, E. B.: 1978, J. Air Pollut. Control Assoc. 28, 229. Galloway, J. N. Cosby, B. J., and Likens, G. E.: 1979, Limnol. Oceanogr. 24, 1161. Garland, J. A.: 1978, Atmos. Envir. 12, 349. Gatz, D., Selman, R. F., Langs, R. K. and Holtzman, R.: 1971, J. Appl. Met. 10, 341. Granat, U: 1978, Atmos. Envir. 12, 413. Hales, J. M.: 1972, Atmos. Envir. 6, 635. Hales, J. M.: 1978, Atmos. Envir. 12, 389. Hornbeck, J. W., Likens, G. E., and Eaton, J. S.: 1977, Water, Air, and Soil Pollut. 7, 355. Likens, G. E. and Bormann, F. H.: 1974, Science 184, 1176. Likens, G. E., Wright, R. F., Galloway, J. N., and Butler, T. J.: Oct. 1979, Sci. Amer. 241, 43. Likens, G. E. and Butler, T. J.: 1981, Atmos. Envir. 15, 1103. MacCracken, M. C.: 1978, Atmos. Environ. 12, 649. Madsen, B. C.: 1981, Atmos. Environ. 15, 853. Marsh, A. R. W.: 1978, Atmos. Environ. 12, 401. Middleton, P., Kiang, C. S. and Mohnen, V. A.: 1980, Atmos. Environ. 14,463. Moller, D.: 1980, Atmos. Environ. 14, 1067. Pack, D. W.: 1978, Geophy. Res. Letters 5, 673. Pack, D. H. (ed.): 1979, Proceedings: Advisory Workshop to Identify Research Needs on Formation of Acid
Precipitation, CONF-780850, EPRI Workshop Report EA-1074, 270 pp. Pack, D. H.: 1980, Science 208, 1143. Pellett, G. L.: 1981, NASA Technical Paper 1801, 90 pp. Penkett, S. A., Jones, B. M. R., Brice, K. A., and Eggleton, A. E. J.: 1979, Atmos. Environ. 13, 123. Pickerell, D., Hook, T., Dolzine, T., and Robertson, J.: 1979, in Mulik, J. and Sawicki, E. (eds.): Ion
Chromatographic Analysis of Environmental Pollutants, Ann Arbor Sci. Pub., pp 289-293. Pruppacher, H. R. and Klett, J. D.: 1978, Microphysics of Clouds and Precipitation, D. Reidel PuN. Co.,
Dordrecht, Holland, 714 pp. Raynor, G. S. and Hayes, J. V.: 1978, Experimental Data from'Analysis of Sequential Precipitation Samples
at Brookhaven National Laboratory, Report BNL 50826, Brookhaven National Laboratory, Upton, N.Y., 44 pp.
Raynor, G. S. and McNeil, J. P.: 1979, Atmos. Environ. 13, 149. Raynor, G. S. and Hayes, J. V.: 1981, Water, Air, and Soil Poll. 15,229. Scott, B. C.: 1978, J. Appli. Met. 17, 1375. Seymour, M. D., Schubert, S. A., Clayton, J. W., and Fernando, Q.: 1978, Water, Air and Soil Pollut. 10, 147. Varshney, C. K. and Dochinger, L. S.: 1979, Curt. Sci. 48, No. 8, 337. Wilson, J., Mohnen, V., and Kadlecek, J.: 1980~ Wet Deposition in the Northeastern United States, ASRC
Publication 796, State Univ. New York, Albany, N.Y. Wisniewski, J. and Miller, J. M.: 1977, WMO Special Environment Report No. 10, Air Pollution Measurement
Techniques, WMO No. 460, World Meteorological Organization, Geneva, Switzerland, 63-69. Wolff, G. T., Lioy, P. J., Golub, H., and Hawkins, J. S.: 1979, Environ. Sci. Technol. 13, 209. Yue, G. K., Mohnen, V. A., and Kiang, C. S.: 1976. Water, Air and Soil Pollut. 6, 277.