Embed Size (px)
Citation preview
SENSORY COMPARISON OF A SOY ENHANCED CHOCOLATE CANDY AND A REGULAR
CHOCOLATE CANDY
PETER L. BORDI', CAROLYN LAMBERT, CYNTHIA A. DEVITIS and PO-JO CHEN
School of Hotel, Restaurant and Recreation Management 201 Mateer Building
me Pennsylvania State University University Park, PA I6802
AND
COLLEENCONLEY
Dupont Protein Technologies St. Louis. Missouri
Accepted for Publication September 9, 2002
ABSTRACT
Soy has become an option for many consumers due to its contribution to lowering serum cholesterol levels. The objective of this study was to compare the sensory qualities of a soy-enhanced chocolate candy with a regular candy bar. The study required the reformulation of an existing chocolate peanut butter candy bar with five grams of soy protein isolate incolporated into the existing recipe resulting in a more nutritious product containing 21 % of the recommend- ed daily allowance (RDA) for calcium, 16% of the RDA for protein and 24% faoer calories than a regular bar. Based on USDA food label regulations, this candy bar is an excellent source of calcium. The soy-enhanced candy bar(test) was evaluated by 70 employees from Protein Technologies Incorporated (PTI) and Ralston Purina along with the regular (control) candy bar. Results of the sensory testing with the use of one-way variance did not indicate a significant difference between the control product and the test product for any of six categories; liking of appearance, liking of overall flavor, liking offillingmvor, liking of chocolate flavor, liking of texture, amount of chocolate coating, and color offilling. The mean overall liking score was 7.2 for the control and 7.1 for the test. An ANOVA test indicated that the overall likings of the two bars were not found to be significantly different. Food science professionals and food
Corresponding author E-mail: [email protected]
Foodservice Research International 13 (2002) 193-201. All Rights Reserved. OCopyright 2002 by Food & Nutrition Press, Inc., Trumbull, Connecticut. 193
194 P.L. BORDI ETAL.
manufacturers need to work cooperatively to develop more nutritious versions of familiar products.
INTRODUCTION
Cardiovascular disease (CVD) is the primary cause of death in the United States for both men and women, accounting for more than 950,000 deaths annually (American Heart Association 2001). A major cause of the incidence of CVD is cholesterol (American Heart Association 2001). Total cholesterol and low-density lipoprotein cholesterol (LDL) have been identified as primary independent risk factors for coronary heart disease (Stamler et al. 1986; Holme 1990). It is estimated that over 99 million American adults have total blood cholesterol levels of 200 mg/dL and higher. In adults, total cholesterol levels of 240 mg/dL or higher are considered high; levels from 200 to 239 mg/dL are considered borderline-high (American Heart Association 200 1). The relationship between total cholesterol and CVD is continuous throughout the range of blood cholesterol levels, with the strongest association observed at the highest levels (Stamler et al. 1986). In comparison, those with increased levels of high-density lipoproteins (HDL) tend to have a lower incidence of CVD. Gordon et al. (1989) analyzed four previous studies and found a consistent inverse relationship between HDL levels and coronary heart disease (CHD.) Numerous investiga- tions have established a causal link between low-density lipoproteins (LDL) and the risk of coronary heart disease (National Cholesterol Education Program 1993). Therefore, interventions that successfully lower total and LDL cholesterol levels may reduce CHD. According to the Food and Drug Administration (FDA 1996) :
Factors that decrease total blood cholesterol and LDL cholesterol levels also tend to decrease the risk of CHD. Thus, the total cholester- ol levels can predict the risk of developing CHD and those dietary factors affecting blood cholesterol levels are related to CHD 56 FR 60582, 60583 (Nov. 27, 1991).
These interventions may include the inclusion of soy and chocolate in functional foods consumed in the average diet.
Although protein is an essential nutrient, demand for higher levels in food products is being driven by consumer interest in improving health. In order to meet this desire for higher protein diets, many food companies are seeking to boost the protein content of many different foods. Companies and product developers have a variety of protein ingredients to choose from when formulat- ing protein-enhanced food products (Hegenbart 2001). Soy protein isolate

SENSORY COMPARISON OF CHOCOLATE CANDY 195
represents one such new ingredient in the food industry. Used in various new and reformulated traditional food products, this ingredient has met with both success and failure in its adoption into consumer diets (Sellers ef al. 1986). Most products created today are designed to satisfy consumer needs (ASTM 1979). Of the hundreds of food products introduced each year, at least 90% disappear quickly from the market, to be reintroduced after a few years (Stone 1988). Product concepts may arise from a variety of sources, including marketing and research departments, management input, consumer research, and idea generation (Resurrmion 1988). Isolated soy protein is far more popular in Asia where average per-capita consumption of soy ranges from 10 to 30 g per day (Messina el al. 1994a). Average per-capita soy intake in the United States is only 3 g per day (Hutchins et al. 1995), however, soy consumption has increased in the United States in recent years. As people become more aware of the possible health benefits of soy and purchase more food products that are soy protein based, there will continue to be an increase in soy consumption.
Soy Foods
Consumers are turning to soy protein in light of research indicating soy protein’s ability to reduce serum cholesterol. The Food and Drug Administration approved a health claim covering this relationship in 1999 (Henkel2000). Other research indicates that soy protein has benefits beyond cholesterol reduction, including decreasing the risk for developing kidney disease and breast cancer, easing of menopausal symptoms, and lowering the potential for insulin resistance in diabetes (Hegenbart 2001). According to Hendrich et al. (1998), soy ingredients have received considerable attention as a source of the isoflavones that have health protective effects in both humans and animals. Soy foods may be divided into four classes: (1) soy ingredients; (2) traditional soy foods; (3) second generation soy foods; and (4) foods in which soy is used as a functional ingredient. Examples of soy ingredients include texturized vegetable soy protein (TVP) and hydrolyzed soy protein; traditional soy foods include soy milks, tofu, and other soy-based foods traditional to the Asian cuisine; second generation, including soy-based burgers and hot dogs; and soy as a functional product, such as soy flour (found in soy muffins and soy bread products). Soy flour is often added to improve texture and to whiten the color of baked goods (Hegenbart 2001).
Chocolate in Functional Foods
The surge in the functional food market is not only affecting health-related foods, but is now inundating confectionery or candy products. The public is looking for many ways to incorporate functional foods into their daily regimens; demand for these types of products has been found traditionally in the

196 P.L. BORDI E T A .
~
Categories
Sensory criteria
supplement aisle or in health food stores. A tour of grocery stores, however, reveals that candy aisles are now stocked with chocolate-based health bars that contain minerals, herbs, and vitamins (Kuntz 2001).
The supplements that are in chocolate bars are not the only healthy ingredients, as cocoa powder and chocolate are also part of the health claim. Chocolate contains some chemicals, methylxanthines, which can alter mood. It also contains flavonoid antioxidants that may reduce LDL oxidation and the formation of plaque on the artery walls (Kuntz 2001). The amount of antioxi- dants is based on the color of the chocolate - the darker the chocolate, the greater the amount of antioxidants. In his recent study, Kuntz suggested that cocoa powder might help decrease blood clots by relaxing the inner surface of the blood vessels, leveling out blood pressure and preventing arteriosclerosis. This effect occurs because the chocolate compounds elevate the nitric-oxide concentrations, which relaxes blood vessels (Kuntz 2001). A recent study also concluded that the biologic effects of flavonoid-rich cocoas and chocolate support the concept that the consumption of flavonoid rich foods may be associated with positive cardiovascular effects (Kris-Etherton and Keen 2002).
Quality Indices Measurement Methods
Appearance Sensory evaluation Color of filling
METHODOLOGY
The product development team included a food scientist and a research chef. The food scientist had 28 years of product development of candy products. The research chef had nine years of experience working on soy-based baked and confectionary products. A sensory analyst consulted on the project.
The first task was to define the product quality characteristics that effected consumer acceptance, nutritional value and cost.
TABLE 1 . PRODUCT QUALITY CHARACTERISTICS
Texture of filling I Taste ~
Nutritional value I hotein content I Calculation method I I
Storage property Shelf-life Based on previous product

SENSORY COMPARISON OF CHOCOLATE CANDY 197
Nuwient
Serving Size
The product contained three major ingredients; chocolate, peanut butter and soy. However, the percentage of chocolate to filling had to remain the same. So, the filling was the major concern. A simple lattice design was used for the two components (Hu 1999).
The objective was to incorporate as much soy protein as possible, while maintaining the sensory quality indices. Thirty-two trials were run to determine when the product reached the maximum level of soy protein while retaining the consistency necessary to be processed. As shown in Table 2, the final soy- enhanced candy bar contained 8 g (16%) of the RDA for protein and 21 % of the RDA for calcium. A regular candy bar offers 3 g of protein and minimal amounts of calcium. The soy-enhanced candy bar may be considered a good source of protein and an excellent source of calcium according to FDA label regulations. After the initial nutrient content was determined, a company was sought to produce the item in larger quantities. Several different companies were contacted; however, a candy manufacturing company was selected in central Pennsylvania to produce the candy bar. After several trials runs, a production run of 50 pounds of soy-enhanced candy bars and 50 lb of regular candy bars were manufactured and shipped to the sensory analyst. Seventy employees from Protein Technologies International and Ralston Purina sampled the regular (control) and soy-enhanced (test) bars. The participants were preselected as frequent consumers of chocolate and peanut butter candy bars. The bars were judged using a %point hedonic acceptance with a 5-pOint “Just About Right” scale. The sensory attributes were as follows: Liking of Appearance; Liking of Overall Flavor; Liking of Filling Flavor; Liking of Chocolate Flavor; Liking of Texture; Amount of Chocolate Coating; Color of Filling.
~~ ~~
Soy-enhanced Bar Regular Chocolate Bar
42.5 g 43 g
TABLE 2.
CHOCOLATEANDREGULARCHOCOLATE COMPARISON OF THE NUTRITIONAL VALUE OF THE SOY-ENHANCED
Kcal
protein
Carbohydrate
Fat
Saturated fat
Calcium
1 -
228 300 kcal
8.0 g (4 g SOY) 20 g 23 g
14 g 19 g
7 g 8 g
3 g
213 mg NIA
198
Control Mean Test df (SD) Mean (SD)
7.2 (1.5) 7.1 (1.4) (1,138)
7.4 (1.1) 7.6 (1.0) (1,138)
7.2 (1.2) 7.2 (1.2) (1,138)
7.1 (1.5) 6.8 (1.4) (1,138)
7.3 (1.3) 7.2 (1.2) (1,138)
i 6.9 (1.7) 6.8 (1.5) (1,138)
P.L. BORDI ETAL.
F
0.16
0.59
0.04
1.05
0.26
0.06
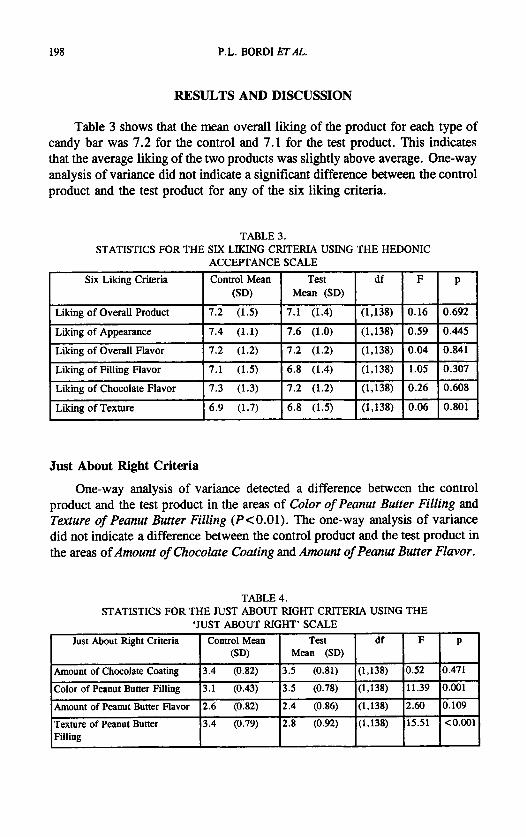
RESULTS AND DISCUSSION
Test df Mean (SD)
3.5 (0.81) (1,138)
3.5 (0.78) (1,138)
2.4 (0.86) (1,138)
2.8 (0.92) (1,138)
Table 3 shows that the mean overall liking of the product for each type of candy bar was 7.2 for the control and 7.1 for the test product. This indicates that the average liking of the two products was slightly above average. One-way analysis of variance did not indicate a significant difference between the control product and the test product for any of the six liking criteria.
F P
0.52 0.471
11.39 0.001
2.60 0.109
15.51 <0.001
STATISTICS FOR TH
Just About Right Criteria
Amount of Chocolate Coating
Color of Peanut Butter Filling
Amount of Peanut Butter Flavor
Texture of Peanut Butter Filling
Six Likiig Criteria
Control Mean (SD)
3.4 (0.82)
3.1 (0.43)
2.6 (0.82)
3.4 (0.79)
Liking of Overall Product
Likiig of Appearance
Liking of Overall Flavor
Liking of Filling Flavor
Liking of Chocolate Flavor
Liking of Texture
0.841
0.307
0.801
Just About Right Criteria
One-way analysis of variance detected a difference between the control product and the test product in the areas of Color of Peanut Butter Filling and Texture of Peanut Butter Filling (PCO.01). The one-way analysis of variance did not indicate a difference between the control product and the test product in the areas of Amount of Chocolate Coating and Amount of Peanut Butter Flavor.
SENSORY COMPARISON OF CHOCOLATE CANDY 199
As the public’s awareness of the benefits of soy and other functional foods increases, the food development industry needs to incorporate these products into a variety of foods so that consumers are given more options. The soy-enhanced candy bar proves the point that consumers are willing to add these items to their diet as long as the product is appetizing. When the panel was asked which bar they would purchase, there was no significant difference in the purchase intent between the two bars. People tend to accept new foods into their diet when they believe that the foods will enhance the value of their diet. The fact that the soy- enhanced candy bar is a reformulated product makes the food more acceptable to the public; therefore, success in the market is likely. However, the product must still have the anticipated value of the original food. Another factor which will need to be researched is the cost differential that customers will pay for the soy-enhanced candy bar.
IMPLICATIONS
The success of new technology in the food industry, whether new production technologies or new ingredients in processed foods, ultimately depends upon consumer acceptance of the final product (Sellers et al. 1988). Food manufacturers and food science professionals should strive to develop a variety of these innovative products that are designed to improve the health of Americans.
REFERENCES
American Heart Association. 1998. AHA 1997 Heart and Stroke Statistical
American Heart Association. 2001. http://www.americanheart.org. American Heart Association. 2001. AHA 2002 Heart and Stroke Statistical
Update. American Heart Association, Dallas, Texas. American Society for Testing Materials, Committee E-18.1979. ASTM Manual
on Consumer Sensory Evaluation, ASTM Special Technical Publication 682, (E.E. Schaefer, ed.) pp. 28-30, American Society for Testing and Materials, Philadelphia, PA.
Food and Drug Administration, U.S. Dept. of Health and Human Services. 1996. Consumer impacts of health claims: An experimental study. Washington, DC.
GORDON, D.J. et al. 1989. High density lipoprotein cholesterol and cardiovas- cular disease; four prospective American studies. Circulation 79, 8-15.
Update. American Heart Association, Dallas, Texas.
200 P.L. BORDI E T A .
HEGENBART, S. 2001. Push for high protein. In Food Product Design. pp. 47-66, Weeks Publishing Co, Northbrook, IL.
MURPHY, P.A. 1998. Human bioavailabilty of soy isoflavones: influences of diet, dose, time and gut microflora. In Functional Foodr, (T. Shibamoto, ed.) pp. 150, ACS Monograph, ACS Books, Washington, DC.
HENKEL, J. 2000. Soy: Health claims for soy protein, questions about other components. FDA Consumer. 34(3), 13-5, 18-20.
HOLME, I. 1990. An analysis of randomized trials evaluating the effect of cholesterol reduction on total mortality and coronary heart disease incidence. Circulation 82, 1916-1924.
HU, R. 1999. Food Product Design, pp. 29-32, Technomic Publishing Co., Lancaster, PA.
HUTCHINS, A.M., SLAVIN, J.L. and LAMPE, J.W. 1995. Urinary isoflavoid phytoestrogen and lignin excretion after consumption of fermented and unfermented soy products. J. Am. Diet Assoc. 95, 545-551.
KRIS-ETHERTON, P.M. and KEEN, C.L. 2002. Evidence that the antioxidant flavonoids in tea and cocoa are beneficial for cardiovascular health. Current Opinion Lipidology 13, 41-49.
KUNTZ, L. 2001. The functional confection connection. In Food Product Design, pp. 67-80, Weeks Publishing Co., Northbrook, IL.
MESSINA, J.J., PERSKY, V., SETCHELL, K.D.R. and BARNES, S. 1994a. Soy Intake and Cancer Risk: A review of the in vitro and in vivo data. Nutr. Cancer 21, 113-131.
MESSINA, M., MESSINA, V. and SETCHELL, K.D.R. 1994b. Soy foods and cancer prevention. In The Simple Soybean and Your Health. pp. 77-86, Avery, New York.
National Cholesterol Education Program. 1993. Second Report of the Expert Panel on Detection, Evaluation, and Treatment of High Blood Cholesterol in Adults (Adult Treatment Panel 11). NIH (NIH Publication no 93-3095) Bethesda, MD.
National Heart, Lung, and Blood Institute. 1992. Morbidity and Mortality Chartbook on cardiovascular, lung, and blood diseases-1990. pp. 69, U.S. Dept. of Health and Human Services, Public Health Service, NIH, Bethesda, MD.
RESURRECCION, A.V.A. 1988. Applications of multivariate methods in food quality evaluation. Food Technol. 42(11), 128, 130, 132-134, 136.
SELLERS, S.G., BENNETT, J.W. and COLE, W. 1988.The importance of traditional quality for foods containing vegetable protein ingredients. In Soy Protein and National Food Policy, (F.H. Schwarz, ed.) pp. 273-349.
HENDRICH, S., WANG, G-J., XU, X., TEW, B., WANG, H.J. and
SENSORY COMPARISON OF CHOCOLATE CANDY 20 1
STAMLER, J., WENTWORTH, D. and NEATON J.D. 1986. Is the relation- ship between serum cholesterol and risk of premature death from coronary heart disease continuous and graded? Findings in 356,222 primary screens of the Multiple Risk Factor Intervention Trial. J. Am. Med. Assoc. 256,
STONE, H. 1988. Using sensory resources to identify successful products. In Food Acceptability, (D.M.H. Thompson, ed.) pp. 283-296, Elsevier, London.
2823-2828.