Embed Size (px)
Citation preview
in-crop
PA in Practice II Using precision agriculture technologies: a guide to getting the best results
88
Sensors offer potential for in-crop decisions
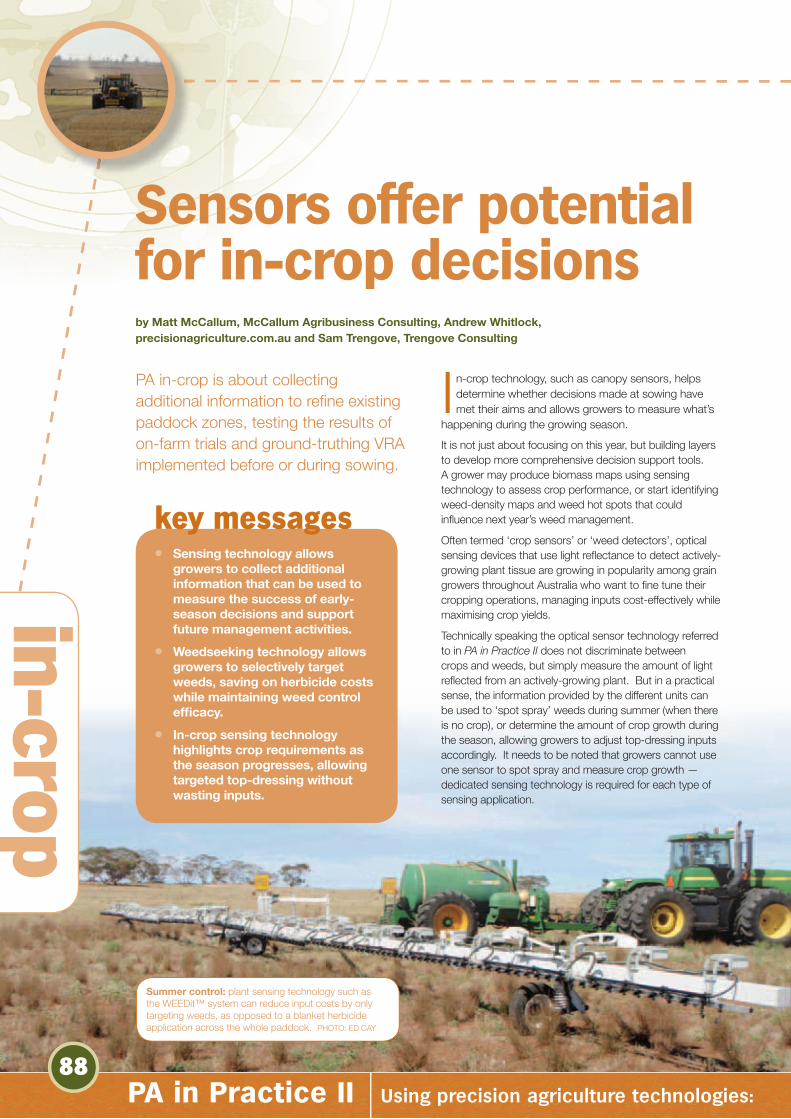
PA in-crop is about collecting additional information to refi ne existing paddock zones, testing the results of on-farm trials and ground-truthing VRA implemented before or during sowing.
In-crop technology, such as canopy sensors, helps determine whether decisions made at sowing have met their aims and allows growers to measure what’s
happening during the growing season.
It is not just about focusing on this year, but building layers to develop more comprehensive decision support tools. A grower may produce biomass maps using sensing technology to assess crop performance, or start identifying weed-density maps and weed hot spots that could infl uence next year’s weed management.
Often termed ‘crop sensors’ or ‘weed detectors’, optical sensing devices that use light refl ectance to detect actively-growing plant tissue are growing in popularity among grain growers throughout Australia who want to fi ne tune their cropping operations, managing inputs cost-effectively while maximising crop yields.
Technically speaking the optical sensor technology referred to in PA in Practice II does not discriminate between crops and weeds, but simply measure the amount of light refl ected from an actively-growing plant. But in a practical sense, the information provided by the different units can be used to ‘spot spray’ weeds during summer (when there is no crop), or determine the amount of crop growth during the season, allowing growers to adjust top-dressing inputs accordingly. It needs to be noted that growers cannot use one sensor to spot spray and measure crop growth — dedicated sensing technology is required for each type of sensing application.
by Matt McCallum, McCallum Agribusiness Consulting, Andrew Whitlock, precisionagriculture.com.au and Sam Trengove, Trengove Consulting
• Sensing technology allows growers to collect additional information that can be used to measure the success of early-season decisions and support future management activities.
• Weedseeking technology allows growers to selectively target weeds, saving on herbicide costs while maintaining weed control effi cacy.
• In-crop sensing technology highlights crop requirements as the season progresses, allowing targeted top-dressing without wasting inputs.
key messages
Summer control: plant sensing technology such as the WEEDit™ system can reduce input costs by only targeting weeds, as opposed to a blanket herbicide application across the whole paddock. PHOTO: ED CAY
89PA in Practice II Using precision agriculture technologies: a guide to getting the best results
There are fi ve main commercially-available sensors on the market in Australia that growers are using —WeedSeeker™, WEEDit™, GreenSeeker™, OptRx™ (formerly Crop Circle™) and CropSpec™ (see Table 1, page 91 for more information).
Sensors for weed control
The WeedSeeker and WEEDit products use sensing technology to detect and spray weeds, mainly during the summer-autumn period (see Figure 1). Growers can gain substantial cost savings targeting herbicide application at weeds only, as opposed to blanket applications across a paddock.
Although a less common practice, these tools can also be used for in-crop weed control either very early or very late in the season or used under shrouds between crop rows during the season.
In-crop sensing
The GreenSeeker, OptRx and CropSpec sensors are responsive to both crop biomass (amount of vegetation) and crop colour (which relates to chloropyll concentration and/or nutrient concentration).
A darker green crop gives higher values than a paler green crop for the same given biomass. While the use of this technology is slowly evolving, growers are starting to apply this information to vary inputs during the growing season, for example nitrogen, trace elements and herbicides.
After the information from the sensor is processed, growers can interpret the results into a VRA paddock map, which they can then load into a controller with VRA capacity.
Alternatively, where growers are confi dent the information supplied by the sensors refl ects exactly what is happening in the paddock, inputs can be varied on-the-go as data is collected from sensors mounted on a tractor, sprayer or similar machinery.
Direction of travel
WeedSeeker™
3
14
2
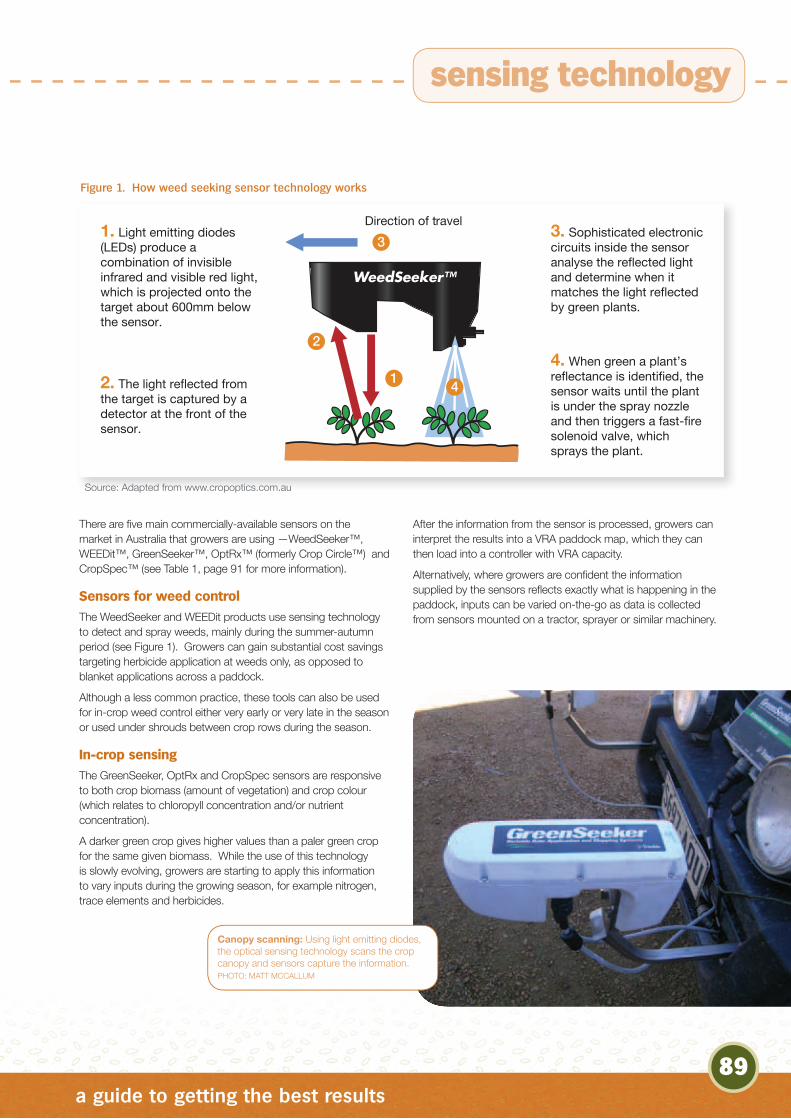
1. Light emitting diodes (LEDs) produce a combination of invisible infrared and visible red light, which is projected onto the target about 600mm below the sensor.
2. The light reflected from the target is captured by a detector at the front of the sensor.
3. Sophisticated electronic circuits inside the sensor analyse the reflected light and determine when it matches the light reflected by green plants.
4. When green a plant’s reflectance is identified, the sensor waits until the plant is under the spray nozzle and then triggers a fast-fire solenoid valve, which sprays the plant.
Figure 1. How weed seeking sensor technology works
Canopy scanning: Using light emitting diodes, the optical sensing technology scans the crop canopy and sensors capture the information. PHOTO: MATT MCCALLUM
sensing technology
Source: Adapted from www.cropoptics.com.au
in-crop
PA in Practice II Using precision agriculture technologies: a guide to getting the best results
90
In this section readers will read about SPAA trials and grower experiences with sensors for weed control and VRA programs. Compared with yield mapping, paddock zoning and VRA at sowing, the uptake of this technology is only in its infancy, but on-going research and grower experiences will drive adoption into the future.
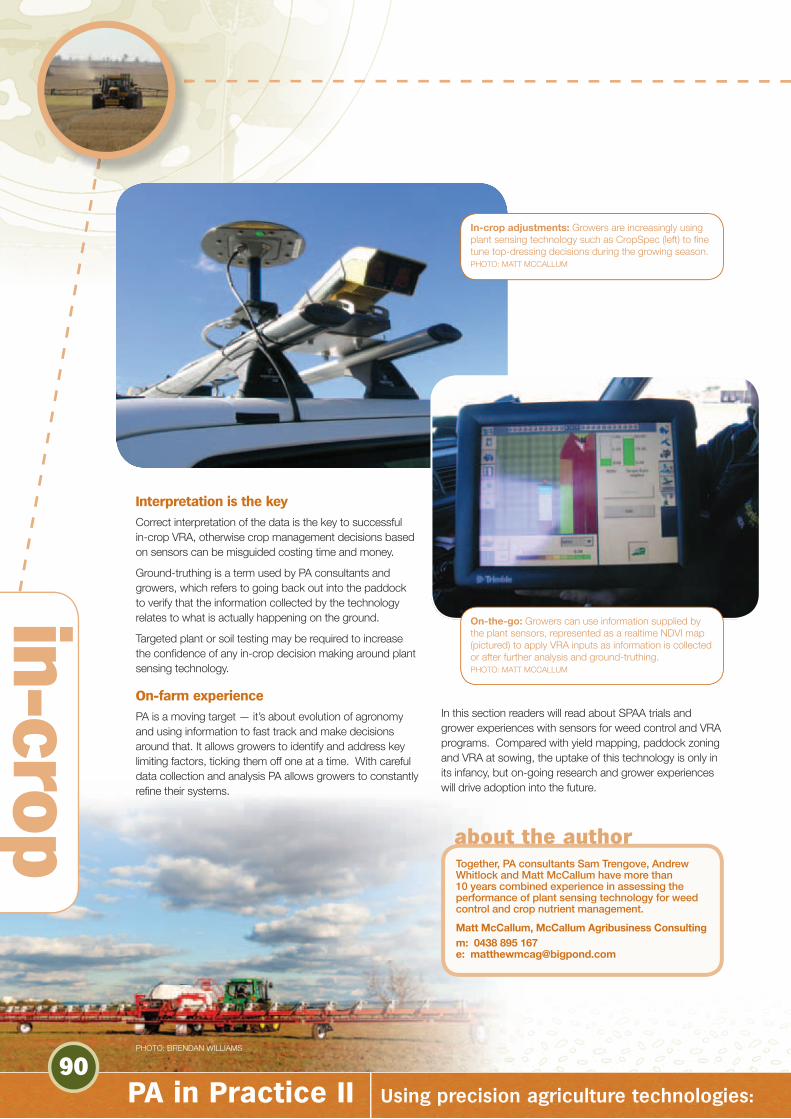
In-crop adjustments: Growers are increasingly using plant sensing technology such as CropSpec (left) to fi ne tune top-dressing decisions during the growing season.PHOTO: MATT MCCALLUM
On-the-go: Growers can use information supplied by the plant sensors, represented as a realtime NDVI map (pictured) to apply VRA inputs as information is collected or after further analysis and ground-truthing.PHOTO: MATT MCCALLUM
Interpretation is the key
Correct interpretation of the data is the key to successful in-crop VRA, otherwise crop management decisions based on sensors can be misguided costing time and money.
Ground-truthing is a term used by PA consultants and growers, which refers to going back out into the paddock to verify that the information collected by the technology relates to what is actually happening on the ground.
Targeted plant or soil testing may be required to increase the confi dence of any in-crop decision making around plant sensing technology.
On-farm experience
PA is a moving target — it’s about evolution of agronomy and using information to fast track and make decisions around that. It allows growers to identify and address key limiting factors, ticking them off one at a time. With careful data collection and analysis PA allows growers to constantly refi ne their systems.
PHOTO: BRENDAN WILLIAMS
Together, PA consultants Sam Trengove, Andrew Whitlock and Matt McCallum have more than 10 years combined experience in assessing the performance of plant sensing technology for weed control and crop nutrient management.
Matt McCallum, McCallum Agribusiness Consultingm: 0438 895 167e: [email protected]
about the author
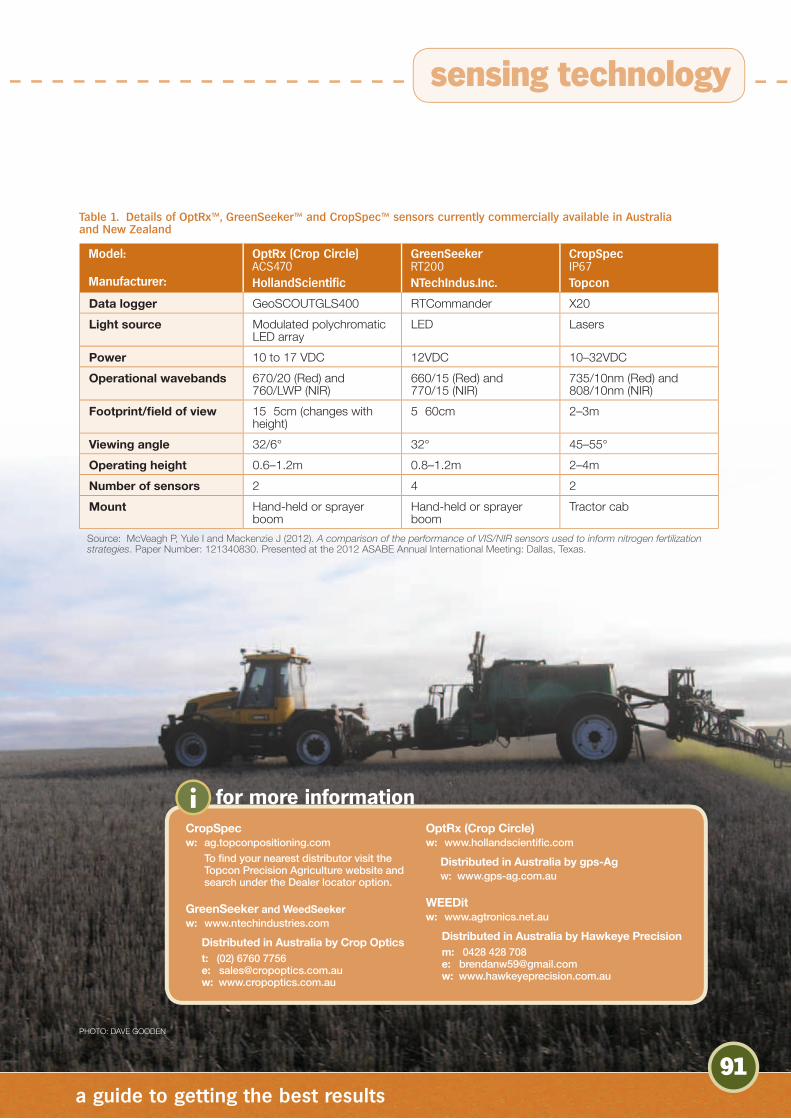
Model:
Manufacturer:
OptRx (Crop Circle) ACS470HollandScientific
GreenSeekerRT200NTechIndus.Inc.
CropSpecIP67Topcon
Data logger GeoSCOUTGLS400 RTCommander X20
Light source Modulated polychromatic LED array
LED Lasers
Power 10 to 17 VDC 12VDC 10–32VDC
Operational wavebands 670/20 (Red) and 760/LWP (NIR)
660/15 (Red) and 770/15 (NIR)
735/10nm (Red) and 808/10nm (NIR)
Footprint/fi eld of view 15×5cm (changes with height)
5×60cm 2–3m
Viewing angle 32/6° 32° 45–55°
Operating height 0.6–1.2m 0.8–1.2m 2–4m
Number of sensors 2 4 2
Mount Hand-held or sprayer boom
Hand-held or sprayer boom
Tractor cab
Source: McVeagh P, Yule I and Mackenzie J (2012). A comparison of the performance of VIS/NIR sensors used to inform nitrogen fertilization strategies. Paper Number: 121340830. Presented at the 2012 ASABE Annual International Meeting: Dallas, Texas.
Table 1. Details of OptRx™, GreenSeeker™ and CropSpec™ sensors currently commercially available in Australia and New Zealand
PA in Practice II Using precision agriculture technologies: a guide to getting the best results
91
PHOTO: DAVE GOODEN
sensing technology
for more informationiCropSpec w: ag.topconpositioning.com
To fi nd your nearest distributor visit the Topcon Precision Agriculture website and search under the Dealer locator option.
GreenSeeker and WeedSeeker w: www.ntechindustries.com
Distributed in Australia by Crop Optics t: (02) 6760 7756 e: [email protected] w: www.cropoptics.com.au
OptRx (Crop Circle) w: www.hollandscientifi c.com
Distributed in Australia by gps-Ag w: www.gps-ag.com.au
WEEDit w: www.agtronics.net.au
Distributed in Australia by Hawkeye Precision m: 0428 428 708 e: [email protected] w: www.hawkeyeprecision.com.au
in-crop
PA in Practice II Using precision agriculture technologies: a guide to getting the best results
92
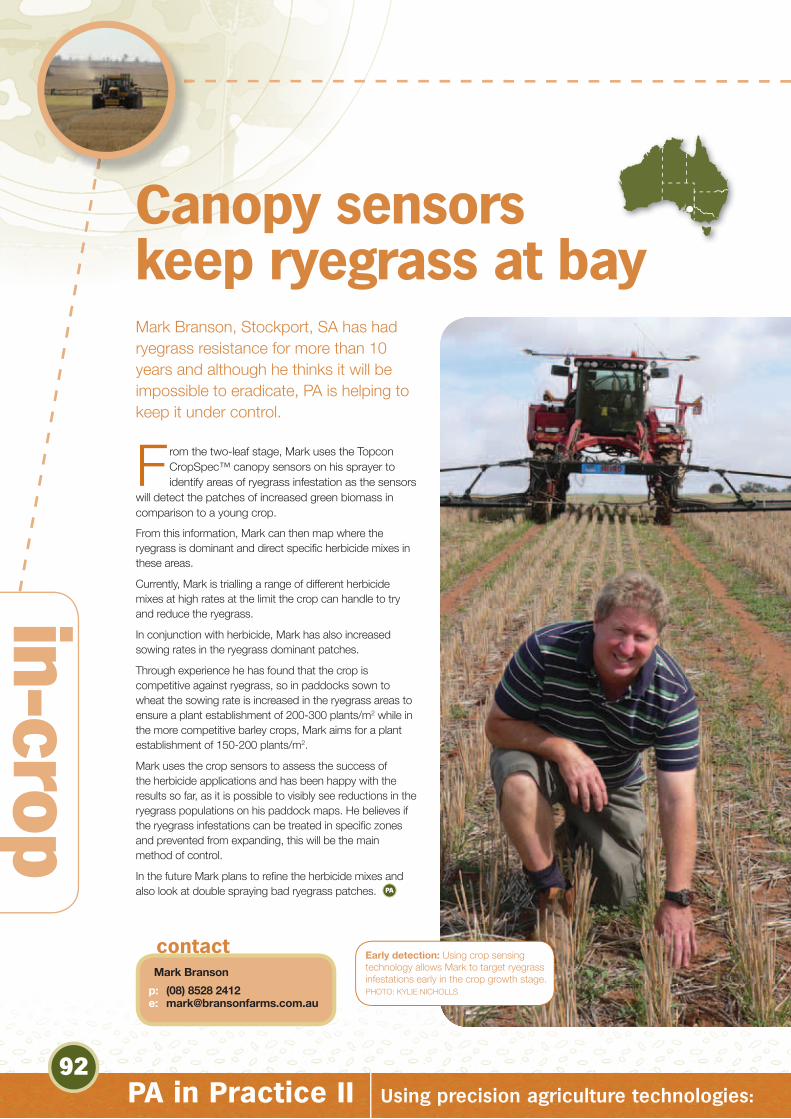
Canopy sensors keep ryegrass at bayMark Branson, Stockport, SA has had ryegrass resistance for more than 10 years and although he thinks it will be impossible to eradicate, PA is helping to keep it under control.
From the two-leaf stage, Mark uses the Topcon CropSpec™ canopy sensors on his sprayer to identify areas of ryegrass infestation as the sensors
will detect the patches of increased green biomass in comparison to a young crop.
From this information, Mark can then map where the ryegrass is dominant and direct specifi c herbicide mixes in these areas.
Currently, Mark is trialling a range of different herbicide mixes at high rates at the limit the crop can handle to try and reduce the ryegrass.
In conjunction with herbicide, Mark has also increased sowing rates in the ryegrass dominant patches.
Through experience he has found that the crop is competitive against ryegrass, so in paddocks sown to wheat the sowing rate is increased in the ryegrass areas to ensure a plant establishment of 200-300 plants/m2 while in the more competitive barley crops, Mark aims for a plant establishment of 150-200 plants/m2.
Mark uses the crop sensors to assess the success of the herbicide applications and has been happy with the results so far, as it is possible to visibly see reductions in the ryegrass populations on his paddock maps. He believes if the ryegrass infestations can be treated in specifi c zones and prevented from expanding, this will be the main method of control.
In the future Mark plans to refi ne the herbicide mixes and also look at double spraying bad ryegrass patches. PA
Mark Branson
p: (08) 8528 2412 e: [email protected]
contact Early detection: Using crop sensing technology allows Mark to target ryegrass infestations early in the crop growth stage.PHOTO: KYLIE NICHOLLS

case study
93PA in Practice II Using precision agriculture technologies: a guide to getting the best results
Precision spraying options reduce chemical costsThe Postlethwaite family use a combination of band and shielded spraying to reduce chemical use and costs by up to $27 per hectare on their 2400ha mixed farming enterprise near St Arnaud, Victoria.
A 2cm autosteer and tailor made spraying equipment, fi tted to their sowing and spraying tractors have enabled the Postlethwaite’s to adopt precision spraying
techniques to wide-row crops such as faba beans and chickpeas.
All pulse crops (lentils, beans, chickpeas and vetch) are sown 1m apart in paired rows (225mm apart) and Neale uses a combination of shielded and band-spraying techniques to strategically apply chemicals to these crops.
Wheat, barley and canola are all sown on straight 225mm spacings.
During the past, all wide-row pulse crops were sprayed on the inter-row, using a shielded sprayer with cheaper knockdown herbicides (glyphosate, paraquat, diquat).
The more expensive selective herbicides and fungicides were sprayed just on the row itself (band spraying) saving Neale $27/ha on chemical in total.
During recent years the cost of in-crop grass control herbicides has dramatically reduced, so Neale now blanket sprays products such as clethodim on pulse crops, although he still band sprays fungicides, which are more expensive.
In addition to clethodim, shielded spraying with knockdown products is still used to strategically control ryegrass on a few paddocks each year.
Tailor made
The Postlethwaites manufactured their own shielded spraying unit due to a lack of commercially-available equipment suitable for their operation. They now produce them commercially, along with other controlled traffi c farming equipment (for more information go to tpos.com.au). PA
Neale Postlethwaite
m: 0407 547 848e: [email protected]
contact
Cutting costs: Inter-row spraying using 2cm autosteer accuracy and wide rows provides opportunities to signifi cantly reduce chemical costs. PHOTO: NEALE POSTLETHWAITE
Where are they now
in-crop
PA in Practice II Using precision agriculture technologies: a guide to getting the best results
94
SPAA trials have revealed that the use of WeedSeeker™ technology to spot spray low- to moderate-density weed burdens can reduce
water use (and hence chemical use) by up to 78% when compared with blanket application.
But where weed densities exceed about 60–80% across a paddock, a blanket application can actually be more cost-effective.
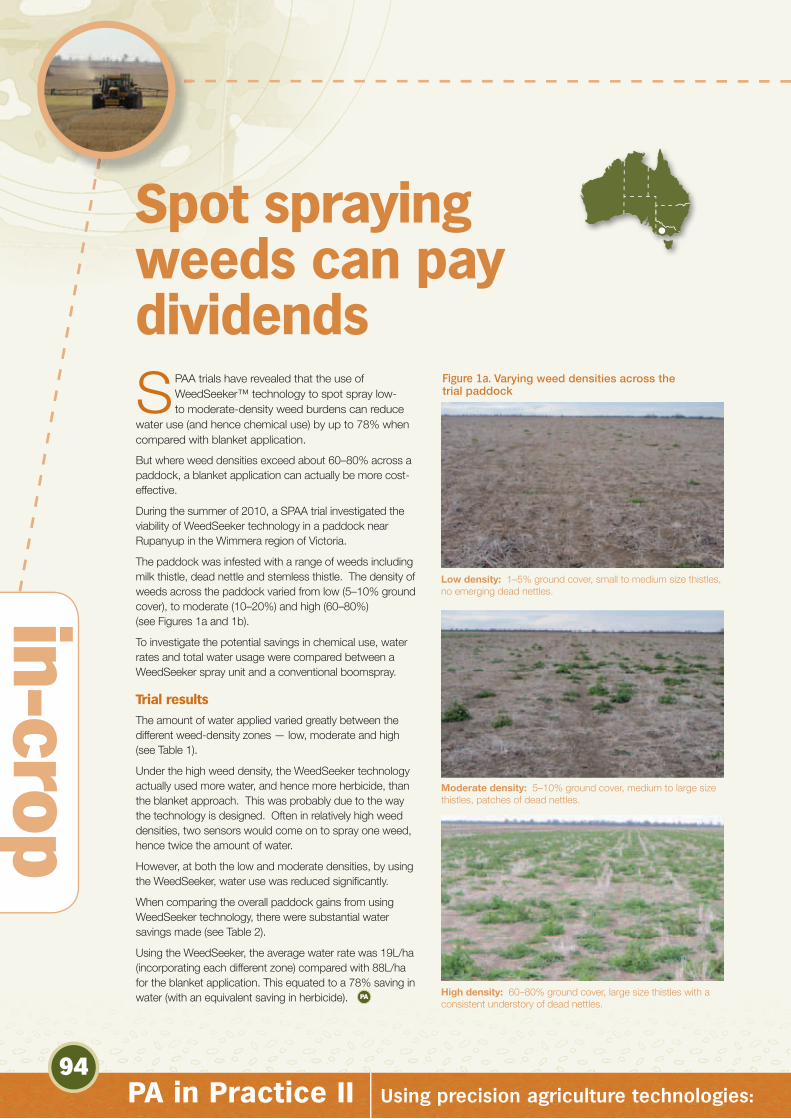
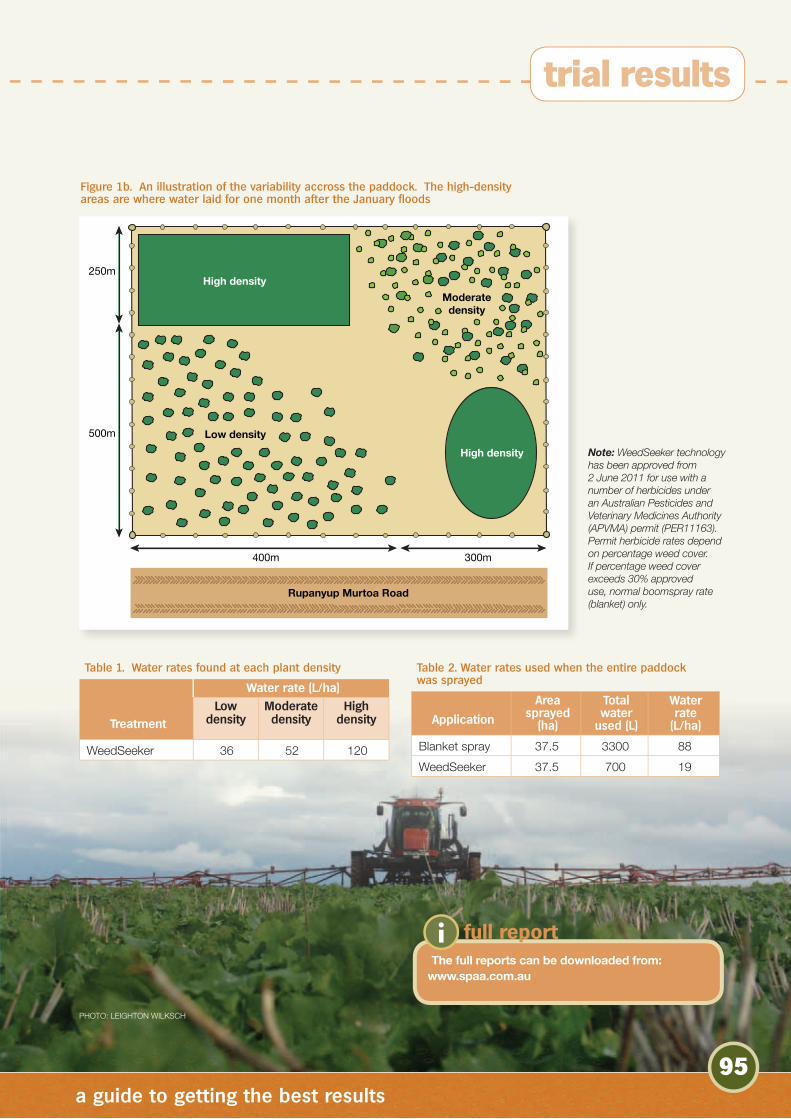
During the summer of 2010, a SPAA trial investigated the viability of WeedSeeker technology in a paddock near Rupanyup in the Wimmera region of Victoria.
The paddock was infested with a range of weeds including milk thistle, dead nettle and stemless thistle. The density of weeds across the paddock varied from low (5–10% ground cover), to moderate (10–20%) and high (60–80%) (see Figures 1a and 1b).
To investigate the potential savings in chemical use, water rates and total water usage were compared between a WeedSeeker spray unit and a conventional boomspray.
Trial results
The amount of water applied varied greatly between the different weed-density zones — low, moderate and high (see Table 1).
Under the high weed density, the WeedSeeker technology actually used more water, and hence more herbicide, than the blanket approach. This was probably due to the way the technology is designed. Often in relatively high weed densities, two sensors would come on to spray one weed, hence twice the amount of water.
However, at both the low and moderate densities, by using the WeedSeeker, water use was reduced signifi cantly.
When comparing the overall paddock gains from using WeedSeeker technology, there were substantial water savings made (see Table 2).
Using the WeedSeeker, the average water rate was 19L/ha (incorporating each different zone) compared with 88L/ha for the blanket application. This equated to a 78% saving in water (with an equivalent saving in herbicide). PA
Spot spraying weeds can pay dividends
Figure 1a. Varying weed densities across the trial paddock
Low density: 1–5% ground cover, small to medium size thistles, no emerging dead nettles.
Moderate density: 5–10% ground cover, medium to large size thistles, patches of dead nettles.
High density: 60–80% ground cover, large size thistles with a consistent understory of dead nettles.
95PA in Practice II Using precision agriculture technologies: a guide to getting the best results
Moderatedensity
Low density
250m
500m
400m 300m
High density
High density
Rupanyup Murtoa Road
Figure 1b. An illustration of the variability accross the paddock. The high-density areas are where water laid for one month after the January floods
Table 1. Water rates found at each plant density
Treatment
Water rate (L/ha)
Low density
Moderate density
High density
WeedSeeker 36 52 120
Table 2. Water rates used when the entire paddock was sprayed
Application
Area sprayed
(ha)
Total water
used (L)
Water rate
(L/ha)
Blanket spray 37.5 3300 88
WeedSeeker 37.5 700 19
The full reports can be downloaded from:www.spaa.com.au
full reporti
trial results
PHOTO: LEIGHTON WILKSCH
Note: WeedSeeker technology has been approved from 2 June 2011 for use with a number of herbicides under an Australian Pesticides and Veterinary Medicines Authority (APVMA) permit (PER11163). Permit herbicide rates depend on percentage weed cover. If percentage weed cover exceeds 30% approved use, normal boomspray rate (blanket) only.

in-crop
96
Sensors aid in-crop nitrogen decisions
A successful variable rate in-crop nitrogen program is often described by growers as the ‘holy grail’ in PA, and crop sensing technology may prove to be
a valuable tool in achieving this goal.
A series of SPAA trials carried out during 2010 has helped growers evaluate a range of crop sensors, and their role in nitrogen decision making.
GreenSeeker™ vs EM38
On Bruce and Robert Pococks’ farm in the South Australian Mallee, the GreenSeeker NDVI map, showing variation in crop biomass and greenness, was compared against the paddock’s EM map.
The NDVI map produced by the GreenSeeker correlated well with the EM38 map, and proved that paddock zones in the Mallee could be mapped according to NVDI (see Figures 1a, 1b and 1c).
0
0.1
0.2
0.3
0.4
0.6
0.7
0.5
NDVI
EM38 1m
0 25 50 75 100 125 150
R2 = 0.8489
Figure 1c. Correlation curves for NDVI and EM38 readings, Mallee, SA, 2010
Figure 1a. GreenSeeker NDVI map Mallee, SA, 2010 Figure 1b. EM38 map Mallee, SA, 2010
PA in Practice II Using precision agriculture technologies: a guide to getting the best results
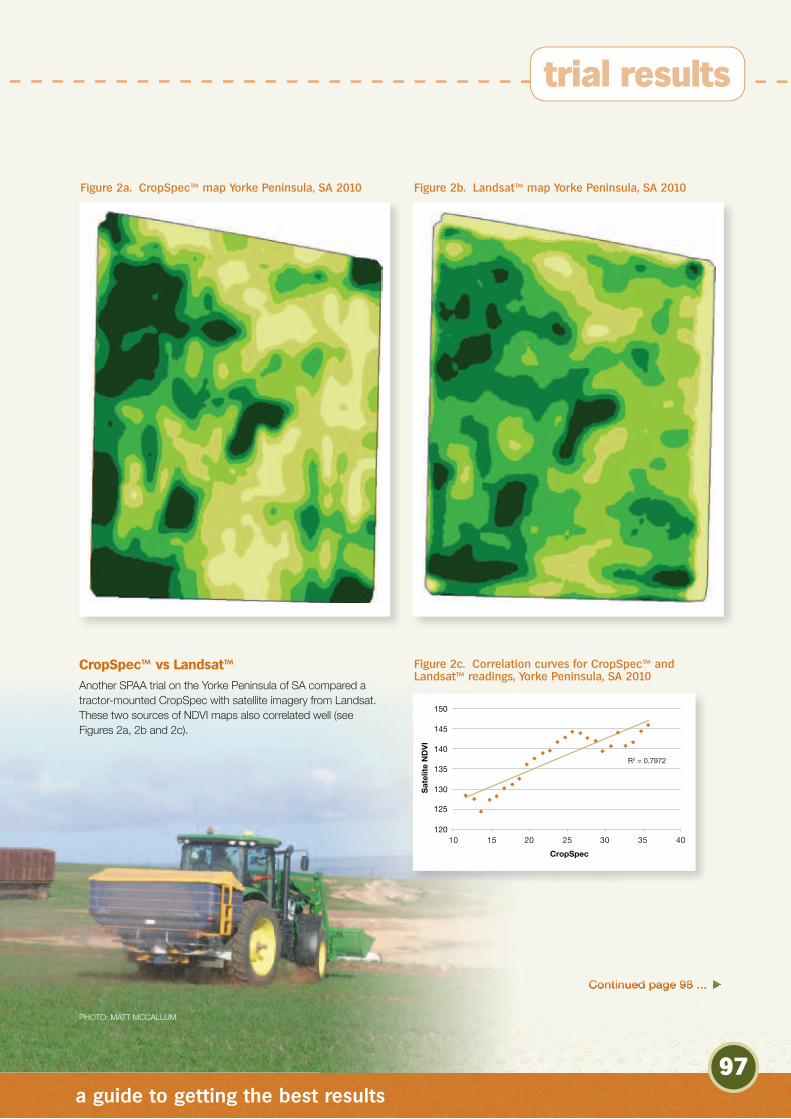
CropSpec™ vs Landsat™
Another SPAA trial on the Yorke Peninsula of SA compared a tractor-mounted CropSpec with satellite imagery from Landsat. These two sources of NDVI maps also correlated well (see Figures 2a, 2b and 2c).
120
125
130
135
140
150
145
Satelite NDVI
CropSpec
10 15 20 25 30 35 40
R2 = 0.7972
Figure 2a. CropSpec™ map Yorke Peninsula, SA 2010 Figure 2b. Landsat™ map Yorke Peninsula, SA 2010
Figure 2c. Correlation curves for CropSpec™ and Landsat™ readings, Yorke Peninsula, SA 2010
Continued page 98 ... uContinued page 98 ... Continued page 98 ... u
97PA in Practice II Using precision agriculture technologies: a guide to getting the best results
trial results
PHOTO: MATT MCCALLUM
in-crop
PA in Practice II Using precision agriculture technologies: a guide to getting the best results
98
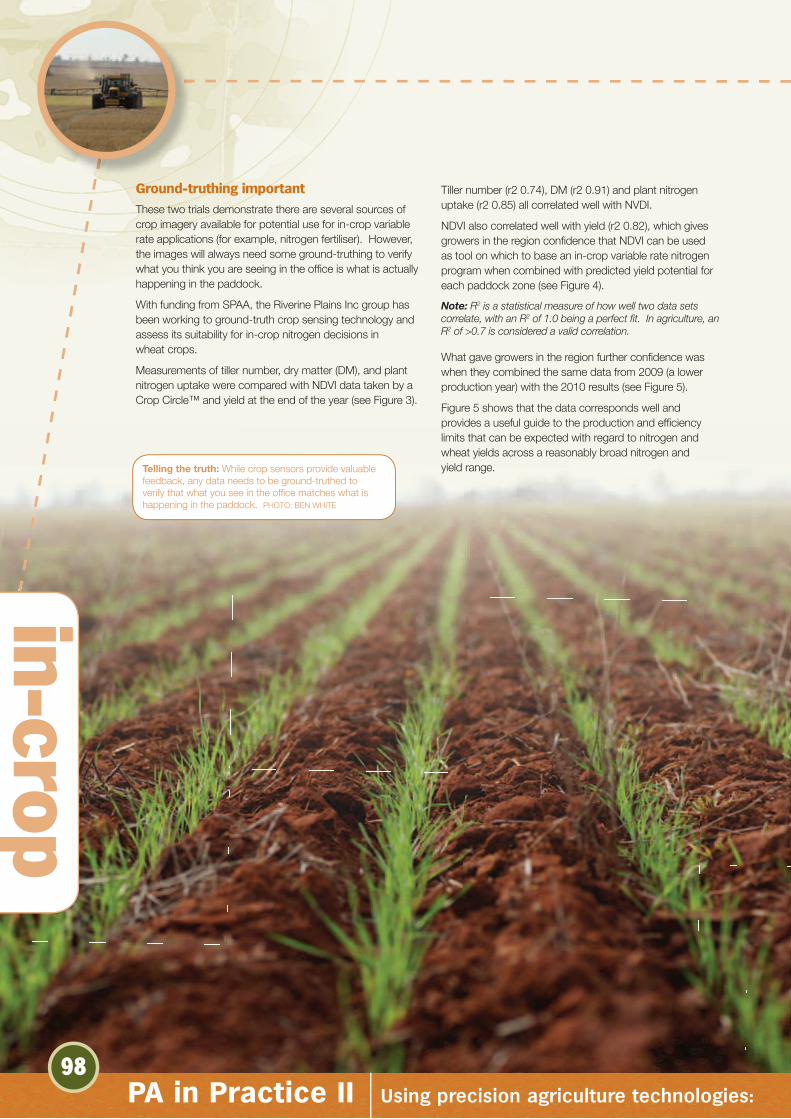
Ground-truthing important
These two trials demonstrate there are several sources of crop imagery available for potential use for in-crop variable rate applications (for example, nitrogen fertiliser). However, the images will always need some ground-truthing to verify what you think you are seeing in the offi ce is what is actually happening in the paddock.
With funding from SPAA, the Riverine Plains Inc group has been working to ground-truth crop sensing technology and assess its suitability for in-crop nitrogen decisions in wheat crops.
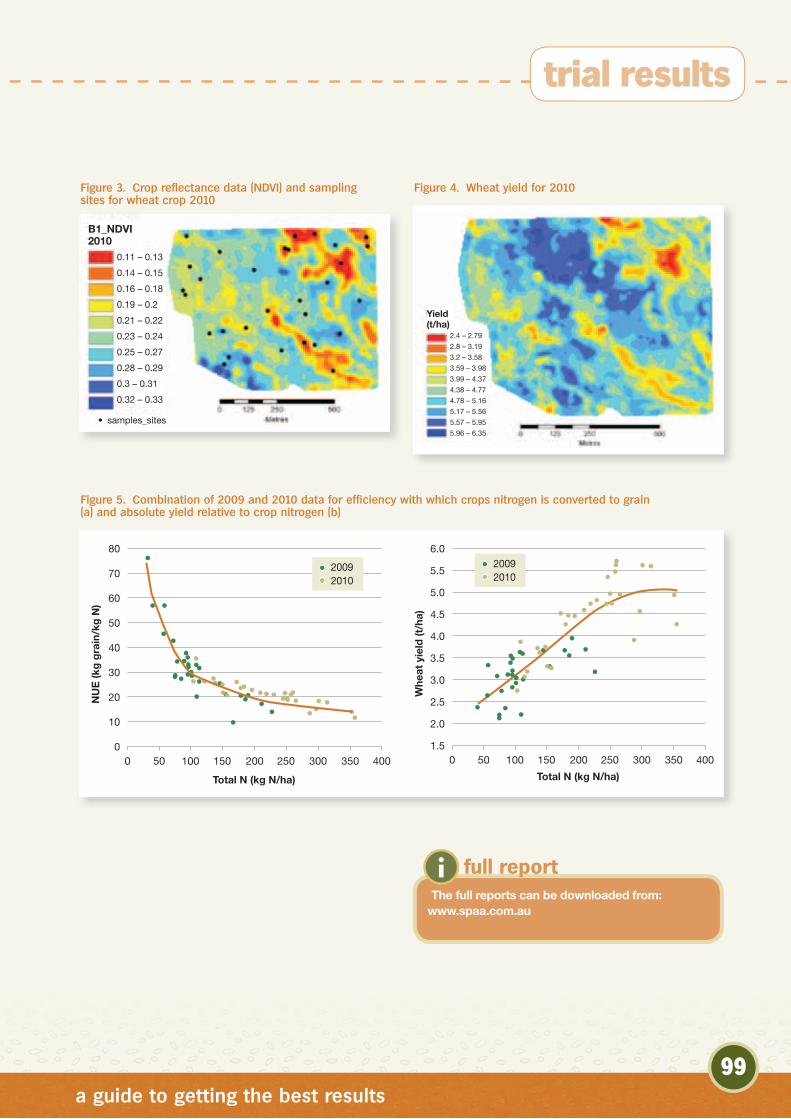
Measurements of tiller number, dry matter (DM), and plant nitrogen uptake were compared with NDVI data taken by a Crop Circle™ and yield at the end of the year (see Figure 3).
Tiller number (r2 0.74), DM (r2 0.91) and plant nitrogen uptake (r2 0.85) all correlated well with NVDI.
NDVI also correlated well with yield (r2 0.82), which gives growers in the region confi dence that NDVI can be used as tool on which to base an in-crop variable rate nitrogen program when combined with predicted yield potential for each paddock zone (see Figure 4).
Note: R2 is a statistical measure of how well two data sets correlate, with an R2 of 1.0 being a perfect fi t. In agriculture, an R2 of >0.7 is considered a valid correlation.
What gave growers in the region further confi dence was when they combined the same data from 2009 (a lower production year) with the 2010 results (see Figure 5).
Figure 5 shows that the data corresponds well and provides a useful guide to the production and effi ciency limits that can be expected with regard to nitrogen and wheat yields across a reasonably broad nitrogen and yield range. Telling the truth: While crop sensors provide valuable
feedback, any data needs to be ground-truthed to verify that what you see in the offi ce matches what is happening in the paddock. PHOTO: BEN WHITE
99PA in Practice II Using precision agriculture technologies: a guide to getting the best results
Figure 3. Crop reflectance data (NDVI) and sampling sites for wheat crop 2010
Figure 4. Wheat yield for 2010
Figure 5. Combination of 2009 and 2010 data for efficiency with which crops nitrogen is converted to grain (a) and absolute yield relative to crop nitrogen (b)
80
70
60
50
40
30
20
10
0
NU
E (k
g g
rain
/kg
N)
Total N (kg N/ha)
0 50 100 150 200 250 300 350 400
2009 2010
6.0
5.5
5.0
4.5
4.0
3.5
3.0
2.5
2.0
1.5
Whe
at y
ield
(t/h
a)
Total N (kg N/ha)
0 50 100 150 200 250 300 350 400
2009 2010
The full reports can be downloaded from:www.spaa.com.au
full reporti
trial results
0.11 – 0.13
0.14 – 0.15
0.16 – 0.18
0.19 – 0.2
0.21 – 0.22
0.23 – 0.24
0.25 – 0.27
0.28 – 0.29
0.3 – 0.31
0.32 – 0.33
• samples_sites
Yield(t/ha)
B1_NDVI2010
2.4 – 2.79
2.8 – 3.19
3.2 – 3.58
3.59 – 3.98
3.99 – 4.37
4.38 – 4.77
4.78 – 5.16
5.17 – 5.56
5.57 – 5.95
5.96 – 6.35