Embed Size (px)
Citation preview
THE IMPACT OF SCHOOL RESTARTS ON TEACHER QUALITY AND RACE IN
NEW ORLEANS
AN HONORS THESIS
SUBMITTED ON THE 25 DAY OF APRIL, 2016
TO THE DEPARTMENT OF ECONOMICS
IN PARTIAL FULFILLMENT OF THE REQUIREMENTS
OF THE HONORS PROGRAM
OF NEWCOMB TULANE COLLEGE
TULANE UNIVERSITY
FOR THE DEGREE OF
BACHELOR OF SCIENCES
WITH HONORS IN ECONOMICS
BY
___________________________ Gabriella Runnels
APPROVED: ________________________ Jane Lincove Director of Thesis
________________________ Paula Arce-Trigatti Second Reader
________________________ Michele Adams Third Reader

This page is intentionally blank.
Gabriella Runnels. The impact of school restarts on teacher quality and race in New
Orleans.
(Jane Lincove, Economics)
Most school restarts in New Orleans take the form of charter takeovers.
Research on the effects of charter takeovers shows somewhat positive impacts on
student achievement, although the mechanism of this influence is unclear. Economic
research suggests that teachers are the most important input in the production of
education. Thus, if charters are replacing some or all of the teachers in the schools
they take over, we may expect that this impact on achievement is due, at least in part,
to the new teachers the students in restarted schools are experiencing. This paper
examines whether and how teachers change in New Orleans schools following a
restart. Federal legislation requires public schools in the United States to meet certain
standards of curriculum content and student performance. A school restart, one
strategy for relaunching a school that fails to meet these standards, occurs when an
outside party, such as a charter management organization (CMO), takes over the
operation of the school from the local school district. This study focuses on restarts in
New Orleans, most of which are charter takeovers of low-performing traditional
public schools or other charter schools.
This paper seeks to determine how teachers in restarted schools change, and
future research can determine whether the observed change in teachers is responsible
for any impact on student achievement. I use a difference-in-differences approach and
find that, following a restart, the proportion of both uncertified teachers and teachers
with no teaching experience increases. Furthermore, the percent of both teachers who
are black and teachers who attended college in Louisiana decreases. There is no
significant impact on the proportion of teachers with advanced degrees.
ii
Acknowledgements
Thank you to Dr. Jane Lincove, Dr. Paula Arce-Trigatti, and Dr. Michele Adams
for their crucial contributions to this project. Each committee member has dedicated
significant time and provided valuable guidance in support of this paper. I would like
to express particular gratitude for Dr. Paula Arce-Trigatti, who has worked with me
each week for over a year to brainstorm, shape, and execute this project from start to
finish. I would also like to thank the Education Research Alliance for New Orleans
(ERA) for providing critical resources for this study. This research was supported by
Tulane Economics.
iii
Table of Contents
List of Tables...................................................................................................................................v
List of Figures................................................................................................................................vi
Introduction....................................................................................................................................1
Background and Context.............................................................................................................4
History and Policy............................................................................................................4
Controversy Nationwide.................................................................................................6
Controversy in New Orleans..........................................................................................7
Literature.........................................................................................................................................8
Impacts of Takeovers on Student Achievement.........................................................8
Teacher Characteristics.................................................................................................11
Data................................................................................................................................................15
Variable and Treatment Definitions...........................................................................15
Treatment Response Perspective................................................................................18
Theory and Methods...................................................................................................................19
Conceptual Framework.................................................................................................19
Empirical Methods.........................................................................................................21
Results............................................................................................................................................23
Difference-in-Differences.............................................................................................23
Event Study......................................................................................................................24
Robustness Checks.........................................................................................................25
Conclusion....................................................................................................................................26
References.....................................................................................................................................29
Tables and Figures.......................................................................................................................36
s
iv

List of Tables
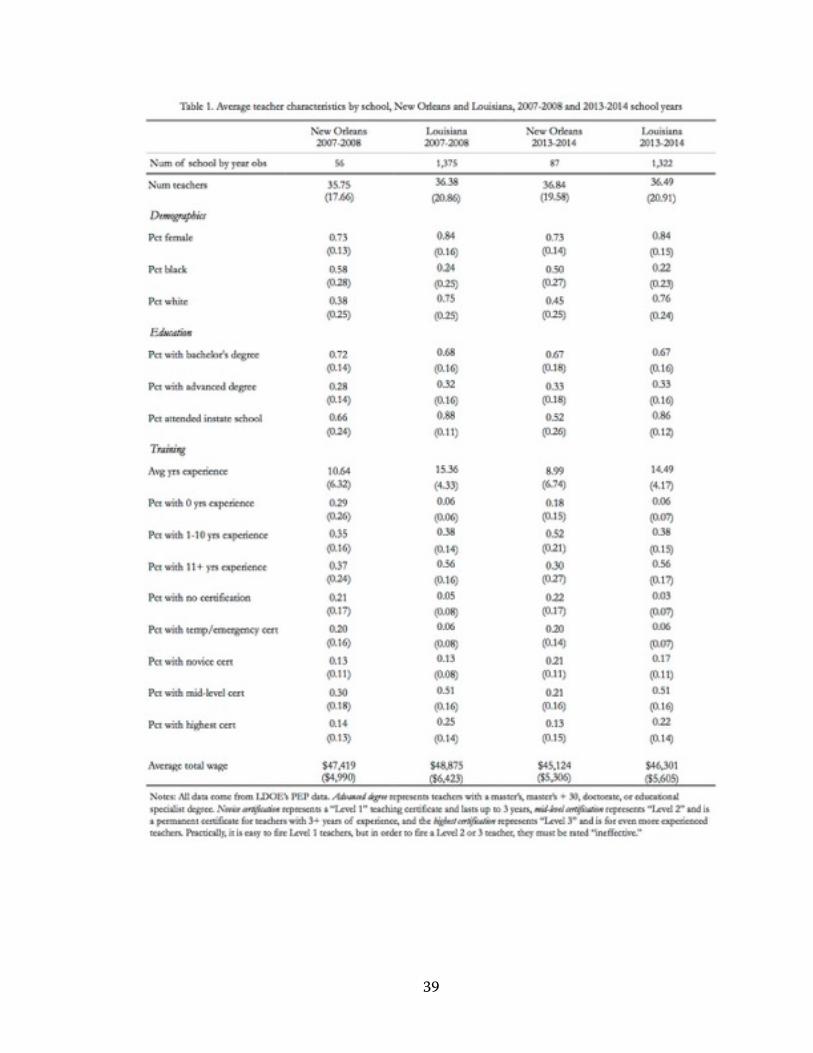
Table 1. Average teacher characteristics by school, New Orleans and Louisiana, 2007-2008 and 2013-2014 school years
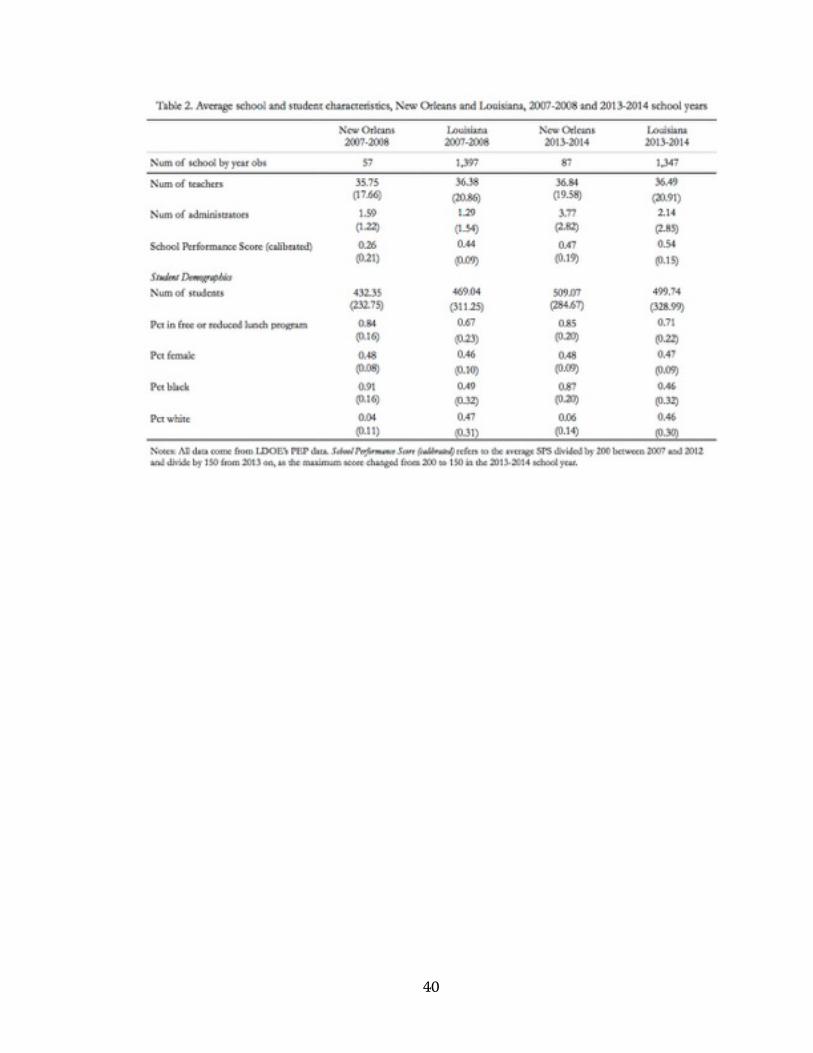
Table 2. Average school and student characteristics, New Orleans and Louisiana, 2007-2008 and 2013-2014 school years
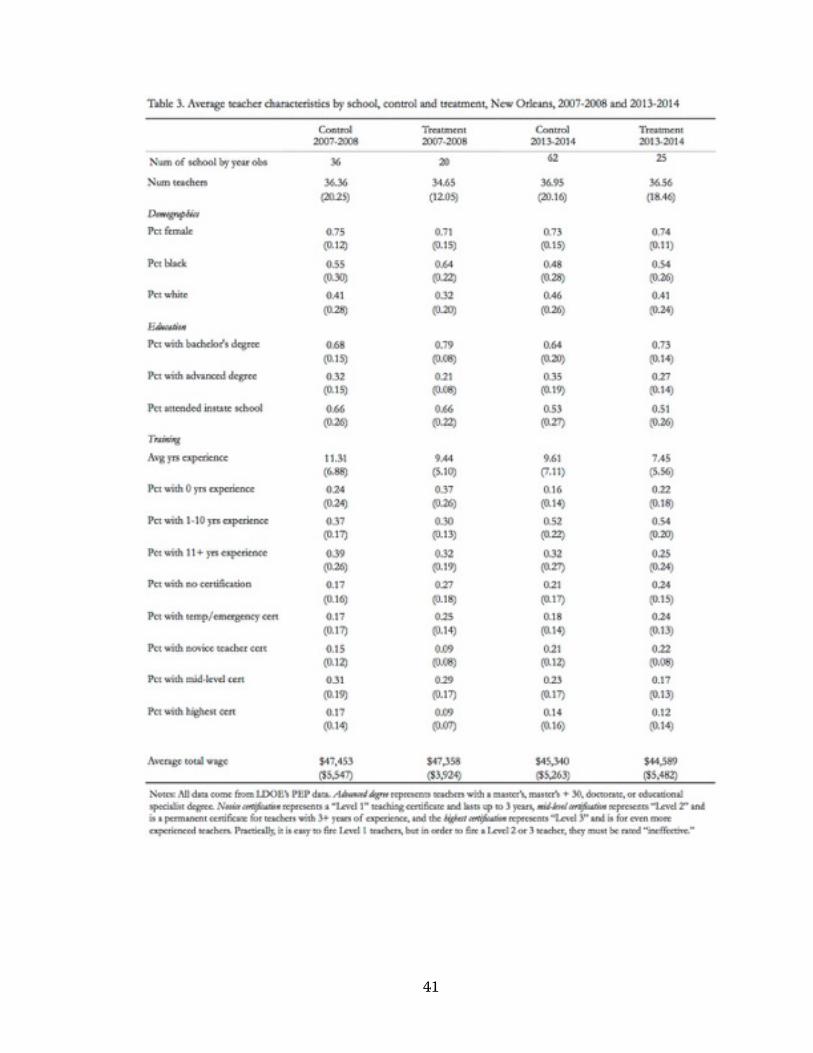
Table 3. Average teacher characteristics by school, control and treatment, New Orleans, 2007-2008 and 2013-2014 school years
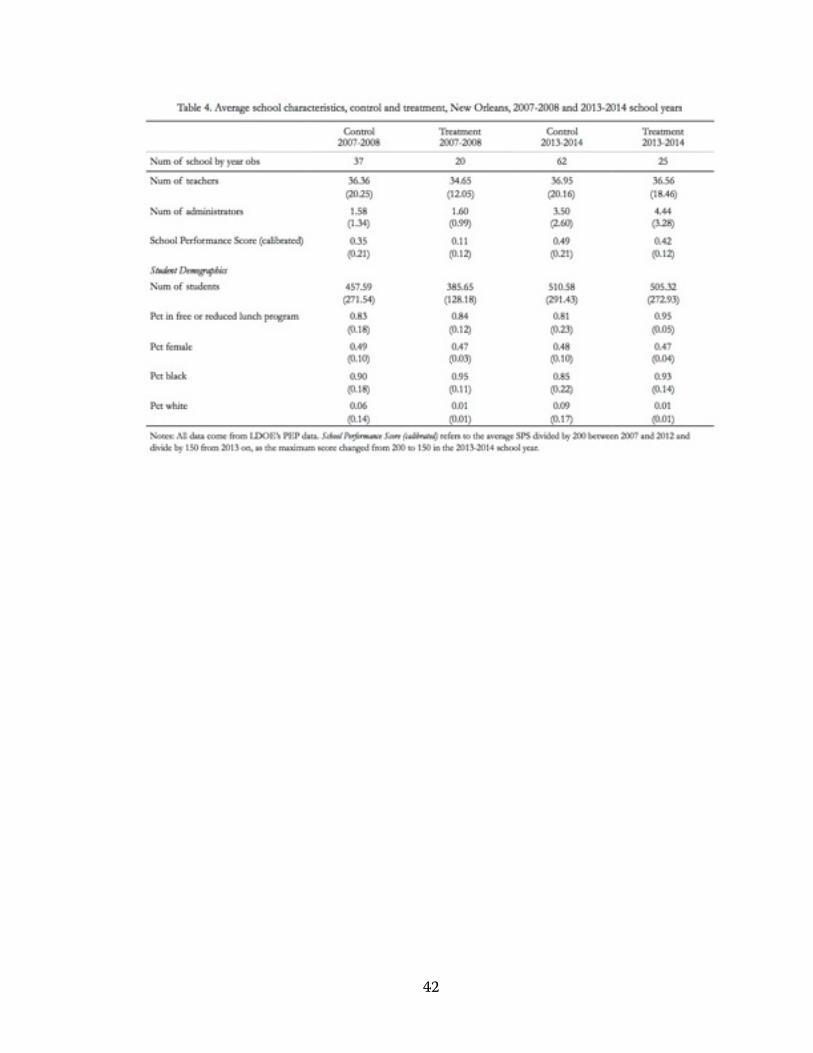
Table 4. Average school characteristics, control and treatment, New Orleans, 2007-2008 and 2013-2014 school years
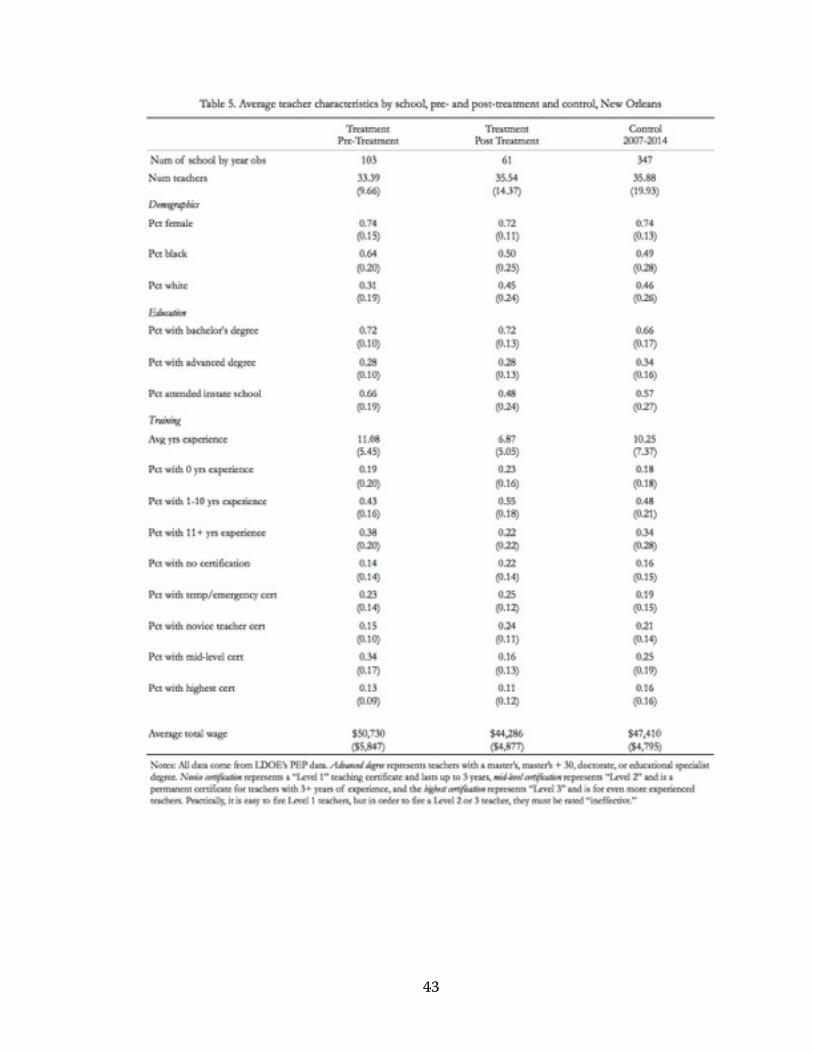
Table 5. Average teacher characteristics by school, pre- and post-treatment and control, New Orleans
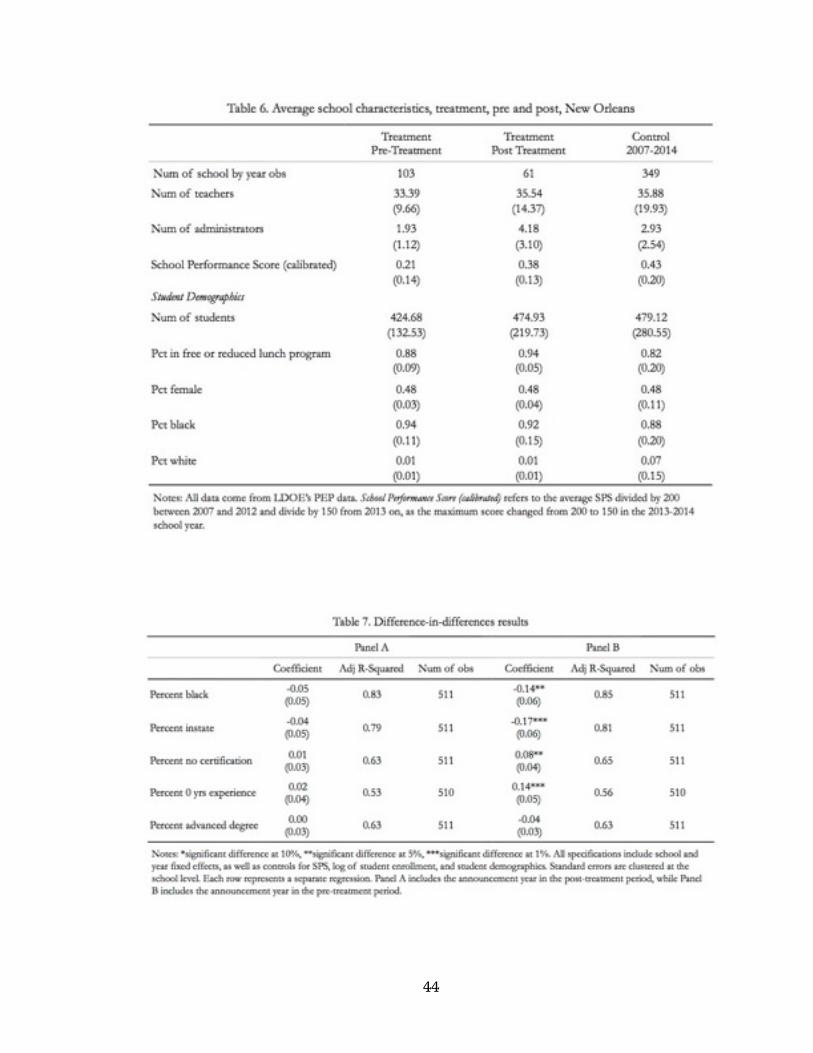
Table 6. Average school characteristics, treatment, pre and post, New Orleans
Table 7. Difference-in-differences results
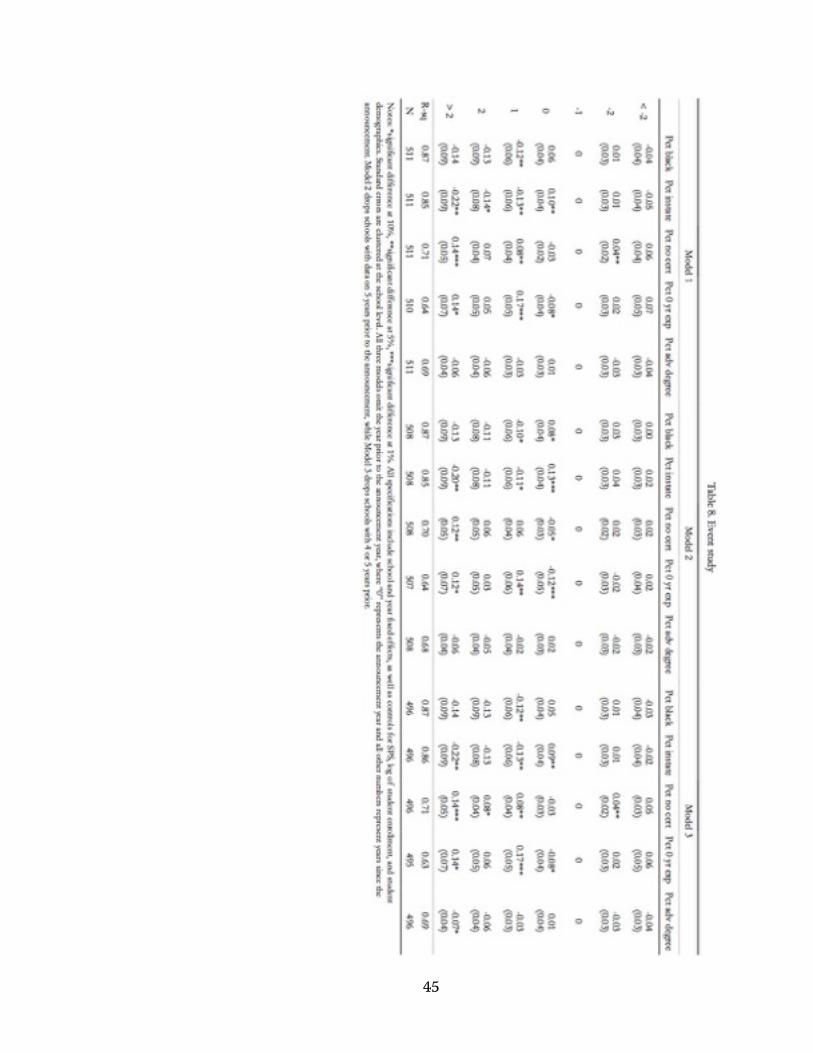
Table 8. Event study results
v
List of Figures
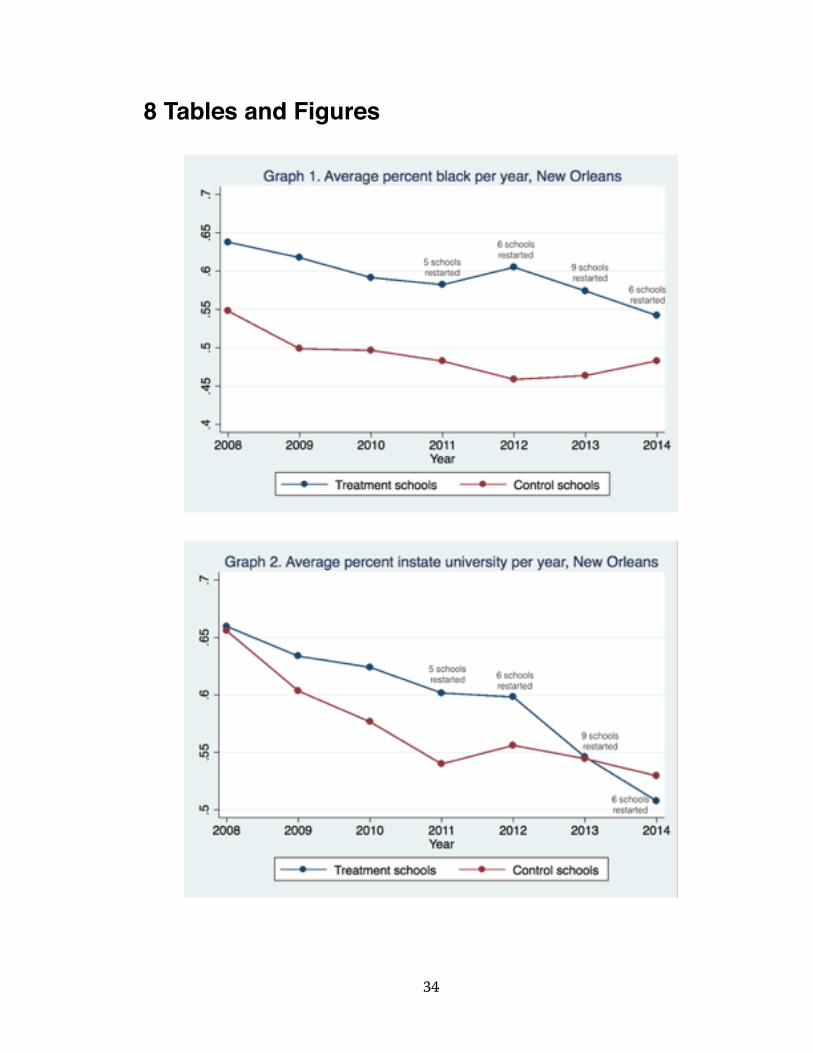
Graph 1. Average percent black per year, New Orleans
Graph 2. Average percent instate university per year, New Orleans
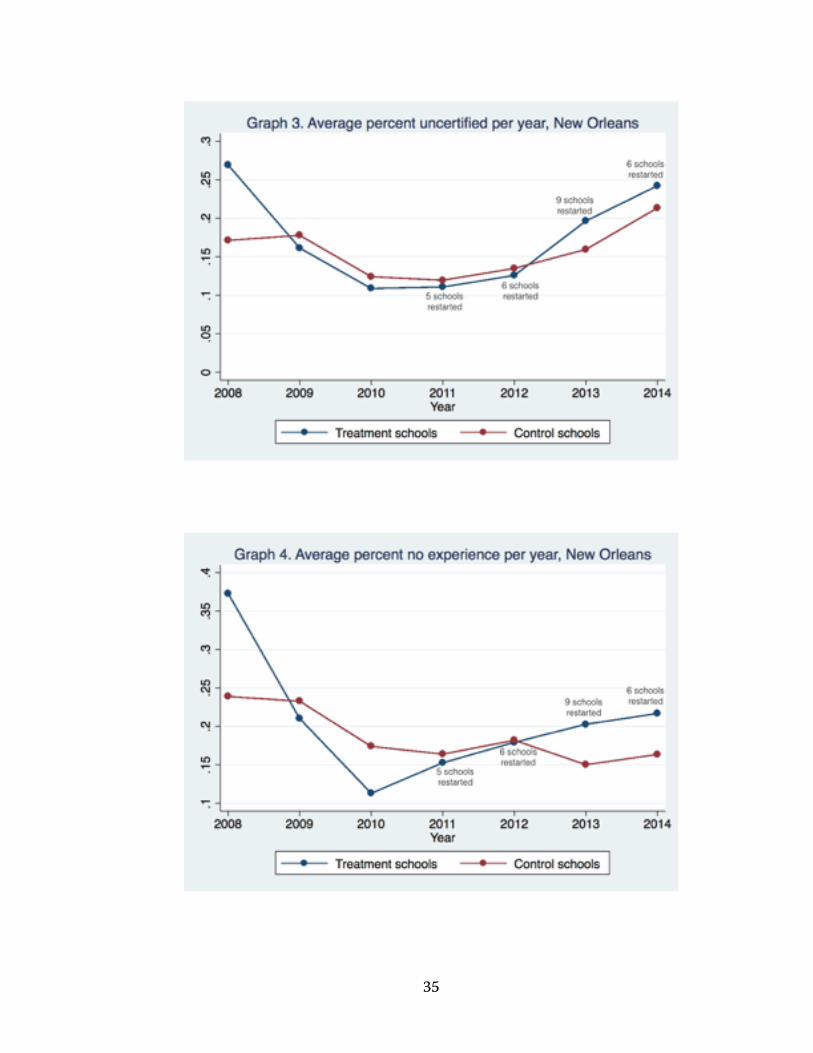
Graph 3. Average percent uncertified per year, New Orleans
Graph 4. Average percent no experience per year, New Orleans
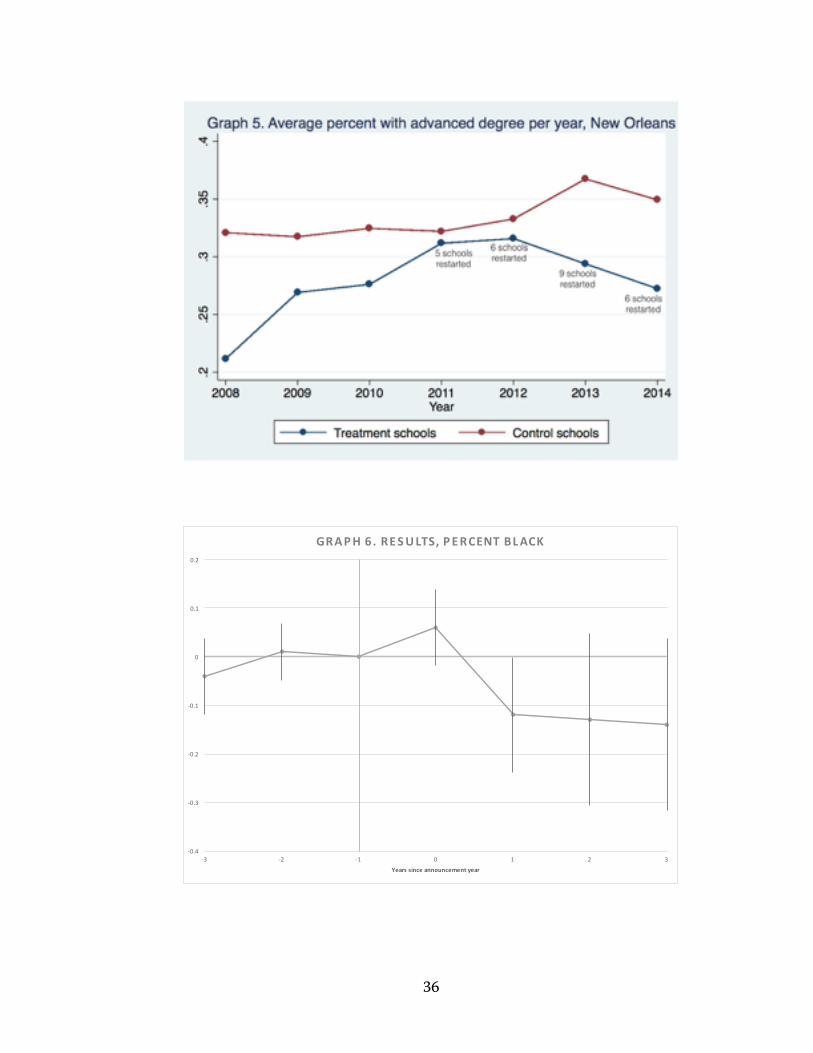
Graph 5. Average percent with advanced degree per year, New Orleans
Graph 6. Event study results, percent black
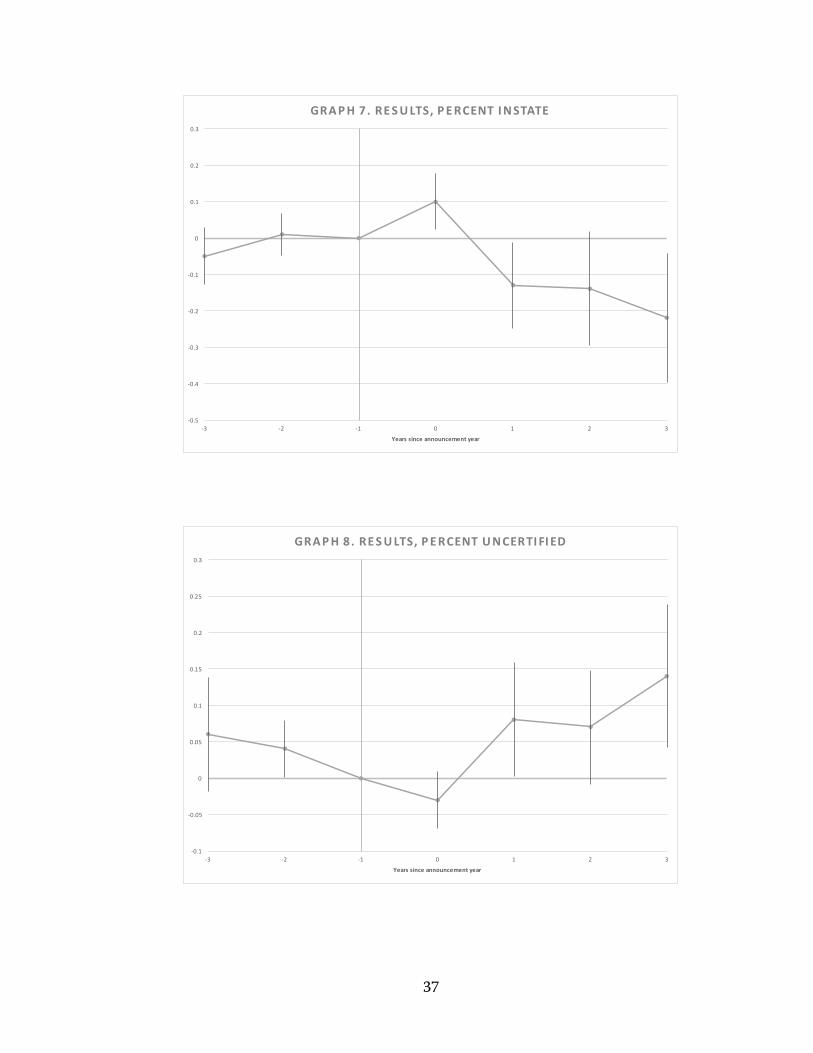
Graph 7. Event study results, percent instate
Graph 8. Event study results, percent uncertified
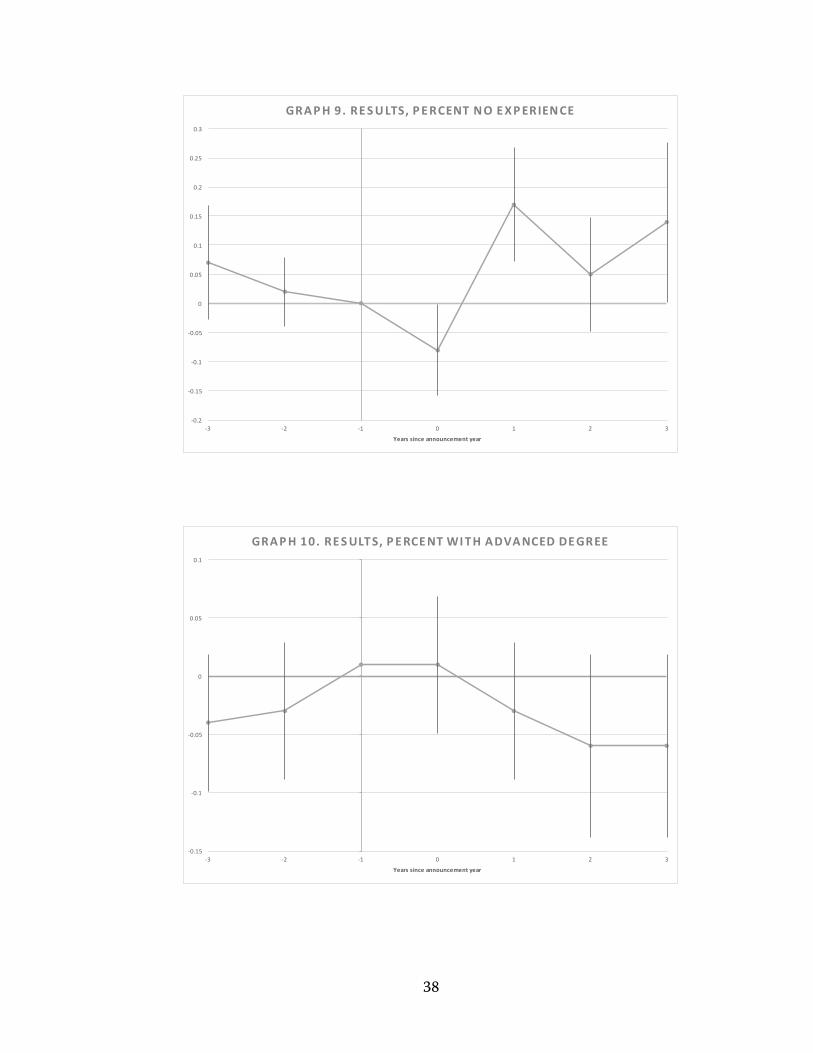
Graph 9. Event study results, percent with no experience
Graph 10. Event study results, percent with advanced degree
vi
1 Introduction
Throughout the United States, public schools are required to meet certain
standards of curriculum content and student performance, and if they fail to meet
these standards, they face being shut down or “redone” in some way. Federal funding
legislation puts forth four possible policies for relaunching underperforming schools:
turnarounds, transformations, closures, and restarts (Ruble 2015). Turnarounds and
transformations are less severe courses of action in which some school staff,
administrators, and policies may be altered, but students are allowed to stay in their
same schools. A closure occurs when a school ceases to operate, while a restart is any
school whose operation is taken over by an outside party, such as a charter
management organization (CMO), and whose students may remain enrolled in the
school. While research on charter takeovers shows a positive impact on student test
scores, the precise mechanism of this effect has not been established (Imberman,
2007; Ruble, 2015). However, because teachers are the biggest determinant of student
outcomes, it would be reasonable to expect that a change in teachers is at least
partially responsible for this impact.
This study seeks to determine whether and how teachers change in schools
following a restart. I will examine the extent to which school-level teacher
characteristics, including race and measures of teacher quality, change following a
takeover. To the best of my knowledge, there is no evidence on how charter takeovers
change teacher characteristics within schools. Discovering how school-level teacher
characteristics change following a restart could allow researchers to determine the
role that teachers play in charter takeovers’ impact on student achievement, especially
since states often turn underperforming schools over to CMOs in order to improve
educational outcomes for students.
1
My study will focus on restarts in New Orleans, the majority of which are
charter takeovers of low-performing traditional public schools or other charter
schools. Following the impact of Hurricane Katrina in 2005, Louisiana seized most of
New Orleans’ public schools and placed them in the state-managed RSD. At first, the
RSD directly ran some schools and contracted out others to CMOs. As of the
2014-2015 academic year, however, all schools in the RSD are charter schools (Sims &
Vaughan, 2014). Conducting this study in New Orleans will be especially interesting
given the city’s unique relationship with charters. New Orleans leads the nation in its
use of charter schools, and this reliance on charters to provide most of the city’s public
education has caused significant controversy. Additionally, this is an important
opportunity to observe what happens when several restarts occur in the same city
around the same time: while many urban centers have likely experienced at least a few
school restarts, New Orleans has seen 26 restarts over the last ten years. For other
urban areas considering restarts as an improvement strategy, the findings from this
study should help inform policymakers how this may play out when taken to scale.
In theory, privatizing education could benefit society by allowing for the
creation of schools with more diverse specializations and different kinds of school
missions than traditional public schools can have (Friedman, 1962). Charters, which
are publicly funded but privately run, are a form of education privatization, and in this
way, converting traditional public schools into charter schools could increase options
for students and parents. Furthermore, charter takeovers could increase the efficiency
of education production as charters compete for contracts from the government
(Friedman, 1962; Sawicky, 1996). Such competition could result in charters being
higher quality and lower cost than traditional public schools, which do not compete
for funding in the same way.
2
The theoretical framework I use for this research is the education production
function (EPF). Rice & Schwartz (2008) explain that research on the production of
education uses a similar framework to other production functions, treating schools,
teachers, peers, et cetera, as the inputs to education and student performance,
primarily measured by test scores, as its output. Measuring the production of
education is complicated. Many outcomes of education are difficult to define in
quantitative terms, such as leadership abilities or critical thinking skills. Most
researchers thus study test scores as the output of the EPF, likely because they are easy
to quantify. In this paper, I will examine teachers as an “input” to education
production; therefore, any observed effect on teachers can be viewed as an effect on
the largest input to the production of student achievement. Future research could then
determine whether the effect of restarts on student achievement is at all due to the
observed change in teachers.
To determine the impact of a school restart on the teacher composition of a
school, I employ a difference-in-differences estimation strategy using school-level data
from the Louisiana Department of Education (LDOE). The first difference accounts for
changes over time, while the second difference accounts for underlying, time-invariant
differences between schools that were restarted and those that never experienced a
restart. I find that following a school restart, the average proportion of teachers who
are black or who attended college in Louisiana decreases and the proportion who are
uncertified or who have no teaching experience increases. There is no significant effect
on the average percent of teachers who hold an advanced degree.
The remainder of this paper is organized as follows: Section 2 describes the
background and context for school restarts in general and specifically in New Orleans.
Section 3 discusses the previous literature on school restarts and teachers, and Section
3
4 describes the data used for this study. Section 5 explains the empirical methods
employed, and Section 6 discusses the results. Finally, Section 7 presents the
conclusions to this paper.
2 Background and Context
2.1 History and Policy
Following the publication of A Nation at Risk, the landmark 1983 report on the
state of education in the United States, American education policies have focused on
standards-based reforms, which set criteria for the content areas of instruction and
the performance level of the students that schools are required to meet. In 2001,
Congress passed the No Child Left Behind (NCLB) Act, which aims to increase the
academic performance of the nation’s public schools by requiring states to institute
standards-based accountability measures and taking action against those schools that
fail to achieve them (Springer, 2008). The reasoning behind these reforms is that
creating incentives for school administrators and teachers to meet performance goals
will result in improved student achievement and other outcomes (Sims, 2013).
Before the mid-1990s, takeovers were primarily motivated by financial or
management issues, but in recent years, most takeovers have occurred as a result of
schools failing to meet accountability standards for academics set by the state
(Oluwole & Green, 2009). When the state takes over an underperforming school, it
can either run the school directly or contract the school out to another manager. In
compliance with NCLB, the Louisiana legislature passed an amendment in 2003
granting the government the power to shut down or take over the operations of
“failing” schools. A school is considered failing when it does not meet the minimum
accountability standards set by the state, which are based on metrics including student
test scores and graduation rates (Burns, 2010). When the state takes over a failing
4
school, it can either run the school directly, or it can contract the school out to a CMO
or other such operator. In Louisiana, the Recovery School District (RSD) is the
administrative body tasked with taking over and improving sub-standard public
schools. After Hurricane Katrina hit New Orleans in 2005, destroying most of the
city’s school buildings and displacing thousands of students, the legislature turned
over to the RSD more than 100 of New Orleans’ worst-performing schools (American
Youth Policy Forum, 2008). Most of these schools were subsequently contracted out as
charter schools, which are publicly-funded but independently-run.
Beginning in the 2014-2015 academic year, all New Orleans schools taken over
by the RSD have been turned over to CMOs (Sims & Vaughan, 2014). Other cities
across the country, including the notable examples of Detroit, Philadelphia, and
Cleveland, have begun to follow New Orleans’ lead in using charter schools to such an
extent (National Alliance for Public Charter Schools, 2014). Indeed, in 2010,
Education Secretary Arne Duncan stated that Hurricane Katrina was “the best thing
that happened to the education system in New Orleans” (Anderson, 2010). Although
he later apologized for this insensitive remark, the sentiment behind his declaration
was clear: New Orleans school reforms, including the numerous restarts that have
occurred since 2005, appear to work.
2.2 Controversy Nationwide
Not everyone was as certain of the effectiveness of accountability standards
and charter schools as was Secretary Duncan, however. The charter school takeover
system and other standards-based school reform measures have met with significant
controversy from parents, teachers, activists, and other policymakers. In 2015, these
concerns reached the highest levels of education policymakers: on October 24,
Duncan stated that he has had innumerable conversations with educators “who are
5
understandably stressed and concerned about an overemphasis on testing” and that
the Obama administration “will work with states, districts and educators to help solve
[this problem]” (Zernike, 2015).
Controversy over school reforms is not new, and some of the major historical
concerns raised by opponents about takeover policies are relevant today. As soon as
takeover reform strategies started rising in popularity in the 1990s, critics began
speaking out about some of the problems they perceived. Opponents of these reforms
take issue with the idea of predominantly white governing bodies and administrators
preventing racial minorities from controlling their own domains (Green and Carl,
2000). They condemn the biases in most standardized tests used in accountability
metrics, a phenomenon that was studied and confirmed in 2002 by economists Kane
and Staiger, who found that measures of standardized test scores are largely unreliable.
Furthermore, critics claim that takeovers do not address the root of the problem of
inequities in education along racial lines. Indeed, failing schools that are subject to
state takeovers are mostly, if not uniformly, majority students of color and are
generally run by non-white administrators. In contrast, most of the policymakers and
takeover advocates at all stages of the reform history have been white, some of them
the “politicians who resisted providing educational funding for these same
districts” (Green & Carl, 2000, p. 64).
2.3 Controversy in New Orleans
Some non-white community leaders and citizens have also supported takeover
measures and greater state influence over local education in general (Green & Carl,
2000; Burns, 2010). However, when Louisiana districts voted on the takeover
amendment in 2003, jurisdictions in which black residents turned out to vote in large
numbers strongly opposed the policy, whereas majority white areas disproportionately
6
supported it (Burns, 2010). This strong reaction to the takeover policy from black
voters is likely rooted in the racial nature of the structure and implementation of the
reforms. After the hurricane, the Orleans Parish School Board (OPSB) fired all of the
city’s public school teachers, most of whom were black women (Carr, 2015). The U.S.
Supreme Court recently denied the appeal of nearly 7,500 public school employees
who filed a class action lawsuit against the OPSB after the Louisiana Supreme Court
threw out their case (Dreilinger, 2015). To this day, New Orleans schools remain
deeply segregated along lines of race and class, whereby the city’s public schools are
majority black and low-income students, while the private schools have more white
and higher income students. Some New Orleanians blame the rise of charter schools
for continuing these patterns of educational inequality in the city (Institute on Race
and Poverty, 2010). In particular, a common perception among New Orleans residents
is that charter schools are taking over traditional public schools and replacing
established, local black teachers with inexperienced, uncertified, mostly white teachers
who come to New Orleans from out of state through organizations like Teach for
America.
3 Literature
3.1 Impacts of Takeovers on Student Achievement
A “charter” is a contract that grants private organizations the authority to
operate schools using public funds. Most literature on the effectiveness of charter
schools does show generally positive impacts on student achievement compared to
traditional public schools (Hoxby, 2004; Hoxby & Rockoff, 2005; Imberman, 2007;
Abdulkadiroğlu et al., 2009; Hoxby, Murarka, & Kang, 2009; Abdulkadiroğlu et al.,
2010; Angrist, Pathak, & Walters, 2011; Angrist et al., 2011; Tuttle et al., 2013;
7
CREDO, 2013); however, a smaller body of research shows mixed or even negative
effects (Sass, 2004; CREDO, 2009; Zimmer et al., 2009; Gleason et al., 2010). Despite
this bulk of research on the impacts of charter schools, not much evidence exists
specifically on the effects of charter takeovers of low-performing schools. Studies that
do analyze the impacts on student achievement of regular public schools that close
and then reopen under charter management show mixed results (Abdulkadiroğlu et
al., 2014).
A few studies separately examine the effects of converted charter schools and
startup charters (Imberman, 2007; Buddin & Zimmer, 2003; Buddin & Zimmer, 2005).
“Startups” are schools that begin as charters, while “conversions” are schools that are
initially traditional public schools but convert to charters (Imberman, 2007). In this
literature, “conversions” are comparable to charter takeovers or school restarts, while
“startups” would be new charter schools that did not take over the operation of
another existing school. Imberman (2007) uses individual fixed effects strategies to
evaluate the success of charters in an anonymous large urban school district, and he
finds mild evidence of an increase in test scores for converted charters. Although
initial results indicate a positive impact, the effects become mostly insignificant when
gifted and talented magnet schools are taken out of the analysis. Similarly, Buddin &
Zimmer (2003; 2005) do not find significant impacts of startup or converted charters
on achievement. In their studies, Buddin & Zimmer separate their analyses of charter
schools into four categories: conversion charters, startups, charters that use
classroom-based instruction, and those with instruction based outside of the
classroom. They note that most research on charter school performance treats
charters as a homogenous group, obscuring differences in their structures and
effectiveness. They find that startups and conversions were not meaningfully different
8
from each other in terms of impact on test scores (2003), and neither types of charter
school were significantly different from conventional public schools (2003).
Studies that analyze the effects of contracting out low-performing schools on
student achievement show mixed results. In these studies, “contracting out” a school is
comparable to taking over or chartering an existing school. For example, Gill et al.
(2007) analyze Philadelphia’s Diverse Provider Model, a policy that turned over 45
public schools to private managers, and find that these managers neither improve nor
harm student test scores. In contrast, Ruble (2015) shows that students enrolled in
contracted-out schools experienced increases in test scores. Ruble’s work on the
impact of school restarts on student achievement is the paper that most closely
resembles the present study. Her study examines whether and how contracting out
underperforming schools to CMOs in New Orleans affects student test scores. New
Orleans’ especially extensive use of charter schools provides a unique opportunity to
study contracting in education. Ruble evaluates the causal effects of contracting out
low-performing schools, including both regular public schools and failed charter
schools, and finds that test performance improves two years after a charter takeover of
a traditional public school and only one year after a takeover of another charter
school. A potential explanation for the differing results between Ruble’s and Gill et al.’s
studies may be that the Philadelphia model did not have many providers competing
for contracts, whereas Ruble’s study is the first of its kind to analyze the effectiveness
of contracting out education in an environment with high competition.
The general focus of the previously discussed literature is to examine how
school takeovers impact student performance. These studies, for the most part, do not
address the actual mechanism responsible for the observed impact on achievement. In
9
particular, there is no analysis of how teachers, the most important determinant of
student achievement, are impacted by charter takeovers.
3.2 Teacher Characteristics
We may expect that any impact of takeovers on student achievement could be
at least partially due to a change in teachers, as teachers are by far the most important
input to the education production function (Rice & Schwartz, 2008). Most studies
measuring teachers’ impact on student achievement have looked at teachers’ “value-
added,” which represents each teacher’s individual contribution to student test scores;
that is, the “value” that a given teacher “adds” to a student’s education. A wealth of
research has shown that there is significant variation in teacher value-added,
suggesting that some teachers are much more effective than others (Hanushek, Kain,
O’Brien, & Rivkin, 2005; Rivkin, Hanushek, & Kain, 2005; Hanushek, Kain, O’Brien, &
Rivkin, 2005; Chetty, Friedman, & Rockoff, 2014; Nye, Konstantopoulos, & Hedges,
2004; Aaronson, Barrow, & Sander, 2007; Sanders and Rivers, 1996). Existing literature
on the impacts of specific teacher characteristics, however, cannot completely account
for this variation in teacher quality, as most teacher characteristics, including level of
education, years of experience, and type of certification, show little or no effect on a
teacher’s value-added.
While many parents, school officials, and policymakers believe that higher
teacher quality is necessary for improving education, evidence on the effect of
observable teacher traits on student achievement is inconclusive (Rockoff, 2004).
“Observable teacher characteristics” include attributes like years of experience, race,
gender, and subjective evaluations by principals, among others. Aaronson et al. (2007)
study traditional human capital measures of teacher quality and find that “the vast
majority of the total variation in teacher quality is unexplained by observable teacher
10
characteristics” (p. 129). In particular, they find no impact of level of education, type of
certification, or years of teaching experience on teacher fixed effects, although they do
find that female and African American teachers produce somewhat higher test scores
than do male and white teachers. In slight contrast, Boyd et al. (2008) use a value-
added model to estimate the effect of teacher characteristics on achievement and find
that, taken together, increased teaching experience, higher value-added scores, and
being certified had a modestly positive impact on the achievement of students in the
poorest schools.
Studies that look at the impact of individual characteristics on student
achievement show that some traits, such as years of experience, are related to teacher
quality, but most are unrelated or only related in a limited way. Hanushek (1971) finds
no impact on teacher quality of teaching experience, while Rivkin et al. (2005), Kane et
al. (2008), Rockoff (2004), and Nye et al. (2004) all show that experience does matter,
at least within the first few years. Hanushek (1971) and Rivkin (2005) find no link
between a teacher’s level of education, including a master’s degree, and teacher quality.
In their research on teacher certification, Goldhaber and Brewer (1997) find some
evidence that certification matters for students’ mathematics achievement, and Kane
et al. (2008) similarly find that whether or not a teacher is certified does have a small
effect on student performance. Taken together, the literature suggests that while some
observable attributes of teachers may influence students’ achievement, they do not
definitively account for the wide variation in teacher quality.
Economists have studied the impacts of teacher experience, education,
certification, and race on student achievement. While certain of these attributes (or
combinations of them) do have an impact on student performance, these teacher
qualities cannot fully explain the wide variation in teacher effectiveness (Hanushek,
11
1971; Goldhaber and Brewer, 1997; Rockoff, 2004; Nye et al., 2004; Rivkin, 2005;
Aaronson et al., 2007; Kane et al., 2008). Nevertheless, examining how the
composition of teachers changes in terms of these characteristics could provide
insight into the strategies school leaders are pursuing in restarting underperforming
schools. Furthermore, there is no literature that I know of on the impact of teachers’
geographic background on their effectiveness, but like race or gender, sharing an
identity with students, such as the identity of being from Louisiana, could be
impactful. Thus, determining whether and to what extent the New Orleans teaching
force is becoming populated with fewer local teachers and more out-of-state teachers
could provide another possible explanation for the observed changes in student
performance.
Race and Gender
Few studies of teacher characteristics look at the impact of a teacher’s gender
or race on achievement of students of the same (or different) race or gender, and those
that have analyzed these characteristics have shown mixed results. Ehrenberg et al.
(1995) and Dee (2004) both attempt to answer the question of whether and to what
extent a teacher’s race (and, in Ehrenberg et al.’s case, gender) affect the achievement
of students of the same race (or gender) as the teacher. Furthermore, Ehrenberg et al.
and Dee study the impact of racial matching between teachers and students on
teachers’ subjective evaluations of their students.
Using data from the National Educational Longitudinal Study of 1988,
Ehrenberg et al. (1995) examine the impact of a teacher's race, gender, and ethnicity
(RGE) on the achievement of students from similar and different RGE groups. For
each student group, the authors estimate the gain score equations, which measure the
increase in test scores between the students’ 8th and 10th grade years. Only a few of
12
the coefficients are significant, suggesting that, overall, teachers’ RGE did not play a
very important role in how much students learned. In contrast, Dee (2004) finds that
exposure to a teacher of a student’s own race does have a significant positive impact
on a student’s achievement. Using data from Tennessee’s Project STAR experiment, he
regresses student test scores on student, teacher, and classroom traits. The Project
STAR study randomly paired students and teachers within schools, which means it is
unlikely that the correlations between racial matching and achievement are simply due
to unobserved student characteristics. His models all include fixed effects for the
grade, entry wave, and school of entry, and he identifies the impact on students of
exposure to an own-race teacher. His results suggest such exposure produces
achievement gains for most student racial groups.
Race is a particularly important teacher characteristic to study in New Orleans,
since it is widely believed by the city’s residents that for schools in general, and for
charter takeovers in particular, the teaching force is becoming gradually more white as
established black teachers are being pushed out of schools to make way for
inexperienced, non-local white teachers from organizations such as Teach for America
and TeachNOLA. Because the existing literature on the impact of a teacher’s race on
student achievement is limited and shows mixed results, a study on teacher race in
New Orleans would be especially interesting in terms of showing how changing the
race of the teachers that students experience affects students’ educational
performance.
In the following sections, I will examine the change in teacher characteristics,
including level of education, years of experience, certification status, race, and others,
that is due to a charter takeover of an underperforming public or charter school.
Research shows that, to some extent, charter takeovers do impact student
13
performance, but the exact mechanism of this influence is unclear. If charters are
replacing some or all of the teachers in the schools they take over, we may expect that
this impact is due, at least in part, to the new teachers that the students are
experiencing. The literature shows that, while teachers have a large effect on student
achievement and this effect varies widely, observable teacher attributes do not
completely explain variation in teacher quality. Researchers still debate the causal
effect of teacher characteristics on student achievement, and data on the teachers in
the unique case of New Orleans could provide new insights to this debate.
Furthermore, economists have not given much attention to the impact of a teacher’s
race on the learning of a student of the same (or different) race, and New Orleans’
charter schools, which have been widely criticized for furthering problems of racial
inequality in the city’s education system, would be an especially interesting
environment in which to study this effect.
4 Data
This study uses school-level data from the Louisiana Department of Education
(LDOE) for the academic years 2007-2008 through 2013-2014. This timeframe allows
for three years of data before and three years of data after most restarts occurred. The
dataset has information on all public schools in Louisiana, but the baseline sample for
this study contains only public schools in Orleans Parish, including schools in the
RSD, schools operated or chartered by the Orleans Parish School Board (OPSB), and
schools chartered by the Louisiana Board of Elementary and Secondary Education
(BESE).
4.1 Variable and Treatment Definitions
This paper attempts to answer the question of whether and to what extent
average teacher characteristics, including race, years of experience, educational
14
degree, certification status, and location of university attended, are changing within
restarted schools. “Race” is defined in terms of the percentage of teachers who are
black (few teachers are a race other than white or black); “years of experience”
represents the percent of teachers who have zero years of teaching experience;
“educational degree” refers to the percent of teachers with an advanced degree,
including a master’s, educational specialist, or doctorate (few teachers have anything
less than a bachelor’s degree); “certification status” refers to the percentage of teachers
who have no teaching certification; and “location of university attended” represents
the percentage of teachers who attended college in the state of Louisiana.
Federal policy describes turnarounds, transformations, closures, and restarts as
the four possible strategies for redoing underperforming schools. In New Orleans, a
school is at risk of being relaunched if its school performance score (SPS) is
consistently near or below the threshold for failure. The SPS is measured each year
and primarily reflects student achievement on standardized tests (Cowen Institute,
2015). The failing school SPS cutoff was 60 out of 200 possible points in 2008 and was
raised to 75 in 2012 (Ruble 2015). In 2013, the SPS scale was readjusted to a 150-point
range, and the cutoff for failure was changed to 50 points (The Lens, n.d.). In Table 2,
which shows the average school and student characteristics of schools in New Orleans
and Louisiana for the 2007-2008 and 2013-2014 school years, the average SPS for a
New Orleans public school school in the 2007-2008 academic year was 52 out of 200,
while the average SPS was 70.5 out of 150 in 2013-2014. Nearly half of all New Orleans
public schools experienced either a restart or a closure between 2007 and 2014.
This study focuses on restarts. The treatment group in this paper is comprised
of schools that are restarted between 2007-2008 and 2013-2014, while the control
group is made up of schools that are never redone in that timeframe. Schools that are
15
closed during this timeframe are left out of the sample. This study seeks to determine
the effect of a restart on schools’ teacher compositions, and school closures fall neither
in the treatment group, since they do not experience any years of operation post-
treatment, nor the control group, since they were identified as low-performing and
selected to be redone during that time period.
This final sample contains 90 unique schools, including 64 control schools and
26 treatment schools. In Table 3, which shows average teacher characteristics by
school for the control and treatment schools during the 2007-2008 and 2013-2014
school years, schools in the treatment group are observably different from schools that
were not restarted between 2007 and 2014. In the 2007-2008 school year, the first year
of the observed treatment period, the average proportion of black teachers in control
schools was 55 percent, while it was 64 percent in treatment schools. By the
2013-2014 academic year, the last year in the treatment period, those proportions had
declined for both groups to 48 percent for control schools and 54 percent for
treatment schools. The average proportion of teachers with an advanced degree in
2007-2008 was 32 percent for control schools and 21 percent for treatment schools,
and those proportions both increased to 35 and 27, respectively, in 2013-2014. In
2007-2008, 66 percent of teachers in both treatment and control schools on average
had attended an instate university, while only 53 percent of control teachers and 51
percent of treatment teachers did so by 2013-2014. Average years of teaching
experience for teachers in control schools declined from 11.3 years in 2007-2008 to 9.6
years in 2013-2014, while it declined from 9.4 to 7.5 in treatment schools over that
time period. The average percent of uncertified teachers increased from 17 to 21
percent in control schools and decreased from 27 to 24 percent in treatment schools
over the course of the treatment period. Finally, average wages for teachers in both
16
types of schools decreased between 2007-2008 and 2013-2014, with wages in control
schools higher than those in treatment schools for both years.
4.2 Treatment Response Perspective
A study on how teachers change following a school restart could consider the
question from any of three different points of view: the student level, the teacher level,
or the school level. From the student-level perspective, after a restart occurs, each
student either remains in the restarted school (in which case they likely experience
new teachers) or transfers to another school (in which case they certainly experience
new teachers). In either case, the restart is causing the student to be exposed to
different teacher characteristics than those they previously experienced, which could
impact the student’s educational outcomes. To perform this analysis from the student-
level perspective, a researcher would need to know whether a student stays in the
restarted school or leaves, and if they do leave, where they go. The student-level
analysis is arguably the most important point of view to consider, as the ultimate goal
of most research in this field is to determine the impact of different school treatments
on student outcomes.
Alternatively, this analysis could be performed from the teacher-level
perspective, in which the question of interest would be where teachers go after a
restart. Do they stay at the same school, move to a different school, or leave teaching
altogether? This analysis would require information on individual teacher mobility.
This study, however, will approach the question from the school-level point of view, in
which the central question concerns how and to what extent the composition of
teacher characteristics in a school changes after a school is restarted. My analysis will
not be able to show whether it is the school leaders or the teachers themselves that are
the driving force behind any observable changes in teachers in New Orleans public
17
schools. In other words, this school-level analysis will only show how teacher
composition is changing from the school’s perspective, but it will not explain the
mechanism behind that change. This choice in perspective is largely due to limitations
of the data, but results from this study will still be useful to researchers who do have
access to student-level data. Future analyses that follow students after a restart can use
this research to estimate the average effect on the teacher characteristics that a
student experiences of moving to a charter school from a district school, to a district
school from a charter, to a charter from another charter, or remaining in their same
school after a restart has taken place.
5 Theory and Methods
5.1 Conceptual Framework
Public schools in New Orleans are typically closed or restarted due to low
school performance, which is primarily measured by student test scores. Thus, restarts
are generally intended to improve student outcomes in previously low-achieving
schools. According to Hanushek, Kain and Rivkin (2004), one effect of a restart is the
school quality effect. Using an education production function framework, we might
expect that, in order to improve school quality, decision-makers would replace
teachers from the low-performing schools with new, “higher quality” teachers.
Teachers are the most important input to the education production function and have
been shown to have the largest impact on student test scores. Although literature
analyzing the impact of teacher qualities such as experience, certification, and
education on student achievement shows mixed results at best, we might still expect
decision-makers to choose teachers based on these visible characteristics that are
associated with higher quality teaching.
18
However, New Orleans is a unique case; this city is a popular destination for
organizations like Teach for America, TeachNOLA, and City Year, which typically hire
recent college graduates with little or no experience to teach in underserved
classrooms. Teach for America (TFA) alone has 300 teachers stationed in Orleans,
Jefferson, and St. Bernard parishes and makes up 20 percent of the teaching force of
New Orleans (Teach for America, 2016). While data on the precise locations and
mobility of TFA and similar teachers in New Orleans is not readily available, a
common local narrative is that experienced, established black teachers are being
replaced with inexperienced, non-local, mostly white Teach for America and
TeachNOLA teachers, particularly in schools that are restarted or taken over by
charter schools (Vanacore, 2011).
It seems to be that CMOs in New Orleans have strong working relationships
with these kinds of teaching organizations. Therefore, instead of replacing teachers in
low-performing schools with “higher quality” teachers (teachers with a more advanced
degree, a higher certification status, or more years of experience, for example), New
Orleans schools leaders in restarted schools are likely replacing teachers with mostly
inexperienced college graduates from organizations like Teach for America. In this
analysis, we would thus expect to see an increase in the proportion of teachers who
are white, inexperienced, non-local (measured indirectly by location of university
attended), uncertified, and who have at most a bachelor’s degree in New Orleans
public schools following a restart.
5.2 Empirical Methods
To estimate the effect of restarts on school-level teacher characteristics
including race, years of experience, educational degree, certification status, and
university location, I compare the outcomes of a school that was restarted to those of a
19
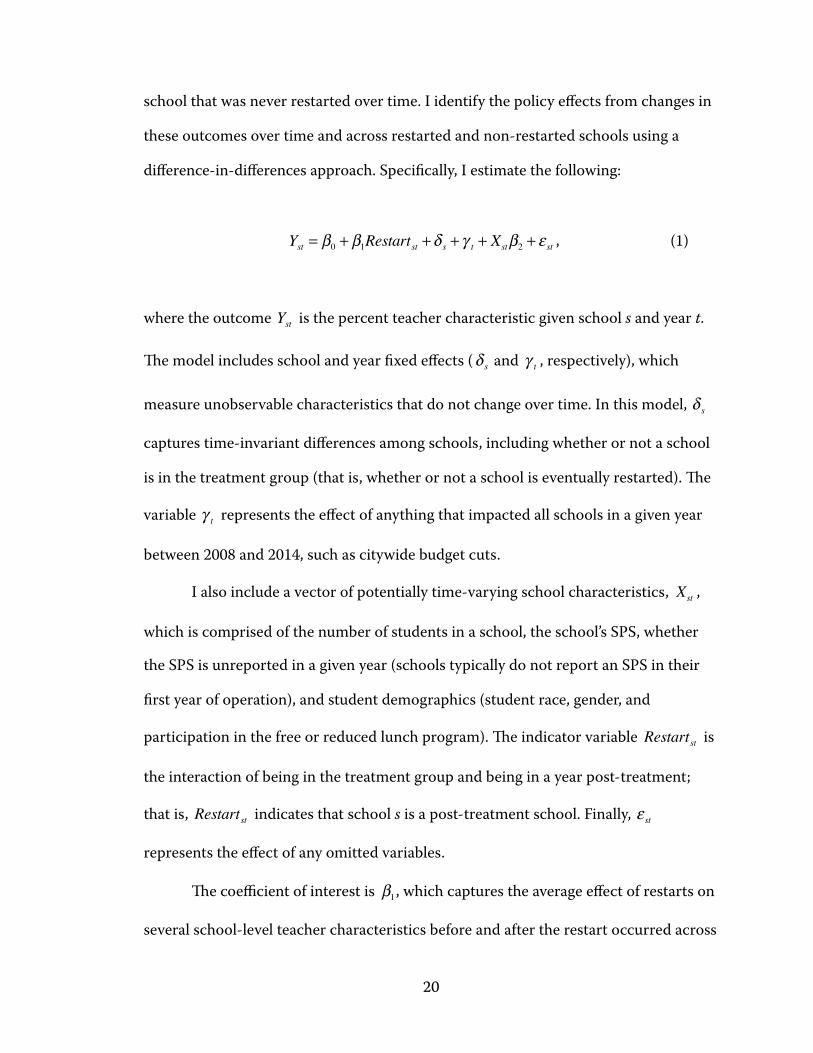
school that was never restarted over time. I identify the policy effects from changes in
these outcomes over time and across restarted and non-restarted schools using a
difference-in-differences approach. Specifically, I estimate the following:
, (1)
where the outcome is the percent teacher characteristic given school s and year t.
The model includes school and year fixed effects ( and , respectively), which
measure unobservable characteristics that do not change over time. In this model,
captures time-invariant differences among schools, including whether or not a school
is in the treatment group (that is, whether or not a school is eventually restarted). The
variable represents the effect of anything that impacted all schools in a given year
between 2008 and 2014, such as citywide budget cuts.
I also include a vector of potentially time-varying school characteristics, ,
which is comprised of the number of students in a school, the school’s SPS, whether
the SPS is unreported in a given year (schools typically do not report an SPS in their
first year of operation), and student demographics (student race, gender, and
participation in the free or reduced lunch program). The indicator variable is
the interaction of being in the treatment group and being in a year post-treatment;
that is, indicates that school s is a post-treatment school. Finally,
represents the effect of any omitted variables.
The coefficient of interest is , which captures the average effect of restarts on
several school-level teacher characteristics before and after the restart occurred across
Yst = β0 + β1Restartst +δ s + γ t + Xstβ2 + ε st
Yst
δ s γ t
δ s
γ t
Xst
Restartst
Restartst ε st
β1
20
schools that were restarted relative to those that were not. The identifying assumption
in this case is that, conditional on the school and year fixed effects as well as on the
time-varying school characteristics, the implementation of school restarts is
uncorrelated with other determinants of teacher-level outcomes. In this model, we
cannot assume school observations across years are independent, so I cluster the
standard errors by school.
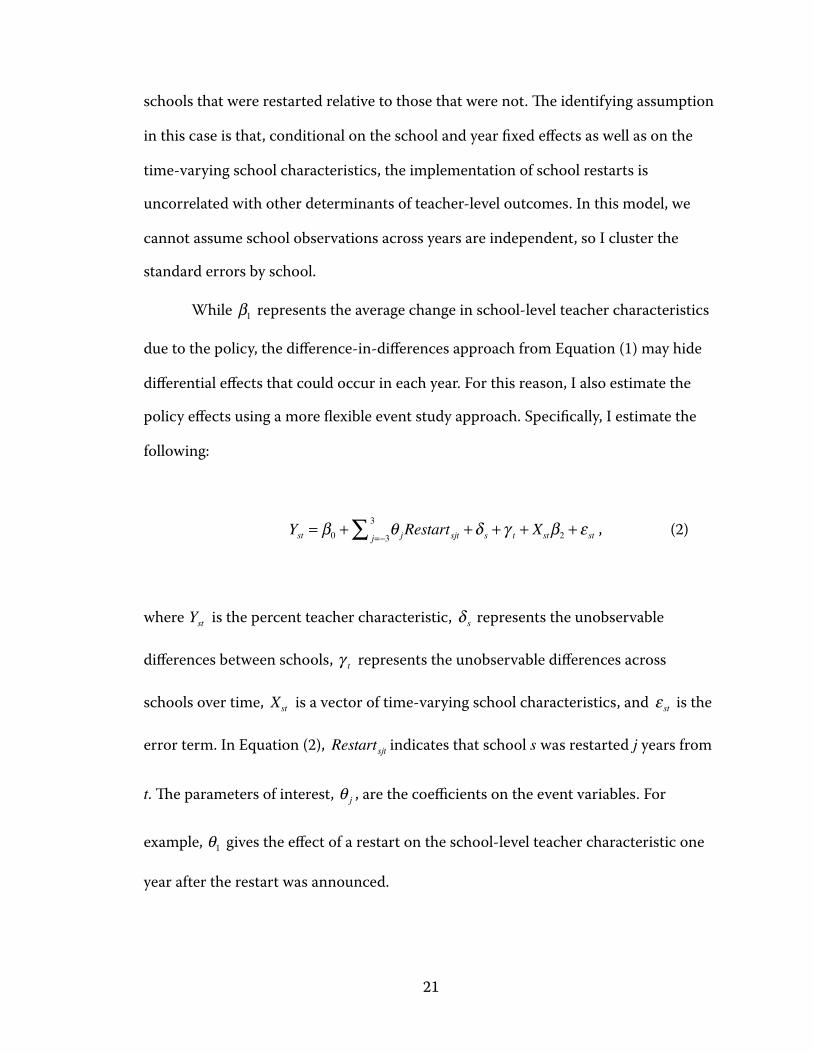
While represents the average change in school-level teacher characteristics
due to the policy, the difference-in-differences approach from Equation (1) may hide
differential effects that could occur in each year. For this reason, I also estimate the
policy effects using a more flexible event study approach. Specifically, I estimate the
following:
, (2)
where is the percent teacher characteristic, represents the unobservable
differences between schools, represents the unobservable differences across
schools over time, is a vector of time-varying school characteristics, and is the
error term. In Equation (2), indicates that school s was restarted j years from
t. The parameters of interest, , are the coefficients on the event variables. For
example, gives the effect of a restart on the school-level teacher characteristic one
year after the restart was announced.
β1
Yst = β0 + θ jRestartsjtj=−3
3∑ +δ s + γ t + Xstβ2 + ε st
Yst δ s
γ t
Xst ε st
Restartsjt
θ j
θ1
21
This event study approach allows me to test whether treatment schools
(schools that experienced a restart) had, on average, similar trends in outcomes to
those of the control schools (schools that never experienced a restart) during the years
before the treatment had taken place.
6 Results
6.1 Difference-in-Differences
Table 7 compares the results of estimating Equation (1) using two different
definitions of the “pre-treatment” and “post-treatment” periods. Panel A uses the
announcement year (that is, the year in which the restart was announced to occur for
the following year) as the first year in the post-treatment period. Panel B includes the
announcement year in the pre-treatment period and defines the year following the
announcement year (the first year in which the school has been restarted) as the first
year post-treatment. It is reasonable to include the announcement year in the post-
treatment period because we might expect that, in reaction to the news that their
school is going to be restarted the next year, teachers may choose to leave the school.
Thus, the announcement itself can be viewed as part of the treatment.
Both panels produce similar trends in results, but none of the Panel A
coefficients are significant, while all of the Panel B coefficients, with the exception of
advanced degree, are significant at either the 0.01 or 0.05 level. The results from Panel
A show insignificant effects of -0.05 for average percent black, -0.04 for average
percent who attended college in Louisiana, 0.01 for average percent uncertified, and
0.02 for average percent with no teaching experience. The results from Panel B show
the same direction of trends but with larger and significant effects. Estimating the
model with the announcement year included in the pre- rather than post-treatment
period shows a decrease in the average percentage of black teachers of 14 percent and
22
a decrease in the average percentage of teachers who attended an instate university of
17 percent, while the average proportion of uncertified teachers and of teachers with
no experience increased by 8 percent and 14 percent, respectively. Neither panel
shows significant effects on the average percentage of teachers who hold advanced
degrees. Although the outcomes are sensitive to treatment definition, the results from
both panels suggest that among similar schools, the effect of a school restart on
within-school changes is that the teaching populations become proportionally less
black, less local (measured indirectly by location of university attended), more
uncertified, and more inexperienced.
6.2 Event Study
Because we might expect that teachers would respond to the news of a restart
in the announcement year, I estimated Equation (1) first with the announcement year
included in the post-treatment period, then with the announcement year as part of the
pre-treatment period. Although the two estimation strategies produced similar trends
in results, the magnitude and significance of the outcomes were different. To
investigate the possibility that teachers are reacting to the treatment in some way
during the announcement year, I estimated Equation (2), an event study analysis that
assesses the impact of the treatment in each year relative to the control schools and to
a given omitted treatment year. In this case, I omit the year prior to the announcement
year because theoretically, there should be no treatment effects during that year.
Graphs 6 through 10 show that for some characteristics, the announcement
year does have a significant effect, but the effect is often in the opposite direction as
that of the rest of the years post-treatment. Including the announcement year in the
post-treatment period therefore decreases the magnitude and significance of the effect
of the treatment, since the effect of the treatment year alone cancels out some of the
23
effect of the rest of the years. Similarly, including the announcement year in the pre-
treatment period, thereby treating it as though it has no treatment effects, likely
artificially inflates the magnitude and significance of the effect of the post-treatment
period beginning with the first year of the restart. Therefore, the true effects likely fall
somewhere in between the results of Panel A in Table 7 and those of Panel B.
6.3 Robustness Checks
In order to confirm that the results of the event study method are robust to
model specifications, I conducted some robustness checks. Table 8 shows the results
from three different event study models. All three models include clustered standard
errors and student demographics and omit the year prior to the announcement year.
Additionally, all three models group together the effects of three and four years post-
announcement year. Model 1 is the tabled results of estimating Equation (2) using all
schools and all years in the base sample and groups together the effects of three, four,
and five years prior to the announcement year. To show comparisons, Model 2 drops
any schools that have data on five years prior to announcement year and groups
together observations on three and four years prior, while Model 3 drops schools with
either four or five years prior. The results from Model 2 have the same trends for the
announcement year as those from Model 1, but the effects are larger and more
significant. Model 3 produces very similar results to Model 1 in terms of significance
and magnitude for the announcement year. Although the event study method is
sensitive to model specifications, the results of three models taken together suggest
that the announcement year has significant effects on most of the observed teacher
characteristics in the opposite direction as that of the rest of the post-treatment years.
In other words, while the post-treatment period as a whole shows a decrease in the
proportion of teachers who are black or who attended an instate university and an
24
increase in the proportion who have no certification and no years of teaching
experience, the announcement year alone shows increased percent black, increased
percent instate, decreased percent uncertified, and decreased percent inexperienced.
7 Conclusion
Since 2007, nearly half of all New Orleans public schools have experienced
either a restart or a closure as a result of failing to meet statewide standards of student
performance. In New Orleans, most school restarts take the form of a charter takeover
of a traditional public school or other charter school. Although research suggests that
these restarts do have a positive impact student achievement (Imberman, 2007; Ruble,
2015), no research exists, that I know of, on the impact of charter takeovers on
teachers. If charter takeover schools are replacing some or all of the teachers in the
schools they take over, we may expect that this impact on achievement is at least
partially explained by the change in teachers that the students in restarted schools are
experiencing.
This paper uses a difference-in-differences approach to estimate the average
effect of school restarts in New Orleans on within-school teacher characteristics
including race, location of university attended, certification status, teaching
experience, and educational degree. Between 2007 and 2014, restarting schools
resulted in schools having, on average, a smaller proportion of black teachers, a
smaller proportion of teachers who attended college in Louisiana, a larger proportion
of teachers without any certification, and a larger proportion of teachers with zero
years of teaching experience. There was no apparent impact on the average percent of
teachers who hold advanced degrees. These findings are conceptually consistent with
the assumption that, after a restart, decision-makers are bringing in teachers from
organizations like Teach for America to the schools.
25
This study cannot determine whether the change in teachers is a result of
decisions by school leaders (e.g., firing and replacing teachers) or by the teachers
themselves (e.g., voluntarily leaving schools that have been restarted). This analysis
also cannot establish how the students themselves are experiencing any change in
teachers. Future research with access to student-level data can see whether or not
students stay in their same schools once the schools are restarted or, if the students
choose to leave instead, where they go. Then, based on the results of this study, they
can see whether any observed impact of school restarts on student achievement can
be attributed to the change in teachers that those students are experiencing.
Economic theory suggests that charter takeovers could benefit society;
however, the specific ways in which charter takeovers are executed may result in
disadvantageous, or at least controversial, effects. New Orleans has a unique historical
relationship with charter schools, which have especially flourished in the city after
Hurricane Katrina. New Orleans has been a leader in the charter school movement,
and its extensive use of charter schools has caused significant controversy. Charter
takeovers in particular are viewed by many New Orleans residents as detrimental to
racial progress in the city. A common local narrative is that predominantly white
CMOs are taking over the operations of majority black public schools and replacing
longstanding, experienced black teachers with unqualified, mostly white recent college
graduates who have no real ties to the city and rarely teach for longer than a few years.
While this analysis cannot directly confirm those assumptions, the results presented
in this paper suggest that decision-makers in school restarts may be relying on TFA-
type organizations to supply their teachers, which is fundamentally changing the
quality and race of the teaching populations in New Orleans public schools.
26
References
Aaronson, D., Barrow, L., & Sander, W. (2007). Teachers and student achievement
in the Chicago public high schools. Journal of Labor Economics, 25(1), 95–
135.
Abdulkadiroğlu, A., Angrist, J., Dynarski, S., Kane, T., & Pathak, P. (2009).
Accountability and flexibility in public schools: Evidence from Boston's
charters and pilots (Working Paper No. 15549). Retrieved from http://
www.nber.org/papers/w15549
Abdulkadiroğlu, A., Angrist, J., Hull, P., & Pathak, P. (2014) Charters without
lotteries: Testing takeovers in New Orleans and Boston (Working Paper No.
20792). Retrieved from http://www.nber.org/papers/w20792.
American Youth Policy Forum. (2008). New Orleans Recovery School District:
Rebuilding public education in New Orleans after Hurricane Katrina.
Presentation to the American Youth Policy Forum. Retrieved from http://
www.aypf.org/documents/RamseyGreenPPT.pdf
Anderson, N. (2010, February 2). Education Secretary Duncan apologizes for
Katrina comments. The Washington Post. Retrieved November 9, 2015, from
http://www.washingtonpost.com/wp-dyn/content/article/2010/02/02/
AR2010020201661.html
Angrist, J., Pathak, P., & Walters, C. (2011). Explaining charter school effectiveness
(Working Paper No. 17332). Retrieved from http://www.nber.org/papers/
w17332.
Boyd, D., Lankford, H., Loeb, S., Rockoff, J., & Wyckoff, J. (2008). The narrowing
gap in New York City teacher qualifications and its implications for student
27
achievement in high-poverty schools (Working Paper No. 14021) Retrieved
from http://www.nber.org/papers/w14021.
Buddin, R., & Zimmer, R. (2003). Academic outcomes. In Charter school operations
and performance: New evidence from California. RAND Corporation: Santa
Monica, CA.
Buddin, R., & Zimmer, R.(2005). Student achievement in charter schools: A
complex picture. Journal of Policy Analysis and Management, 24(2), 351–371.
Burns, P. (2010). Race and support for state takeovers of local school districts.
Urban Education, 45(3), 274–292.
Carr, S. (2015, June 18). What happened after New Orleans fired all of its teachers
—and why it still matters to diversity in the classroom. Slate. Retrieved
November 9, 2015, from http://www.slate.com/blogs/schooled/2015/06/18/
black_teachers_in_new_orleans_the_number_of_them_has_plummeted_sinc
e_hurricane.html
Commonwealth Educational Policy Institute (CEPI). (2000). The Virginia Standards
of Learning. Retrieved November 9, 2015, from http://web.archive.org/web/
20080821125416/http://www.cepionline.org/policy_issues/saa/
va_standards.html
Chetty, R., Friedman, J., & Rockoff, J. (2014). Measuring the impacts of teachers I:
Evaluating bias in teacher value-added estimates. American Economic Review,
104(9), 2593–2632.
Chetty, R., Friedman, J., & Rockoff, J. (2014). Measuring the impacts of teachers II:
Teacher value-added and student outcomes in adulthood. American
Economic Review, 104(9), 2633–2679.
28
Center for Research on Education Outcomes (CREDO). National charter school
study (2009). Standford, University: Stanford, CA.
Center for Research on Education Outcomes (CREDO). National charter school
study (2013). Standford, University: Stanford, CA.
Dee, T. (2004). Teachers, race, and student achievement in a randomized
experiment. The Review of Economics and Statistics, 86(1), 195–210.
Dreilinger, D. (2015, May 18). U.S. Supreme Court denies teachers' Katrina layoffs
suit. The Times-Picayune. Retrieved November 9, 2015, from http://
www.nola.com/education/index.ssf/2015/05/
supreme_court_denies_katrina_t.html
Ehrenberg, R., Goldhaber, D., & Brewer, D. (1995). Do teachers’ race, gender, and
ethnicity matter? Evidence from the National Educational Longitudinal
Study of 1988. Industrial and Labor Relations Review, 48(3), 547–561.
Friedman, M. (1962). The role of government in education. In Capitalism and
Freedom (85–107). Chicago, IL: University of Chicago Press.
Gill, B., Zimmer, R., Christman, J., & Blanc, S. (2007). State takeover, school
restructuring, private management, and student achievement in
Philadelphia. RAND Corporation: Santa Monica, CA.
Gleason, P., Clark, M., Tuttle, C., Dwoyer, E., & Silverberg, M. (2010). The
evaluation of charter school impacts: Final report. National Center for
Education Evaluation and Regional Assistance, Institute of Education
Sciences, U.S. Department of Education: Washington, D.C.
Goldhaber, D., & Brewer, D. (1997). Why don’t schools and teachers seem to
matter? Assessing the impact of unobservables on educational productivity.
The Journal of Human Resources, 32(3), 505–520.
29
Green, R. L., & Carl, B. R. (2000). A reform for troubled times: Takeovers of urban
schools. The Annals of the American Academy of Political and Social Science,
569(1), 56–70.
Hanushek, E.A. (1971). Teacher characteristics and gains in student achievement:
Estimation using micro data. American Economic Review, 60(2), 280–288.
Hanushek, E., Kain, J., O’Brien, D., & Rivkin, S. (2005). The market for teacher
quality (Working Paper No. 11154). Retrieved from http://www.nber.org/
papers/w11154.
Hoxby, C. M. (2004). Achievement in charter schools and regular public schools in
the United States: Understanding the differences. Harvard University and
National Bureau of Economic Research.
Hoxby, C. M. & Rockoff, J. E. (2005). The impact of charter schools on student
achievement. RAND Corporation: Santa Monica, CA.
Hoxby, C.M., Murarka, S., & Kang, J. (2009). How New York City’s charter schools
affect achievement. Second report in series. New York City Charter Schools
Evaluation Project: Cambridge, MA.
Imberman, S. (2007). Achievement and behavior in charter schools: Drawing a
more complete picture. The Review of Economics and Statistics, 93(2), 416–
435.
Institute on Race and Poverty. (2010) The State of Public Schools in Post-Katrina
New Orleans: The Challenge of Creating Equal Opportunity. Retrieved
November 9, 2015 from http://www.irpumn.org/uls/resources/projects/
THE_STATE_OF_SCHOOLS_IN_NEW_ORLEANS.pdf
30
Kane, T., Rockoff, J., & Staiger, D. (2008). What does certification tell us about
teacher effectiveness? Evidence from New York City. Economics of Education
Review, 27, 615–631.
Kane, T. J. & Staiger, D. O. (2002). The promise and pitfalls of using imprecise
school accountability. Journal of Economic Perspectives, 16(4), 91–114.
National Alliance for Public Charter Schools. (2014). A growing movement:
America’s largest charter school communities. Washington, D.C.
Nye, B., Konstantopoulos, S., & Hedges, L. (2004). How large are teacher effects?
Educational Evaluation and Policy Analysis, 26(3), 237–257.
Oluwole, J. O. & Green, P. C. (2009). State takeovers of school districts: Race and
the equal protection clause. Indiana Law Review, 42, 343–409.
Rice, J., & Schwartz, A. (2008). Toward an understanding of productivity in
education. In Handbook of research in education finance and policy. New
York, NY: Routledge.
Rivkin, S., Hanushek, E., & Kain, J. (2005). Teachers, schools, and academic
achievement. Econometrica, 73(2), 417–458.
Rockoff, J. (2004). The impact of individual teachers on student achievement:
Evidence from panel data. The American Economic Review, 94(2), 247–252.
Ruble, W. (2015). The effect of contracting out low performing schools on student
performance. Preliminary draft.
Sanders, W. L., & Rivers, J. C. (1996). Cumulative and residual effects of teachers on
future student academic achievement (Research Progress Report). Knoxville,
TN: University of Tennessee Value-Added Research and Assessment Center.
Sass, T. (2004). Charter schools and student achievement in Florida. Preliminary
draft.
31
Sawicky, M. (1996). Contracting and economic efficiency. In Risky Business: Private
Management of Public Schools. Economic Policy Institute: Washington, D.C.
Sims, D. (2013). Can failure succeed? Using racial subgroup rules to analyze the
effect of school accountability failure on student performance. Economics of
Education Review, 32, 262–274.
Sims, P. & Vaughan, D. (2014). The state of public education in New Orleans.
Cowen Institute for Public Education Initiatives, Tulane University: New
Orleans, LA.
Sims, P. & Rossmeier, V. (2015). The state of public education in New Orleans: 10
years after Hurricane Katrina. Cowen Institute for Public Education
Initiatives, Tulane University: New Orleans, LA.
Springer, M. (2008). The influence of an NCLB accountability plan on the
distribution of student test score gains. Economics of Education Review, 27,
556-563.
Teach for America. (2016). About Greater New Orleans-Louisiana Delta. Retrieved
from https://neworleans.teachforamerica.org
The Lens. (n.d.). How to understand School Performance Scores and grades.
Retrieved March 24, 2016, from http://thelensnola.org/how-to-understand-
school-performance-scores-and-grades/
Tuttle, C. C., Gill, B., Gleason, P., Knechtel, V., Nichols-Barrer, I., and Resch, A.
(2013). KIPP middle schools: Impacts on achievement and other outcomes.
Mathematica Policy Research, Princeton, NJ.
Vanacore, A. (2011, Nov. 27). Teach for America has become embedded in New
Orleans education. The Times-Picayune. Retrieved March 24, 2016, from
32
http://www.nola.com/education/index.ssf/2011/11/
teach_for_america_has_become_e.html
Zernike, K. (2015, October 24). Obama administration calls for limits on testing in
schools. New York Times. Retrieved November 9, 2015, from http://
www.nytimes.com/2015/10/25/us/obama-administration-calls-for-limits-
on-testing-in-schools.html?_r=0
Zimmer, R., Gill, B., Booker, K., Lavertu, S., Sass, T. R., & Witte, J. (2009). Charter
schools in eight states: Effects on achievement, attainment, integration, and
competition. RAND Corporation: Santa Monica, CA.
33
8 Tables and Figures
34
35
36
-0.4
-0.3
-0.2
-0.1
0
0.1
0.2
-3 -2 -1 0 1 2 3Yearssinceannouncementyear
GRAPH6. RESULTS,PERCENT BLACK
37
-0.5
-0.4
-0.3
-0.2
-0.1
0
0.1
0.2
0.3
-3 -2 -1 0 1 2 3Yearssinceannouncementyear
GRAPH7. RESULTS,PERCENT INSTATE
-0.1
-0.05
0
0.05
0.1
0.15
0.2
0.25
0.3
-3 -2 -1 0 1 2 3Yearssinceannouncementyear
GRAPH8. RESULTS,PERCENT UNCERTIFIED
38
-0.2
-0.15
-0.1
-0.05
0
0.05
0.1
0.15
0.2
0.25
0.3
-3 -2 -1 0 1 2 3Yearssinceannouncementyear
GRAPH9. RESULTS,PERCENT NOEXPERIENCE
-0.15
-0.1
-0.05
0
0.05
0.1
-3 -2 -1 0 1 2 3Yearssinceannouncementyear
GRAPH10. RESULTS,PERCENTWITHADVANCEDDEGREE
39
40
41
42
43
44
45