Embed Size (px)
Citation preview
Verizon Communications Inc.S.R.THIVYA DHANA LAKSHMI10MBA048
History of Verizon Communications1,2
• 2000 – Bell Atlantic and Vodafone combine U.S. wireless operations to form Verizon Wireless
• Jun 2000 – Verizon Communications Inc. formed with merger of Bell Atlantic Corp. and GTE Corp to become the number one communications provider.
• 2004 – Verizon embarks on next generation broadband services (EV-DO, FiOS)
• Dec 2005 – Acquired competitor MCI Inc.4
• 2005 – Verizon becomes first wireless provider to offer a nationwide broadband service
• 2005 – Wins Frost & Sullivan’s Product Innovation Award5
• 2006 – 2007 – Invested $34.6 billion to maintain, upgrade, and expand its technology infrastructure
• Headquartered in New York, New York
• Total Operating Revenue is $93.5 billion
• Employs nearly 235,000 employees
• Largest wireless and fixed-line service provider
• Operates three business units– Verizon Wireless– Wireline– Verizon Business
Current Statistics3
Products and Services15-17
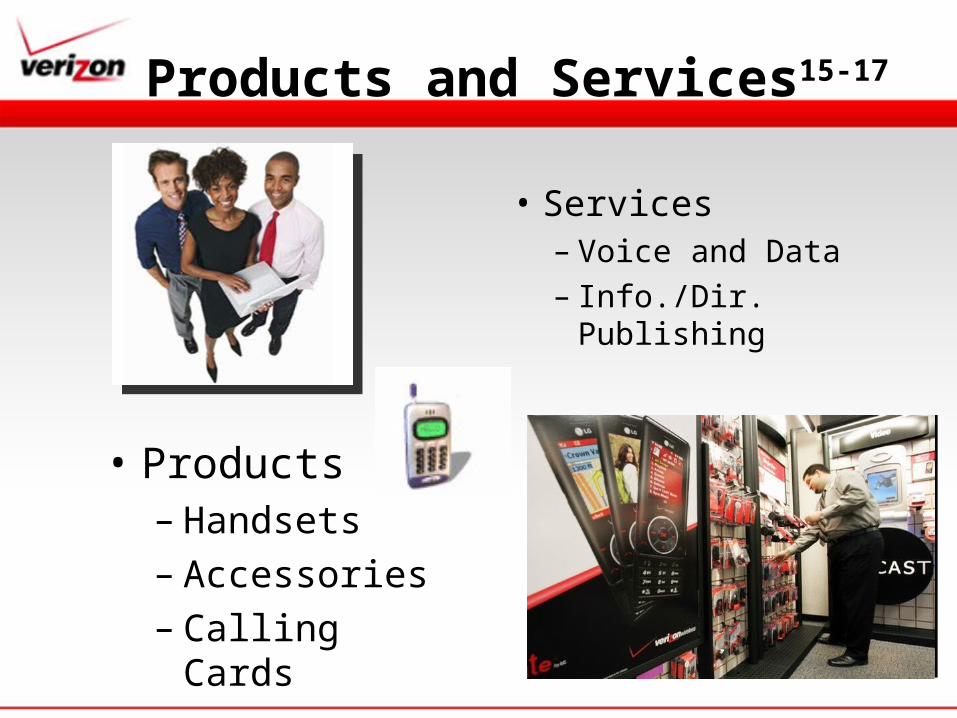
• Services– Voice and Data– Info./Dir. Publishing
• Products– Handsets– Accessories– Calling Cards
Current Leaders6
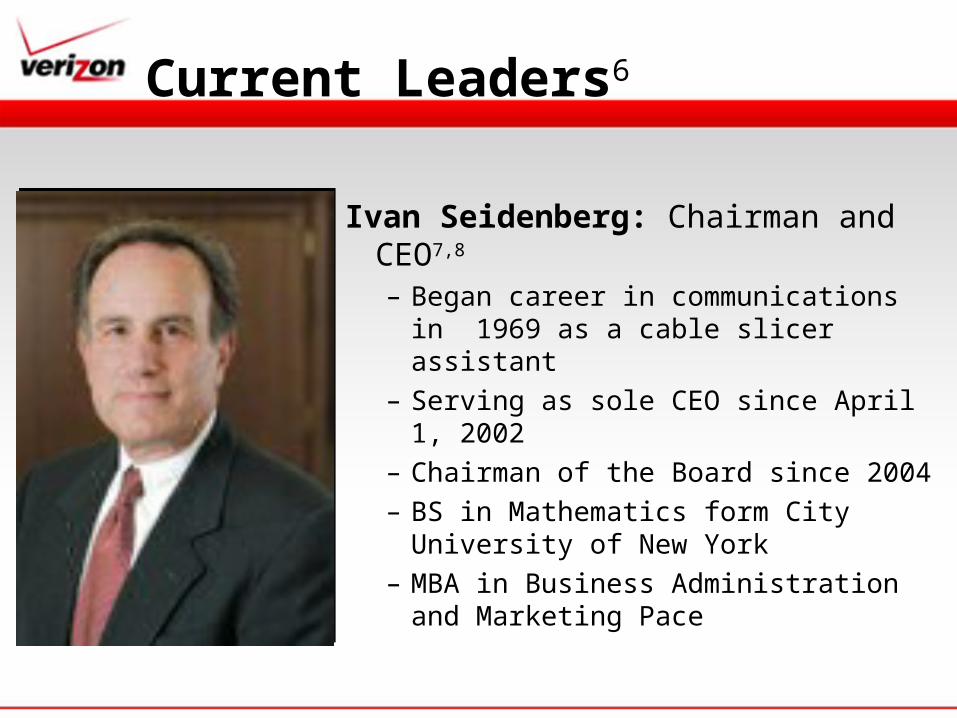
Ivan Seidenberg: Chairman and CEO7,8
– Began career in communications in 1969 as a cable slicer assistant
– Serving as sole CEO since April 1, 2002– Chairman of the Board since 2004– BS in Mathematics form City University
of New York– MBA in Business Administration and
Marketing Pace
Current Leaders6
William P. Barr: EVP and General Counsel11,12
– Began career in telecommunications in 1994 with GTE as EVP of government and regulatory advocacy
– Attorney general from 1991 to 1993– Held current EVP and General Counsel position since 2000– Helped steer negotiations that formed Verizon– BA in Government from Columbia University– MA in Government and Chinese Studies from Columbia
University– Juris Doctor Degree from George Washington University
Dennis F. Strigl: President and COO9,10
– Former President and CEO of Bell Atlantic Mobile– Former group President and CEO of Bell Atlantic Global
Wireless– Over 30 years of experience in the communications industry– Serves on Board of Directors of Verizon Wireless– BA in Business Administration from Canisius College Buffalo,
NY– MBA from Fairleigh Dickinson University Rutherford, NJ
“Verizon’s mission is to enable people and businesses to communicate with each other. We are also committed to providing full and
open communication with our customers, employees and investors.”
Mission Statement (Actual)13
Mission Statement (Proposed)
“Verizon’s mission is to maintain leadership in communications by continuously stretching the boundaries of technology and providing
our customers with the means to communicate in ways not thought before.”
Vision Statement (Actual)14
“For our Core Goals, we decided on just one: To create the most respected brand in
communications.”
Vision Statement (Proposed)
“For our Core Goals, we decided on just one: To create the most respected brand in
communications through product and technological innovation paired with excellent
customer service.”
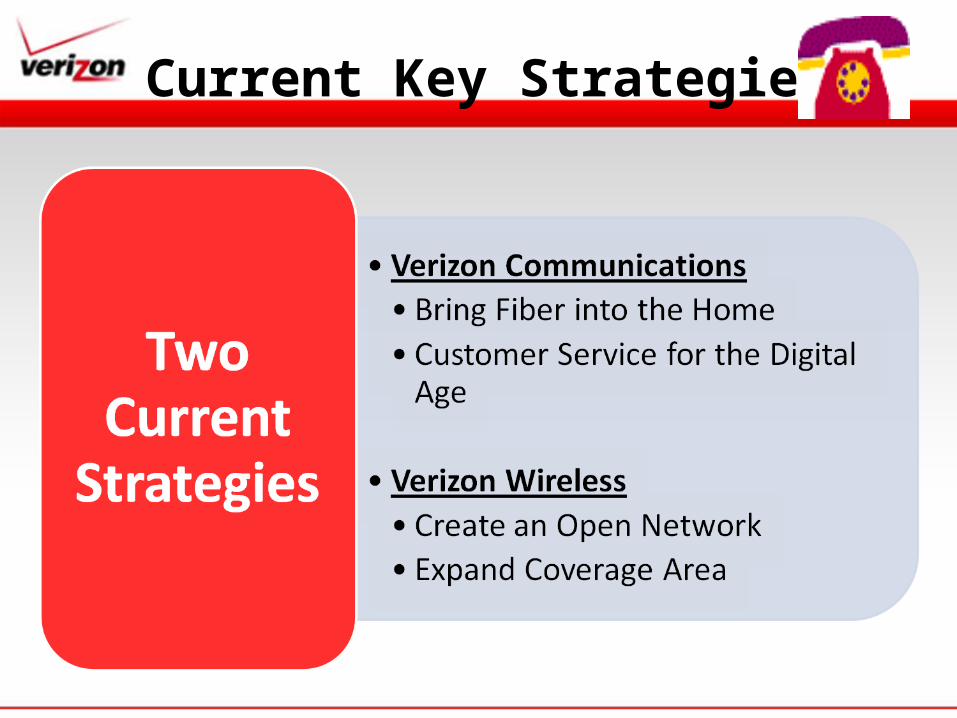
Current Key Strategies
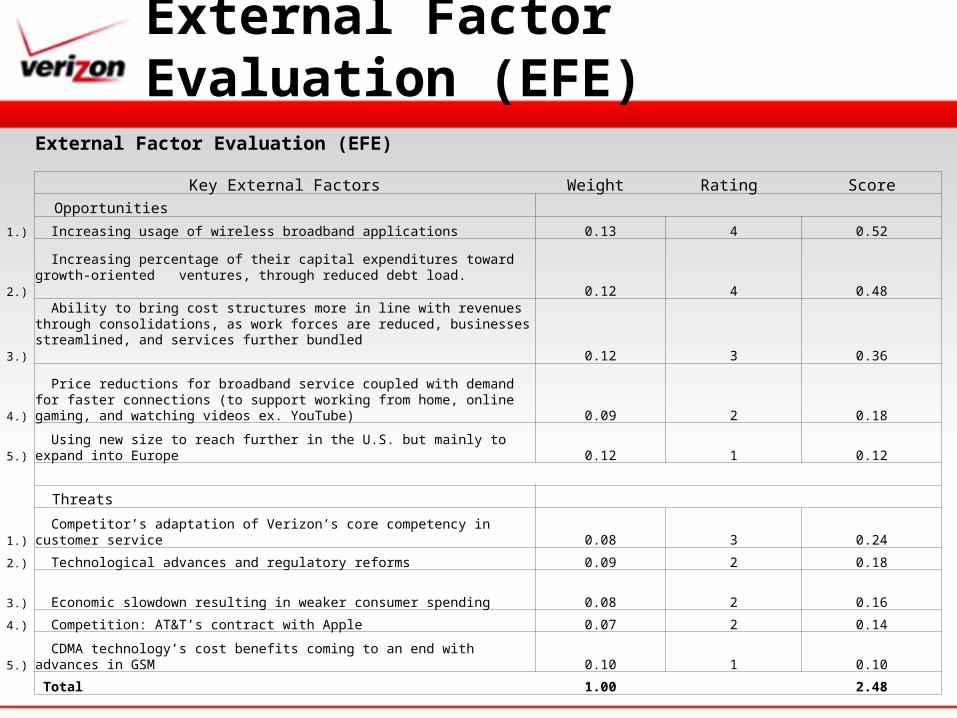
External Factor Evaluation (EFE)
Key External Factors Weight Rating Score
Opportunities
1.) Increasing usage of wireless broadband applications 0.13 4 0.52
2.)
Increasing percentage of their capital expenditures toward growth-oriented ventures, through reduced debt load.
0.12 4 0.48
3.)
Ability to bring cost structures more in line with revenues through consolidations, as work forces are reduced, businesses streamlined, and services further bundled
0.12 3 0.36
4.) Price reductions for broadband service coupled with demand for faster connections (to support working from home, online gaming, and watching videos ex. YouTube) 0.09 2 0.18
5.) Using new size to reach further in the U.S. but mainly to expand into Europe 0.12 1 0.12
Threats
1.) Competitor’s adaptation of Verizon’s core competency in customer service 0.08 3 0.24
2.) Technological advances and regulatory reforms 0.09 2 0.18
3.) Economic slowdown resulting in weaker consumer spending 0.08 2 0.16
4.) Competition: AT&T’s contract with Apple 0.07 2 0.14
5.) CDMA technology’s cost benefits coming to an end with advances in GSM 0.10 1 0.10
Total 1.00 2.48
External Factor Evaluation (EFE)
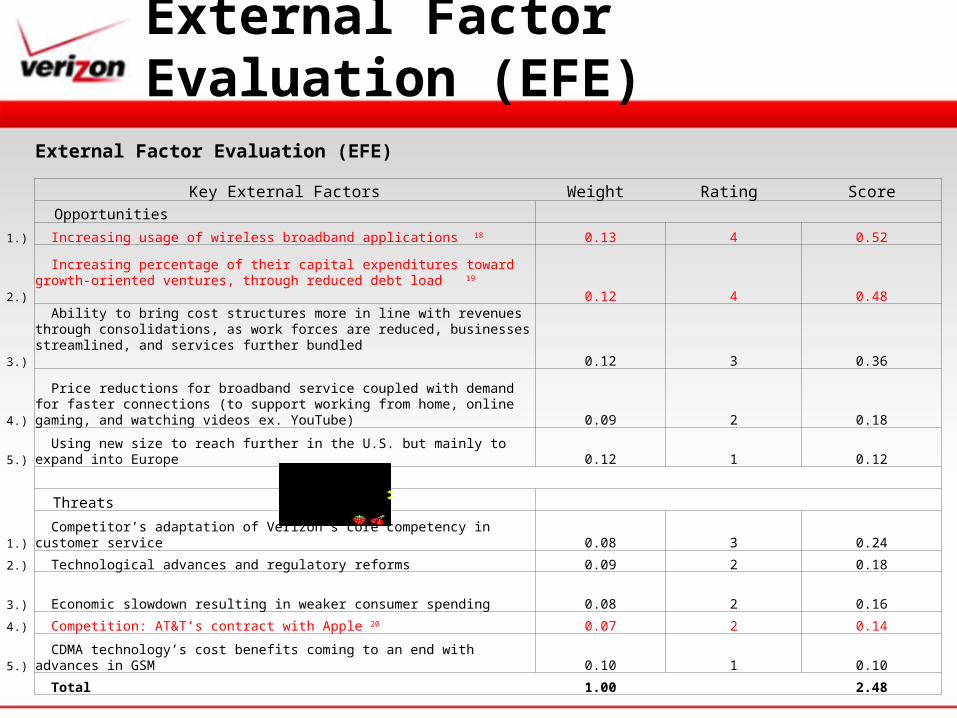
External Factor Evaluation (EFE)
Key External Factors Weight Rating Score Opportunities
1.) Increasing usage of wireless broadband applications 18 0.13 4 0.52
2.)
Increasing percentage of their capital expenditures toward growth-oriented ventures, through reduced debt load 19
0.12 4 0.48
3.)
Ability to bring cost structures more in line with revenues through consolidations, as work forces are reduced, businesses streamlined, and services further bundled
0.12 3 0.36
4.) Price reductions for broadband service coupled with demand for faster connections (to support working from home, online gaming, and watching videos ex. YouTube) 0.09 2 0.18
5.) Using new size to reach further in the U.S. but mainly to expand into Europe 0.12 1 0.12
Threats
1.) Competitor’s adaptation of Verizon’s core competency in customer service 0.08 3 0.24
2.) Technological advances and regulatory reforms 0.09 2 0.18
3.) Economic slowdown resulting in weaker consumer spending 0.08 2 0.16
4.) Competition: AT&T’s contract with Apple 20 0.07 2 0.14
5.) CDMA technology’s cost benefits coming to an end with advances in GSM 0.10 1 0.10
Total 1.00 2.48
External Factor Evaluation (EFE)
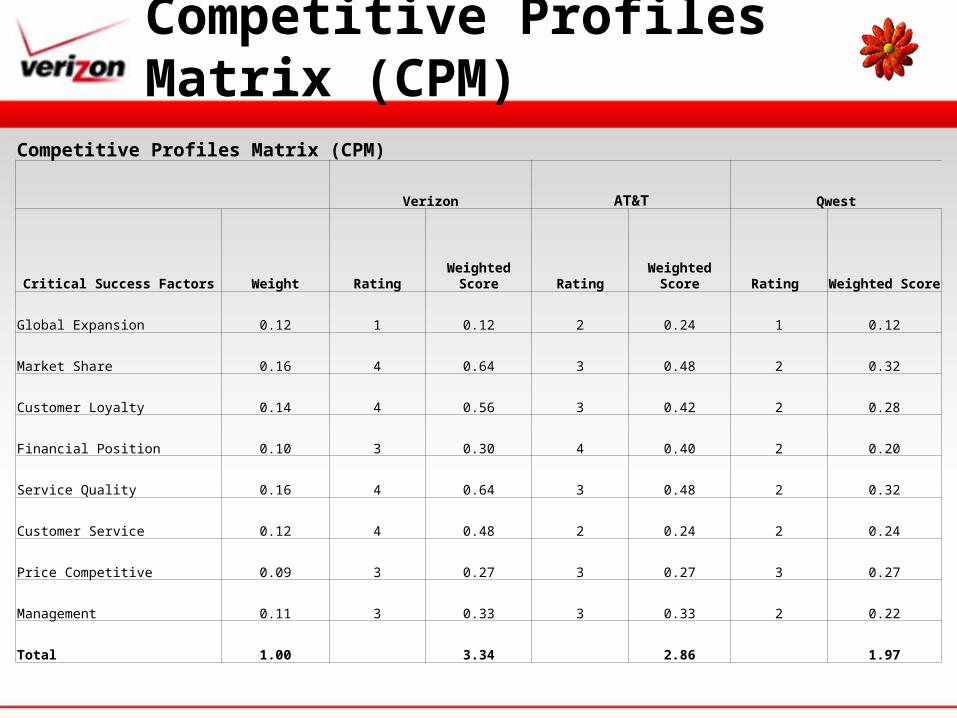
Competitive Profiles Matrix (CPM)
Verizon AT&T Qwest
Critical Success Factors Weight Rating Weighted Score Rating Weighted Score Rating Weighted Score
Global Expansion 0.12 1 0.12 2 0.24 1 0.12
Market Share 0.16 4 0.64 3 0.48 2 0.32
Customer Loyalty 0.14 4 0.56 3 0.42 2 0.28
Financial Position 0.10 3 0.30 4 0.40 2 0.20
Service Quality 0.16 4 0.64 3 0.48 2 0.32
Customer Service 0.12 4 0.48 2 0.24 2 0.24
Price Competitive 0.09 3 0.27 3 0.27 3 0.27
Management 0.11 3 0.33 3 0.33 2 0.22
Total 1.00 3.34 2.86 1.97
Competitive Profiles Matrix (CPM)
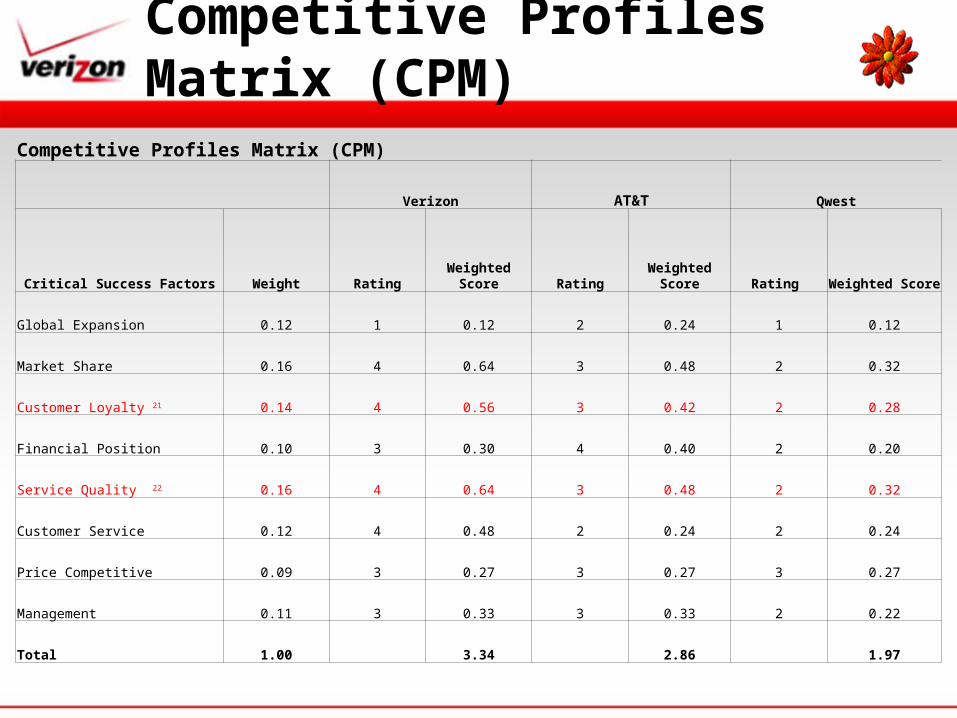
Competitive Profiles Matrix (CPM)
Verizon AT&T Qwest
Critical Success Factors Weight Rating Weighted Score Rating Weighted Score Rating Weighted Score
Global Expansion 0.12 1 0.12 2 0.24 1 0.12
Market Share 0.16 4 0.64 3 0.48 2 0.32
Customer Loyalty 21 0.14 4 0.56 3 0.42 2 0.28
Financial Position 0.10 3 0.30 4 0.40 2 0.20
Service Quality 22 0.16 4 0.64 3 0.48 2 0.32
Customer Service 0.12 4 0.48 2 0.24 2 0.24
Price Competitive 0.09 3 0.27 3 0.27 3 0.27
Management 0.11 3 0.33 3 0.33 2 0.22
Total 1.00 3.34 2.86 1.97
Competitive Profiles Matrix (CPM)
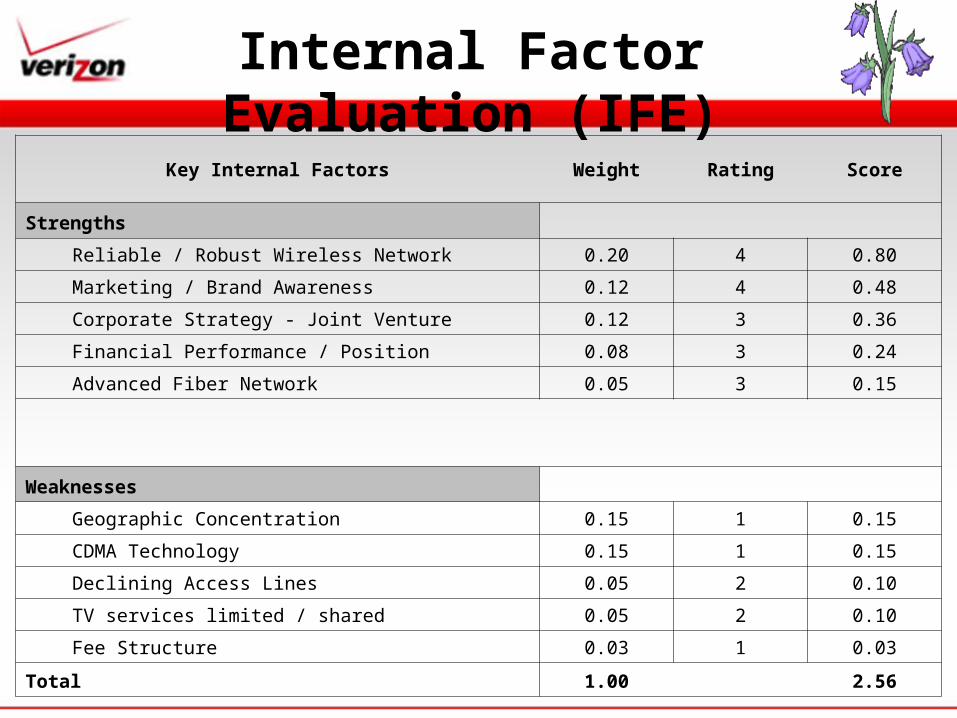
Internal Factor Evaluation (IFE)Key Internal Factors Weight Rating Score
Strengths
Reliable / Robust Wireless Network 0.20 4 0.80
Marketing / Brand Awareness 0.12 4 0.48
Corporate Strategy - Joint Venture 0.12 3 0.36
Financial Performance / Position 0.08 3 0.24
Advanced Fiber Network 0.05 3 0.15
Weaknesses
Geographic Concentration 0.15 1 0.15
CDMA Technology 0.15 1 0.15
Declining Access Lines 0.05 2 0.10
TV services limited / shared 0.05 2 0.10
Fee Structure 0.03 1 0.03
Total 1.00 2.56
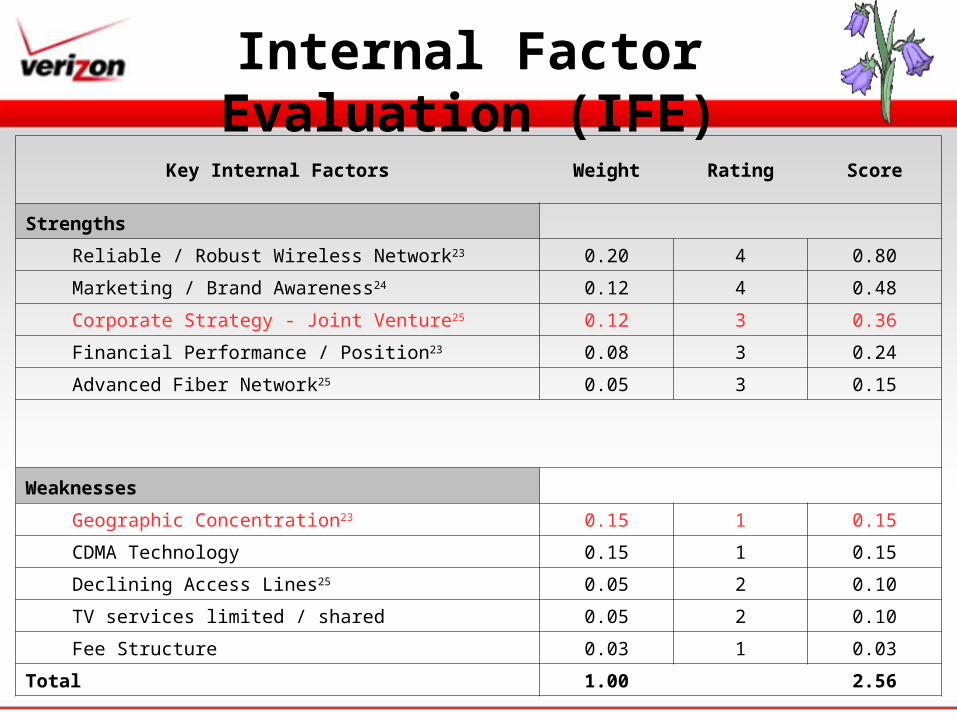
Internal Factor Evaluation (IFE)Key Internal Factors Weight Rating Score
Strengths
Reliable / Robust Wireless Network23 0.20 4 0.80
Marketing / Brand Awareness24 0.12 4 0.48
Corporate Strategy - Joint Venture25 0.12 3 0.36
Financial Performance / Position23 0.08 3 0.24
Advanced Fiber Network25 0.05 3 0.15
Weaknesses
Geographic Concentration23 0.15 1 0.15
CDMA Technology 0.15 1 0.15
Declining Access Lines25 0.05 2 0.10
TV services limited / shared 0.05 2 0.10
Fee Structure 0.03 1 0.03
Total 1.00 2.56
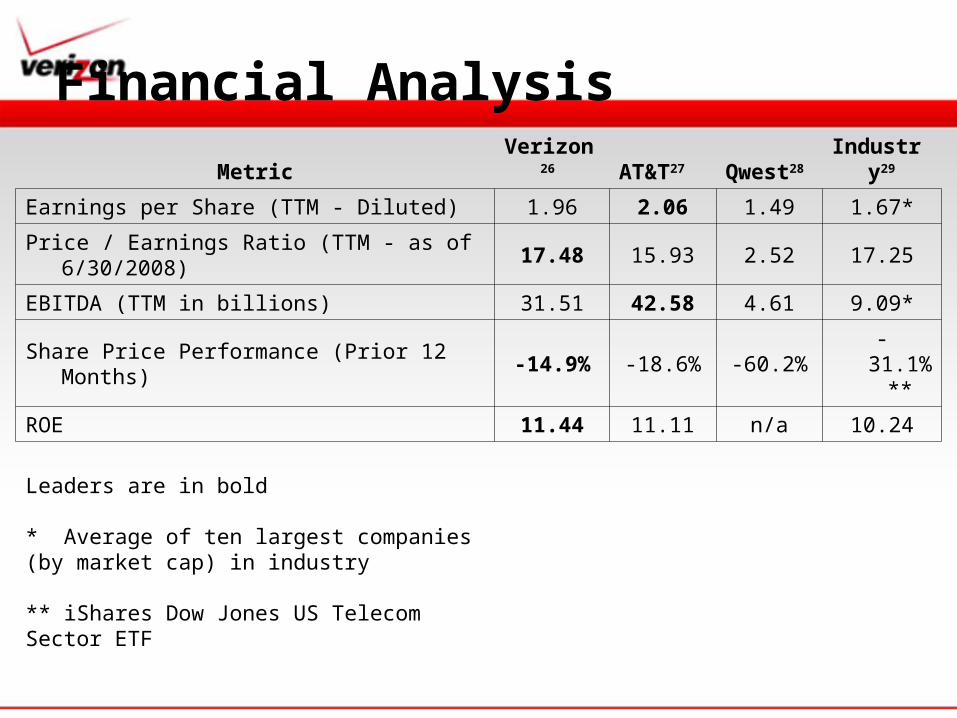
Financial AnalysisMetric Verizon26 AT&T27 Qwest28 Industry29
Earnings per Share (TTM - Diluted) 1.96 2.06 1.49 1.67*
Price / Earnings Ratio (TTM - as of 6/30/2008) 17.48 15.93 2.52 17.25
EBITDA (TTM in billions) 31.51 42.58 4.61 9.09*
Share Price Performance (Prior 12 Months) -14.9% -18.6% -60.2% -31.1%**
ROE 11.44 11.11 n/a 10.24
Leaders are in bold
* Average of ten largest companies (by market cap) in industry
** iShares Dow Jones US Telecom Sector ETF
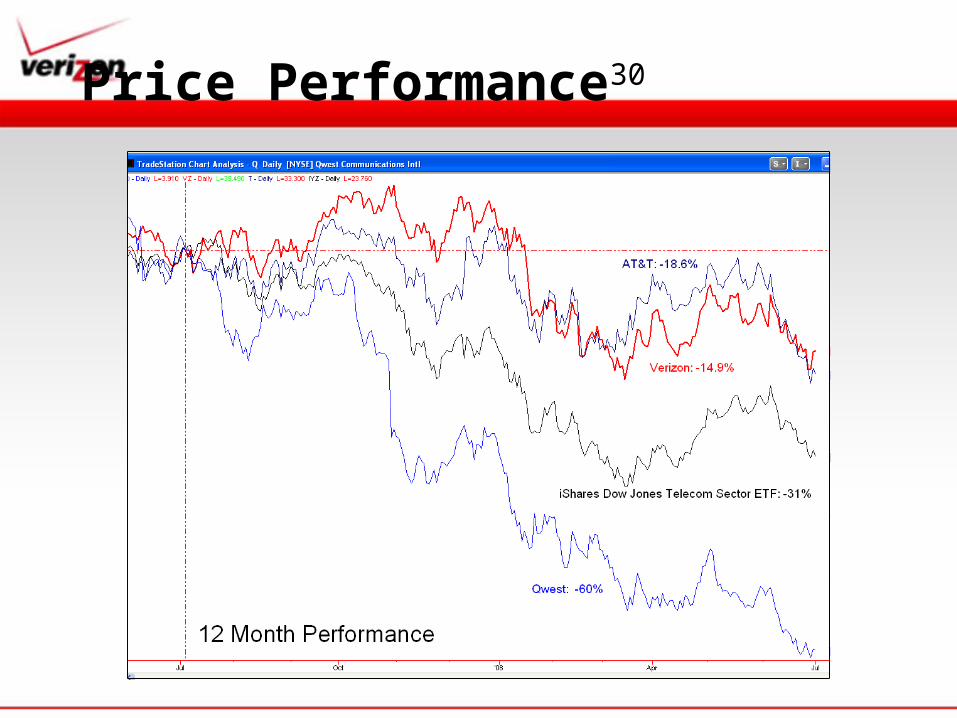
Price Performance30
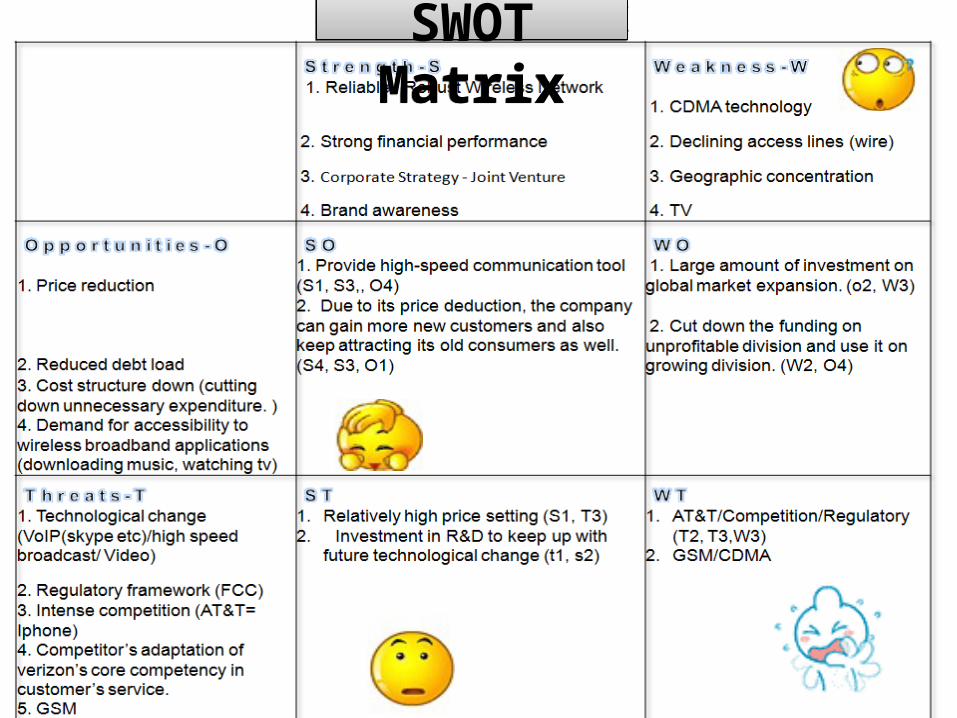
SWOT MatrixSWOT Matrix
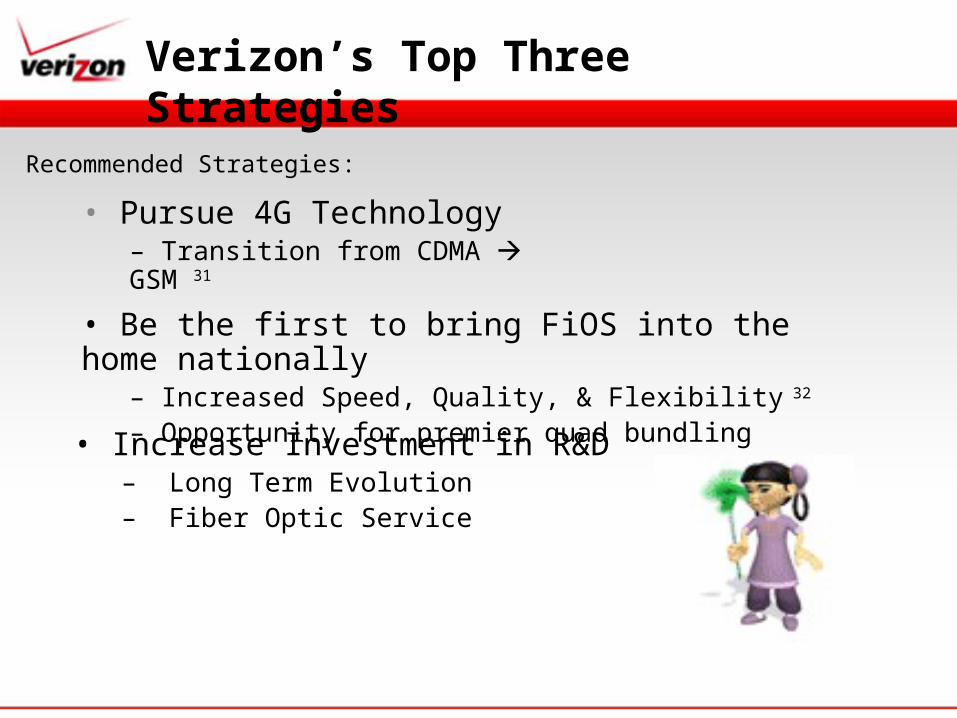
Verizon’s Top Three Strategies
• Pursue 4G Technology– Transition from CDMA GSM 31
Recommended Strategies:
• Be the first to bring FiOS into the home nationally– Increased Speed, Quality, & Flexibility 32
– Opportunity for premier quad bundling
• Increase Investment in R&D – Long Term Evolution– Fiber Optic Service
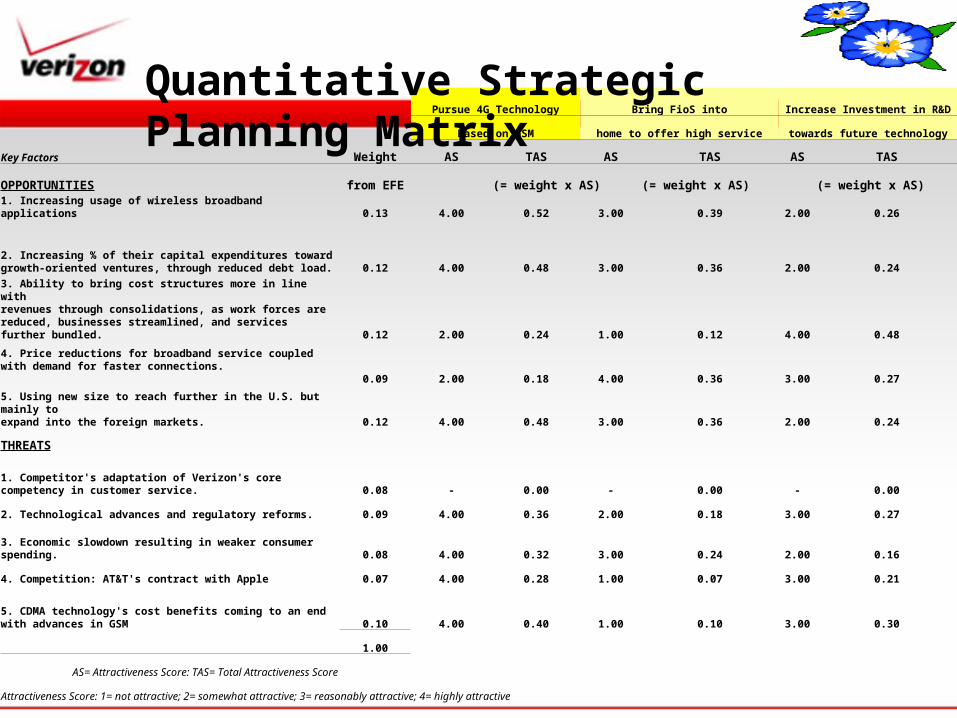
Pursue 4G Technology Bring FioS into Increase Investment in R&D
Based on GSM home to offer high service towards future technology
Key Factors Weight AS TAS AS TAS AS TAS
OPPORTUNITIES from EFE (= weight x AS) (= weight x AS) (= weight x AS)
1. Increasing usage of wireless broadband applications 0.13 4.00 0.52 3.00 0.39 2.00 0.26
2. Increasing % of their capital expenditures towardgrowth-oriented ventures, through reduced debt load. 0.12 4.00 0.48 3.00 0.36 2.00 0.24
3. Ability to bring cost structures more in line with revenues through consolidations, as work forces are reduced, businesses streamlined, and services further bundled. 0.12 2.00 0.24 1.00 0.12 4.00 0.48
4. Price reductions for broadband service coupled with demand for faster connections.
0.09 2.00 0.18 4.00 0.36 3.00 0.27
5. Using new size to reach further in the U.S. but mainly to expand into the foreign markets. 0.12 4.00 0.48 3.00 0.36 2.00 0.24
THREATS
1. Competitor's adaptation of Verizon's core competency in customer service. 0.08 - 0.00 - 0.00 - 0.00
2. Technological advances and regulatory reforms. 0.09 4.00 0.36 2.00 0.18 3.00 0.27
3. Economic slowdown resulting in weaker consumer spending. 0.08 4.00 0.32 3.00 0.24 2.00 0.16
4. Competition: AT&T's contract with Apple 0.07 4.00 0.28 1.00 0.07 3.00 0.21
5. CDMA technology's cost benefits coming to an end with advances in GSM 0.10 4.00 0.40 1.00 0.10 3.00 0.30
1.00
AS= Attractiveness Score: TAS= Total Attractiveness Score
Attractiveness Score: 1= not attractive; 2= somewhat attractive; 3= reasonably attractive; 4= highly attractive
Quantitative Strategic Planning Matrix
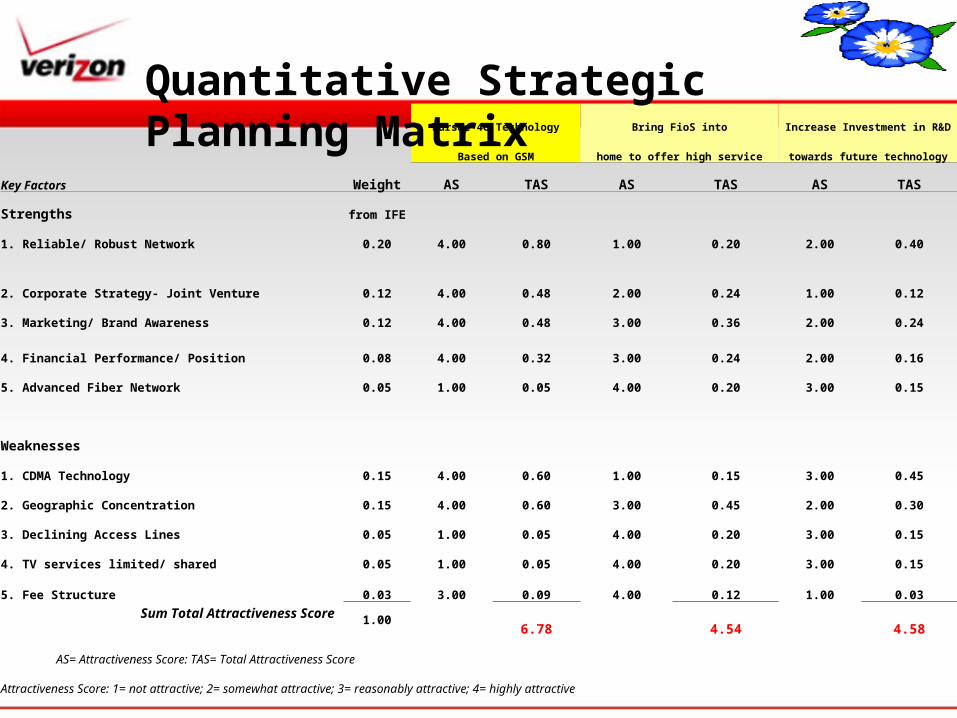
Pursue 4G Technology Bring FioS into Increase Investment in R&D
Based on GSM home to offer high service towards future technology
Key Factors Weight AS TAS AS TAS AS TAS
Strengths from IFE
1. Reliable/ Robust Network 0.20 4.00 0.80 1.00 0.20 2.00 0.40
2. Corporate Strategy- Joint Venture 0.12 4.00 0.48 2.00 0.24 1.00 0.12
3. Marketing/ Brand Awareness 0.12 4.00 0.48 3.00 0.36 2.00 0.24
4. Financial Performance/ Position 0.08 4.00 0.32 3.00 0.24 2.00 0.16
5. Advanced Fiber Network 0.05 1.00 0.05 4.00 0.20 3.00 0.15
Weaknesses
1. CDMA Technology 0.15 4.00 0.60 1.00 0.15 3.00 0.45
2. Geographic Concentration 0.15 4.00 0.60 3.00 0.45 2.00 0.30
3. Declining Access Lines 0.05 1.00 0.05 4.00 0.20 3.00 0.15
4. TV services limited/ shared 0.05 1.00 0.05 4.00 0.20 3.00 0.15
5. Fee Structure 0.03 3.00 0.09 4.00 0.12 1.00 0.03
Sum Total Attractiveness Score 1.006.78 4.54 4.58
AS= Attractiveness Score: TAS= Total Attractiveness ScoreAttractiveness Score: 1= not attractive; 2= somewhat attractive; 3= reasonably attractive; 4= highly attractive
Quantitative Strategic Planning Matrix
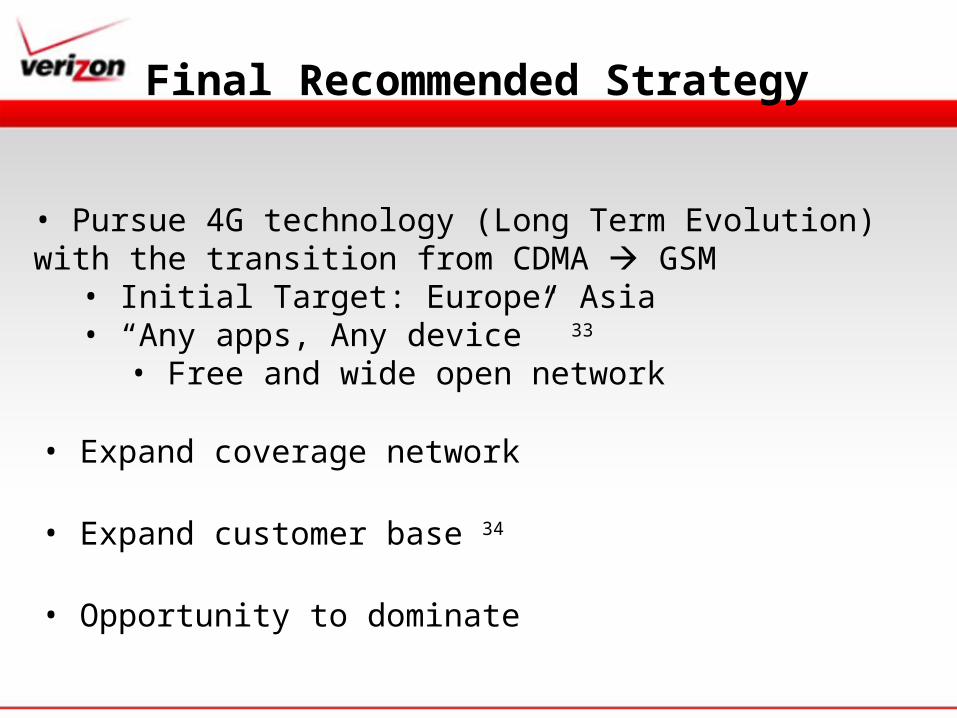
• Pursue 4G technology (Long Term Evolution) with the transition from CDMA GSM
• Initial Target: Europe/ Asia• “Any apps, Any device” 33
• Free and wide open network
• Expand coverage network
• Expand customer base 34
• Opportunity to dominate
Final Recommended Strategy
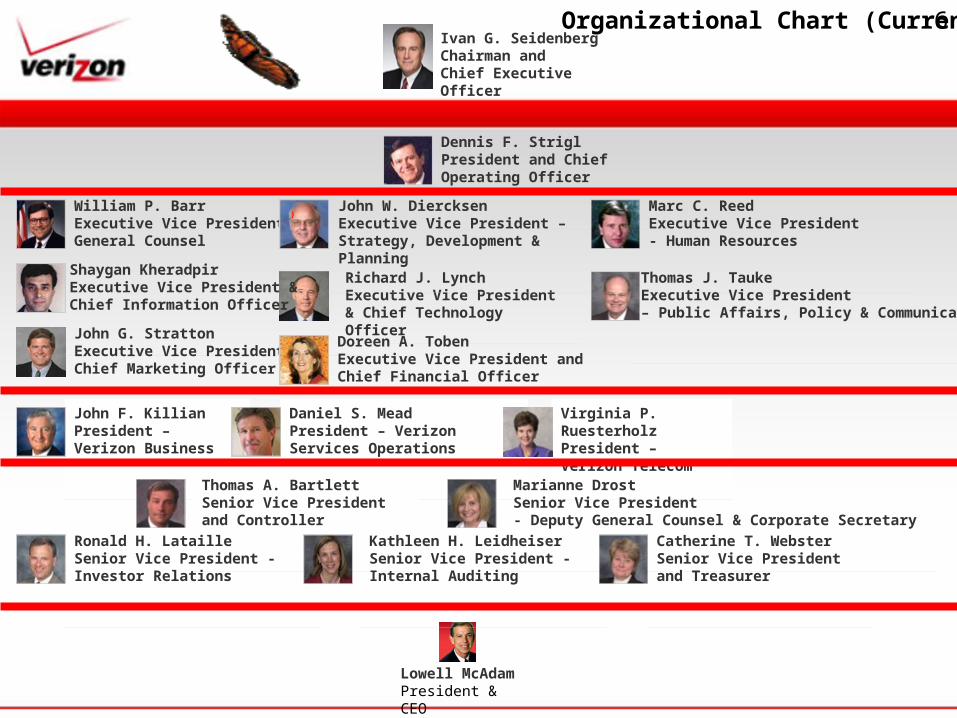
Lowell McAdamPresident & CEO
Richard J. Lynch Executive Vice President & Chief Technology Officer
Ivan G. SeidenbergChairman and Chief Executive Officer
Dennis F. StriglPresident and Chief Operating Officer
William P. Barr Executive Vice President &General Counsel
John W. Diercksen Executive Vice President – Strategy, Development & Planning
Shaygan Kheradpir Executive Vice President &Chief Information Officer
Marc C. Reed Executive Vice President - Human Resources
John G. Stratton Executive Vice President &Chief Marketing Officer
Thomas J. Tauke Executive Vice President – Public Affairs, Policy & Communications
Doreen A. Toben Executive Vice President and Chief Financial Officer
John F. Killian President – Verizon Business
Daniel S. Mead President – Verizon Services Operations
Virginia P. Ruesterholz President – Verizon Telecom
Thomas A. Bartlett Senior Vice President and Controller
Marianne Drost Senior Vice President - Deputy General Counsel & Corporate Secretary
Ronald H. Lataille Senior Vice President - Investor Relations
Kathleen H. Leidheiser Senior Vice President - Internal Auditing
Catherine T. Webster Senior Vice President and Treasurer
6Organizational Chart (Current)
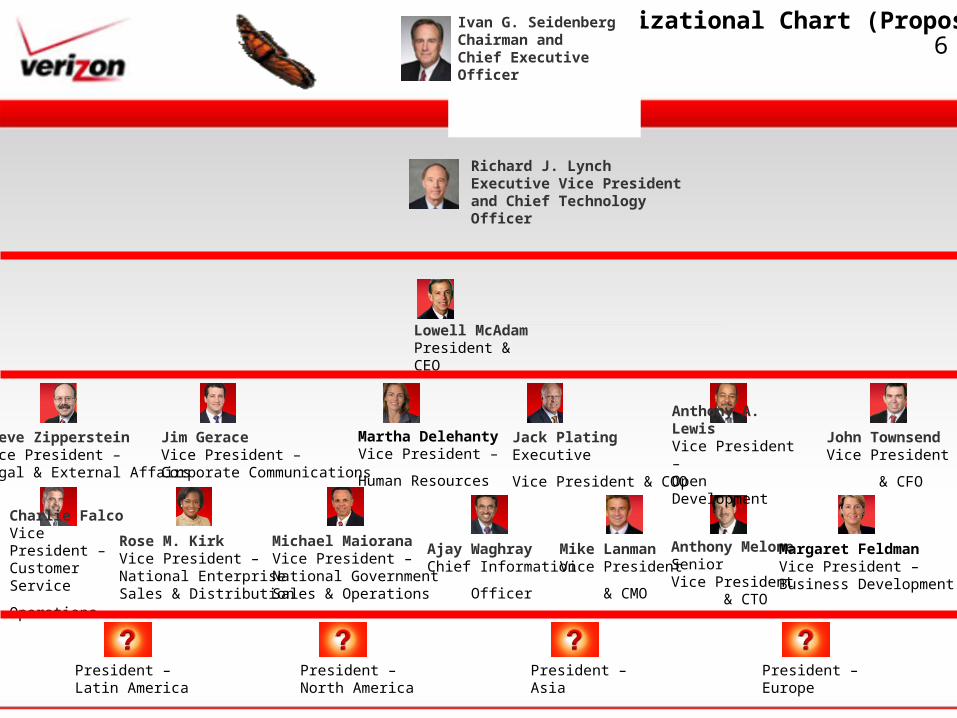
Organizational Chart (Proposed)
Lowell McAdamPresident & CEO
Jack PlatingExecutive
Vice President & COO
John TownsendVice President
& CFO
Anthony MeloneSenior Vice President & CTO
Mike LanmanVice President
& CMO
Ajay WaghrayChief Information
Officer
Steve ZippersteinVice President – Legal & External Affairs
Anthony A. LewisVice President – Open Development
Jim GeraceVice President – Corporate Communications
Martha DelehantyVice President –
Human Resources
Margaret FeldmanVice President – Business Development
Charlie FalcoVice President – Customer Service
Operations
Rose M. KirkVice President – National Enterprise Sales & Distribution
Michael MaioranaVice President – National Government Sales & Operations
President – Latin America
Ivan G. SeidenbergChairman and Chief Executive Officer
President – North America
President – Europe
President – Asia
Richard J. Lynch Executive Vice President and Chief Technology Officer
6
• Employees Own Their Career- Company knows improvement of company & workforce
- Company wants workforce to have careers not just jobs - “Customers like current affair & passion.” - Melissa (customer service supervisor) - Trained to be team spirited. Helped each other & help employees to see & overcome
challenges
• Employee Training - Tools & framework available to resolve any customer problems - Support - Passion & Training
• Place to Grow
• Get Degree Verizon Pay
• Medical / Health Benefits compensation for tuition
• Day care program
Organizational Culture (current)
• Motivational Factors- Company wants to treat their job as a career- Continued support to their employees professional or personally- Aspires to further develop their employees standard- Holds motivational meetings - Holds informal affairs for their employees- “Company wants improvement of company and workforce”- Trains employees to be team-spirited to helped employees to see and overcome challenges.
Organizational Culture (Revised)
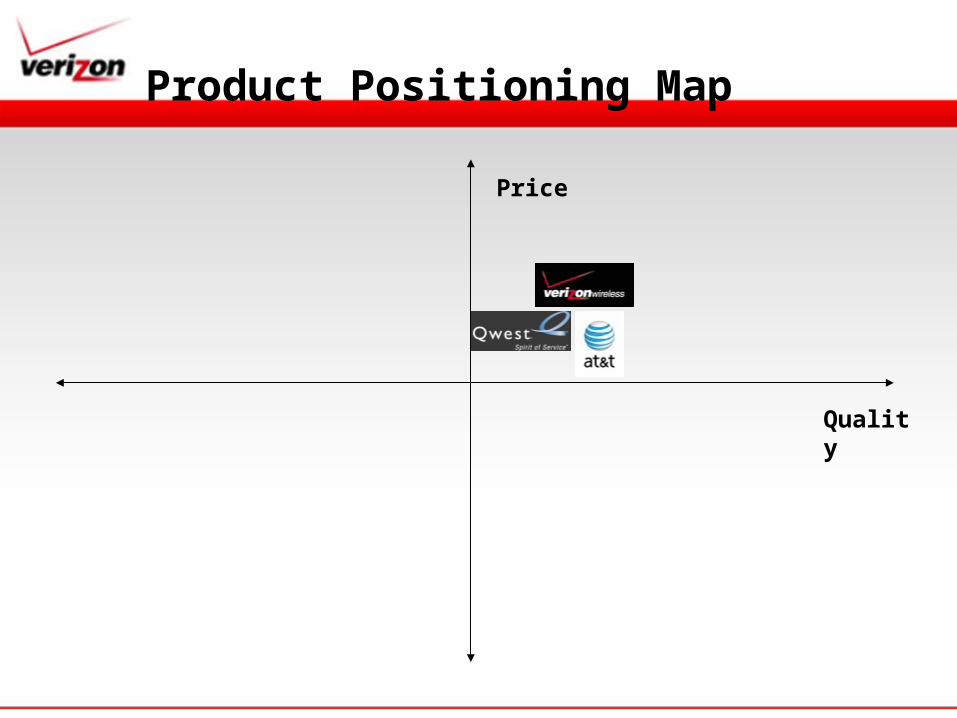
Product Positioning Map
Price
Quality
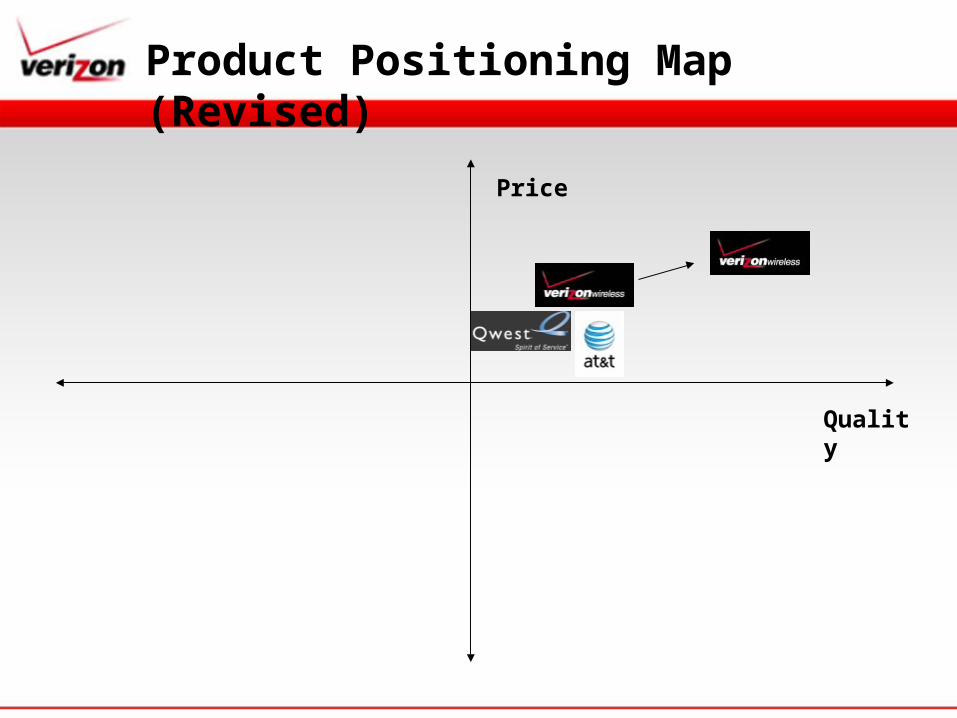
Product Positioning Map (Revised)
Price
Quality
Target Market Description
• Geographic: Mostly U.S.; more prevalent in the North Eastern region of the U.S.
• Age: Male and female, young teens (12-17), college students (18-24), recent college grads (25-30), and families1.
• Ethnicity: Caucasian, Hispanic, African-American, and other non-Hispanic.
• Education: High school diploma and college grads.• Occupation: Students, blue collar and white collar, young and
older professionals, executives, business owners.• User status: Regular user• Usage rate: Medium and Heavy users• Loyalty status: Strong• Attitude towards product: Positive
Target Market
• Current Market Position– Heavily saturated market with a massive user base of over
67.2 million users– They differentiate themselves from others through network
quality and customer service as shown in ads and also slogans: “We never stop working for you” and “Can you hear me now?”2
• Revised Market Position (the above plus)– Integrate marketing divisions in different regional areas to
better focus on the target market in the area.
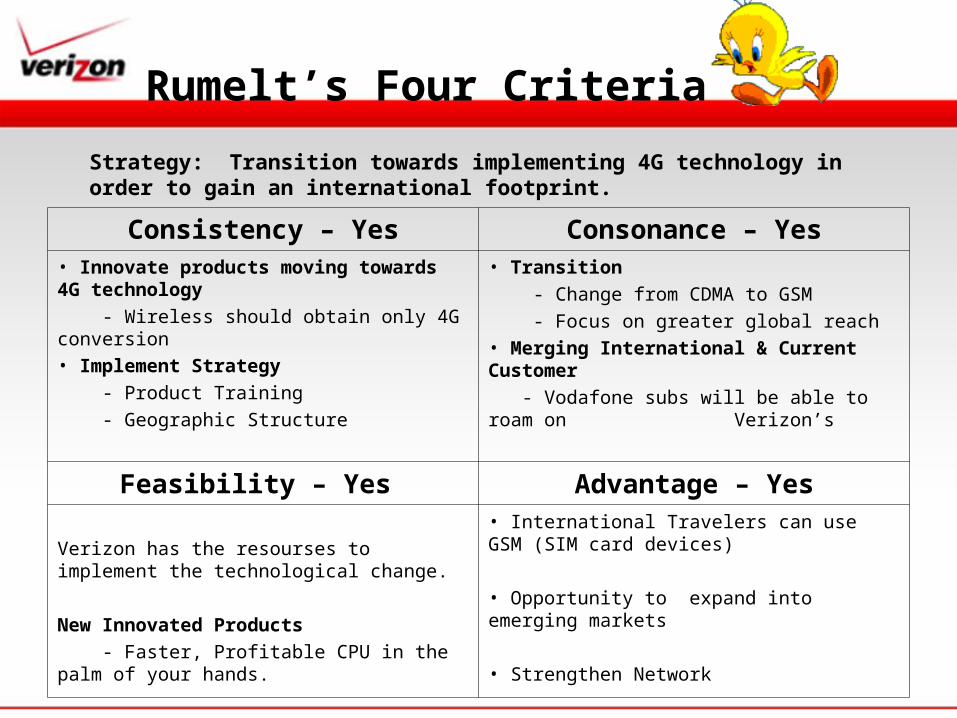
Consistency – Yes Consonance – Yes• Innovate products moving towards 4G technology
- Wireless should obtain only 4G conversion • Implement Strategy
- Product Training
- Geographic Structure
• Transition
- Change from CDMA to GSM
- Focus on greater global reach• Merging International & Current Customer
- Vodafone subs will be able to roam on Verizon’s
Feasibility – Yes Advantage – Yes
Verizon has the resourses to implement the technological change.
New Innovated Products
- Faster, Profitable CPU in the palm of your hands.
• International Travelers can use GSM (SIM card devices)
• Opportunity to expand into emerging markets
• Strengthen Network
Strategy: Transition towards implementing 4G technology in order to gain an international footprint.
Rumelt’s Four Criteria
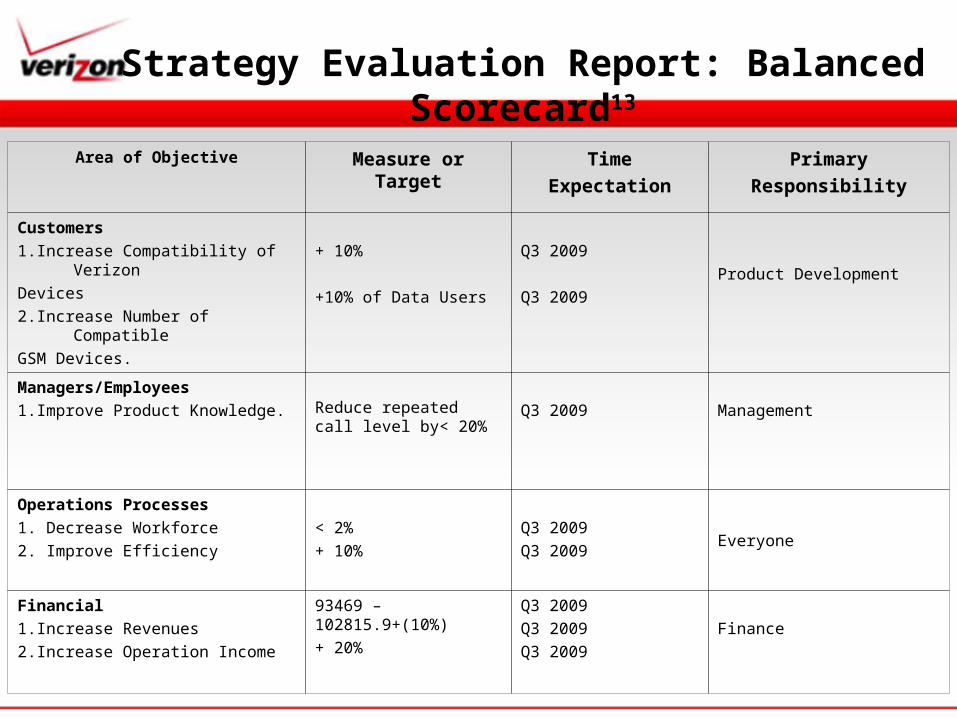
Strategy Evaluation Report: Balanced Scorecard13
Area of Objective Measure or Target Time
Expectation
Primary
Responsibility
Customers
1.Increase Compatibility of Verizon
Devices
2.Increase Number of Compatible
GSM Devices.
+ 10%
+10% of Data Users
Q3 2009
Q3 2009
Product Development
Managers/Employees
1.Improve Product Knowledge. Reduce repeated call level by< 20%
Q3 2009 Management
Operations Processes
1. Decrease Workforce
2. Improve Efficiency
< 2%
+ 10%
Q3 2009
Q3 2009Everyone
Financial
1.Increase Revenues
2.Increase Operation Income
93469 – 102815.9+(10%)
+ 20%
Q3 2009
Q3 2009
Q3 2009
Finance
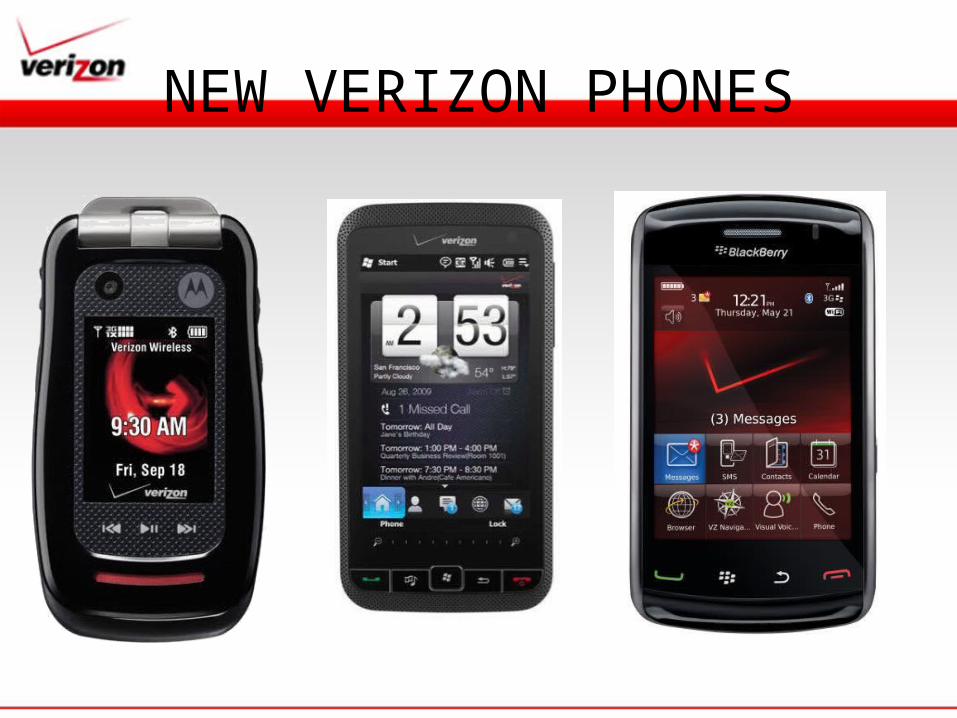
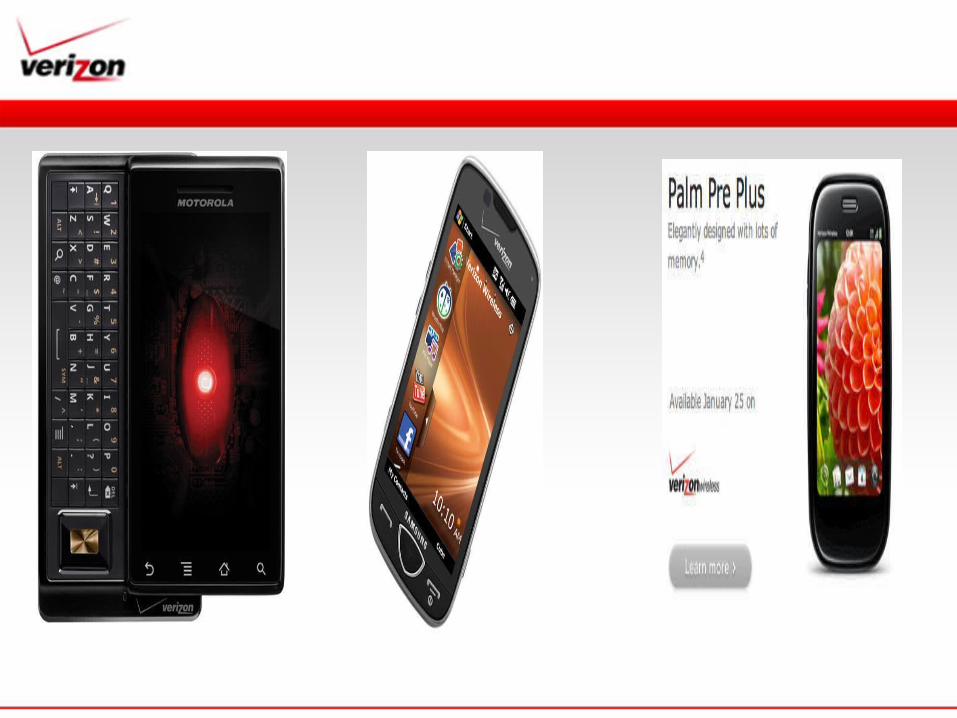
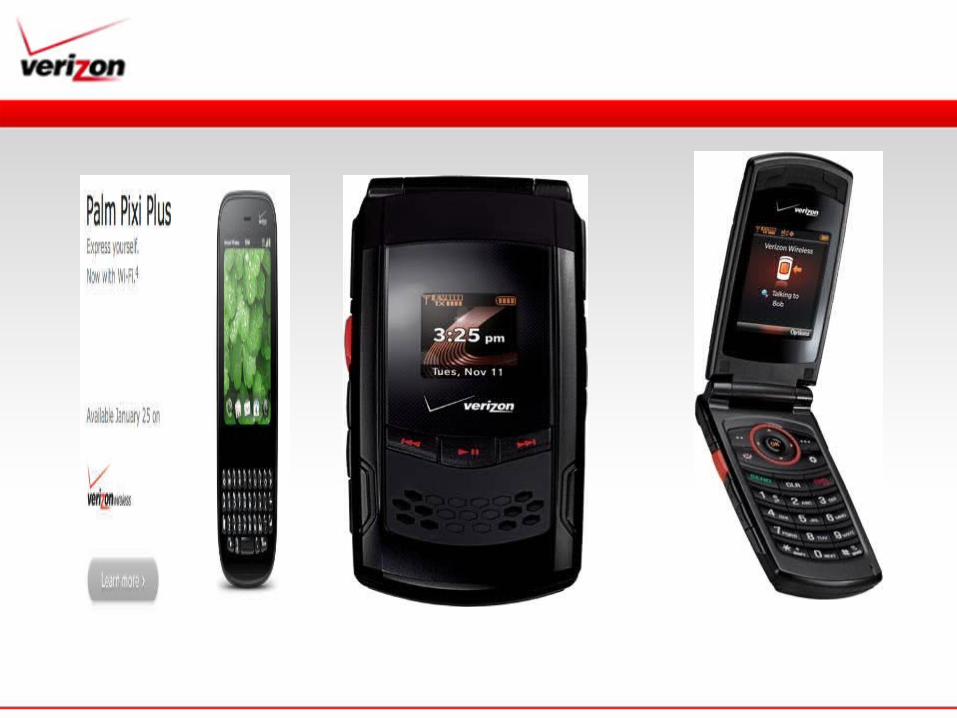
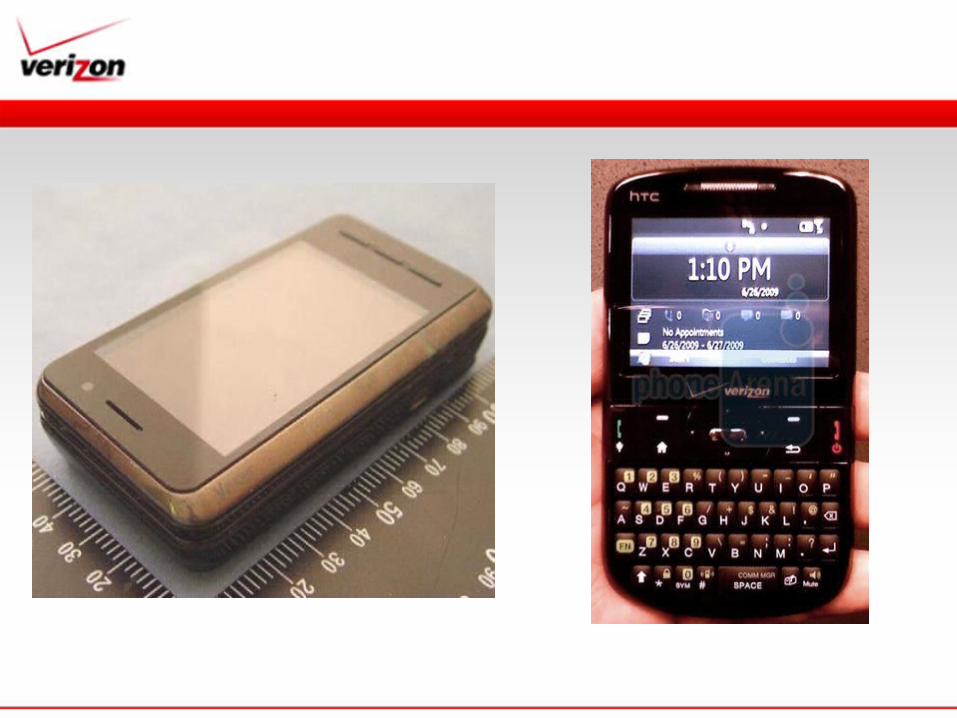
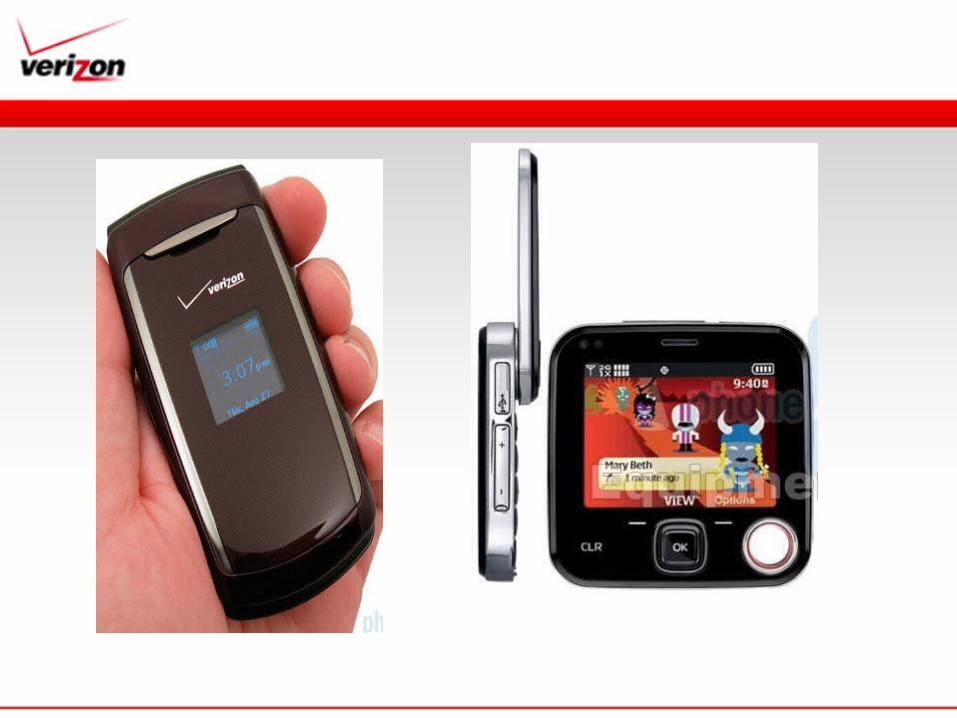
NEW VERIZON PHONES