Embed Size (px)
Citation preview

Information Sciences 181 (2011) 1517–1537
Contents lists available at ScienceDirect
Information Sciences
journal homepage: www.elsevier .com/locate / ins
Semantic Web Technologies for supporting learning assessment
Dagoberto Castellanos-Nieves a, Jesualdo Tomás Fernández-Breis a,⇑, Rafael Valencia-García a,Rodrigo Martínez-Béjar b, Miguela Iniesta-Moreno c
a Departamento de Informática y Sistemas, Universidad de Murcia, CP 30100, Spainb Departamento de Ingeniería de la Información las Comunicaciones, Universidad de Murcia, CP 30100, Spainc Departamento de Estadística e Investigación Operativa, Universidad de Murcia, CP 30100, Spain
a r t i c l e i n f o
Article history:Received 12 July 2010Received in revised form 1 December 2010Accepted 1 January 2011Available online 9 January 2011
Keywords:Computers and educationeLearningSemantic web
0020-0255/$ - see front matter � 2011 Elsevier Incdoi:10.1016/j.ins.2011.01.010
⇑ Corresponding author. Tel.: +34 868884613; faxE-mail addresses: [email protected] (D. Castel
um.es (R. Martínez-Béjar), [email protected] (M. Inie
a b s t r a c t
The use of Semantic Web Technologies in eLearning has become more significant in recentyears. A topic that has received less attention to date is the use of such technologies forsupporting assessment processes. In this paper, an approach that makes use of SemanticWeb Technologies to support the assessment of open questions in eLearning courses isdescribed. This methodology combines domain ontologies, semantic annotations andsemantic similarity measurements. It also incorporates an algorithm for extracting knowl-edge from students’ answers. It has been applied in different courses and the results arealso reported and discussed. In our approach, the behaviour of the algorithm for calculatingthe referred semantic similarity is defined by the teacher.
� 2011 Elsevier Inc. All rights reserved.
1. Introduction
Assessment, that is, the evaluation of the knowledge or skills of the students, is a basic activity in both conventional edu-cation and eLearning. This is usually done by giving students tests, which can contain different types of exercises such asopen questions, closed questions, puzzles, matching and so on. Each exercise tries to evaluate different levels of the students’ability. In [11], a six-level taxonomy of intellectual behaviour is identified: evaluation, synthesis, analysis, application, under-standing and knowledge. The cognitive memory or recognition of facts is the lowest level, whereas evaluation, the highestone, requires more abstract and complex problem solving ability. The mentioned taxonomy allows teachers to classify theabstraction levels of the questions and exercises used for assessing students’ work. This classification has been revised sev-eral times (see for instance [4,6]), and it is not unique in the literature (see for instance [25]).
Different authors agree on the statement that the higher levels of Bloom’s taxonomy can only be evaluated through openquestions [9,40,42,48]. These questions are not difficult to design for teachers, although their manual evaluation is difficultand sometimes based on superficial properties of the answer, such as the presence of important terms. In this case, the eval-uator may be easily deceived if the students write generalities and nonsense content including the terms the evaluator islooking for. For an appropriate evaluation process, the answers must be carefully read, looking for clarity and logic. More-over, this task becomes exhausting if the evaluator has to mark a large amount of exams. Nevertheless, the assessment ofopen questions without human participation is a serious issue given the need for evaluating a natural language text. Also,it requires the development of new methodologies for supporting such processes.
On the technological side, the Semantic Web aims at adding semantic information to web contents in order to create anenvironment in which software agents will be capable of doing tasks efficiently [8]. The Semantic Web proposes the idea that
. All rights reserved.
: +34 868884151.lanos-Nieves), [email protected] (J.T. Fernández-Breis), [email protected] (R. Valencia-García), rodrigo@sta-Moreno).
1518 D. Castellanos-Nieves et al. / Information Sciences 181 (2011) 1517–1537
web contents are defined and linked not only for visualization but for being used by applications. This would make theSemantic Web a promising technology to implement eLearning systems. Furthermore, [54] showed that the SemanticWeb meets the basic eLearning requirements: quickness, just-in-time and pertinent learning. The appropriateness of Seman-tic Web Technologies for developing eLearning systems is also supported by the research efforts done in the last years fromdifferent perspectives (see, for instance, [21,17,10]). A number of technologies are needed for the success of the SemanticWeb, among which the ontology is the main one. In literature, multiple definitions for ontology can be found (see for in-stance [27,30]). Ontologies define common, shareable and reusable views of a domain, and they give meaning to informationstructures that are exchanged by information systems [13]. The process of adding semantic metadata to web resources iscommonly known as semantic annotation.
The objective of this work is to describe the development of an approach based on Semantic Web Technologies to supportthe assessment of open questions. In this context, we identify the following potential beneficial uses of Semantic WebTechnologies:
1. Ontologies can provide the precise semantic specification of the domain; in this case, the knowledge the students mustacquire through the course.
2. Semantic annotations can be used for getting a precise semantic specification of the questions and the answers. This alsofacilitates the reuse of questions in different exams and the sharing of questions and knowledge among teachers inSemantic Web environments.
3. Objective marks can be obtained by an automatic processing of the semantic annotations, thus limiting the impact ofhuman-related factors.
4. Automatic feedback processes can be developed by combining course ontologies and semantic annotations. The availabil-ity of semantically annotated learning materials would allow teachers to include the appropriate reinforcement learningcontents in the feedback.
In this work, the first three items are included in our approach, whereas the technological infrastructure described in thispaper will be ready to incorporate the fourth one in the near future. It should be noted that our approach aims to assess theexplicit knowledge of the students, not the tacit one. Knowledge is represented in the approach by using ontologies, and thisallows to support the development of semantic feedback mechanisms and the extraction of knowledge from natural lan-guage texts. The ontologies will include the knowledge the students have to acquire in a particular course. The assessmentof the course is done by giving students tests. Each test will have some open questions associated. Each open question has aparticular a set of semantic annotations associated, which are the parts of the course ontology that the students should haveacquired to answer it correctly. Semantic annotations are also associated to students’ answers in natural language, and thispart of the process is semiautomatic and supported by natural language processing techniques. The mark will then be pro-portional to the semantic similarity of both sets of annotations. In our approach, the marking policy and the behaviour of thealgorithm for calculating the mentioned semantic similarity are defined by the teacher. The strictness of the marking policyis determined by a threshold, which is defined by the teacher and establishes how similar the student’s answer and theexpected response must be for the student to get points in an exercise. This approach aims to contribute to improve theefficiency of assessment processes and free teachers from time-consuming and repetitive tasks.
We have also developed a tool that implements our approach and that has been used and validated in real courses in botheLearning and blended learning. The implementation of the semantic issues in the tool has been done using the Web Ontol-ogy Language (OWL) (http://www.w3.org/TR/owl-ref/), which is the current recommendation of the W3C for the exchange ofsemantic content.
The structure of this paper is as follows. First, some related work on eLearning Assessment and the relation between theSemantic Web and eLearning is provided in Section 2. Next, the approach for assessing open question-based exams is ex-plained in Section 3. The software platform is then described in Section 4. The results of the application of our method inreal courses are shown in Section 5. Finally, the discussion and some conclusions are put forward in Section 6.
2. Background
In this work, an approach for supporting the assessment of open questions in eLearning environments is presented. In thissection we explain how assessment has been addressed in eLearning in recent years and how Semantic Web Technologieshave been used in eLearning solutions will be discussed.
2.1. Assessment in eLearning
Different techniques have traditionally been applied to the assessment of open questions. In particular, knowledge rep-resentation techniques such as semantic networks or lexical conceptual structures (see for instance [18,47,58]) can be found.In recent years, Topic Maps [39] have been widely used for conceptualizing domains in educational settings. Topic maps canrepresent information by using topics, associations (which represent the relationships between them), and occurrences.They are thus similar to semantic networks and to both concept and mind maps in many aspects. However, their knowledge

D. Castellanos-Nieves et al. / Information Sciences 181 (2011) 1517–1537 1519
is not formalized and requires the definition of the topic map ontology. Non semantic approaches can also be found in theliterature [15]. For instance, fuzzy sets have also been used for evaluating performance in eLearning settings (see for instance[56]). In [46], the performance of the students is assessed through an optimization model based on analyzing multiple fuzzyopinions. Generally speaking, these techniques require some previous training, so the assessment of a collection of exams isrequired. Therefore, they are not suitable for generating useful feedback. In addition to this, such techniques require specificcorpora and, for this reason, they cannot be easily reused in different domains.
There are also techniques based on statistics, information retrieval and natural language processing according to the clas-sification done in [43]. The statistical approach does not get good results if it is only based on keywords. They usually haveproblems when dealing with synonymy, polisemy, and lexical variability. The automatic analysis of natural language texts isan open research area and the current state-of-the-art does provide techniques to carry out a complete semantic analysisautomatically. Information retrieval techniques combine both of the above mentioned approaches, but they also requiresome lexical resources and corpora for training the techniques.
Systems for computer-supported students’ assessment can also be found. In [20], a learning and assessment system basedon the creation of course hyperbooks by groups of students is presented. Each group creates a hyperbook from a courseontology manually. Then, the hyperbooks are compared and discussed collaboratively. Consequently, the students arerequired to have some skills in ontologies. On the other hand, the Atenea platform (see for instance [1]) combines naturallanguage processing and statistical techniques to process student’s natural language answers. In [26], a visual tool forgrading students that can be used by the teacher to manage the process is described. However, this tool aims at supportingthe visualization of grades rather than the proper assessment process. In [16], an automatic tool for advising in schoolalgebra is presented. In [59], the authors use course ontologies to specify the structure of the course contents and forgenerating the board structure for the Q/A process and classifying the e-documents read by the students. Such course ontologiesare described by using three main types of relations, that is, is-a, component-of, and part-of. A method for the intelligentassessment of summaries is provided in [29]. This approach is based on latent semantics techniques for analyzing boththe student’s and reference answers. An approach based on DL reasoning, ontologies and Model-Driven Architectures isproposed for the intelligent assessment in [50]. Finally, our group has already used ontologies for supporting the assessmentof individuals in group work [22].
2.2. Semantic Web and eLearning
Semantic Web and ontologies have been used in eLearning in different ways. On the one hand, an ontology can be seen asa semantic model containing concepts, their properties, interconceptual relations, and axioms related to the previous ele-ments. In practical settings, ontologies have become widely used because they are reusable and shareable (see for instance[12,23,14,52]). Ontologies can describe learning domains from different perspectives, allowing for a richer description andretrieval of learning contents. Besides, they facilitate the access to the contents preferred by a person. Semantic eLearningfacilitates obtaining easy-to-exchange learning contents, allowing for customizable learning. On the other hand, semanticannotations are metadata associated to particular information items, expressed in terms defined by an ontology. Such anno-tations can be used for a semantic enrichment of information, e.g., to facilitate its retrieval [5].
On the eLearning side, some standards and recommendations clarify the relation and need for Semantic Web-basedapproaches. On the one hand, the Learning Object Metadata (LOM) standard recommends the annotation and classificationof learning objects by using metadata to facilitate their retrieval. On the other hand, the IMS LD specification, whichdescribes the learning process that takes place in learning units, is currently described by an ontology [3]. Some ontologieshave been built for eLearning domains: learning contents of technical documents [35], interactions between students andthe learning systems in collaborative environments [31], specification of learning tasks [45], learning objects and group work[32], etc. In [7], an ontology is used as the metamodel for representing the basic concepts related to collaborative learningand the relations and dependencies among collaborative scenarios. More recently, Semantic Web Technologies such asontologies and semantic annotations have been mainly used in eLearning for the design, preparation, and classification ofcourse materials (see for instance [37,28,57,17,36]).
In this work, we will use ontologies to model the course knowledge and semantic annotations to classify the exams’ ques-tions and answers regarding that ontology. There are currently different ontology languages such as OWL, OBO (http://www.obofoundry.org/) or DAML (http://www.daml.org/). Our assessment approach can be applied by using any of theseontology languages, because all of them manage the notions of concepts, relations and attributes. The difference wouldbe the implementation into a concrete software platform.
Finally, mechanisms for calculating the semantic similarity between ontological elements are needed. In literature, dif-ferent similarity measurement approaches can be found (see for instance [51,38,53,19,2]). These approaches share somemodeling principles, because the semantic similarity is calculated as the combination of different factors, which take intoaccount the following issues:
� Linguistic similarity: The similarity between the terms associated to the ontological elements. It can be calculated byusing a string-based calculation or by means of linguistic resources, such as Wordnet [41].� Taxonomic: The distance among ontological elements in the ontology through taxonomic links [33].� Properties: The similarity of the set of properties associated to the ontological elements.

1520 D. Castellanos-Nieves et al. / Information Sciences 181 (2011) 1517–1537
Such approaches are interesting to use and useful for our objectives because: (1) they are accepted by the community forcomputing semantic similarity; (2) they follow general similarity principles which make them easy to use and understand;(3) they manage the semantic elements of interest for our assessment approach; and (4) they have a number of parametersthat can be used by teachers to adjust the assessment process. However, these approaches are focused on the comparison ofconcepts. Consequently, in this work we will extend those approaches by providing functions to calculate the semantic sim-ilarity between ontological relations and attributes.
3. The assessment approach
The assessment approach presented in this work includes the following steps: (1) design of assessment questions; (2)processing of the students’ answers to the assessment questions; and (3) automatic marking of the students’ answers to suchquestions. The approach assumes the existence of a course ontology which models all the relevant course content. Such anontology is the knowledge reference for annotating questions and answers, therefore providing the context for the markingprocess. This ontology models the course knowledge that has to be learned by the students. The three phases of the approachare described next.
3.1. Design of assessment questions
This approach allows for working with both closed and open questions, which are designed and created by a teacher. Inthis subsection, the definitions for open and closed questions, as well for the annotations that can be associated to such ques-tions, are provided.
Definition 1 (Closed question). A closed question, written closed_question, is one with a set of possible answers, amongwhich one is correct. Hence, semantics is not needed to mark them. A closed question can be defined as follows:
closed�question ¼< description; fanswerig; expected�answer;value >;
where description is the name of the question; {answeri} is the set of possible answers, where i = 1 . . .n; expected_answer �{answeri} is the correct answer; and value is the number of units given to the student in case of success.
Definition 2 (Open question). An open question, written open_question, is a question with an answer in natural language, sothe correction requires some processing and the question has to be semantically annotated. An open question can be definedas follows:
open�question :< desc; expected�answer; fopen�question�annotig;value >;
where desc is the name of the question; expected_answer is optional, and it contains the correct answer to the question innatural language; open�question�annoti is the set of semantic annotations defined for such open question; and finally, markis the number of units given to the student in case of success.
Definition 3 (Open Question Annotation). The expected response to an open question is created by the teacher, and thisexpected response must be annotated with regard to the course ontology. For this purpose, each open question has a setof annotations associated (concepts, relations, attributes and values), written open_question_annot, which can be of the fol-lowing types:
1. Concepts, which represent the main domain entities (e.g., student);2. Attributes, which represent properties of concepts (e.g., the login of a student);3. Relations, which establish semantic links between two concepts (e.g., a student takes a course).
Such annotation types have been modeled through an annotation ontology. It should be noted that the annotationproperties of a particular ontological category for a question annotation differ from those associated to an answerannotation. An open question annotation can be then defined as follows:
open�question�annotðQAÞ :< entity�annot; quantitative�value >;
where entity_annot represents the annotation for the knowledge entity in the course ontology; and quantitative�value is thequestion quantitative score associated to the question.
The quantitative�value stands for the importance of the knowledge entity in the context of the individual question. Entityannotations are differently defined for concepts, attributes, and relations. The annotations of a question must belong to thecourse ontology, and they are the entities that the students must answer to have the question marked as correct. In order tograde such mark, the teacher has to provide quantitative and qualitative values to each annotated entity, which will accountfor its importance in the answer.

D. Castellanos-Nieves et al. / Information Sciences 181 (2011) 1517–1537 1521
Definition 4 (Exam). An exam is an assessment test, which is structured as a set of open and closed questions. An exam canbe defined as follows:
examðEÞ : f< questioni;valuei >g;
where question is an open or closed question; and value is the quantitative value of the question in the exam.
Definition 5 (Exam answer). The exam answer, written exam_answer, is the set or pairs formed by an exam question and theanswer to such question. Exam questions can be open or closed, so there are two types of answers, one for open questions,and one for the closed ones. Both types of question_answers are defined next. Then, an exam answer can be defined asfollows:
exam�answer : f< exam�questioni; question�answeri >g;
Definition 6 (Closed Question Answer). A closed question answer, written closed_question_answer, is the type of ques-tion_answer associated to closed questions, and it is comprised of the choice selected by the students. A closed questionanswer can be defined as follows:
closed�question�answer :< choice >;
where choice is the option chosen among the available ones.
Definition 7 (Open Question Answer). An open question answer, written open_question_answer, is the type ofquestion_answer associated to open questions, and it consists of the linguistics answer and the semantic annotations. Anopen question answer can be defined as follows:
open�question�answer : f< text�answer; fanswer�annotig >g;
where text�answer is the answer of the student in natural language; and answer�annotationi is the set of semantic annota-tions obtained from the textual answer, which are defined next.
Definition 8 (Answer Annotation). An answer annotation, written answer_annot, is a semantic annotation defined for a partof the textual answer given by a student for a particular question. Each annotation refers to a knowledge item of theontology.
answer�annot :< entity�annot; ling�expr >;
where entity�annot is defined as for Question_Annotation; and ling�expr represents the text of the answer associated to theknowledge entity.
3.2. Processing the students’ answers
In this section, the processing of the students’ answers to open questions is addressed, and we will describe how the an-swer annotations are generated. As shown in Definitions 7 and 8, an answer to an open question is defined by the text innatural language and a set of semantic annotations. Each annotation is the pair comprising one entity of the course ontologyand one linguistic expression. The latter is the part of the natural language answer in which that entity has been identified.
Such annotations can be manually obtained, but in our approach this process can be realized in (semi) automatic manner.For this purpose, an algorithm for semi-automatic detection of ontological elements using Natural Language ProcessingTechnologies (NLP) has been used. This algorithm is based on the work presented in [55], and it is an incremental knowledgeacquisition algorithm, consisting of three sequential phases: Preparation; Search; and Set in a context (see Fig. 1).
The Preparation phase has four sequential steps: (1) spell checking, to verify and correct the word spelling in the text; (2)sentence detection, to split the text fragment into sentences; (3) tokenization, to split the sentences into tokens; and (4) POSTagging, to obtain the grammar category of each word in the text fragment (see Fig. 2).
The search phase identifies linguistic expressions representing ontological elements such as concept, attribute, value orrelation. Knowledge bases and stemming algorithms are used to detect the candidate linguistic expressions. Stemming algo-rithms are applied to find in the knowledge base words similar to the remaining of the non-analyzed words in the text frag-ment (current words). If the algorithm cannot find good options, new knowledge can be manually associated to theexpression. Then, the correctly recognized associations between the linguistic expressions and the knowledge entities arestored. The current words are always single constituents in a text fragment. However, knowledge base expressions can con-tain multiple words. Due to the incremental nature of this algorithm, the time spent by teachers marking exams decreaseswith the growth of the knowledge base. This may contain different linguistic expressions associated to the same knowledgeentity (synonymy) and the same linguistic expression associated to different knowledge entities (ambiguity).

Fig. 1. The incremental algorithm for extracting knowledge from text. This algorithm has three main sequential phases: preparation, search and set in acontext.
Fig. 2. The preparation phase. It has four sequential steps: spell checking, sentence detection, tokenization, and POS tagging.
Table 1Grammar patterns. The grammar patterns are defined by regular expressions which describe how sentences can be structured.
Grammar pattern Relation Example
Noun ‘‘of’’ ‘‘the’’ Noun The first Noun is a property of the second one The colour of the carAdjective Noun The first word is a property of the second one Tall boyNoun (’’,’’ Noun)* (’’and’’ Noun)? Prep (Det)? Noun The first nouns are properties of the last one The size and colour of clothes
1522 D. Castellanos-Nieves et al. / Information Sciences 181 (2011) 1517–1537
Once the search phase has been performed, a list of associated knowledge expressions is generated. In case only conceptsare suggested, then there is no need for the next step. Otherwise, the concepts associated to that knowledge entity (i.e., attri-bute, value, relation) have to be identified. The set in a context phase uses grammar patterns, which are language-dependent.Grammar patterns use the grammar category of the words to establish their relation. Consequently, relations betweenknowledge entities can be suggested (see some examples for English in Table 1). In this phase, the grammar patterns andthe other knowledge entities in the text fragment are used to solve ambiguity.
Let us suppose that the knowledge base is the one shown in Table 2, that the sentence ‘‘this includes aspects such as sim-plicity, clearness, originality, interactivity, adaptability, and usability of the use interface’’ is being processed, and that thesearch phase has identified the following entities:
� Concept: user interface� Attribute: simplicity, clarity, originality, interactivity, usability.
The word ‘‘clearness’’ is associated with the attribute ‘‘simplicity’’ in the knowledge base, so the linguistic expression‘‘clearness’’ is associated with the attribute ‘‘clarity’’. According to the algorithm, there is a need for obtaining the conceptsassociated with the attributes and the relations. For this purpose, grammar patterns are used. If the current expression isassociated with a relation, the algorithm searches for two concepts, one on the left and another on the right hand-side ofthe current expression. If an attribute is found, the searching process for a related concept is the same as the one describedabove to provide a context for attributes.
In our example, the application of the pattern Noun (‘‘,’’ Noun)* (‘‘and’’Noun)? Prep (Det)? Noun Noun (see Table 1), returnssimplicity_NOUN, clarity_NOUN, originality_NOUN, interactivity_NOUN, adaptability_NOUN, and usability_NOUN of_PREP
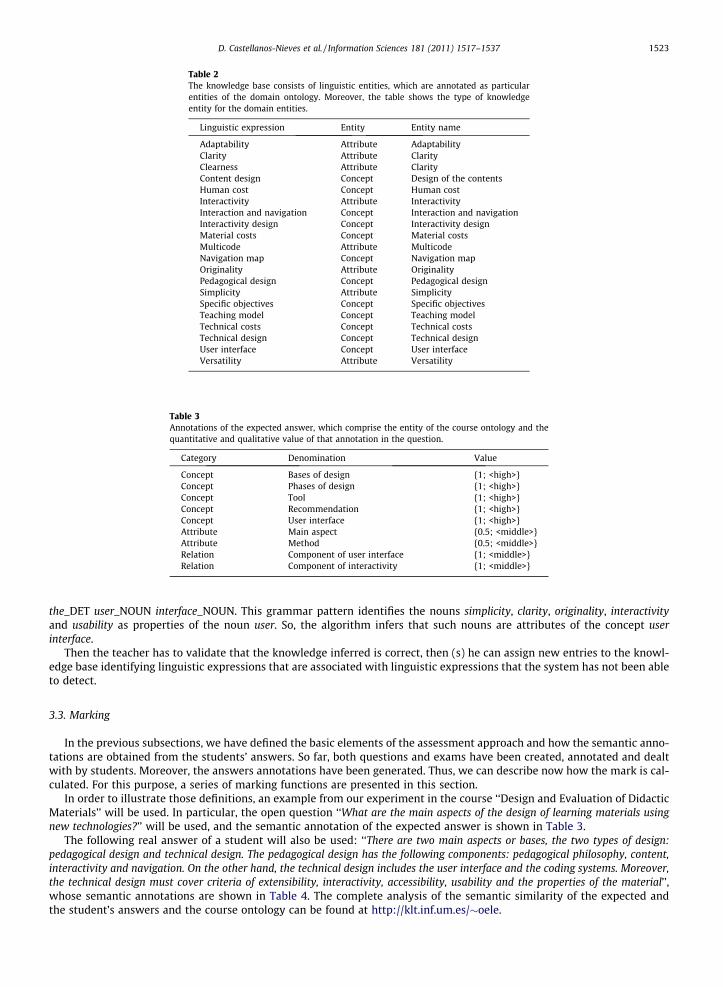
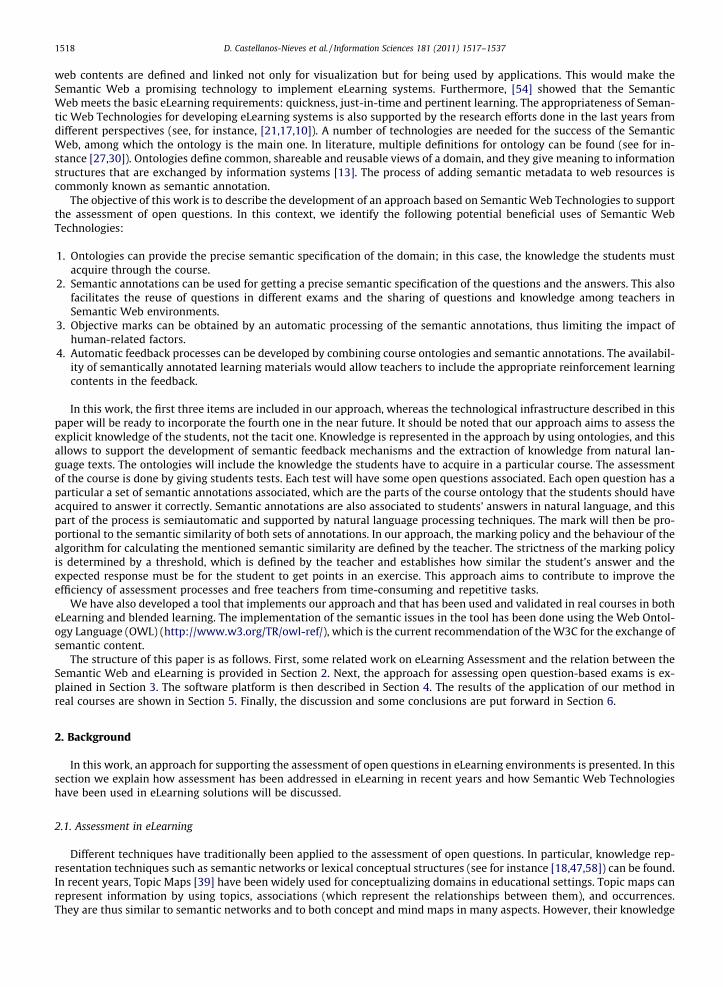
Table 2The knowledge base consists of linguistic entities, which are annotated as particularentities of the domain ontology. Moreover, the table shows the type of knowledgeentity for the domain entities.
Linguistic expression Entity Entity name
Adaptability Attribute AdaptabilityClarity Attribute ClarityClearness Attribute ClarityContent design Concept Design of the contentsHuman cost Concept Human costInteractivity Attribute InteractivityInteraction and navigation Concept Interaction and navigationInteractivity design Concept Interactivity designMaterial costs Concept Material costsMulticode Attribute MulticodeNavigation map Concept Navigation mapOriginality Attribute OriginalityPedagogical design Concept Pedagogical designSimplicity Attribute SimplicitySpecific objectives Concept Specific objectivesTeaching model Concept Teaching modelTechnical costs Concept Technical costsTechnical design Concept Technical designUser interface Concept User interfaceVersatility Attribute Versatility
Table 3Annotations of the expected answer, which comprise the entity of the course ontology and thequantitative and qualitative value of that annotation in the question.
Category Denomination Value
Concept Bases of design {1; <high>}Concept Phases of design {1; <high>}Concept Tool {1; <high>}Concept Recommendation {1; <high>}Concept User interface {1; <high>}Attribute Main aspect {0.5; <middle>}Attribute Method {0.5; <middle>}Relation Component of user interface {1; <middle>}Relation Component of interactivity {1; <middle>}
D. Castellanos-Nieves et al. / Information Sciences 181 (2011) 1517–1537 1523
the_DET user_NOUN interface_NOUN. This grammar pattern identifies the nouns simplicity, clarity, originality, interactivityand usability as properties of the noun user. So, the algorithm infers that such nouns are attributes of the concept userinterface.
Then the teacher has to validate that the knowledge inferred is correct, then (s) he can assign new entries to the knowl-edge base identifying linguistic expressions that are associated with linguistic expressions that the system has not been ableto detect.
3.3. Marking
In the previous subsections, we have defined the basic elements of the assessment approach and how the semantic anno-tations are obtained from the students’ answers. So far, both questions and exams have been created, annotated and dealtwith by students. Moreover, the answers annotations have been generated. Thus, we can describe now how the mark is cal-culated. For this purpose, a series of marking functions are presented in this section.
In order to illustrate those definitions, an example from our experiment in the course ‘‘Design and Evaluation of DidacticMaterials’’ will be used. In particular, the open question ‘‘What are the main aspects of the design of learning materials usingnew technologies?’’ will be used, and the semantic annotation of the expected answer is shown in Table 3.
The following real answer of a student will also be used: ‘‘There are two main aspects or bases, the two types of design:pedagogical design and technical design. The pedagogical design has the following components: pedagogical philosophy, content,interactivity and navigation. On the other hand, the technical design includes the user interface and the coding systems. Moreover,the technical design must cover criteria of extensibility, interactivity, accessibility, usability and the properties of the material’’,whose semantic annotations are shown in Table 4. The complete analysis of the semantic similarity of the expected andthe student’s answers and the course ontology can be found at http://klt.inf.um.es/�oele.

Table 4Annotations of the student’s answer. Each annotation refers to one knowledge entity fromthe course ontology.
Category Description
Concept {Bases of design}Concept {Pedagogical design}Concept {Flexibility}Concept {User interface}Concept {Material}Concept � � �Concept {Context of use}Concept {Coding system}Concept {Content Design}Concept {Tool}Relation {Pedagogical design is a Base of Design}Relation {Technical design is a Base of Design}Relation {Pedagogical design component of Content Design}Relation . . .
Relation {Pedagogical design is a Base of Technical Design}Relation {Pedagogical design component of Navigation}Attribute {Impact of use}Attribute {Method}Attribute {Clarity}Attribute {Cost}
1524 D. Castellanos-Nieves et al. / Information Sciences 181 (2011) 1517–1537
In our approach, exams are marked on a question-by-question basis. Our intention was to define a flexible marking ap-proach, which can be customized in different ways. Therefore, different evaluation policies might be applied. On the otherhand, our approach compares the two sets of semantic annotations by comparing the ontological entities of the same cat-egory, that is, concept-concept, relation-relation, and attribute-attribute.
Next, the functions for measuring such similarities between concepts, attributes and relations are described. Each indi-vidual similarity function has been designed to return a value in [0,1].
3.3.1. ConceptsThe similarity between concepts belonging to the annotated student answer and to the expected one is evaluated
through the function (1). Let us show an example of this function for the concepts ‘‘phase of design’’, c1, and ‘‘pedagogicdesign’’, c2.
The conceptual similarity is calculated as the weighted average of three factors: the proximity of the concepts in the tax-onomic structure of the ontology (concProx), the linguistic similarity of the terms associated with the concepts (eqName) andthe similarity of the set of properties associated with the concepts (propSim). The coefficients cp1, cp2 and cp3 weight theimportance of each factor in the global score. In this way, cp1 is the importance of the ontological distance between the con-cepts, cp2 is the importance of the similarity of the sets of properties, and cp3 refers to the importance of the linguisticsimilarity.
concSimðci; cjÞ ¼ cp1concProxðci; cjÞ þ cp2 � propSimðci; cjÞ þ cp3 � eqNameðtermðciÞ; termðcjÞÞ; ð1Þ
wherePðcpi ¼ 1 and 0 6 cpi 6 1.
Let us define now these three functions. The conceptual proximity calculates the distance of the concepts in the ontology.This function would allow to calculate how far two concepts in the course ontology are, that is, how far the concepts iden-tified by the teacher and the student are. The function is defined by Eq. (2).
concProxðci; cjÞ ¼ 1� distðci; cjÞNodes
ancðci; cjÞ– ø; ð2Þ
0 otherwise;
where dist stands for the amount of concepts between ci and cj through the shortest common path, that is, through the clos-est common taxonomic parent concept; nodes stands for the total amount of concepts in the ontology; and anc(ci,cj) is thereflexive function that returns the common taxonomic parents of the concept c. In case there is no common parent, the con-ceptual proximity function returns 0.
In our example, the result would show how close the concepts ‘‘phase of design’’ and ‘‘pedagogic design’’ are in the do-main ontology. This function returns the following score:
concProxðci; cjÞ ¼ 1� distðc1; c2ÞNodes
¼ 1� 180¼ 0:98:
The score 0.98 means that both concepts are very close in the context of the taxonomy included in the course ontology.

D. Castellanos-Nieves et al. / Information Sciences 181 (2011) 1517–1537 1525
In order to calculate the linguistic distance, a function is applied to get the linguistic similarity between the terms asso-ciated with two concepts. This approach uses the Levenshtein distance, written L (x,y), and defined by Eq. (3).
eqNameðsi; sjÞ ¼1
1þ Lðsi; sjÞ: ð3Þ
In our running example, the following score is obtained:
eqNameðsi; sjÞ ¼1
1þ LðC1;C2Þ¼ 1
1þ 10¼ 0:091:
The score obtained in our example is 0.091. This value indicates that the terms associated with the concepts are clearly dif-ferent, that is, the number of transformations needed for one of the terms to obtain the other one is high. It should be notedin this example that the original texts are in Spanish, so this score is obtained by applying the function to the terms inSpanish, respectively, ‘‘fases de diseño’’ and ‘‘diseño pedagógico’’.
Finally, propSim accounts for the similarity between the sets of properties associated with the respective concept (see Eqs.4, 5 and 5). It is calculated by using the similarity measurement widely used in literature ( see for instance, [51,38,53,19]).
propSimðci; cjÞ ¼jCðci; cjÞjGðci; cjÞ
; ð4Þ
Cðci; cjÞ ¼ commonAttributesðci; cjÞ; ð5Þ[ commonRelationsðci; cjÞ;
Gðci; cjÞ ¼ jCðci; cjÞj þ b1 � jnCðci; cjÞj þ b2 � jnCðcj; ciÞj: ð6Þ
The factor C(ci,cj), refers to the amount of properties both concepts share, and it is calculated as follows: (1)commonAttributesis a function that returns the set of attributes having the same name, type and value restrictions in ci and cj; (2) common-Relations is a function that returns the set of relations having the same name, with ci and cj playing the same role in the rela-tion and the other participant being the same in both relations.
On the other hand, nC(ci,cj) is calculated analogously but considering the set of attributes and relations which do not ap-pear in both concepts. Finally, bi is calculated as defined in Eq. (7). In this function, the value of b1 depends on the depth ofthe concepts ciand cj in the taxonomy, according to the definition provided in [53].
b1 ¼depthðcjÞ
depthðciÞþdepthðcjÞdepthðciÞ 6 depthðcjÞ;
depthðciÞdepthðciÞþdepthðcjÞ
depthðciÞ > depthðcjÞ;ð7Þ
b2 ¼ 1� b1:
Let us apply these definitions to the concept design phases (c1) and pedagogical design (c2). The number of common prop-erties is 3. The value for nC (c1,c2) is 9, and for nC (c2,c1) is 4. Hence, the propSim score for these concepts is calculated asfollows:
propSimðc1; c2Þ ¼jCðc1; c2ÞjGðc1; c2Þ
¼ 33þ 9ð1� 0:33Þ þ 4ð1� 0:33Þ ¼ 0:347:
This function evaluates the properties that are common and disjoint for any given pair of concepts. In our example, this func-tion returns the value 0.34, and this means that there are not many properties in common between these two concepts. Now,by combining all the scores, the conceptual similarity can be calculated:
concSimðc1; c2Þ ¼ 0:5ð0:98Þ þ 0:4ð0:34Þ þ 0:1ð0:091Þ ¼ 0:654:
This function combines the previously calculated factors. In this example, the score obtained is 0.65. It should be noted that,in this example, the most important factor for measuring the conceptual similarity is the conceptual proximity, which isweighted 0.5, followed by the similarity of properties, which is weighted 0.4. Finally, the importance of the linguistic sim-ilarity is 0.1.
3.3.2. AttributesThe similarity between two attributes, written attSim, is calculated by using three factors: (1) the linguistic similarity; (2)
the similarity of their value sets; and (3) the similarity of the concepts they refer to. These elements are combined in Eq. (8).
attSimðai; ajÞ ¼ at1 � eqNameðtermðaiÞ; termðajÞÞ þ at2 � valSimðai; ajÞ þ at3 � concSimðconceptðaiÞ; conceptðajÞÞ; ð8Þ
whereP
ati=1 and 0 6 ati 6 1.The coefficients at1, at2 and at3 play a similar role to the ones played by cpi for the concepts: at1 weights the importance of
the linguistic distance, at2 indicates the importance of the similarity of the values of the attributes, and at3 refers to the sim-ilarity of the concepts associated with the attributes.

1526 D. Castellanos-Nieves et al. / Information Sciences 181 (2011) 1517–1537
The first and the third factors have already been described for concepts. The second factor, written valSim, calculates thesimilarity among value sets as shown in Eq. (9).
valSimðai; ajÞ ¼jvaluesðaiÞ \ valuesðajÞj
mink¼i;jjfvaluesðakÞgj: ð9Þ
To illustrate the similarity functions between attributes, the attributes ‘‘main aspects’’ of the concept ‘‘bases of design’’, a1,and ‘‘impact of use’’ of the concept ‘‘context of use’’ a2 are used.
These attributes have the following similarity of values:
valSimða1; a2Þ ¼jvaluesða1Þ \ valuesða2Þj
mink¼i;jjfvaluesðakÞgj¼ 3
8¼ 0:38:
The result of this functions to the values of the attributes ‘‘main aspects’’ of the concept ‘‘bases of design’’ and ‘‘impact of use’’of the concept ‘‘context of use’’ is 0.38. This score shows that there is a low similarity between the corresponding set of val-ues of both attributes. The global similarity of these attributes is then obtained as follows:
attSimða1; a2Þ ¼ at1 � eqNameðtermðaiÞ; termðajÞÞ þ at2 � valSimða1; a2Þ þ at3 � concSimðconceptða1Þ; conceptða2ÞÞ¼ 0:3ð0:0625Þ þ 0:2ð0:38Þ þ 0:5ð0:014Þ ¼ 0:101:
The similarity between the two attributes is 0.101, and this means that both attributes are quite different. In fact we can see thatthe similarity score is low for the three factors, linguistics similarity, similarity of values, and similarity of the concepts associ-ated with the concepts. In this example, this latter factor was considered the most important, since it has a weight 0.5 associated.
3.3.3. RelationsThe similarity between two relations depends on the relationships themselves and on the similarity of the concepts that
participate in such relationships. Hence, the similarity between two relations, written relSim, is calculated by using two fac-tors: (1) the linguistic similarity between the relations; and (2) the similarity between their participants. Both factors arecombined in Eq. (10).
relSimðri; rjÞ ¼ rl1 � eqlNameðtermðriÞ; termðrjÞÞ þ rl2 � concSimðri:concept1; rj:concept1Þ� concSimðri:concept2; rj:concept2Þ; ð10Þ
whereP
rli=1 and 0 6 rli 6 1 and ri.conceptj stands for the jth concept associated to the ith relation.To illustrate this similarity, two relations are used:
� ‘‘component of interface’’ between the concepts ‘‘technical design’’ and ‘‘user interface’’, r1.� ‘‘component of content’’ between the concepts ‘‘pedagogical design’’ and ‘‘content design’’, r2.
Both the linguistic similarity and the conceptual similarity have already been defined for concepts, so we can directly ap-ply the equation to obtain the similarity between both relations:
relSimðr1; r2Þ ¼ rl1 � eqlNameðtermðr1Þ; termðr2ÞÞ þ rl2 � concSimðr1:concept1; r2:concept1Þ� concSimðr1:concept2; r2:concept2Þ
¼ 0:3ð0:066Þ þ 0:7ð0:075Þð0:15Þ ¼ 0:027:
In this example, the similarity between the relations is 0.027, which indicates that they are not very similar. In particular, thehighest partial score is 0.15, which accounts for the similarity between the concepts ‘‘user interface’’ and ‘‘content design’’. Inthis case, the similarity between the concepts associated with the relations is weighted 0.7, whereas the linguistic similarityis given less importance in this example.
3.3.4. Obtaining the markAfter presenting the functions for comparing entities of the same ontological category, we can define how a particular
question/answer is marked: by applying a series of functions which use the previously defined ones. In this section, the focuswill be on open questions, since the evaluation of the closed ones is trivial. Intuitively, the evaluation of an answer can beconceived as the sum of the evaluation of all the concepts, the attributes and the relations contained in the set of semanticannotations, and the rationale for obtaining the final mark is based on that.
The flexibility of the assessment approach is provided by the configuration parameters. One of such parameters is athreshold, which stands for the lowest acceptable similarity score. A threshold equal to 1 represents the strictest marking,meaning that the student’s answer must be identical to the expected one; otherwise, the mark given for the answer is 0.Consequently, the strictness of the marking process is directly proportional to the threshold value. Moreover, two differentpolicies can be applied if the similarity is greater than the threshold:
� Non-strict: The student gets all the marks associated to the particular knowledge item.� Strict: The marks obtained by the student are proportional to the similarity score.

D. Castellanos-Nieves et al. / Information Sciences 181 (2011) 1517–1537 1527
The mathematical definition of the marking functions is provided next. Given an expected answer P, a student answer E, athreshold S, and a policy M, the evaluation of the concepts is calculated as shown in Eq. (11).
Fig. 3.teacher
cEvalðP; E; S;MÞ ¼X
aivalueðPiÞtotalvalue
; ð11Þ
8i ¼ 1 � � � jPjbi ¼ maxj¼1���jEjfconcSimðPi; EjÞg;
8i ¼ 1 � � � jPjai ¼di;bi P S;
0 otherwise;
8i ¼ 1 � � � jPjdi ¼bi if M ¼ strict;
1 otherwise;
where value(Pi) is the quantitative value of the concept Pi in the question and total_value isP
value (Pi).This means that, for each concept in P, its similarity with all the concepts in E is calculated, and the highest similarity bi is
compared to S. If bi P S, then the student gets marks for this item. The amount of marks depends on the strictness of theevaluation process, defined by M. The process is similar for relations (rEval) and attributes (aEval). Therefore, a global eval-uation function, written gEval, is defined by Eq. (12).
gEvalðP; E; S;MÞ ¼ cEvalðconcðPÞ; concðEÞ; S;MÞ þ rEvalðrelðPÞ; relðEÞ; S;MÞ þ aEvalðattðPÞ; attðEÞ; S;MÞ; ð12Þ
where conc (A), att (A), and rel (A) stand for the sets of concepts, attributes and relations contained in A.
4. The OeLE platform
In the previous section, the approach for assessing exams based on open questions has been presented. In this section, thesoftware platform that has been developed and implements the marking approach is described. First, the conceptualizationof the courses domain implemented in the platform will be presented. Then, the implementation of the marking functionswill be described. Finally, some technical and functional details will be provided.
4.1. The conceptualization of the courses domain
The development of the OeLE platform has been guided by an application ontology written in OWL. This ontology modelsthe necessary concepts and relationships of the domain such as course, teacher, student, exam, questions, answers and so on.
Partial description of the domain ontology. This figure is focused on the concept course and its relations with other domain concepts such as exams,s and students.

Fig. 4. Partial description of the domain ontology. This figure is focused on the concept exam and the types of questions and answers.
1528 D. Castellanos-Nieves et al. / Information Sciences 181 (2011) 1517–1537
This ontology also models all the elements that were identified in Section 3.1, including the taxonomy of annotations. Thisontology is partially shown in Figs. 3 and 4. The part of the ontology shown in Fig. 3 is focused, on the one hand, on the rela-tions between courses and teachers, students and exams and, on the other hand, on the relations between exam, student,question and student exam.
The part of the ontology shown in Fig. 4 corresponds to an assessment perspective, because it shows the different types ofquestions, open and closed, and their corresponding relations. A closed question has a set of choices associated, whereas anopen one has annotations. This figure also shows that annotations are associated with the answer provided by a student to aquestion.The assessment approach assumes the existence of a course ontology. This application ontology accounts for this, sothe course concept has one property called ontology, which must also be written in OWL.
OWL is selected instead of other languages such as OBO or DAML because: (1) it is the W3C recommendation, thereforemore and more ontologies are currently being developed in OWL; (2) it has richer formal semantics; (3) it has not beendeveloped for a particular area; and (4) it has a wider community which is developing powerful APIs and tools. On the otherhand, there are converters from languages such as OBO or DAML to OWL which might be used to import ontologies in suchlanguages. This conversion might be internally or externally done, since the platform works internally with the OWL knowl-edge model. In particular, we are using OWL DL, since this OWL flavor provides reasoning capabilities at the DescriptionLogics level, therefore ensuring the finiteness of such reasoning processes.
4.2. Implementation of the assessment functions
The OeLE platform is capable of executing the assessment functions in order to calculate the marks of the students. UsingOWL has some implications regarding the implementation of the assessment functions. On the one hand, two different onto-logical entities (concepts, attributes, and relations) cannot have the same identifier associated in OWL. In the current imple-mentation we assume that two entities of the same OWL course ontology cannot have any linguistic label in common. Hence,in case of having the same label, they may be considered the same entity and their similarity should be 1. Furthermore, OWLrestrictions can give rise to the following direct similarity scores:
� If two classes are defined as equivalent, then their similarity is 1;� If two classes are defined as disjoint, then their similarity is 0;� Otherwise, the corresponding similarity coefficient is obtained.
On the other hand, OWL provides a formal taxonomic theory, whereas other relations such as mereology or topology arenot formalized. Hence, the concept proximity is calculated by using the taxonomic structure. Provided that taxonomies arehierarchical classifications, concepts that do not belong to the same taxonomy are likely to be less similar. For example, mancan be said to belong to the living beings taxonomy whereas chair belongs to a furniture taxonomy. Both concepts mightappear in the same ontology, but they are not likely to be similar.
D. Castellanos-Nieves et al. / Information Sciences 181 (2011) 1517–1537 1529
4.3. The software platform
The platform has been developed in Java, and the Jena Semantic Web Framework (http://jena.sourceforge.net/) has beenused for processing the content of the ontologies. Jena also provides persistence, therefore the different annotations andinstances are stored in OeLE in a PostgreSQL database (http://www.postgresql.org/).
Ontology-based applications usually have a multilayer structure. At the highest level of such structure there is a top-levelor upper domain ontology, which contains the generic concepts.The intermediate level contains application ontologies,which define the concepts for the particular application. The lowest level contains the domain ontology, which containsthe fundamental concepts. This platform follows a two-layered approach, in which the highest level is defined by the coursesdomain ontology. This ontology defines all the elements required for modelling courses and their assessment. On the otherhand, the lower level contains the ontology of a particular course, accounting for the knowledge to be acquired by studentsthrough the course. Both ontologies are necessary and complementary for achieving our goal.
There are three types of users in this platform: administrator, teacher, and student. In this section, we will focus on thelatter ones, students and teachers, since they are the agents involved in the marking process. A teacher provides the courseontology, designs the open and closed questions, the exams, and does the marking. Regarding the open questions, theteacher also provides the semantic annotations for the expected answer, in case (s) he wants to use the automatic markingcapability of the system. Teachers are currently provided with a window-based interface (see Fig. 5, whose main screen isdivided into different sections: courses taught by the teacher (top-left), students of the selected course (top-right), openand closed questions defined for that course, and, finally, exams. The teacher can also perform actions such as definingthe values for the parameters used in the marking process and associating the ontology with the course by using the menu.
On the other hand, a student can only take exams and check his/her marks. Students access these items through the webbrowser. Once logged into the system, the student has to select the course (‘‘curso’’) and the exam (‘‘examen’’). As a result ofthis, the exam form is dynamically generated (see Fig. 6). A text area is generated for each open question, and a radio group iscreated for each closed one. Once the student has completed the exam, this is stored for marking by clicking on the savebutton (‘‘guardar’’).
The next step is the annotation of the student exam, which is a semiautomatic process. The NLP techniques suggest theannotations, but the teacher can modify them. Fig. 7 shows how the teacher annotates the student’s answer. This student’sanswer (‘‘respuesta dada por el estudiante’’) is displayed on the top of the figure, the course ontology (‘‘ontología’’) on theleft, and the annotations for the student’s answers (‘‘anotaciones’’ and ‘‘anotaciones automáticas’’) appear on the right sideof the figure. Finally, the dialog ‘‘Elemento de respuesta-Anotar’’ appears to add a new annotation. Then, an ontological entity
Fig. 5. The main screen of the OeLE platform for teachers. In this screen, we can see the existing open question (‘‘preguntas abiertas’’), closed questions(‘‘preguntas cerradas’’), exams (‘‘exámenes’’), etc. for the highlighted course.

Fig. 6. The dynamically generated form for the exam, which contains the description of the question, the number of marks associated with the question andthe text area for the answer in free text.
1530 D. Castellanos-Nieves et al. / Information Sciences 181 (2011) 1517–1537
is associated with a linguistic expression. This process is analogous to the annotation of the expected answer for openquestions.
After annotating the student answer, the marking process can be launched. The marking dialog, shown in Fig. 8, has twomain areas. The question (‘‘Enunciado’’), the expected answer (‘‘Respuesta esperada’’) and its annotations (‘‘Anotaciones de larespuesta esperada’’) are on the left side, whereas the student’s answer (‘‘Respuesta obtenida’’) and its annotations(‘‘Anotaciones de la respuesta obtenida’’) appear on the right side. This part of the screen also contains the manual(‘‘Calificación manual’’) and automatic (‘‘Calificación automática’’) mark. The teacher can manually provide a mark for thequestions by analyzing the textual answer, or get an automatic one by pressing the button (‘‘Corregir Automáticamente’’).
Finally, there are different initiatives to standardize practice in eLearning. SCORM (http://www.adlnet.gov/scorm/) is astandard for defining Learning Objects, whereas IMS QTI (http://www.imsglobal.org/question/) describes a data model forthe representation of assessmentItems (questions) and tests. There, the structural components of exams and questions aredefined, whereas we are more interested in their relation with the course knowledge. This software platform is capableof generating IMS-compliant tests, although the current implementation only exports the non-semantic parts.
5. Validation
The approach presented in this work has been validated in two real courses. The complete data of this process can befound at http://klt.inf.um.es/�oele/. The goal of the validation was to evaluate whether the marking approach can supporthumans in the assessment process.
5.1. The courses
The marking approach has been applied in two real courses. The same process was followed in both courses. First, theteachers built manually the course ontologies, whose consistency was checked by using online validators and reasoners suchas Fact++(http://owl.man.ac.uk/factplusplus/) and Pellet (http://pellet.owldl.com/). Afterwards, they designed and annotatedthe exam questions, and created the exams. Then, those were done by the students, and marked in different ways: manuallyby the teacher(s), and automatically by applying OeLE. It should be noted that the humans involved in the manual markingdid not participate in the semiautomatic one using OeLE. Next, both courses are described.

Fig. 7. The dialog for the semantic annotations of the answers of the students: (up) the answer given by the student; (left) the course ontology; (right) theannotations for the answer.
Fig. 8. The dialog for marking the answer to the question: (left, from top to bottom) the question, the expected answer, the annotations of the expectedanswer and the number of marks assigned to the question; (right, from top to bottom) the student’s answer, the annotations of that answer, and the manualand automatic marks.
D. Castellanos-Nieves et al. / Information Sciences 181 (2011) 1517–1537 1531

1532 D. Castellanos-Nieves et al. / Information Sciences 181 (2011) 1517–1537
Course 1. Design and evaluation of didactic media. The 2007 edition of this online course of the Faculty of Education at theUniversity of Murcia was used. This course had 14 students, which took part in this experiment. The ontology builthas 80 classes, 63 taxonomic relations, 34 object properties, and 15 datatype properties. It also includes cardinalityand disjointness restrictions. It can be found at http://klt.inf.um.es/�oele/ontologiadiseomedios.owl. This ontologywas built before designing the four open questions of the exam. The students’ answers were manually evaluated bytwo teachers and automatically by using OeLE. The exams were processed by a third human teacher, who was incharge of supervising the annotations of the students answers.
Course 2. Multimedia Systems and Graphical Interaction. The data was collected for three years (2006, 2007 and 2008) in theSchool of Computer Science at the University of Murcia, and this was not an eLearning course. The ontology built isaccessible at http://klt.inf.um.es/�oele/Multimedia.owl, and it has 17 classes, 8 taxonomic relations, 20 object prop-erties, as well as cardinality and disjointness restrictions. This ontology was built after designing the open questions,so that the teacher was asked to focus on the relevant part of the course related to the questions. As in the first exper-iment, the annotations were obtained by a different teacher. Exams from different calls were processed. The sameteacher was in charge of the course and calls for the three years, so the human evaluator did not change. The examsset during this period of time had two common open questions, which have been the ones included in this study.These questions had a different weight in each exam, but this was not a problem for this work, because we are eval-uating the assessment of the individual questions rather than complete exams. The exams were processed byanother teacher, who was in charge of supervising the annotations of the students answers.
5.2. The validation process
5.2.1. The statistical approachWe are interested in describing the relationship between automatic and human marks. Our statistical approach makes
use of categorical variables, like exam, question or call, by means of the Analysis of Covariance Method (ANCOVA) [24].ANCOVA integrates Regression and Analysis of Variance (ANOVA) for reducing the unexplained variance in random exper-iments, allowing for a more accurate assessment of the effect of the experimental variables. ANCOVA analysis involves theobservation of the overall relationship between the dependent and the continuous variables included in the model, calledcovariates. Hence, a regression model is looked for the entire data, ignoring which group every individual belongs to. In thisprocess, that global relationship is assumed true for all the groups of participants. This assumption is very important and it iscalled the assumption of homogeneity of regression slopes. If there is evidence that the individual regression lines are notparallel, then a separate regression line must be fitted for each group for prediction purposes.
The analysis of covariance allows for comparing the intercepts. The differences among the intercepts are the vertical dis-tances between the lines, and those distances are compared in the analysis. If there is evidence that the lines are not coin-cident we can assess the adjusted means, which represent what value is predicted for the dependent variable in each groupwhen the covariate has its average value. If there is no evidence that the lines are not coincident, then all the data can besimply pooled together and a single regression line fitted for all the data. For assessing the quality of the fit and the validationof the model, we will make use of the residuals.
Three experiments have been carried out using the data of both courses. Experiment I combines the data from bothcourses, whereas Experiments II and III make an individual analysis of the results of each course.The significance level usedof all the tests is 0.05.
5.2.2. The experimentsExperiment I: Courses 1 and Course 2. In this experiment we combine the data sets of both courses. The categorical variable
Exam accounts for the modality of the course, specifically course 1 means eLearning and course 2 means blended learning. AnANCOVA analysis is then carried out, in which Automatic is the dependent variable, Manual-1 is the covariate and Exam isthe fixed factor. The data are fitted to a full ANCOVA model with iteration term Manual-1 ⁄ Exam, which is significant(p-value = 0.0266). Therefore, the hypothesis of homogeneity of slopes is not proved and an analysis for each course willbe performed.
Experiment II: Course 1. The analysis of the possible relation between automatic and manual marks is carried out byCovariance Analysis (ANCOVA) in which automatic mark (Automatic) is the dependent variable, the human marks(Manual-1) are the covariate, and the categorical variable Question is used for classifying and grouping the data.
The correct interpretation of ANCOVA requires using the ANOVA results as starting point, because we need to knowwhether the factors in the experimental design have the same effect before and after the addition of the covariate in the dataanalysis process. In fact, a significant effect might become non-significant after adding another effect to the model. The oppo-site situation could also happen.
The analysis of the effect of the factor Question on the dependent variable is carried out by One-way ANOVA. The signif-icance value (p-value < 0.05) seems to indicate that there is a significant relation between Automatic and Question. Moreover,there is at least one pair of questions whose means of automatic scores differ significantly, for example the means of ques-tion 3 and question 4.

D. Castellanos-Nieves et al. / Information Sciences 181 (2011) 1517–1537 1533
Then, we can perform the ANCOVA including Manual-1 as covariate. Now, the result shows that the factor Question doesnot explain a significant part of the total explained variance (p-value = 0.2109). Due to this fact, the adjusted means, obtainedby regression when the covariate Manual-1 has its mean value, are not significantly different. In fact, they are not signifi-cantly different to the value 0.9558 ⁄ 1.3321 + 0.0852 = 1.358421, where 1.3321 is the mean of all the manual marks andthe coefficients have been obtained by Simple Linear Regression. With 95% of confidence, the average of Automatic for thoseindividuals who are marked with zero in Manual-1 is less than 0.170. Moreover, the true value for the slope is between the95% confidence limits 0.898 and 1.012. This means that an increase of one unit in Manual-1 is associated with an estimatedmean increase between 0.898 and 1.012 units in Automatic.
Finally, the ANOVA model explains 41.40% of the Automatic variance whereas this percentage is increased by the ANCOVAmodel to 95.91%. Without the categorial variable Question, the Simple Linear Regression model explains the 95.4% of theAutomatic variance.
Two issues have to be considered for interpreting the results. First, there is a considerable range of individual differenceswithin the values of Manual-1 and Automatic for each of the four questions. Second, the values of Manual-1 and Automaticwithin each group have a high positive correlation. Thus, a very substantial portion of the variability that occurs within eachset of Automatic measures is actually correlated with the corresponding set of Manual-1 measures.
We can also check the remaining prior assumptions to assess the goodness of the fit by means of the graphs of residuals.We can accept that the model has been correctly specified, that no important explanatory variable has been omitted and thatno individual observations exert a great influence on the fitted regression.
Experiment III: Course 2. In this case the experiment is designed using Call and Question as fixed factors, but applying thesame statistical approach. First, we measure the effects of the two factors simultaneously in Automatic by means of a fullfactorial design ANOVA. Second, ANCOVA is used for testing the main and interaction effects of the categorical variableson the dependent variable (Automatic), analyzing the effects of the variable Manual-1 to detect changes in the significanceof the factors after removing Manual-1. The results of ANOVA show that the main effect for Question is significant. Neitherthe effect for Call nor for the two-way interaction of Question * Call were significant.
Then, we carry out the ANCOVA analysis using the main factors used in ANOVA and the covariate Manual-1. The effect offactor Question becomes non-significant while the effect of Call remains non-significant. The effect detected in ANOVA due toQuestion is due to Manual-1, and the adjusted means by regression are not significantly different. We have a situation verysimilar to course 1.
As in the previous case, we perform the Simple Linear Regression of Automatic on Manual-1 marks using all the individ-uals of course 2. The proportion of variance explained by the model is R-Squared = 0.997 and the value for Durbin–Watson is2.283 (close to 2), therefore we can accept the assumption that the residuals are not autocorrelated.
We can conclude with 95% confidence that the Automatic mean for those individuals who are marked with zero inManual-1 is not significantly different from zero. Also, the true value for the slope is between the 95% confidence limits0.99432 and 1.01562. Thus, an increase of one point in Manual-1 is associated with an estimated mean increase between0.99432 and 1.01562 points in Automatic mark. On other hand, the adjusted means by regression for Automatic marks in bothquestion groups are not significantly different to the value 1.2516 ⁄ 1.00497 + 0.00056 = 1.25829, where 1.2516 is the meanof all the Manual-1 marks.
Finally, the analysis of the residuals graphs is similar to the previous one, that is, all points marked as potential outliers inresidual versus fitted plots do not exert a great influence on the fitted regression.
5.3. Summary of the results
The following results may be pointed out:
1. A separate analysis is done for each course because the parallelism of the regression lines for explaining the effects of thevariable Manual-1 on the variable Automatic in Course 1 and Course 2 cannot be assumed.
2. The statistical conclusions about the effect of the factor Question on each course can be summarized as follows:(a) Question causes a significant effect on the variable Automatic in both courses. In other words, when automatic marks
are grouped by number of question, we reject the null hypothesis that all the true means are equal.(b) Question becomes non-substancial in both courses when we control the variability of the variable Automatic through
Manual-1 by means of an ANCOVA model.(c) There is a linear relationship between automatic and human marks independently of the question.
3. A single fitting to the simple regression model of Automatic versus Manual-1 is made for all data in each course. The good-ness of the fit of these models is very high.
4. With 95% confidence, an increase of one point in Manual-1 mark is associated with an estimated mean increase between0.898 and 1.012 points in Automatic mark in course 1 and between 0.99432 and 1.01562 in course 2.
5. With 95% confidence, the mean of Automatic for those individuals who are marked with zero in Manual-1 is less than 0.170in course 1 and less than 0.017 in course 2. In both courses this mean is not significantly different from zero.

1534 D. Castellanos-Nieves et al. / Information Sciences 181 (2011) 1517–1537
6. Discussion
In this paper, we have presented an approach based on Semantic Web technologies for supporting assessment processesbased on open questions. This method opens a series of new possibilities and challenges in online assessment. As mentionedin Section 2, a few approaches have been proposed in the last years for supporting students’ assessment, although importantdifferences should be pointed out. A review of the state of the art in this field is presented in [49]. There, the conclusion isthat there is still a long way to go before reaching the ideal system, although there are already some interesting systems. Weconsider that our results are consistent with that conclusion. We think our results are interesting, but our methods and toolswould need a series of improvements in order to facilitate its adoption in educational settings for daily practice. To this end,it should be noted that most of our limitations are likely to be due to the state of the arf of the applied technologies. In ourapproach, the use of ontologies allows us to analyze the course knowledge, which is an advantage over approaches based ontopic or conceptual maps, since powerful semantic tasks can be done more effectively. Non-semantic approaches based onfuzzy logics or statistical techniques need an important previous training, and they need a domain-specific, annotated cor-pus. Our approach does not require such effort, since the system learns through its usage.
Using semantic technologies as the kernel for marking students, as it is done in this work, makes it possible to enrich theassessment process in a more effective way than non ontology-based methods. This is also supported by the results obtainedin [59], although those approaches have a more constrained semantic model since, for instance, they allow for a reducednumber of relations. On the other hand, only preliminary results of the approach presented in [50] are known, althoughwe think that the technological solution would be harder to manage for teachers. All these approaches aim to assess the ex-plicit knowledge of the students. We think that it would be interesting to include tacit knowledge in the assessment frame-works of the efforts in line with [44].
The application of this framework through different assignments may facilitate the acquisition of semantic learning mod-els of the students. The global analysis of such models might help obtain learning profiles and flaws, and this informationmight be used by the teacher to change or adapt the learning objects according to the student’s needs. On the other hand,different assignments might focus on the same conceptual entities from different perspectives. In such situations, our ap-proach would allow to measure how the shared conceptual entities are acquired by the students from the different perspec-tives. Each perspective might correspond to a particular learning and assessment methodology, so our framework might alsobe used to semantically compare the different results obtained by the students by using different learning and assessmentmethodologies.
The marking function is one of the most important aspects of the approach presented here. One of our goals was to designthis function as flexible as possible. This has been achieved by defining a set of functionally-differentiated parameters asfollows: (1) three parameters for calculating the similarity between concepts; (2) three parameters for the similaritybetween attributes; (3) two parameters for the similarity between relations; (4) one parameter to set up an assessmentof the threshold; and (5) a parameter to define the evaluation policy. The first three groups of parameters constitute theinternal flexibility of the evaluation function, since they allow the teacher to grade the importance of conceptual, linguisticor property-based similarity among the different entities. The last two groups represent the severity instruments forteachers. In our current implementation, the teacher can define the values of such parameters and the same parametersare applied to the student’s answers for the same exam. Thus, the same marking criteria are applied to all the students ofa particular subject and for a particular exam. In addition to this, the teachers can use different parameters for differentexams. This would allow teachers, for instance, to be more strict with easier exams or more flexible with harder ones.Obviously, they could use the same parameters for all the exams taken in a course. In summary, the marking policy canbe easily adapted to the needs and preferences of the teachers.
Regarding the method for weighting each parameter, the following can be stated. First, there is no standard or automaticway to determine the best values for the weights, so an analysis has been carried out in order to suggest their potentially bestrange values. Suboptimal values for the parameters were used, so additional research should be made to learn good sets ofparameters for particular courses and for particular teacher profiles to guarantee the success in any course. Most of the func-tions included in our approach have a parameter which depends on the linguistic similarity. We consider that its weightshould be low (e.g., 0.1), because it does not provide information about the particular structure or meaning of the knowledgeentity. Methods for computing the linguistic similarity by making use of linguistic resources such as Wordnet (http://wordnet.princeton.edu/) are in progress. However, this weight can differ between different exams for the same course.For the rest of parameters, local decisions should be made due to the local nature of their meaning, combining the context(e.g., cp1 or at3) and the internal structure of the information being assessed (e.g., cp2 or at2). The conceptual similarity isconsidered more important than the linguistic one for concepts, the similarity of the concepts taking part in a relation ismore important than the linguistic one, etc. Additional research should be made to learn good sets of parameters forparticular courses as well as drawing teacher profiles in order to guarantee the successful application of this approach toany course. Even so, promising results are envisioned even without using the best set of parameters, since the marksassigned by the methodology are similar to those assigned by human teachers.
Ideally, a particular exam should be given the same qualification by different teachers. However, different teachers mayhave different marking policies, and therefore different marks are given. Our approach attempts to reduce such differences.First, the expected answer has to be annotated by the teacher. Through this process, the teacher has to identify and grade the

D. Castellanos-Nieves et al. / Information Sciences 181 (2011) 1517–1537 1535
involved knowledge items present in the answer. When different teachers give a different mark to the same question, it isusually due to the following facts: (1) they are grading the knowledge items differently, so they are evaluating different ex-pected answers; and (2) they are using a different threshold in the evaluation.
The processing of natural language is important in our approach, since it is basic for extracting the sets of annotations.From a technical perspective, there are approaches based on Natural Language Processing (NLP) combined with other tech-niques such as information retrieval, syntax analysis, pattern recognition, Bayesian networks, decision trees, statistics, and soon. These are flexible techniques, but their reliability is not good enough. Therefore, we decided to use a semiautomatic,incremental approach for extracting students’ annotations. Therefore, in case of having stable courses, the effort made bythe teacher decreases with time. We are currently developing a methodology that improves the extraction of the semanticannotation and reduces the participation of the teacher in this process.
Some reflections about the role and interaction of the teacher are made next. We cannot assume ontology modeling skillsin teachers, so they would require some training or more powerful and intuitive ontology building tools. One of the strengthsof our approach is the possibility for sharing and reusing questions and annotations for different exams, courses, and insti-tutions, that is, it could be the base for educational assessment networks. This scenario would require a common ontology,which would require either its collaborative development or to be provided by some educative agent. We aim to extend ourapproach to cover new assessment-related functionalities and services, such as feedback, recommendation of reinforcementmaterials, design of customized courses and so on. Consequently, the effort of developing such ontologies would be reallyworthwhile. This is an effort that teachers have to make once and that is not required in non-semantic approaches. Addition-ally, those shared ontologies would promote interoperability and knowledge sharing and management capabilities [34], inthis case, between eLearning systems.
Teachers may also participate in the generation of their semantic annotations for the students’ answers. According to theperformance of the NLP algorithm used, the participation of the teacher decreases with time, so the answers’ will eventuallybe completely done in an automatic way. At this point, the effort of the teacher would be the same as when using statistics-based approaches, since the algorithm would annotate the exams following the annotation patterns of the teacher. However,non-semantic approaches do not give teachers any chance to revise and correct the decisions made by the system, and toadapt the marking functions to particular marking policies. So, they can decide to what extent they want to be involvedin this process. Our system aims to support teachers in assessment, not to replace them. Hence, the benefits for teachersin terms of time spent in marking processes come when they have a lot of exams to mark and they do not use the systemjust for one exam or one year, but they plan to use it regularly, for instance, for continuous evaluation.
We think that our approach does not really need to be more effective in terms of marking precision than other semanticor non-semantic approaches, so we do not believe that it makes sense to compare its effectiveness in relation to other ap-proaches. Our goal was to develop a different technological proposal based on Semantic Web Technologies effective, havingsome desirable properties in terms of adjustability, uniformity, sharing, reusability, and easy to extend to cover new assess-ment-related activities such as the aforementioned ones.
If the expected answer includes relations and attributes, the student would only get marks if those relations and attri-butes, as well as their corresponding concepts, are identified in the answer. This includes a series of factors such as attSimand relSim, which do not only compare linguistic labels as keyword spotting would do. All our semantic functions make useof weights that allow to adjust the semantic behavior of the algorithm, and this cannot be done in keyword spottingapproaches.
This approach can be applied to every type of courses, and some of them will be small ones and they might have smallontologies associated. In this case, it might be thought that the marking algorithm would be just like keyword spotting.This thought would be wrong, since the marking algorithm takes into account not only the concepts but also the relationsand the attributes. Hence, if the expected answer includes relations and attributes, the student would only get marks ifthose relations and attributes, as well as their corresponding concepts, are identified in the answer. That might be truefor expected answers that contain only concepts, although there would be some difference too. In a keyword spotting con-text, if the concept written by the student is not the expected one, the answer would be directly wrong. However, our algo-rithm would calculate the semantic similarity between both concepts and, if they are close enough, the student could getsome marks.
7. Conclusions
Assessment is a fundamental task in the educative context, because it allows students to get information about their pro-gress, while teachers may thus know how effective their teaching is. Most educational systems incorporate solutions forassessment based on closed questions or with very structured and constrained answers. Nevertheless, there is a clear needfor approaches considering the use of open questions, since natural language is the most common way of communication forhumans. In this paper, we have presented an approach for supporting teachers in assessment processes. Our assessmentmethod is built on top of ontologies and semantic annotations, and the marking algorithm is based on semantic similarityand the teacher can define the value of the parameters for the automatic marking process. The results obtained in two realcourses are promising, since the method is capable of marking in a way similar to human’s. However, experiments with sub-jects from different knowledge areas would allow a better generalization of our results.

1536 D. Castellanos-Nieves et al. / Information Sciences 181 (2011) 1517–1537
We are currently extending the approach and the software platform to deal with the fourth potential benefit mentionedin the Introduction section, that is, the automatic generation of semantic feedback for both teachers and students. In thisway, the students would not only receive the numerical score of their exams, but also the knowledge that should be rein-forced. Teachers would then be provided with useful information about the learning flaws of the students and this informa-tion might be used to design new learning contents or adapt the teaching–learning process.
Acknowledgements
This work has been possible thanks to the Fundacion Seneca, Agencia Regional de Ciencia y Tecnologia through project08756/PI/08.
References
[1] E. Alfonseca, D. Perez, Automatic assessment of open ended questions with a bleu-inspired algorithm and shallow nlp, in: EsTAL, 2004, pp. 25–35.[2] A. Algergawy, R. Nayak, G. Saake, Element similarity measures in xml schema matching, Information Sciences 180 (2010) 4975–4998.[3] R. Amorı́n, M. Lama, E. Sánchez, A. Riera, X. Vila, A learning design ontology based on the IMS specification, in: Proceedings of the UNFOLD-PROLEARN
Joint Workshop, 1995, pp. 203–225.[4] L.W. Anderson, D.R. Krathwohl, P.W. Airasian, K.A. Cruikshank, R.E. Mayer, P.R. Pintrich, J. Raths, M.C. Wittrock, A Taxonomy for Learning, Teaching, and
Assessing: A Revision of Bloom’s Taxonomy of Educational Objectives, Longman, 2001.[5] G. Antoniou, F. Harmelen, A Semantic Web Primer, The MIT Press, 2004.[6] R.I. Arends, Learning to Teach, McGraw-Hill Higher Education, 2004.[7] B. Barros, F. Verdejo, T. Read, R. Migozuchi, Applications of collaborative learning ontology, in: Proceedings of the 2nd MICAI, 2002, pp. 301–310.[8] T. Berners-Lee, J. Hendler, O. Lassila, The semantic web, Scientific American (2001) 34–43.[9] M. Birenbaum, K. Tatsuoka, Y. Gutvirtz, Effects of response format on diagnostic assessment of scholastic achievement, Applied Psychological
Measurement 16 (1992) 353–363.[10] I. Bittencourt, E. Costa, M. Silva, E. Soares, A computational model for developing semantic web-based educational systems, Knowledge-Based Systems
22 (2009) 302–315.[11] B. Bloom, The classification of educational goals. Taxonomy of educational objectives: the classification of educational goals, in: B.S. Bloom (Ed.) David
McKay Company, Inc, 1956, 201–207. Chapter Taxonomy of Educational Objectives, 1956, pp. 201–207.[12] C. Brewster, K. O’Hara, Knowledge representation with ontologies: present challenges-future possibilities, International Journal of Human–Computer
Studies 65 (2007) 563–568.[13] C. Brewster, K. O’Hara, Knowledge representation with ontologies: the present and future, IEEE Intelligent Systems 19 (2004) 72–81.[14] V. Carchiolo, A. Longheu, M. Malgeri, Reliable peers and useful resources: searching for the best personalised learning path in a trust- and
recommendation-aware environment, Information Sciences 180, 1893–1907. Special Issue on Intelligent Distributed Information Systems, 2010.[15] F. Chia-I, Intelligent assessment of distance learning, Information Sciences 140 (2002) 105–125.[16] E. Delozanne, D. Prévit, B. Grugeon, F. Chenevotot, Automatic multi-criteria assessment of open-ended questions: a case study in school algebra,
Lecture Notes in Computer Science 591 (2008) 101–110.[17] V. Devedzic, Semantic Web and Education, Springer, 2006.[18] C. Devin, Panlingua, 1998.[19] J. Euzenat, P. Valtchev, Similarity-based ontology alignment in owl-lite, in: Proceedings of the 16th European Conference on Artificial Intelligence,
2004, pp. 333–337.[20] G. Falquet, C. Mottaz, Ontology based interfaces to access a library of virtual hyperbooks, Lecture Notes in Computer Science 3232 (2004) 99–110.[21] D. Fensel, S. Staab, S. Studer, R.F. van Harmelen, J. Davies, A future perspective: exploiting peer-to-peer and the semantic web for knowledge
management, in: Chapter Towards the Semantic Web, John Wiley and Sons, 2003, pp. 245–264.[22] J.T. Fernández-Breis, D. Castellanos-Nieves, R. Valencia-Garcı́a, Measuring individual learning performance in group work from a knowledge
integration perspective, Information Sciences 179 (2009) 339–354.[23] J.T. Fernández-Breis, R. Martı́nez-Béjar, A cooperative framework for integrating ontologies, International Journal of Human–Computer Studies 56
(2002) 665–720.[24] R.A. Fisher, F. Yates, Statistical Tables for Biological, Agricultural and Medical Research, Oliver and Boyd, Edinburgh, 1948.[25] F.Horgan, C. Mangrum, Teaching Content Area Reading Skills, Columbus, 1993.[26] S.A. Friedler, B. Shneiderman, Enabling teachers to explore grade patterns to identify individual needs and promote fairer student assessment,
Computers and Education 51 (2008) 1467–1485.[27] T. Gruber, A translation approach to portable ontology specifications, Knowledge Acquisition 5 (1993) 199–220.[28] C. Guangzuo, C. Fei, Ontoedu: Ontology-based education grid system for e-learning, in: 8th Global Chinese Conference on Computers in Education,
2004.[29] Y. He, S. Hiu, T. Quan, Automatic summary assessment for intelligent tutoring systems, Computers and Education 53 (2009) 890–899.[30] G. van Heijst, A. Schreiber, B. Wielinga, Using explicit ontologies in KBS development, International Journal of Human–Computer Studies 46 (1997)
183–292.[31] M. Ikeda, U. Hoppe, R. Mizoguchi, Ontological issues of cscl systems design, in: Proceedings of the AIED, 1995, pp. 242–249.[32] A. Inaba, T. Tamura, R. Ohkubo, M. Ikeda, R. Mizoguchi, J. Toyoda, Design and analysis of learners interaction based on collaborative learning ontology,
in: P. Dillenbourg, A. Eurelings, K. Hakkarainen, (Eds.), in: Proceedings of the 2nd Euro-CSCL, 2001, pp. 308–315.[33] X. Jiang, A.H. Tan, Learning and inferencing in user ontology for personalized semantic web search, Information Sciences 179 (2009) 2794–2808.[34] J.J. Jung, Reusing ontology mappings for query routing in semantic peer-to-peer environment, Information Sciences 180 (2010) 3248–3257.[35] S. Kabel, B. Wielinga, R. de How, Ontologies for indexing technical manuals for instruction, in: Proceedings of the AIED Workshop on Ontologies for
Intelligent Educational Systems, 1999, pp. 44–53.[36] M. Lee, K.H. Tsai, T.I. Wang, A practical ontology query expansion algorithm for semantic-aware learning objects retrieval, Computers and Education 50
(2008) 1240–1257.[37] M. Lytras, A. Pouloudi, N. Korfiatis, An ontological oriented approach on e-learning. integrating semantics for adaptive e-learning systems, in:
Proceedings of the 11th European Conference on Information Systems, 2003.[38] A. Maedche, S. Staab, Measuring similarity between ontologies, in: A. Gómez-Pérez, V. Benjamins, (Eds.), Lecture Notes in Computer Science, 2002, pp.
251–263.[39] L. Maicher, J. Park, Charting the Topic Maps Research and Applications Landscape, Springer, 2005.[40] P. Mcgrath, Assessing students: computer simulation vs mcqs, in: Proceedings of the 7th Computer Assisted Assessment Conference, 2003.[41] G.A. Miller, Wordnet: a lexical database for English, Communications of the ACM 38 (1995) 39–41.[42] T. Mitchell, N. Aldridge, W. Williamson, P. Broomhead, Computer based testing of medical knowledge, in: Proceedings of the 7th Computer Assisted
Assessment Conference, 2003.

D. Castellanos-Nieves et al. / Information Sciences 181 (2011) 1517–1537 1537
[43] T. Mitchell, T. Russell, T. Broomhead, N. Aldridge, Towards robust computerised marking of free-text responses, in: Proceedings of the 6th ComputerAssisted Assessment Conference, 2002.
[44] M. Mitri, Applying tacit knowledge management techniques for performance assessment, Computers and Education 41 (2003) 173–189.[45] R. Mizoguchi, K. Sinitsa, Task ontology design for intelligent educational/training systems, in: Proceedings of the ITS, 1996, pp. 1–21.[46] E. Nasibov, A. Kinay, An iterative approach for estimation of student performances based on linguistic evaluations, Information Sciences 179 (2009)
688–698.[47] M.B. Olsen, Translating English and Mandarin Verbs with Argument Structure, Technical Report, New Mexico State University, 1998.[48] K. Palmer, P. Richardson, On-line assessment and free-response input – a pedagogic and technical model for squaring the circle, in: Proceedings of the
7th Computer Assisted Assessment Conference, 2003.[49] D. Perez-Marin, I. Pascual-Nieto, P. Rodriguez, Computer-assisted assessment of free-text answers, The Knowledge Engineering Review 24 (2009) 353–
374.[50] S. Radenkovic, N. Krdzavac, V. Devedzic, An assessment system on the semantic web, Annals of Information Systems 6 (2009) 177–200.[51] P. Resnik, Semantic similarity in a taxonomy: an information-based measure and its application to problems of ambiguity in natural language, Journal
of Artificial Intelligence Research 11 (1999) 95–130.[52] D. Richards, A social software/web 2.0 approach to collaborative knowledge engineering, Information Sciences 179 (2009) 2515–2523.[53] M.A. Rodrı́guez, M.J. Egenhofer, Determining semantic similarity among entity classes from different ontologies, IEEE Transactions on Knowledge Data
Engennering 15 (2003) 442–456.[54] L. Stojanovic, S. Staab, R. Studer, Elearning based on the semantic web, in: Webnet 2001 – World Conference on the WWW and Internet, 2001.[55] R. Valencia-Garcia, D. Castellanos-Nieves, P.J. Vivancos-Vicente, J.T. Fernandez-Breis, R. Martinez-Bejar, F. Garcia-Sanchez, An approach for ontology
building from text supported by NLP techniques, in: CAEPIA, 2003, pp. 126–135.[56] H. Wang, S. Chen, Evaluating students’ answerscripts based on extended fuzzy grade sheets, International Journal of Innovative Computing
Information and Control 4 (2008) 961–970.[57] H. Wang, C. Hsu, Teaching-material design center: an ontology-based system for customizing reusable e-materials, Computers and Education 46
(2006) 458–470.[58] D. Whittingdon, H. Hunt, Approaches to the computerised assessment of free-text responses, in: 3rd International Computer Assisted Assessment
Conference, 1999.[59] Q. Zeng, Z. Zhao, Y. Liang, Course ontology-based user’s knowledge requirement acquisition from behaviors within e-learning systems, Computers and
Education 53 (2009) 809–818.


![[Webinar] Semantic Technologies](https://img.dokumen.tips/doc/110x75/555099c4b4c9058b208b4849/webinar-semantic-technologies.jpg)