Embed Size (px)
Citation preview
Self-Teaching Guide for Food Acidulants 1
Self-Teaching Guide for Food Acidulants
The Self-Teaching Guide for Food Acidulants was developed by Bartek Ingredients Inc. for product developers working in foods and beverages. It provides a basic understanding of acidulants and their functional properties. There are two ways of selecting acidulants for a product application —
the trial & error method, which costs and leads to ,
or,
the predictive method, which leads to .
Product formulators can predict acidulant properties and therefore save time in acidulant selection by using this Self-Teaching Guide.
Section A, Basic Acid Concepts, is a basic introduction to acid chemistry and includes topics such as “What is pH?” and “What is an Acid?”
Section B, Acidulant Selection, discusses various criteria used to compare and select food acidulants using predictive methods. Readers who already have a basic understanding of acids may wish to go directly to Section B.
We welcome any comments, input or questions you might have concerning this guide and/or your particular application. Please feel free to contact us at: [email protected]
Self-Teaching Guide for Food Acidulants 2
Table of Contents
SECTION A. BASIC ACID CONCEPTS Page
WHAT’S A MOLE? 3
MOLAR CONCENTRATION 5
LOGS AND EXPONENTS 6
WHAT IS pH? 7
WHAT IS AN ACID? 8
THE DISSOCIATION CONSTANT, Ka, pKa 9
SECTION B. ACIDULANT SELECTION
INTRODUCTION TO SECTION B. ACIDULANT SELECTION 12
ACID STRENGTH 14
ACID STRENGTH CALCULATIONS 19
BUFFER CAPACITY 21
SOURNESS 25
FLAVOR EFFECTS 30
APPLICATIONS NOTES 36
Self-Teaching Guide for Food Acidulants 3
What’s a Mole?
The mole is a unit of measurement.
One mole = 602,000,000,000,000,000,000,000 molecules.
Molecules of different chemicals have different weights. For example, the molecular weight of Fumaric Acid is 116 amu. The molecular weight of Malic Acid is 134 amu.
The weight in grams of a mole is equal to the numerical value of the molecular weight.
One mole of Fumaric Acid = 116 grams. One mole of Malic Acid = 134 grams.
116 grams of Fumaric Acid contains the same number of molecules as 134 grams of Malic Acid.
That’s why moles are used – to weigh out an amount of a chemical that has a specified number of molecules.
Q. How many moles of Fumaric Acid are in a 25 kg. bag?
A. 215.52 Moles (25,000/116 = 215.52)
Q. How many moles of Malic Acid are in a 25 kg bag?
A. 186.57 Moles (25,000/134 = 186.57)
Q. 10 grams of Malic Acid are how many moles?
A. 0.075 Moles (10/134 = 0.075)
Q. Does a 25 kg. bag of Fumaric Acid contain more or less molecules than a 25 kg bag of Malic Acid?
A. More (215.52 is greater than 186.57)
Self-Teaching Guide for Food Acidulants 4
What’s a Mole? (cont’d)
Q. Anhydrous Citric Acid has a molecular weight of 192. How many moles of Citric Acid are there in a 25 kg bag?
A. 130.21 moles (25,000/192 = 130.21)
25 kg of Citric Acid = 130.21 moles 25 kg of Malic Acid = 186.57 moles 25 kg of Fumaric Acid = 215.52 moles
Of these three acids, you get the most molecules per kg or per bag when you buy Fumaric Acid, followed by Malic Acid.
Because Fumaric Acid and Malic Acid molecules are smaller (lower molecular weight) than Citric Acid molecules, you get more molecules per kg or per bag.
You get 43% more (186.57/130.21 = 1.43) molecules per kg with Malic Acid than with Citric Acid. You get 66% more (215.52/130.21 = 1.66) molecules per kg with Fumaric Acid than with Citric Acid.
Chemical reactions or interactions depend on the number of molecules, not on the kgs or lbs involved. For example; pH, buffer capacity, chelation capacity, and sourness are all in part determined by the number of molecules present.
That’s why both Fumaric and Malic Acids are preferred in many applications to Citric Acid – simply because there are more molecules per kg or lb. and this results in superior performance; for example, more sourness, lower pH, greater buffer capacity, etc.
Self-Teaching Guide for Food Acidulants 5
Molar Concentration
Molar concentration, or molarity, is simply the number of moles in a liter of solution. It is abbreviated by M. It is a way of expressing the concentration of a chemical in solution.
Most of the time in the food and beverage industry, the concentration of an ingredient is expressed as % or ppm. For example, 10 grams of Malic Acid in 1000 ml of solution would be a 1% w/v solution. “w/v” stands for “weight/volume”.
“ppm” stands for parts per million. 0.1 gram of Malic Acid in 1000 ml of solution would be a 0.01% w/v solution or a 100 ppm solution.
Why use molarity instead of % or ppm? Chemists are interested in molarity because it indicates the number of molecules present in solution. Many chemical calculations and predictions are based on molarity. For example, the predictions of pH and buffer capacity require that we calculate molarity.
Q. What is the molarity of a 1% w/v Malic Acid solution?
A. 0.075M (a 1% w/v solution contains 10 grams per liter. 10 grams of Malic Acid = 0.075 moles (10/134 = 0.075))
Q. The molecular weight of a hydrogen ion, H+, is 1.0. If we have 0.01 grams of hydrogen ions in a liter of solution, what is the molarity of this solution?
A. 0.01M (0.01/1 = 0.01)
Q. Comparing a 1% w/v solution of Fumaric Acid to a 1% w/v solution of Malic Acid, which has greater molarity?
A. The Fumaric Acid solution (a 1% w/v solution contains 10 grams per liter. 10 grams of Fumaric Acid = 0.086 moles (10/116 = 0.086). Therefore, a 1% solution of Fumaric Acid is 0.086M. Compare this to the answer for a 1% Malic Acid solution above.)
Self-Teaching Guide for Food Acidulants 6
Logs and Exponents
Logarithms, or Logs, are an easy way to handle large numbers. For example, instead of saying “0.0000025”, it is easier to say “-5.6”, which is the logarithm of 0.0000025. Logarithms are exponents. Logs to the base 10, which are most commonly used, are the exponents that would raise 10 to the number in question. For example, 10-5.6 = 0.0000025. You can determine Logs of any given number using tables or spreadsheet programs like Excel. In Excel, just enter “=log(x)”, x being the number that you need a Log of.
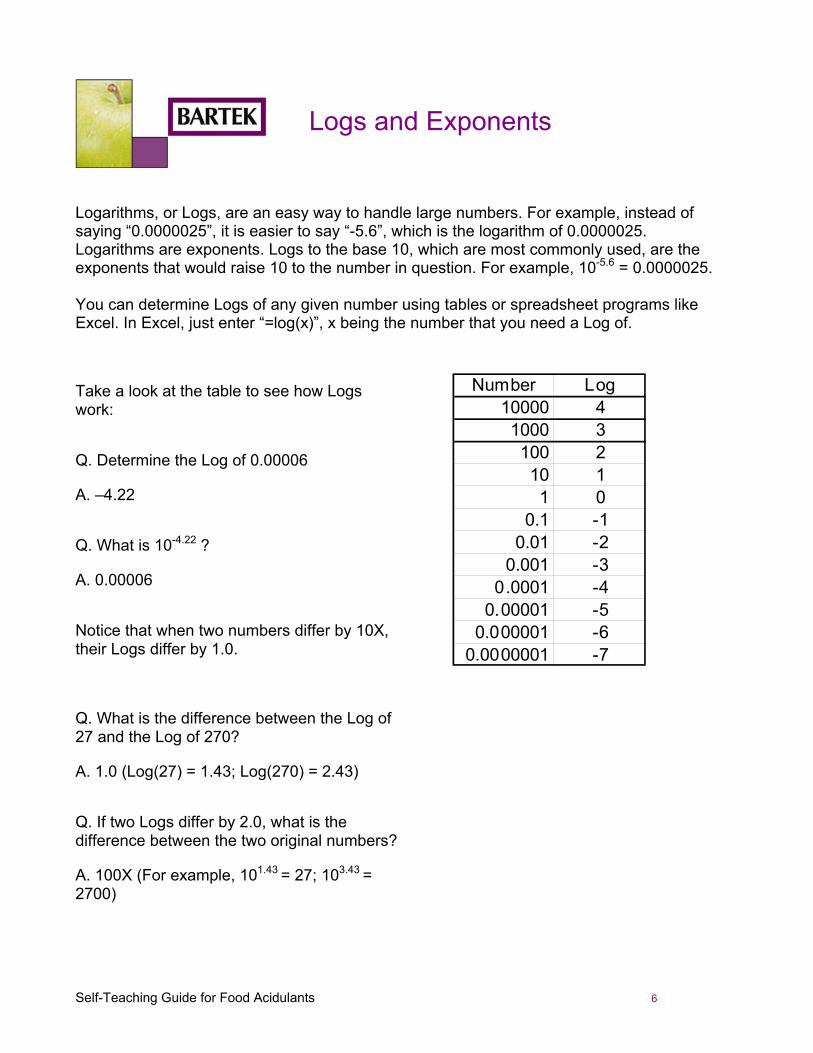
Take a look at the table to see how Logs work:
Q. Determine the Log of 0.00006
A. –4.22
Q. What is 10-4.22 ?
A. 0.00006
Notice that when two numbers differ by 10X, their Logs differ by 1.0.
Number Log10000 41000 3100 210 11 0
0.1 -10.01 -2
0.001 -30.0001 -4
0.00001 -50.000001 -6
0.0000001 -7
Q. What is the difference between the Log of 27 and the Log of 270?
A. 1.0 (Log(27) = 1.43; Log(270) = 2.43)
Q. If two Logs differ by 2.0, what is the difference between the two original numbers?
A. 100X (For example, 101.43 = 27; 103.43 = 2700)
Self-Teaching Guide for Food Acidulants 7
What is pH?
The pH is just another way of stating the molar concentration of hydrogen ions. It is the negative log of the molar concentration of hydrogen ions.
For example, if the hydrogen ion concentration is 0.000025M, then the pH would be 4.6 (log(0.000025) = -4.6). It is much more convenient to say “4.6” than “0.000025”.
To convert back to the hydrogen ion concentration, use 10-pH. For example, 10-4.6 = 0.000025.
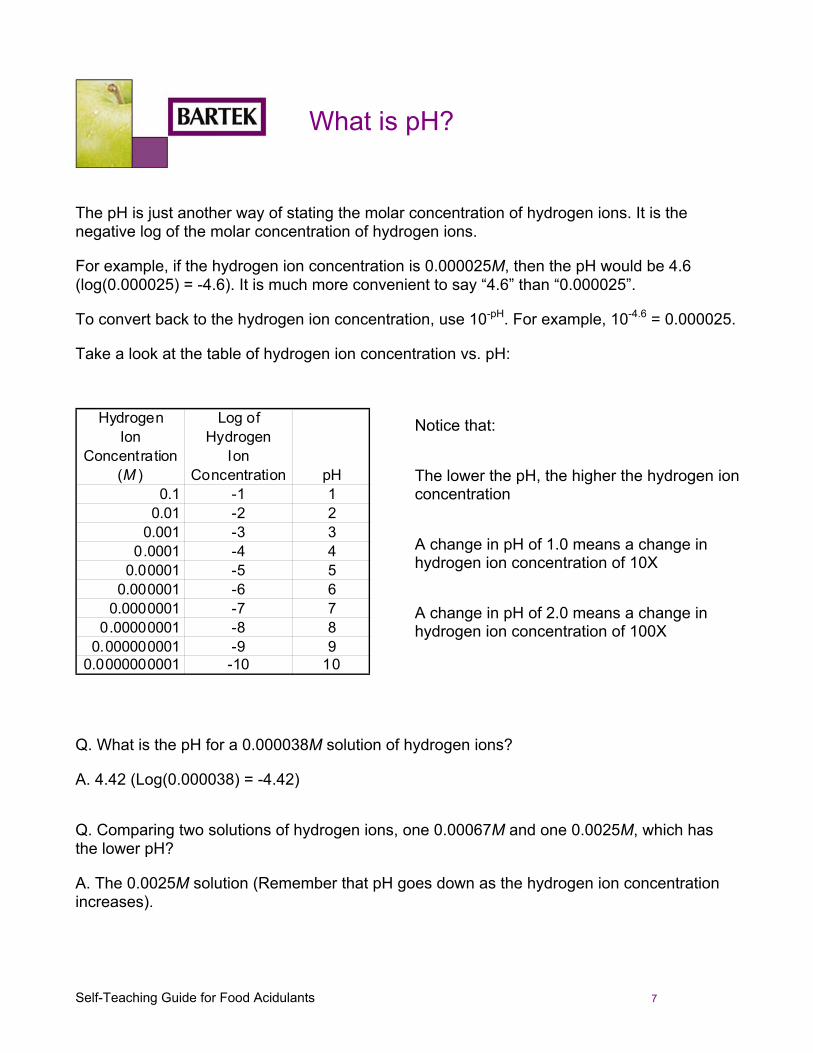
Take a look at the table of hydrogen ion concentration vs. pH:
HydrogenIon
Concentration(M )
Log ofHydrogen
IonConcentration pH
0.1 -1 10.01 -2 2
0.001 -3 30.0001 -4 4
0.00001 -5 50.000001 -6 6
0.0000001 -7 70.00000001 -8 8
0.000000001 -9 90.0000000001 -10 10
Notice that:
The lower the pH, the higher the hydrogen ion concentration
A change in pH of 1.0 means a change in hydrogen ion concentration of 10X
A change in pH of 2.0 means a change in hydrogen ion concentration of 100X
Q. What is the pH for a 0.000038M solution of hydrogen ions?
A. 4.42 (Log(0.000038) = -4.42)
Q. Comparing two solutions of hydrogen ions, one 0.00067M and one 0.0025M, which has the lower pH?
A. The 0.0025M solution (Remember that pH goes down as the hydrogen ion concentration increases).
Self-Teaching Guide for Food Acidulants 8
What is an Acid?
An acid is a substance that releases hydrogen ions in solution.
What happens when the concentration of hydrogen ions goes up? The pH goes down.
When an acid is added to a solution, the pH will go down (assuming no other changes are made) because the acid releases hydrogen ions in solution.
Why do acids taste sour? Human saliva has a pH of about 6.8. When we eat or drink products that contain acids, these acids lower the pH of the saliva and interact with sour taste receptor cells in the mouth. Signals are sent from the mouth to the brain and these signals are interpreted as “sourness”.
Most fruits naturally contain acids such as Citric Acid, Malic Acid, Tartaric Acid, and Ascorbic Acid. These acids are essential for the authentic flavor profile of the fruit. Without them, the fruit would not taste like fruit. Imagine orange juice with no sourness.
What are acids used for other than to provide sourness? Some other applications are listed below:
To modify and enhance flavor
To lower pH in order to retard microbial growth
To lower pH in order to gel products containing pectin
To improve the texture and machinability of tortillas
To increase buffer capacity
To sustain Malolactic fermentation – the conversion of Malic Acid to Lactic Acid
As you can see, there are many different applications. However, the most important applications are to provide sourness and improve flavor.
Self-Teaching Guide for Food Acidulants 9
The Dissociation Constant, Ka, pKa
How do we compare acids? How do we know which acid to use? Aside from flavor differences, we can compare acid strengths by using the dissociation constant. A strong acid, like Nitric Acid, releases a lot of hydrogen atoms into solution. If you spill a strong acid on your skin, you would get a chemical burn.
A weak acid, like Acetic Acid, does not release a lot of hydrogen ions in solution. Vinegar contains about 5% Acetic Acid and is edible.
By using the dissociation constant, we can predict some acid properties like the acid level required to lower pH to a given value. This saves time in the development of new food and beverage products.
What is dissociation? Just a fancy word for the release of hydrogen ions. For example, when Acetic Acid releases hydrogen ions, or dissociates, what’s left is the Acetate ion. The process of dissociation changes the form of the acid to what is known as the dissociated, or ionized form.
The dissociation constant, Ka, is a measure of how strong an acid is. The higher the dissociation constant, the stronger the acid. For example, Acetic Acid has a Ka of 0.00001754 and is a weakly dissociated acid. As shown in the following formula, the dissociation constant equals the hydrogen ion concentration multiplied by the Acetate ion concentration divided by the concentration of Acetic Acid. The use of square brackets indicates molar concentration. For example, [Acetic Acid] is the molar concentration of Acetic Acid.
[ ][ ]a
H Acetate ionK 0.00001754
Acetic Acid
+ = =
As shown in the formula, when Acetic Acid is added to water, very little of it converts to hydrogen ion and Acetate ion. Most of it stays in its original form. We can calculate that, in a 0.02M solution of Acetic Acid, 97.1% of it does not dissociate but stays in its original form. 2.9% of it releases a hydrogen ion and in the process, is converted to an Acetate ion.
The dissociation constant, Ka, has been determined experimentally for most acids. Because this number is a constant, we can use it to make predictions about the acid in question.
Self-Teaching Guide for Food Acidulants 10
The Dissociation Constant, Ka, pKa (cont’d)
A strong acid like Nitric Acid, on the other hand, is mostly converted to hydrogen ions and nitrate ions, as indicated by its large dissociation constant.
[ ][ ]a
H Nitrate ionK 20
Nitric Acid
+ ≅ =
When we add Nitric Acid to water, most of it ends up as a combination of hydrogen ions and Nitrate ions.
A solution of a strong acid would usually have a lower pH than a solution of a weak acid because there are more hydrogen ions released by the strong acid.
Most food acidulants are weak acids like Acetic Acid. It turns out that the undissociated form of these acids is very important in the sourness sensation.
What is the pKa? The pKa of an acid is the negative log of its dissociation constant. For example, if the dissociation constant of an acid is 0.00056, then the pKa is the negative log of 0.00056, or 3.25. To convert back to Ka, the dissociation constant, use 10-pKa. The lower the pKa, the larger the Ka. This works just like the pH – hydrogen ion concentration relationship. In that case, the lower the pH, the higher the hydrogen ion concentration. In the case of Acetic Acid, the pKa is the negative log of 0.00001754, or 4.76.
Q. Acetic Acid has a pKa of 4.76. Lactic Acid has a pKa of 3.86. Which is the stronger acid?
A. Lactic Acid is stronger because it has a lower pKa.
Q. Two different acids are dissolved in water so that they have the same molar concentration – in other words, the same number of molecules of each acid. Acid solution #1 has a pH of 2.25. Acid solution #2 has a pH of 3.68. Which acid is stronger? Which acid has the lowest pKa?
A. Acid #1 is stronger and has the lowest pKa because it releases more hydrogen ions in solution and ends up with the lowest pH.
Self-Teaching Guide for Food Acidulants 11
The Dissociation Constant, Ka, pKa (cont’d)
Before discussing the prediction of acid strength by using dissociation constants, it is important to point out that some acids release more than one hydrogen ion. Malic and Fumaric Acids, for example, release two hydrogen ions. In this case, we have two separate dissociation constants, Ka1 and Ka2. The pKa1 for Malic Acid is 3.40 and the pKa2 is 5.11.
Monoprotic acids release only one hydrogen ion. Acetic Acid, Lactic Acid, and Sodium Acid Sulfate are all monoprotic acids.
Diprotic acids release two hydrogen ions. Fumaric Acid, Malic Acid, and Tartaric Acid are all diprotic acids.
Triprotic acids release three hydrogen ions. Citric Acid and Phosphoric Acid are both triprotic acids.
Self-Teaching Guide for Food Acidulants 12
Introduction to Section B. Acidulant Selection
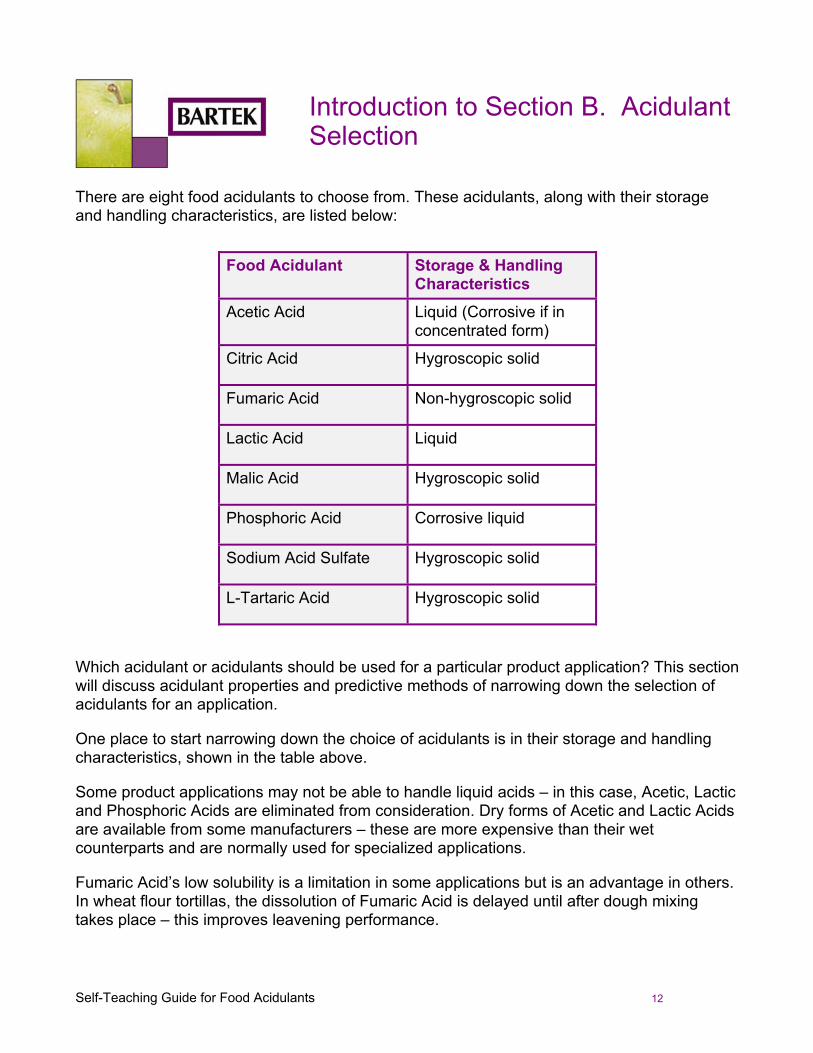
There are eight food acidulants to choose from. These acidulants, along with their storage and handling characteristics, are listed below:
Food Acidulant Storage & Handling
Characteristics
Acetic Acid Liquid (Corrosive if in concentrated form)
Citric Acid Hygroscopic solid
Fumaric Acid Non-hygroscopic solid
Lactic Acid Liquid
Malic Acid Hygroscopic solid
Phosphoric Acid Corrosive liquid
Sodium Acid Sulfate Hygroscopic solid
L-Tartaric Acid Hygroscopic solid
Which acidulant or acidulants should be used for a particular product application? This section will discuss acidulant properties and predictive methods of narrowing down the selection of acidulants for an application.
One place to start narrowing down the choice of acidulants is in their storage and handling characteristics, shown in the table above.
Some product applications may not be able to handle liquid acids – in this case, Acetic, Lactic and Phosphoric Acids are eliminated from consideration. Dry forms of Acetic and Lactic Acids are available from some manufacturers – these are more expensive than their wet counterparts and are normally used for specialized applications.
Fumaric Acid’s low solubility is a limitation in some applications but is an advantage in others. In wheat flour tortillas, the dissolution of Fumaric Acid is delayed until after dough mixing takes place – this improves leavening performance.
Self-Teaching Guide for Food Acidulants 13
Introduction to Section B. Acidulant Selection (cont’d)
For beverage dry mixes, the non-hygroscopic nature of Fumaric Acid is an advantage, allowing more economical packaging material to be used. Cold-water-soluble Fumaric Acid would be normally used for this application.
In most product applications, we can choose from a number of acidulants.
As mentioned earlier in “What is an Acid?”, acidulants function in food and beverage products to:
Provide sourness
Modify and enhance flavor
Lower pH in order to retard microbial growth
Lower pH in order to gel products containing pectin
Increase buffer capacity
Improve the texture and machinability of tortillas
Sustain Malolactic fermentation – the conversion of Malic Acid to Lactic Acid
The last two functions, tortillas and Malolactic fermentation, are discussed elsewhere in the Bartek web site. See http://www.bartek.on.ca/app_bakery_tortillas.html for information on tortilla applications and http://www.bartek.on.ca/app_beverages_alcoholic.html for information on Malolactic fermentation.
The lowering of pH function is discussed in Acid Strength, following this chapter. The other functions; sourness, buffer capacity, and flavor effects, are discussed in individual chapters but are all related to Acid Strength. Acid Strength; that is, how much acid has to be added to lower the pH to the target pH, is a major factor in determining the impact of the other three acidulant properties simply because they all depend on acid level.
Self-Teaching Guide for Food Acidulants 14
Acid Strength
Before comparing acidulants as to sourness, buffer capacity, and flavor effects, the first step is to estimate the level of each acidulant in the system under consideration. This is done first since the other properties depend on the acid level.
It is possible to calculate the acid level required to lower the pH of a model system to a specific value. This is simply another way of measuring acid strength. This acid strength value will be different for each acid – the weaker the acid, the higher the level required to lower the pH. The model system is chosen to be similar in ionic strength and basic strength to the product under consideration.
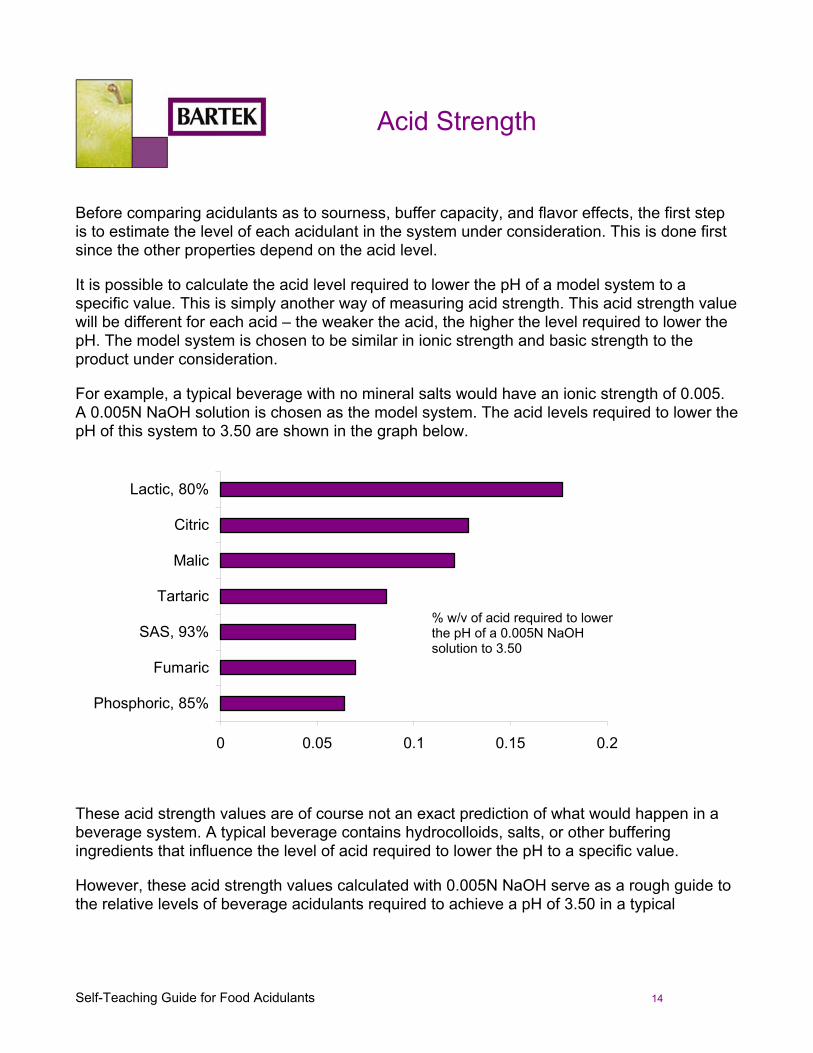
For example, a typical beverage with no mineral salts would have an ionic strength of 0.005. A 0.005N NaOH solution is chosen as the model system. The acid levels required to lower the pH of this system to 3.50 are shown in the graph below.
0 0.05 0.1 0.15 0.2
Phosphoric, 85%
Fumaric
SAS, 93%
Tartaric
Malic
Citric
Lactic, 80%
These acid strength values are of course not an exact prediction of what would happen in a beverage system. A typical beverage contains hydrocolloids, salts, or other buffering ingredients that influence the level of acid required to lower the pH to a specific value.
However, these acid strength values calculated with 0.005N NaOH serve as a rough guide to the relative levels of beverage acidulants required to achieve a pH of 3.50 in a typical
% w/v of acid required to lower the pH of a 0.005N NaOH solution to 3.50
Self-Teaching Guide for Food Acidulants 15
Acid Strength (cont’d)
beverage system. We can see right away that almost three times as much Lactic Acid is required as Phosphoric Acid. There would be more impact in sourness, buffer capacity, and flavor from Lactic Acid than from Phosphoric Acid simply because there would be a much higher level of Lactic Acid.
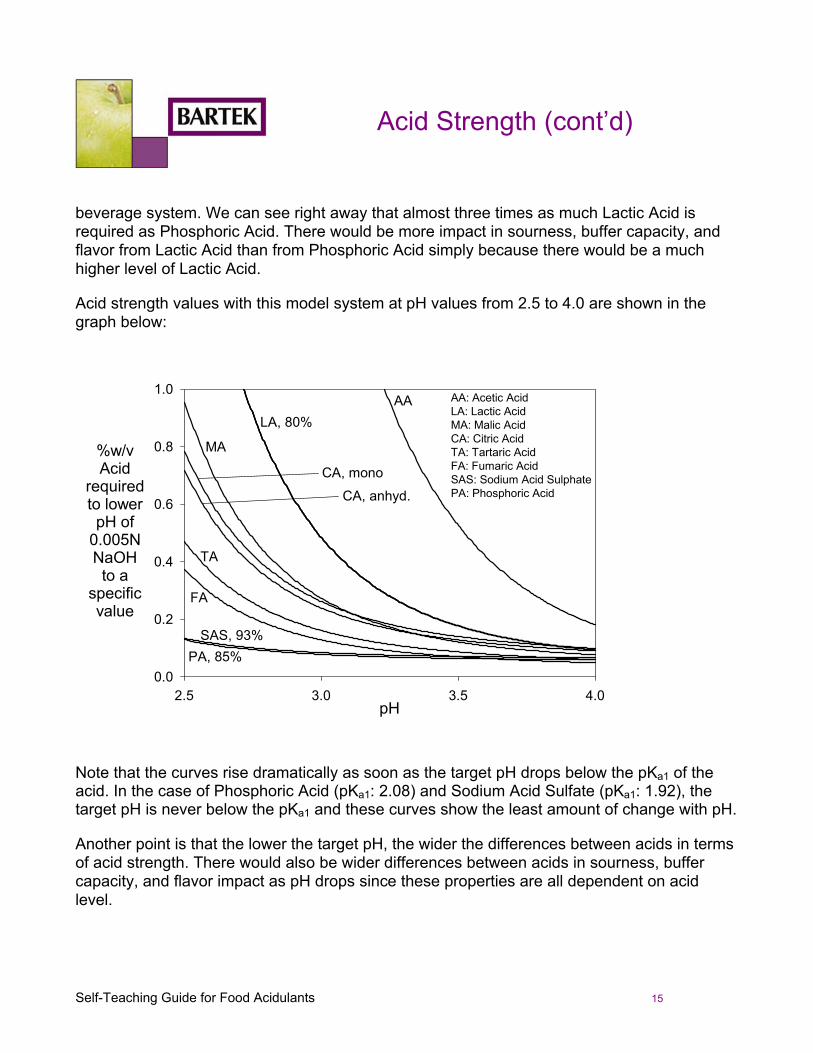
Acid strength values with this model system at pH values from 2.5 to 4.0 are shown in the graph below:
2.5 3.0 3.5 4.00.0
0.2
0.4
0.6
0.8
1.0 AA: Acetic AcidLA: Lactic AcidMA: Malic AcidCA: Citric AcidTA: Tartaric AcidFA: Fumaric AcidSAS: Sodium Acid SulphatePA: Phosphoric Acid
pH
%w/vAcid
requiredto lowerpH of
0.005NNaOH
to aspecificvalue
LA, 80%
MA
TA
FA
PA, 85%SAS, 93%
CA, monoCA, anhyd.
AA
Note that the curves rise dramatically as soon as the target pH drops below the pKa1 of the acid. In the case of Phosphoric Acid (pKa1: 2.08) and Sodium Acid Sulfate (pKa1: 1.92), the target pH is never below the pKa1 and these curves show the least amount of change with pH.
Another point is that the lower the target pH, the wider the differences between acids in terms of acid strength. There would also be wider differences between acids in sourness, buffer capacity, and flavor impact as pH drops since these properties are all dependent on acid level.

Self-Teaching Guide for Food Acidulants 16
Acid Strength (cont’d)
If we are interested in comparing acidulants to be used in tortillas, then it is useful to look at the level of acid required to lower the pH of 0.05N NaOH to 5.50, since 5.50 is usually the target pH in tortillas:
0.2 0.3 0.4 0.5 0.6
Fumaric
Acetic
Malic
L-Tartaric
Citric, anhyd.
Phosphoric, 85%
Lactic, 80%
Right away we can see that less Fumaric Acid is required than any of the other acids. One of the reasons that Fumaric Acid is preferred in tortillas is that it is stronger than all other food acidulants at pH 5.50. Therefore, less is required. This means that there would be less sourness and flavor impact from Fumaric Acid simply because its level of use is lower. The acidulant cost is also lower for this reason.
Note that the relative order among acids changes depending on the target pH. At pH 3.50, Phosphoric Acid was the strongest acid. At pH 5.50, it is weaker than most other acids. The acid strength at various pHs is determined by the relationship between the target pH and the pKa values of the acid, as will be explained later. Each acidulant has a unique set of pKa values and therefore a unique acid strength vs. pH curve. These curves change relative position depending on the pH, as shown in the graph on page 15. In that graph, It is possible to see the Malic Acid curve drop below the Citric Acid curve at about pH 3.40. Above this pH, Malic Acid is slightly stronger than Citric Acid, meaning less is required to lower the pH to a specific value.
%w/v of acid required to lower the pH of 0.05N NaOH to 5.50
Self-Teaching Guide for Food Acidulants 17
Acid Strength (cont’d)
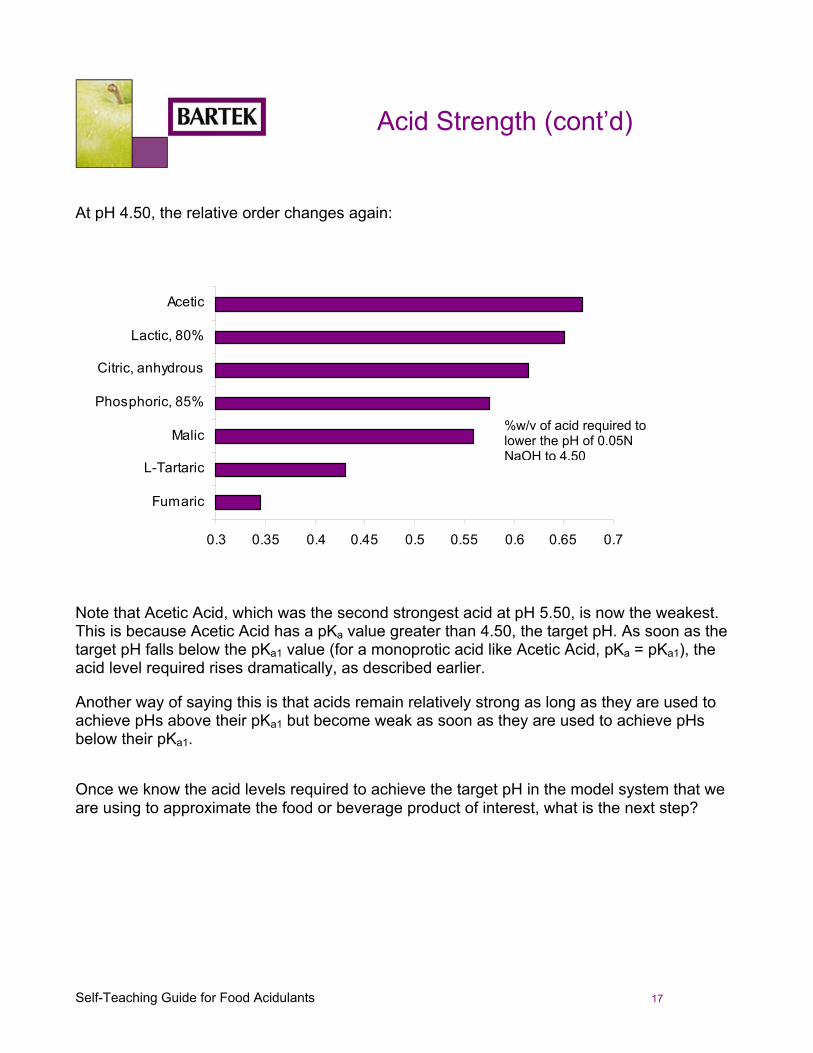
At pH 4.50, the relative order changes again:
0.3 0.35 0.4 0.45 0.5 0.55 0.6 0.65 0.7
Fumaric
L-Tartaric
Malic
Phosphoric, 85%
Citric, anhydrous
Lactic, 80%
Acetic
Note that Acetic Acid, which was the second strongest acid at pH 5.50, is now the weakest. This is because Acetic Acid has a pKa value greater than 4.50, the target pH. As soon as the target pH falls below the pKa1 value (for a monoprotic acid like Acetic Acid, pKa = pKa1), the acid level required rises dramatically, as described earlier.
Another way of saying this is that acids remain relatively strong as long as they are used to achieve pHs above their pKa1 but become weak as soon as they are used to achieve pHs below their pKa1.
Once we know the acid levels required to achieve the target pH in the model system that we are using to approximate the food or beverage product of interest, what is the next step?
%w/v of acid required to lower the pH of 0.05N NaOH to 4.50
Self-Teaching Guide for Food Acidulants 18
Acid Strength (cont’d)
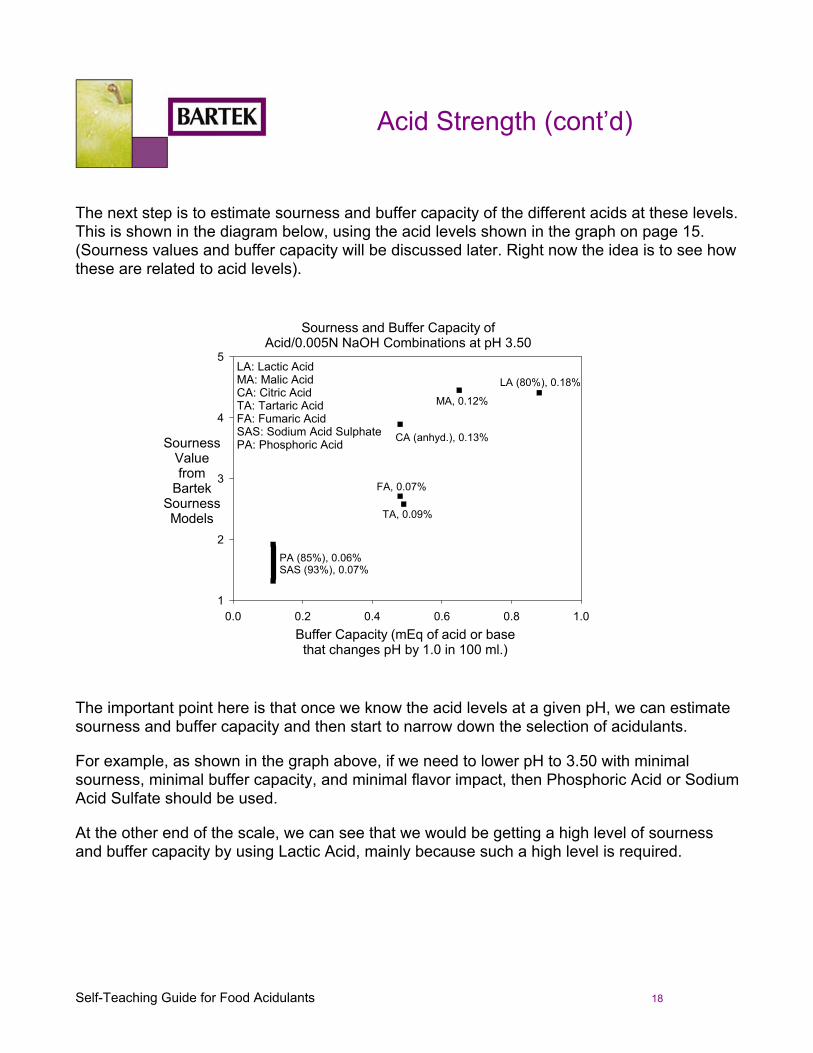
The next step is to estimate sourness and buffer capacity of the different acids at these levels. This is shown in the diagram below, using the acid levels shown in the graph on page 15. (Sourness values and buffer capacity will be discussed later. Right now the idea is to see how these are related to acid levels).
LA: Lactic AcidMA: Malic AcidCA: Citric AcidTA: Tartaric AcidFA: Fumaric AcidSAS: Sodium Acid SulphatePA: Phosphoric Acid
0.0 0.2 0.4 0.6 0.8 1.01
2
3
4
5
Buffer Capacity (mEq of acid or basethat changes pH by 1.0 in 100 ml.)
SournessValuefrom
BartekSournessModels
LA (80%), 0.18%
MA, 0.12%
CA (anhyd.), 0.13%
FA, 0.07%
TA, 0.09%
PA (85%), 0.06%SAS (93%), 0.07%
LA: Lactic AcidMA: Malic AcidCA: Citric AcidTA: Tartaric AcidFA: Fumaric AcidSAS: Sodium Acid SulphatePA: Phosphoric Acid
Sourness and Buffer Capacity ofAcid/0.005N NaOH Combinations at pH 3.50
The important point here is that once we know the acid levels at a given pH, we can estimate sourness and buffer capacity and then start to narrow down the selection of acidulants.
For example, as shown in the graph above, if we need to lower pH to 3.50 with minimal sourness, minimal buffer capacity, and minimal flavor impact, then Phosphoric Acid or Sodium Acid Sulfate should be used.
At the other end of the scale, we can see that we would be getting a high level of sourness and buffer capacity by using Lactic Acid, mainly because such a high level is required.
Self-Teaching Guide for Food Acidulants 19
Acid Strength Calculations
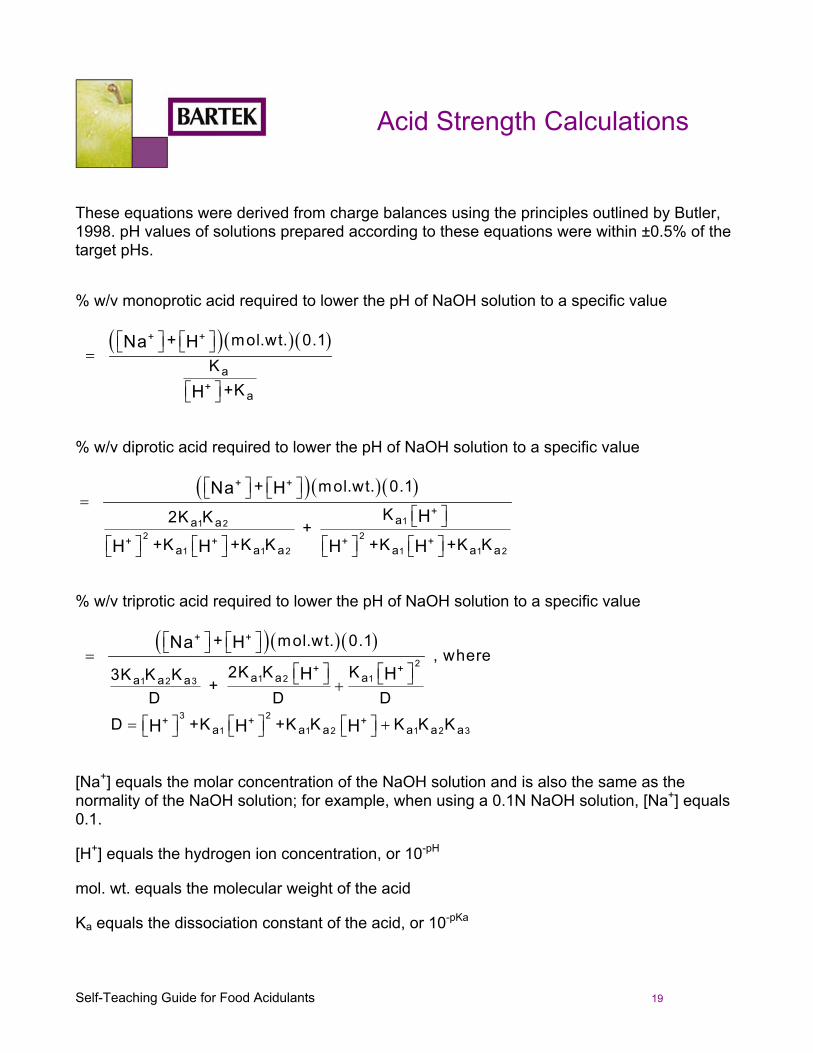
These equations were derived from charge balances using the principles outlined by Butler, 1998. pH values of solutions prepared according to these equations were within ±0.5% of the target pHs.
% w/v monoprotic acid required to lower the pH of NaOH solution to a specific value
( )( )( ) =
+ +
+a
a
+ mol.wt. 0.1
K+K
Na H
H
% w/v diprotic acid required to lower the pH of NaOH solution to a specific value
( )( )( )11 2
2 21 1 2 1 1 2
+ +
+
+ + + +
aa a
a a a a a a
+ mol.wt. 0.1
K2K K +
+K +K K +K +K K
Na HH
H H H H
=
% w/v triprotic acid required to lower the pH of NaOH solution to a specific value
( )( )( ) = +
= +
21 2 11 2 3
3 21 1 2 1 2 3
+ +
+ +
+ + +
a a aa a a
a a a a a a
+ mol.wt. 0.1 , where
2K K K3K K K +
D D D D +K +K K K K K
Na H
H H
H H H
[Na+] equals the molar concentration of the NaOH solution and is also the same as the normality of the NaOH solution; for example, when using a 0.1N NaOH solution, [Na+] equals 0.1.
[H+] equals the hydrogen ion concentration, or 10-pH
mol. wt. equals the molecular weight of the acid
Ka equals the dissociation constant of the acid, or 10-pKa
Self-Teaching Guide for Food Acidulants 20
Acid Strength Calculations (cont’d)
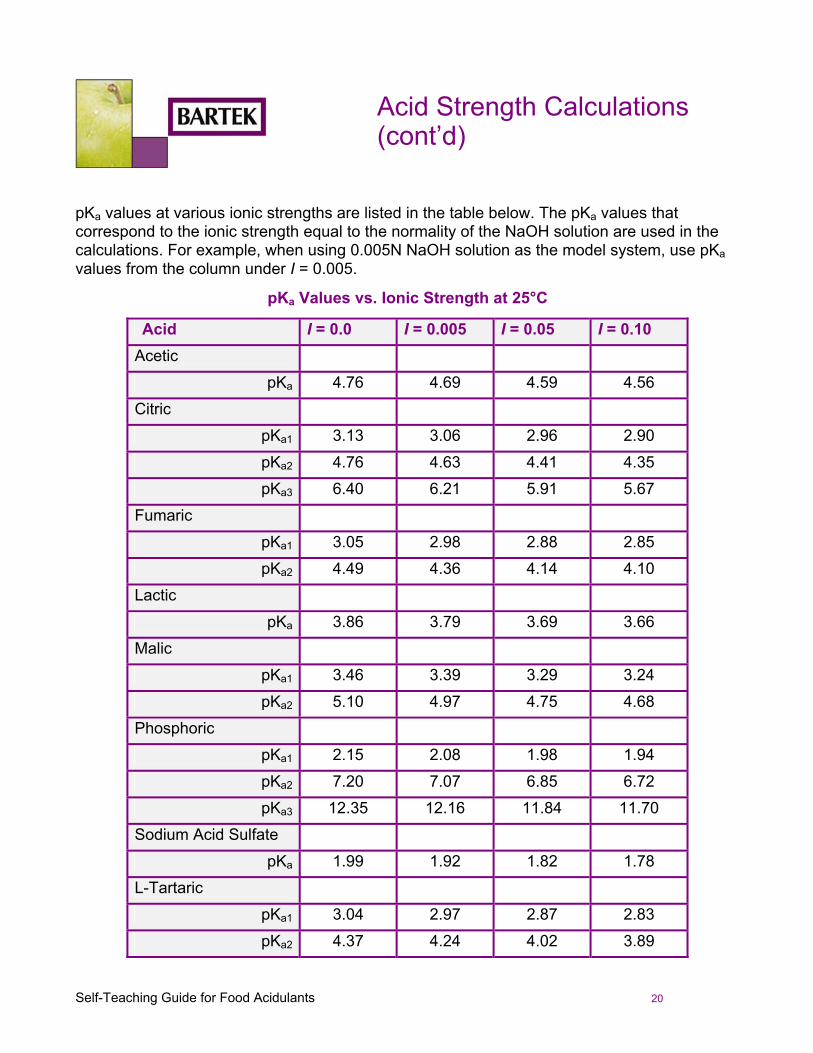
pKa values at various ionic strengths are listed in the table below. The pKa values that correspond to the ionic strength equal to the normality of the NaOH solution are used in the calculations. For example, when using 0.005N NaOH solution as the model system, use pKa values from the column under I = 0.005.
pKa Values vs. Ionic Strength at 25°C
Acid I = 0.0 I = 0.005 I = 0.05 I = 0.10 Acetic pKa 4.76 4.69 4.59 4.56 Citric pKa1 3.13 3.06 2.96 2.90 pKa2 4.76 4.63 4.41 4.35 pKa3 6.40 6.21 5.91 5.67 Fumaric pKa1 3.05 2.98 2.88 2.85 pKa2 4.49 4.36 4.14 4.10 Lactic pKa 3.86 3.79 3.69 3.66 Malic pKa1 3.46 3.39 3.29 3.24 pKa2 5.10 4.97 4.75 4.68 Phosphoric pKa1 2.15 2.08 1.98 1.94 pKa2 7.20 7.07 6.85 6.72 pKa3 12.35 12.16 11.84 11.70 Sodium Acid Sulfate pKa 1.99 1.92 1.82 1.78 L-Tartaric pKa1 3.04 2.97 2.87 2.83 pKa2 4.37 4.24 4.02 3.89
Self-Teaching Guide for Food Acidulants 21
Buffer Capacity
A buffer is a partially neutralized acid that resists changes in pH. Typical buffer salts used in food and beverage applications include Sodium Citrate and Sodium Lactate.
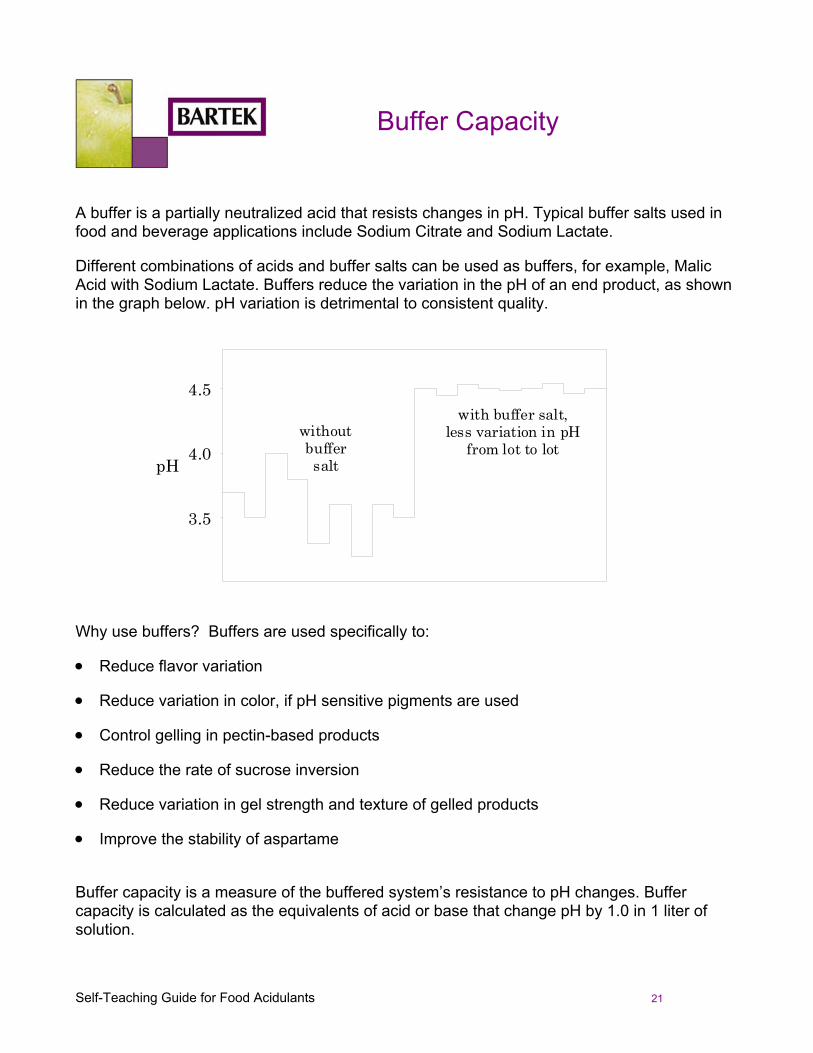
Different combinations of acids and buffer salts can be used as buffers, for example, Malic Acid with Sodium Lactate. Buffers reduce the variation in the pH of an end product, as shown in the graph below. pH variation is detrimental to consistent quality.
3.5
4.0
4.5
pH
withoutbuffersalt
with buffer salt,less variation in pH
from lot to lot
Why use buffers? Buffers are used specifically to:
• Reduce flavor variation
• Reduce variation in color, if pH sensitive pigments are used
• Control gelling in pectin-based products
• Reduce the rate of sucrose inversion
• Reduce variation in gel strength and texture of gelled products
• Improve the stability of aspartame
Buffer capacity is a measure of the buffered system’s resistance to pH changes. Buffer capacity is calculated as the equivalents of acid or base that change pH by 1.0 in 1 liter of solution.
Self-Teaching Guide for Food Acidulants 22
Buffer Capacity (cont’d)
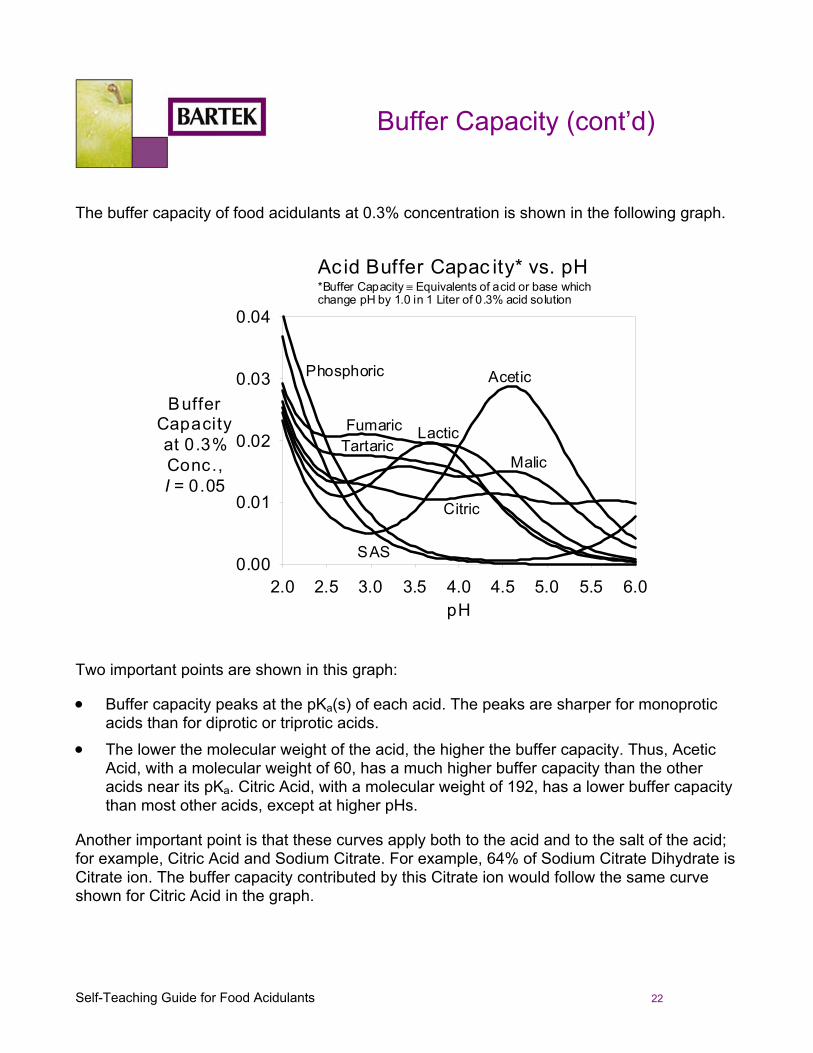
The buffer capacity of food acidulants at 0.3% concentration is shown in the following graph.
Ac id Buffer Capac ity* vs. pH
pH2.0 2.5 3.0 3.5 4.0 4.5 5.0 5.5 6.0
BufferCapacityat 0.3%Conc.,I = 0.05
0.00
0.01
0.02
0.03
0.04
Malic
Citric
Lactic
*Buffer Capacity ≡ Equivalents of acid or base whichchange pH by 1.0 in 1 Liter of 0.3% acid solution
FumaricTartaric
Phosphoric
SAS
Acetic
Two important points are shown in this graph:
• Buffer capacity peaks at the pKa(s) of each acid. The peaks are sharper for monoprotic acids than for diprotic or triprotic acids.
• The lower the molecular weight of the acid, the higher the buffer capacity. Thus, Acetic Acid, with a molecular weight of 60, has a much higher buffer capacity than the other acids near its pKa. Citric Acid, with a molecular weight of 192, has a lower buffer capacity than most other acids, except at higher pHs.
Another important point is that these curves apply both to the acid and to the salt of the acid; for example, Citric Acid and Sodium Citrate. For example, 64% of Sodium Citrate Dihydrate is Citrate ion. The buffer capacity contributed by this Citrate ion would follow the same curve shown for Citric Acid in the graph.
Self-Teaching Guide for Food Acidulants 23
Buffer Capacity (cont’d)
How can this buffer capacity graph be used in the selection of acidulants? Primarily in the selection of acidulants (or buffer salts) for greater buffer capacity. For example, if we developing a buffered system with a pH between 3.0 and 4.7, by looking at this graph we can see that Lactic Acid (or Lactate) would have a higher buffer capacity than Citric Acid (or Citrate) at the same concentration.
Some other important aspects of buffers that would affect acidulant selection are: • More sourness results when using acids and buffer salts from different acids; for
example, Malic Acid with Sodium Citrate as opposed to Citric Acid with Sodium Citrate. This is due to a sourness additive effect between acidulants, discussed in the next chapter.
• The ratio between the acid and the buffer salt determines the pH of the buffer system. Sourness and buffer capacity both increase as levels of acid and buffer salt increase at a constant ratio.
This is shown in the following set of samples:
Sample Formulation pH Buffer Capacity
Sourness Value
A 0.12% Citric Acid 0.03% Sodium Citrate
3.06 0.00644 4.46
B 0.16% Citric Acid 0.04% Sodium Citrate
3.03 0.00806 5.47
In this case, the levels of the acid and buffer salt were both increased by 33%. Therefore, the ratio between the acid level and the buffer salt ratio remains the same. As a result, the pH stays about the same (slightly lower due to the increase in ionic strength). However, buffer capacity and sourness both increase.
Therefore, if we are working on a buffered system and need to increase sourness and/or buffer capacity, there are two possible approaches:
• Replace the acid and/or buffer salt with an acid and/or buffer salt that have more sourness per unit weight at the pH in question (sourness vs. pH will be discussed in the next chapter).
• Increase the levels of acid and buffer salt by the same proportion, maintaining the same ratio between them.
Self-Teaching Guide for Food Acidulants 24
Buffer Capacity (cont’d)
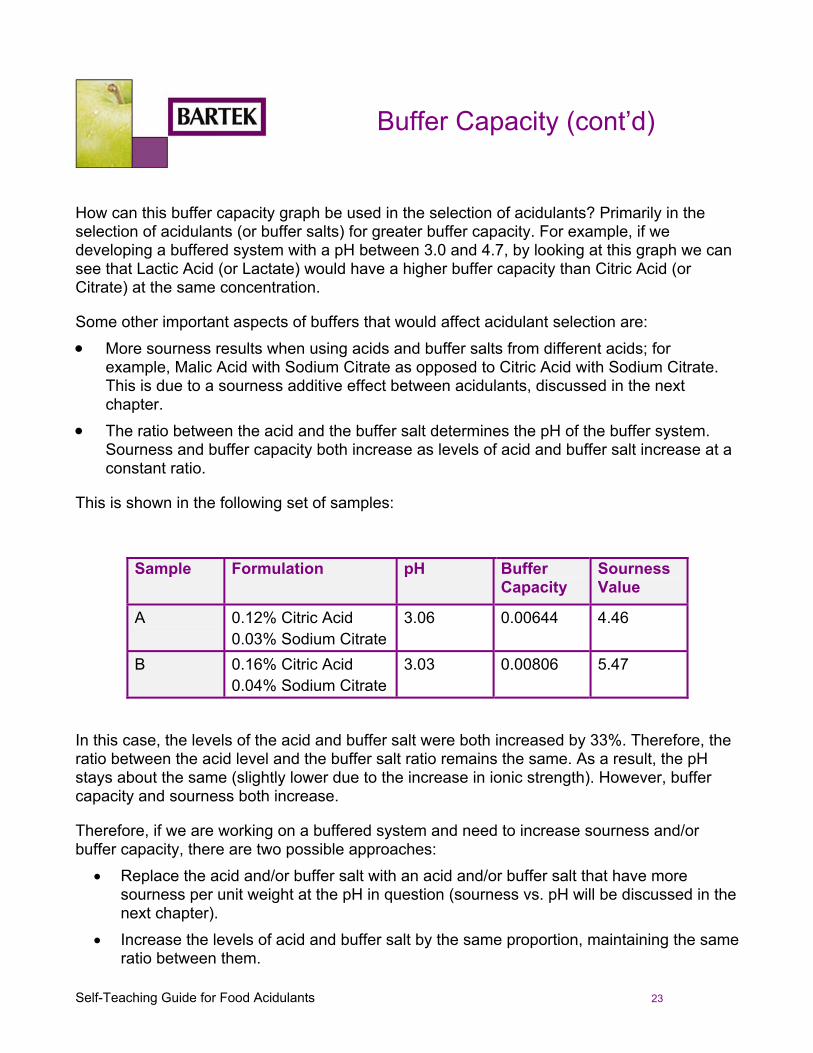
Going back to the diagram that showed buffer capacity at pH 3.50 for various acidulants,
LA: Lactic AcidMA: Malic AcidCA: Citric AcidTA: Tartaric AcidFA: Fumaric AcidSAS: Sodium Acid SulphatePA: Phosphoric Acid
0.0 0.2 0.4 0.6 0.8 1.01
2
3
4
5
Buffer Capacity (mEq of acid or basethat changes pH by 1.0 in 100 ml.)
SournessValuefrom
BartekSournessModels
LA (80%), 0.18%
MA, 0.12%
CA (anhyd.), 0.13%
FA, 0.07%
TA, 0.09%
PA (85%), 0.06%SAS (93%), 0.07%
LA: Lactic AcidMA: Malic AcidCA: Citric AcidTA: Tartaric AcidFA: Fumaric AcidSAS: Sodium Acid SulphatePA: Phosphoric Acid
Sourness and Buffer Capacity ofAcid/0.005N NaOH Combinations at pH 3.50
it is possible to see that Fumaric Acid at 0.07% and Tartaric Acid at 0.09% have about the same buffer capacity as Citric Acid at 0.13%. This would be a consideration in acidulant selection if the priority was buffer capacity.
Self-Teaching Guide for Food Acidulants 25
Sourness
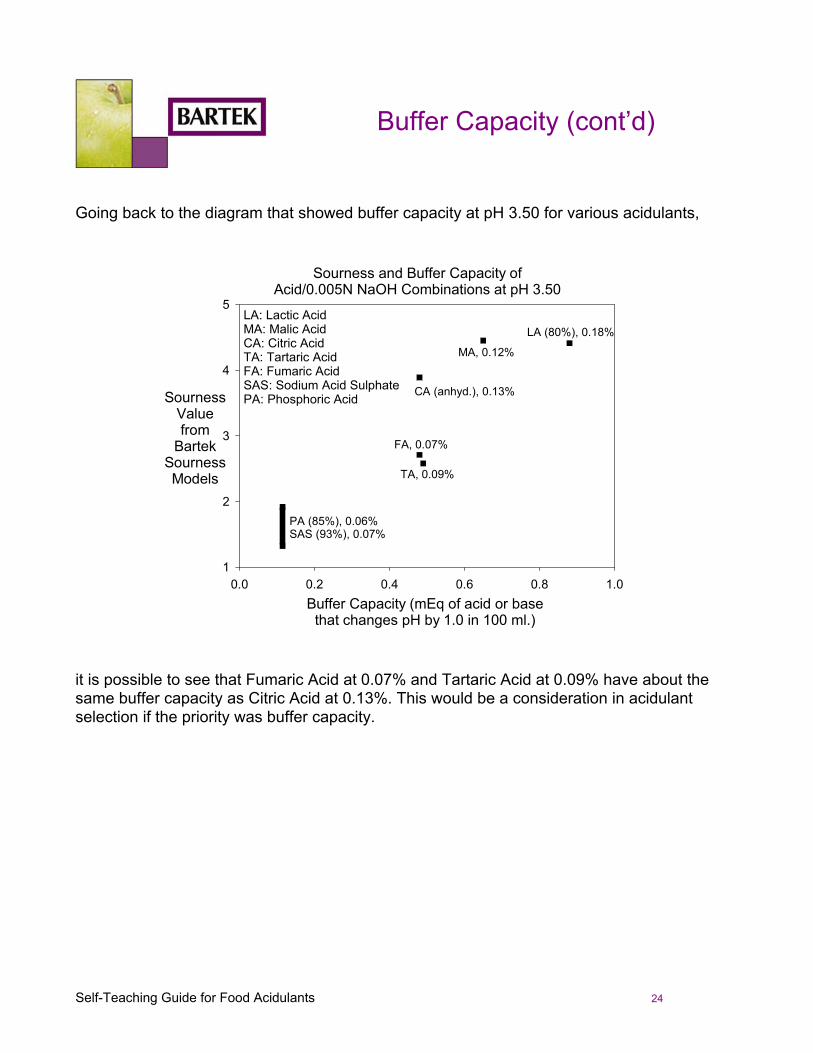
There are three factors that determine the level of sourness – the specific acid used, the pH of the food or beverage in which the acid is used, and the concentration of the acid.
As can be seen in the graph below, acids change in relative sourness with pH. For example, at pH 3.0, Malic Acid provides significantly more sourness than Citric Acid. However, at pH 4.7, they both provide the same level of sourness per unit weight. What are some other conclusions we can draw from this graph?
pH3.0 3.5 4.0 4.5 5.0
0
4
8 Fumaric
MalicCitric
Lactic
Tartaric
EstimatedSourness(units from
ratio scales ofH.Moskowitz
(1971))Sourness models fitted to sensorydata at pH 3.5, 0.4-0.7% acid(Noble et al., 1986),and at pH 3.5, 4.5, 0.2% acid(Hartwig & McDaniel, 1995) I = 0.005
Acetic
Sourness of Acids at 0.2% w/v vs. pH
We can see that:
• In every case, sourness increases as pH decreases. Since we know that acids release hydrogen ions in solution and that this results in a decrease in pH, we can also say that if an acid is added or if the acid level is increased, then sourness would increase (assuming that no other changes take place). The reverse is also true – sourness decreases if the pH is increased (assuming that no other changes take place).
• If we know the pH of the food or beverage that is being formulated, then we can select acids for more or less sourness. The most sour acid at one pH may be the least sour acid at another pH – see Citric Acid at pH 5.0 and then at pH 3.0.
Self-Teaching Guide for Food Acidulants 26
Sourness (cont’d)
Some other important points:
The graph on the previous page is useful up to a point as a guide to relative differences in sourness. If we replace 0.2% Citric Acid with 0.2% Malic Acid at pH 4.7, sourness would remain the same according to the graph. Does this mean that the product would taste the same? NO, because each acid has its own specific flavor effects. Flavor effects are discussed in the next chapter.
Salts of organic acids, like Sodium Citrate, also contribute sourness depending on the pH. For example, 64% of Sodium Citrate Dihydrate is Citrate ion. The sourness contributed by this Citrate ion would follow the same curve shown for Citric Acid in the graph. No matter whether the starting point is Citric Acid or Citrate ion, the sourness is the same at the same pH.
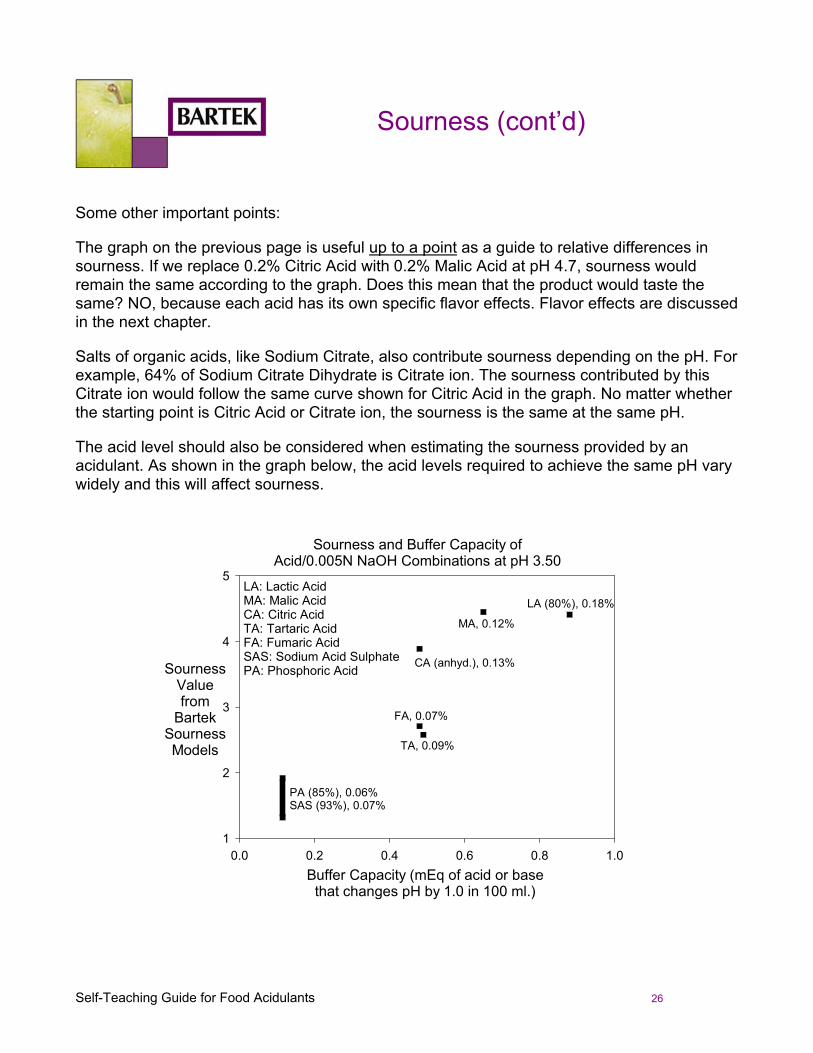
The acid level should also be considered when estimating the sourness provided by an acidulant. As shown in the graph below, the acid levels required to achieve the same pH vary widely and this will affect sourness.
LA: Lactic AcidMA: Malic AcidCA: Citric AcidTA: Tartaric AcidFA: Fumaric AcidSAS: Sodium Acid SulphatePA: Phosphoric Acid
0.0 0.2 0.4 0.6 0.8 1.01
2
3
4
5
Buffer Capacity (mEq of acid or basethat changes pH by 1.0 in 100 ml.)
SournessValuefrom
BartekSournessModels
LA (80%), 0.18%
MA, 0.12%
CA (anhyd.), 0.13%
FA, 0.07%
TA, 0.09%
PA (85%), 0.06%SAS (93%), 0.07%
LA: Lactic AcidMA: Malic AcidCA: Citric AcidTA: Tartaric AcidFA: Fumaric AcidSAS: Sodium Acid SulphatePA: Phosphoric Acid
Sourness and Buffer Capacity ofAcid/0.005N NaOH Combinations at pH 3.50
Self-Teaching Guide for Food Acidulants 27
Sourness (cont’d)
Lowering pH while adding minimal sourness
Taking all of the above into account, which acidulants should be selected to lower pH while adding minimal sourness, a common formulation problem?
If the pH of the product is below 4.0, then Phosphoric Acid or Sodium Acid Sulfate should be considered. The level of use for these acids is very low and as a result, the sourness contributed by them is very low. Based on limited data, it appears that the sourness curves for these acids are relatively flat and that they cross the Lactic and Tartaric curves at about pH 4.0.
If the pH of the product is above 4.0, then Fumaric Acid, Lactic Acid or Tartaric Acid should be considered. These all would contribute less sourness than the other acids at pHs above 4.0, once their different acid strengths are taken into account. For example, Fumaric Acid is more sour on a per unit weight basis than Lactic or Tartaric Acids, as shown in the graph on page 25. However, it also has a higher acid strength, as shown in the graph on page 15. This means that less Fumaric Acid could be used to achieve a given pH. Its lower level of use would result in reduced sourness.
Sourness additive effect
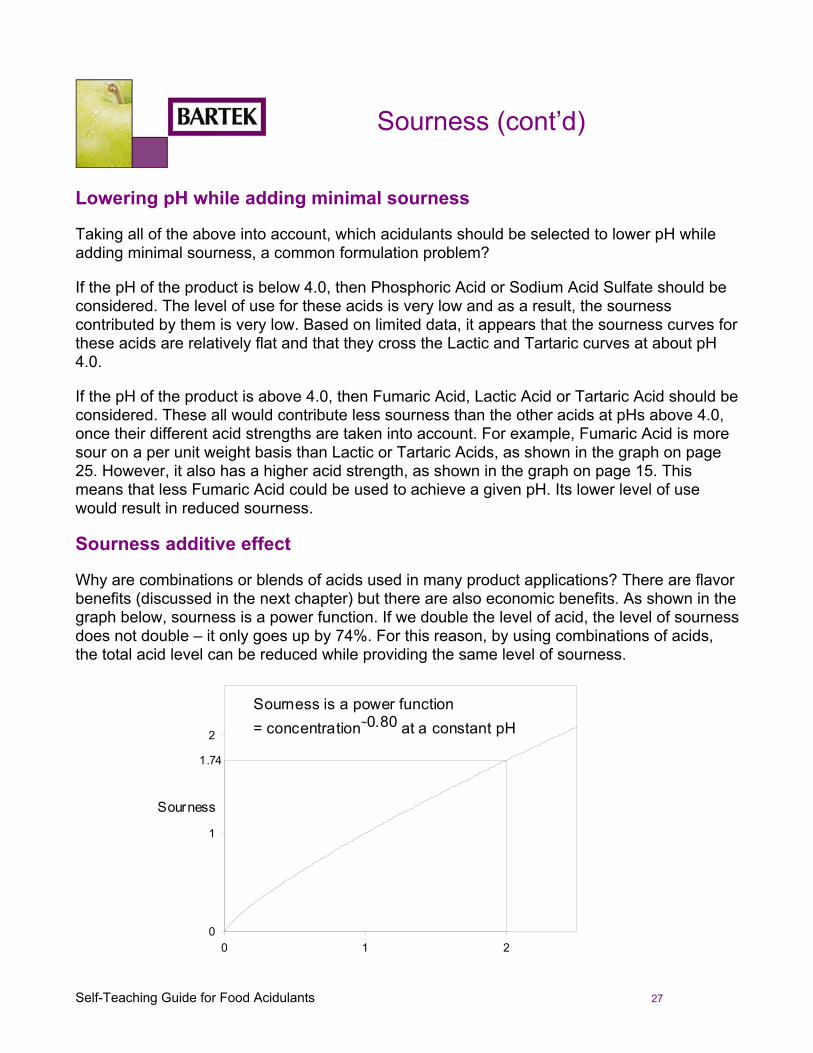
Why are combinations or blends of acids used in many product applications? There are flavor benefits (discussed in the next chapter) but there are also economic benefits. As shown in the graph below, sourness is a power function. If we double the level of acid, the level of sourness does not double – it only goes up by 74%. For this reason, by using combinations of acids, the total acid level can be reduced while providing the same level of sourness.
0 1 2
Sourness
0
1
2
Sourness is a power function= concentration~0.80 at a constant pH
1.74
Self-Teaching Guide for Food Acidulants 28
Sourness (cont’d)
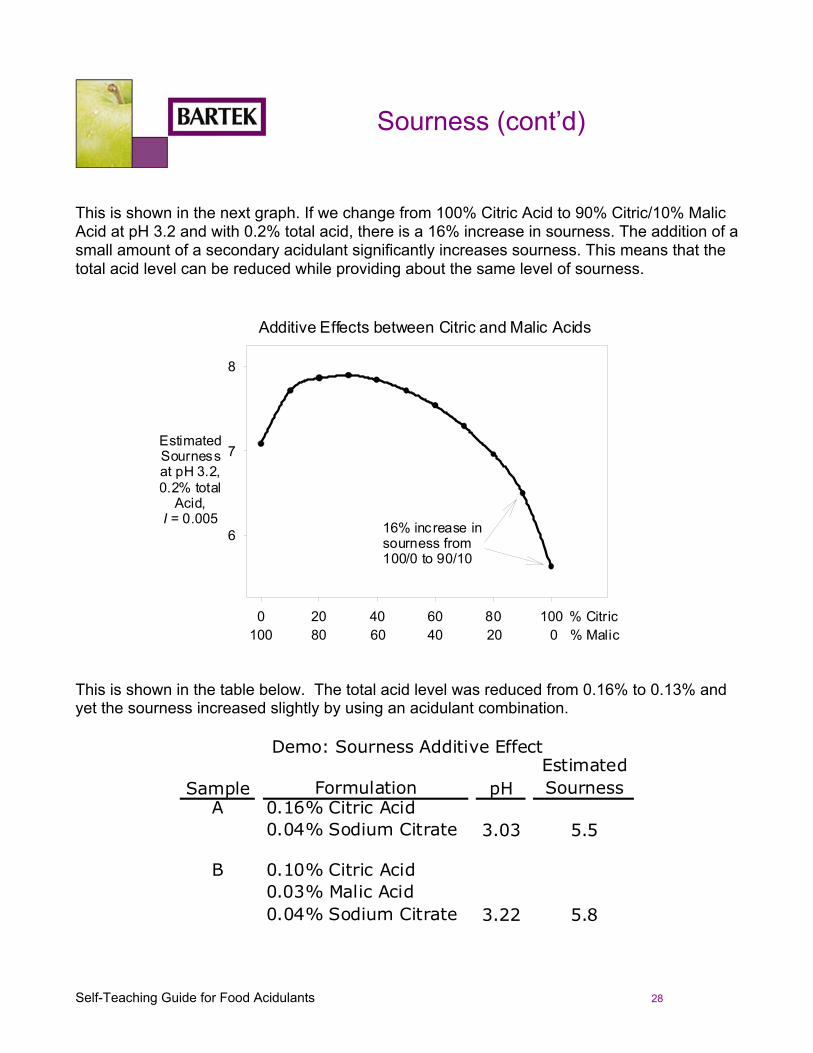
This is shown in the next graph. If we change from 100% Citric Acid to 90% Citric/10% Malic Acid at pH 3.2 and with 0.2% total acid, there is a 16% increase in sourness. The addition of a small amount of a secondary acidulant significantly increases sourness. This means that the total acid level can be reduced while providing about the same level of sourness.
0 20 40 60 80 100
6
7
8
100 80 60 40 20 0% Citric% Malic
EstimatedSournessat pH 3.2,0.2% total
Acid,I = 0.005 16% increase in
sourness from100/0 to 90/10
Additive Effects between Citric and Malic Acids
This is shown in the table below. The total acid level was reduced from 0.16% to 0.13% and yet the sourness increased slightly by using an acidulant combination.
Sample Formulation pHEstimatedSourness
A 0.16% Citric Acid0.04% Sodium Citrate 3.03 5.5
B 0.10% Citric Acid0.03% Malic Acid0.04% Sodium Citrate 3.22 5.8
Demo: Sourness Additive Effect
Self-Teaching Guide for Food Acidulants 29
Sourness (cont’d)
Sourness persistence
Another aspect of sourness that is important in product formulation is the persistence of sourness.
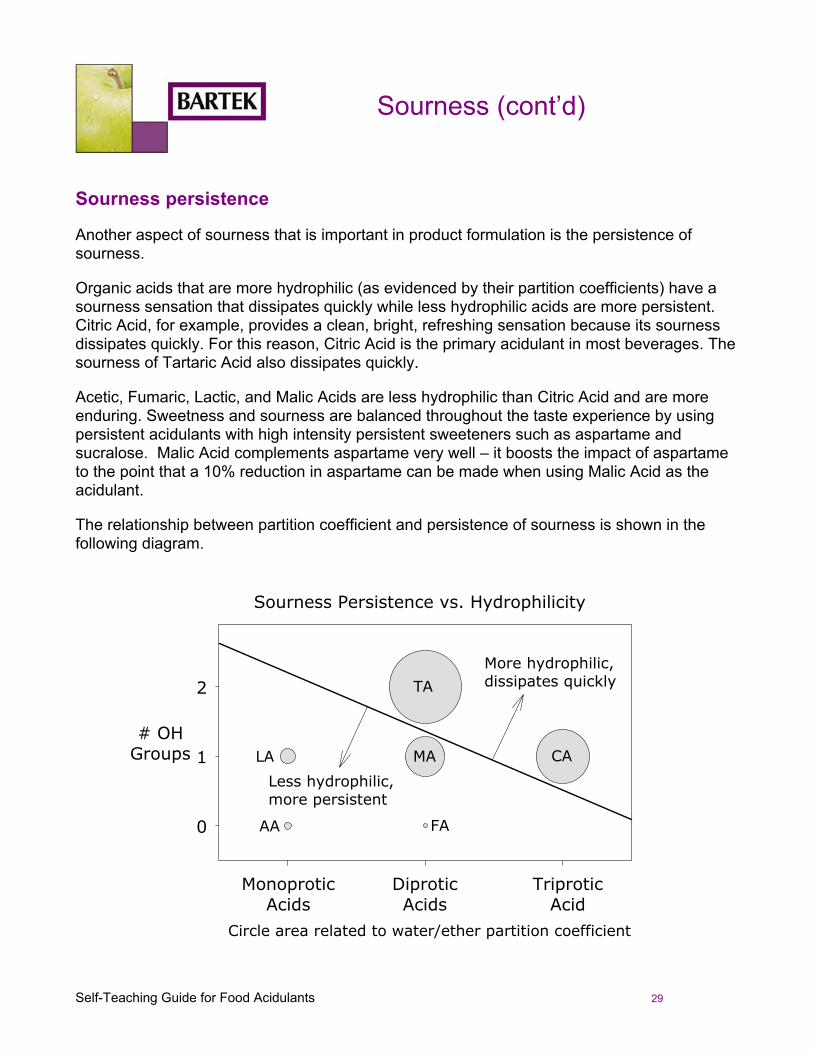
Organic acids that are more hydrophilic (as evidenced by their partition coefficients) have a sourness sensation that dissipates quickly while less hydrophilic acids are more persistent. Citric Acid, for example, provides a clean, bright, refreshing sensation because its sourness dissipates quickly. For this reason, Citric Acid is the primary acidulant in most beverages. The sourness of Tartaric Acid also dissipates quickly.
Acetic, Fumaric, Lactic, and Malic Acids are less hydrophilic than Citric Acid and are more enduring. Sweetness and sourness are balanced throughout the taste experience by using persistent acidulants with high intensity persistent sweeteners such as aspartame and sucralose. Malic Acid complements aspartame very well – it boosts the impact of aspartame to the point that a 10% reduction in aspartame can be made when using Malic Acid as the acidulant.
The relationship between partition coefficient and persistence of sourness is shown in the following diagram.
0
1
2
# OHGroups
MonoproticAcids
DiproticAcids
TriproticAcid
AA FA
CALA MA
TA
Circle area related to water/ether partition coefficient
More hydrophilic,dissipates quickly
Less hydrophilic,more persistent
Sourness Persistence vs. Hydrophilicity
Self-Teaching Guide for Food Acidulants 30
Flavor Effects
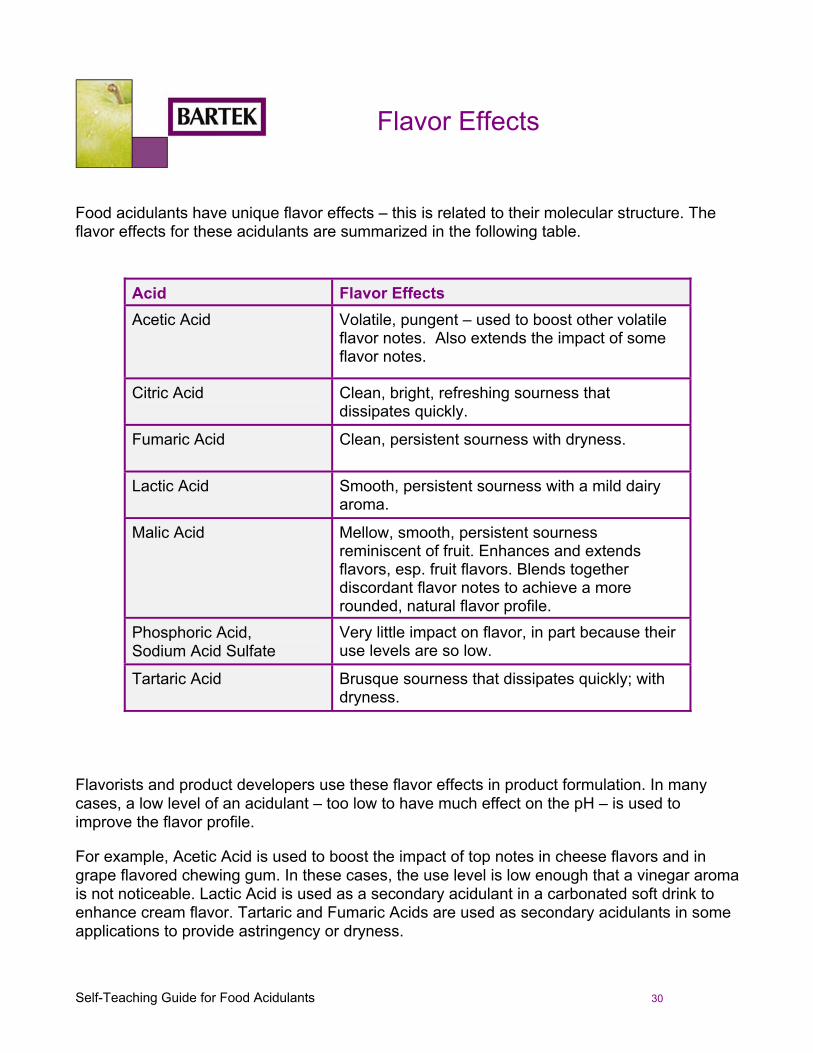
Food acidulants have unique flavor effects – this is related to their molecular structure. The flavor effects for these acidulants are summarized in the following table.
Acid Flavor Effects
Acetic Acid Volatile, pungent – used to boost other volatile flavor notes. Also extends the impact of some flavor notes.
Citric Acid Clean, bright, refreshing sourness that dissipates quickly.
Fumaric Acid Clean, persistent sourness with dryness.
Lactic Acid Smooth, persistent sourness with a mild dairy aroma.
Malic Acid Mellow, smooth, persistent sourness reminiscent of fruit. Enhances and extends flavors, esp. fruit flavors. Blends together discordant flavor notes to achieve a more rounded, natural flavor profile.
Phosphoric Acid, Sodium Acid Sulfate
Very little impact on flavor, in part because their use levels are so low.
Tartaric Acid Brusque sourness that dissipates quickly; with dryness.
Flavorists and product developers use these flavor effects in product formulation. In many cases, a low level of an acidulant – too low to have much effect on the pH – is used to improve the flavor profile.
For example, Acetic Acid is used to boost the impact of top notes in cheese flavors and in grape flavored chewing gum. In these cases, the use level is low enough that a vinegar aroma is not noticeable. Lactic Acid is used as a secondary acidulant in a carbonated soft drink to enhance cream flavor. Tartaric and Fumaric Acids are used as secondary acidulants in some applications to provide astringency or dryness.
Self-Teaching Guide for Food Acidulants 31
Flavor Effects (cont’d)
Malic Acid: a unique flavor modifier
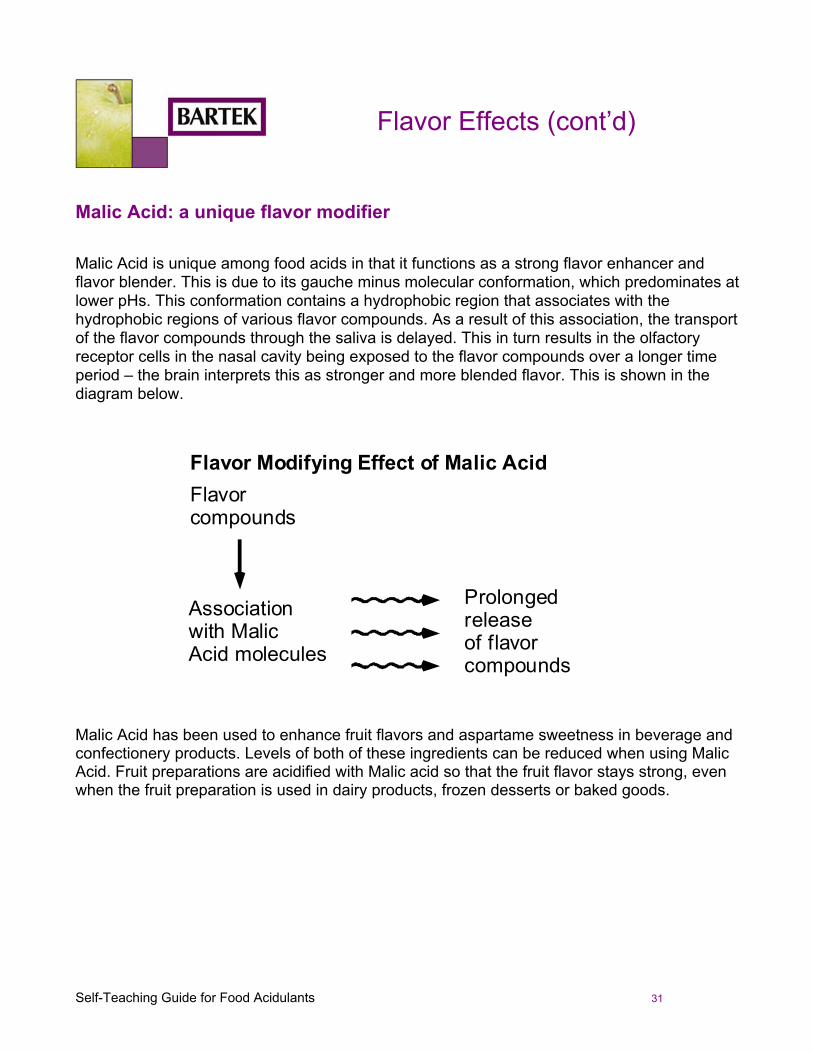
Malic Acid is unique among food acids in that it functions as a strong flavor enhancer and flavor blender. This is due to its gauche minus molecular conformation, which predominates at lower pHs. This conformation contains a hydrophobic region that associates with the hydrophobic regions of various flavor compounds. As a result of this association, the transport of the flavor compounds through the saliva is delayed. This in turn results in the olfactory receptor cells in the nasal cavity being exposed to the flavor compounds over a longer time period – the brain interprets this as stronger and more blended flavor. This is shown in the diagram below.
Flavorcompounds
Associationwith MalicAcid molecules
Prolongedreleaseof flavorcompounds
Flavor Modifying Effect of Malic Acid
Malic Acid has been used to enhance fruit flavors and aspartame sweetness in beverage and confectionery products. Levels of both of these ingredients can be reduced when using Malic Acid. Fruit preparations are acidified with Malic acid so that the fruit flavor stays strong, even when the fruit preparation is used in dairy products, frozen desserts or baked goods.
Self-Teaching Guide for Food Acidulants 32
Flavor Effects (cont’d)
Blended flavor
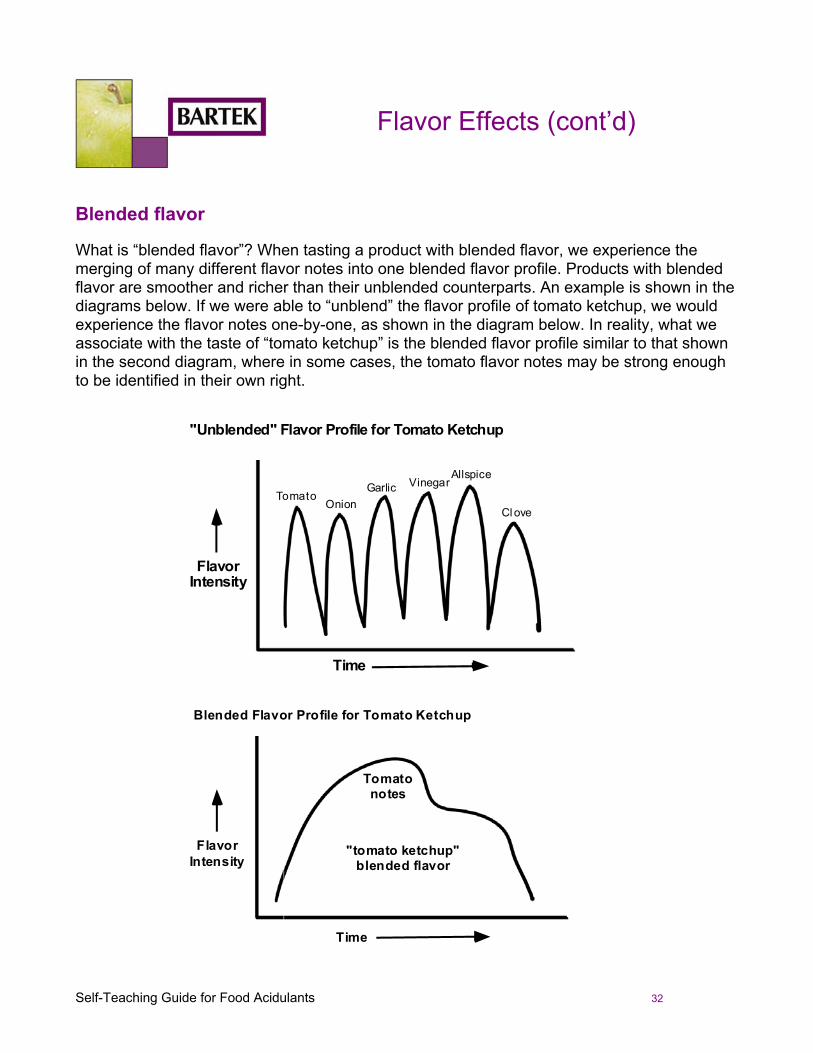
What is “blended flavor”? When tasting a product with blended flavor, we experience the merging of many different flavor notes into one blended flavor profile. Products with blended flavor are smoother and richer than their unblended counterparts. An example is shown in the diagrams below. If we were able to “unblend” the flavor profile of tomato ketchup, we would experience the flavor notes one-by-one, as shown in the diagram below. In reality, what we associate with the taste of “tomato ketchup” is the blended flavor profile similar to that shown in the second diagram, where in some cases, the tomato flavor notes may be strong enough to be identified in their own right.
"Unblended" Flavor Profile for Tomato Ketchup
FlavorIntensity
Time
TomatoOnion
Garlic
Cl ove
AllspiceVinegar
Time
FlavorIntensity
Blended Flavor Profile for Tomato Ketchup
"tomato ketchup" blended flavor
Tomatonotes
Self-Teaching Guide for Food Acidulants 33
Flavor Effects (cont’d)
Which ingredients in tomato ketchup act as flavor blenders? Allspice and clove, two brown spices, are important. Also, the malic acid that is naturally present in tomato acts as a flavor blender. Tomato-based sauces are generally popular because they enhance and blend flavors in a wide variety of applications.
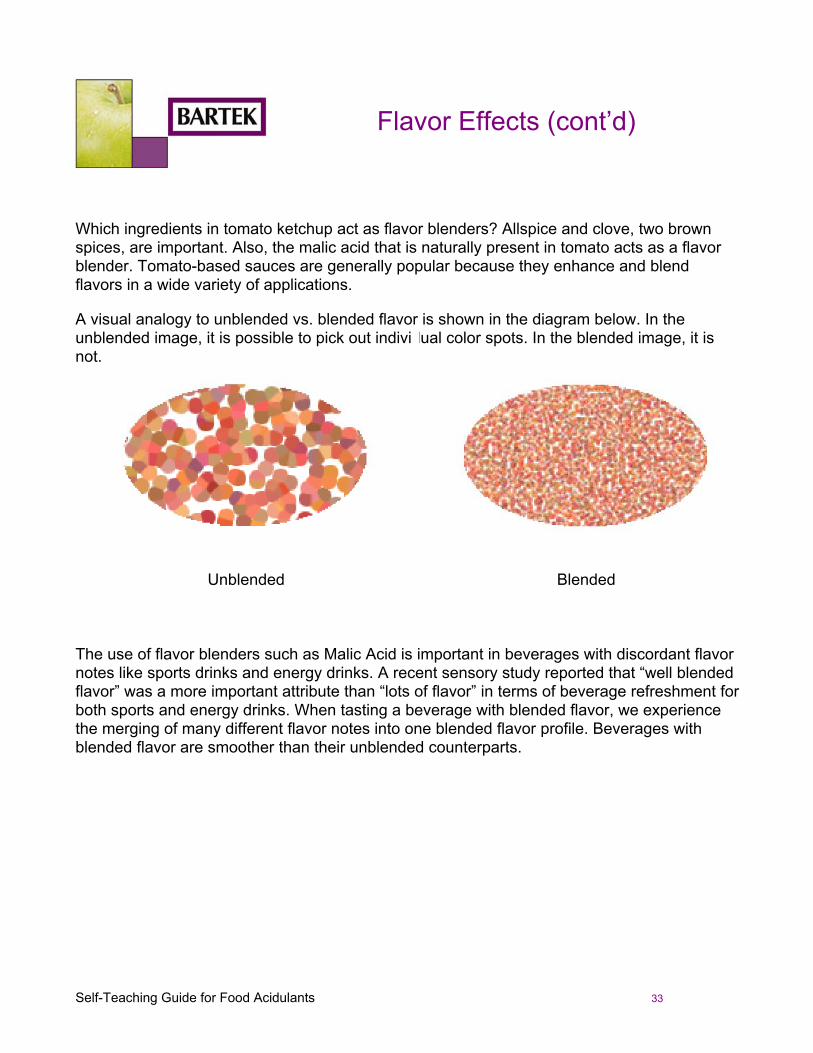
A visual analogy to unblended vs. blended flavor is shown in the diagram below. In the unblended image, it is possible to pick out individual color spots. In the blended image, it is not.
Unblended Blended
The use of flavor blenders such as Malic Acid is important in beverages with discordant flavor notes like sports drinks and energy drinks. A recent sensory study reported that “well blended flavor” was a more important attribute than “lots of flavor” in terms of beverage refreshment for both sports and energy drinks. When tasting a beverage with blended flavor, we experience the merging of many different flavor notes into one blended flavor profile. Beverages with blended flavor are smoother than their unblended counterparts.
Self-Teaching Guide for Food Acidulants 34
Flavor Effects (cont’d)
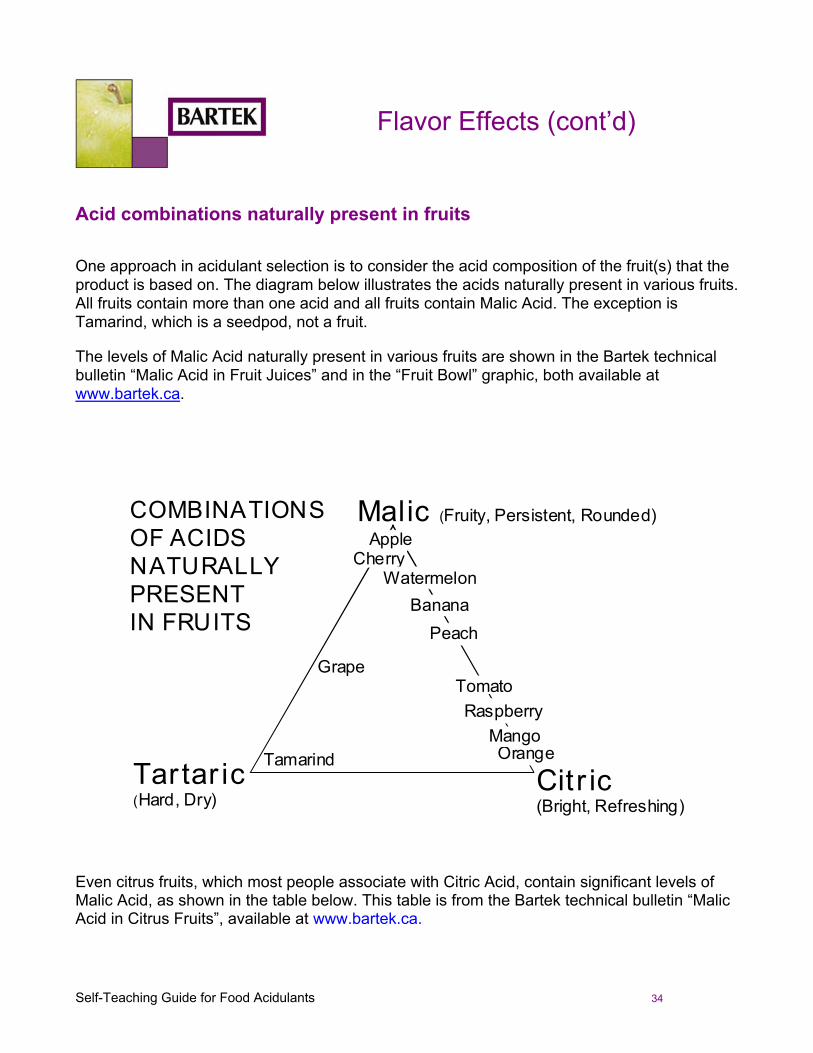
Acid combinations naturally present in fruits
One approach in acidulant selection is to consider the acid composition of the fruit(s) that the product is based on. The diagram below illustrates the acids naturally present in various fruits. All fruits contain more than one acid and all fruits contain Malic Acid. The exception is Tamarind, which is a seedpod, not a fruit.
The levels of Malic Acid naturally present in various fruits are shown in the Bartek technical bulletin “Malic Acid in Fruit Juices” and in the “Fruit Bowl” graphic, both available at www.bartek.ca.
Cherry
Citr ic(Bright, Refreshing)
Tar tar ic(Hard, Dry)
Malic (Fruity, Persistent, Rounded)
Tamarind
Grape
Apple
Orange
Tomato
Peach
Raspberry
COMBINATIONSOF ACIDSNATURALLYPRESENTIN FRUITS
Mango
BananaWatermelon
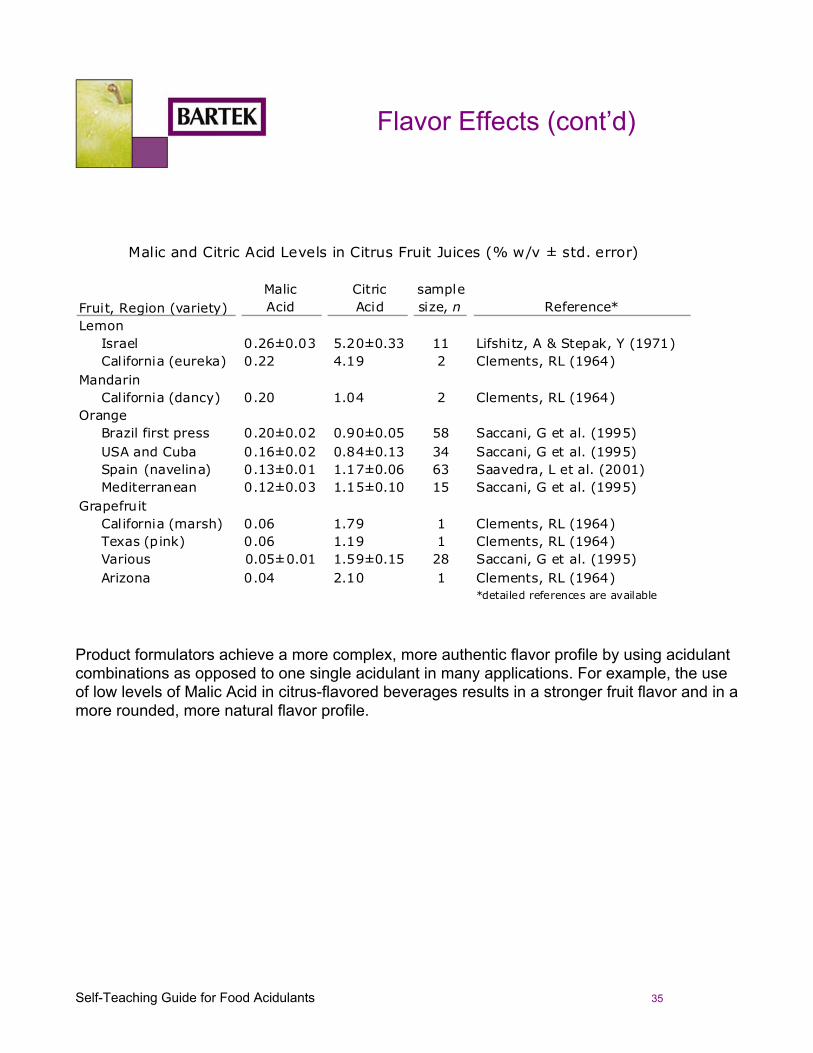
Even citrus fruits, which most people associate with Citric Acid, contain significant levels of Malic Acid, as shown in the table below. This table is from the Bartek technical bulletin “Malic Acid in Citrus Fruits”, available at www.bartek.ca.
Self-Teaching Guide for Food Acidulants 35
Flavor Effects (cont’d)
MalicAcid
CitricAcid
samplesize, n Reference*
Israel 0.26±0.03 5.20±0.33 11 Lifshitz, A & Stepak, Y (1971)California (eureka) 0.22 4.19 2 Clements, RL (1964)
California (dancy) 0.20 1.04 2 Clements, RL (1964)
Brazil first press 0.20±0.02 0.90±0.05 58 Saccani, G et al. (1995)USA and Cuba 0.16±0.02 0.84±0.13 34 Saccani, G et al. (1995)Spain (navelina) 0.13±0.01 1.17±0.06 63 Saavedra, L et al. (2001)Mediterranean 0.12±0.03 1.15±0.10 15 Saccani, G et al. (1995)
California (marsh) 0.06 1.79 1 Clements, RL (1964)Texas (pink) 0.06 1.19 1 Clements, RL (1964)Various 0.05±0.01 1.59±0.15 28 Saccani, G et al. (1995)Arizona 0.04 2.10 1 Clements, RL (1964)
*detailed references are available
Malic and Citric Acid Levels in Citrus Fruit Juices (% w/v ± std. error)
Grapefruit
Fruit, Region (variety)Lemon
Mandarin
Orange
Product formulators achieve a more complex, more authentic flavor profile by using acidulant combinations as opposed to one single acidulant in many applications. For example, the use of low levels of Malic Acid in citrus-flavored beverages results in a stronger fruit flavor and in a more rounded, more natural flavor profile.
Self-Teaching Guide for Food Acidulants 36
Applications Notes
Applications information concerning primarily Malic and Fumaric Acids but other acidulants as well is posted at Bartek’s web site: www.bartek.on.ca. Applications sheets at this web site describe benefits of Malic and Fumaric Acids in specific applications. Ingredient declarations for many products are listed under “List of Products” for each application and in the quarterly newsletter posted at the web site.
The following are some general notes concerning the selection of acidulants for specific product categories:
Beverages
In many beverages, Citric Acid is used as the primary acidulant because of its refreshing sensation. Secondary acidulants are used to take advantage of the sourness additive effect and to improve or enhance flavor. Malic Acid, a strong flavor enhancer and flavor blender, is widely used in combination with Citric Acid.
Exceptions to this general practice are:
• When persistent high intensity sweeteners such as aspartame or sucralose are used. In this case, Malic Acid is used as the primary acidulant in order to achieve a more balanced sweetness/sourness effect throughout the taste experience. Malic Acid is widely used in low calorie tea beverages for this reason.
• Beverages that naturally contain low levels of Citric Acid. Examples are: Tamarind (Tartaric), Apple (Malic), Cherry (Malic), Grape (Malic & Tartaric), and Cola (Phosphoric).
• Alcoholic beverages, where a well blended flavor profile is essential. Malic Acid is used widely in cocktail mixes and coolers for this reason.
Self-Teaching Guide for Food Acidulants 37
Applications Notes
Confectionery
• Malic and Fumaric Acids provide more sourness (and more persistent sourness) than Citric Acid at low pHs. Malic Acid enhances fruit flavor and boosts the impact of aspartame. Malic Acid is a saliva stimulant – important in chewing gum.
• Acidulant blends (2-4 acidulants) are commonly used for the sourness additive effect and for flavor improvement. When nonpolar ingredients (gum base, vegetable shortening) are present, the use of a mixture of acidulants with different partition coefficients results in a sequential release of sourness.
• Buffered systems are used to control sucrose inversion and gel texture (when gelatin or pectin are used).
• The hydrophobicity of the acidulant is important in compressed tablets. Fumaric and Malic Acids improve tablet lubrication because they are more hydrophobic than Citric or Tartaric Acid. Using these acidulants results in smoother, less brittle tablets that adhere less to the die wall and punch face.
Fruit Preparations
As described earlier, fruit preparations are acidified with Malic acid so that the fruit flavor stays strong, even when the fruit preparation is used in dairy products, frozen desserts or baked goods.
Snack Foods
Acidulant combinations are widely used in spice blends that are dusted on snack foods. The acid particles boost initial impact because they provide concentrated points of sourness in the mouth.