Embed Size (px)
Citation preview
JOURNAL OF GEOPHYSICAL RESEARCH VOL. 68, No. 21 NOVEMBER I, 1963
Seismicity of the South Pacific Ocean 1
LYNN R. SYKES
Lamont Geological Obsen)atory, Columbia Univendty Palisades, New Y01·k
Abstract. A map of earthquake epicenters is presented for the South Pacific Ocean for the period 1957 to 1963. For much of this region the accuracy in locating epicenters has been improved by nearly an order of magnitude in comparison with that of previous studies. In several areas of the South Pacific the seismic activity is confined to narrow zones that are less than 50 km wide . Near 55°S and between 122° and 135°W the pattern of epicenters is offset approximately 1000 km. Seismic and bathymetric data indicate that a fracture zone intersects the Easter Island ridge in this region . Epicentral dn.ta suggest that several other fracture zones may be present in the South Pacific and eastern Indian oceans. Regions of relatively high seismicity on the oceanic ridges may be related to the presence of fracture zones that
intersect the crest of the ridge. Seismic activity along these fracture zones is restricted aJmost
exclusively to the region between the displaced crests of the oceanic ridge. A number of topographic profiles across the oceanic ridges in the South Pacific and eastern Indian oceans are compared with the epicentral determinations.
INTRODUCTION
Until recently the determination of earthquake epicenters in the South Pacific was subject to considerable uncertainty. In the southern part of this region, epicentral determinations were in doubt by as much as 5° [Gutenberg and Richter, 1954]. Topographic information was incomplete for a large part of the South Pacific. Hence, neither the seismic belts nor the large-scale geological features were known with precision.
Several recent developments led to an improvement in the determination of epicenters in the southern hemisphere. The establishment of several first-class seismic stations in Antarctica during the IGY (1957-1958) made the greatest contribution to improved epicentral determinations in this region. In addition, electronic computers made it possible to utilize a very large number of P or P KP readings in determining a least-squares solution to the residuals of the travel-time data. Electronic computers enabled the U. S. Coast and Geodetic Survey to report an increased number of epicenters. Also, it is now possible to recompute the locations of older epicenters for which no least-squares solution was available. Likewise, improvements in the design of echo sounders and an increase in the
1 Lamont Geological Observatory contribution 657.
number of scientific cruises led to a better understanding of the bathymetry.
It is apparent that greater accuracy can be achieved in the determination of earthquake epicenters in many areas of the world as more seismic stations are installed and better data become available. With this greater accuracy it should be possible to obtain a much clearer understanding of the relationships between seismicity and geological structure.
LOCATION OF EPICENTERS
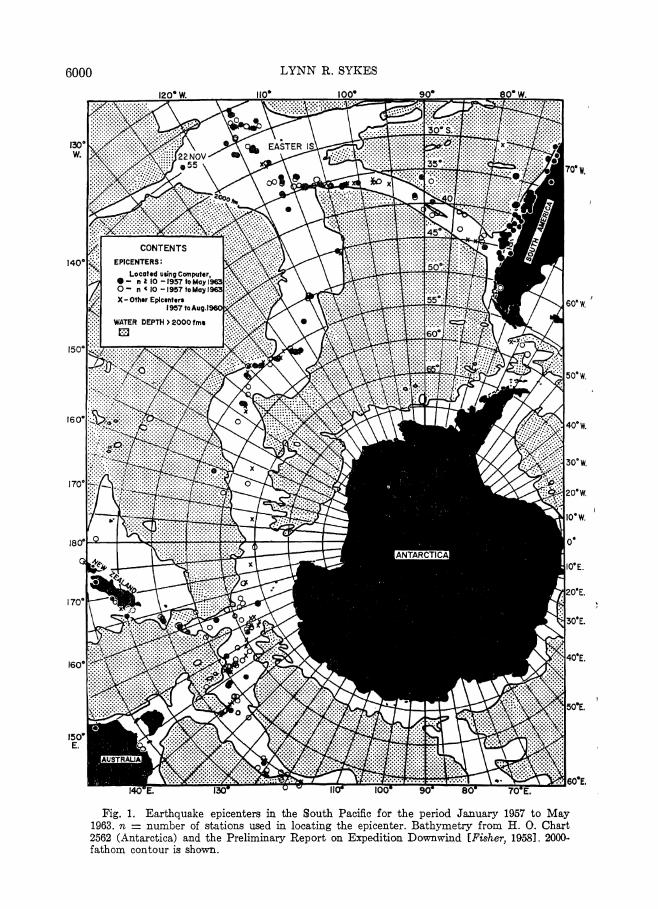
Epicentral data were derived from the epicenter cards and seismological bulletins of the U. S. Coast and Geodetic Survey (USCGS) and were supplemented by da,ta from the bulletins of the Bureau Central International de Seismologie (BCIS). In Figures 1 and 2 epicenters located by computer with data from 10 or more stations are denoted by black dots. Those computed with data from fewer than 10 stations are indicated by open circles; those derived without the aid of a computer are denoted by crosses. These epicenters were computed either by the USCGS using a program developed by Gunst and Reece [Gunst and Engdahl, 1962J, or by ilie author using a program written by Bolt [1960J and modified by J. Kuo and others at the Lamont Geological Observatory. Epicenters have been determined by the USCGS with the aid of a computer since August 1960. When these US
5999
6000 LYNN R. SYKES
Fig. 1. Earthquake epicenters in the South Pacific for the period January 1957 to May 1963. n = number of stations used in locating the epicenter. Bathymetry from H. O. Chart 2562 (Antarctica) and the Preliminary Report on Expedition Downwind [Fisher, 1958]. 2000-fathom contour is shown.
SEISMICITY OF PACIFIC OCEAN 6001
135
140
145
150
160
165
55S
50
..... .,.... •. � 55
65
70
75 S
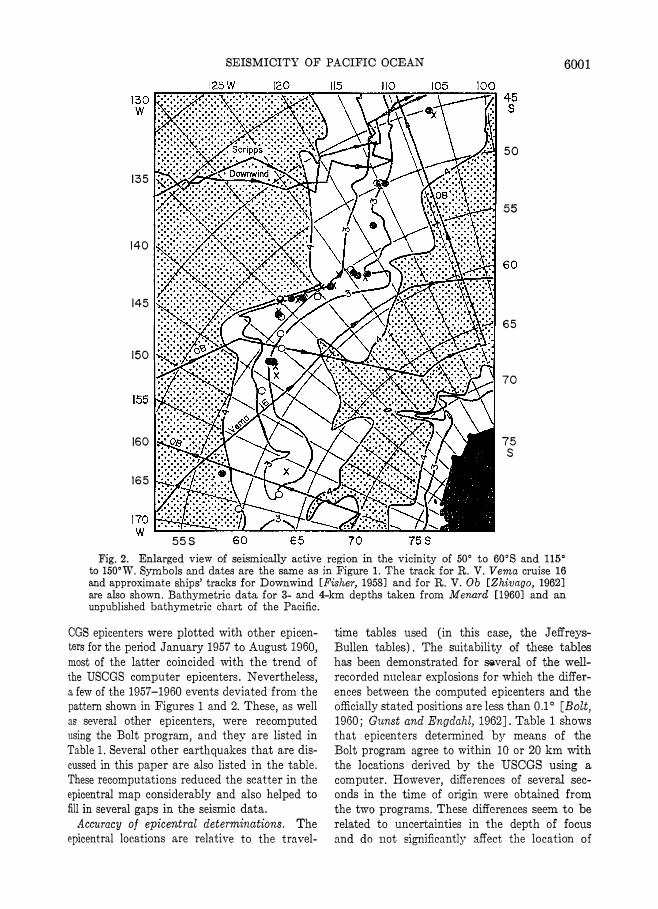
Fig. 2. Enlarged view of seismically active region in the vicinity of 50· to 60·S and 115· to 150·W. Symbols and dates are the same as in Figure 1. The track for R. V. Vema cruise 16 and approximate ships' tracks for Downwind [Fisher, 1958] and for R. V. Ob [Zhivago, 1962] are also shown. Bathymetric data for 3- and 4-km depths taken from Menard [1960] and an unpublished bathymetric chart of the Pacific.
CGS epicenters were plotted with other epicenters for the period January 1957 to August 1960, most of the latter coincided with the trend of the USCGS computer epicenters. Nevertheless, a few of the 1957-1960 events deviated from the pattern shown in Figures 1 and 2. These, as well as several other epicenters, were recomputed using the Bolt program, and they are listed in Table 1. Several other earthquakes that are discussed in this paper are also listed in the table. These recomputations reduced the scatter in the epicentral map considerably and also helped to fill in several gaps in the seismic data.
Accuracy of epicentral determinations. The epicentral locations are relative to the travel-
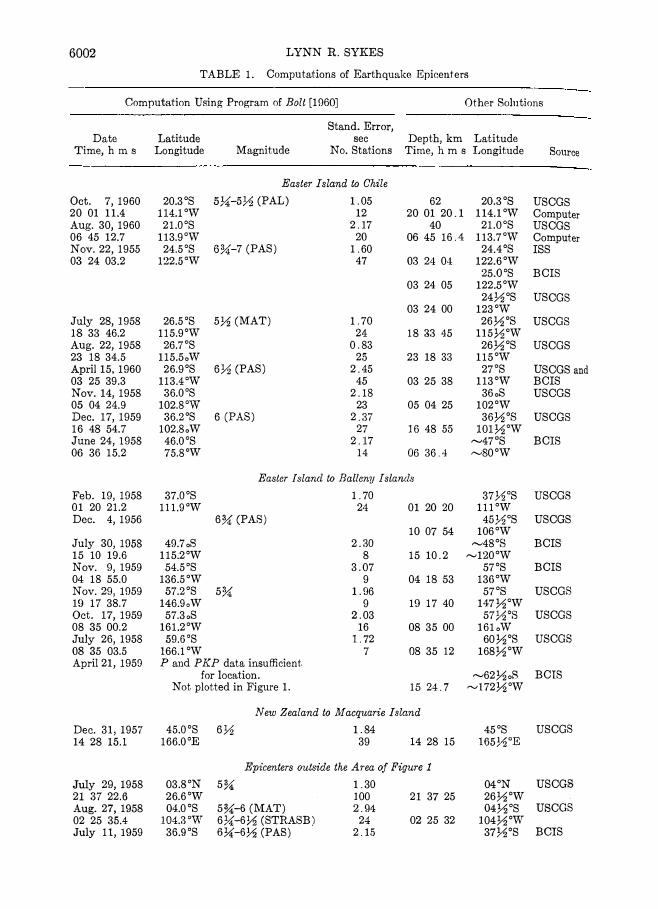
time tables used (in this case, the JeffreysBullen tables). The suitabil ity of these tables has been demonstrated for SQveral of the wellrecorded nuclear explosions for which the differences between the computed ep icenters and the officially st ated positions are less than 0.1 0 [Bolt, 1960; Gunst and Engdahl, 1962]. Table 1 shows that epicenters determined by means of the Bolt program agree to within 10 or 20 km with
the locat ions derived by the USCGS using a computer. However, differences of several seconds in the time of origin were obtained from the two programs. These differences seem to be related to uncertainties in the depth of focus and do not significantly affect the location of
6002 LYNN R. SYKES
TABLE 1. Computations of Earthquake Epicenters
Computation Using Program of Bolt [1960] Other Solutions
Date Time, h m 8
Oct. 7, 1960 20 01 11.4 Aug. 30, 1960 06 45 12.7 Nov. 22, 1955 03 24 03.2
July 28, 1958 18 33 46.2 Aug. 22, 1958 23 18 34.5 April 15. 1960 03 25 39.3 Nov. 14, 1958 05 04 24.9 Dec. 17, 1959 16 48 54.7 June 24, 1958 06 36 15.2
Feb. 19, HJ58 01 20 21.2 Dec. 4, 1956
July 30, 1058 15 10 19.6 Nov. 9, 1959 04 18 55.0 Nov. 29, 1959 I(l 17 38.7 Oct. 17, 1959 08 35 00.2 July 26, 1958 08 35 03.5 April 21, 1959
Dec. 31, 1957 14 28 15.1
July 29, 1958 21 37 22.6 Aug. 27, 1958 02 25 35.4 July 11, 1959
Latitude Longitude
20.3°S 114.1 oW
21.00S 1I3.9°W
24.5°8 122.5°W
26.5°S 115.9°W
26.7°S lI5.5°W
26.9°S 113.4°W
36. 00S 102.8 oW
36.2°S 102.8°W
46.0°8 75. 8°W
37.0°8 111.9 oW
49.7°S 115.2°W
54.5 oS 136.5°W
57.2°S 146.9 oW
57.3 oS 161.2°W
150.G oS 166.1°W
Stand. Error, sec
Magnitude No. Stations
Easter Island to Chile
5U-5Yz (PAL)
6;Y.i'-7 (PAS)
5�1 (MAT)
6Yz (PAS)
6 (PAS)
1.05 12
2.17 20
1.60 47
1. 70 24
0.83 21)
2.45 45
2.18 23
2.37 27
2.17 14
Depth, km Time, h m s
62 20 01 20.1
40 06 45 16.4
03 24 04
03 24 05
03 24 00
18 33 45
23 18 33
03 25 38
05 04 25
16 48 51)
06 36.'1
Easter [sland to Rallenll I sland.�
1. 70 24 01 20 20
6;Y.i' (PAS) 10 07 54
2.30 8 15 10.2
3.07 9 04 18 53
5;Y.i' l.(J6 9 10 17 40
2.03 16 08 35 00
1. 72 7 08 35 12
P and PKP data insufficient for location.
Not. plotted in Figure 1. 15 24.7
New Zealand to Macquarie Island
45.00S 6Yz 1.84 166.00E 39 14 28 15
Epicenters outside the Area of Figure 1 03.SoN 5;Y.i' 1.30 26.6°W 100 21 37 25 04.0 oS 5;Y.i'-6 (MAT) 2.94
104.3 oW 6U-6YZ (STRA8B) 24 02 25 32 36.9°S 6U-6Yz (PAS) 2.15
Latitude Longitude Source
20.3°S USCGS 114.1 oW Computer
21.00S USCGS lI3.7°W Computer
24.4 oS ISS 122.6°W
25.00S BCIS 122.5°W
24Yz°S USCGS 123°W
26Yz°S USCGS II 5Y:;i oW
26Yz°S USCGS 115°W
27°8 USCGS and 113 oW BCIS
36°S USCGS 102 oW
36Yz°S USCGS 101Yz°W
,....,47 oS BCIS "-'80 oW
37 P-1loS USCGS 111 oW
45Yz°8 USCGS 106 oW
"-'48 oS BCIS ",1200W
157 oS BCIS 13GoW
57°S USCGS 147Yz°W
57Yz°8 U8CGS 161°W
60Yz°S U8CG8 168Yz°W
"-'62 Yz °8 BCIS �l72Yz°W
45°S USCGS 165Yz°E
04°N USCGS 26Yz°W 04Yz°S USCGS
104Yz°W 37Yz°S BCIS
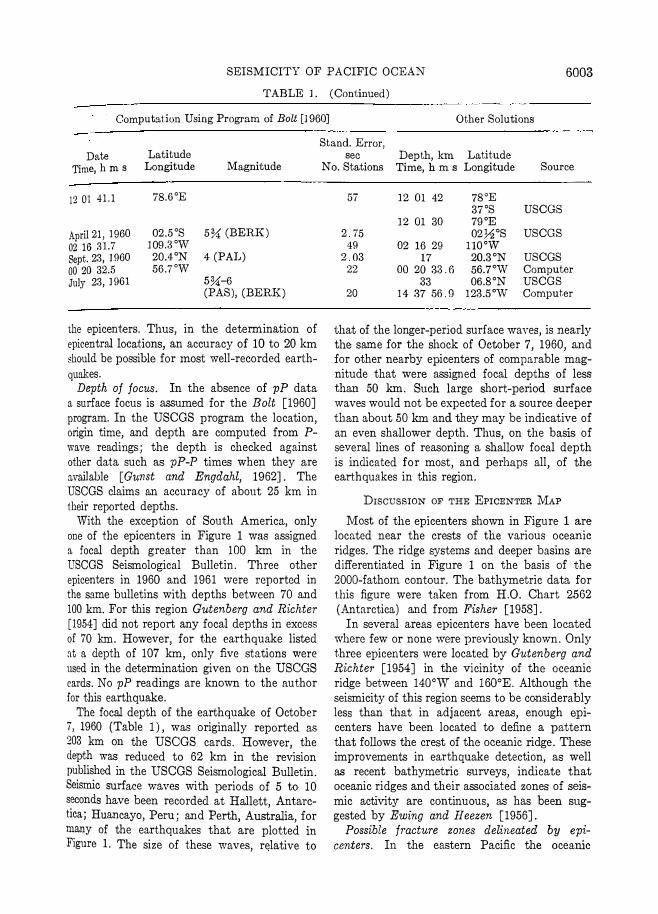
SEISMICITY OF PACIFIC OCEAN 6003 TABLE 1. (Continued)
Compu tation Using Program of Bolt [1960] Other Solutions
Date Time, h m s
12 01 41.1
April 21, 1960 02 16 31.7 Sept. 23, 1960
00 20 32.5 July 23, 1961
Latitude Longitude Magnitude
7S.6°E
02. 5°S 5%; (BERK) lO9.3°W 20A oN 4 (PAL) 56.7°W
5 %;-6 (PAS), (BERK)
the epicenters. Thus, in the detennination of epicentrallocations, an accuracy of 10 to 20 km "hould be possible for most well-recorded earth
quakes. Depth of focus. In the absence of pP data
a surface focus is assumed for the Bolt [1960J
program. In the USCGS program the location, origin time, and depth are computed from Pwave readings; the depth is checked against other data such as pP-P times when they are available [Gunst and Engdahl, 1962J . The USCGS claims an accura.cy of about 25 km in their reported depths.
With the exception of South America, only one of the epicenters in Figure 1 was assigned a focal depth greater than 100 km in the USCGS Seismological Bulletin. Three other epicent.ers in 1960 and 1961 were reported in the same bulletins with depths between 70 and 100 km. For this region Gutenberg and Richter [1954J did not report any focal depths in excess of 70 km. However, for the earthquake listed at a depth of 107 km, only five stations were used in the detennination given on the USCGS cards. No pP readings are known to the author for t.his earthquake.
The focal depth of the earthquake of October 7, 1960 (Table 1), was originally reported as 203 km on the USCGS cards. However, the depth was reduced to 62 km in the revision published in the USCGS Seismological Bulletin. Seismic surface waves with periods of 5 to 10 seconds have been recorded at Hallett, Antarctica; Huancayo, Peru; and Perth, Australia, for many of the earthquakes t,hat are plotted in Figure 1. The size of these waves, relative to
St.and. Error, sec Depth, km Latitude
No. Stations Time, h m s Longitude Source
57 12 01 42 7SoE 37°S USCGS
12 01 30 79°E 275 02� oS USCGS
49 02 16 29 1l00W 2.03 17 20.3 oN USCGS
22 00 20 33.6 56.7°W Computer 33 06.8°N USCGS
20 14 37 56.9 123.5°W Comput.er
that of the longer-period surface waves, is nearly the same for the shock of October 7, 1960, and for other nearby epicenters of comparable magnitude that were assigned focal depths of less than 50 km. Such large short-period surface waves would not be expected for a source deeper than about 50 km and they may be indicative of an even shallower depth. Thus, on the basis of several lines of reasoning a shallow focal depth is indicated for most, and perhaps all, of the earthquakes in this region.
DISCUSSION OF THE EPICENTER MAP
Most of the epicenters shown in Figure 1 are located near the crests of the various oceanic ridges. The ridge systems and deeper basins are differentiated in Figure 1 on the basis of the 2000-fathom contour. The bathymetric data for this figure were taken from H.O. Chart 2562 (Antarctica) and from Fisher [1958J.
In several areas epicenters have been located where few or none were previously known. Only three epicenters were located by Gu.tenberg and Richter [1954J in the vicinity of the oceanic ridge between 1400W and 1600E. Although the seismicity of this region seems to be considerably less tha.n that in adjacent areas, enough epicenters have been located to define a pattern that follows the crest of the oeeanic ridge. These improvements in earthquake detection, as well as recent bathymetric surveys, indicate that oceanic ridges and their associated zones of seismic activity are continuous, as has been suggested by Ewing and Heezen [1956J.
Possible fracture zones delineated by epicenters. In the eastern Pacific the oceanic
6004 LYNN R. SYKES
ridge is intersected by a series of long straight bands of mountainous topography called fracture zenes [Menard, 1960]. Studies of magnetic anomalies in the northeast Pacific indicate large strike-slip movements along several of the fracture zones [Menard, 1962].
In several of the oceanic areas shown in Figture 1, the epicenters are all located along nar
row linear zones. One of these is the region 50° to 600S and 115° to 1500W. This region is shown in an enlarged view in Figure 2. H. W. Menard (personal communication) has recently completed a bathymetric chart of the Pacific Ocean. The 3- and 4-km contours shown in Figure 2 were taken from this ma·p. The bathymetric data that Menard [1960J has interpreted as a fracture zone coincide with the abrupt changes
in the pattern of epicenters near 55°8. The displacement of the line of epiccmters in this region is approximately 1000 km and is in a right
latera.l sense . For the period 1957 to 1963 no epicenters were found on the continuation of the 55°S zone beyond the crests of the oceanic
ridge. Another narrow seismic zone is located between 35°8, 109°W, and 36°8 , 97°W. The two epicenters near 3608, 90oW, may indicate an extension of this sei"mic zone. Bathymetric data are very sparse in these two areas ; better data would be of great help in confirming the existence of fracture zones in these regions.
A similar pattern of epicenters is observed at the equator in the Atlantic where the midoceanic ridge is offset approximately 15° in a left-lateral sense along a series of en echelon fracture zones [H eezen and Tharp, 1961]. Reported earthquake epicenters for the period January 1957 to May 1963, with bnt one exception, fall either on the crest of the mid-Atlantic ridge or on fracture zones that offset the ridge. Only one epicenter was located off the ridge crest. This epicenter may be located on the extension of a fault zone. This earthquake, on July 29, 1958, at 3.8°N, 26.6°W (Table 1), was located with the epicenter relocation program using 100 P-wave rea.dings.
Shallow-focus earthquakes in Chile. Another region in which earthquakes are restricted to a fairly narrow zone is the coast of Chile. In Figure 1 the only Chilean epicenters plotted are those that were located by using 10 or more P-wave readings and for which a shallow focus (less than 70 km) was reported by the U8CGS.
The width of the seismically active zone in Chile is about 200 km, as shown in Figure 1. Benioff [1962J has derived similar dimensions for other circum-Pacific faults. However, some of the seismically active zones associated with oceanic ridge systems appear to be considerably narrower and may be less than 50 km wide. Along the Chilean coast an abrupt decrease in seismicity occurs near 47°8 where the west Chile ridge intersects the continent.
Regions of hl{;h and low seismicity. Two other oceanic areas of high seismicity are shown in Figure 1. One is west of Easter Island; the other is south of Australia. The scatter in the epicenters west of Easter Island, near 25°8, appears to be re.al.. Many of the epicenters were located by using more than 10 P-wave readings. Menard [1960J has indicated an east-west fraeture zone in the vicinity of 26°8 between 80' and 1200W. The seismicity of this region may be related to the presence of one or more fra�ture zones that intersect the crest of the Easter
Island ridge. Only two epicenters were reported on the
Easter Island ridge between 9° and 20°8. Both epicenters (near 13% oS, 1111;2 OW) are located on what is probably a fault [Von H erze:n aM Uyeda, 1963J . This fault trends approximately east-west and displaces the oceanic ridge approximately 100 to 150 km in a right-lateral sense. Gutenberg and Richter [1954J did not list anyepicenters on the Easter Island ridge between 10' and 22°8. For the period December 1956 to May 1963 only three epicenters were reported on the Easter Island ridge between 35° and 49°S. For the same period of time the seismicity of the oceanic ridge between 1500W and 1700E and between 1400E and 127°E was also lower than that in adjoining regions.
It is possible that each of the regions in Figure 1 that exhibits relatively high seismicity may be related to the presence of fracture zones that intersect the crests of the oceanic ridge. Each of these oceanic areas also appears as a region of relatively high seismicity on the epicentral maps of Gutenberg and Richtel' [1954] and Richter [1958J. 11any of the areas of high seismicity along the mid-Atlantic ridge aTe found where Heezen and Tharp [1961] have shown fracture zones intersecting the ridge. These fracture zones were located from bathymetric data.
SEISMICITY OF PACIFIC OCEAN 6005
Aseismic ridges and fracture zones. An earth
quake on November 22, 1955, at 24.5°S, 122.5°
W, is :11so included in Figure 1 because of its
unusllal location and because of the large num
ber of stations that could be used in the reloca
tion of the epicenter. Its location is about 100 to 200 km north of one of the fracture zones
shown by Menard [1960, 1961]. This epicenter
raises a question: Is the ridge system that ex
tends from Easter Island to the Tuamotu Archi
pelago completely aseismic or is this e[Lrthquake
associ[Lted with a fracture zone? Except where
they intersect the crest of a seismically active
oceanic ridge, fracture zones in the Pacific are normally aseismic. The earthquakes along a por
tion of the Mendocino fracture zone represent
activity that is apparently induced by the adja
cent San Andreas fault [Benioff, 1962]. An epi
center at 6.8°N, 123.5°W, July 23, 1961, is approximately 100 km south of the Clipperton
fracture zone [Menard, 1960] . However, the
epicenters in the Pacific basin given by Gutenberg and Richter [1954] show no apparent relationship to the fracture zones reported by Menard [1960]. Actually, the number of epicenters reported in regions that are normally inactive is surprisingly small compared with that for aseismic continental areas.
Epicenters on the midoceanic ridge south of Australia. The p[Lttern of epicenters south of Australia between 140° and 155°E may be indicative of one or more fracture zones in this region. Much of the scatter in the epicentral data in this region may be caused by the small number of stations used in the computations. Many of these points represent preliminary detenninations that were m[Lde by the USCGS on the basis of as few as five to ten stations. More stations often record these earthquakes and their readings are eventually reported to the USCGS, the BCIS, and the International Seismological Summary (ISS). The use of additional P and PKP readings should decrease the scatter in the epicentral data.
The scatter of the epicenters on the ridge near l\Iacquarie Island (55°S, 159°E) has been reduced considerably in comparison with the data arailable to Gutenberg and Richter [1954]. Several earthquakes of magnitude larger than 7 have been reported in the vicinity of the ridge between New Zealand and Macquarie Island [Richter, 1958, p. 423]. Several New Zealand
and Australian earthquakes are also shown in Figure 1. A thorough search for epicenters in New Zealand, Australia, and Ant[Lfctica was not made, however.
MAGNITUDE DETERMINATIONS
For the period January 1957 to May 1963 only one earthquake was reported in the area of Figure 1 (exclusive of Chile) of magnitude 7 or grcater . This was the earthquake of December 13, 1960, at 52.7°S, 159.1 °E (USCGS), of magnitude 71,4. The epicenter lies on the ridge between New Zealand and Macquarie Island.
Magnitudes have been reported for only a small fraction of the earthquakes shown in Figure 1. Because of this lack of data and the general absence of large earthquakes in these oceanic areas, no distinction has been made in Figure 1 in regard to magnitude. Probably none of the shocks studied here is of magnitude less than 5.
RECENT BATHYMETRIC SURVEYS
Several topographic profiles of the midoceanic ridge in the Pacific and Indian oceans have recently been published [H eezen, 1960, 1962; Ewing and Heezen, 1960]. Bathymetric data are still not [Lvailable for many areas in the South Pacific. Nevertheless, it is possible to compare existing dat1t with the recent epicentral determinations.
The ridge crossing near 500S, 139°E [lIeezen, 1962, Figure 16], has a well-defined rift valley similar to that seen in other profiles in the Atlantic and Indian oceans. Several other unpublished profiles between 1400 and 1500E, made during cruise 16 of Columbia University's R.V. Vema, indic1tte a narrow asymmetrical ridge that may be the expression of a fracture zone (B. C. Heezen, personal communication). The pattern of epicenters in this region shows some departure from a straight line, and it may indicate the presence of one or more fracture zones.
A precision depth sounding made from U.S.S. Glacier near 179°E [Heezen, 1960, p. 103J also shows a rift valley and very rugged relief near the ridge crest. A profile made by the R.V. Ob [Zhivago, 1962J near 166°E shows a wide central depression. However, rugged rift mountains and depths shallower than 1500 meters seem to be present only on the north side of the rift. Epicenters in the vieinity of these two profiles
6006 LYNN R. SYKES
are located near the crest of the oceanic ridge.
The profile of the midoceanic ridge near 58°S, 1500W, which was made during cruise 16 of the R.V. Vema [Heezen, 1962, Figure 16], is considerably different from other profiles in the Atlantic and Indian oceans. As Heezen [1962] has pointed out, this profile is in sharp contrast with the others in having its highest relief near the flanks of the ridge rather than near the crest. A rift valley was not observed for this profile. No epicenters were found within 200 km of the ridge crossing. The profile of the R.V. Ob near 1400W [Zhivago, 1962] shows a small depression near the ridge crest. The ships' tracks for these profiles are shown on the enlarged map of epicenters (Figure 2).
The Ob profile along 1600W indicates a
trough near 64 oS. The ridge crest is loca.ted near 61 ¥l oS. This position agrees with Menard's bathymetric contours (Figure 2). The epicenters and the bathymetry suggest that a fracture zone may be present in this region. Gutenberg and Richter [1954] reported an earthquake of magnitude 7.2 at 59%OS, 1600W, on December 15, 1947.
Two profiles of the west Chile ridge differ considerably from those already discussed. A profile near 41°S, 88°W, was made by the Scripps Institution of Oceanography, Expedition Downwind, and has been published by Heezen [1962, Figure 16]. The ridge crest has been described by Menard [1961] as a prominent ridge-and-trough topography. There is no single, well-defined rift valley. Similar topography can be seen from the Ob profile in the vicinity of 109°W and between 32° and 35°S. Figure 1 indicates that the west Chile ridge is seismically active in these regions.
Acknowledgments. It is a pleasure to thank Dr. Bruce C. Heezen of the Lamont Geological Observatory for furnishing information on the bathymetry in the Indian and Pacific oceans and for several very helpful discussions during the preparation of this paper. Dr. H. W. Menard of the Scripps Institution of Oceanography kindly furnished a copy of a bathymetric chart of the Pacific prior to publication. I am indebted to Drs. Ewing, Heezen, Oliver, and Sutton of the Lamont Observatory, who read the manuscript critically a.nd offered several helpful suggestions.
Computing facilities were made available by the Goddard Space Flight Center, Institute for Space Studies, New York.
Th� research was �artially supported through the All' Force Cambndge Research Laboratories
under contract AF19(604)7376 as part of the AdJ vanced Research Projects Agency's project Veh. Uniform. )
REFERENCES Benioff, H., Movements on major transcurrent
faults, in Continental Drift, edited by S. IiRuncorn, pp. 103-134, Academic Press, New York and London, 1962. l
Bolt, B. A., The revision of earthquake epicentre1 focal depths and origin-times using a high-speed l computer, Geophys. J., S, 433-440, 1960.
Ewing, M., and B. C. Heezen, Some problems of Antarctic submarine geology, in Antarctica ii the International Geophysical Year, edited h. A. Crary, L. Gould, E. Hulburt, H. Odishaw and W. Smith, pp. 75-81, Geophysical Monograph 1: American Geophysical Union, Washington,D.c: 1956. I
Ewing, M., and B. C. Heezen, Continuity of mid. oceanic ridge and rift valley in the southwest. ern Indian Ocean confirmed, Science, 131, 1677. 1679, 1960.
Fisher, R. L., editor, Preliminary report on R�. pedition Downwind, University of Californi�1 Scripps Institution of Oceanography, IGY crui�, to the Southeast Pacific, IGY World Data CenJ tel' A, IGY General Report Series, no. 2, 79 pp., National Academy of Sciences, Washington, D. C., 1958.
Gunst, R. H., and E. R. Engdahl, Progress report of USC&GS Hypocenter Computer Program, Earthquake Notes, 33, 93-96, 1962.
Gutenberg, B., and C. F. Richter, Seismicity oj the Earth, Princeton University Press, 1954. t
Heezen, B. C., The rift in the ocean fioor, Sci. Am,' 203(4),98-110,1960. ' I
Heezen, B. C., The deep-sea fioor, in Continental Drift, edited by S. K. Runcorn, pp. 235-288, Academic Press, New York and London, 1962.
Heezen, B. C., and M. Tharp , Physiographic dia· gram of the South Atlantic Ocean, the Caribbean Sea, the Scotia Sea, and the eastern margin � of the South Pacific Ocean, Geological Society of America , New York, 1961. ,
Menard, H. W., The east Pacific rise, Science,1S!, 1737-1746,1960.
Mena.rd, H. W., The east Pacific rise, Sci. Am" 205(6), 45-61, 1961.
Menard, H. W., Correlation between length and, offset on very large wrench faults, J. GeophYI.7 Res., 67, 4096-4098, 1962.
Richter, C. F., Elementary Seismology, W. H.i Freeman and Company, San Francisco, 1958. '
Von Herzen, R. P., and S. Uyeda, Heat flow I through the eastern Pacific Ocean fioor, J. Geophys. Res., 68, 4219-4250, 1963.
I
Zhivago, A. V., Outlines of southern ocean geo-j morphology , in Antarctic Research, edited by H. Wexler, M. Rubin, and J. Caskey, Jr., pp. 74-, 80, Geophysical Monograph 7, American Geophysical Union, Washington, D. C., 1962.
(Manuscript received May 25, 1963; revised August 15, 1963.)


![Indo-Pacific Climate Modes in Warming Climate: Consensus ...Indian Ocean dipole . Indian Ocean basin warming . Indo-western Pacific ocean ... [17], inducing a north Indian Ocean (NIO)](https://img.dokumen.tips/doc/110x75/611a7e4e613a58782f2e061c/indo-pacific-climate-modes-in-warming-climate-consensus-indian-ocean-dipole.jpg)