Embed Size (px)
Citation preview
Tectonophysics 472 (2009) 148–157
Contents lists available at ScienceDirect
Tectonophysics
j ourna l homepage: www.e lsev ie r.com/ locate / tecto
Seismic imaging and modelling of the lithosphere of SW-Iberia
I. Flecha a,⁎, I. Palomeras a,1, R. Carbonell a,1, F. Simancas b,2, P. Ayarza c,3,J. Matas d,4, F. González-Lodeiro b,2, A. Pérez-Estaún a,1
a Departament de Geofísica i Tectònica, Institut de Ciències de la Terra “Jaume, Almera”-CSIC, C/ Lluis Solé i Sabaris s/n, 08028 Barcelona, Spainb Departamento de Geodinámica, Universidad de Granada, Av. Fuentenueva, s/n, 18071 Granada, Spainc Departamento de Geología, Universidad de Salamanca, 37008 Salamanca, Spaind Instituto Geológico Minero de España, C/ Ríos Rosas, 23, 28003 Madrid, Spain
⁎ Corresponding author. Tel.: +34 93 409 54 10; fax:E-mail addresses: [email protected] (I. Flecha), ipalo
[email protected] (R. Carbonell), [email protected] (F. Sim(P. Ayarza), [email protected] (F. González-Lodeiro), andre
1 Tel.: +34 93 409 54 10; fax: +34 93 411 00 12.2 Tel.: +34 958 24 33 53; fax: +34 958 24 85 27.3 Tel.: +34 923 29 44 88.4 Tel.: +34 91 349 57 00.
0040-1951/$ – see front matter © 2008 Elsevier B.V. Adoi:10.1016/j.tecto.2008.05.033
A B S T R A C T
A R T I C L E I N F OArticle history:
Data from a closely spaced Received 21 March 2007Received in revised form 29 April 2008Accepted 15 May 2008Available online 5 June 2008Keywords:Wide-angle stackMafic intrusionsCrustal heterogeneities
wide-angle transect has been used to study the middle-to-lower crust and theMoho in SW-Iberia. A low-fold wide-angle stack image reveals a highly heterogeneous seismic signature atlower-crustal levels changing laterally along the profile. The lower crust features an irregular distribution ofthe reflectivity that can be explained by a heterogeneous distribution of physical properties. The Mohodiscontinuity also features a high variability in its seismic character that correlates with the different tectonicterranes in the area. A 2D finite difference code was used for solving the elastic wave equation and to providesynthetic wide-angle shots. Relatively simple layer cake model derived from conventional refractioninterpretation generates the main events of the shot records. However, these models cannot account for thelateral variability of the seismic signature. In order to obtain more realistic simulations, the velocity modelwas modified introducing stochastic lensing at different levels within the crust. The Moho was modelled as a3 km thick layered structure. The resulting average velocity models include a high velocity layer at mid-crustal depth, a highly reflective lower crust and a relatively thin horizontal Moho. This heterogeneous modelcan be achieved by lensing within the crust, a layered mafic intrusion and a strongly laminated lower crustand Moho.
© 2008 Elsevier B.V. All rights reserved.
1. Introduction
The lower crust and theMoho aremajor issues in deep geophysicalprospecting. The knowledge about these parts of the Earth crust islimited because of the lack of direct information at this level of thelithosphere. Nevertheless, some outcrops have been identified ascorresponding to lower crust materials. Good examples are the CaboOrtegal complex (Peucat et al., 1990; Galán and Marcos, 1997;Martínez-Catalán et al., 1997; Santos-Zalduegui et al., 1997) and theIvrea Zone (North Italy; Rutter et al., 1999). In both these cases severalstudies have been carried out and their crustal composition and thedistribution of physical properties are well known (Holliger andLevander, 1992; Holliger et al., 1993; Levander et al., 1994b). Since thelower continental crust is not accessible for direct investigation, themain source of information about its physical properties andcomposition comes from indirect methods such as deep seismic
+34 93 411 00 [email protected] (I. Palomeras),ancas), [email protected]
[email protected] (A. Pérez-Estaún).
ll rights reserved.
surveys. Seismic vertical incidence reflection profiles provide imageswhere geometric information about the crustal structure can beobtained and wide-angle experiments provide data about physicalproperties (P-wave and S-wave velocities). These physical propertiescan then be inverted to composition by comparing with lithologiesmeasured in laboratories. Results from these methodologies and itscorrect interpretation are probably the best tools available in order tounderstand geological processes at lithospheric scale.
Since the early 1990's, a large research effort has been devoted tostudying SW-Iberia (e.g., the EUROPROBE (Ribeiro et al., 1996) andGEODE (Blundel et al., 2005) international programmes). One of themain objectives of these programmes was the acquisition of the highresolution normal incidence deep seismic reflection transect IBERSEIS(Simancas et al., 2003; Carbonell et al., 2004). The presence of largemineral deposits in the southwestern part of the Iberian Península,within the Pyrite Belt, and surrounding areas, suggests that the crustfeatures particular physical properties and that it underwent asingular tectonic evolution. Therefore, extensive geological andgeophysical research has been undertaken in the area.
The project IBERSEIS-WA consisted in two wide-angle transectsacquired in SW-Iberia. A wide-angle stack of one of the wide-angledataset (transect B, Fig.1) is presented in this study. The specific targetof this research is the nature of the lower crust and Moho. Further-more, synthetic seismicmodelling is carried out in order to explain the
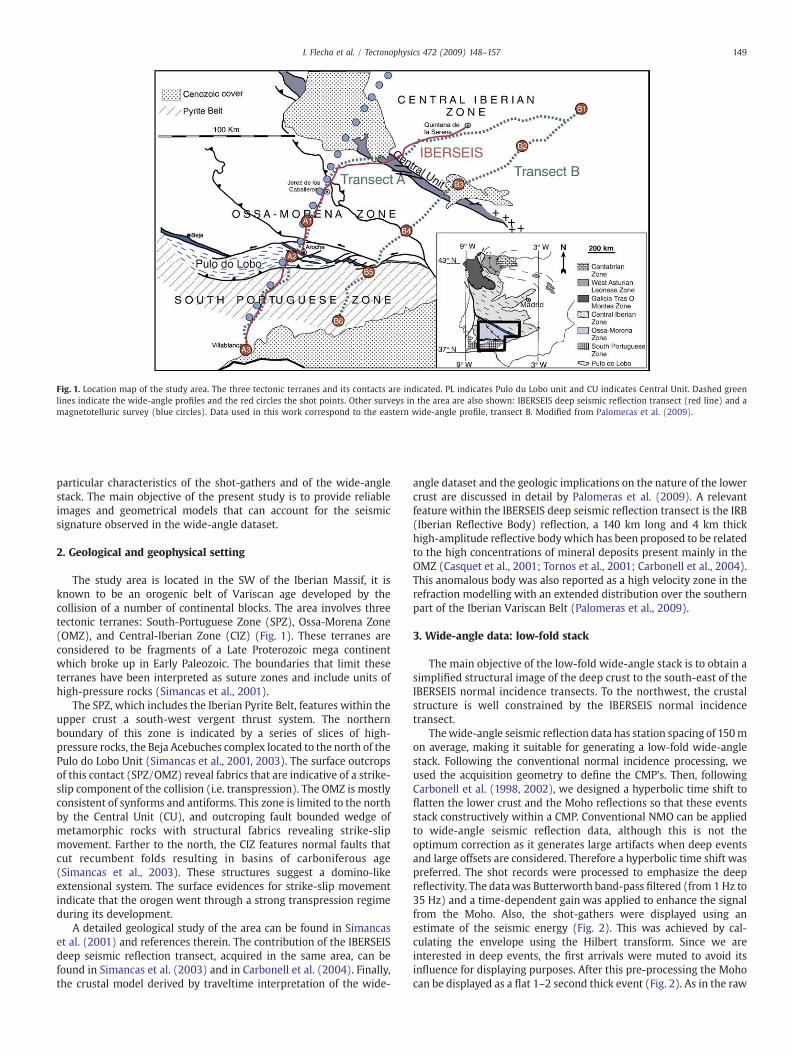
Fig. 1. Location map of the study area. The three tectonic terranes and its contacts are indicated. PL indicates Pulo du Lobo unit and CU indicates Central Unit. Dashed greenlines indicate the wide-angle profiles and the red circles the shot points. Other surveys in the area are also shown: IBERSEIS deep seismic reflection transect (red line) and amagnetotelluric survey (blue circles). Data used in this work correspond to the eastern wide-angle profile, transect B. Modified from Palomeras et al. (2009).
149I. Flecha et al. / Tectonophysics 472 (2009) 148–157
particular characteristics of the shot-gathers and of the wide-anglestack. The main objective of the present study is to provide reliableimages and geometrical models that can account for the seismicsignature observed in the wide-angle dataset.
2. Geological and geophysical setting
The study area is located in the SW of the Iberian Massif, it isknown to be an orogenic belt of Variscan age developed by thecollision of a number of continental blocks. The area involves threetectonic terranes: South-Portuguese Zone (SPZ), Ossa-Morena Zone(OMZ), and Central-Iberian Zone (CIZ) (Fig. 1). These terranes areconsidered to be fragments of a Late Proterozoic mega continentwhich broke up in Early Paleozoic. The boundaries that limit theseterranes have been interpreted as suture zones and include units ofhigh-pressure rocks (Simancas et al., 2001).
The SPZ, which includes the Iberian Pyrite Belt, features within theupper crust a south-west vergent thrust system. The northernboundary of this zone is indicated by a series of slices of high-pressure rocks, the Beja Acebuches complex located to the north of thePulo do Lobo Unit (Simancas et al., 2001, 2003). The surface outcropsof this contact (SPZ/OMZ) reveal fabrics that are indicative of a strike-slip component of the collision (i.e. transpression). The OMZ is mostlyconsistent of synforms and antiforms. This zone is limited to the northby the Central Unit (CU), and outcroping fault bounded wedge ofmetamorphic rocks with structural fabrics revealing strike-slipmovement. Farther to the north, the CIZ features normal faults thatcut recumbent folds resulting in basins of carboniferous age(Simancas et al., 2003). These structures suggest a domino-likeextensional system. The surface evidences for strike-slip movementindicate that the orogen went through a strong transpression regimeduring its development.
A detailed geological study of the area can be found in Simancaset al. (2001) and references therein. The contribution of the IBERSEISdeep seismic reflection transect, acquired in the same area, can befound in Simancas et al. (2003) and in Carbonell et al. (2004). Finally,the crustal model derived by traveltime interpretation of the wide-
angle dataset and the geologic implications on the nature of the lowercrust are discussed in detail by Palomeras et al. (2009). A relevantfeature within the IBERSEIS deep seismic reflection transect is the IRB(Iberian Reflective Body) reflection, a 140 km long and 4 km thickhigh-amplitude reflective bodywhich has been proposed to be relatedto the high concentrations of mineral deposits present mainly in theOMZ (Casquet et al., 2001; Tornos et al., 2001; Carbonell et al., 2004).This anomalous body was also reported as a high velocity zone in therefraction modelling with an extended distribution over the southernpart of the Iberian Variscan Belt (Palomeras et al., 2009).
3. Wide-angle data: low-fold stack
The main objective of the low-fold wide-angle stack is to obtain asimplified structural image of the deep crust to the south-east of theIBERSEIS normal incidence transects. To the northwest, the crustalstructure is well constrained by the IBERSEIS normal incidencetransect.
Thewide-angle seismic reflection data has station spacing of 150mon average, making it suitable for generating a low-fold wide-anglestack. Following the conventional normal incidence processing, weused the acquisition geometry to define the CMP's. Then, followingCarbonell et al. (1998, 2002), we designed a hyperbolic time shift toflatten the lower crust and the Moho reflections so that these eventsstack constructively within a CMP. Conventional NMO can be appliedto wide-angle seismic reflection data, although this is not theoptimum correction as it generates large artifacts when deep eventsand large offsets are considered. Therefore a hyperbolic time shift waspreferred. The shot records were processed to emphasize the deepreflectivity. The datawas Butterworth band-pass filtered (from 1 Hz to35 Hz) and a time-dependent gain was applied to enhance the signalfrom the Moho. Also, the shot-gathers were displayed using anestimate of the seismic energy (Fig. 2). This was achieved by cal-culating the envelope using the Hilbert transform. Since we areinterested in deep events, the first arrivals were muted to avoid itsinfluence for displaying purposes. After this pre-processing the Mohocan be displayed as a flat 1–2 second thick event (Fig. 2). As in the raw
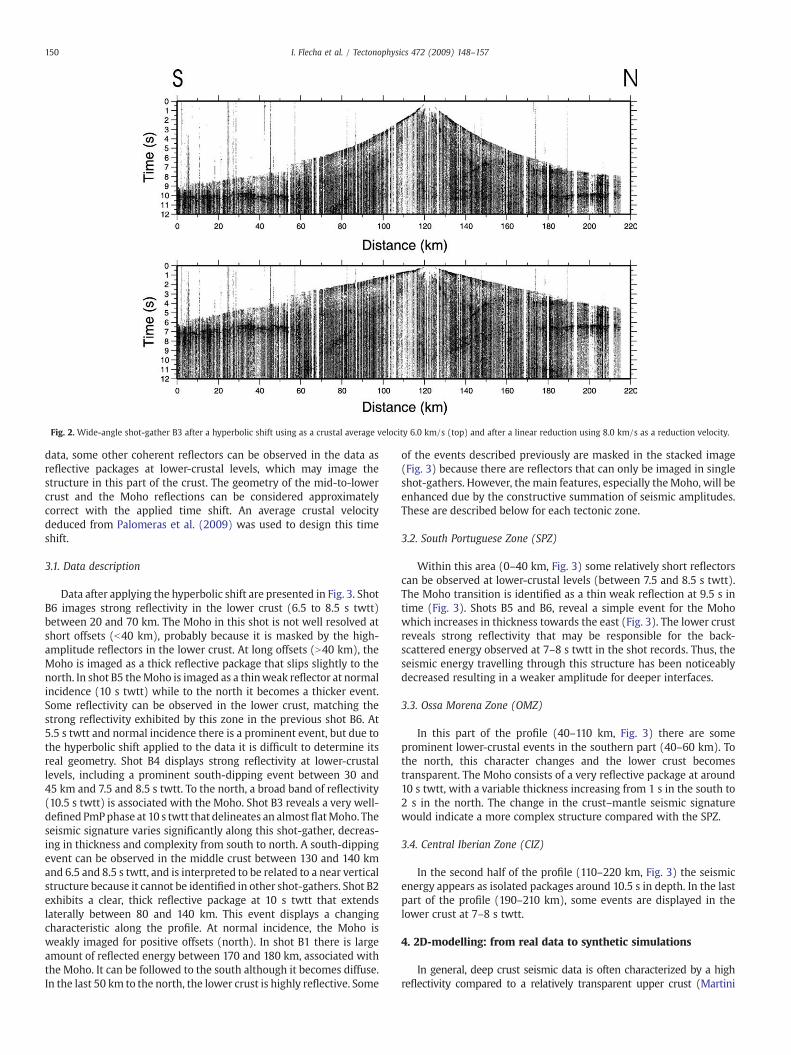
Fig. 2. Wide-angle shot-gather B3 after a hyperbolic shift using as a crustal average velocity 6.0 km/s (top) and after a linear reduction using 8.0 km/s as a reduction velocity.
150 I. Flecha et al. / Tectonophysics 472 (2009) 148–157
data, some other coherent reflectors can be observed in the data asreflective packages at lower-crustal levels, which may image thestructure in this part of the crust. The geometry of the mid-to-lowercrust and the Moho reflections can be considered approximatelycorrect with the applied time shift. An average crustal velocitydeduced from Palomeras et al. (2009) was used to design this timeshift.
3.1. Data description
Data after applying the hyperbolic shift are presented in Fig. 3. ShotB6 images strong reflectivity in the lower crust (6.5 to 8.5 s twtt)between 20 and 70 km. The Moho in this shot is not well resolved atshort offsets (b40 km), probably because it is masked by the high-amplitude reflectors in the lower crust. At long offsets (N40 km), theMoho is imaged as a thick reflective package that slips slightly to thenorth. In shot B5 theMoho is imaged as a thinweak reflector at normalincidence (10 s twtt) while to the north it becomes a thicker event.Some reflectivity can be observed in the lower crust, matching thestrong reflectivity exhibited by this zone in the previous shot B6. At5.5 s twtt and normal incidence there is a prominent event, but due tothe hyperbolic shift applied to the data it is difficult to determine itsreal geometry. Shot B4 displays strong reflectivity at lower-crustallevels, including a prominent south-dipping event between 30 and45 km and 7.5 and 8.5 s twtt. To the north, a broad band of reflectivity(10.5 s twtt) is associated with the Moho. Shot B3 reveals a very well-defined PmPphase at 10 s twtt that delineates an almostflatMoho. Theseismic signature varies significantly along this shot-gather, decreas-ing in thickness and complexity from south to north. A south-dippingevent can be observed in the middle crust between 130 and 140 kmand 6.5 and 8.5 s twtt, and is interpreted to be related to a near verticalstructure because it cannot be identified in other shot-gathers. Shot B2exhibits a clear, thick reflective package at 10 s twtt that extendslaterally between 80 and 140 km. This event displays a changingcharacteristic along the profile. At normal incidence, the Moho isweakly imaged for positive offsets (north). In shot B1 there is largeamount of reflected energy between 170 and 180 km, associated withthe Moho. It can be followed to the south although it becomes diffuse.In the last 50 km to the north, the lower crust is highly reflective. Some
of the events described previously are masked in the stacked image(Fig. 3) because there are reflectors that can only be imaged in singleshot-gathers. However, the main features, especially theMoho, will beenhanced due by the constructive summation of seismic amplitudes.These are described below for each tectonic zone.
3.2. South Portuguese Zone (SPZ)
Within this area (0–40 km, Fig. 3) some relatively short reflectorscan be observed at lower-crustal levels (between 7.5 and 8.5 s twtt).The Moho transition is identified as a thin weak reflection at 9.5 s intime (Fig. 3). Shots B5 and B6, reveal a simple event for the Mohowhich increases in thickness towards the east (Fig. 3). The lower crustreveals strong reflectivity that may be responsible for the back-scattered energy observed at 7–8 s twtt in the shot records. Thus, theseismic energy travelling through this structure has been noticeablydecreased resulting in a weaker amplitude for deeper interfaces.
3.3. Ossa Morena Zone (OMZ)
In this part of the profile (40–110 km, Fig. 3) there are someprominent lower-crustal events in the southern part (40–60 km). Tothe north, this character changes and the lower crust becomestransparent. The Moho consists of a very reflective package at around10 s twtt, with a variable thickness increasing from 1 s in the south to2 s in the north. The change in the crust–mantle seismic signaturewould indicate a more complex structure compared with the SPZ.
3.4. Central Iberian Zone (CIZ)
In the second half of the profile (110–220 km, Fig. 3) the seismicenergy appears as isolated packages around 10.5 s in depth. In the lastpart of the profile (190–210 km), some events are displayed in thelower crust at 7–8 s twtt.
4. 2D-modelling: from real data to synthetic simulations
In general, deep crust seismic data is often characterized by a highreflectivity compared to a relatively transparent upper crust (Martini
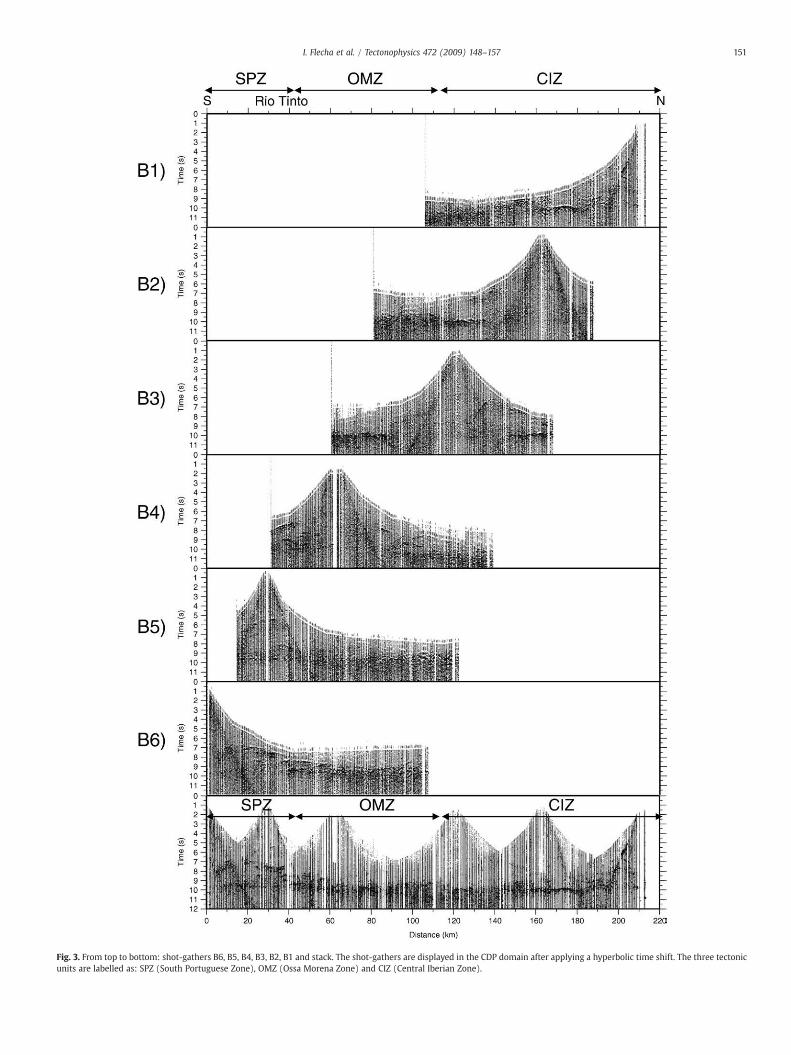
Fig. 3. From top to bottom: shot-gathers B6, B5, B4, B3, B2, B1 and stack. The shot-gathers are displayed in the CDP domain after applying a hyperbolic time shift. The three tectonicunits are labelled as: SPZ (South Portuguese Zone), OMZ (Ossa Morena Zone) and CIZ (Central Iberian Zone).
151I. Flecha et al. / Tectonophysics 472 (2009) 148–157
152 I. Flecha et al. / Tectonophysics 472 (2009) 148–157
et al., 2001). This reflectivity is normallycomposedof short, discontinuousreflections which usually appear in distinct packages confined to one ormore parts of the crust (Holliger and Levander, 1992). It has beenproposed that relatively small changes in composition and/or meta-morphic grade, may substantially affect the reflectivity of the lower crust(Holligeret al.,1993).Otherwise, observed reflection amplitudes areoftenlarger than the ones predicted by the reflection coefficients based oncrustal compositionwhich can be explained by the result of constructiveinterference between individual reflection wavelets (Hurich and Smith-son, 1987). Reflection coefficients and reflection amplitudes are depen-dent upon the contrasts in acoustic impedance and not on bulk velocity(Deemer and Hurich, 1994), therefore a layered lower crust could beconsidered to justify these coefficients. This optionwould also account forreverberations in the data that cannot be explained by a single reflectinginterface. The seismic signature featured by the acquired data can also beachieved by considering a lateral and vertical randomvelocity fluctuation(Gibson and Levander, 1988; Carbonell and Smithson, 1991). Isotropicrandomvariations are consistent withmodels of lower-crustal petrologicprocesses, which may include igneous intrusions (Gibson and Levander,1988). Hence, the most plausible scenario to satisfactorily describe thefield data may consist of a random lamination or lensing coupled withrandom changes in rock properties. It has been shown that reflectionseismic lines shot in the Variscan orogen display a strongly reflectivelower crust characterized by numerous short horizontally embeddedreflectors (Wenzel et al.,1987). Furthermore,field observations show thatthe crystalline rocks of the continental crust are often characterizedby compositional variations at many scales (Hurich and Smithson,1987) spanning at least seven orders of magnitude, from microfabrics(≤10−3 m) to major crustal units (≥104 m) (Holliger et al., 1994).
Seismic theory establishes that Fresnel diameter is given by:
d≈
ffiffiffiffiffiffiffiffiffiffiffiffiffiffiffiffiffiffiffiffiffiffi2zλ +
λ2
4
sð1Þ
and is the smallest resolvable feature in unmigrated seismic data,delimiting the measure of lateral resolution. Hence, crustal features
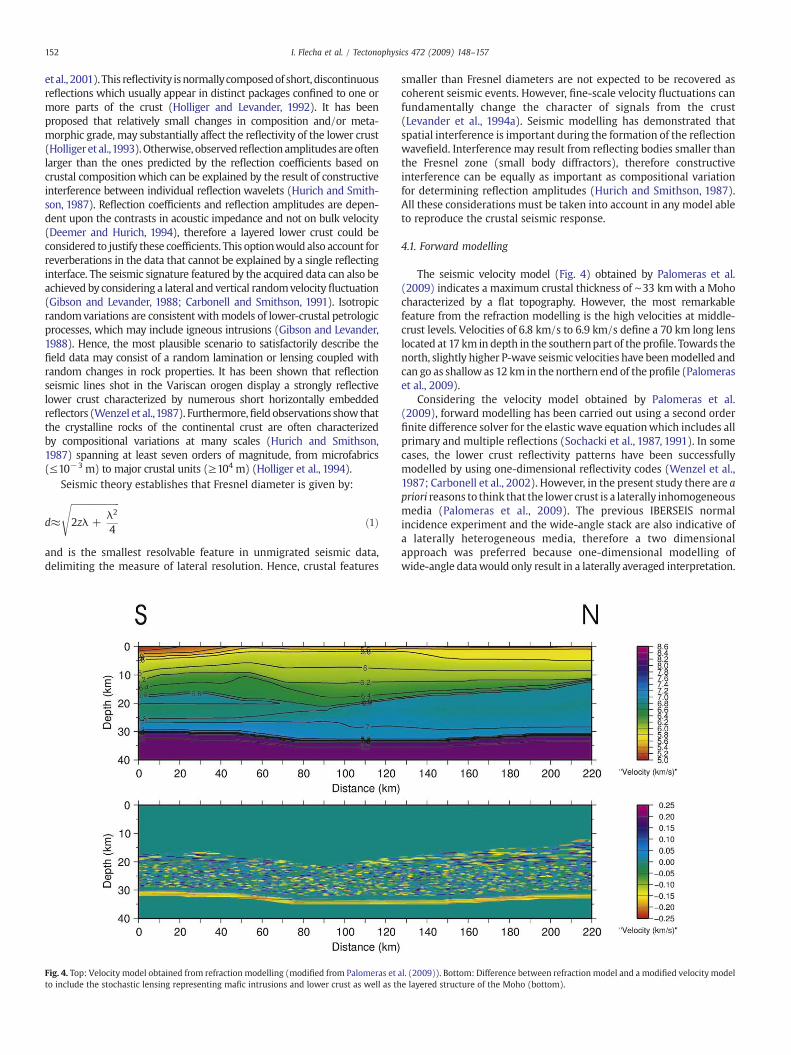
Fig. 4. Top: Velocity model obtained from refraction modelling (modified from Palomeras etto include the stochastic lensing representing mafic intrusions and lower crust as well as th
smaller than Fresnel diameters are not expected to be recovered ascoherent seismic events. However, fine-scale velocity fluctuations canfundamentally change the character of signals from the crust(Levander et al., 1994a). Seismic modelling has demonstrated thatspatial interference is important during the formation of the reflectionwavefield. Interference may result from reflecting bodies smaller thanthe Fresnel zone (small body diffractors), therefore constructiveinterference can be equally as important as compositional variationfor determining reflection amplitudes (Hurich and Smithson, 1987).All these considerations must be taken into account in any model ableto reproduce the crustal seismic response.
4.1. Forward modelling
The seismic velocity model (Fig. 4) obtained by Palomeras et al.(2009) indicates a maximum crustal thickness of ∼33 kmwith a Mohocharacterized by a flat topography. However, the most remarkablefeature from the refraction modelling is the high velocities at middle-crust levels. Velocities of 6.8 km/s to 6.9 km/s define a 70 km long lenslocated at 17 km in depth in the southernpart of the profile. Towards thenorth, slightly higher P-wave seismic velocities have beenmodelled andcan go as shallowas 12 km in the northern end of the profile (Palomeraset al., 2009).
Considering the velocity model obtained by Palomeras et al.(2009), forward modelling has been carried out using a second orderfinite difference solver for the elastic wave equationwhich includes allprimary and multiple reflections (Sochacki et al., 1987, 1991). In somecases, the lower crust reflectivity patterns have been successfullymodelled by using one-dimensional reflectivity codes (Wenzel et al.,1987; Carbonell et al., 2002). However, in the present study there are apriori reasons to think that the lower crust is a laterally inhomogeneousmedia (Palomeras et al., 2009). The previous IBERSEIS normalincidence experiment and the wide-angle stack are also indicative ofa laterally heterogeneous media, therefore a two dimensionalapproach was preferred because one-dimensional modelling ofwide-angle datawould only result in a laterally averaged interpretation.
al. (2009)). Bottom: Difference between refraction model and a modified velocity modele layered structure of the Moho (bottom).
153I. Flecha et al. / Tectonophysics 472 (2009) 148–157
The P-wave velocity model derived from the refraction processing andinterpretation was resampled using a 25×25 m grid which isappropriate for modelling crustal-scale seismic data. As the elasticapproximation was used, also density and S-wave velocity wereintroduced as inputs in the code. The S-wave was calculated from theP-wave velocity using a Vp/Vs ratio of
ffiffiffi3
p, and the density model was
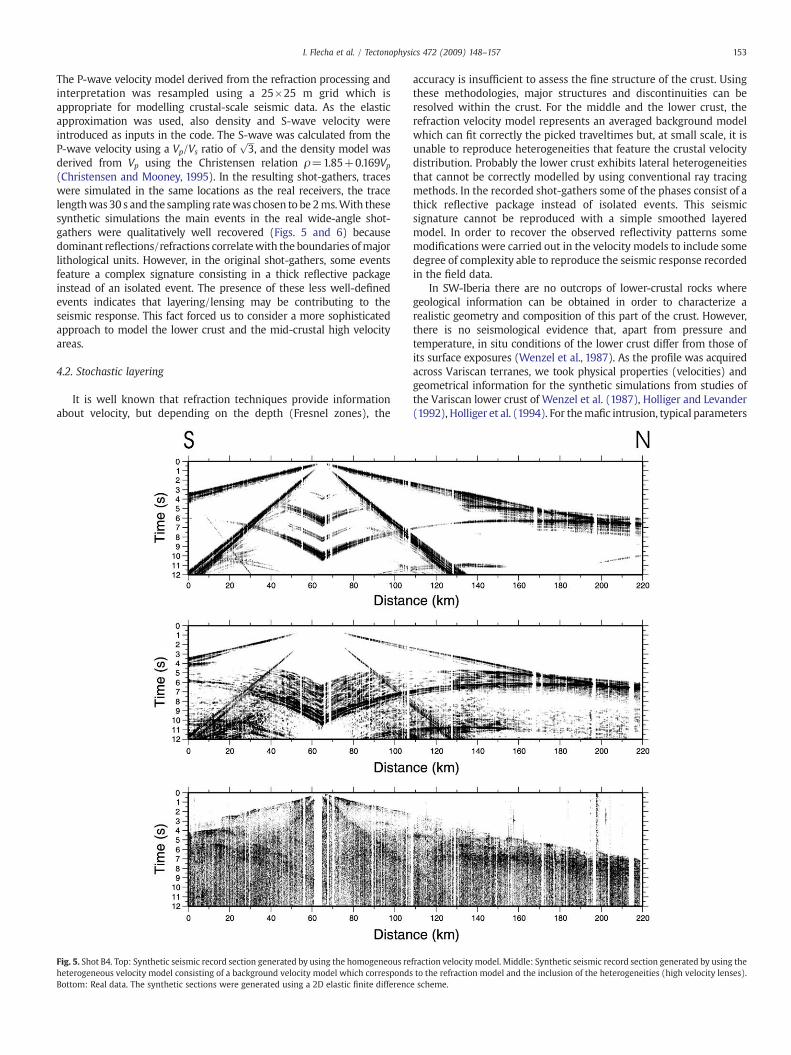
derived from Vp using the Christensen relation ρ=1.85+0.169Vp(Christensen and Mooney, 1995). In the resulting shot-gathers, traceswere simulated in the same locations as the real receivers, the tracelengthwas30 s and the sampling ratewas chosen to be 2ms.With thesesynthetic simulations the main events in the real wide-angle shot-gathers were qualitatively well recovered (Figs. 5 and 6) becausedominant reflections/refractions correlatewith the boundaries ofmajorlithological units. However, in the original shot-gathers, some eventsfeature a complex signature consisting in a thick reflective packageinstead of an isolated event. The presence of these less well-definedevents indicates that layering/lensing may be contributing to theseismic response. This fact forced us to consider a more sophisticatedapproach to model the lower crust and the mid-crustal high velocityareas.
4.2. Stochastic layering
It is well known that refraction techniques provide informationabout velocity, but depending on the depth (Fresnel zones), the
Fig. 5. Shot B4. Top: Synthetic seismic record section generated by using the homogeneous reheterogeneous velocity model consisting of a background velocity model which correspondsBottom: Real data. The synthetic sections were generated using a 2D elastic finite differenc
accuracy is insufficient to assess the fine structure of the crust. Usingthese methodologies, major structures and discontinuities can beresolved within the crust. For the middle and the lower crust, therefraction velocity model represents an averaged background modelwhich can fit correctly the picked traveltimes but, at small scale, it isunable to reproduce heterogeneities that feature the crustal velocitydistribution. Probably the lower crust exhibits lateral heterogeneitiesthat cannot be correctly modelled by using conventional ray tracingmethods. In the recorded shot-gathers some of the phases consist of athick reflective package instead of isolated events. This seismicsignature cannot be reproduced with a simple smoothed layeredmodel. In order to recover the observed reflectivity patterns somemodifications were carried out in the velocity models to include somedegree of complexity able to reproduce the seismic response recordedin the field data.
In SW-Iberia there are no outcrops of lower-crustal rocks wheregeological information can be obtained in order to characterize arealistic geometry and composition of this part of the crust. However,there is no seismological evidence that, apart from pressure andtemperature, in situ conditions of the lower crust differ from those ofits surface exposures (Wenzel et al., 1987). As the profile was acquiredacross Variscan terranes, we took physical properties (velocities) andgeometrical information for the synthetic simulations from studies ofthe Variscan lower crust of Wenzel et al. (1987), Holliger and Levander(1992), Holliger et al. (1994). For themafic intrusion, typical parameters
fraction velocity model. Middle: Synthetic seismic record section generated by using theto the refraction model and the inclusion of the heterogeneities (high velocity lenses).
e scheme.

Fig. 6. Shot B5. Top, middle and bottom images correspond to the same than in Fig. 5 for the shot B4.
154 I. Flecha et al. / Tectonophysics 472 (2009) 148–157
were taken from Deemer and Hurich (1994). At a small scale, adeterministic description of structures is unreasonable (Holliger et al.,1994), therefore a stochastic approach was applied. A new velocitymodel was built based on the one obtained by seismic refraction asstartingpoint. The upper andmiddle crustwere left unchangedwhereasthe high velocity layer, the lower crust and theMoho discontinuityweremodified introducing lensing at different scales. The lensing wasachieved by considering a set of ellipses randomly distributed alongthe high velocity layer and the lower crust. The center of every ellipsewas chosen using a random function. The parameters defining theellipse (semimajor axis and semiminor axis) were chosen arbitrarilyranging between aminimumand amaximumcorrelation length in bothaxes. Finally, the velocity for every ellipse was also randomly chosenconsidering a maximumvariation of the aleatory measurements within
Table 1Values used to modify the refraction velocity model in order to obtain a random layeredmodel for the mafic intrusion, the lower crust and the Moho discontinuity.
Mafic Intrusion Lower crust Moho
Bulk velocity (km/s) 6.7 7.1 7.85Velocity variation (km/s) ±0.2 ±0.2 ±0.25X dimension (km) 1–3 0.4–1.2 5–25Z dimension (km) 0.1–0.2 0.025–0.2 0.025–0.1
Values were approximated from the literature (Wenzel et al., 1987; Holliger andLevander, 1992; Deemer and Hurich, 1994; Holliger et al., 1994).
the range of possible values of velocities for lithologies possible at thisdepth. The limit values for dimensions and velocities are summarized inTable 1. Both velocitymodels (with andwithout stochastic layering) aredisplayed in Fig. 4.
The Moho can be identified because it features a sharp change invelocity. Classically, the Moho has been considered as a velocitydiscontinuity with some lateral continuity. Most authors tend tomodel this as a simple interface, a line avoiding any additionalstructure except by its topography. However, some studies haveproposed a concentration of lamellae without laterally continuousvelocity discontinuity to explain complex patterns in wide-angle data(Long et al., 1994). In our case, the Mohowas modelled as a 3 kmwidestrip centered in the digitized Moho from the refraction modelling(7.85 km/s isovelocity line). Along this strip a random lensing wasperformed following the same stochastic process as before. Resultsfrom these simulations provide a more reflective lower crust as aresult of the constructive interference between lenses. The Mohodiscontinuity is imaged as a 1 second reflective band which betterreproduces the real data (Figs. 5 and 6).
5. Discussion
The Moho discontinuity is clearly imaged in the six shot-gathersconsidered in the present work (Fig. 3). In the data acquired to thesouth, it appears as a simple thinweak event (shots B5 and B6) around9.5 s in twtt. Towards the north, theMoho signature changes gradually

155I. Flecha et al. / Tectonophysics 472 (2009) 148–157
increasing in thickness, amplitude and complexity (shots B1, B2 andB3). To the north, this seismic event seems to be slightly deeper(10 s twtt) than in the southern edge. At large scale, the Moho can beconsidered as a flat interface, some prominent events in the north-ernmost shots of the profile may indicate a variation in its topography.Other prominent events can be identified in individual shots at lower-crustal levels but its nature as well as its real geometry is difficult toassess because of the hyperbolic time correction applied. However,these reflectors are indicative of complex structures within the base ofthe crust. Forward seismic modelling showed that data generatedusing the refraction model is able to recover the main seismic eventslinked to major discontinuities in the velocity model but, it isinsufficient to justify complex seismic patterns observed in real data.In order to better reproduce the real seismic signature, heterogene-ities must be considered. Introducing lensing/layering in maficintrusions, lower crust and Moho, more realistic simulations areachieved where interference between small diffractor bodies (lenses)can qualitatively account for the coda observed in field shot records.
The variations in the seismic signature of lower crust and Moho aswell as the changes in reflectivity patterns along the profile stronglyevidence a very heterogeneous crust. Although the image lacks thequality of a continuous normal incidence stack, it is possible todistinguish different areas in the lower crust based on the differencesin seismic signature. Moreover, this wide-angle transect extends tothe south and east, beneath the well known Iberian Pyrite Belt, theknowledge provided by the published results for the IBERSEIS profilewhere the Moho appears at around 10.5 s twtt (Simancas et al., 2003;Carbonell et al., 2004). The seismic data is congruent with an idealizedmodel that consists of strongly layered high velocity intrusions in themid-crust, a heterogeneous lower crust and a laminated Moho, thinand simple beneath the SPZ, and thicker and more complex beneaththe OMZ and CIZ (Fig. 7).
Additional work would be required to better understand thedistribution of acoustic properties of the lower crust as well as thedetailed structure of the Moho discontinuity for instance, adding in-formation from S-wave data.
The wide-angle stack coupled with the synthetic modellingsuggests that the crust beneath the study area features stronglylaminated zones at mid-crustal depths which are characterized byrelatively high velocities (Fig. 4). This zones account for the relativelyhigh frequency reflectivity at mid-crustal depth approximately at 5 to7 s twtt (shots B1, B4, B5 and B6) and in the wide-angle stack. Thevelocities and the high frequency reflectivity are consistent withlayered mafic intrusions (Palomeras et al., 2009). Deemer and Hurich(1994) indicated that thin layered mafic intrusions can result in highacoustic impedances. The lower crust has been modelled as a layerwith a medium degree of heterogeneity and/or lamination. This result
Fig. 7. Cartoon model that would account for the wide-angle data: layering/lensing in middterranes SPZ, OMZ and CIZ.
in a heterogeneous lower crust with lenses and/or deformed layeringcomposed of gabbronorite to pyroxene quartz, some intrusives,gabbrodiorites intermixed with garnet granulites (Saleeby et al.,2003). These lithologies distributed in lense lense-like structuresinterfingering each other can account for the observed lower-crustalreflectivity.
The Moho has been modelled as consisting of a thinly laminatedstructure. The Moho is thicker in the center of the orogen wherethe reflectivity is higher and the band of reflectivity thicker. Thereflection coefficients are also high towards the northern end of thetransect. The Moho discontinuity also features lensing stronglydevelop and heterogeneous beneath the core of the orogen (thecenter of the transect beneath shot points B3 and B4) this lensingis most probably a mixture of lithologies that can include spinelperidotite layers interfingering garnet peridotite and gabbros(Saleeby et al., 2003; Palomeras et al., 2009).
The wide-angle stack does not constrain the upper crust, howeverit provides information on the mid-to-lower crust. The 1 to 2 s thickband of high reflectivity observed at the base of the crust in the wide-angle stack which can be accounted for by the models suggests thatthe lower crust and Moho are relatively young structures mostprobably developed in the late stages of the collision and a result ofthe crustal re-equilibration. After the collision and the strike-slipmovements, during the late stages of the transpression tectonics,intense lithospheric processes were taking place, intense lower-crustal deformation, subcrustal erosion of the crustal orogenic root,most probably large amounts of upper mantle mafic melts intruded inthe lower and middle crust and in some cases even up to the surfacecreating a unique tectonic evolution scenario which favored thedevelopment of the unprecedented large scale sulphide depositsobserved at the surface. The mantle material also ponded at Moholevel in the shape of thin lamelae. Thus, the signature of the terraneswas not preserved with depth, rather the lower crust and Mohobehave different than the upper crust during the transpression. Thelower crust and Moho are most probably a result of the deformationand therefore the present day structure is a consequence of the re-equilibration processes during the late stages of the transpression. Thetranspression erasedmost of the characteristic features of the terranesand collision at lower crust and Moho depths.
Geologically, the mid-to-lower-crustal heterogeneities could berepresented by elongated lenses featuring high seismic velocities.These are embedded into the mid-lower crust representing sillsintrusions of mafic material which has been emplaced in weak zoneswithin the crust (i.e., previous fractures). The synthetic seismic dataproduced by the model features interfingering domains of high-amplitude layered reflectivity. The seismic fabric and the high-amplitude reflectivity are consistent with layering caused by multiple
le-crust mafic intrusions, lower crust and Moho discontinuity, across the three tectonic
156 I. Flecha et al. / Tectonophysics 472 (2009) 148–157
sill lense type intrusions. The intrusion of mafic magmas in the crustassimilated part of the surrounding rocks, leaving behind relativelylarge amount of restites. These restites would be embeddedwithin thelower crust resulting inmore competent, higher velocity layers/lenses.
The mafic intrusion in the middle crust must have preferentiallyemplaced in an existing weak zones (i.e., faults, detachments). TheIBERSEIS normal incidence image revealed evidences for basaldetachment beneath the imbricate thrust system of the SPZ at mid-crustal depth. Which is consistent with the mid-crustal reflectivityidentified in the southern end of the transect (shots B5 and B6).
Beneath the SPZ (Fig. 7) mafic layering is located at approximately20 km depth. This layering must be simple, it most probably consist ofa few relatively large sills. This structure needs to be strongly reflectivebecause of the high-amplitude reflectivity at 7 s twtt in shots B5 andB6. Nevertheless it needs to be simple because the PMP reflection fromthe Moho can be identified at normal incidence offsets as a relativelythin reflection beneath this zone.
Beneath the OMZ, the band of reflectivity at themid-to-lower crusttowards the north is more transparent. Nevertheless the seismicsignature of the Moho is thicker and increases slightly in depth. Thethin relatively continuous PMP reflection beneath the SPZ turns into athicker reflective band with reflection events with relatively shortlateral continuity. This is qualitatively consistent with a thickerlayered Moho composed of interlayering of high and low velocitylenses. This is most probably the result of the re-equilibration process,the assimilation of the root of the orogen on the OMZ whichcorresponds to the core of the orogen. The seismic response of theMoho discontinuity is strongly affected by the lateral dimensions ofthe overlying structures. These structures disperse the energy anddeform the wavefront breaking up the reflection events.
Beneath the CIZ the Moho reflectivity evolves from relatively thick0.7–1 event to a thinner and weaker event at the northern edge of thetransect. This feature and the increase in reflectivity of the mid-to-lower crust have been simulated by introducing a layer of sills thatincreases in thickness towards the north, at 15 to 20 km in depth. Thismid-crustal feature is consistent and it might represent the IRB(Iberian Reflective Body) beneath this transect. The IRBwas imaged bythe IBERSEIS transect which is located farther to the north-west(Fig. 1). This mid-crustal complex sill intrusion will affect the seismicsignature of the Moho resulting in a weaker event.
6. Conclusions
The closely spaced wide-angle seismic dataset presented in thiswork, provides an image of the crust which reveals a stronglyheterogeneous nature. Our results outline a picture of the Variscanlower crust as a heterogeneous media with small-scale velocityvariations. Likewise, a mafic intrusion located in the middle crustfeatures a heterogeneous layering/lensing. The full-wave forwardmodelling performed here shows that a simple layer cake velocitymodel obtained from conventional ray tracing techniques, cannotexplain the lower crust reflective packages in the data. On the otherhand, a qualitatively satisfactory fit of the data was accomplishedwhen stochastic lensing was added to the refraction velocity model.This suggests that the mafic intrusion and the lower crust are stronglylayered. The Moho discontinuity beneath the southern end is imagedas a thinweak reflector, accounting for a simple interface. Beneath thecentral part of the transect the Moho is associated to a thick high-amplitude reflective packagewhich suggest amore complex structure.Finally, beneath the northern end, the Moho is displayed as adiscontinuous interface with changing seismic signature. The wide-angle low-fold stacked section obtained from this experiment and thesynthetic seismic modelling provide a new picture of the Mohodiscontinuity in SW-Iberia. The seismic image reveals a laterallyheterogeneous Moho and a changing lower crust seismic signaturealong the profile. This lateral variability and the horizontality of the
lower crust and Moho suggest that they are most probably the resultof the re-equilibration lithospheric processes during and after the latestages of the transpression event.
Acknowledgements
Funding for this research was provided by the Spanish Ministry ofEducation and Science CGL200404623, TOPOIBERIA CONSOLIDER-INGENIO (CSD2006-00041), and Generalitat de Catalunya2005SGR00874. Junta de Andalucia provided additional funds for theacquisition. This project was also supported by REPSOL-YPF.
References
Blundel, D., Arndti, N., Cobbold, P., Heinrich, C., 2005. Geodynamics and ore depositsevolution in Europe. Ore Geol. Rev. 27, 1–349.
Carbonell, R., Smithson, S.B., 1991. Large-scale anisotropy within the crust in the Basinand Range province. Geology 19, 698–701.
Carbonell, R., Lecerf, D., Itzin, M., Gallart, J., Brown, D., 1998. Mapping the Moho beneaththe southern Urals with wide-angle reflections. Geophys. Res. Lett. 25, 4229–4232.
Carbonell, R., Gallart, J., Pérez-Estaún, A., 2002. Modelling and imaging the Mohotransition: the case of the southern Urals. Geophys. J. Int. 149, 134–148.
Carbonell, R., Simancas, F., Juhlin, C., Pous, J., Pérez-Estaún, A., González-Lodeiro, F.,Muñoz, G., Heise, W., Ayarza, P., 2004. Geophysical evidence of a mantle derivedintrusion in SW Iberia. Geophys. Res. Lett. 31, L11601.
Casquet, C., Galindo, C., Tornos, F., Velasco, F., Canales, A., 2001. The Aguablanca Cuni oredeposit (Extremadura, Spain), a case of synorogenic orthomagmatic mineraliza-tion: age and isotope composition of magmas (Sr,Nd)and ore (s). Ore Geol. Rev. 18,237–250.
Christensen, N.I., Mooney, W.D., 1995. Seismic velocity structure and composition of thecontinental crust: a global view. J. Geophys. Res. 100, 9761–9788.
Deemer, S.J., Hurich, C.A., 1994. The reflectivity of magmatic under-plating using thelayered mafic intrusion analog. Tectonophysics 232, 239–255.
Galán, G., Marcos, A., 1997. Geochemical evolution of high pressure mafic granulitesfrom the Bacariza formation (Cabo Ortegal complex, NW Spain): an example of aheterogeneous lower crust. Geol. Rundsch. 86, 539–555.
Gibson, B.S., Levander, A.R., 1988. Lower crustal reflectivity patterns in wide-angleseismic recordings. Geophys. Res. Lett. 15, 617–620.
Holliger, K., Levander, A.R., 1992. A stochastic view of lower crustal fabric based onevidence from the Ivrea Zone. Geophys. Res. Lett. 19, 1153–1156.
Holliger, K., Levander, A.R., Goff, J.A., 1993. Stochastic modeling of the reflective lowercrust: petrophysical and geological evidence from the Ivrea Zone (northern Italy).J. Geophys. Res. 98, 11.967–11.980.
Holliger, K., Levander, A., Carbonell, R., Hobbs, R., 1994. Some attributes of wavefieldsscattered from Ivrea-type lower crust. Tectonophysics 232, 267–279.
Hurich, C.A., Smithson, S.B., 1987. Compositional variation and the origin of deep crustalreflections. Earth Planet. Sci. Lett. 85, 416–426.
Levander, A., England, R.W., Smith, S.K., Hobbs, R.W., Goff, J.A., Holliger, K., 1994a.Stochastic characterization and seismic response of upper and middle crustal rocksbased on the Lewisian gneiss complex, Scotland. Geophys. J. Int. 119, 243–259.
Levander, A., Hobbs, R.W., Smith, S.K., England, R.W., Snyder, D.B., Holliger, K., 1994b.The crust as a heterogeneous “optical” medium, or “cocodriles in the mist”.Tectonophysics 232, 281–297.
Long, R.E., Matthews, P.A., Graham, D.P., 1994. The nature of crustal boundaries:combined interpretation of wide-angle and normal-incidence seismic data.Tectonophysics 232, 309–318.
Martínez-Catalán, J.R., Arenas, R., Díaz-García, F., Abati, J., 1997. The Variscanaccretionary complex of NW Iberia: involved terranes and successions oftectonothermal events. Geology 25, 1103–1106.
Martini, F., Bean, C.J., Dolan, S., Marsan, D., 2001. Seismic image quality beneath stronglyscattering structures and implications for lower crustal imaging: numericalsimulations. Geophys. J. Int. 145, 423–435.
Palomeras, I., Carbonell, R., Flecha, I., Simancas, F., Ayarza, P., Matas, J., Martínez Poyatos,D., Azor, A., González Lodeiro, F., Pérez-Estaún, A., 2009. Nature of the lithosphereacross the Variscan Orogen of SW Iberia: Dense wide-angle seismic reflection data.J. Geophys. Res. 114, B02302.
Peucat, J.J., Bernard-Griffiths, J., Gil-Ibarguchi, J.I., Dallmeyer, R.D., Menot, R.P., Cornichet,J., de Leon, M.I.-P., 1990. Geochemical and geochronological cross section of thedeep Variscan crust; the Cabo Ortegla high-pressure nappe (northwestern Spain).Tectonophysics 177, 263–292.
Ribeiro, A., Sanderson, D., Colleagues, S.I., 1996. EUROPROBE 1996 — lithospheredynamics: origin and evolution of continents, chapter SW-Iberia. TranspressionalOrogeny in the Variscides. Uppsala University, pp. 91–95.
Rutter, E.H., Khazanehdari, J., Brodie, K.H., Blundell, D.J., Waltham, D.A., 1999. Syntheticseismic reflection profile through the Ivrea Zone-Serie dei Laghi continental crustalsection, northwestern italy. Geology 27, 79–82.
Saleeby, J., Ducea, M., Clemens-Knott, D., 2003. Production and loss of high-densitybatholitic root, southern Sierra Nevada, California. Tectonics 22, 3(1)–3(24).
Santos-Zalduegui, J.F., Schrarer, Y., Gil-Ibarguchi, J.I., Girardeau, J.J., 1997. Origin andevolution of the Paleozoic Cabo Ortegal ultramafic–mafic complex (NW-Spain).Chem. Geol. 129, 281–304.

157I. Flecha et al. / Tectonophysics 472 (2009) 148–157
Simancas, F., Martínez-Poyatos, D., Expósito, I., azor, A., González-Lodeiro, F., 2001. Thestructure of a major suture zone in the SW Iberian massif: the Ossa-Morena/Central-Iberian contact. Tectonophysics 332, 295–308.
Simancas, J.F., Carbonell, R., González-Lodeiro, F., Pérez-Estaún, A., Juhlin, C., Ayarza, P.,Kashubin, A., Azor, A., Martínez-Poyatos, D., Almodóvar, G.R., Pascual, E., Sáez, R.,Expósito, I., 2003.Crustal structure of the transpressionalVariscanorogenof SWIberia:SW Iberia deep seismic reflection profile (IBERSEIS). Tectonics 22, (1)-1–(1)-20.
Sochacki, J.S., Kubichek, R., George, J.H., Fletcher, W.R., Smithson, S.B., 1987. Absorbingboundary conditions and surface waves. Geophysics 52, 60–71.
Sochacki, J.S., George, J.H., Ewing, R.E., Smithson, S.B., 1991. Interface conditions foracoustic and elastic wave propagation. Geophysics 56, 168–181.
Tornos, F., Casquet, C., Galindo, C., Velasco, F., Canales, A., 2001. A new style of Ni-Cumineralization related tomagmatic breccia pipes in a transpressional magmatic arc,Aguablanca, Spain. Miner. Depos. 36, 700–706.
Wenzel, F., Sandmeier, K.-J., Wälde, W., 1987. Properties of the lower crust frommodeling refraction and reflection data. J. Geophys. Res. 92, 11.575–11.583.