Embed Size (px)
Citation preview
Research ArticleSeismic Fragility Estimates of LRB Base Isolated Frames UsingPerformance-Based Design
ImanMansouri,1 Gholamreza Ghodrati Amiri,2 JongWan Hu,3,4
Mohammadreza Khoshkalam,2 Sanaz Soori,5 and Shahrokh Shahbazi6
1Department of Civil Engineering, Birjand University of Technology, Birjand 97175-569, Iran2School of Civil Engineering, Iran University of Science and Technology, Tehran 16765-163, Iran3Department of Civil and Environmental Engineering, Incheon National University, 12-1 Songdo-dong, Yeonsu-gu,Incheon 406-840, Republic of Korea4Head of Center, Incheon Disaster Prevention Research Center, Incheon National University, 12-1 Songdo-dong, Yeonsu-gu,Incheon 406-840, Republic of Korea5Department of Civil Engineering, Shahid Bahonar University of Kerman, Kerman 76169133, Iran6Pooya Sazeh Koohin Co., Ltd., Tehran 18718-13553, Iran
Correspondence should be addressed to Jong Wan Hu; [email protected]
Received 29 November 2016; Revised 12 February 2017; Accepted 19 February 2017; Published 11 April 2017
Academic Editor: Longjun Dong
Copyright © 2017 Iman Mansouri et al.This is an open access article distributed under the Creative Commons Attribution License,which permits unrestricted use, distribution, and reproduction in any medium, provided the original work is properly cited.
With improving technology, the idea of using energy dissipater equipment has been strengthened in order to control the structuresresponse in dynamic loads such as wind and earthquake. In this research, we dealt with seismic performance of base isolatedstructures with lead-rubber bearing (LRB) using incremental dynamic analysis (IDA). For this purpose, 3- and 9-story buildingshave been utilized in the SAC project undergoing 22 earthquake records which were far-fault. Plotting the fragility curve for variousstates of design time period and isolator damping of LRB, it is observed that, by increasing damping, the isolator has not beenactivated in small spectrum acceleration, which shows that the annual exceedance probability is increased in immediate occupancy(IO) performance level and decreased in life safety (LS) performance level. The results show the reduction of determined failureprobability in fragility curves for two levels of performance of uninterrupted use and lateral safety. Likewise obtained results showthat, with increasing design time period of isolator, the amount of failure probability is decreased rather than the isolator withsmaller design time period, for both LS and IO states. And the isolator illustrates better performance.
1. Introduction
Earthquake as a destructive phenomenon threatens its habi-tants in most of life areas so that decreasing the earthquakeirreparable damage has been the final goal of researchersand earthquake scientists. By passing time and changingthe viewpoint of plotting based on force to plotting basedon performance, the use of nonlinear analyses has beenincreased. The design method based on the performance isthe new one that has mostly been used in new regulationsand instructions [1–5]. In the earth movements, undergoingearthquake, some tensions are created in structures which
get the structure elements advanced into the yield andfailure [6]. The first step in the seismic improvement ofexisted structures is their evaluation of seismic vulnerability.In recent years, various methods have been presented toinvestigate the amount of structures vulnerability, wheremostof them are based on the qualitative and quantitative analysesof structures.Theweaknesses and shortcomings of structuresare determined based on the evaluations that are performedon them. The use of appropriate method is necessary forthe modification of these weaknesses, doing retrofit, andimprovement. In most times, there are some restrictionsin choosing the improvement methods in structures which
HindawiShock and VibrationVolume 2017, Article ID 5184790, 20 pageshttps://doi.org/10.1155/2017/5184790
2 Shock and Vibration
influence mainly the selected method [7]. Separating thebase is one of the most effective and economical methodsto prevent the damage which resulted from the earthquake,which makes released energy of earthquake decreased instructure, without getting damaged. One of the modernmethods, in order to evaluate systems seismic performance,is the seismic plan of structures based on the performancethat observation of structure behavior forms its base fromthe initial loading in elastic domain to its entire collapse. Theprerequisite of this investigation is the use of dynamic analysismethods that covers whole domain of structure behavior.One of the nonlinear dynamic analysis methods is the incre-mental nonlinear dynamic analysis (IDA). Liauw et al. [8]investigated the combined effects of vertical and horizontalmovements of a real earthquake for base isolated structureson the sliding base with different specification of frictionand stiffness. The results showed that the earth’s verticalmovement significantly affects superstructure response andsliding base displacement. Thus, existence of base isolator isso effective in decreasing the superstructure response. Nowa-days, the ability of seismic isolator has been demonstratedas a means to reduce the entered earthquake forces to thestructure. Until now, many researches have been conductedto evaluate the performance of seismic isolator systemswhichare one of the most practical in-active systems in controllingthe structures vibrations. Kramer [9] investigated the 3-, 7-, and 12-story frames in the case of being without and withisolator (LRB) using the IDA analysis. Then, the effect of(LRB) isolator was separately determined in the reinforcedconcrete structures using fragility curve under 7 earthquakesnear and far-fault. Shakib and Fuladgar [10] examined theeffect of earthquake motive triple components over theisolated structures response in base by sliding frictionalseismic isolator undergoing three components of El-Centro1940, Tabas 1978, and Northbridge 1994 earthquakes. Theresults showed that the earthquakes with three movementcomponents can influence the structure’s responses withlow-period significantly which have sliding seismic isolator.Furthermore, employing structure under variousmotives cannoticeably undergo the structure response, due to being threecomponents of the earthquake [10]. Finding and classificationproblems in seismology relate to distinction between naturalevents which contain mostly tectonic and volcanic earth-quakes and artificial events, such as underground nuclearexplosions, mine blasts, underwater explosions, and militaryexplosions. Perhaps the most important aspect of the seismicsource identification problem is that of finding proper dis-criminant parameters [11–13].
Zhang and Huo [16] used the fragility functions inorder to evaluate the isolation devices effect on freewaybridges in IDA and PSDAmethods.Theymade a comparisonbetween the fragility of 2D and 3D models of bridge usingOpenSees software. Vasiliadis [17] fulfilled the parametricstudy of the effect of isolator system period over nonlinearseismic response of three main frames in reinforced concretebuilding and furthermore, the influence of LRB and FPI wasstudied on the base isolator system. Finally, the maximumdeveloped displacement and the remained displacement ofisolator system were introduced. Seo and Hu [18] studied
the Seismic Response and Performance Evaluation of lead-rubber bearing (LRB) isolation systems with superelasticshape memory alloy (SMA) on the CBF Building underNF ground motions. The results of this research were theindicative of significant decrease of remaining displacementin comparison with steel bending bars. Hu [15] made thecomparison between base shears and interstory drifts forsteel frames bearing lead-rubber bearing (LRB) isolationsystems and for this purpose he used nonlinear time historyanalyses with NF ground motions. Komur [19] investigatedthe soft-story behavior in RC structures with conventionalbase and lead core rubber bearing systems under the var-ious seismic loads. Following that, period of the framesystem, story acceleration, interstory drift ration, base shearforces, and distribution of plastic hinges and their damagecondition have been assessed. Hu [20] conducted seismicanalysis and parametric study of SDOF lead-rubber bearing(LRB) isolation systemswith recentering shapememory alloy(SMA) bending bars. The results showed that recenteringLRB isolators gets the seismic performance improved interms of strength, energy dissipation, and recentering effect.Kumar et al. [21] studied the influences of intraearthquakevariations investigated on the response of base isolatednuclear structures for ten isolation systems of two periodsand five characteristic strengths using OpenSees platform.Sharbatdar et al. [22] evaluated seismic response of isolatedstructures with lead core rubber bearing and the frictionalPandoli isolator undergoing the earthquake near the fault.They came to conclusion that remarkable displacement andspeed pulse can significantly change the results of seismicresponse of isolated structure in records of near fault. In thispaper, the seismic performance of base isolated structuresand its effect on the various parameters of structure responsewere studied using incremental dynamic analysis (IDA). Forthis purpose, 3- and 9-story steel buildings of SAC projecthave been used under 22 remote records of fault, beingintroduced in the FEMA-P695 issue. Lead-rubber isolatorhas been used to isolate the mentioned buildings. Then,by utilizing the fragility curves, we dealt with the preciseestimation of structures failure probability and the effect ofisolator existence.
2. Lead-Rubber Isolators
The use of isolators with similar performance of horizontalsprings decreases the amount of earthquake forces andresonance phenomenon with dominant frequency contentthrough the change in inherent time period of structure.The act of increasing time period of structure is the sameconcept of using isolators [23]. Seismic isolation is one ofthe most diverse ways to encounter with earthquake, thatby increasing the time period of structure and force transferinterruption path, it helps new structures, even retrofittingavailable structures [24]. The lead-rubber isolator has beenmore prevalent among isolator systems and has heavily beenused in New Zealand, the United States, and Japan. Theseisolators contain some layers of steel and rubber plates with
Shock and Vibration 3
Top cover plate
Bottom cover plate
Steel platesLead coreRubber
(a)
mb
ub
(b)
ub
F
(c)
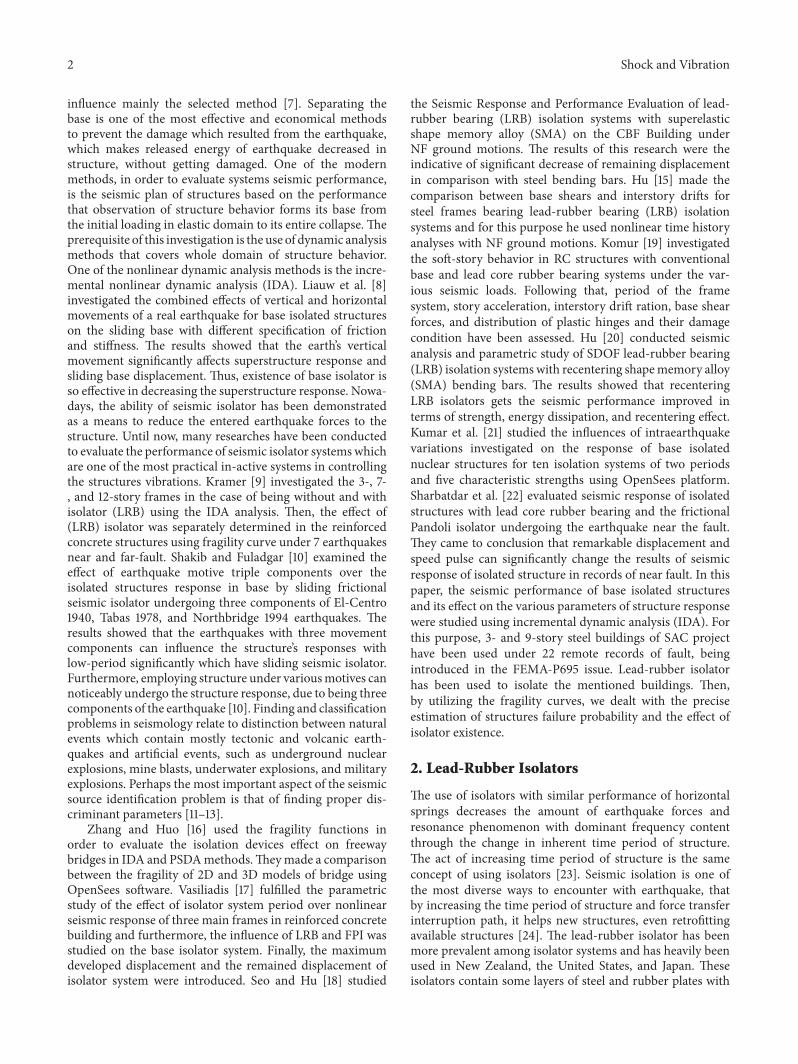
Figure 1: (a) General form of Rubber isolators with lead core, (b) calculation model, and (c) force-displacement diagram [14].
lead bar which is embedded in some holes. The lead coresdeform in about 10MPA shearing stress and make two lines’response generated in lead.The role of this lead core is energydissipation and ultimately it gets the amount of isolatordisplacement declined; thus, it can be called an auxiliarydamper [14] that it has been shown in Figure 1.
The first detached building with rubber-lead supportswas in New Zealand in 1981. Afterward it was used in otherbuildings in various countries. Detached buildings with leadsupports performed satisfactory performance in Northridgeand Kobe earthquake [23].
3. Incremental Dynamic Analysis Principles
Themethod of incremental dynamic analysis (IDA) containsa collection of several dynamic analyses of nonlinear timehistory of structure where undergoing different severity ofearthquakes is incremental. One of the most importantsubjects in incremental dynamic analysis method is theselection of intensity criterion and suitable damage in whichstructures are set under one or several seismographs ofearthquake record which have been measured in differentmagnitude levels. After doing the analysis, one or severalIDA curves will be made in parametric response againstintensity levels. Ultimately by defining Load and ResistanceFactor Design states and combining results with risk analysiscurves, we dealt with evaluation of structures [25]. So theincremental dynamic analysis method is a multipurposemethod with much more usage. The structure’s behaviorcompletely depends on the selected record in the IDA curve[26].
4. Research Methodology and Systems ofStudied Structures
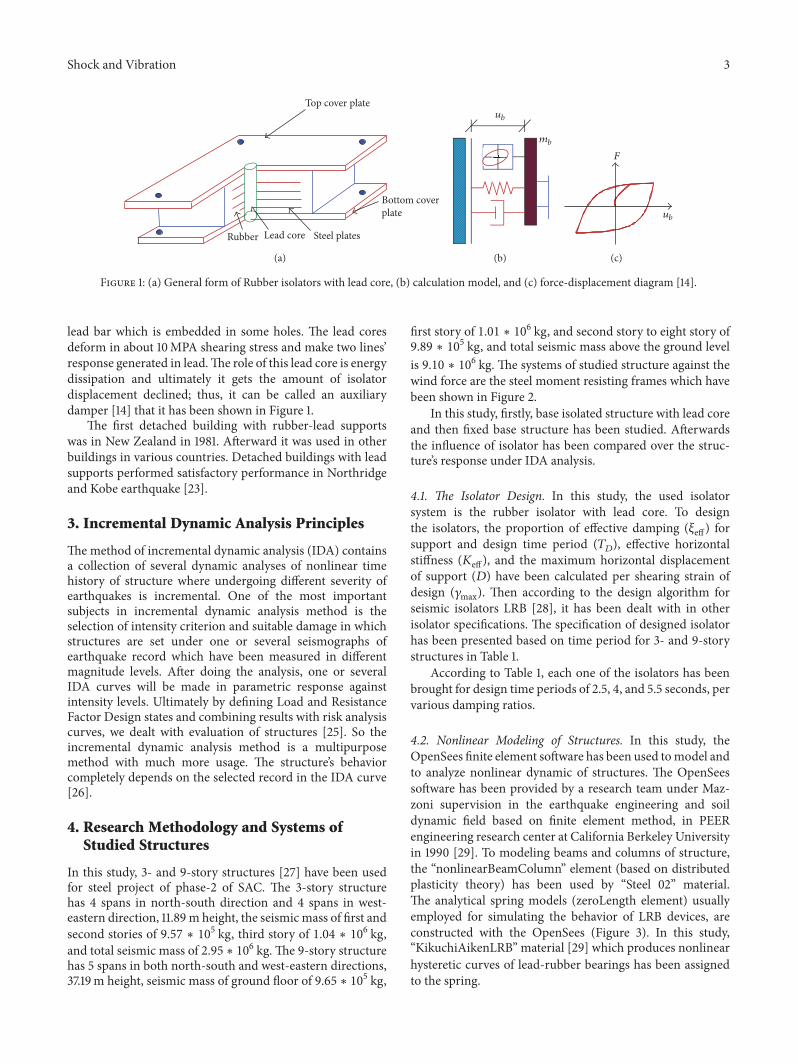
In this study, 3- and 9-story structures [27] have been usedfor steel project of phase-2 of SAC. The 3-story structurehas 4 spans in north-south direction and 4 spans in west-eastern direction, 11.89 m height, the seismic mass of first andsecond stories of 9.57 ∗ 105 kg, third story of 1.04 ∗ 106 kg,and total seismic mass of 2.95 ∗ 106 kg. The 9-story structurehas 5 spans in both north-south and west-eastern directions,37.19m height, seismic mass of ground floor of 9.65 ∗ 105 kg,
first story of 1.01 ∗ 106 kg, and second story to eight story of9.89 ∗ 105 kg, and total seismic mass above the ground levelis 9.10 ∗ 106 kg. The systems of studied structure against thewind force are the steel moment resisting frames which havebeen shown in Figure 2.
In this study, firstly, base isolated structure with lead coreand then fixed base structure has been studied. Afterwardsthe influence of isolator has been compared over the struc-ture’s response under IDA analysis.
4.1. The Isolator Design. In this study, the used isolatorsystem is the rubber isolator with lead core. To designthe isolators, the proportion of effective damping (𝜉eff ) forsupport and design time period (𝑇𝐷), effective horizontalstiffness (𝐾eff ), and the maximum horizontal displacementof support (𝐷) have been calculated per shearing strain ofdesign (𝛾max). Then according to the design algorithm forseismic isolators LRB [28], it has been dealt with in otherisolator specifications. The specification of designed isolatorhas been presented based on time period for 3- and 9-storystructures in Table 1.
According to Table 1, each one of the isolators has beenbrought for design time periods of 2.5, 4, and 5.5 seconds, pervarious damping ratios.
4.2. Nonlinear Modeling of Structures. In this study, theOpenSees finite element software has been used tomodel andto analyze nonlinear dynamic of structures. The OpenSeessoftware has been provided by a research team under Maz-zoni supervision in the earthquake engineering and soildynamic field based on finite element method, in PEERengineering research center at California Berkeley Universityin 1990 [29]. To modeling beams and columns of structure,the “nonlinearBeamColumn” element (based on distributedplasticity theory) has been used by “Steel 02” material.The analytical spring models (zeroLength element) usuallyemployed for simulating the behavior of LRB devices, areconstructed with the OpenSees (Figure 3). In this study,“KikuchiAikenLRB” material [29] which produces nonlinearhysteretic curves of lead-rubber bearings has been assignedto the spring.
4 Shock and Vibration
(1) (2) (3) (4) (5)
(6) (7) (8) (9) (10)
(15)(11) (12) (13) (14)
(16) (17) (18) (19) (20)A–A
3rd
2nd
1st
Ground
(wea
k ax
is)
A A
Building plan
N
W24 × 68 W24 × 68 W24 × 68 W21 × 44
W30 × 116 W30 × 116 W30 × 116 W21 × 44
W33 × 118 W33 × 118 W33 × 118 W21 × 44
W14×68
W14×311
W14×257
W14×257
(a)
(11) (12)
7th
6th
8th
(1) (2) (3) (4) (5) (6)B-1
(42)
(18)
(7) (8) (9) (10)
(13) (14) (15) (16) (17)
(23)(19) (20) (21) (22)
(25) (26) (27) (28) (29)3rd
2nd
1st
Ground
(30)
(24)
(36)(31) (32) (33) (34) (35)
(41)(37) (38) (39) (40)
(43) (45)(44) (46) (47)
A–A
5th
4th
(48)
(49) (50) (51) (52) (53)(54)
(55) (56) (57) (58) (59)(60)
9th (61) (62) (63) (64) (65) (66)
A A
Building plan
N
W14×500
W14×455
W14×370
W14×283
W14×257
1.83m typ
(b)
Figure 2: Plan and elevation of selected (a) 3-story building and (b) 9-story building.
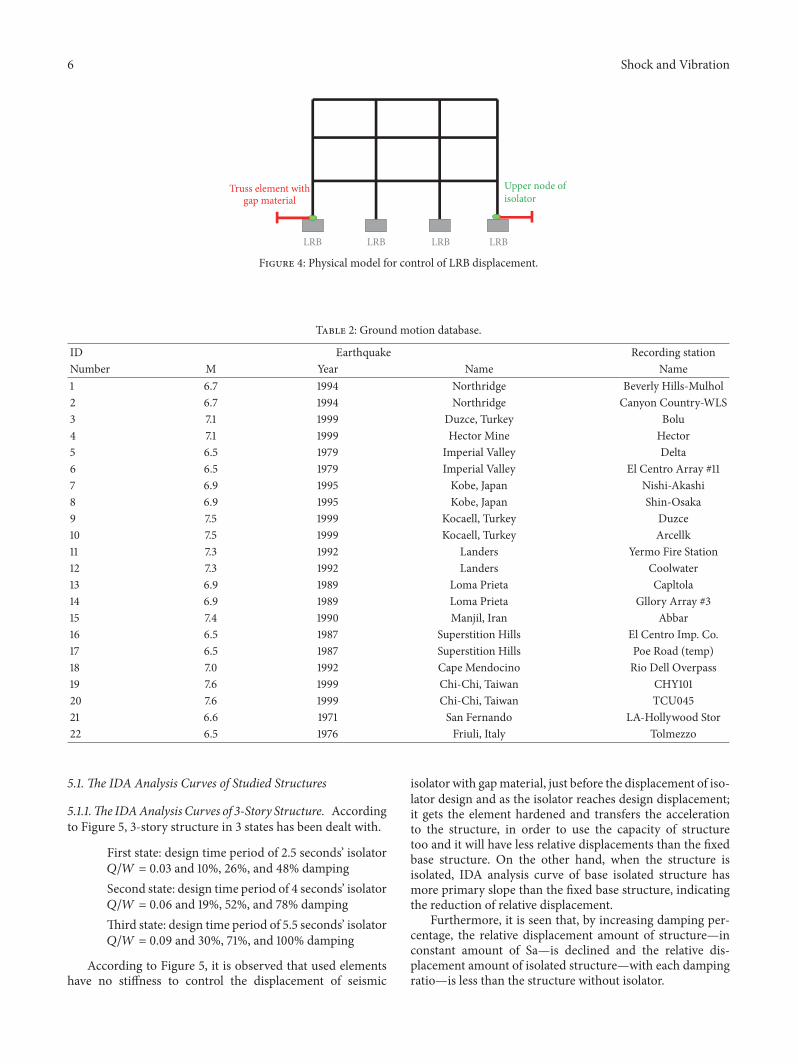
Also, in order to control LRB displacement “truss” ele-ment was employed at both ends of structure and “ElasticPP-Gap” material has been assigned (Figure 4).
4.3. Utilized Records in This Study. One of the importantissues in incremental dynamic analysis is determining theentered records to the structure. Therefore, suitable numbersof earthquake record should be selected to cover the rangeof structure response. Regarding study of Shome [30] using10 to 20 ground motion records usually is enough in orderto estimate the damage demand of buildings. In this study,the records of FEEMA P695 have been used for far domainswhich are 22 ones, in order to fulfill incremental dynamic
analyses.The specification of used records has been presentedin Table 2.
5. Results and Discussion
In this study, firstly the IDA curves of structures have beenplotted under 22 records. Then the structures have beenassessed under the same records with LRB isolators in thecolumns base, though the gap material has been used tocontrol the isolator displacement.
Three states have been considered for each structure inisolators design and the analysis of structures for differenttime period has been dealt with (𝑇𝐷 = 2.5, 4, and 5.5), byassuming 𝑄/𝑊= 0.03, 0.06, and 0.09.
Shock and Vibration 5
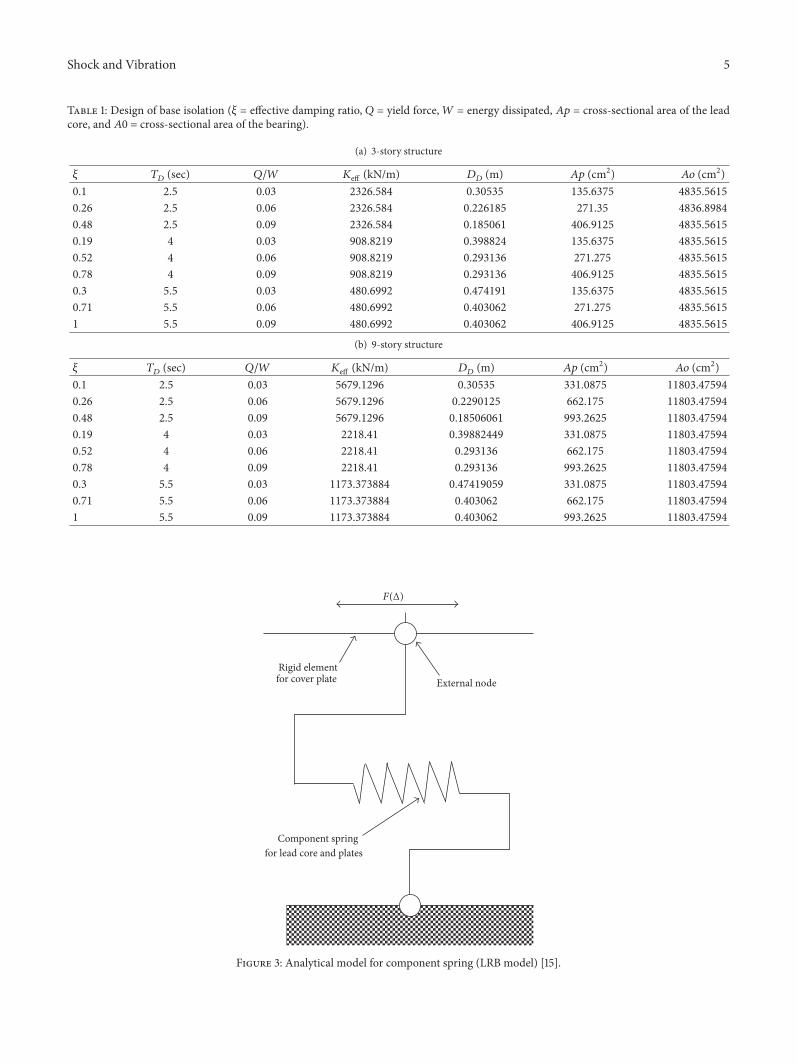
Table 1: Design of base isolation (𝜉 = effective damping ratio, 𝑄 = yield force,𝑊 = energy dissipated, 𝐴𝑝 = cross-sectional area of the leadcore, and 𝐴0 = cross-sectional area of the bearing).
(a) 3-story structure
𝜉 𝑇𝐷 (sec) 𝑄/𝑊 𝐾eff (kN/m) 𝐷𝐷 (m) 𝐴𝑝 (cm2) 𝐴𝑜 (cm2)0.1 2.5 0.03 2326.584 0.30535 135.6375 4835.56150.26 2.5 0.06 2326.584 0.226185 271.35 4836.89840.48 2.5 0.09 2326.584 0.185061 406.9125 4835.56150.19 4 0.03 908.8219 0.398824 135.6375 4835.56150.52 4 0.06 908.8219 0.293136 271.275 4835.56150.78 4 0.09 908.8219 0.293136 406.9125 4835.56150.3 5.5 0.03 480.6992 0.474191 135.6375 4835.56150.71 5.5 0.06 480.6992 0.403062 271.275 4835.56151 5.5 0.09 480.6992 0.403062 406.9125 4835.5615
(b) 9-story structure
𝜉 𝑇𝐷 (sec) 𝑄/𝑊 𝐾eff (kN/m) 𝐷𝐷 (m) 𝐴𝑝 (cm2) 𝐴𝑜 (cm2)0.1 2.5 0.03 5679.1296 0.30535 331.0875 11803.475940.26 2.5 0.06 5679.1296 0.2290125 662.175 11803.475940.48 2.5 0.09 5679.1296 0.18506061 993.2625 11803.475940.19 4 0.03 2218.41 0.39882449 331.0875 11803.475940.52 4 0.06 2218.41 0.293136 662.175 11803.475940.78 4 0.09 2218.41 0.293136 993.2625 11803.475940.3 5.5 0.03 1173.373884 0.47419059 331.0875 11803.475940.71 5.5 0.06 1173.373884 0.403062 662.175 11803.475941 5.5 0.09 1173.373884 0.403062 993.2625 11803.47594
Rigid element for cover plate External node
Component springfor lead core and plates
F(Δ)
Figure 3: Analytical model for component spring (LRB model) [15].
6 Shock and Vibration
LRB LRB LRB LRB
Truss element with gap material
Upper node of isolator
Figure 4: Physical model for control of LRB displacement.
Table 2: Ground motion database.
ID Earthquake Recording stationNumber M Year Name Name1 6.7 1994 Northridge Beverly Hills-Mulhol2 6.7 1994 Northridge Canyon Country-WLS3 7.1 1999 Duzce, Turkey Bolu4 7.1 1999 Hector Mine Hector5 6.5 1979 Imperial Valley Delta6 6.5 1979 Imperial Valley El Centro Array #117 6.9 1995 Kobe, Japan Nishi-Akashi8 6.9 1995 Kobe, Japan Shin-Osaka9 7.5 1999 Kocaell, Turkey Duzce10 7.5 1999 Kocaell, Turkey Arcellk11 7.3 1992 Landers Yermo Fire Station12 7.3 1992 Landers Coolwater13 6.9 1989 Loma Prieta Capltola14 6.9 1989 Loma Prieta Gllory Array #315 7.4 1990 Manjil, Iran Abbar16 6.5 1987 Superstition Hills El Centro Imp. Co.17 6.5 1987 Superstition Hills Poe Road (temp)18 7.0 1992 Cape Mendocino Rio Dell Overpass19 7.6 1999 Chi-Chi, Taiwan CHY10120 7.6 1999 Chi-Chi, Taiwan TCU04521 6.6 1971 San Fernando LA-Hollywood Stor22 6.5 1976 Friuli, Italy Tolmezzo
5.1. The IDA Analysis Curves of Studied Structures
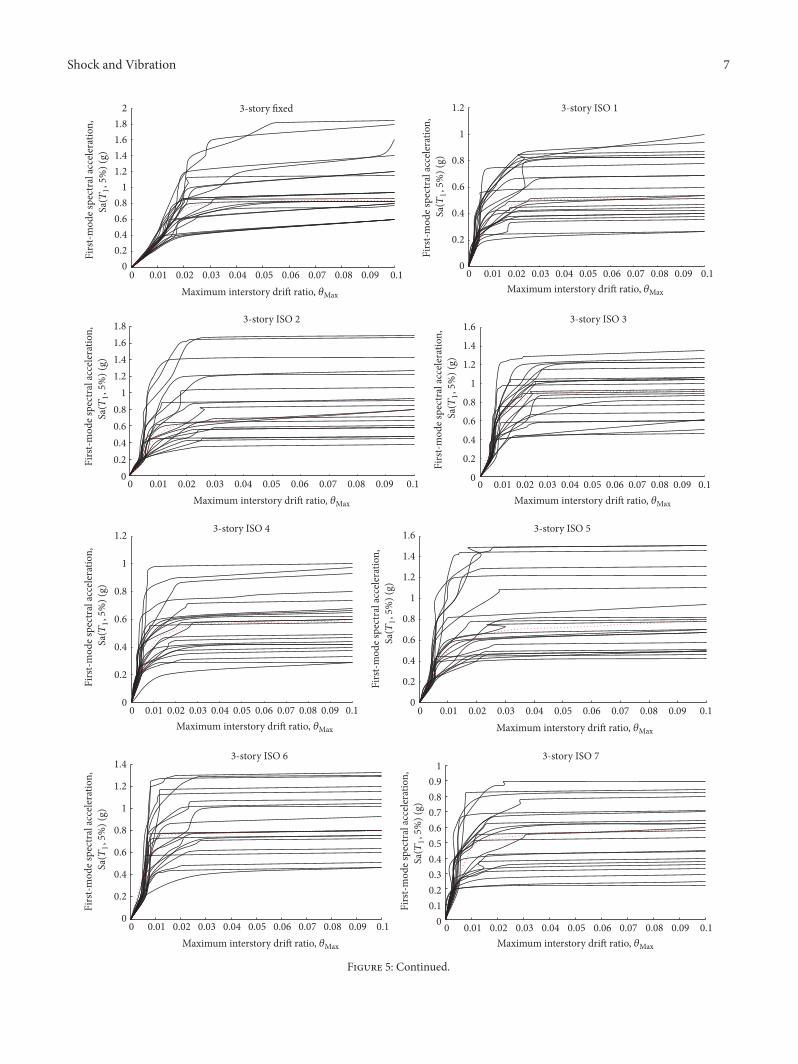
5.1.1.The IDAAnalysis Curves of 3-Story Structure. Accordingto Figure 5, 3-story structure in 3 states has been dealt with.
First state: design time period of 2.5 seconds’ isolator𝑄/𝑊 = 0.03 and 10%, 26%, and 48% dampingSecond state: design time period of 4 seconds’ isolator𝑄/𝑊 = 0.06 and 19%, 52%, and 78% dampingThird state: design time period of 5.5 seconds’ isolator𝑄/𝑊 = 0.09 and 30%, 71%, and 100% damping
According to Figure 5, it is observed that used elementshave no stiffness to control the displacement of seismic
isolator with gapmaterial, just before the displacement of iso-lator design and as the isolator reaches design displacement;it gets the element hardened and transfers the accelerationto the structure, in order to use the capacity of structuretoo and it will have less relative displacements than the fixedbase structure. On the other hand, when the structure isisolated, IDA analysis curve of base isolated structure hasmore primary slope than the fixed base structure, indicatingthe reduction of relative displacement.
Furthermore, it is seen that, by increasing damping per-centage, the relative displacement amount of structure—inconstant amount of Sa—is declined and the relative dis-placement amount of isolated structure—with each dampingratio—is less than the structure without isolator.
Shock and Vibration 7
00.20.40.60.8
11.21.41.61.8
2
0 0.01 0.02 0.03 0.04 0.05 0.06 0.07 0.08 0.09 0.1
3-story fixed
0
0.2
0.4
0.6
0.8
1
1.2
0 0.01 0.02 0.03 0.04 0.05 0.06 0.07 0.08 0.09 0.1
3-story ISO 1
00.20.40.60.8
11.21.41.61.8
0 0.01 0.02 0.03 0.04 0.05 0.06 0.07 0.08 0.09 0.1
3-story ISO 2
0
0.2
0.4
0.6
0.8
1
1.2
1.4
1.6
0 0.01 0.02 0.03 0.04 0.05 0.06 0.07 0.08 0.09 0.1
3-story ISO 3
0
0.2
0.4
0.6
0.8
1
1.2
0 0.01 0.02 0.03 0.04 0.05 0.06 0.07 0.08 0.09 0.1
3-story ISO 4
0
0.2
0.4
0.6
0.8
1
1.2
1.4
1.6
0 0.01 0.02 0.03 0.04 0.05 0.06 0.07 0.08 0.09 0.1
3-story ISO 5
0
0.2
0.4
0.6
0.8
1
1.2
1.4
0 0.01 0.02 0.03 0.04 0.05 0.06 0.07 0.08 0.09 0.1
3-story ISO 6
00.10.20.30.40.50.60.70.80.9
1
0 0.01 0.02 0.03 0.04 0.05 0.06 0.07 0.08 0.09 0.1
3-story ISO 7
Maximum interstory drift ratio, 𝜃Max
Maximum interstory drift ratio, 𝜃Max
Maximum interstory drift ratio, 𝜃Max
Maximum interstory drift ratio, 𝜃Max Maximum interstory drift ratio, 𝜃Max
Maximum interstory drift ratio, 𝜃Max
Maximum interstory drift ratio, 𝜃Max
Maximum interstory drift ratio, 𝜃Max
Firs
t-mod
e spe
ctra
l acc
eler
atio
n,Sa
(T1,5
%) (
g)Fi
rst-m
ode s
pect
ral a
ccel
erat
ion,
Sa(T
1,5
%) (
g)Fi
rst-m
ode s
pect
ral a
ccel
erat
ion,
Sa(T
1,5
%) (
g)Fi
rst-m
ode s
pect
ral a
ccel
erat
ion,
Sa(T
1,5
%) (
g)
Firs
t-mod
e spe
ctra
l acc
eler
atio
n,Sa
(T1,5
%) (
g)
Firs
t-mod
e spe
ctra
l acc
eler
atio
n,Sa
(T1,5
%) (
g)
Firs
t-mod
e spe
ctra
l acc
eler
atio
n,Sa
(T1,5
%) (
g)
Firs
t-mod
e spe
ctra
l acc
eler
atio
n,Sa
(T1,5
%) (
g)
Figure 5: Continued.
8 Shock and Vibration
0
0.2
0.4
0.6
0.8
1
1.2
1.4
0 0.01 0.02 0.03 0.04 0.05 0.06 0.07 0.08 0.09 0.1
3-story ISO 8
00.20.40.60.8
11.21.41.61.8
2
0 0.01 0.02 0.03 0.04 0.05 0.06 0.07 0.08 0.09 0.1
3-story ISO 9
Maximum interstory drift ratio, 𝜃Max Maximum interstory drift ratio, 𝜃Max
Firs
t-mod
e spe
ctra
l acc
eler
atio
n,Sa
(T1,5
%) (
g)
Firs
t-mod
e spe
ctra
l acc
eler
atio
n,Sa
(T1,5
%) (
g)
Figure 5: IDA curves for 3-story frame (ISO 1 to 9 are related to damping ratios 0.1, 0.26, 0.48, 0.19, 0.52, 0.78, 0.3, 0.71, and 1.0, resp.).
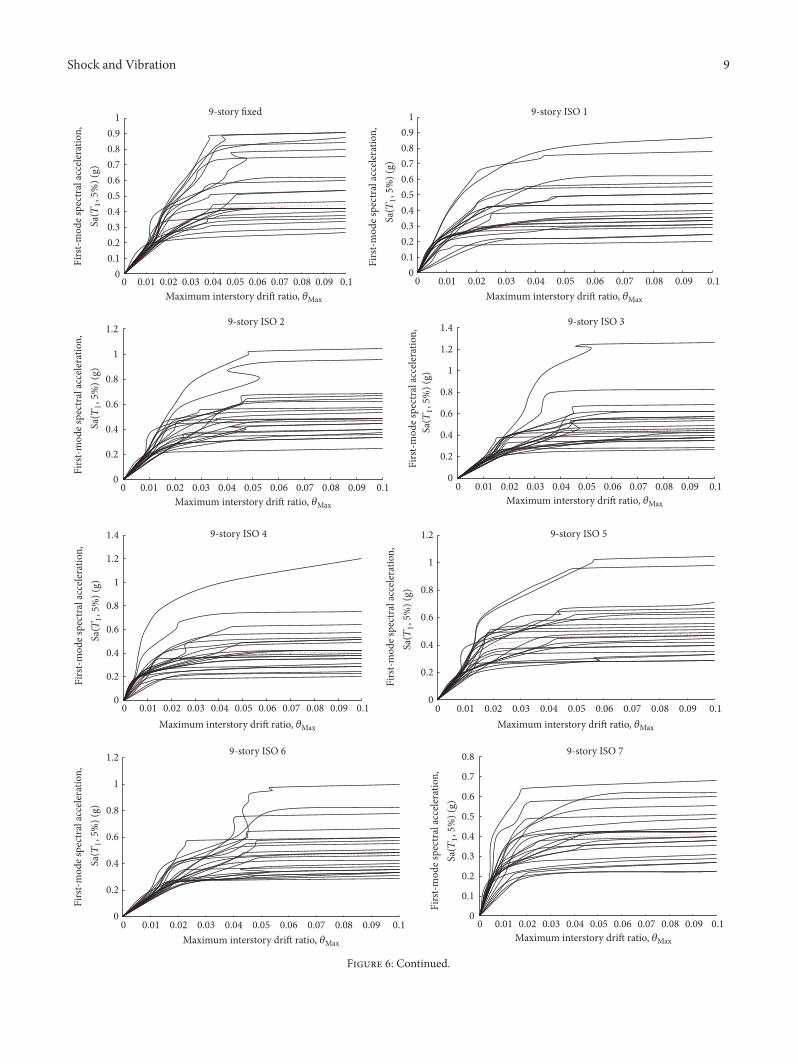
5.1.2. The IDA Analysis Curves of 9-Story Structure. Figure 6shows the evaluation of incremental dynamic analysis graphsin 9-story structure under 9 isolated states.
As it is observed in Figure 6, in IDA curves category of 9-story structure hasmore primary slope, like 3-story structure;thus, it transfers less relative displacement to the structure.
It should be mentioned that for both 3- and 9-storystructures the maximum interstory drift has occurred atbottom stories which indicates the shear behavior (shearbuilding) of structures.
5.2. Clustering IDA Curves for Various Designs Time Periods
5.2.1. Clustering IDACurves for 3-Story Structure. IDA curvesfor 3-story structure for various design time periods havebeen presented in Figure 7.
In Figure 7, it is observed that the base isolatedstructure—in constant amount of Sa—has less relative dis-placement. Also being abounded the primary slope of dia-gram with more damping amount gets the relative dis-placement to be decreased. The time period and spectralacceleration of 3-story structure have been presented in twolevels of performance, in Figure 5.
In Table 3 the amounts of annual exceedance probabilityhave been presented for 3-story structure.
As it is observed in Figure 5, by adding LRB isolator, thetime period of 3-story structure is increased rather than stateof constant base, though by increasing damping, time periodhas a descending procedure. For example, in the isolator withdesign time period of 2.5 seconds, it has 2.11, 1.5, and 1.37seconds’ time period of structure, per 10%, 26%, and 48%damping, respectively.
Likewise it can be concluded that, by raising dampingin structure, the intensity magnitude with immediate occu-pancy performance levels and lateral safety is increased andby raising time period of designed isolator, these quantitiesare declined.
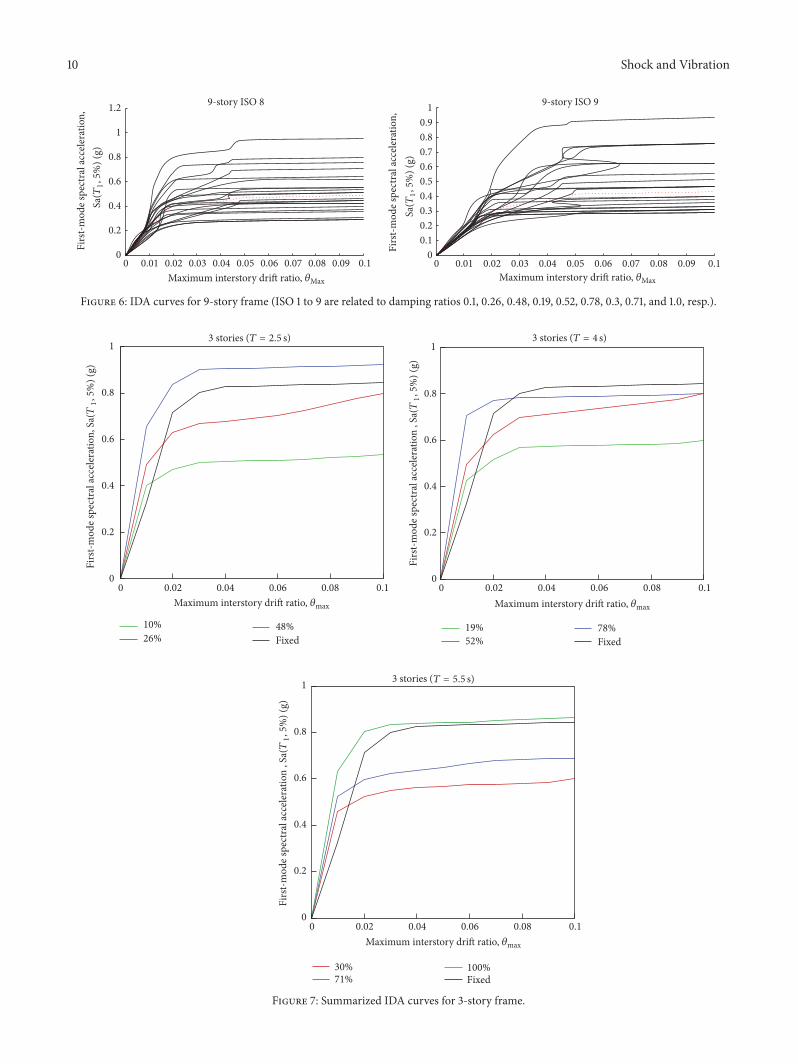
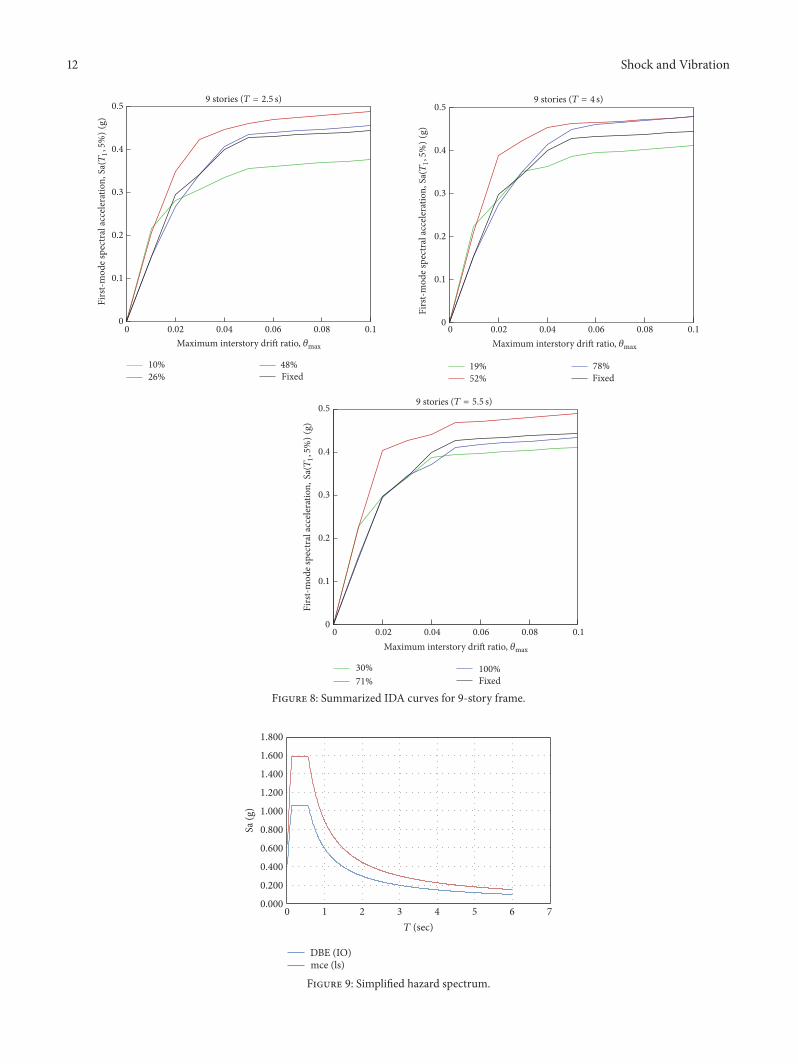
5.2.2. Clustering IDA Curves for 9-Story Structure. IDAcurves for 9-story structure have been presented in Figure 8for various designs time periods.
In Figure 8, as it is observed, base isolated structure hasmore primary slope in various design time periods than fixedbase structure that make the stories relative displacementdecrease. Existing chaos is because of various behaviors oftall structures rather than vibrational modes and sensibilityto the entered records of earthquake. But isolator also hasideal effect in structure. For instance, the isolator in 26%damping has demonstrated better effect from itself than 48%damping. Furthermore, in the second cluster curves, 52%damping and in the third cluster curves 71% damping havethe most reduction in relative displacement of stories.
5.3. Hazard Spectrum. To investigate the structure, theamount of spectral acceleration should be extracted from therelated response spectrum in various levels of performance.In Figure 9 the hazard spectrumhas been shown for two levelsof IOperformance, equivalent to spectrumDBEofAISC codeand for performance level of LS fromMCE spectrum.
5.4. Fragility Curve. For quantitative expression of struc-tural and nonstructural various components vulnerability,the exceedance probability can be expressed from a specialamount of damage based on a reference characteristic ofearthquake such as PGA, PGD, and PGV, according to theamount of earthquake risk. Repetition of this operation forvarious amounts of PGA (or other parameters) gets thenormal curves to be produced, which are prevalent as thefragility curve. These curves consider uncertainties, relatedchanges to the capacity curve characteristic, failure states, andearth motion.
A fragility curve can be usually produced with the useof a mathematical function related to seismic capacity anddemand of the structure, accounting for their uncertainties[31]. Mathematical function of fragility curves can be repre-sented as follows [31]:
𝑃𝑓 = 0[[[ln (𝑆𝑑/𝑆𝑐)√𝛽2𝑑+ 𝛽2𝑐]]]
(1)
in which 𝑃𝑓 is the conditional probability of exceeding acertain performance limit state; Sd is the seismic demand
Shock and Vibration 9
00.10.20.30.40.50.60.70.80.9
1
0 0.01 0.02 0.03 0.04 0.05 0.06 0.07 0.08 0.09 0.1
9-story fixed
00.10.20.30.40.50.60.70.80.9
1
0 0.01 0.02 0.03 0.04 0.05 0.06 0.07 0.08 0.09 0.1
9-story ISO 1
0
0.2
0.4
0.6
0.8
1
1.2
0 0.01 0.02 0.03 0.04 0.05 0.06 0.07 0.08 0.09 0.10
0.2
0.4
0.6
0.8
1
1.2
1.4
0 0.01 0.02 0.03 0.04 0.05 0.06 0.07 0.08 0.09 0.1
9-story ISO 3
0
0.2
0.4
0.6
0.8
1
1.2
1.4
0 0.01 0.02 0.03 0.04 0.05 0.06 0.07 0.08 0.09 0.1
9-story ISO 4
0
0.2
0.4
0.6
0.8
1
1.2
0 0.01 0.02 0.03 0.04 0.05 0.06 0.07 0.08 0.09 0.1
9-story ISO 5
0
0.2
0.4
0.6
0.8
1
1.2
0 0.01 0.02 0.03 0.04 0.05 0.06 0.07 0.08 0.09 0.1
9-story ISO 6 9-story ISO 7
0
0.1
0.2
0.3
0.4
0.5
0.6
0.7
0.8
0 0.01 0.02 0.03 0.04 0.05 0.06 0.07 0.08 0.09 0.1
9-story ISO 2
Firs
t-mod
e spe
ctra
l acc
eler
atio
n,Sa
(T1,5
%) (
g)
Firs
t-mod
e spe
ctra
l acc
eler
atio
n,Sa
(T1,5
%) (
g)
Firs
t-mod
e spe
ctra
l acc
eler
atio
n,Sa
(T1,5
%) (
g)Fi
rst-m
ode s
pect
ral a
ccel
erat
ion,
Sa(T
1,5
%) (
g)Fi
rst-m
ode s
pect
ral a
ccel
erat
ion,
Sa(T
1,5
%) (
g)
Firs
t-mod
e spe
ctra
l acc
eler
atio
n,Sa
(T1,5
%) (
g)
Firs
t-mod
e spe
ctra
l acc
eler
atio
n,Sa
(T1,5
%) (
g)Fi
rst-m
ode s
pect
ral a
ccel
erat
ion,
Sa(T
1,5
%) (
g)
Maximum interstory drift ratio, 𝜃Max Maximum interstory drift ratio, 𝜃Max
Maximum interstory drift ratio, 𝜃Max
Maximum interstory drift ratio, 𝜃Max
Maximum interstory drift ratio, 𝜃Max Maximum interstory drift ratio, 𝜃Max
Maximum interstory drift ratio, 𝜃Max
Maximum interstory drift ratio, 𝜃Max
Figure 6: Continued.
10 Shock and Vibration
0
0.2
0.4
0.6
0.8
1
1.2
0 0.01 0.02 0.03 0.04 0.05 0.06 0.07 0.08 0.09 0.1
9-story ISO 8
00.10.20.30.40.50.60.70.80.9
1
0 0.01 0.02 0.03 0.04 0.05 0.06 0.07 0.08 0.09 0.1
9-story ISO 9
Firs
t-mod
e spe
ctra
l acc
eler
atio
n,Sa
(T1,5
%) (
g)
Firs
t-mod
e spe
ctra
l acc
eler
atio
n,Sa
(T1,5
%) (
g)
Maximum interstory drift ratio, 𝜃Max Maximum interstory drift ratio, 𝜃Max
Figure 6: IDA curves for 9-story frame (ISO 1 to 9 are related to damping ratios 0.1, 0.26, 0.48, 0.19, 0.52, 0.78, 0.3, 0.71, and 1.0, resp.).
0 0.02 0.04 0.06 0.08 0.10
0.2
0.4
0.6
0.8
1
10%26%
48%Fixed
19%52%
78%Fixed
0 0.02 0.04 0.06 0.08 0.1
0 0.02 0.04 0.06 0.08 0.1
0
0.2
0.4
0.6
0.8
1
30%71%
100%Fixed
Firs
t-mod
e spe
ctra
l acc
eler
atio
n, S
a(T
1,5
%) (
g)
Firs
t-mod
e spe
ctra
l acc
eler
atio
n , S
a(T
1,5
%) (
g)
0
0.2
0.4
0.6
0.8
1
3 stories (T = 2.5 s)
Maximum interstory drift ratio, 𝜃max Maximum interstory drift ratio, 𝜃max
Maximum interstory drift ratio, 𝜃max
3 stories (T = 4 s)
3 stories (T = 5.5 s)
Firs
t-mod
e spe
ctra
l acc
eler
atio
n , S
a(T
1,5
%) (
g)
Figure 7: Summarized IDA curves for 3-story frame.
Shock and Vibration 11
Table 3: Periods and spectral accelerations of 3-story frame at IOand LS states.
(a) Period = 2.5 s
Structure Fixed baseBase
isolated 1(2.5 s)
Baseisolated 2(2.5 s)
Baseisolated 3(2.5 s)
Period(s) 1 2.11 1.5 1.37Sa(IO (g)) 0.59 0.30 0.39 0.43Sa(LS (g)) 0.89 0.44 0.59 0.65
(b) Period = 4 s
Structure Fixed baseBase
isolated 1(4 s)
Baseisolated 2
(4 s)
Baseisolated 3
(4 s)
Period(s) 1 2.35 1.72 1.54Sa(IO (g)) 0.59 0.25 0.34 0.38Sa(LS (g)) 0.89 0.38 0.52 0.58
(c) Period = 5.5 s
Structure Fixed baseBase
isolated 1(5.5 s)
Baseisolated 2(5.5 s)
Baseisolated 3(5.5 s)
Period(s) 1 2.52 1.93 1.71Sa(IO (g)) 0.59 0.23 0.31 0.35Sa(LS (g)) 0.89 0.35 0.46 0.52
caused due to seismic loads; Sc is the median value ofstructural capacity for predefined damage state; 𝛽𝑑 is thelogarithmic standard deviation of the demand; 𝛽𝑐 is thelogarithmic standard deviation for the capacity; and 0[ ] isthe standard normal distribution function. The parameter 𝛽𝑐was assumed to be 0.3 following the recommendations fromHAZUS [31], while 𝛽𝑑 was computed as the logarithmic stan-dard deviation of seismic responses gained for each floor ofthe studied structure from the nonlinearly dynamic analyses.As aforementioned, the maximum interstory drift ratios havebeen widely and efficiently used to generate fragility curvesfor multistory framing structures at predescribed FEMAdifferent performance levels.
Following that it has been dealt with fragility curves toobtain the vulnerability amount of 3- and 9-story structures.
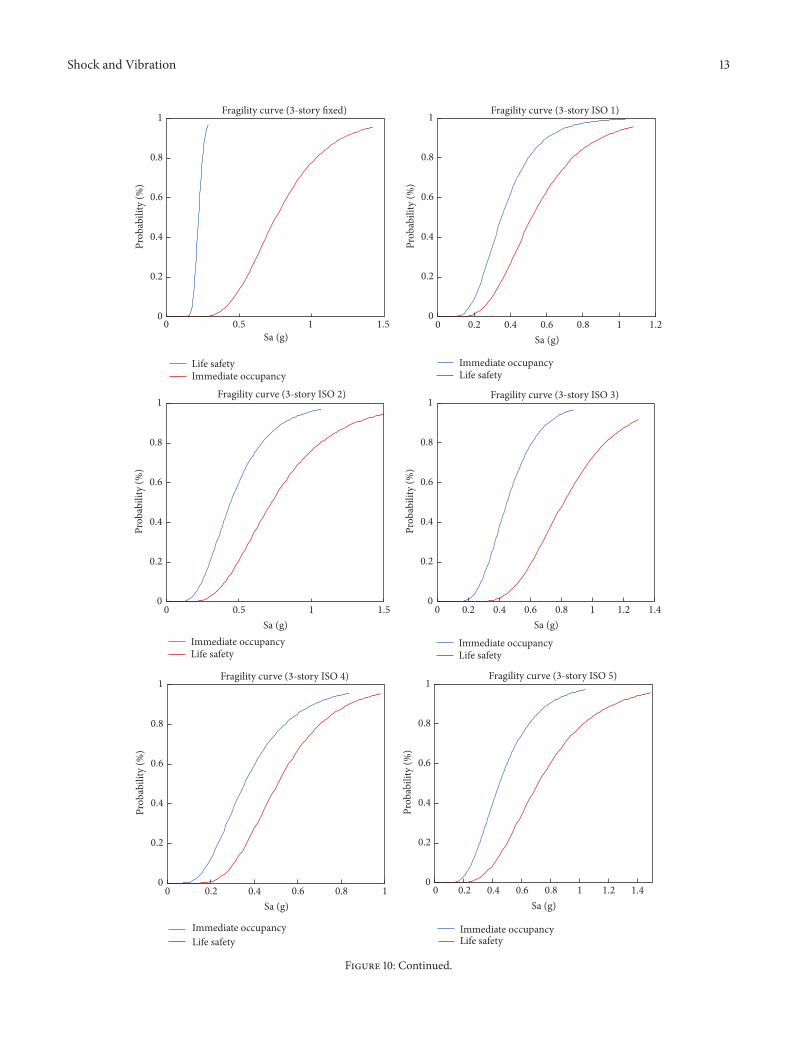
5.4.1. Fragility Curves for 3-Story Structure. In Figure 10fragility curves have been shown for 3-story structure.
As can be seen from Figure 10, for the 3-story structure,in base isolated case, the amounts of annual exceedanceprobability reach together LS and IO performance levels.And in fixed base structure state, these amounts have moredistance with each other. By increasing damping in curveswith equal design time period, the difference of annualexceedance probability increases in two levels of performancewhere this difference is so less than fixed base structure. Thereason of this significant difference is the reduction of isolatoreffect in performance level of life safety that decreases the
Table 4: Values of annual exceedance probability for 3-story frame.
(a) Period = 2.5 s
Structure Fixed baseBase
isolated 1(2.5 s)
Baseisolated 2(2.5 s)
Baseisolated 3(2.5 s)
Period(s) 1 2.11 1.5 1.37Prob(IO) 100% 35% 40% 45%Prob(LS) 68% 35% 32% 26%
(b) Period = 4 s
Structure Fixed baseBase
isolated 1(4 s)
Baseisolated 2
(4 s)
Baseisolated 3
(4 s)
Period(s) 1 2.11 1.5 1.37Prob(IO) 100% 24% 26% 28%Prob(LS) 68% 23% 22% 17%
(c) Period = 5.5 s
Structure Fixed baseBase
isolated 1(5.5 s)
Baseisolated 2(5.5 s)
Baseisolated 3(5.5 s)
Period(s) 1 2.11 1.5 1.37Prob(IO) 100% 10% 18% 24%Prob(LS) 68% 22% 21% 13%
amount of damage remarkably, whilst the isolator shows lessproficiency from itself in the level of immediate occupancy.In Table 4 the amount of annual exceedance probability in 3-story structure has been presented.
The exceedance probability for two levels of performancein 3-story structure is as follows.
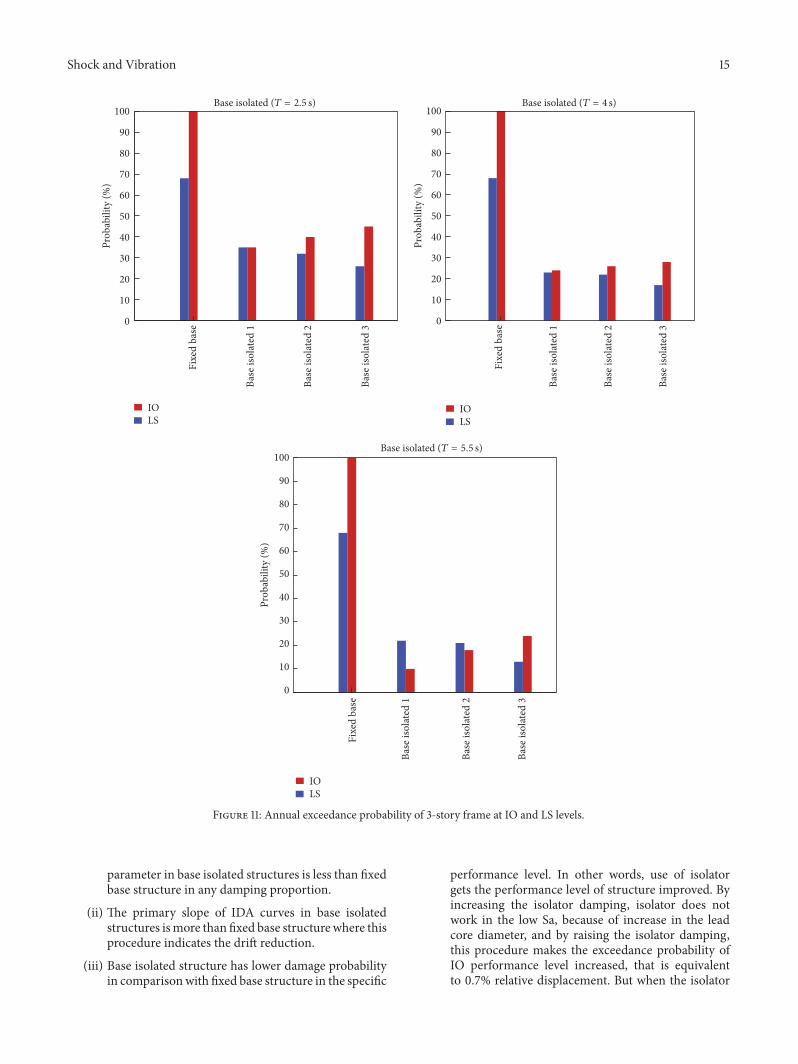
In Figure 11 the exceedance probability for two levels ofperformance has been illustrated for 3-story structure.
Comparison of the amounts of exceedance probabilityfor 3-story structure in Figure 11 shows that, by increasingdamping, the annual exceedance probability in immediateoccupancy level performance is increased and is decreasedin life safety performance level and that this amount isless than constant structure. The isolator in immediateoccupancy performance has appropriate proficiency but byincreasing damping, the amounts of exceedance probabilityare increased. In other words, the isolator shows betterproficiency from itself in low damping and it is oppositethe state which happens in life safety. Likewise by increasingdesign time period (for example, 5.5 seconds) the amounts offailure probability are decreased and the isolator shows betterperformance
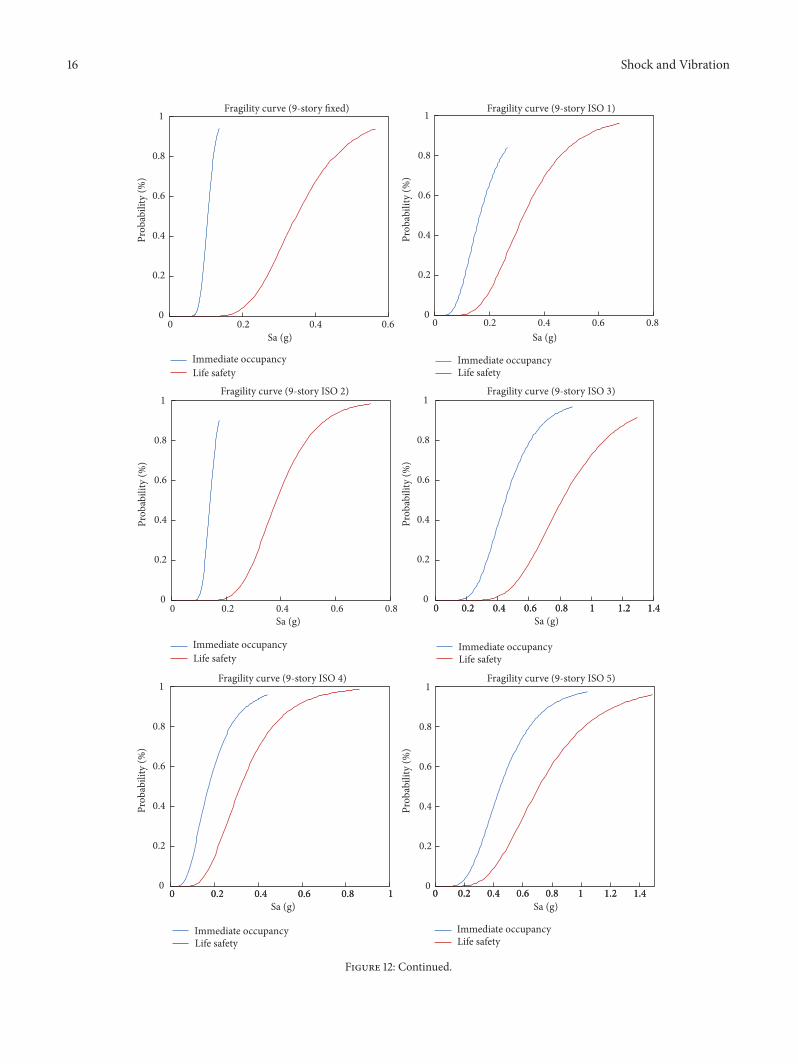
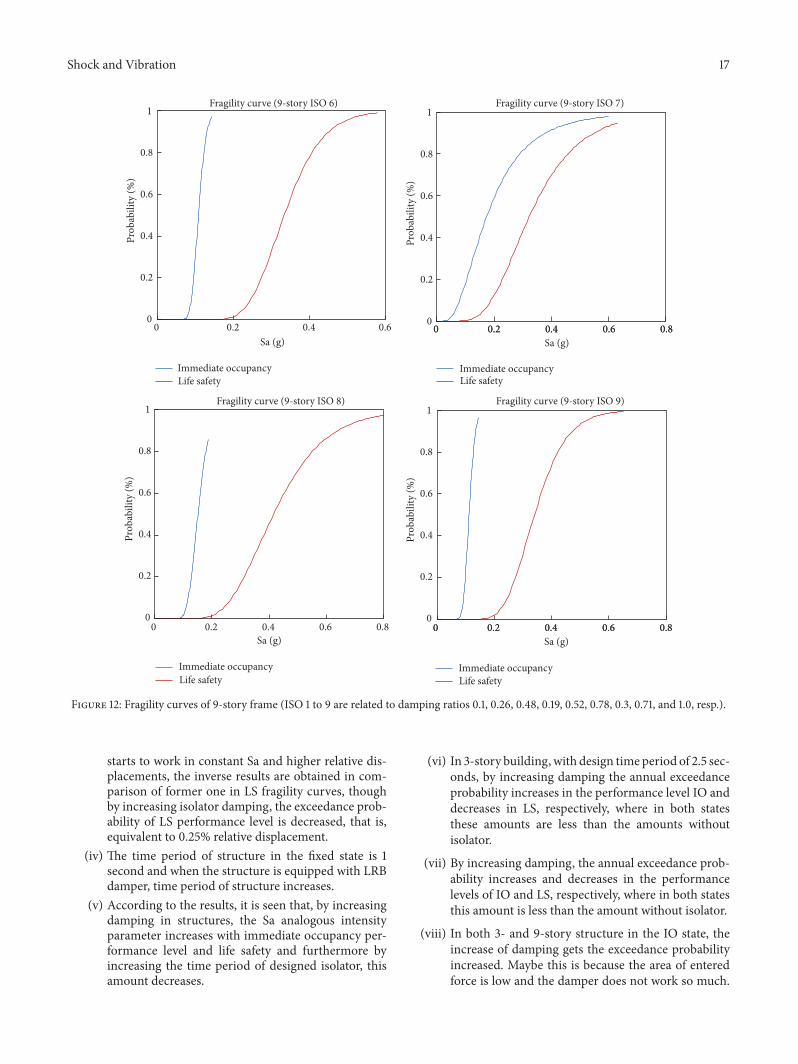
5.4.2. Fragility Curves of 9-Story Structures. In Figure 12fragility curves have been shown for 9-story structure.
In Table 5 the amounts of annual exceedance probabilityhave been presented for 9-story structure.
The exceedance probability in two levels of performancein 9-story structure is as follows.
12 Shock and Vibration
0 0.02 0.04 0.06 0.08 0.1
0 0.02 0.04 0.06 0.08 0.1
0
0.1
0.2
0.3
0.4
0.5
10%26%
48%Fixed
0
0.1
0.2
0.3
0.4
0.5
19%52%
78%Fixed
0
0.1
0.2
0.3
0.4
0.5
30%71%
100%Fixed
9 stories (T = 2.5 s)
9 stories (T = 5.5 s)
Maximum interstory drift ratio, 𝜃max
Maximum interstory drift ratio, 𝜃max
0 0.02 0.04 0.06 0.08 0.1Maximum interstory drift ratio, 𝜃max
Firs
t-mod
e spe
ctra
l acc
eler
atio
n,Sa
(T1,5
%)(g)
Firs
t-mod
e spe
ctra
l acc
eler
atio
n,Sa
(T1,5
%)(g)
Firs
t-mod
e spe
ctra
l acc
eler
atio
n,Sa
(T1,5
%)(g)
9 stories (T = 4 s)
Figure 8: Summarized IDA curves for 9-story frame.
0.000
0.200
0.400
0.600
0.800
1.000
1.200
1.400
1.600
1.800
0 1 2 3 4 5 6 7
DBE (IO)mce (ls)
T (sec)
Sa (g
)
Figure 9: Simplified hazard spectrum.
Shock and Vibration 13
Sa (g)
Prob
abili
ty (%
)
0 0.5 1 1.5
Fragility curve (3-story fixed)
Prob
abili
ty (%
)
Immediate occupancyLife safety
Immediate occupancyLife safety
Immediate occupancyLife safety
Immediate occupancyLife safety
Fragility curve (3-story ISO 1)
Prob
abili
ty (%
)
Prob
abili
ty (%
)Fragility curve (3-story ISO 2) Fragility curve (3-story ISO 3)
Prob
abili
ty (%
)
Immediate occupancyLife safety
Fragility curve (3-story ISO 4)
Sa (g)
Prob
abili
ty (%
)
Immediate occupancyLife safety
Fragility curve (3-story ISO 5)
0 0.2 0.4 0.6 0.8 1 1.2 1.4
0
0.2
0.4
0.6
0.8
1
0.80.4 0.60.2 1.210Sa (g)
0
0.2
0.4
0.6
0.8
1
0.2 0.4 0.6 0.8 1 1.2 1.40Sa (g)
0
0.2
0.4
0.6
0.8
1
0
0.2
0.4
0.6
0.8
1
0.5 1 1.50Sa (g)
0
0.2
0.4
0.6
0.8
1
0
0.2
0.4
0.6
0.8
1
0.2 0.4 0.6 0.8 10Sa (g)
Figure 10: Continued.
14 Shock and Vibration
Sa (g)
Prob
abili
ty (%
)
Prob
abili
ty (%
)
0 0.2 0.4 0.6 0.8 1 1.20
0.2
0.4
0.6
0.8
1
Immediate occupancyLife safety
Immediate occupancyLife safety
Fragility curve (3-story ISO 8) Fragility curve (3-story ISO 9)
0
0.2
0.4
0.6
0.8
1
0.2 0.4 0.6 0.8 1 1.2 1.4 1.6 1.80Sa (g)
Sa (g)
Prob
abili
ty (%
)
0 0.2 0.4 0.6 0.8 1 1.2 1.40
0.2
0.4
0.6
0.8
1
Prob
abili
ty (%
)
0
0.2
0.4
0.6
0.8
1
Immediate occupancyLife safety
Immediate occupancyLife safety
fragility curve (3-story ISO 6)
Sa (g)0 0.2 0.4 0.6 0.8 1
Fragility curve (3-story ISO 7)
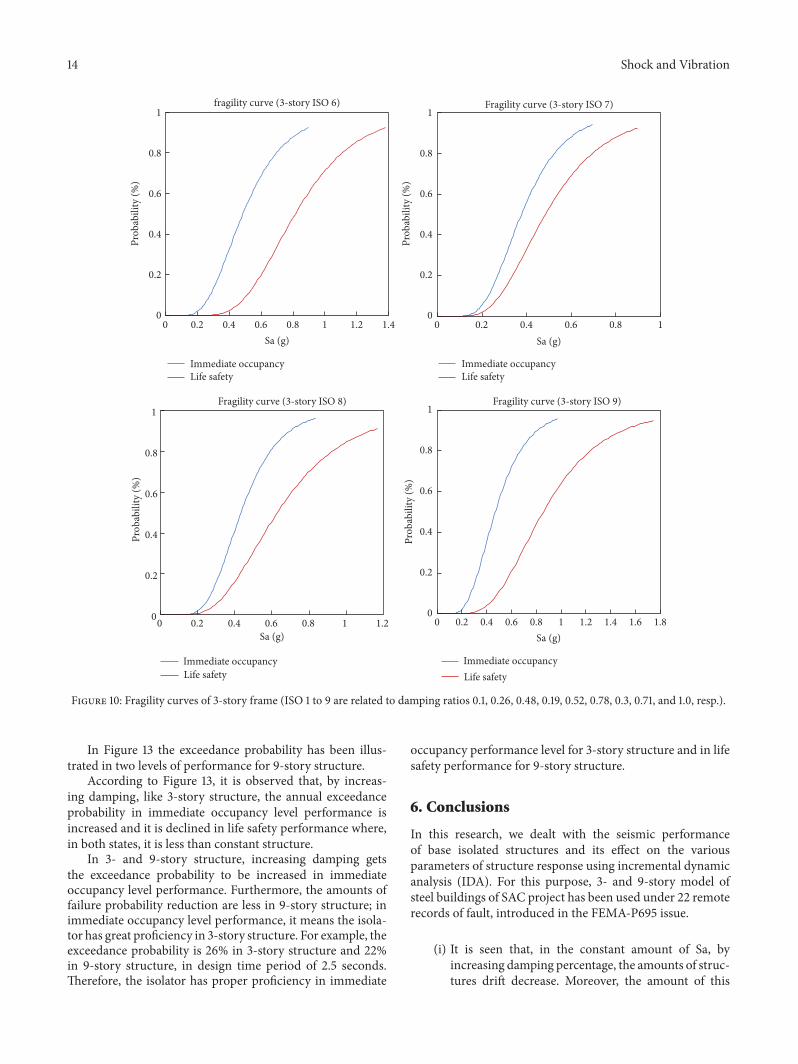
Figure 10: Fragility curves of 3-story frame (ISO 1 to 9 are related to damping ratios 0.1, 0.26, 0.48, 0.19, 0.52, 0.78, 0.3, 0.71, and 1.0, resp.).
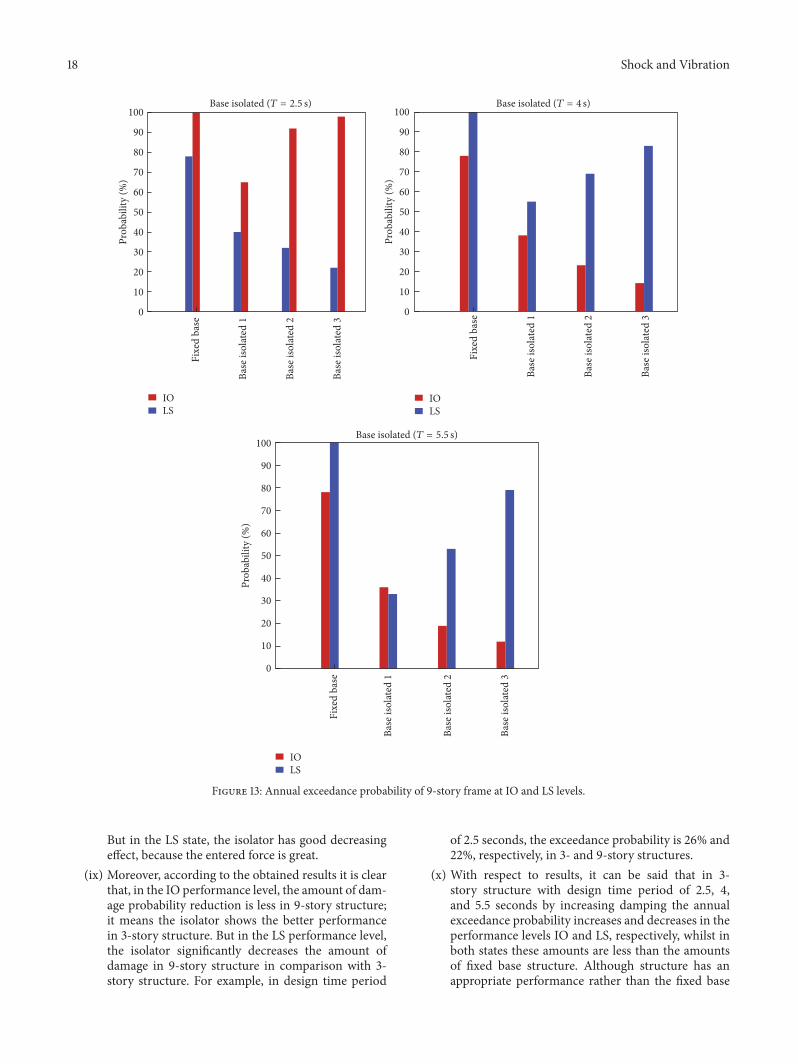
In Figure 13 the exceedance probability has been illus-trated in two levels of performance for 9-story structure.
According to Figure 13, it is observed that, by increas-ing damping, like 3-story structure, the annual exceedanceprobability in immediate occupancy level performance isincreased and it is declined in life safety performance where,in both states, it is less than constant structure.
In 3- and 9-story structure, increasing damping getsthe exceedance probability to be increased in immediateoccupancy level performance. Furthermore, the amounts offailure probability reduction are less in 9-story structure; inimmediate occupancy level performance, it means the isola-tor has great proficiency in 3-story structure. For example, theexceedance probability is 26% in 3-story structure and 22%in 9-story structure, in design time period of 2.5 seconds.Therefore, the isolator has proper proficiency in immediate
occupancy performance level for 3-story structure and in lifesafety performance for 9-story structure.
6. Conclusions
In this research, we dealt with the seismic performanceof base isolated structures and its effect on the variousparameters of structure response using incremental dynamicanalysis (IDA). For this purpose, 3- and 9-story model ofsteel buildings of SAC project has been used under 22 remoterecords of fault, introduced in the FEMA-P695 issue.
(i) It is seen that, in the constant amount of Sa, byincreasing damping percentage, the amounts of struc-tures drift decrease. Moreover, the amount of this
Shock and Vibration 15
Prob
abili
ty (%
)
0
10
20
30
40
50
60
70
80
90
100
Prob
abili
ty (%
)
0
10
20
30
40
50
60
70
80
90
100
Prob
abili
ty (%
)
0
10
20
30
40
50
60
70
80
90
100
IOLS
IOLS
IOLS
Base
isol
ated
1
Base
isol
ated
2
Base
isol
ated
3
Fixe
d ba
se
Fixe
d ba
se
Fixe
d ba
se
Base
isol
ated
1
Base
isol
ated
2
Base
isol
ated
3
Base
isol
ated
1
Base
isol
ated
2
Base
isol
ated
3
Base isolated (T = 2.5 s) Base isolated (T = 4 s)
Base isolated (T = 5.5 s)
Figure 11: Annual exceedance probability of 3-story frame at IO and LS levels.
parameter in base isolated structures is less than fixedbase structure in any damping proportion.
(ii) The primary slope of IDA curves in base isolatedstructures ismore than fixed base structure where thisprocedure indicates the drift reduction.
(iii) Base isolated structure has lower damage probabilityin comparisonwith fixed base structure in the specific
performance level. In other words, use of isolatorgets the performance level of structure improved. Byincreasing the isolator damping, isolator does notwork in the low Sa, because of increase in the leadcore diameter, and by raising the isolator damping,this procedure makes the exceedance probability ofIO performance level increased, that is equivalentto 0.7% relative displacement. But when the isolator
16 Shock and Vibration
Fragility curve (9-story ISO 4) Fragility curve (9-story ISO 5)
Sa (g) Sa (g)0 0.2 0.4 0.6 0 0.2 0.4 0.6 0.8
Prob
abili
ty (%
)
0
0.2
0.4
0.6
0.8
1
Prob
abili
ty (%
)
0
0.2
0.4
0.6
0.8
1
Prob
abili
ty (%
)
0
0.2
0.4
0.6
0.8
1
Prob
abili
ty (%
)
0
0.2
0.4
0.6
0.8
1
Prob
abili
ty (%
)
0
0.2
0.4
0.6
0.8
1Pr
obab
ility
(%)
0
0.2
0.4
0.6
0.8
1
Immediate occupancyLife safety
Immediate occupancyLife safety
Immediate occupancyLife safety
Immediate occupancyLife safety
Immediate occupancyLife safety
Immediate occupancyLife safety
Fragility curve (9-story fixed) Fragility curve (9-story ISO 1)
Sa (g)
Sa (g)
Sa (g)0 0.2 0.4 0.20.20.6 0.60.60.40.40.8
Fragility curve (9-story ISO 2)
00 0.80.8 11 1.21.2 1.41.4
Sa (g)0.20.2 0.60.60.40.400 0.80.8 110.20.2 0.60.60.40.400 0.80.8 11 1.21.2 1.41.4
Fragility curve (9-story ISO 3)
Figure 12: Continued.
Shock and Vibration 17
0.8
Fragility curve (9-story ISO 8) Fragility curve (9-story ISO 9)
Fragility curve (9-story ISO 6) Fragility curve (9-story ISO 7)
Prob
abili
ty (%
)
0
0.2
0.4
0.6
0.8
1
Prob
abili
ty (%
)
Prob
abili
ty (%
)
0
0.2
0.4
0.6
0.8
1Pr
obab
ility
(%)
0
0.2
0.4
0.6
0.8
1
Immediate occupancyLife safety
Immediate occupancyLife safety
Immediate occupancyLife safety
Immediate occupancyLife safety
Sa (g)0 0.2 0.4 0.6
Sa (g)0.20.2 0.60.60.40.400 0.80.8
Sa (g)0.20.2 0.60.60.40.400 0.80.8
Sa (g)0 0.2 0.4 0.6
0
0.2
0.4
0.6
0.8
1
Figure 12: Fragility curves of 9-story frame (ISO 1 to 9 are related to damping ratios 0.1, 0.26, 0.48, 0.19, 0.52, 0.78, 0.3, 0.71, and 1.0, resp.).
starts to work in constant Sa and higher relative dis-placements, the inverse results are obtained in com-parison of former one in LS fragility curves, thoughby increasing isolator damping, the exceedance prob-ability of LS performance level is decreased, that is,equivalent to 0.25% relative displacement.
(iv) The time period of structure in the fixed state is 1second and when the structure is equipped with LRBdamper, time period of structure increases.
(v) According to the results, it is seen that, by increasingdamping in structures, the Sa analogous intensityparameter increases with immediate occupancy per-formance level and life safety and furthermore byincreasing the time period of designed isolator, thisamount decreases.
(vi) In 3-story building, with design time period of 2.5 sec-onds, by increasing damping the annual exceedanceprobability increases in the performance level IO anddecreases in LS, respectively, where in both statesthese amounts are less than the amounts withoutisolator.
(vii) By increasing damping, the annual exceedance prob-ability increases and decreases in the performancelevels of IO and LS, respectively, where in both statesthis amount is less than the amount without isolator.
(viii) In both 3- and 9-story structure in the IO state, theincrease of damping gets the exceedance probabilityincreased. Maybe this is because the area of enteredforce is low and the damper does not work so much.
18 Shock and Vibration
Prob
abili
ty (%
)
0
10
20
30
40
50
60
70
80
90
100
Prob
abili
ty (%
)
0
10
20
30
40
50
60
70
80
90
100
Prob
abili
ty (%
)
0
10
20
30
40
50
60
70
80
90
100
Fixe
d ba
se
Base
isol
ated
1
Base
isol
ated
2
Base
isol
ated
3Fi
xed
base
Base
isol
ated
1
Base
isol
ated
2
Base
isol
ated
3
Fixe
d ba
se
Base
isol
ated
1
Base
isol
ated
2
Base
isol
ated
3
IOLS
IOLS
IOLS
Base isolated (T = 2.5 s) Base isolated (T = 4 s)
Base isolated (T = 5.5 s)
Figure 13: Annual exceedance probability of 9-story frame at IO and LS levels.
But in the LS state, the isolator has good decreasingeffect, because the entered force is great.
(ix) Moreover, according to the obtained results it is clearthat, in the IO performance level, the amount of dam-age probability reduction is less in 9-story structure;it means the isolator shows the better performancein 3-story structure. But in the LS performance level,the isolator significantly decreases the amount ofdamage in 9-story structure in comparison with 3-story structure. For example, in design time period
of 2.5 seconds, the exceedance probability is 26% and22%, respectively, in 3- and 9-story structures.
(x) With respect to results, it can be said that in 3-story structure with design time period of 2.5, 4,and 5.5 seconds by increasing damping the annualexceedance probability increases and decreases in theperformance levels IO and LS, respectively, whilst inboth states these amounts are less than the amountsof fixed base structure. Although structure has anappropriate performance rather than the fixed base
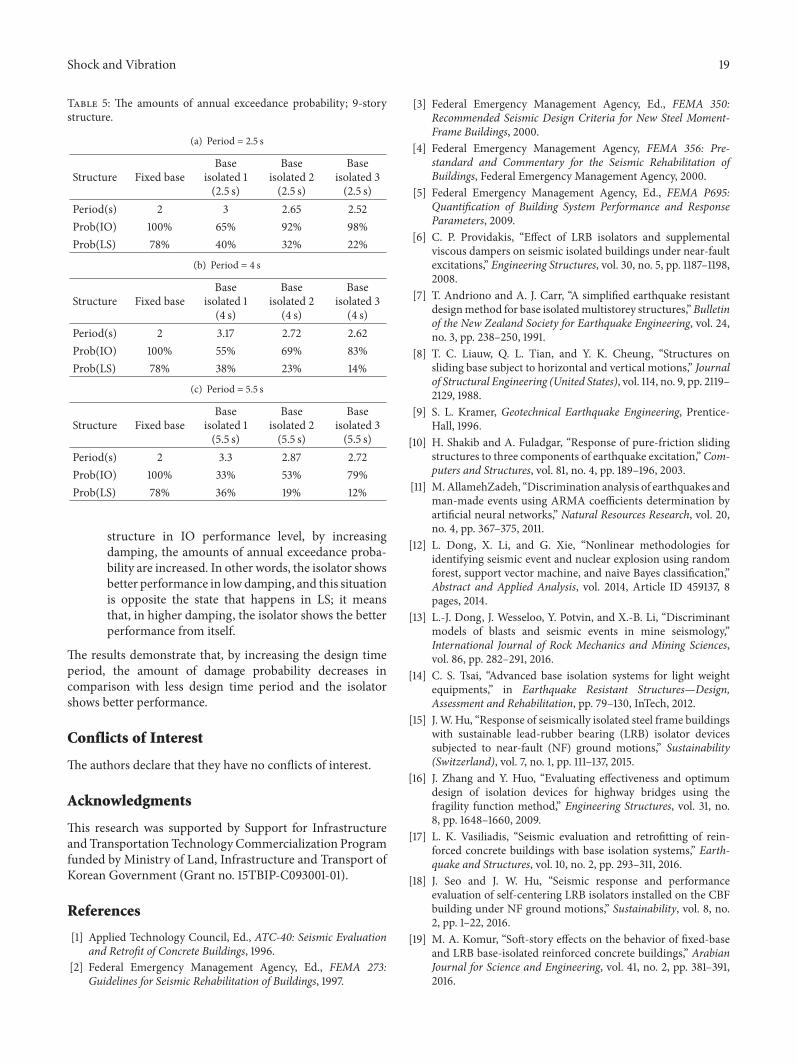
Shock and Vibration 19
Table 5: The amounts of annual exceedance probability; 9-storystructure.
(a) Period = 2.5 s
Structure Fixed baseBase
isolated 1(2.5 s)
Baseisolated 2(2.5 s)
Baseisolated 3(2.5 s)
Period(s) 2 3 2.65 2.52Prob(IO) 100% 65% 92% 98%Prob(LS) 78% 40% 32% 22%
(b) Period = 4 s
Structure Fixed baseBase
isolated 1(4 s)
Baseisolated 2
(4 s)
Baseisolated 3
(4 s)Period(s) 2 3.17 2.72 2.62Prob(IO) 100% 55% 69% 83%Prob(LS) 78% 38% 23% 14%
(c) Period = 5.5 s
Structure Fixed baseBase
isolated 1(5.5 s)
Baseisolated 2(5.5 s)
Baseisolated 3(5.5 s)
Period(s) 2 3.3 2.87 2.72Prob(IO) 100% 33% 53% 79%Prob(LS) 78% 36% 19% 12%
structure in IO performance level, by increasingdamping, the amounts of annual exceedance proba-bility are increased. In other words, the isolator showsbetter performance in lowdamping, and this situationis opposite the state that happens in LS; it meansthat, in higher damping, the isolator shows the betterperformance from itself.
The results demonstrate that, by increasing the design timeperiod, the amount of damage probability decreases incomparison with less design time period and the isolatorshows better performance.
Conflicts of Interest
The authors declare that they have no conflicts of interest.
Acknowledgments
This research was supported by Support for Infrastructureand Transportation Technology Commercialization Programfunded by Ministry of Land, Infrastructure and Transport ofKorean Government (Grant no. 15TBIP-C093001-01).
References
[1] Applied Technology Council, Ed., ATC-40: Seismic Evaluationand Retrofit of Concrete Buildings, 1996.
[2] Federal Emergency Management Agency, Ed., FEMA 273:Guidelines for Seismic Rehabilitation of Buildings, 1997.
[3] Federal Emergency Management Agency, Ed., FEMA 350:Recommended Seismic Design Criteria for New Steel Moment-Frame Buildings, 2000.
[4] Federal Emergency Management Agency, FEMA 356: Pre-standard and Commentary for the Seismic Rehabilitation ofBuildings, Federal Emergency Management Agency, 2000.
[5] Federal Emergency Management Agency, Ed., FEMA P695:Quantification of Building System Performance and ResponseParameters, 2009.
[6] C. P. Providakis, “Effect of LRB isolators and supplementalviscous dampers on seismic isolated buildings under near-faultexcitations,” Engineering Structures, vol. 30, no. 5, pp. 1187–1198,2008.
[7] T. Andriono and A. J. Carr, “A simplified earthquake resistantdesignmethod for base isolatedmultistorey structures,”Bulletinof the New Zealand Society for Earthquake Engineering, vol. 24,no. 3, pp. 238–250, 1991.
[8] T. C. Liauw, Q. L. Tian, and Y. K. Cheung, “Structures onsliding base subject to horizontal and vertical motions,” Journalof Structural Engineering (United States), vol. 114, no. 9, pp. 2119–2129, 1988.
[9] S. L. Kramer, Geotechnical Earthquake Engineering, Prentice-Hall, 1996.
[10] H. Shakib and A. Fuladgar, “Response of pure-friction slidingstructures to three components of earthquake excitation,”Com-puters and Structures, vol. 81, no. 4, pp. 189–196, 2003.
[11] M.AllamehZadeh, “Discrimination analysis of earthquakes andman-made events using ARMA coefficients determination byartificial neural networks,” Natural Resources Research, vol. 20,no. 4, pp. 367–375, 2011.
[12] L. Dong, X. Li, and G. Xie, “Nonlinear methodologies foridentifying seismic event and nuclear explosion using randomforest, support vector machine, and naive Bayes classification,”Abstract and Applied Analysis, vol. 2014, Article ID 459137, 8pages, 2014.
[13] L.-J. Dong, J. Wesseloo, Y. Potvin, and X.-B. Li, “Discriminantmodels of blasts and seismic events in mine seismology,”International Journal of Rock Mechanics and Mining Sciences,vol. 86, pp. 282–291, 2016.
[14] C. S. Tsai, “Advanced base isolation systems for light weightequipments,” in Earthquake Resistant Structures—Design,Assessment and Rehabilitation, pp. 79–130, InTech, 2012.
[15] J. W. Hu, “Response of seismically isolated steel frame buildingswith sustainable lead-rubber bearing (LRB) isolator devicessubjected to near-fault (NF) ground motions,” Sustainability(Switzerland), vol. 7, no. 1, pp. 111–137, 2015.
[16] J. Zhang and Y. Huo, “Evaluating effectiveness and optimumdesign of isolation devices for highway bridges using thefragility function method,” Engineering Structures, vol. 31, no.8, pp. 1648–1660, 2009.
[17] L. K. Vasiliadis, “Seismic evaluation and retrofitting of rein-forced concrete buildings with base isolation systems,” Earth-quake and Structures, vol. 10, no. 2, pp. 293–311, 2016.
[18] J. Seo and J. W. Hu, “Seismic response and performanceevaluation of self-centering LRB isolators installed on the CBFbuilding under NF ground motions,” Sustainability, vol. 8, no.2, pp. 1–22, 2016.
[19] M. A. Komur, “Soft-story effects on the behavior of fixed-baseand LRB base-isolated reinforced concrete buildings,” ArabianJournal for Science and Engineering, vol. 41, no. 2, pp. 381–391,2016.
20 Shock and Vibration
[20] J. W. Hu, “Seismic analysis and parametric study of SDOF lead-rubber bearing (LRB) isolation systems with recentering shapememory alloy (SMA) bending bars,” Journal of MechanicalScience and Technology, vol. 30, no. 7, pp. 2987–2999, 2016.
[21] M. Kumar, A. S.Whittaker, andM. C. Constantinou, “Responseof base-isolated nuclear structures to extreme earthquake shak-ing,” Nuclear Engineering and Design, vol. 295, pp. 860–874,2015.
[22] M. K. Sharbatdar, S. R. Hoseini Vaez, G. Ghodrati Amiri, andH. Naderpour, “Seismic response of base-isolated structureswith LRB and FPS under near fault ground motions,” ProcediaEngineering, vol. 14, pp. 3245–3251, 2011.
[23] R. L. Mayes and F. Naeim, “Design of structures with seis-mic isolation,” in The Seismic Design Handbook, pp. 723–755,Springer, 2001.
[24] Y. Wang, “Fundamentals of seismic isolation,” in Proceedingsof the International Training Programs for Seismic Design ofBuilding Structures, pp. 139–149, Taipei, Taiwan, 2003.
[25] D. Vamvatsikos, Seismic performance, capacity and reliability ofstructures as seen through incremental dynamic analysis [Ph.D.thesis], Stanford University, 2002.
[26] F. Colangelo, “A simplemodel to include fuzziness in the seismicfragility curve and relevant effect compared with randomness,”Earthquake Engineering and Structural Dynamics, vol. 41, no. 5,pp. 969–986, 2012.
[27] Y. Ohtori, R. E. Christenson, B. F. Spencer Jr., and S. J. Dyke,“Benchmark control problems for seismically excited nonlinearbuildings,” Journal of Engineering Mechanics, vol. 130, no. 4, pp.366–385, 2004.
[28] F. Naeim and J. M. Kelly, Design of Seismic Isolated Structures:FromTheory to Practice, JohnWiley& Sons, Hoboken, NJ, USA,1999.
[29] F. McKenna, G. L. Fenves, and M. H. Scott, Open System forEarthquake Engineering Simulation, OpenSees, 2000.
[30] N. Shome, Probabilistic seismic demand analysis of nonlinearstructures [Ph.D. thesis], Stanford University, 1999.
[31] J. Seo, J. W. Hu, and B. Davaajamts, “Seismic performanceevaluation of multistory reinforced concrete moment resistingframe structure with shear walls,” Sustainability, vol. 7, no. 10,pp. 14287–14308, 2015.

RoboticsJournal of
Hindawi Publishing Corporationhttp://www.hindawi.com Volume 2014
Hindawi Publishing Corporationhttp://www.hindawi.com Volume 2014
Active and Passive Electronic Components
Control Scienceand Engineering
Journal of
Hindawi Publishing Corporationhttp://www.hindawi.com Volume 2014
International Journal of
RotatingMachinery
Hindawi Publishing Corporationhttp://www.hindawi.com Volume 2014
Hindawi Publishing Corporation http://www.hindawi.com
Journal of
Volume 201
Submit your manuscripts athttps://www.hindawi.com
VLSI Design
Hindawi Publishing Corporationhttp://www.hindawi.com Volume 201
Hindawi Publishing Corporationhttp://www.hindawi.com Volume 2014
Shock and Vibration
Hindawi Publishing Corporationhttp://www.hindawi.com Volume 2014
Civil EngineeringAdvances in
Acoustics and VibrationAdvances in
Hindawi Publishing Corporationhttp://www.hindawi.com Volume 2014
Hindawi Publishing Corporationhttp://www.hindawi.com Volume 2014
Electrical and Computer Engineering
Journal of
Advances inOptoElectronics
Hindawi Publishing Corporation http://www.hindawi.com
Volume 2014
The Scientific World JournalHindawi Publishing Corporation http://www.hindawi.com Volume 2014
SensorsJournal of
Hindawi Publishing Corporationhttp://www.hindawi.com Volume 2014
Modelling & Simulation in EngineeringHindawi Publishing Corporation http://www.hindawi.com Volume 2014
Hindawi Publishing Corporationhttp://www.hindawi.com Volume 2014
Chemical EngineeringInternational Journal of Antennas and
Propagation
International Journal of
Hindawi Publishing Corporationhttp://www.hindawi.com Volume 2014
Hindawi Publishing Corporationhttp://www.hindawi.com Volume 2014
Navigation and Observation
International Journal of
Hindawi Publishing Corporationhttp://www.hindawi.com Volume 2014
DistributedSensor Networks
International Journal of


![Hobsbawm Sobre Togliatti LRB[1]](https://img.dokumen.tips/doc/110x75/577cda131a28ab9e78a4ce42/hobsbawm-sobre-togliatti-lrb1.jpg)