Embed Size (px)
Citation preview

Seismic Behaviour of Multi-Storey XLam Buildings
Ario Ceccotti Professor Director [email protected] Maurizio Follesa Civil Engineer Research Associate [email protected] CNR-IVALSA Via Biasi, 75 38010 San Michele all’Adige (TN)
Civil Engineer, Prof. of Structural Engineering, University of Venice. Director of the Trees and Timber Institute of the National Research Council of Italy (CNR-IVALSA). Member of Eurocode 5 (Timber Structures) and Eurocode 8 (Structures in Seismic Areas) Civil Engineer, Research Associate in Timber Engineering and Seismic Behaviour of Timber Structures for the Trees and Timber Institute of the National Research Council of Italy (CNR-IVALSA) and University of Florence.
Summary The Trees and Timber Institute of the National Research Council of Italy (CNR-IVALSA) in collaboration with National Institute for Earth Science and Disaster Pevention (NIED), Shizuoka University, Building Research Institute and Center for Better Living, Japan, initiated in 2005 a research program on the seismic resistance of Multi-Storey XLam Buildings. This is a part of a more comprehensive program named SOFIE Project (in which SOFIE stands for the Fiemme house constructive system, where Fiemme is a part of Trentino, a region of the north-est of Italy particularly rich of wood) and funded by the Autonomous Province of Trento, Italy. This project is undertaken in cooperation with many international research institutions and deals with many aspects of this new constructive system in order to enhance the use of wood and of multi-storey wooden buildings in Italy and Europe. In this paper results from shaking table tests on a full-scale 3 storied XLam building are presented. The test were conducted at the NIED Tsukuba Shaking Table facility in June and July of 2006. It is the first time that such a test have been ever conducted on this type of structures.
1. Introduction XLam structures (where XLam stands for cross-laminated timber boards) are becoming in the last years a “standard” in Europe among the timber-based constructive systems, even for multi-storey buildings, and they’re gaining increasing shares in the residential market. Their unquestionable success is due to several reasons among which we may take into account the following:
Fig. 1 Four stories XLam building
• the cross lamination method gives a material with high stability and good overall mechanical properties, good thermal insulation, and a fairly good behaviour in case of earthquake or fire;
• XLam panels are extremely strong and stiff whatever is the timber quality, therefore they allow the use of medium-low grades of home-grown sawn wood;
• the system shows a good ductility and good overall dissipating properties in dependence of the connection layout;
• the XLam system allows both for single unit housing and multi-storey buildings; • the construction process is very quick and possible even for non-highly-skilled manpower; and most of all, • the XLam system is more appealing to a large part of European public, less keen to
“lightweight” timber buildings systems and more familiar with massive masonry buildings. However, due to the fast growing rate of diffusion of this system, up to now European Standards are not yet supporting this constructive system with an harmonised set of product, design, erection, inspection and maintenance rules which may summon up the know-how and the design and erection procedures already developed.
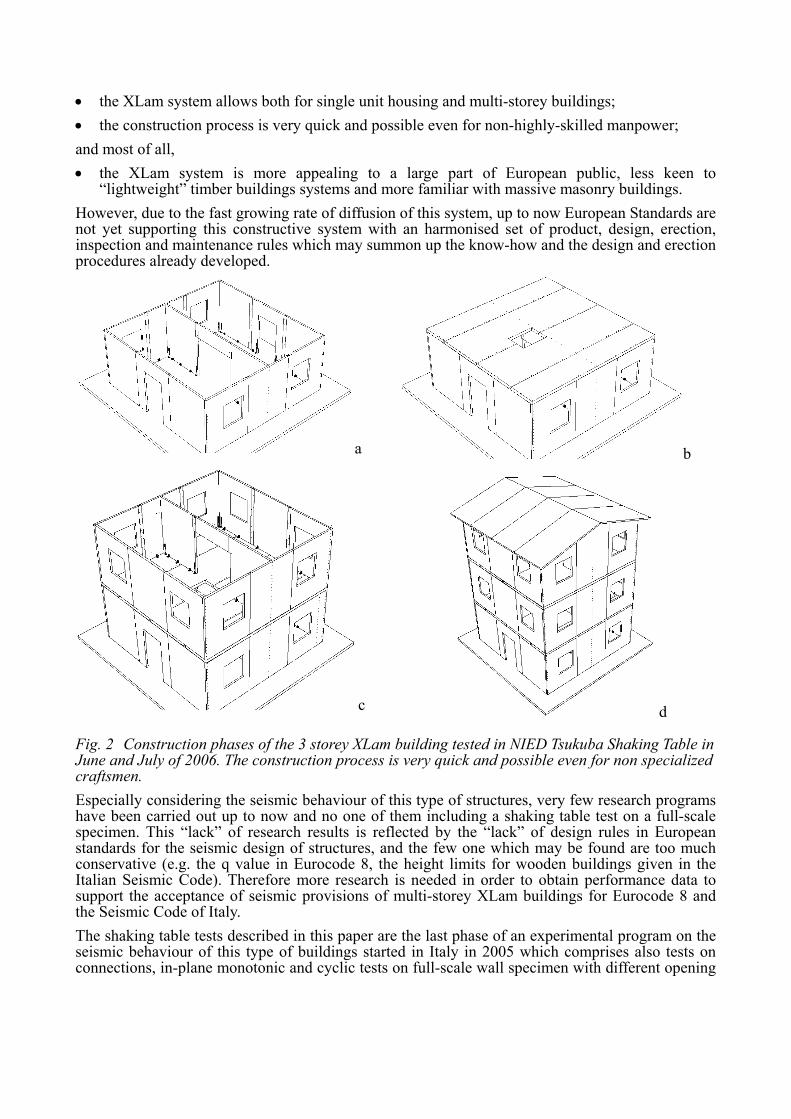
a b
c d
Fig. 2 Construction phases of the 3 storey XLam building tested in NIED Tsukuba Shaking Table in June and July of 2006. The construction process is very quick and possible even for non specialized craftsmen. Especially considering the seismic behaviour of this type of structures, very few research programs have been carried out up to now and no one of them including a shaking table test on a full-scale specimen. This “lack” of research results is reflected by the “lack” of design rules in European standards for the seismic design of structures, and the few one which may be found are too much conservative (e.g. the q value in Eurocode 8, the height limits for wooden buildings given in the Italian Seismic Code). Therefore more research is needed in order to obtain performance data to support the acceptance of seismic provisions of multi-storey XLam buildings for Eurocode 8 and the Seismic Code of Italy. The shaking table tests described in this paper are the last phase of an experimental program on the seismic behaviour of this type of buildings started in Italy in 2005 which comprises also tests on connections, in-plane monotonic and cyclic tests on full-scale wall specimen with different opening
1003
and connection layouts and a pseudo-dynamic test on a one-storey specimen with the same dimensions of the one described in this paper. The results of this preliminary tests are described in paper “Quasi-Static and Pseudo-Dynamic Tests on XLam Walls and Buildings” by M.P. Lauriola and C. Sandhaas. The final purpose of this research project is to develop a reliable analytical model capable to predict the non-linear behaviour of this kind of buildings under real earthquakes excitations in order to provide the European and Italian codes with a quantitative basis for the rational calculations of the seismic behaviour of XLam buildings.
2. Shaking table tests The tests were conducted on the 14,5m x 15m NIED Shaking Table in Tsukuba. The basic specifications of the table are listed in Table 1 Table 1 Basic specification of the shaking table Payload 500 ton Size 14,5m x 15m Shaking Direction X Horizontal Maximum Acceleration 500cm/s2 (500 ton)
940cm/s2 (200 ton) Maximum Velocity 90cm/s Maximum Displacement ±22 cm
2.1 Description of Test Specimen
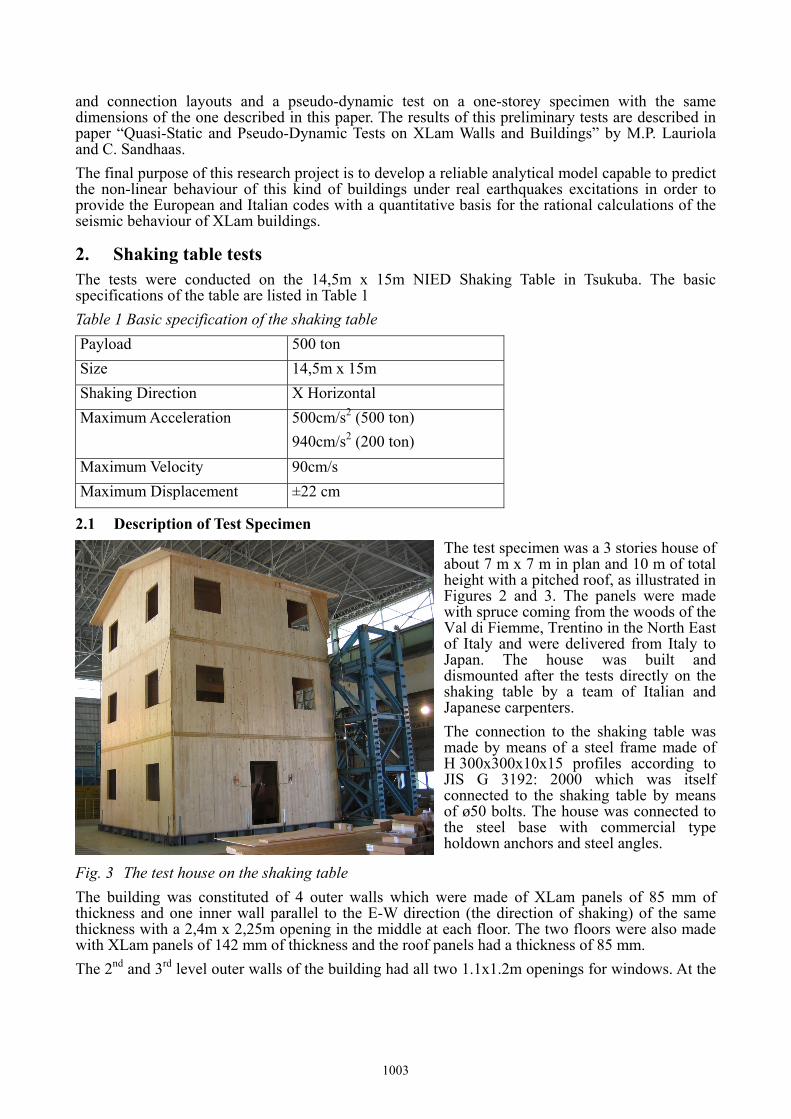
Fig. 3 The test house on the shaking table
The test specimen was a 3 stories house of about 7 m x 7 m in plan and 10 m of total height with a pitched roof, as illustrated in Figures 2 and 3. The panels were made with spruce coming from the woods of the Val di Fiemme, Trentino in the North East of Italy and were delivered from Italy to Japan. The house was built and dismounted after the tests directly on the shaking table by a team of Italian and Japanese carpenters. The connection to the shaking table was made by means of a steel frame made of H 300x300x10x15 profiles according to JIS G 3192: 2000 which was itself connected to the shaking table by means of ø50 bolts. The house was connected to the steel base with commercial type holdown anchors and steel angles.
The building was constituted of 4 outer walls which were made of XLam panels of 85 mm of thickness and one inner wall parallel to the E-W direction (the direction of shaking) of the same thickness with a 2,4m x 2,25m opening in the middle at each floor. The two floors were also made with XLam panels of 142 mm of thickness and the roof panels had a thickness of 85 mm. The 2nd and 3rd level outer walls of the building had all two 1.1x1.2m openings for windows. At the
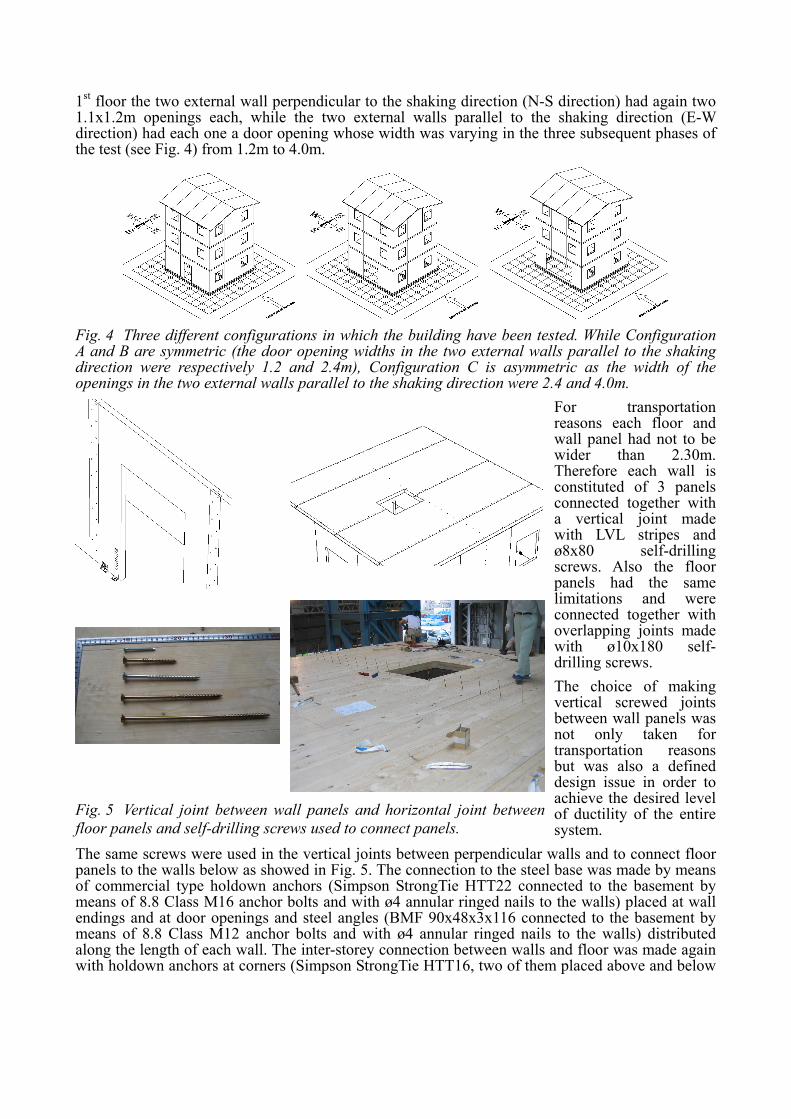
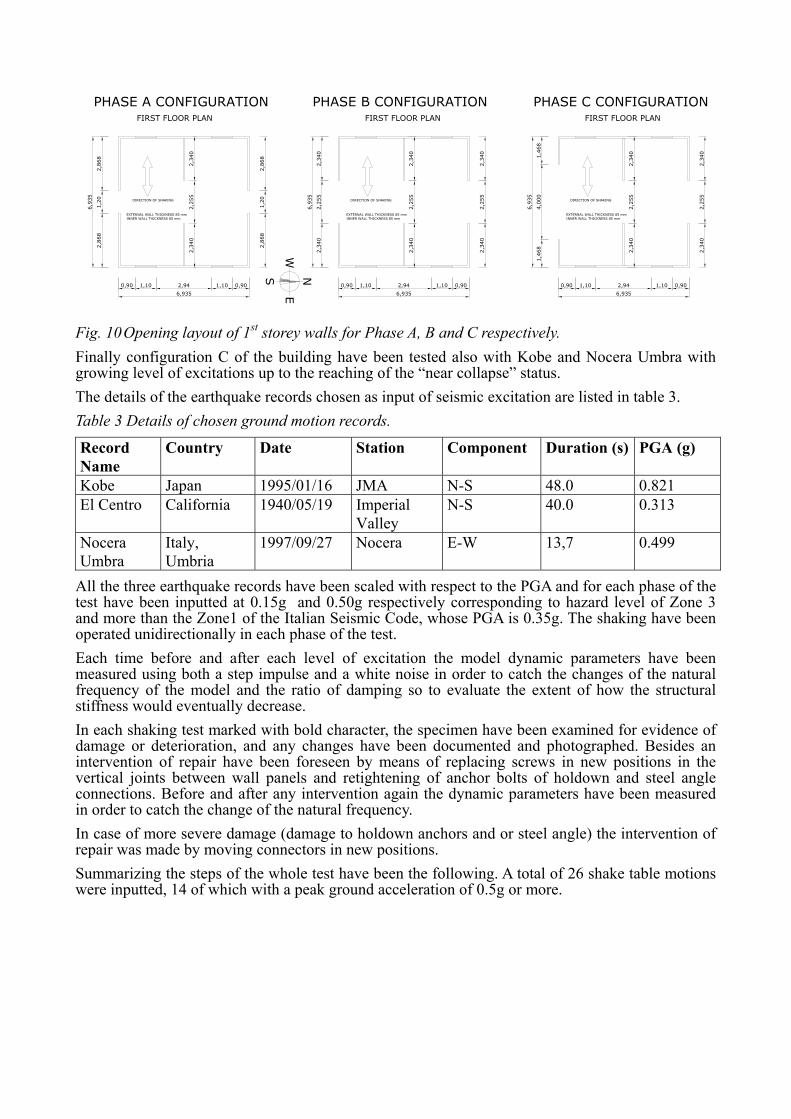
1st floor the two external wall perpendicular to the shaking direction (N-S direction) had again two 1.1x1.2m openings each, while the two external walls parallel to the shaking direction (E-W direction) had each one a door opening whose width was varying in the three subsequent phases of the test (see Fig. 4) from 1.2m to 4.0m.
Fig. 4 Three different configurations in which the building have been tested. While Configuration A and B are symmetric (the door opening widths in the two external walls parallel to the shaking direction were respectively 1.2 and 2.4m), Configuration C is asymmetric as the width of the openings in the two external walls parallel to the shaking direction were 2.4 and 4.0m.
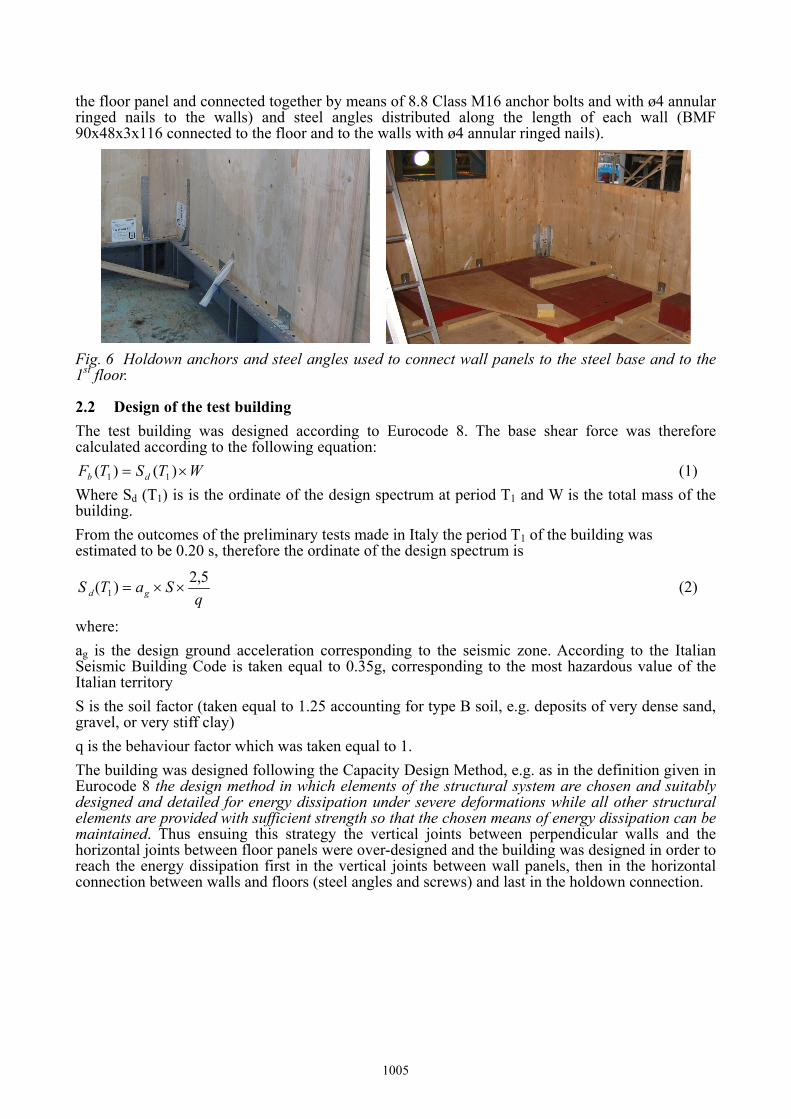
Fig. 5 Vertical joint between wall panels and horizontal joint between floor panels and self-drilling screws used to connect panels.
For transportation reasons each floor and wall panel had not to be wider than 2.30m. Therefore each wall is constituted of 3 panels connected together with a vertical joint made with LVL stripes and ø8x80 self-drilling screws. Also the floor panels had the same limitations and were connected together with overlapping joints made with ø10x180 self-drilling screws. The choice of making vertical screwed joints between wall panels was not only taken for transportation reasons but was also a defined design issue in order to achieve the desired level of ductility of the entire system.
The same screws were used in the vertical joints between perpendicular walls and to connect floor panels to the walls below as showed in Fig. 5. The connection to the steel base was made by means of commercial type holdown anchors (Simpson StrongTie HTT22 connected to the basement by means of 8.8 Class M16 anchor bolts and with ø4 annular ringed nails to the walls) placed at wall endings and at door openings and steel angles (BMF 90x48x3x116 connected to the basement by means of 8.8 Class M12 anchor bolts and with ø4 annular ringed nails to the walls) distributed along the length of each wall. The inter-storey connection between walls and floor was made again with holdown anchors at corners (Simpson StrongTie HTT16, two of them placed above and below
1005
the floor panel and connected together by means of 8.8 Class M16 anchor bolts and with ø4 annular ringed nails to the walls) and steel angles distributed along the length of each wall (BMF 90x48x3x116 connected to the floor and to the walls with ø4 annular ringed nails).
Fig. 6 Holdown anchors and steel angles used to connect wall panels to the steel base and to the 1st floor.
2.2 Design of the test building The test building was designed according to Eurocode 8. The base shear force was therefore calculated according to the following equation:
WTSTF db ×= )()( 11 (1) Where Sd (T1) is is the ordinate of the design spectrum at period T1 and W is the total mass of the building. From the outcomes of the preliminary tests made in Italy the period T1 of the building was estimated to be 0.20 s, therefore the ordinate of the design spectrum is
qSaTS gd
5,2)( 1 ××= (2)
where: ag is the design ground acceleration corresponding to the seismic zone. According to the Italian Seismic Building Code is taken equal to 0.35g, corresponding to the most hazardous value of the Italian territory S is the soil factor (taken equal to 1.25 accounting for type B soil, e.g. deposits of very dense sand, gravel, or very stiff clay) q is the behaviour factor which was taken equal to 1. The building was designed following the Capacity Design Method, e.g. as in the definition given in Eurocode 8 the design method in which elements of the structural system are chosen and suitably designed and detailed for energy dissipation under severe deformations while all other structural elements are provided with sufficient strength so that the chosen means of energy dissipation can be maintained. Thus ensuing this strategy the vertical joints between perpendicular walls and the horizontal joints between floor panels were over-designed and the building was designed in order to reach the energy dissipation first in the vertical joints between wall panels, then in the horizontal connection between walls and floors (steel angles and screws) and last in the holdown connection.
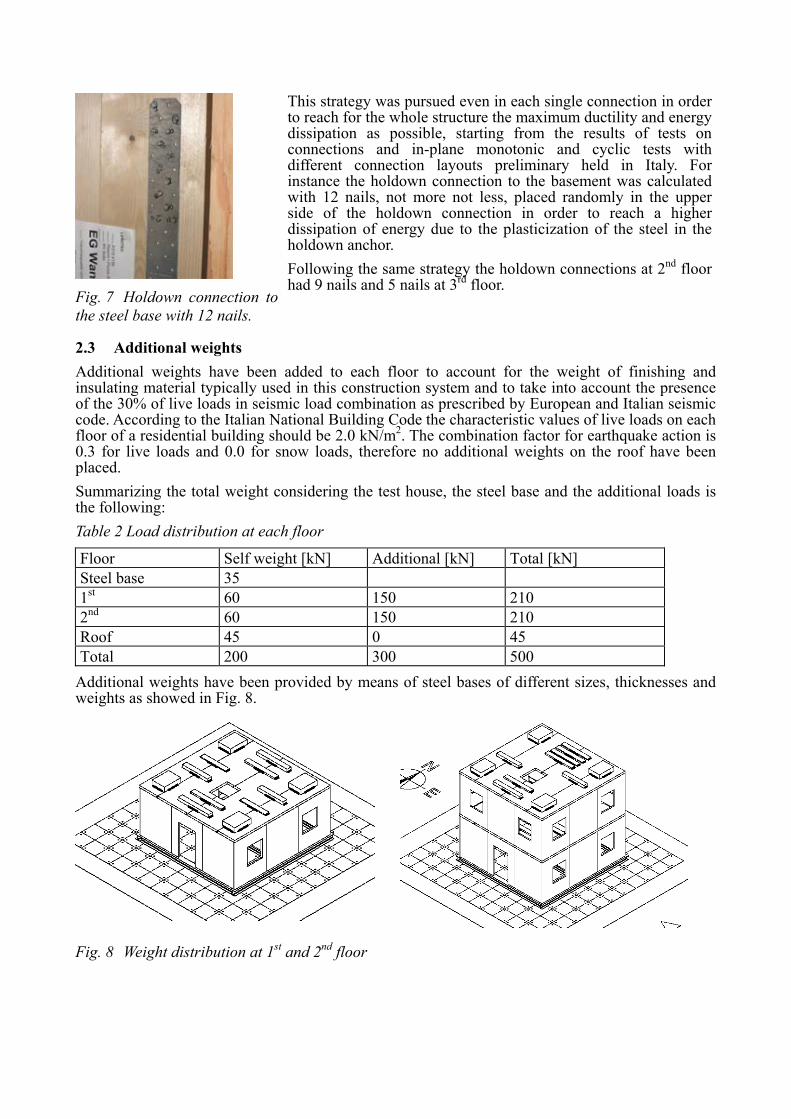
Fig. 7 Holdown connection to the steel base with 12 nails.
This strategy was pursued even in each single connection in order to reach for the whole structure the maximum ductility and energy dissipation as possible, starting from the results of tests on connections and in-plane monotonic and cyclic tests with different connection layouts preliminary held in Italy. For instance the holdown connection to the basement was calculated with 12 nails, not more not less, placed randomly in the upper side of the holdown connection in order to reach a higher dissipation of energy due to the plasticization of the steel in the holdown anchor. Following the same strategy the holdown connections at 2nd floor had 9 nails and 5 nails at 3rd floor.
2.3 Additional weights Additional weights have been added to each floor to account for the weight of finishing and insulating material typically used in this construction system and to take into account the presence of the 30% of live loads in seismic load combination as prescribed by European and Italian seismic code. According to the Italian National Building Code the characteristic values of live loads on each floor of a residential building should be 2.0 kN/m2. The combination factor for earthquake action is 0.3 for live loads and 0.0 for snow loads, therefore no additional weights on the roof have been placed. Summarizing the total weight considering the test house, the steel base and the additional loads is the following: Table 2 Load distribution at each floor
Floor Self weight [kN] Additional [kN] Total [kN] Steel base 35 1st 60 150 210 2nd 60 150 210 Roof 45 0 45 Total 200 300 500
Additional weights have been provided by means of steel bases of different sizes, thicknesses and weights as showed in Fig. 8.
Fig. 8 Weight distribution at 1st and 2nd floor
1007
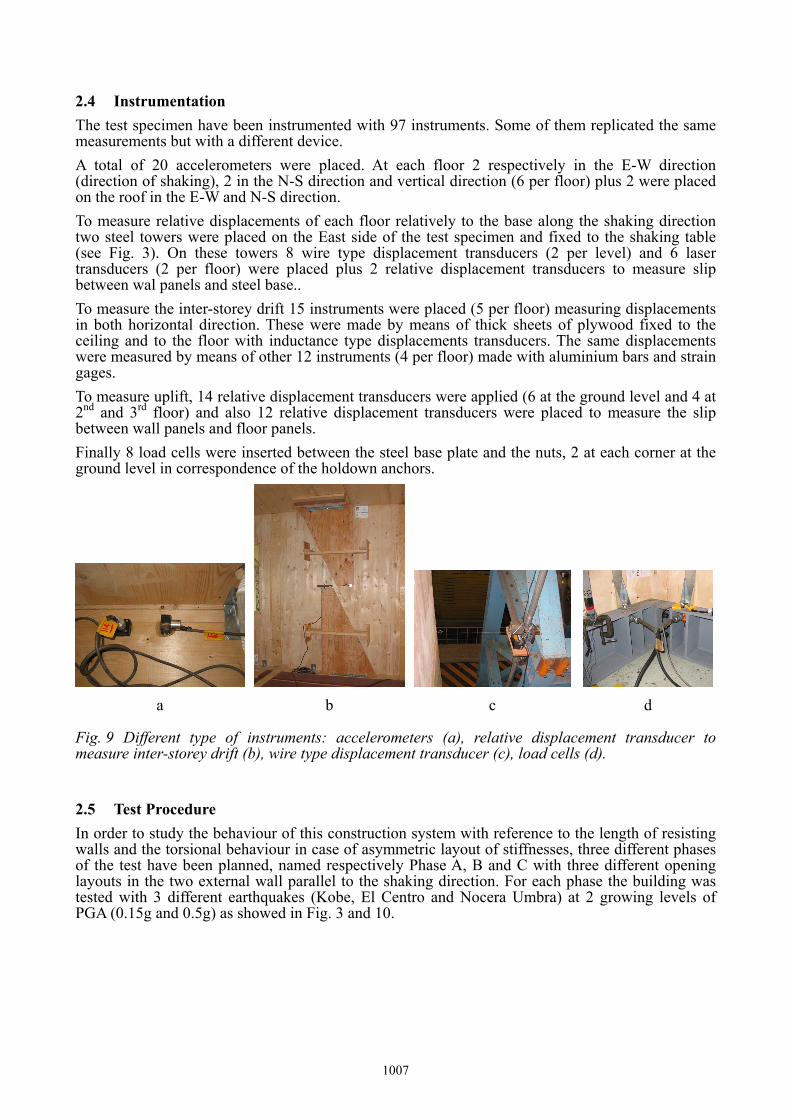
2.4 Instrumentation The test specimen have been instrumented with 97 instruments. Some of them replicated the same measurements but with a different device. A total of 20 accelerometers were placed. At each floor 2 respectively in the E-W direction (direction of shaking), 2 in the N-S direction and vertical direction (6 per floor) plus 2 were placed on the roof in the E-W and N-S direction. To measure relative displacements of each floor relatively to the base along the shaking direction two steel towers were placed on the East side of the test specimen and fixed to the shaking table (see Fig. 3). On these towers 8 wire type displacement transducers (2 per level) and 6 laser transducers (2 per floor) were placed plus 2 relative displacement transducers to measure slip between wal panels and steel base.. To measure the inter-storey drift 15 instruments were placed (5 per floor) measuring displacements in both horizontal direction. These were made by means of thick sheets of plywood fixed to the ceiling and to the floor with inductance type displacements transducers. The same displacements were measured by means of other 12 instruments (4 per floor) made with aluminium bars and strain gages. To measure uplift, 14 relative displacement transducers were applied (6 at the ground level and 4 at 2nd and 3rd floor) and also 12 relative displacement transducers were placed to measure the slip between wall panels and floor panels. Finally 8 load cells were inserted between the steel base plate and the nuts, 2 at each corner at the ground level in correspondence of the holdown anchors.
a b
c d
Fig. 9 Different type of instruments: accelerometers (a), relative displacement transducer to measure inter-storey drift (b), wire type displacement transducer (c), load cells (d).
2.5 Test Procedure In order to study the behaviour of this construction system with reference to the length of resisting walls and the torsional behaviour in case of asymmetric layout of stiffnesses, three different phases of the test have been planned, named respectively Phase A, B and C with three different opening layouts in the two external wall parallel to the shaking direction. For each phase the building was tested with 3 different earthquakes (Kobe, El Centro and Nocera Umbra) at 2 growing levels of PGA (0.15g and 0.5g) as showed in Fig. 3 and 10.
W
NS
E
PHASE B CONFIGURATIONFIRST FLOOR PLAN
2,94
EXTERNAL WALL THICKNESS 85 mmINNER WALL THICKNESS 85 mm
DIRECTION OF SHAKING
6,935
2,3
40
6,9
35
0,90 1,10
2,3
40
2,2
55
2,3
40
2,3
40
0,901,10
2,3
40
2,2
55
2,3
40
2,2
55
PHASE C CONFIGURATION
6,935
DIRECTION OF SHAKING
EXTERNAL WALL THICKNESS 85 mmINNER WALL THICKNESS 85 mm
2,94
FIRST FLOOR PLAN
4,0
00
6,9
35
1,4
68
1,100,90
1,4
68
2,2
55
2,2
55
2,3
40
2,3
40
0,901,10
2,3
40
2,3
40
6,935
6,9
35
2,8
68
1,2
02,8
68
2,8
68
1,2
02,8
68
2,2
55
FIRST FLOOR PLAN
PHASE A CONFIGURATION
2,3
40
2,3
40
DIRECTION OF SHAKING
0,90 0,902,941,10 1,10
EXTERNAL WALL THICKNESS 85 mmINNER WALL THICKNESS 85 mm
Fig. 10 Opening layout of 1st storey walls for Phase A, B and C respectively. Finally configuration C of the building have been tested also with Kobe and Nocera Umbra with growing level of excitations up to the reaching of the “near collapse” status. The details of the earthquake records chosen as input of seismic excitation are listed in table 3. Table 3 Details of chosen ground motion records.
Record Name
Country Date Station Component Duration (s) PGA (g)
Kobe Japan 1995/01/16 JMA N-S 48.0 0.821 El Centro California 1940/05/19 Imperial
Valley N-S 40.0 0.313
Nocera Umbra
Italy, Umbria
1997/09/27 Nocera E-W 13,7 0.499
All the three earthquake records have been scaled with respect to the PGA and for each phase of the test have been inputted at 0.15g and 0.50g respectively corresponding to hazard level of Zone 3 and more than the Zone1 of the Italian Seismic Code, whose PGA is 0.35g. The shaking have been operated unidirectionally in each phase of the test. Each time before and after each level of excitation the model dynamic parameters have been measured using both a step impulse and a white noise in order to catch the changes of the natural frequency of the model and the ratio of damping so to evaluate the extent of how the structural stiffness would eventually decrease. In each shaking test marked with bold character, the specimen have been examined for evidence of damage or deterioration, and any changes have been documented and photographed. Besides an intervention of repair have been foreseen by means of replacing screws in new positions in the vertical joints between wall panels and retightening of anchor bolts of holdown and steel angle connections. Before and after any intervention again the dynamic parameters have been measured in order to catch the change of the natural frequency. In case of more severe damage (damage to holdown anchors and or steel angle) the intervention of repair was made by moving connectors in new positions. Summarizing the steps of the whole test have been the following. A total of 26 shake table motions were inputted, 14 of which with a peak ground acceleration of 0.5g or more.
1009
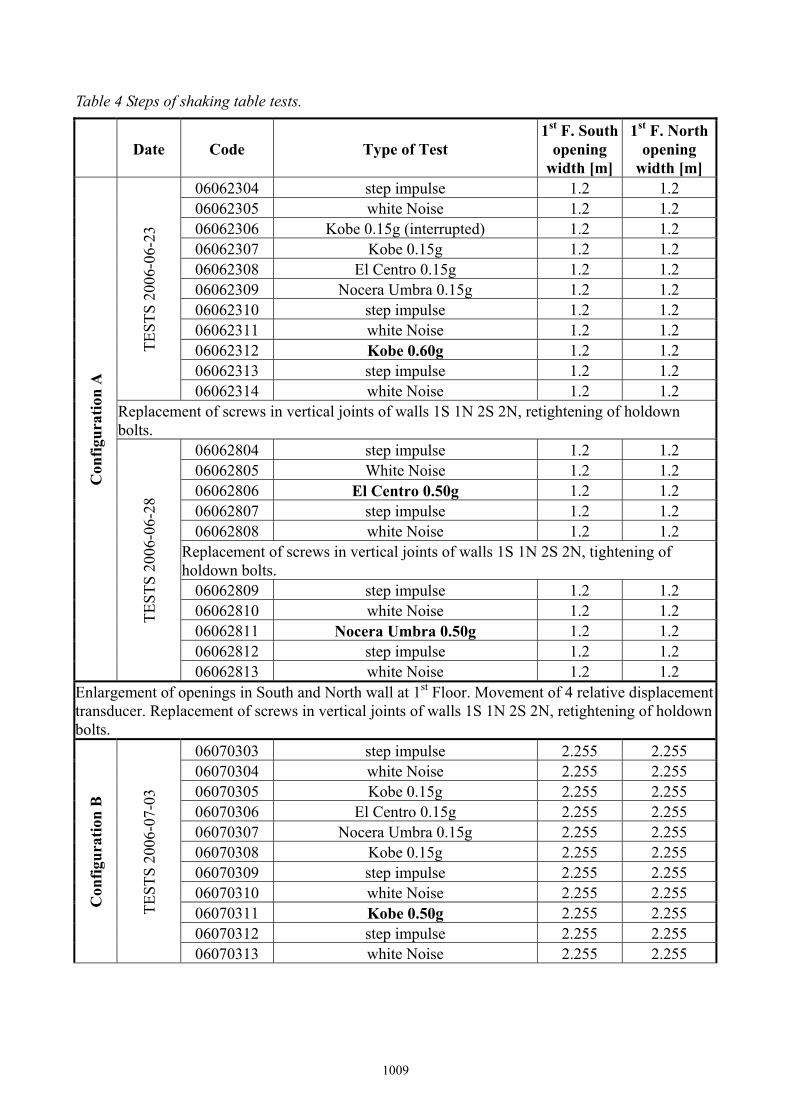
Table 4 Steps of shaking table tests.
Date Code Type of Test 1st F. South
opening width [m]
1st F. North opening
width [m] 06062304 step impulse 1.2 1.2 06062305 white Noise 1.2 1.2 06062306 Kobe 0.15g (interrupted) 1.2 1.2 06062307 Kobe 0.15g 1.2 1.2 06062308 El Centro 0.15g 1.2 1.2 06062309 Nocera Umbra 0.15g 1.2 1.2 06062310 step impulse 1.2 1.2 06062311 white Noise 1.2 1.2 06062312 Kobe 0.60g 1.2 1.2 06062313 step impulse 1.2 1.2
TEST
S 20
06-0
6-23
06062314 white Noise 1.2 1.2 Replacement of screws in vertical joints of walls 1S 1N 2S 2N, retightening of holdown bolts.
06062804 step impulse 1.2 1.2 06062805 White Noise 1.2 1.2 06062806 El Centro 0.50g 1.2 1.2 06062807 step impulse 1.2 1.2 06062808 white Noise 1.2 1.2
Replacement of screws in vertical joints of walls 1S 1N 2S 2N, tightening of holdown bolts.
06062809 step impulse 1.2 1.2 06062810 white Noise 1.2 1.2 06062811 Nocera Umbra 0.50g 1.2 1.2 06062812 step impulse 1.2 1.2
Con
figur
atio
n A
TEST
S 20
06-0
6-28
06062813 white Noise 1.2 1.2 Enlargement of openings in South and North wall at 1st Floor. Movement of 4 relative displacement transducer. Replacement of screws in vertical joints of walls 1S 1N 2S 2N, retightening of holdown bolts.
06070303 step impulse 2.255 2.255 06070304 white Noise 2.255 2.255 06070305 Kobe 0.15g 2.255 2.255 06070306 El Centro 0.15g 2.255 2.255 06070307 Nocera Umbra 0.15g 2.255 2.255 06070308 Kobe 0.15g 2.255 2.255 06070309 step impulse 2.255 2.255 06070310 white Noise 2.255 2.255 06070311 Kobe 0.50g 2.255 2.255 06070312 step impulse 2.255 2.255
Con
figur
atio
n B
TEST
S 20
06-0
7-03
06070313 white Noise 2.255 2.255
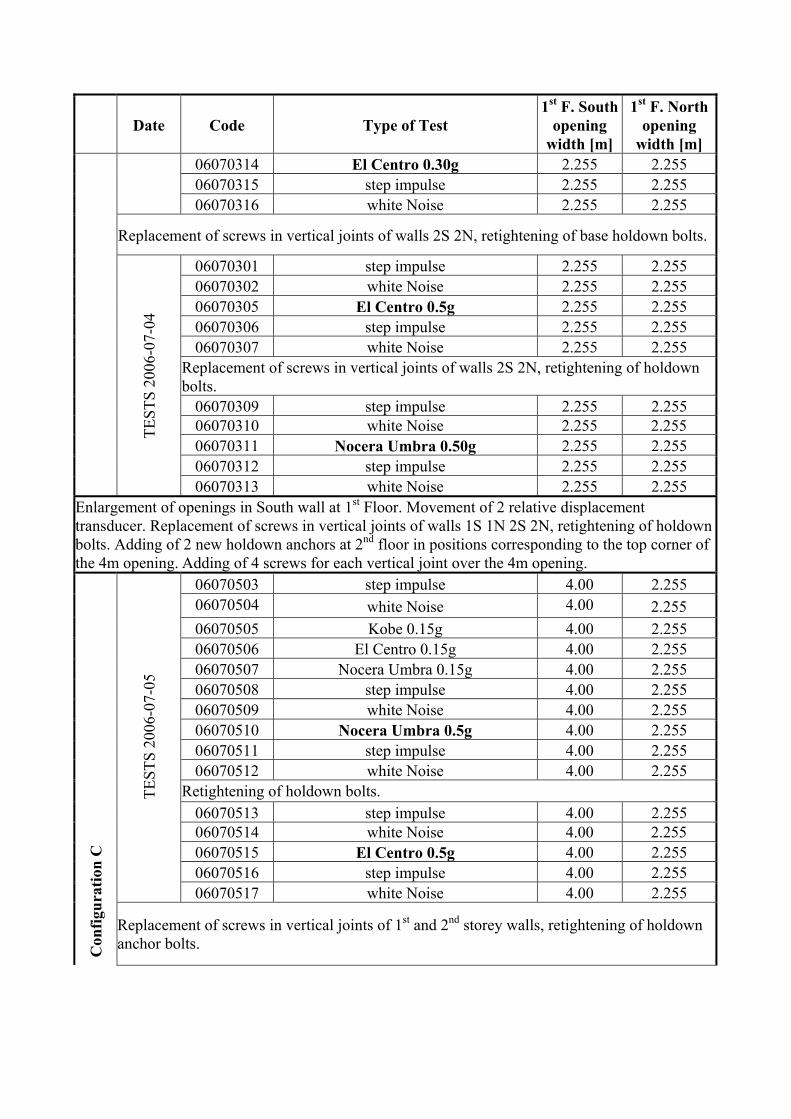
Date Code Type of Test 1st F. South
opening width [m]
1st F. North opening
width [m] 06070314 El Centro 0.30g 2.255 2.255 06070315 step impulse 2.255 2.255
06070316 white Noise 2.255 2.255
Replacement of screws in vertical joints of walls 2S 2N, retightening of base holdown bolts.
06070301 step impulse 2.255 2.255 06070302 white Noise 2.255 2.255 06070305 El Centro 0.5g 2.255 2.255 06070306 step impulse 2.255 2.255 06070307 white Noise 2.255 2.255
Replacement of screws in vertical joints of walls 2S 2N, retightening of holdown bolts.
06070309 step impulse 2.255 2.255 06070310 white Noise 2.255 2.255 06070311 Nocera Umbra 0.50g 2.255 2.255 06070312 step impulse 2.255 2.255
TE
STS
2006
-07-
04
06070313 white Noise 2.255 2.255 Enlargement of openings in South wall at 1st Floor. Movement of 2 relative displacement transducer. Replacement of screws in vertical joints of walls 1S 1N 2S 2N, retightening of holdown bolts. Adding of 2 new holdown anchors at 2nd floor in positions corresponding to the top corner of the 4m opening. Adding of 4 screws for each vertical joint over the 4m opening.
06070503 step impulse 4.00 2.255 06070504 white Noise 4.00 2.255 06070505 Kobe 0.15g 4.00 2.255 06070506 El Centro 0.15g 4.00 2.255 06070507 Nocera Umbra 0.15g 4.00 2.255 06070508 step impulse 4.00 2.255 06070509 white Noise 4.00 2.255 06070510 Nocera Umbra 0.5g 4.00 2.255 06070511 step impulse 4.00 2.255 06070512 white Noise 4.00 2.255
Retightening of holdown bolts. 06070513 step impulse 4.00 2.255 06070514 white Noise 4.00 2.255 06070515 El Centro 0.5g 4.00 2.255 06070516 step impulse 4.00 2.255
TES
TS 2
006-
07-0
5
06070517 white Noise 4.00 2.255
Con
figur
atio
n C
Replacement of screws in vertical joints of 1st and 2nd storey walls, retightening of holdown anchor bolts.
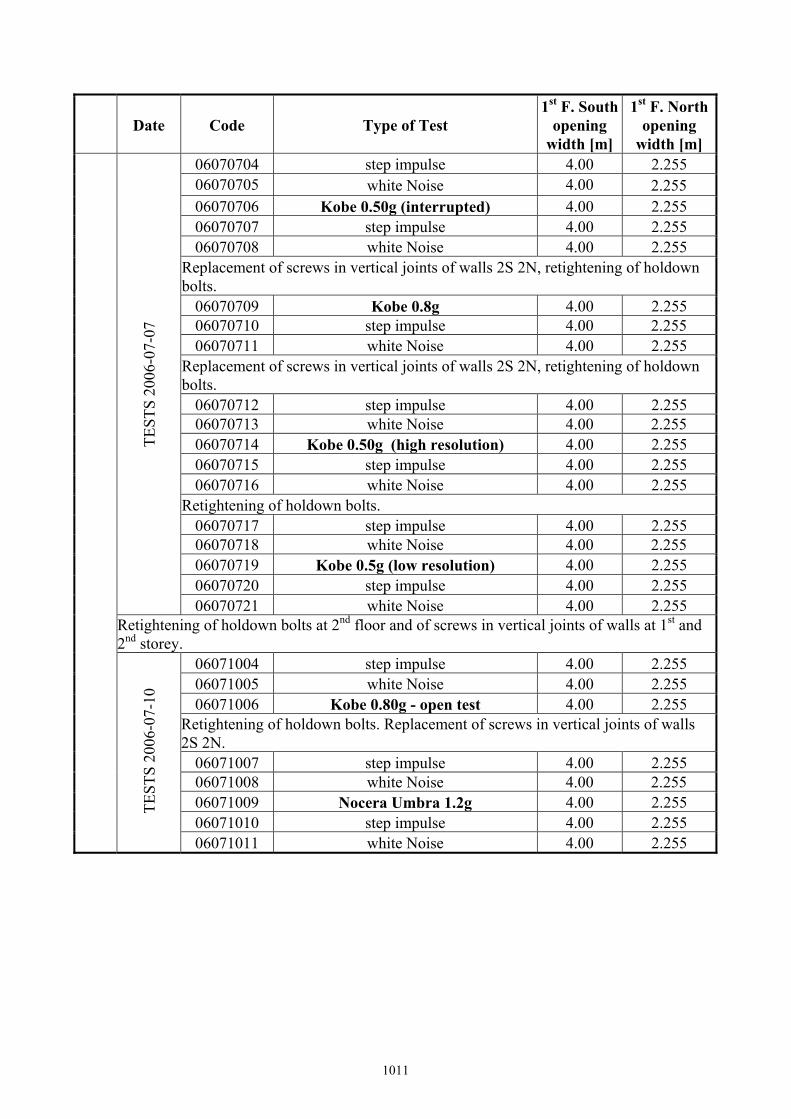
1011
Date Code Type of Test 1st F. South
opening width [m]
1st F. North opening
width [m] 06070704 step impulse 4.00 2.255 06070705 white Noise 4.00 2.255 06070706 Kobe 0.50g (interrupted) 4.00 2.255 06070707 step impulse 4.00 2.255 06070708 white Noise 4.00 2.255
Replacement of screws in vertical joints of walls 2S 2N, retightening of holdown bolts.
06070709 Kobe 0.8g 4.00 2.255 06070710 step impulse 4.00 2.255 06070711 white Noise 4.00 2.255
Replacement of screws in vertical joints of walls 2S 2N, retightening of holdown bolts.
06070712 step impulse 4.00 2.255 06070713 white Noise 4.00 2.255 06070714 Kobe 0.50g (high resolution) 4.00 2.255 06070715 step impulse 4.00 2.255 06070716 white Noise 4.00 2.255
Retightening of holdown bolts. 06070717 step impulse 4.00 2.255 06070718 white Noise 4.00 2.255 06070719 Kobe 0.5g (low resolution) 4.00 2.255 06070720 step impulse 4.00 2.255
TEST
S 20
06-0
7-07
06070721 white Noise 4.00 2.255 Retightening of holdown bolts at 2nd floor and of screws in vertical joints of walls at 1st and 2nd storey.
06071004 step impulse 4.00 2.255 06071005 white Noise 4.00 2.255 06071006 Kobe 0.80g - open test 4.00 2.255
Retightening of holdown bolts. Replacement of screws in vertical joints of walls 2S 2N.
06071007 step impulse 4.00 2.255 06071008 white Noise 4.00 2.255 06071009 Nocera Umbra 1.2g 4.00 2.255 06071010 step impulse 4.00 2.255
T
ESTS
200
6-07
-10
06071011 white Noise 4.00 2.255
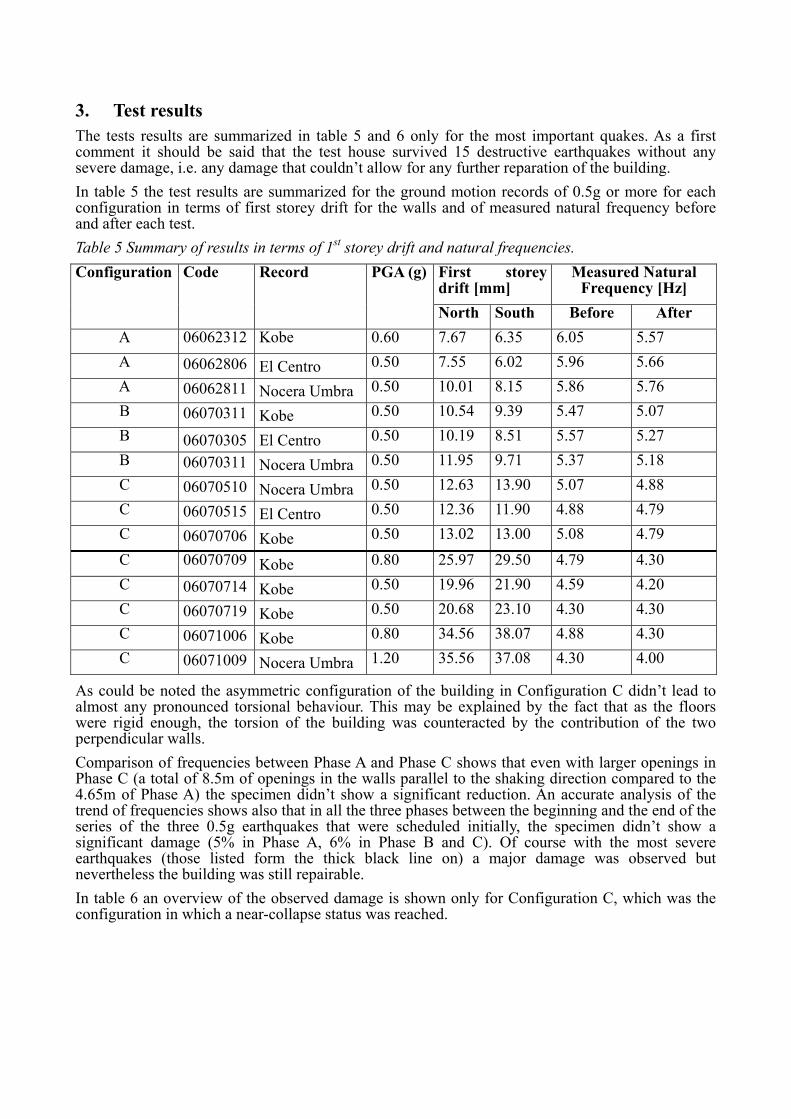
3. Test results The tests results are summarized in table 5 and 6 only for the most important quakes. As a first comment it should be said that the test house survived 15 destructive earthquakes without any severe damage, i.e. any damage that couldn’t allow for any further reparation of the building. In table 5 the test results are summarized for the ground motion records of 0.5g or more for each configuration in terms of first storey drift for the walls and of measured natural frequency before and after each test. Table 5 Summary of results in terms of 1st storey drift and natural frequencies.
First storey drift [mm]
Measured Natural Frequency [Hz]
Configuration Code Record PGA (g)
North South Before After A 06062312 Kobe 0.60 7.67 6.35 6.05 5.57 A 06062806 El Centro 0.50 7.55 6.02 5.96 5.66 A 06062811 Nocera Umbra 0.50 10.01 8.15 5.86 5.76 B 06070311 Kobe 0.50 10.54 9.39 5.47 5.07 B 06070305 El Centro 0.50 10.19 8.51 5.57 5.27 B 06070311 Nocera Umbra 0.50 11.95 9.71 5.37 5.18 C 06070510 Nocera Umbra 0.50 12.63 13.90 5.07 4.88 C 06070515 El Centro 0.50 12.36 11.90 4.88 4.79 C 06070706 Kobe 0.50 13.02 13.00 5.08 4.79 C 06070709 Kobe 0.80 25.97 29.50 4.79 4.30 C 06070714 Kobe 0.50 19.96 21.90 4.59 4.20 C 06070719 Kobe 0.50 20.68 23.10 4.30 4.30 C 06071006 Kobe 0.80 34.56 38.07 4.88 4.30 C 06071009 Nocera Umbra 1.20 35.56 37.08 4.30 4.00
As could be noted the asymmetric configuration of the building in Configuration C didn’t lead to almost any pronounced torsional behaviour. This may be explained by the fact that as the floors were rigid enough, the torsion of the building was counteracted by the contribution of the two perpendicular walls. Comparison of frequencies between Phase A and Phase C shows that even with larger openings in Phase C (a total of 8.5m of openings in the walls parallel to the shaking direction compared to the 4.65m of Phase A) the specimen didn’t show a significant reduction. An accurate analysis of the trend of frequencies shows also that in all the three phases between the beginning and the end of the series of the three 0.5g earthquakes that were scheduled initially, the specimen didn’t show a significant damage (5% in Phase A, 6% in Phase B and C). Of course with the most severe earthquakes (those listed form the thick black line on) a major damage was observed but nevertheless the building was still repairable. In table 6 an overview of the observed damage is shown only for Configuration C, which was the configuration in which a near-collapse status was reached.

1013
Table 6 Results of shaking table tests for Configuration C in terms of observed damage.
Record Code PGA [g]
Restoring intervention (before the test) Observed damage (after the test)
Nocera Umbra
06070510 0.50 Tightening of holdown anchor bolts Replacing of screws in vertical joints between panel
None
El Centro 06070515 0.50 Tightening of holdown anchor bolts. None Kobe 06070714 0.50 Tightening of holdown anchor bolts
Replacing of screws in vertical joints between panel
None
Kobe 06070709 0.80 Idem Slight deformation of screws in vertical joints between panels
Kobe 06070714 0.50 Idem None Kobe 06070719 0.50 Tightening of holdown anchor bolts None
Kobe 06071006 0.80 Replacing of holdown anchors and tightening of bolts. Replacing of screws in vertical joints between panel
Slight deformation of screws in vertical joints between panels
Nocera Umbra
06071009 1.20 Tightening of holdown anchor bolts. Replacing of screws in vertical joints between panel
Holdown failure and deformation of screws in vertical joints between panels
The definition of a collapse criterion (the failure of one ore more holdown anchors) could allow the calculation of the q-value at least for one earthquake using the following strategy:
• Design the structure using q=1 according to the seismic code for a given design PGAu,code (0,35g which is the design ground acceleration corresponding to the more hazardous seismic zone of Italy)
• Define, as above mentioned, as “near-collapse” criterion the failure in holdown anchors (one or more);
• Analyze the test results and calculate q as the ratio between the PGAu,eff value that caused the “actual” near-collapse of the building and the design value of the PGAu,code.
3.1 Evaluation of the q-value for Nocera Umbra earthquake
3.1.1 Design of holdown anchors at ground level To resist the shear forces steel angles have been used and calculated. To resist the uplifting forces holdowns anchors have been used and calculated. The holdown anchors used to connect the building at ground floor were, as before mentioned, SIMPSON STRONG-TIE holdown anchors HTT22, connected to the basement by means of 8.8 Class M16 anchor bolts and with 12 ø4 annular ringed nails to the cross-laminated walls. The distribution of holdown anchors at the ground floor and of the seismic forces at each floor is showed in Fig. 11.

Fig. 11 Distribution of holdown anchors and steel angles at ground floor and distribution of seismic forces at each floor. In the left side picture the holdown anchors marked with H are those taken into account in the design. Following the procedure described in 2.2 the calculated seismic forces are the following: Fr = 91 kN F2 = 279 kN F1 = 139 kN The heights of the 1st floor, 2nd floor and roof are respectively 3.09, 6.18 and 9.40m Considering only the design of the holdown anchors at the ground floor and taking into account also the contribution of the holdowns in the walls perpendicular to the shaking direction the calculation gives the following results (moment equilibrium around the A line and neglecting the contribution of holdown at openings):
093,65293,6
1122 =××−×−×+×+× HWhFhFhF rr (3)
093,65293,646509,313918,627940,991 =××−×−×+×+× H H =40,34 kN (4)
From the results of the experimental tests on the steel to timber connections using annular ringed nails, each nail has an ultimate shear resistance of 4 kN, which is taken as the 5-percentile value of strength. Therefore, according to Eurocode 5 and 8, the strength design value of each nail is:
kNkR
RM
kd 38,3
3,11,14mod =
×=
×=
γ (5)
Hence to resist the uplift force each holdown anchor shall be connected using 12 nails. Hr = 12x3,38 = 40,56 kN > H = 40,34 kN (6) Note that the design tensile strength of the Class 8.8 φ16 anchoring bolt, considering the effective cross section is:
1015
kNfA
NM
yresr 35,91
1,11000640157
=×
×=
×=
γ which is greater than Hr (7)
3.1.2 Evaluation of the q-value Being the design ground acceleration PGAu,code equal to 0,35g, by applying the procedure given in 2.2, the q value is:
4,335,020,1
==q (8)
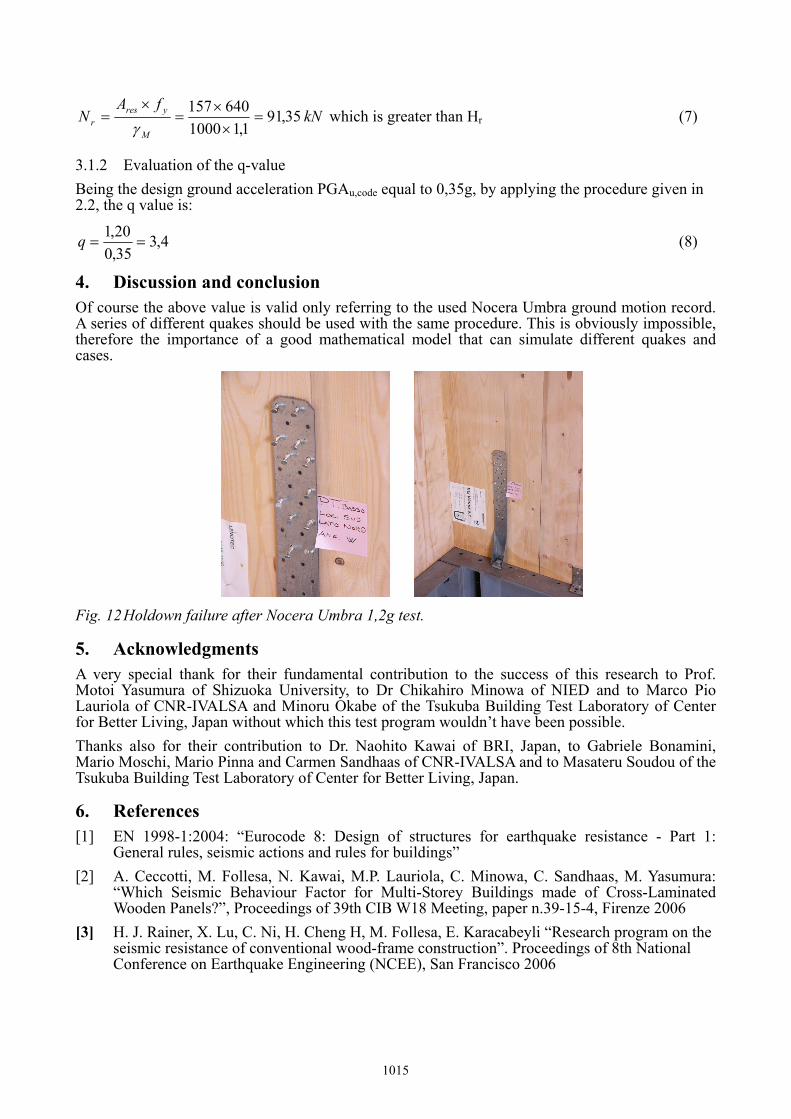
4. Discussion and conclusion Of course the above value is valid only referring to the used Nocera Umbra ground motion record. A series of different quakes should be used with the same procedure. This is obviously impossible, therefore the importance of a good mathematical model that can simulate different quakes and cases.
Fig. 12 Holdown failure after Nocera Umbra 1,2g test.
5. Acknowledgments A very special thank for their fundamental contribution to the success of this research to Prof. Motoi Yasumura of Shizuoka University, to Dr Chikahiro Minowa of NIED and to Marco Pio Lauriola of CNR-IVALSA and Minoru Okabe of the Tsukuba Building Test Laboratory of Center for Better Living, Japan without which this test program wouldn’t have been possible. Thanks also for their contribution to Dr. Naohito Kawai of BRI, Japan, to Gabriele Bonamini, Mario Moschi, Mario Pinna and Carmen Sandhaas of CNR-IVALSA and to Masateru Soudou of the Tsukuba Building Test Laboratory of Center for Better Living, Japan.
6. References [1] EN 1998-1:2004: “Eurocode 8: Design of structures for earthquake resistance - Part 1:
General rules, seismic actions and rules for buildings” [2] A. Ceccotti, M. Follesa, N. Kawai, M.P. Lauriola, C. Minowa, C. Sandhaas, M. Yasumura:
“Which Seismic Behaviour Factor for Multi-Storey Buildings made of Cross-Laminated Wooden Panels?”, Proceedings of 39th CIB W18 Meeting, paper n.39-15-4, Firenze 2006
[3] H. J. Rainer, X. Lu, C. Ni, H. Cheng H, M. Follesa, E. Karacabeyli “Research program on the seismic resistance of conventional wood-frame construction”. Proceedings of 8th National Conference on Earthquake Engineering (NCEE), San Francisco 2006