Embed Size (px)
Citation preview

Master Degree in Civil Engineering – IST – Lisbon, Portugal, 2007
INSTITUTO SUPERIOR TÉCNICO UNIVERSIDADE TÉCNICA DE LISBOA
Seismic Analysis of Reinforced Concrete Buildings according to Eurocode8 – Linear and Nonlinear Analyses
Carlos Augusto Fernandes Bhatt
Dissertation for the Master Degree in Civil Engineering
President: Professor Doutor José Câmara Adviser: Professora Doutora Rita Bento Grand Jury: Professor Doutor Carlos Sousa Oliveira
September 2007

Master Degree in Civil Engineering – IST – Lisbon, Portugal, 2007
1
Seismic Analysis of Reinforced Concrete Buildings according to Eurocode8 –
Linear and Nonlinear Analyses Carlos Augusto Fernandes Bhatt PhD student ICIST, IST, Lisbon, Portugal and Rose School, Pavia, Italy Abstract Catastrophes occurring due to strong earthquakes, throughout the several regions of the planet revealed the deficiencies of many constructions concerning its seismic resistance. In this study, design/building problems were addressed, pointing out the best solutions to reduce the buildings seismic vulnerability. Nowadays, seismic design of buildings in design offices is performed in the majority of the cases using linear dynamic analysis affecting the results obtained by a behaviour coefficient. In spite of the celerity of this process meet the extremely rigid project time demands which must be accomplished in this area of business, it is important to develop and improve methods that can better describe, for the particular situations, the real seismic behaviour of the structures. When the structure is submitted to a seismic action with enough intensity to cause significant damage, it stops working in a linear regime, being therefore essential the proper description of the nonlinear behaviour. In this work, besides the linear dynamic analysis, the nonlinear dynamic analysis and nonlinear static Pushover analysis were presented and applied to two reinforced concrete buildings. These later analyses allowed assessing and describing, in a more rigorous way than the linear analysis, the structures nonlinear behaviour when submitted to a seismic action. All the guidelines considered in this work were taken from the Eurocode 8, Seismic European Code that soon will be applicable in the national territory. 1. Introduction The purpose of this paper is to explore the Eurocode 8, in terms of seismic design and assessment of buildings, and to deepen the study on nonlinear static and on nonlinear dynamic analyses. Firstly are presented some guidelines for the earthquake-resistant design of buildings. Subsequently, a building pre-analysed in the course Building Structures and Modelling and Structural Analysis from the Civil Engineering Degree from the Instituto Superior Técnico, was design and assessed. Linear dynamic analysis and nonlinear static Pushover analysis were applied in the current case-study, using SAP2000. Finally, the SPEAR building, a 3-floor reinforced concrete building, was analysed using Pushover analyses and nonlinear dynamic analyses with the help of SeismoStruct software. 2. Seismic Design of Structures In Seismic regions it is critical that the Structures Project of reinforced concrete must follow careful steps. Usual mistakes, like bad conceptual design, wrong construction practices and wrong detailing, can produce highly malicious consequences to the structures and to human life. Like D.J. Dowrick said in 1977: “… a seism will mercilessly look for every irregularity and structural weakness, whether it was or not previously known…”. A building seismic response depends on external conditions and internal conditions. As external conditions it is possible to mention the relationship of a building to the adjacent ones and to the local topography. On the other hand, as internal conditions it should be mentioned those related with the building, like materials used, the adopted structural system, the link between elements, degrees of redundancy, uniformity in plan with convex sections, symmetry and rectangularity, continuity and regularity in elevation, and ductility. Once errors often occur in the conceptual design and construction in seismic zones, it is crucial to pay a special attention to the construction details in order to ensure the seismic resistance that was previously designed. Eurocode 8 presents basic principles in the seismic conceptual design concerning criteria of structural regularity in plan and in elevation.
Master Degree in Civil Engineering – IST – Lisbon, Portugal, 2007
2
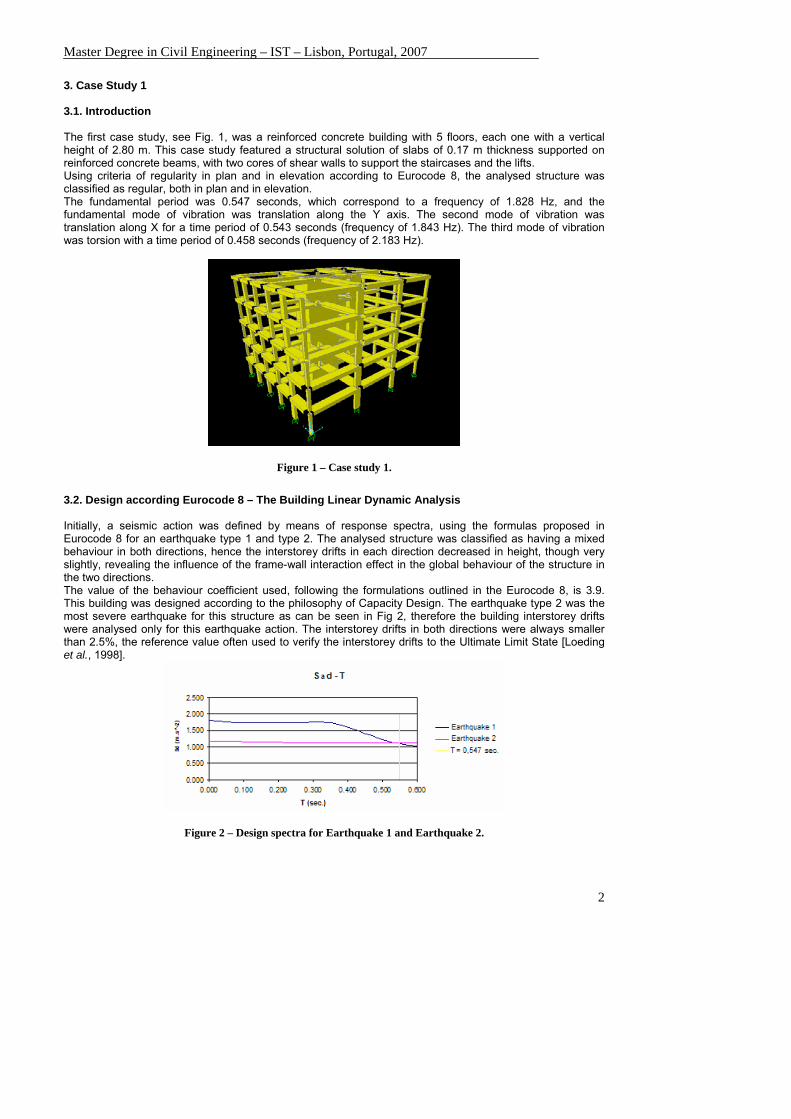
3. Case Study 1 3.1. Introduction The first case study, see Fig. 1, was a reinforced concrete building with 5 floors, each one with a vertical height of 2.80 m. This case study featured a structural solution of slabs of 0.17 m thickness supported on reinforced concrete beams, with two cores of shear walls to support the staircases and the lifts. Using criteria of regularity in plan and in elevation according to Eurocode 8, the analysed structure was classified as regular, both in plan and in elevation. The fundamental period was 0.547 seconds, which correspond to a frequency of 1.828 Hz, and the fundamental mode of vibration was translation along the Y axis. The second mode of vibration was translation along X for a time period of 0.543 seconds (frequency of 1.843 Hz). The third mode of vibration was torsion with a time period of 0.458 seconds (frequency of 2.183 Hz).
Figure 1 – Case study 1.
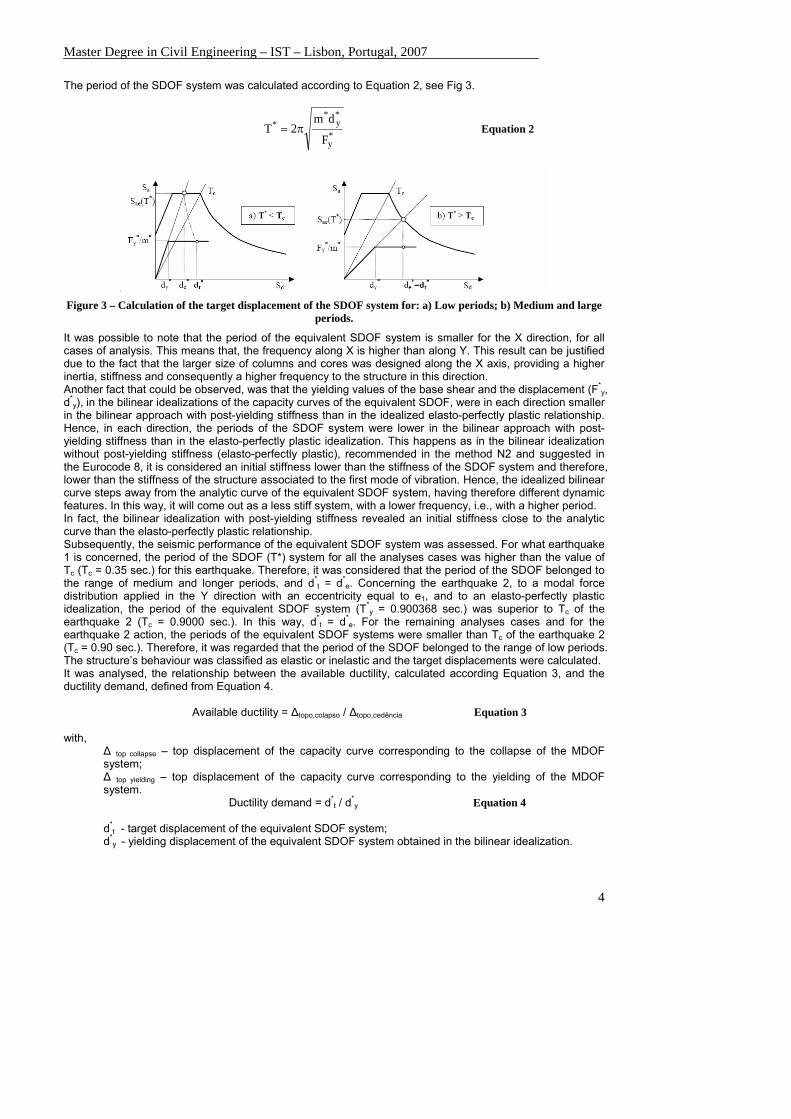
3.2. Design according Eurocode 8 – The Building Linear Dynamic Analysis Initially, a seismic action was defined by means of response spectra, using the formulas proposed in Eurocode 8 for an earthquake type 1 and type 2. The analysed structure was classified as having a mixed behaviour in both directions, hence the interstorey drifts in each direction decreased in height, though very slightly, revealing the influence of the frame-wall interaction effect in the global behaviour of the structure in the two directions. The value of the behaviour coefficient used, following the formulations outlined in the Eurocode 8, is 3.9. This building was designed according to the philosophy of Capacity Design. The earthquake type 2 was the most severe earthquake for this structure as can be seen in Fig 2, therefore the building interstorey drifts were analysed only for this earthquake action. The interstorey drifts in both directions were always smaller than 2.5%, the reference value often used to verify the interstorey drifts to the Ultimate Limit State [Loeding et al., 1998].
Figure 2 – Design spectra for Earthquake 1 and Earthquake 2.

Master Degree in Civil Engineering – IST – Lisbon, Portugal, 2007
3
3.3. The seismic performance assessment of the analysed building – Pushover Analysis The nonlinear static analysis proposed in EC8 [CEN, 2003] is based on the N2 method [Bhatt, C., 2005] and is described in Annex B of the code. It is important to highlight that, in this type of analysis, average values of the material properties are used. To define the resistant capacity curve of the structure it was gradually applied a distribution of modal lateral forces and a distribution of uniform lateral forces. These distributions were applied firstly, according to Y and subsequently according to X direction. The forces were applied in each floor, i.e., in its centre of mass affected by the eccentricity defined in Equation 1. This eccentricity intended to account for uncertainties in the location of masses and in the spatial variation of the seismic motion.
ei = ± 0.05 x li Equation 1 ei – is the accidental eccentricity of storey mass i from its nominal location, applied in the same direction at all floors and perpendicular to the direction of the seismic action; li – is the floor-dimension perpendicular to the direction of the seismic action. Comparing the capacity curves of the structure for the modal distribution, and for the uniform distribution and to the eccentricity e1, X direction and Y direction, and to the eccentricity e2, X direction and Y direction, (e1 = 0.05 x li and e2 = -0.05 x li) respectively, one can conclude that the uniform load distribution was the one that lead to an envelope resistant capacity curve. In fact, to the same value of the base shear the modal distribution of forces lead to a higher value of the top displacement. On the other hand one can assert that the uniform configuration lead to higher values of base shear for similar values of top displacement. In this way, one can conclude that the type of lateral distribution of forces influences the capacity curve hence the seismic assessment/design of the structure. Subsequently, the parameter αu / α1 were compared. Parameter α1 is the value by which the horizontal seismic design action is multiplied in order to first reach the flexural resistance in any member in the structure, while all other design actions remain constant. Parameter αu is the value by which the horizontal seismic design action is multiplied, in order to form plastic hinges in a number of sections sufficient for the development of overall structural instability, while all other design actions remain constant. The factor αu may be obtained from a nonlinear static Pushover global analysis. It was possible to conclude that the structure showed higher values αu / α1 in the X direction. The relationship αu / α1 reflect the over-resistance of the structure associated to its higher or lower redundancy. Hence one can say that the structure was more hyperstatic along the X direction than along the Y direction. The value of the relation αu / α1 used in the linear dynamic analysis for the definition of the behaviour coefficient was 1.30. It was noted that the values αu / α1 obtained in the Y direction to the eccentricity e1 (1.28) and to the eccentricity e2 (1.30) were very close to those used for the definition of the behaviour coefficient, needed in the linear dynamic response spectrum analysis. Consequently, in this direction the exploration of ductility was correctly estimated. The values of αu / α1 obtained in the X direction to the eccentricity e1 (1.99) and to the eccentricity e2 (1.99) were higher to those used in the linear dynamic analysis. Therefore, in this direction one could have further explored the ductility of the structure, as the structure has higher degree of hyperstatics in this direction. Moreover, the structure showed higher ductility along the X axis, as well as higher resistance. In fact, it was possible to note that the base shear values for which the structure collapses (αu) were higher in the X direction than in the Y direction. The larger size of columns and cores was designed along the X axis, providing higher inertia and stiffness to the structure in this direction. The resisting moments of columns and cores were also higher due to its longer arm, hence justifying the higher resistance of the structure along the X direction. Comparing the two types of force distributions, applied with the two eccentricities, it was possible to note that, the relation αu / α1 and the resistance in the two directions, were higher, as expected, for the uniform distribution than for the modal distribution. The next step was the calculation of the structure’s transforming factors Г. They allow move from a multi degree of freedom (MDOF) system to an equivalent one degree of freedom (SDOF) system, in both directions. In the Y direction the transforming factor took the value of 1.398, and in the X direction, the value 1.402 was defined. The base shear, F*, and the top displacement, d*, of the SDOF were obtained dividing the base shear, V, and the top displacement, Δtop, of the MDOF by the transforming factor Г. This procedure was followed for both directions studied (X and Y), hence the analytical capacity curves of the SDOF system were obtained for both directions. Subsequently, the bilinear idealization of the SDOF’s capacity curve was calculated. This step is very important in the seismic performance assessment of the analysed structure, since different idealizations can lead to very different structural responses. Two bilinear idealizations were defined: a bilinear approach with post-yielding stiffness and an idealized elasto-perfectly plastic relationship.
Master Degree in Civil Engineering – IST – Lisbon, Portugal, 2007
4
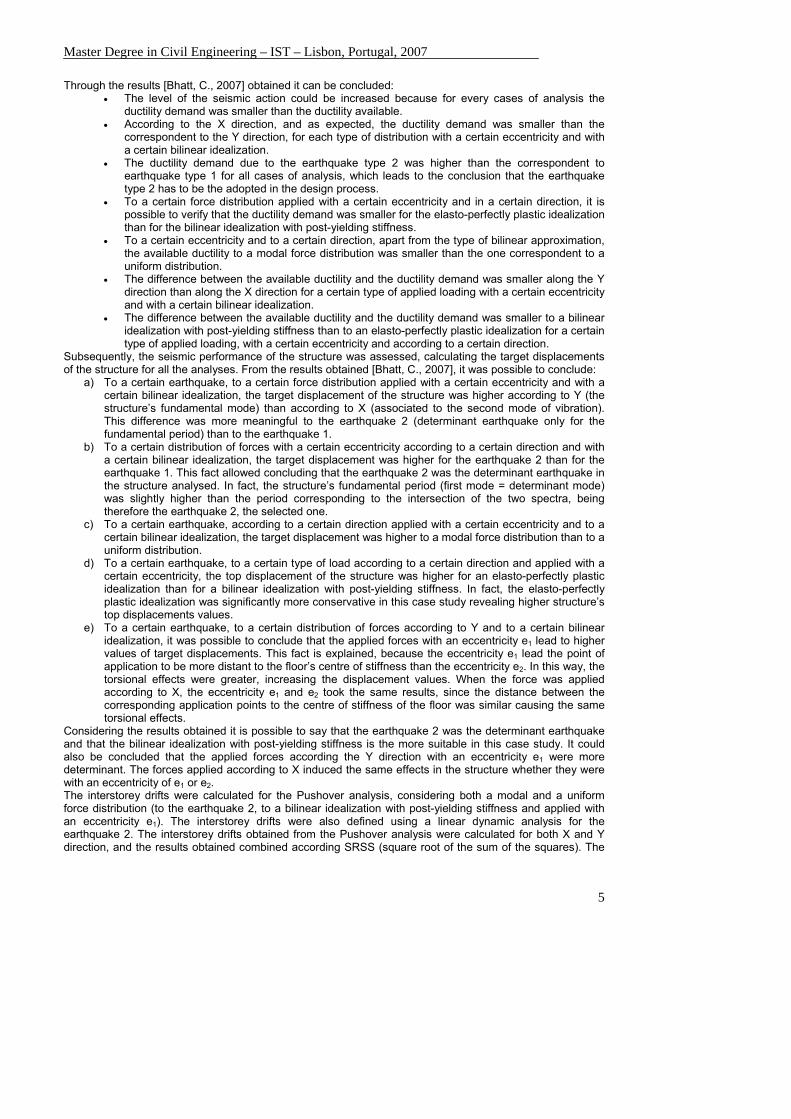
The period of the SDOF system was calculated according to Equation 2, see Fig 3.
*y
*y
**
F
dm2T π= Equation 2
Figure 3 – Calculation of the target displacement of the SDOF system for: a) Low periods; b) Medium and large
periods.
It was possible to note that the period of the equivalent SDOF system is smaller for the X direction, for all cases of analysis. This means that, the frequency along X is higher than along Y. This result can be justified due to the fact that the larger size of columns and cores was designed along the X axis, providing a higher inertia, stiffness and consequently a higher frequency to the structure in this direction. Another fact that could be observed, was that the yielding values of the base shear and the displacement (F*
y, d*
y), in the bilinear idealizations of the capacity curves of the equivalent SDOF, were in each direction smaller in the bilinear approach with post-yielding stiffness than in the idealized elasto-perfectly plastic relationship. Hence, in each direction, the periods of the SDOF system were lower in the bilinear approach with post-yielding stiffness than in the elasto-perfectly plastic idealization. This happens as in the bilinear idealization without post-yielding stiffness (elasto-perfectly plastic), recommended in the method N2 and suggested in the Eurocode 8, it is considered an initial stiffness lower than the stiffness of the SDOF system and therefore, lower than the stiffness of the structure associated to the first mode of vibration. Hence, the idealized bilinear curve steps away from the analytic curve of the equivalent SDOF system, having therefore different dynamic features. In this way, it will come out as a less stiff system, with a lower frequency, i.e., with a higher period. In fact, the bilinear idealization with post-yielding stiffness revealed an initial stiffness close to the analytic curve than the elasto-perfectly plastic relationship. Subsequently, the seismic performance of the equivalent SDOF system was assessed. For what earthquake 1 is concerned, the period of the SDOF (T*) system for all the analyses cases was higher than the value of Tc (Tc = 0.35 sec.) for this earthquake. Therefore, it was considered that the period of the SDOF belonged to the range of medium and longer periods, and d*
t = d*e. Concerning the earthquake 2, to a modal force
distribution applied in the Y direction with an eccentricity equal to e1, and to an elasto-perfectly plastic idealization, the period of the equivalent SDOF system (T*
y = 0.900368 sec.) was superior to Tc of the earthquake 2 (Tc = 0.9000 sec.). In this way, d*
t = d*e. For the remaining analyses cases and for the
earthquake 2 action, the periods of the equivalent SDOF systems were smaller than Tc of the earthquake 2 (Tc = 0.90 sec.). Therefore, it was regarded that the period of the SDOF belonged to the range of low periods. The structure’s behaviour was classified as elastic or inelastic and the target displacements were calculated. It was analysed, the relationship between the available ductility, calculated according Equation 3, and the ductility demand, defined from Equation 4.
Available ductility = Δtopo,colapso / Δtopo,cedência Equation 3
with,
Δ top collapse – top displacement of the capacity curve corresponding to the collapse of the MDOF system; Δ top yielding – top displacement of the capacity curve corresponding to the yielding of the MDOF system.
Ductility demand = d*t / d*
y Equation 4 d*
t - target displacement of the equivalent SDOF system; d*
y - yielding displacement of the equivalent SDOF system obtained in the bilinear idealization.
Master Degree in Civil Engineering – IST – Lisbon, Portugal, 2007
5
Through the results [Bhatt, C., 2007] obtained it can be concluded: • The level of the seismic action could be increased because for every cases of analysis the
ductility demand was smaller than the ductility available. • According to the X direction, and as expected, the ductility demand was smaller than the
correspondent to the Y direction, for each type of distribution with a certain eccentricity and with a certain bilinear idealization.
• The ductility demand due to the earthquake type 2 was higher than the correspondent to earthquake type 1 for all cases of analysis, which leads to the conclusion that the earthquake type 2 has to be the adopted in the design process.
• To a certain force distribution applied with a certain eccentricity and in a certain direction, it is possible to verify that the ductility demand was smaller for the elasto-perfectly plastic idealization than for the bilinear idealization with post-yielding stiffness.
• To a certain eccentricity and to a certain direction, apart from the type of bilinear approximation, the available ductility to a modal force distribution was smaller than the one correspondent to a uniform distribution.
• The difference between the available ductility and the ductility demand was smaller along the Y direction than along the X direction for a certain type of applied loading with a certain eccentricity and with a certain bilinear idealization.
• The difference between the available ductility and the ductility demand was smaller to a bilinear idealization with post-yielding stiffness than to an elasto-perfectly plastic idealization for a certain type of applied loading, with a certain eccentricity and according to a certain direction.
Subsequently, the seismic performance of the structure was assessed, calculating the target displacements of the structure for all the analyses. From the results obtained [Bhatt, C., 2007], it was possible to conclude:
a) To a certain earthquake, to a certain force distribution applied with a certain eccentricity and with a certain bilinear idealization, the target displacement of the structure was higher according to Y (the structure’s fundamental mode) than according to X (associated to the second mode of vibration). This difference was more meaningful to the earthquake 2 (determinant earthquake only for the fundamental period) than to the earthquake 1.
b) To a certain distribution of forces with a certain eccentricity according to a certain direction and with a certain bilinear idealization, the target displacement was higher for the earthquake 2 than for the earthquake 1. This fact allowed concluding that the earthquake 2 was the determinant earthquake in the structure analysed. In fact, the structure’s fundamental period (first mode = determinant mode) was slightly higher than the period corresponding to the intersection of the two spectra, being therefore the earthquake 2, the selected one.
c) To a certain earthquake, according to a certain direction applied with a certain eccentricity and to a certain bilinear idealization, the target displacement was higher to a modal force distribution than to a uniform distribution.
d) To a certain earthquake, to a certain type of load according to a certain direction and applied with a certain eccentricity, the top displacement of the structure was higher for an elasto-perfectly plastic idealization than for a bilinear idealization with post-yielding stiffness. In fact, the elasto-perfectly plastic idealization was significantly more conservative in this case study revealing higher structure’s top displacements values.
e) To a certain earthquake, to a certain distribution of forces according to Y and to a certain bilinear idealization, it was possible to conclude that the applied forces with an eccentricity e1 lead to higher values of target displacements. This fact is explained, because the eccentricity e1 lead the point of application to be more distant to the floor’s centre of stiffness than the eccentricity e2. In this way, the torsional effects were greater, increasing the displacement values. When the force was applied according to X, the eccentricity e1 and e2 took the same results, since the distance between the corresponding application points to the centre of stiffness of the floor was similar causing the same torsional effects.
Considering the results obtained it is possible to say that the earthquake 2 was the determinant earthquake and that the bilinear idealization with post-yielding stiffness is the more suitable in this case study. It could also be concluded that the applied forces according the Y direction with an eccentricity e1 were more determinant. The forces applied according to X induced the same effects in the structure whether they were with an eccentricity of e1 or e2. The interstorey drifts were calculated for the Pushover analysis, considering both a modal and a uniform force distribution (to the earthquake 2, to a bilinear idealization with post-yielding stiffness and applied with an eccentricity e1). The interstorey drifts were also defined using a linear dynamic analysis for the earthquake 2. The interstorey drifts obtained from the Pushover analysis were calculated for both X and Y direction, and the results obtained combined according SRSS (square root of the sum of the squares). The
Master Degree in Civil Engineering – IST – Lisbon, Portugal, 2007
6
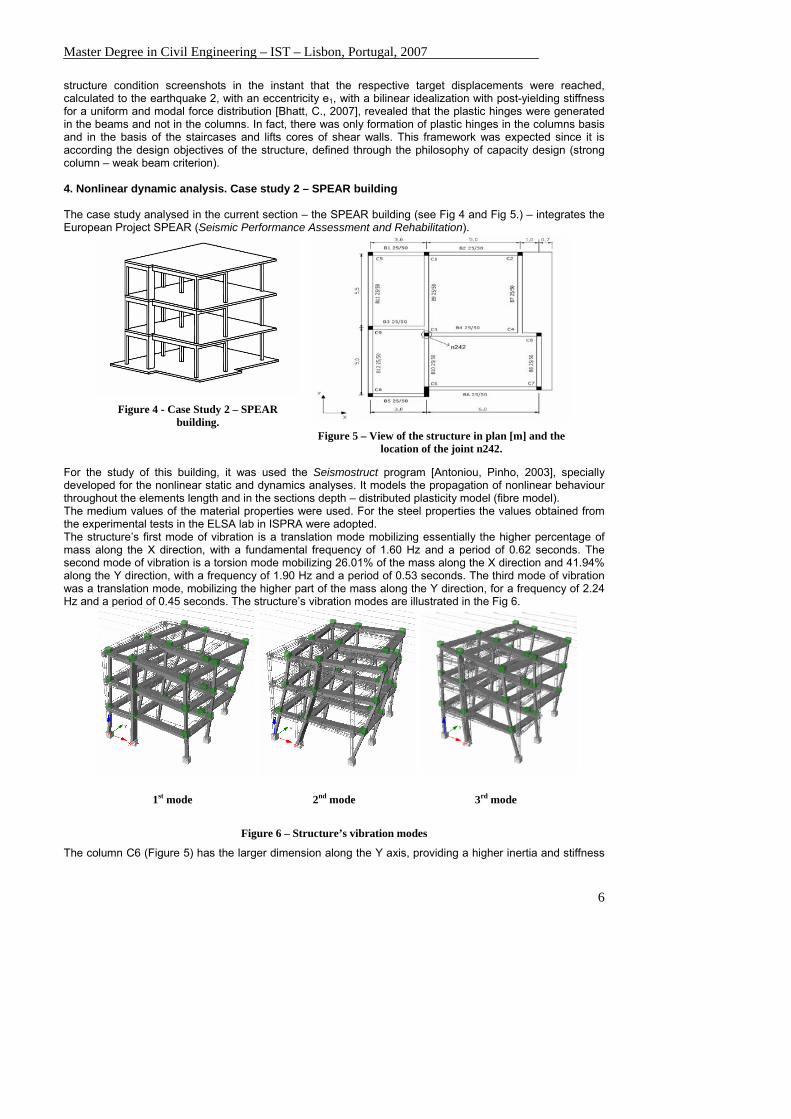
structure condition screenshots in the instant that the respective target displacements were reached, calculated to the earthquake 2, with an eccentricity e1, with a bilinear idealization with post-yielding stiffness for a uniform and modal force distribution [Bhatt, C., 2007], revealed that the plastic hinges were generated in the beams and not in the columns. In fact, there was only formation of plastic hinges in the columns basis and in the basis of the staircases and lifts cores of shear walls. This framework was expected since it is according the design objectives of the structure, defined through the philosophy of capacity design (strong column – weak beam criterion). 4. Nonlinear dynamic analysis. Case study 2 – SPEAR building The case study analysed in the current section – the SPEAR building (see Fig 4 and Fig 5.) – integrates the European Project SPEAR (Seismic Performance Assessment and Rehabilitation).
Figure 4 - Case Study 2 – SPEAR
building. Figure 5 – View of the structure in plan [m] and the
location of the joint n242.
For the study of this building, it was used the Seismostruct program [Antoniou, Pinho, 2003], specially developed for the nonlinear static and dynamics analyses. It models the propagation of nonlinear behaviour throughout the elements length and in the sections depth – distributed plasticity model (fibre model). The medium values of the material properties were used. For the steel properties the values obtained from the experimental tests in the ELSA lab in ISPRA were adopted. The structure’s first mode of vibration is a translation mode mobilizing essentially the higher percentage of mass along the X direction, with a fundamental frequency of 1.60 Hz and a period of 0.62 seconds. The second mode of vibration is a torsion mode mobilizing 26.01% of the mass along the X direction and 41.94% along the Y direction, with a frequency of 1.90 Hz and a period of 0.53 seconds. The third mode of vibration was a translation mode, mobilizing the higher part of the mass along the Y direction, for a frequency of 2.24 Hz and a period of 0.45 seconds. The structure’s vibration modes are illustrated in the Fig 6.
1st mode 2nd mode 3rd mode
Figure 6 – Structure’s vibration modes
The column C6 (Figure 5) has the larger dimension along the Y axis, providing a higher inertia and stiffness

Master Degree in Civil Engineering – IST – Lisbon, Portugal, 2007
7
to the structure in this direction. Therefore, it explains that the vibration along Y corresponds to higher values of frequency. Nonlinear static Pushover analyses were performed to the SPEAR building in each of the direction X and Y, and a SRSS combination was adopted to get the final results. Two forces patterns were used: a modal and a uniform distribution. In this study forces were distributed by the frames proportionally to the mass of each frame. Capacity curves were obtained to the different force patterns used and for both directions. Analysing the capacity curves, it was possible to conclude that the structure revealed, as expected, a higher strength and stiffness along the Y direction than along the X direction. It could also be asserted that to the same direction the uniform load lead to the envelope capacity curves. The target displacements were calculated using the N2 method proposed by Eurocode 8. It is important to note that it was considered a peak ground acceleration (ag) of 0.2g. The transformation factor in the X direction was 1.233 and in the Y direction 1.263. The capacity curves of the equivalent SDOF system were defined as well as its respective bilinear idealizations with post-yielding stiffness and elasto-perfectly plastic, for both directions and to different force distributions. Based on the results obtained the following comments may be stated:
• The frequency of the equivalent SDOF system is higher in the Y direction than in the X direction, as expected due to the C6 column;
• The F*y and d*
y values and the period of the equivalent SDOF system are smaller for the bilinear idealization with post-yielding stiffness than to the elasto-perfectly plastic idealization.
The structure’s target displacements were calculated and the main conclusions are the following • The structure’s target displacement was higher for the X direction In fact, the structure has higher
frequency, hence higher stiffness in the Y direction, as referred; • The structure’s target displacement was higher to an elasto-perfectly plastic idealization than to a
bilinear idealization with post-yielding stiffness; • The structure’s target displacement was higher to a modal force distribution than to a uniform
distribution. Nonlinear dynamic analyses were performed for the SPEAR building. Six pairs of accelerograms were considered, each pair defined by two orthogonal horizontal components of acceleration: one longitudinal and one transversal component. They were used three pairs of artificial accelerograms generated by the software Gosca [Denoël, V., 2001], from the response spectrum used from the EC8 (ag = 0.2g) (target spectrum) and 3 pairs of semi-artificial accelerograms generated in the SPEAR Project. The later accelerograms were obtained from real records and then fitted in order to be compatible with the response spectrum of Eurocode 8 for an ag of 1.0g. Since in this example it was considered a value of 0.2g for the soil acceleration, these accelerograms values were multiplied by 0.2. From these scaled accelerograms they were obtained the respective compatible spectra. Gosca [Denoël, V., 2001] allows the generation of artificial accelerograms compatible with a given response spectrum (target spectrum) and it was the software used in this study for the generation of artificial accelerograms used in the nonlinear dynamic analysis. The response of the structure was assessed analysing the top displacements and the interstorey drifts along the time, in both X and Y direction. It was noted that the absolute maximum values of these two parameters were close for all the accelerograms used. It was also highlighted that the instants of time in which occurred the peaks were directly dependent on the instants of time in which occurred the peaks of the respective accelerograms. Subsequently, the results obtained with the Pushover analyses and the nonlinear dynamic analyses were compared. The target displacements in the two directions, and for all different cases of analysis, are presented in Fig 7 and Fig 8.
0.00000.02000.04000.06000.08000.10000.1200
Pushover Post-Yielding Stifness
modal forcedistribution
Pushover Post-Yielding Stifness
uniform forcedistribution
PushoverElastoplastic modal
force distribution
PushoverElastoplastic uniform
force distribution
Nonlinear DynamicAnalysis artificialaccelerograms
Nonlinear DynamicAnalysis semi-
artificialaccelerograms
Displacement (m)
Figure 7 - Structure’s target displacements in the X direction for all the analyses performed.

Master Degree in Civil Engineering – IST – Lisbon, Portugal, 2007
8
0.00000.02000.04000.06000.08000.10000.1200
Pushover Post-Yielding Stifness
modal forcedistribution
Pushover Post-Yielding Stifness
uniform forcedistribution
PushoverElastoplastic modal
force distribution
PushoverElastoplastic uniform
force distribution
Nonlinear DynamicAnalysis artificialaccelerograms
Nonlinear DynamicAnalysis semi-artificial
accelerograms
Displacement (m)
Figure 8 – Structure’s target displacements in the Y direction for all the analyses performed.
Based on the results obtained, one can say: • The target displacement values obtained in the two directions were close for the nonlinear static
analysis with an elasto-perfectly plastic idealization and for the nonlinear dynamic analysis. According to the X direction, the Pushover analysis performance with an elasto-perfectly plastic idealization and with a modal distribution of forces gets closer to the nonlinear dynamic analysis performance with artificial accelerograms. Analysing the obtained results in the Y direction it is noted that the Pushover analysis (elasto-perfectly plastic idealization) and with a uniform distribution of forces showed more compatible results with the ones obtained from the analysis with artificial accelerograms. The values obtained in the Y direction with the Pushover analysis for an elasto-perfectly plastic idealization and with a modal distribution of forces, are closer to the ones obtained from the nonlinear dynamic analysis with semi-artificial accelerograms in this direction;
• The target displacements obtained in both directions from the Pushover analysis with a bilinear idealization with post-yielding stiffness are considerably smaller than the ones obtained for the other types of analyses. Actually, this idealization didn’t allow getting close to the reality because the post-yielding stiffness was high due to the high values of the initial stiffness assumed. In this idealization it was regarded that the yielding happened considerably sooner than it actually happens. These values were smaller in the Y direction and both were smaller than the ones obtained in the other analyses;
• The target displacements obtained with the Pushover analysis for a modal distribution of forces, were higher than the ones obtained using a uniform distribution;
• Comparing the nonlinear dynamic analysis using semi-artificial accelerograms with the other types of analyses, it was possible to conclude that the former produced higher target displacements. In fact, the values obtained were higher than the results for the artificial accelerograms. This fact can be explained based on the average spectrum associated to the artificial and to the semi-artificial accelerograms in the two directions, represented in the Fig. 9. In this figure it is illustrated for each direction: the average of the three spectrum compatible with the artificial accelerograms, the average of the three spectrum compatible with the semi-artificial accelerograms, and the target spectrum.
Compatible spectra - average vs. target spectrum X direction
0
2
4
6
0 1 2 3 4
T (sec.)
a (m/s2)
Semi-artificialArtificialTarget spectrum1/(natural frequency)1/(0,6 x natural frequency)
Compatible spectra - average vs. target spectrum Y direction
0
2
4
6
0 1 2 3 4
T (sec.)
a (m/s2)
Semi-artificialArtificialTarget spectrum1/(natural frequency)1/(0,6 x natural frequency)
Figure 9 – Compatible spectra - average vs. Target spectrum in the X and in the Y directions.
According to figure 9, the average spectrum compatible with the semi-artificial accelerograms (to an intensity level of 0.2g) shows higher acceleration values than the one compatible with the artificial accelerograms as well as the target spectrum. This happens because the artificial accelerograms were generated from the target spectrum (ag=0.2g), while the semi-artificial ones were fitted to the EC8 spectrum with ag=1.0g and afterwards scaled, drifting away from the target spectrum (ag=0.2g). In a nonlinear regime the global stiffness can be considered, in a simplified way, equal to 30% of the stiffness in a linear elastic regime that leads to a fundamental frequency in a nonlinear regime equal to 60% of the fundamental frequency in a linear elastic regime. Then, the seismic response of the

Master Degree in Civil Engineering – IST – Lisbon, Portugal, 2007
9
structure is mainly due to these values of frequencies. In Fig. 9 one can see that the acceleration values corresponding to the periods associated to these frequencies, for the two directions, are higher for the spectrum associated to the semi-artificial accelerograms than the ones associated to the artificial accelerograms. On the other hand for this result the average of the maximum accelerations of the semi-artificial accelerograms (0.27g according to X and 0.26g according to Y) is higher than the average of maximum accelerations of the artificial accelerograms (0.22g according to X and 0.21g according to Y) in the two directions, and more distant to 0.2g (intensity level to which this study was performed);
• The values obtained using artificial accelerograms and semi-artificial accelerograms were closer in the X direction than in the Y direction. This fact is explained from the analysis of Fig. 9, where it is noted that for the two frequencies mentioned above, the difference of the acceleration values between the average spectrum associated with the artificial accelerograms and the average spectrum associated with the semi-artificial accelerograms was higher in the Y direction;
• The target displacements were higher along the X direction than along the Y direction, which is an expected result, since the column C6 revealed a larger dimension along the Y direction granting thus a higher inertia and stiffness, therefore, a higher frequency, to this direction.
In Fig. 10 and Fig. 11 the structure’s interstorey drifts are presented for all the analyses. It is important to note that the interstorey drifts values of the Pushover analysis in each direction were obtained for the analysis case correspondent to the higher target displacement. This corresponds, in the two directions, to the Pushover analysis with an elasto-perfectly plastic idealization and with a modal distribution of forces.
Interstorey Drifts - X Direction
0.000 0.500 1.000 1.500 2.000
1st floor - Groundfloor
2nd floor - 1st floor
3rd floor - 2nd floor
(%)
Nonlinear dynamic analysis semi-artificial accelerogramsNonlinear dynamic analysisartificial accelerogramsPushover
Figure 10 – Interstorey drifts according to X.
Interstorey Drifts - Y Direction
0.000 0.500 1.000 1.500 2.000
1st floor - Groundfloor
2nd floor - 1st floor
3rd floor - 2nd floor
(%)
Nonlinear dynamic analysis semi-artificial accelerogramsNonlinear dynamic analysisartificial accelerogramsPushover
Figure 11 – Interstorey drifts according to Y.
Based on the results shown in figures 10 and 11, the following comments can be drawn: • The interstorey drifts decreased in height for all the analyses and for the two directions. This is a
characteristic of framed structures; • The interstorey drifts were higher in the X direction than in the Y direction, because the structure, as
previously mentioned, is more stiff according to Y; • Along the X direction, the interstorey drift value between the floor 0 and floor 1 was higher for the
pushover analysis than for the nonlinear dynamic analysis. In the later case the value obtained with the artificial accelerograms was closer to the pushover analysis result than the one obtained with the semi-artificial accelerograms. For the remaining interstorey drifts in this direction, between the floor 1 and floor 2 and between the floor 2 and floor 3, the values obtained were higher for the nonlinear dynamic analysis than for the Pushover analysis and, within the nonlinear dynamic analysis, higher to the ones corresponding to semi-artificial accelerograms;
• According to Y, the interstorey drifts values are higher to the nonlinear dynamic analysis with semi-artificial accelerograms, followed by the Pushover analysis and finally by the nonlinear dynamic analysis with artificial accelerograms;

Master Degree in Civil Engineering – IST – Lisbon, Portugal, 2007
10
• The values obtained from the nonlinear dynamic analysis using the semi-artificial accelerograms are always higher than those obtained using artificial accelerograms and than the ones obtained from the pushover analysis, excluding the interstorey drift between the floor 0 and floor 1 in the X direction;
• The interstorey drifts values in the X direction obtained using the pushover analysis were closer to those obtained with nonlinear dynamic analysis using artificial accelerograms than to those obtained using semi-artificial accelerograms. According to Y, the interstorey drifts using the Pushover analysis were closer to those obtained using semi-artificial accelerograms. This result can be explained, because in this pushover analysis, the N2 method does not take into account the torsional effects, and since the second mode of vibration is a torsion mode it is expected that the results thus generated may slightly drift away from the nonlinear dynamic analysis with artificial accelerograms (closer to the reference response spectrum). As it can be noted the interstorey drifts values obtained using a nonlinear dynamic analysis are higher for the semi-artificial accelerograms than for the artificial accelerograms, except for the interstorey drift between the floor 0 and floor 1 in the X direction. This can be explained using the same reasons that explained the fact that the target displacements are higher using semi-artificial accelerograms than using artificial accelerograms;
• The structure in analysis (SPEAR structure) resisted to the seismic action with an intensity level of ag=0.2g, since the maximum interstorey drift (around 2%) was smaller than 2.5% which is a reference value often used to verify the interstorey drifts to the Ultimate Limit State in terms of design;
• The higher value of interstorey drift occurred between the floor 0 and floor 1 in the X direction and was around 2%.
As it can be noted, the smaller “error” for the target displacements in X direction was obtained when comparing the pushover analysis with an elasto-perfectly plastic idealization with a modal distribution of forces with the nonlinear dynamic analysis with artificial accelerograms and was 4.41%. The smaller “error” for the target displacements according to Y was obtained when comparing the pushover analysis with an elasto-perfectly plastic idealization with a modal distribution of forces with the nonlinear dynamic analysis with semi-artifical accelerograms which was 7.87%. For the interstorey drifts, the smaller “errors” according to X were obtained when comparing a pushover analysis with the nonlinear dynamic analysis with artificial accelerograms. The smaller “error” was 8.37% stands for the drift between the floor 0 and the floor 1. According to Y, the smaller “errors” were obtained comparing the pushover analysis with the nonlinear dynamic analysis with semi-artificial accelerograms. The smaller “error” was approximately 7% and occurred for the drift values between the floor 0 and the floor 1 and between the floor 2 and the floor 3. The difference between the results obtained with the different analyses can be explained by the following:
• The irregularity of the structure in plan leads to torsional problems that were not adequately considered in the adopted procedure based on the nonlinear static analysis, namely the method N2 proposed in Eurocode 8;
• The simplified modelling of the rigid diaphragm effect in plan, adopted in the calculation model; • The accelerograms used to describe the seismic action.
5. Final comments The results obtained by means of the Pushover analysis, performed according to the Eurocode 8, for the case study 1, were close to those obtained with the linear dynamic analysis. These were the outcomes expected in the structure studied. In fact this type of analysis provide good results for regular structures, such as the case concerning the first building analysed in this work. The nonlinear static Pushover analysis applied in both directions, lead to the conclusion that the ductility of this building could have been better explored in the X direction (the value adopted was defined initially, when the behaviour coefficient was assumed). This conclusion was drawn from the values obtained for the relation αu / α1 obtained through the Pushover analyses. These results firstly allow to assess the redundancy of the structure in both directions and then to analyse the possibility of exploring the nonlinear behaviour of the structure. The assessment of the ductility demand and the ductility available (the former was always smaller than the later in all the cases of analyses) allowed to conclude that the structure was over designed or, alternatively, that the structure would resist to seismic actions more severe. The first structure (case study 1) was designed according to the Capacity Design Principles. According to the Pushover analysis, it was clearly shown that the objectives of this methodology were accomplished since the plastic hinges were generated preferably in the beams and not in the columns – weak beam/strong column criterion. In fact, according to the Capacity Design philosophy a hierarchy of formation and development of plastic hinges is enforced, aiming to maximize the energy-dissipation capacity of the structure as well as the ductile behaviour of the structure. It intends to prevent the premature development of partial mechanism with a

Master Degree in Civil Engineering – IST – Lisbon, Portugal, 2007
11
reduced number of plastic hinges. For the frame structures, if the plastic hinges develop in the beams, a much larger number of plastic hinges can develop before the structure becomes a mechanism. The N2 method adopted by the Eurocode 8 for the Pushover analysis shows certain limitations, namely concerning the 3D buildings irregular in plan. The SPEAR building (case study 2) showed irregularity in plan, leading to torsional problems difficult to quantify by means of the N2 method. According to the results obtained with the study of the SPEAR building it was possible to show that the nonlinear dynamic analyses depend substantially on the accelerograms used in the analyses. The SPEAR building had interstorey drift values smaller than 2.5% (the maximum value obtained was around 2%) for the seismic intensity level studied (0.2g). So it can be concluded that this building stood for the seismic intensity considered. Acknowledgments I would like to express my gratitude to my supervisor, Dr. Rita Bento, whose expertise, understanding, advices and patience, added considerably to my student and life experience, helping me in the several challenges that I’m involved. I would also like to thank my family for the support they provided me through my entire life. References Antoniou, S.; Pinho, R., [2003] “Seismostruct – Seismic Analysis program by Seismosoft”, Technical manual and User manual. Bhatt, C. [2005] “Dimensionamento e Avaliação Sísmica de Estruturas de Edifícios de Betão Armado segundo o Eurocódigo 8”, Trabalho Final de Curso da Licenciatura em Engenharia Civil do Instituto Superior Técnico, Departamento de Engenharia Civil do Instituto Superior Técnico. Bhatt, C. [2007] “Análise Sísmica de Edifícios de Betão Armado segundo o Eurocódigo 8 – Análises Lineares e Não Lineares”, Dissertação para a Obtenção do Grau de Mestre em Engenharia Civil do Instituto Superior Técnico, Departamento de Engenharia Civil do Instituto Superior Técnico. CEN, [2003] “Eurocode 8: Design of structures for earthquake resistance – Part 1: General rules, seismic actions and rules for buidings”, Ref. Nº prEN 1998-1:2003 E, Bruxelas. Denoël, V., [2001] “Generation of Spectrum Compatible Accelerograms (GOSCA)”, Research Report, Université de Liège (Belgique). Loeding, S., Kowalsky, M. J., and Priestley, M.J.N., [1998] “Displacement-based design methodology applied to R.C. Building frames.” Report SSRP 98/06 Structures Department, UCSD.