Embed Size (px)
Citation preview

SEGREGATING CALIFORNIA'S FUTURE
Inequality and Its Alternative 60 Years after Brown v. Board of Education
Gary Orfield and Jongyeon Ee
May 2014
Segregating California’s Future, May 2014 Civil Rights Project/Proyecto Derechos Civiles
2 | P a g e
The Civil Rights Project/Proyecto Derechos Civiles would like to acknowledge The California Endowment and its support of this research.
Cover photo by Bernard J. Kleina

Segregating California’s Future, May 2014 Civil Rights Project/Proyecto Derechos Civiles
3 | P a g e
Executive Summary
California has had serious issues of separation and discrimination in its schools since it became a state. It
was little affected by the Brown decision, which was directed primarily at the 17 states that had laws
mandating the segregation of African Americans.
Although the California Supreme Court recognized a broad desegregation right in the state constitution,
and the legislature briefly mandated that school boards take action to enforce this right, both were reversed
by voter-approved propositions. The 1979 Proposition One led to the termination of the city’s
desegregation plan—the first major city in the U.S. to end its plan.
U.S. Supreme Court decisions in the 1990s led eventually to the termination of the federal desegregation
orders in San Francisco and San Jose. Major court decisions in California mandating desegregation that
occurred in the 1970s were overturned by the 1990s, thus California presently has no school integration
policy.
Segregation has grown substantially in the past two decades, especially for Latinos. White students’ contact
with nonwhite and poor students has increased significantly because of the dramatic change in overall
population. Black and Latino students are strongly concentrated in schools that have far lower quality,
according to state Academic Performance Index (API) ratings. Conversely, a far larger share of whites and
Asians attend the most highly related schools and thus are the most prepared for college.
A half-century of desegregation research shows the major costs of segregation and the variety of benefits of
schools that are attended by all races.
California has had an extremely dramatic increase in the segregation of Latinos, who on average attended
schools that were 54 percent white in 1970, but now attend schools that are 84 percent nonwhite. In fact, by
one of our measures, California is now the state in which Latinos are the most segregated, making them the
most isolated group in the state’s schools and becoming more so.
Latinos on average attend schools in which three-quarters of the students are poor. The best way to
understand segregation today in California is the isolation of the combined population of Latinos and
African Americans from the combined population of whites and Asians. The correlation of Latinos plus
African Americans with the percentage of poor students in a school is extremely high. Black and Latino
Segregating California’s Future, May 2014 Civil Rights Project/Proyecto Derechos Civiles
4 | P a g e
students attend schools that on average have more than two-thirds poor students, while whites and Asians
typically attend schools with a majority of middle-class students.
The typical black student in California today attends a school with more than 2.5 times as many Latinos as
blacks, thus making them a minority within a school dominated by another disadvantaged group.
The most segregated districts are in the Los Angeles-Inland Empire Region. The most integrated large
districts are in the Sacramento and Fresno areas, where housing segregation is low.
Current demographic trends make full integration impossible, but they also offer important opportunities to
expand integrated options and thus to support lasting community integration. For example, the existing
choice and charter systems ignore integration, but with the right policies in place, choice could become an
important positive force.
Among large school districts in California, some are far more integrated than others, which demonstrate
that a pattern of segregation is not inevitable and offers models for other communities.
Where desegregation is simply not possible, we spell out important things that can be done to make
opportunity more equal in segregated schools, and to offer students more choices. The Local Control
Funding Formula targets funding for many children in segregated schools, and the funds could be used to
support efforts to offer more equal opportunities. However, there is currently no state initiative in the
pipeline to deal with issues of resegregation in California. California educators need to step up and provide
leadership on civil rights.
Segregating California’s Future, May 2014 Civil Rights Project/Proyecto Derechos Civiles
5 | P a g e
Segregating California’s Future: Inequality and Its Alternative
60 Years after Brown v. Board of Education
Gary Orfield and Jongyeon Ee
The time has come to celebrate the 60th anniversary of Brown v. Board of Education, a landmark U.S.
Supreme Court decision that was announced by Chief Justice Earl Warren on May 17, 1954. This soaring
unanimous decision challenged the legitimacy of the entire education system in the U.S. South and helped
kick off a great social movement that changed the country in the 1960s. Brown is celebrated across the
world as a landmark on the march toward racial equality. Today, however, a look at California’s schools
shows little sign of movement toward integrating the education of the state’s remarkably diverse population
of young people. In fact, we see major court orders long abandoned, the idea of state leadership and
support for integration essentially forgotten, an entirely new system of highly segregated charter schools,
and the spread of Latino and African American segregation into major sectors of what not too long ago
were white suburbs. We see California’s Latino students, now the majority, locked into schools that are
vastly more segregated today than during the civil rights era, and also facing concentrated poverty. Blacks
are now deeply segregated from whites and middle-class students; they also are typically a small minority
within schools dominated by Latinos. To a large extent, teachers who have had extensive experience and
educational opportunities are concentrated in middle class white and Asian schools, which increases
inequality, placing less experienced teachers and many teachers of color in the schools that need highly
experienced teachers the most, and denying white and Asian students the opportunity to learn from a truly
diverse faculty.
California has tacitly accepted the Plessy v. Ferguson standard of “separate but equal,” and California
educators and local leaders act as if they can make equal schools that the Supreme Court said in Brown
were “inherently unequal.” Although a handful of much praised schools have achieved equality against the
odds inherent in isolated concentrated poverty settings, a half century of efforts, under a succession of
reforms since l965, with hundreds of billions of federal and state dollars spent, has produced no evidence
that this is possible on a larger scale. Californians rush to condemn racist comments by visible leaders,
public or private, but accept astonishing inequalities in school opportunities by race as a normal reality and
rarely seriously discuss ways to change it or even to stop its spread.
Segregating California’s Future, May 2014 Civil Rights Project/Proyecto Derechos Civiles
6 | P a g e
This report begins with a history of segregation and inequality in California’s schools. It analyzes the
changes that have occurred in the California schools since the civil rights era of the l960s and assesses the
degree to which African American and Latino students today are attending segregated or diverse schools. It
looks at segregation by economic status as well as by race, and examines the links between the two that
result in severe double segregation. It discusses the serious problem in some areas of linguistic isolation,
which can lead to triple segregation. It also examines large districts across the state to see whether there are
important variations in different regions that can point out issues that future policy should address.
Importantly, this report points out ways that various institutions and groups in California could begin to
turn the state back toward the goals of Brown—of public education that is fair for all and brings our diverse
society together within our most fundamental institution to prepare students for the future. It suggests,
finally, that school districts consider using the major new state funding provided by the newly enacted
Local Control Funding Formula to help address these issues through voluntary strategies.
A State in Continuous Change. California was originally settled by many Indian tribes and then became a
lightly populated outpost of the Spanish empire. It was briefly part of an independent Mexico before the
Gold Rush and the Mexican American War. Statehood was followed by generations of vast immigrations
of largely European-American residents creating what was an overwhelmingly white state, but the society
of what had become America’s largest state took a dramatically different turn from the 1970s to the
present. In one of the great demographic transformations in the nation’s history California became a
predominantly nonwhite state in less than a half century.
California’s population has expanded continuously and massively since the state’s founding, sometimes
more than doubling in a single decade. There was not a large population of Mexican American students in
California at the time of Brown, as the state had primarily attracted streams of Anglo migration from the
rest of the country for generations. Southern California was the strongest magnet, growing by 101 percent
in the 1870s, 213 percent in the 1880s, and 51 percent in the 1890s. From 1900 to 1940, Southern
California grew by 1,107 percent and Los Angeles by 1,536 percent.1
By the early 20th century, the state was overwhelmingly white and its schools remained that way at the
time of Brown. Large migrations of Latinos and blacks flowed into the state, primarily in response to a
demand for labor, bringing large numbers of their children into California’s public schools. The central
1 Carey McWillams, Southern California
Segregating California’s Future, May 2014 Civil Rights Project/Proyecto Derechos Civiles
7 | P a g e
reality of California schools now is that an unprecedented racial transformation changed the state from
one with a school population that was over 80 percent white in the mid-1960s to one with a majority of
Latino students; today only about one-fourth of students in the state are white. As the number of white
students declined sharply as a share of the growing population and the Latino proportion soared, the
proportion of African Americans declined modestly. Asians, whose numbers were insignificant in the
state in the 1950s, today comprise a group that is half again as large as blacks. This process of change
continues, even as birthrates for all groups and immigration have dropped substantially, and the state is
experiencing a decline in the number of high school students and young workers. If California cannot
educate its own people fairly and help them understand each other and live and work together effectively,
it will face deeper decline and increased polarization.
A History of Discrimination. Historically, school segregation has been a contentious issue in California
since it became a state. The state discriminated by law against several groups and long accepted local
practices which put students in separate and highly unequal schools. California authorities had laws which
overtly discriminate against some groups until a few years before the Brown decision. After the segregation
laws ended, segregative practices remained entrenched. Many practices, public and private, allowed
segregation to become far worse, especially for Latinos, the state’s future majority population.
California has discriminated against many groups in many ways. The Gold Rush, which brought a
sudden tidal wave of people to California from all over the world, the U.S. victory in the Mexican-
American War, and the state’s rapid growth produced ethnic conflicts in an openly racist society. Very
early on, California enacted a strong fugitive slave act that enabled out of state slave owners to repossess
their “property.” In a white Protestant nation committed to the “manifest destiny” of white rule, the
presence of Indians, Chinese, Mexicans, and blacks in a society that assumed white racial superiority
and feared racial change triggered many forms of separation and subordination. In fact, the state
constitution embodied discrimination against Asians and Indians: California Chief Justice Murray,
writing in 1856, concluded in The People v. Hall that Asians were a “distinct people [and] a race of
people whom nature has marked as inferior, and who are incapable of progress or intellectual
development beyond a certain point.” Nature had created an “impassible difference,” he said.2 As a
result, community leaders and educators created segregated schools while minorities fought to have any
2 The People v. George W. Hall, 13 Cal. 73.
Segregating California’s Future, May 2014 Civil Rights Project/Proyecto Derechos Civiles
8 | P a g e
schools at all. Asian schools, Indian schools, and black schools were created, along with practices that
separated Mexicans from others in their own schools.3
San Francisco passed the first ordinance that attempted to use zoning powers to exclude Chinese from
residing in certain parts of the city, and the Chinese community had to fight for a school.4 One was
finally provided for them in a dank basement room in a church; this was later replaced by a new
segregated school building in Chinatown. A bitter struggle in the city over access to school became an
international incident when the emperor of Japan intervened. Eventually, President Theodore Roosevelt
had to call the entire city school board to Washington to get them to agree to enroll Japanese children.
The president promised San Francisco officials that he would take action to forbid more immigration,
and he did. Immigrants from Asia were totally excluded from settling in the U.S. until Lyndon Johnson
signed the 1965 immigration act, a civil rights era reform that set in motion what would become a great
wave of immigration from Asia. This wave, however, was not an immigration of the poor but largely of
the educated, of people with money and professions who would build extremely successful families and
communities in late 20th-century California. Ironically, it was an element of the empowered Chinese
community in San Francisco that brought the lawsuit ending desegregation plan for blacks and Latinos
and poor isolated Asians in the city in the 1990s.
California’s Japanese children experienced a shocking form of segregation during World War II, when
families were rounded up and forced to move to internment camps because of racial prejudice and
rumors that the Japanese were spying on the U.S. during the war, which turned out to be completely
false. Earl Warren, the hero of Brown, supported this effort while serving as California’s attorney
general and governor, and in advocating for it he actively opposed the U.S. Justice Department.5
Interned Japanese families were encouraged to move inland, away from traditional Japanese areas, and
many lost their land and businesses.6
3 Although California had a substantial Indian population, it had no large tribes occupying large land masses, as in other parts of the Southwest. The Indians tended to occupy small rancherias or to be scattered among the exploding urban communities. A few areas established segregated Indian schools, and the federal Bureau of Indian Affairs educated a significant number of students in reservation schools or in Indian boarding schools. The Indian population is now substantially less than 1 percent of the state’s students, and although we could not do so in this report, we believe that the current story of Indian educational opportunity deserves serious research. 4 C. S. Johnson, Patterns of Negro Segregation. New York: Harper and Brothers, 1943, p. 173. 5 J. Newton, Justice for All: Earl Warren and the Nation He Made. New York: Riverhead Books, 2006, p. 129. 6 Wollenberg, All Deliberate Speed: Segregation and Exclusion in California Schools, 1855-1975, Berkeley: Univ. of California Press, l975. pp. 28-81.
Segregating California’s Future, May 2014 Civil Rights Project/Proyecto Derechos Civiles
9 | P a g e
When substantial Asian immigration to California resumed in the late 1960s, the preference systems
under the act and the high cost of immigration from Asia brought a highly educated immigrant
population to the state, an Asian population that resembled the early immigrants from Cuba following
the Cuban Revolution, who also were largely gifted and educated. These Asians did not face serious
residential segregation and were highly integrated in the public schools. There were few majority Asian
schools, and the fact that Asians spoke many languages and few had any intention of returning to their
country of origin meant that there was very little language segregation. The flow of Asian technical
workers into California’s Silicon Valley was a striking example of a truly exceptional immigration. The
major exceptions were the post-Vietnam immigrants from Indochina, who included many uneducated
families, some from primitive communities in Laos and Cambodia and from tribes that had supported
the U.S. during the war. By and large, however, segregation did not become a significant issue for
Asians in this era of extremely rapid growth in the student population, as they had become California’s
most integrated and educationally successful racial group.7
Major Latino and black settlements were late in developing. California’s Mexican-origin population
tripled in the 1920s, and their children became one-tenth of the state’s total school enrollment, about
nine-tenths of them in Southern California.8 World War II, with its vast military operations, had an
enormous impact on California’s economy and society. The massive need for labor for shipbuilding,
aircraft plants, and many related industries brought the active recruitment of minority workers, which
produced significant growth in the state’s small African American population. During this period,
communities were formed and migration paths developed that would later have a massive impact on the
state and its schools. There was blatant whites-only residential discrimination, and the wartime “zoot
suit” riots targeted Mexicans and other minorities in Los Angeles and other California cities.9
7 There is a great deal of writing about the “model minority myth” that disputes claims of U.S. Asians’ success. It is of course true that significant Asians subgroups, particularly post-Vietnam refugees from Indochina, have experienced severe educational and economic problems. There are also some white communities with concentrated poverty and disadvantage, and there are in turn significant groups of African Americans and Latinos who have experienced substantial educational and economic success. Nonetheless, the average experiences of each of these groups are very distinctive, as the data in this report show. 8 C. Wollenberg, All Deliberate Speed: Segregation and Exclusion in California Schools, 1855-1975, Berkeley: Univ. of California Press, l975. 9 A. M. Rose, ed., Race Prejudice and Discrimination. New York: Alfred A. Knopf, 1951, pp. 208-219, 270-275.
Segregating California’s Future, May 2014 Civil Rights Project/Proyecto Derechos Civiles
10 | P a g e
California’s major segregation issues arose from what is often described as the de facto segregation of
Mexican American students. Many California educators had long believed that Mexican American
children would be better off in segregated schools, and the rapid increase in the number of Mexican
students enrolled in the state’s public schools led many communities to operate segregated Mexican
schools or to create attendance boundaries that concentrated these students. Widely considered by white
leaders and educators of the time to be intellectually and culturally inferior, Mexican American children
were educated in separate facilities and only received an elementary education.10 In his history of
discrimination in California, Wollenberg concludes that by the late 1920s “Mexicans became by far the
most segregated group in California public education.”11
Desegregation Law and Policy. After World War II, a war against a racist dictatorship, policy on
racial discrimination began to change. Mexican Americans won a famous victory in the 1947 Mendez
case, which held that local school districts’ practice of segregating Mexican American students was
unconstitutional, and the state responded by repealing its segregation laws, but neither of these made
much difference, as segregated housing and schools increased and little was done to stop it. At the time
of Brown, California’s African Americans were highly segregated, Latinos less so. However, the most
stunning change in terms of segregation in the state is the level of Latino segregation from the 1960s to
the present. Today, both blacks and Latinos are widely segregated both by race and economic status, and
they often attend the same disadvantaged schools.
Brown held that the basic system of segregating black students that was in place in 17 states was deeply
unequal and could not become equal because of the racist attitudes and practices inherent in a society
where the dominant racial groups kept the best for themselves. This reality violated the 1868 Equal
Protection Clause of the 14th Amendment to the Constitution, which mandates “equal protection of the
laws,” as segregation was “inherently unequal” and a fundamental injustice. The decision helped trigger
a great social movement and led to a revolution in law and politics, which ended the system of apartheid
in the U.S. South and made it the least segregated region in the nation for African American students.
California, which had recently repealed a law legalizing the segregation of Asians and Indians and had a
relatively small black population, was little affected by Brown during the civil rights era, despite its long
10 McWilliams, Southern California, pp. 110-116. 11 McWilliams, Southern California, p. 116.
Segregating California’s Future, May 2014 Civil Rights Project/Proyecto Derechos Civiles
11 | P a g e
history of discrimination in education, the intense segregation of black students, and a history of
segregating Latinos.
The ruling in Brown generated massive legal and political struggles over the fate of Southern schools,
but officials in California denied that the state had a segregation problem. California school authorities
refused to even count their students or publish the facts on segregation, although it was obviously
spreading neighborhood by neighborhood, producing protests by civil rights organizations in minority
communities.
Although Mendez v. Westminster, a key pre-Brown case decided in California in 1947, held that school
districts’ practice of segregating Mexican American students was unconstitutional, the case only
resolved the issue for those who lived within the boundaries of attendance areas of predominantly white
schools. 12 It did not address segregation arising from manipulation of boundaries or from residential
segregation and it did not prescribe any ongoing oversight of the schools. That decision never went to
the U.S. Supreme Court, did not define what “desegregation” meant, and was not applied to the rapid
spread of de facto segregated Latino schools that were mushrooming as the Mexican American
community grew, and as school boards were making decisions about school sites, boundaries,
assignment patterns, etc.
It was not until 1973, more than a quarter century later, that the U.S. Supreme Court spoke about Latinos’
desegregation rights under the U.S. Constitution and about the rights of urban students of color in states
outside the South that had no segregation laws but where discrimination was practiced in many
dimensions. The 1973 Keyes v. Denver decision established the conditions for getting federal urban
desegregation orders outside the South. Keyes required desegregation only when civil rights lawyers
proved a violation by showing systematic official action and policies that had the effect of segregating
students of color. Therefore, the real impact of Brown did not reach California until the 1970s, and then
only through Keyes. Although the Johnson administration vigorously enforced the Supreme Court’s
orders in the 1960s, President Nixon and his administration were opposed to and fought hard against
urban desegregation in the courts. As a result, Keyes was not significantly implemented. In California,
Governor Ronald Reagan was similarly opposed, and in 1974 the U.S. Supreme Court narrowly blocked
12 Mendez v. Westminster, 64 F.Supp. 544 (S.D. Cal. 1946), aff’d, 161 F.2d 774 (9th Cir. 1947) (en banc).
Segregating California’s Future, May 2014 Civil Rights Project/Proyecto Derechos Civiles
12 | P a g e
desegregation orders from crossing into the suburbs, making desegregation unworkable under federal
law, no matter what violation occurred, in cities with few white or middle-class students.13
California lawyers usually turned to the California courts rather than Federal courts because the state
Supreme Court, held that segregation violated the state constitution, whatever the cause, making it much
easier to win a desegregation case in the state courts. Civil rights lawyers did not have to prove a
complex pattern of fostering segregation, and undermining integration over many years against the
resources of school districts and their much better funded s lawyers. California’s education authorities
implemented their own desegregation policies in small districts during the 1960s and 1970s, but state
law did not require extensive proof of violations and could permit remedies that crossed district lines, as
was done in the Palo Alto area. Therefore, apart from major federal cases in San Francisco and San Jose
and a smaller one in Pasadena, the California desegregation battle was largely limited to state courts and
to voluntary action. Berkeley and Riverside were among the first communities to desegregate their
schools voluntarily.
California’s Desegregation Efforts and the Persistence of Segregation
Until the 1960s, more than a decade after Brown, there was little systematic reporting of patterns of
school segregation in California, although the state’s schools had long been strictly segregated for black
students. Both black and Latino students faced serious segregation in California after Brown, but it was
much more intense for African Americans and the Latino segregation levels were much lower than those
in some other areas with a large Latino population. A 1966 California survey showed that, in the state’s
largest school districts, 57 percent of Latino students were attending minority schools, 28 percent were
in “mixed” schools, and just 15 percent were attending predominantly white schools. Blacks were then
far more segregated, with 85 percent attending minority schools, 12 percent mixed schools, and only 3
percent white schools.14 By the fall of 1968, the federal Office for Civil Rights was systematically
collecting enrollment data by race across the U.S. Those statistics showed significant segregation of
Latinos in the elementary schools but less in high schools. Although California had the lowest level of
segregation for Hispanics in the Southwest, about one-third (32.8 percent) of Mexican American
13 Milliken v. Bradley (1974). 14 T. P. Carter and R. D. Segura, Mexican Americans in School: A Decade of Change. New York: College Board, 1979.
Segregating California’s Future, May 2014 Civil Rights Project/Proyecto Derechos Civiles
13 | P a g e
elementary students were in schools with populations more than half Mexican American; that number
was only one-sixth (15.6 percent) in high school.15
The civil rights revolution of the l960s created a mixed picture in California with positive moves mixed
with serious resistance. As national attention turned to urban desegregation, to investigating the roots of
segregation outside the South, and to the rights of Latino students, lawsuits, local initiatives, and policy
proposals sprouted in California. Pasadena, Los Angeles, and San Francisco were especially important
in these developments. Berkeley,16 Riverside,17 Sacramento, and several other California communities
initiated substantial voluntary desegregation programs.18
There was increasing recognition in this period within the education policy and research worlds of the
inequalities associated with segregation and the desirability of integration in a state that still had a very
large white majority. In 1962, the state board of education required districts to “exert all effort to avoid
and eliminate segregation.”19 In 1965, the California School Boards Association urged districts to “take
steps to ameliorate any imbalances that exist.”20 A case in Pasadena challenged the California Supreme
Court to explore the significance the state constitution had for school integration. The wartime surge of
the black population in Pasadena had produced patterns of school segregation in the city’s schools that
were made worse by the board’s creation of “neutral zones,” which enabled white families in racially
evolving areas to transfer their students to a “whiter” school. In response to an NAACP lawsuit, the
California Supreme Court made its first response to Brown in its 1963 Jackson v. Pasadena decision,
which found the city guilty of intentional segregation and ordered a remedy. The court went on to rule
that the state constitution required action even when there was no proof of intent: “The right to equal
opportunity for education and the harmful consequences of segregation require that school boards take
steps, insofar as is reasonably feasible, to alleviate racial imbalance in schools regardless of its cause.”21
15 Carter and Segura, Mexican Americans in School, p. 137. 16 Neill Sullivan, Now Is the Time: Integration in the Berkeley Schools. Bloomington: University of Indiana Press, 1969. 17 F. M. Wirt, School Desegregation in the North: The Challenge and the Experience. San Francisco:Chandler Publishing 1967, pp. 116-128. 18 T. P. Carter, Mexican Americans in School: A History of Educational Neglect. New York: College Board, 1970, pp. 73-74. 19 Wollenberg, Segregation,] p. 143. 20 Carter, Mexican Americans in School, 73. 21 Wollenberg, Segregation, p. 142.
Segregating California’s Future, May 2014 Civil Rights Project/Proyecto Derechos Civiles
14 | P a g e
In the wake of the Jackson decision, the state carried out a racial survey of segregation, something
educators had previously refused to do by claiming to be “colorblind.” The survey showed that the state
student population was 8 percent black, 13 percent Latino, 2 percent Asian, and slightly more than 75
percent white. Early studies documented the inequalities among schools with different racial
compositions. The California legislature enacted the Bagley Act in 1971, which made California school
officials responsible for integrating their districts. The law was strongly criticized, however, and a
referendum was organized to repeal it. Proposition 21, known as the Wakefield Anti-Busing Initiative,
was enacted by the voters the next year, which quickly led to the repeal of the requirement,22 even as the
Nixon administration was strongly attacking busing orders.23
A desegregation battle developed in Los Angeles in 1962, when civil rights groups asked the Los
Angeles school board to act against segregated schools. The board denied that there was a problem and
claimed to be running a neutral neighborhood school system, although it refused to collect any statistics.
Finally, in 1966, the school system was required by the state to collect data. The resulting survey
showed that black students in Los Angeles were attending eight highly segregated high schools, 13
junior highs, and 72 elementary schools; only a few black students attended some of the 400
predominantly white schools.24 A desegregation case was filed against the Los Angeles district, and after
a lengthy trial, Superior Court Judge Gitelson ordered the district to begin desegregation and to
eliminate majority minority schools by 1972.25 The decision was attacked by the Los Angeles mayor, by
President Nixon, and by the state superintendent of public instruction. Governor Ronald Reagan called
this decision by a Republican judge “utterly ridiculous.” The case was appealed, no desegregation took
place, and the judge was defeated in a reelection bid after a nasty campaign later in 1970.26 In the
aftermath, no local judges would take the case, and it was assigned to Paul Egly, a judge from San
Bernardino County. In 1976, after a long delay, the California Supreme Court ordered Los Angeles to
desegregate its schools.27 By that time, nearly a decade after the case was originally filed, the school
board reported that 101,000 minority students were attending 113 elementary schools that were 99-100
22 F. Kemerer and P. Sampson, California School Law (2nd ed.). Palo Alto: Stanford University Press, 2009. 23 Orfield and Eaton, Dismantling Desegregation. 24 J. W. Caughey, Segregation Blights Our Schools. Los Angeles: Quail Books, 1967, pp. 14-19. 25 Crawford v. Board of Education (Calif. Super. Ct. Los Angeles County, No. 822, 854, 1970). 26 Wollenberg, Segregation, pp. 158-160. 27 Crawford v. Board of Education, 130 Cal. Rptr. 724 (1976).
Segregating California’s Future, May 2014 Civil Rights Project/Proyecto Derechos Civiles
15 | P a g e
percent nonwhite, and 53,000 more students attended 70 other schools that were more than 80 percent
nonwhite. Another 91,000 students of color attended segregated middle and high schools.28
Los Angeles finally began limited school integration in 1979, after voters adopted Proposition I. Egly
was shocked when the high courts accepted the legitimacy of this restriction on the rights of blacks and
Latinos: “I believed that with the passage of Prop I, if declared constitutional, desegregation efforts by
the court would be finished.” The California Supreme Court had been the bedrock of the state’s
desegregation effort and civil rights lawyers believed the court would strike down the proposition, but,
as Egly recalled, “the California Supreme Court refused to hear the case. The case was then handed back
to the Appellate Court effectively ending the California litigation.”29 “I truly believe,” Egly said, “that
the court was ducking the case for political and personal reasons. I was ashamed of the court.”30 The
next year, the U.S. Supreme Court rejected a challenge to the proposition, although in the 1960s it had
overturned the California proposition forbidding fair housing laws.31 Civil rights groups in Los Angeles
simply never had the money to pursue a federal lawsuit against the Los Angeles system. Moreover, it
was now the Reagan era and the justice department and the federal courts were becoming far more
conservative on school desegregation and on civil rights in general.
Proposition I ended the last state effort to push for desegregation. Under federal law civil rights
plaintiffs would have needed millions of dollars to prove the historic violations occurring in the city, and
any remedy would be limited to the single district. The plaintiffs attempted to bring a federal court case
but could not raise the necessary funds. The upshot in Los Angeles was the abandonment of the partial
plan that had been briefly implemented. Nothing remained but a small voluntary transfer and magnet
school plan, which was not supervised by the court. Los Angeles became the first city in the U.S. to
abandon its court-ordered desegregation plan. Though opponents had argued that the decline of whites
in the district would change with no desegregation, the changes continued. There was to be no remedy
for desegregation in the nation’s second largest school district, which served the nation’s largest Latino
community and the largest black community in the West.
Ongoing conflicts in Pasadena brought a key issue to the U.S. Supreme Court in 1976. Spreading
housing segregation, together with boundary and student assignment policies, were increasing 28 Crawford v. Board of Education, 72. 29 Crawford v. Board of Education, 138. 30 Crawford v. Board of Education, 144. 31 Crawford v. Board of Education of Los Angeles, 458 U.S. 527 (1982).
Segregating California’s Future, May 2014 Civil Rights Project/Proyecto Derechos Civiles
16 | P a g e
segregation in Pasadena, and civil rights lawyers went to court to request an update of the desegregation
plan. Pasadena resisted strongly, however, and appealed the case to the U.S. Supreme Court. By this
time, President Nixon had appointed four far more conservative judges to the Court. In the Spangler
decision, the Court ruled that there was no ongoing responsibility to adjust a desegregation plan as a
city’s population changed.32 Since all cities are constantly changing in a society where the average
family moves every five or six years and the boundaries of minority communities are spreading, this was
a severe threat to the long-term viability of urban desegregation plans across the country. Two years
earlier the Court had blocked city-suburban desegregation in Detroit, despite conclusions by the
conservative trial judge and the court of appeals that serious city and state violations of minority
students’ rights had occurred and that there was no viable remedy within the city. Both California and
the country were getting to a point where it was often difficult to win any viable remedy.
The other epic California legal battle over desegregation took place in San Francisco, the most ethnically
complex large city in the nation. San Francisco, California’s first great city, has always been the center
of Asian population in the U.S. During World War II, large black and Latino populations were recruited
to satisfy the enormous demand for wartime labor in shipbuilding and other fields. Highly segregated
black communities developed in Bayview-Hunter’s Point and other areas, and the large public housing
projects were intensely segregated. The federal lawsuit was brought by African Americans, who were
then San Francisco’s largest minority community and highly segregated. Johnson v. San Francisco
resulted in a court order in 1971 requiring limited desegregation.33
The resultant effort to integrate schools fell seriously short, however, especially in heavily African
American areas, so the plaintiffs returned to court. Rather than a traditional trial, however, Judge
William Orrick directed the parties to appoint experts and the court appointed its own two experts.34
When the settlement was developed after long negotiations, it included major education reforms,
especially at the schools that were still segregated. It relied on radically reorganizing and improving the
most segregated schools, creating more magnet schools and encouraging voluntary transfers to create
multiracial schools, and capping the percentage of students from any one of eight groups in a school.
The court approved a consent decree that brought radical changes, including the reconstitution of failing
32 Pasadena City Board of Education v. Spangler, 427 U.S. 424 (1976), at 436. 33 Johnson v. San Francisco Unified School Dist., 339 F. Supp. 1315 (N.D. Cal. 1971). 34 The school district, the NAACP, and the state of California appointed their experts, and the court appointed two experts (including the author) to negotiate a possible settlement.
Segregating California’s Future, May 2014 Civil Rights Project/Proyecto Derechos Civiles
17 | P a g e
segregated schools, new magnet efforts, special funding for reforms in other heavily minority schools,
and a national search outside the union contract for the best teachers for the new schools.35 The decree
remained in effect, with some added elements, until 1999, and some key elements remained in place
until the court ended the effort in 2005. The plan was ultimately ended by a lawsuit supported by one
faction of the city’s Chinese community.36 The U.S. Supreme Court decisions in the 1990s on the
termination of desegregation plans set the stage for ending this plan; although it had produced
substantial desegregation and some notable educational breakthroughs, major resegregation developed
soon after the plan ended, as reported by the state monitor.37
Despite the limits of these legal efforts in California, desegregation in some parts of the state did
advance for a time. During the desegregation era, a sharp decline in the segregation of blacks in San
Diego occurred as a result of the state lawsuit, where the dissimilarity index fell from 79 in 1967 to 42 in
1986. There was also a decline in Los Angeles, from 91 in 1967 to 69 by 1988, which no doubt reflected
not only the limited school desegregation effort but also the outward residential movement from Watts
and the South Central area, the historic center of black Los Angeles. The Los Angeles index showed
strong and persistent segregation but small gains. In New York City during this same period segregation
actually increased from 62 to 74.38 Even these modest positive trends in California would be reversed in
the coming years.
The upshot of these and other legal battles is that no state or federal requirement calls for further
desegregation in California, unless there is proof of new violations, and the California state constitution
now includes anti-desegregation provisions. On the other hand, any indirect pursuit of integration by
geographic area, by language background, by persistent poverty, or by neighborhood racial composition
is still permissible under federal and state law. The Berkeley school district, for example, which has
been a leader on these issues for almost half a century, developed a remedy that has been affirmed by
California courts. Districts that still have a residual court order have far more freedom to consider a
broad range of alternatives and any proof of new discrimination could trigger a new court order.
After the U.S. Supreme Court supported the termination of existing desegregation plans in its 1991
Dowell decision, it became impossible to sustain major federal court-ordered desegregation plans in 35 San Francisco NAACP v. SFUSD, 576 F. Supp. 34 (N.D. Cal. 1983). 36 Brian Ho v. San Francisco USD 37 S. Biegel, Education and the Law (3rd ed.). St. Paul, MN: West Publishing, 2012, pp. 399-406. 38 CRP calculations from U.S. Office for Civil Rights data.
Segregating California’s Future, May 2014 Civil Rights Project/Proyecto Derechos Civiles
18 | P a g e
California. The Court ruled in Dowell that desegregation orders were temporary and that after a district
complied with its court order for a time, it should be declared unitary and return to local control, even if
the local decisions produced segregated schools. Following that decision, the major orders in San
Francisco and San Jose were dropped by the federal courts.39 Further weakening the possibility of
desegregation was the 2007 U.S. Supreme Court decision in the Parents Involved,40 which undermined
voluntary desegregation by forbidding choice programs and magnet schools that assigned students to
schools with integration policies that set aside seats for underrepresented groups to ensure diversity in
the schools. Such efforts had been actively encouraged by federal courts and civil rights officials for 40
years as a voluntary way to use choice and attractive educational programs to create successfully diverse
schools. In the aftermath of that decision, conservative legal action groups challenged the Los Angeles
magnet school plan and the desegregation policy in Berkeley. Both challenges, however, were defeated
in the California courts because Berkeley relied on the racial composition of small neighborhoods, not
individual students, in its desegregation plans,41 and because Los Angeles was still under a modest
magnet school court order that made it exempt from the Parents Involved standard.42
The upshot of all these legal battles is that little has been done in California to realize the desegregation
rights of Latinos established by the Supreme Court four decades ago in Keyes, and there currently is no
state or federal mandate requiring further desegregation in California in the absence of proof of new
violations, even though magnet school policies from the desegregation era may be illegal and the
California state constitution includes anti-busing provisions. On the other hand, any indirect pursuit of
integration by geographic area, language background, persistent poverty, or a neighborhood’s racial
composition are still permissible, and districts that still have a residual court order in place have the
freedom to explore a broad range of alternatives.
The Harms of Segregation
Early studies of Mexican segregation documented inequalities and reported strong bias against Mexican
students in the community and schools. For example, one study of junior high students in Los Angeles
in the 1960s found that those who were born in Mexico and spoke Spanish as the home language 39 If new violations were proved, new remedies might be forthcoming. 40 Parents Involved in Community Schools v. Seattle School Dist. No. 1, 551 U.S. 701 (2007). 41 G. Orfield and E. Frankenberg, Educational Delusions. Berkeley: University of California Press, 2013, pp. 69-88. 42 M. Landsberg and J. Rubin, “L.A. Unified Can Use Race-Based Formula for Admissions, Judge Rules.” Los Angeles Times, December 12, 2007.

Segregating California’s Future, May 2014 Civil Rights Project/Proyecto Derechos Civiles
19 | P a g e
actually got higher grades than those born in the U.S. The author concluded that “a process of
ghettoization takes place, in which the longer a family line remains in the large, segregated Mexican
American communities of the Los Angeles area, the more inward-grown they become and the less
inclined to acculturation and achievement in the Anglo culture.”43 He found that these students’
achievement level was significantly related to the percentage of white students in their schools. The
question was whether or not California was going to offer Latinos the same opportunities to enter the
mainstream that white newcomers had enjoyed.
There were repeated warnings of deepening inequality in California’s schools. A 1986 study of data
from the late 1970s found that, “by grade three, 81.4 percent of Hispanics and 84.5 percent of blacks
sampled are attending schools that are below the statewide average in achievement scores.”44 The
researchers found that 78 percent of black third graders and 58 percent of Hispanics were attending a
school that was in the lowest achievement quartile, which compared to 14 percent of whites and 27
percent of Asians.45 They found a significant relationship between students’ test scores and their social
isolation. They were able to identify a small number of successful segregated grade schools with a high
concentration of black and Latino students, but successful segregated high schools were almost
nonexistent.46 The authors concluded:
California Hispanic students, even in the earliest grades, are highly concentrated in segregated
schools where the average achievement level is seriously lower . . . The same pattern holds
through all grade levels . . . It means, of course, that a student of above-average potential in a
Hispanic neighborhood would be very likely to attend a school with less challenging classmates
and lower than average expectations than a similar Anglo student.
They suggested that this was “one of the key mechanisms by which educational inequality is perpetuated
and by which talented students are denied the opportunity for equal preparation for college.”47
A generation later, Patricia Gándara analyzed the racial concentration of students in schools as classified
by API scores, the state’s current rating system. She found that almost half of Asian students (49 percent) 43 W. L. Kimball, “Parent and Family Influences on Academic Achievement among Mexican-American Students,” unpublished doctoral dissertation, UCLA, 1968, pp. 217-220. 44 R. Espinosa and A. Ochoa, “Concentration of California Hispanic Students in Schools with Low Achievement: A Research Note,” American Journal of Education 95, no. l (1986): 80. 45 Espinosa and Ochoa, “Concentration of California Hispanic Students,” p. 81. 46 Espinosa and Ochoa, “Concentration of California Hispanic Students,” pp. 83-85. 47 Espinosa and Ochoa, “Concentration of California Hispanic Students,” p. 95.

Segregating California’s Future, May 2014 Civil Rights Project/Proyecto Derechos Civiles
20 | P a g e
and about 40 percent of whites are in the top two deciles of schools in the state in terms of API ratings,
as compared to only 12 percent of blacks and 9 percent of Latinos. Research over a half century has
shown that students’ academic success is significantly related to the success of the peer groups they
attend school with, therefore the fact that some racial and ethnic groups have 4 to 6 times more access to
the best high schools than others is a serious matter in a state where affirmative action college
admissions are illegal.
The consensus of nearly 60 years of social science research on the harm caused by school segregation is
that racially and socioeconomically isolated schools are strongly related to an array of factors that limit
educational opportunities and outcomes. These factors include less experienced and less qualified
teachers, high teacher turnover, less successful peer groups, and inadequate facilities and learning
materials. One recent longitudinal study showed that having a strong teacher in the elementary grades
had a long-lasting, positive impact on students’ lives, including lower teen pregnancy rates, a higher
level of college attendance, and higher earnings.48 Unfortunately, we also know that highly qualified and
experienced teachers are spread unevenly across schools and are much less likely to remain in
segregated or resegregating settings.49
Findings that the academic performance of classmates is strongly linked to educational outcomes for
poor students date back to the 1966 Coleman Report commissioned by the U.S. Congress. The central
conclusion of that report (and numerous follow-ups) was that the concentration of poverty in a school
influenced student achievement more than the poverty status of an individual student, although the latter
was also important. 50 This finding relates to whether high academic achievement, homework
48 R. Chetty, J. N. Friedman, and J. E. Rockoff, The Long-Term Impacts of Teachers: Teacher Value-Added and Student Outcomes in Adulthood, NBER working paper no. 17699. Cambridge, MA: National Bureau of Economic Research, 2011. Retrieved from http://obs.rc.fas.harvard.edu/chetty/value_added.pdf. 49 C. Clotfelter, H. Ladd, and J. Vigdor, “Who Teaches Whom? Race and the Distribution of Novice Teachers,” Economics of Education Review 24, no. 4 (2005): 377-392;S. Rivkin, E. Hanushek, and J. Kain, “Teachers, Schools, and Academic Achievement,” Econometrica, vol. 73, issue 2, (2005), pp. 417-458. Also see, for example, H. Lankford, S. Loeb, and J. Wyckoff, “Teacher Sorting and the Plight of Urban Schools: A Descriptive Analysis.” Educational Evaluation and Policy Analysis 24, no. 1 (2002): 37-62; S. Watson, Recruiting and Retaining Teachers: Keys to Improving the Philadelphia Public Schools. Philadelphia: Consortium for Policy Research in Education, 2001. In addition, one research study found that, in California schools, the percentage of unqualified teachers is 6.75 times higher in high-minority schools (more than 90 percent minority) than in low-minority schools (less than 30 percent minority). See L. Darling-Hammond, “Apartheid in American Education: How Opportunity Is Rationed to Children of Color in the United States.” In T. Johnson, J. E. Boyden, and W. J. Pittz, eds., Racial Profiling and Punishment in U.S. Public Schools. Oakland, CA: Applied Research Center, 2001, pp. 39-44. 50 G. Borman, and M. Dowling, “Schools and Inequality: A Multilevel Analysis of Coleman’s Equality of Educational Opportunity Data.” Teachers College Record 112, no. 5 (2010): 1201-1246.

Segregating California’s Future, May 2014 Civil Rights Project/Proyecto Derechos Civiles
21 | P a g e
completion, regular attendance, and attending college are normalized by peers.51 Schools serving low-
income and segregated neighborhoods have been shown to provide less challenging curricula than
schools in more affluent communities, which largely serve white and Asian students.52 High-stakes
testing has hurt minority-segregated schools, as it leads to a focus on learning rote skills and test-taking
strategies and often takes the place of creative, engaging teaching.53 By contrast, students in middle-
class schools normally have little trouble with high-stakes exams, so these schools and their teachers are
able to broaden the curriculum.
Segregated schools are also significantly less likely than more affluent schools to offer AP or honors-
level courses.54 Additional findings on expulsion rates, dropout rates, success in college, test scores, and
graduation rates underscore the negative impact of segregation. Student discipline is harsher and the
expulsion rate is much higher in minority-segregated schools than in those that are wealthier and
whiter.55 Dropout rates are also significantly higher in segregated and impoverished schools (nearly all
of the 2,000 U.S. schools considered “dropout factories” are doubly segregated by race and poverty),56
51 R. Kahlenberg, All Together Now: Creating Middle Class Schools through Public School Choice. Washington, DC: Brookings Institution Press, 2001. 52 R. W. Rumberger, and G. J. Palardy, “Does Segregation Still Matter? The Impact of Student Composition on Academic Achievement in High School.” Teachers College Record 107, no. 9 (2005): 1999-2045; C. M. Hoxby, “Peer Effects in the Classroom: Learning from Gender and Race Variation,” NBER working paper no. 7867. Cambridge, MA: National Bureau of Economic Research, 2000; J. W. Schofield, “Ability Grouping, Composition Effects, and the Achievement Gap.” In J. W. Schofield, ed., Migration Background, Minority-Group Membership and Academic Achievement Research Evidence from Social, Educational, and Development Psychology. Berlin, Germany: Social Science Research Center, 2006, pp. 67-95. 53 C. Knaus, “Still Segregated, Still Unequal: Analyzing the Impact of No Child Left Behind on African-American Students.” In National Urban League, ed., The State of Black America: Portrait of the Black Male. Silver Spring, MD: Beckham Publications Group, 2007, pp. 105-121. 54 G. Orfield and S. E. Eaton, Dismantling Desegregation: The Quiet Reversal of Brown v. Board of Education. New York: New Press, 1996; G. Orfield and C. Lee, Why Segregation Matters: Poverty and Educational Inequality. Cambridge, MA: The Civil Rights Project, 2005. 55 Exposure to draconian, “zero tolerance” discipline measures is linked to dropping out of school and subsequent entanglement with the criminal justice system, a very different trajectory than attending college and developing a career. Advancement Project and The Civil Rights Project, Opportunities Suspended: The Devastating Consequences of Zero Tolerance and School Discipline Policies. Cambridge, MA: The Civil Rights Project, 2000. Retrieved from http://civilrightsproject.ucla.edu/research/k-12-education/school-discipline/opportunities-suspended-the-devastating-consequences-of-zero-tolerance-and-school-discipline-policies/. 56 R. Balfanz and N. E. Legters, “Locating the Dropout Crisis: Which High Schools Produce the Nation’s Dropouts? In G. Orfield, ed., Dropouts in America: Confronting the Graduation Rate Crisis. Cambridge, MA: Harvard Education Press, 2004, pp. 57-84; C. Swanson, “Sketching a Portrait of Public High School Graduation: Who Graduates? Who Doesn’t?” In Orfield, Dropouts in America, pp. 13-40.
Segregating California’s Future, May 2014 Civil Rights Project/Proyecto Derechos Civiles
22 | P a g e
and research indicates that students who do graduate are less likely to be successful in college, even
after controlling for test scores.57 Segregation, in short, has a strong and lasting impact.58
Desegregated schools give students of all races the opportunity to learn and work with children from a
range of backgrounds. Such settings foster the critical thinking skills that are increasingly important in
today’s multiracial society, as they help students understand a variety of different perspectives.59
Integrated schools are also linked to a reduction in stereotyping,60 and students attending integrated
schools report a heightened ability to communicate and make friends across racial lines.61 Moreover,
desegregated schools are associated with minority student’ heightened academic achievement,62 with no
corresponding detrimental impact on white students.63 Black students who attend desegregated schools
are substantially more likely to graduate from high school and college, in part because they are exposed
to a challenging curriculum and the social networks that support such goals.64 Earnings and physical
well-being are also positively impacted: a recent study by a Berkeley economist found that black
57 E. Camburn, “College Completion among Students from High Schools Located in Large Metropolitan Areas.” American Journal of Education 98, no. 4 (1990): 551-569. 58 A. S. Wells and R. L. Crain, “Perpetuation Theory and the Long-Term Effects of School Desegregation. Review of Educational Research 64 (1994): 531-555; J. H. Braddock and J. McPartland, “Social-Psychological Processes That Perpetuate Racial Segregation: The Relationship between School and Employment Segregation.” Journal of Black Studies 19, no. 3 (1989): 267-289. 59 J. Schofield, “Review of Research on School Desegregation’s Impact on Elementary and Secondary School Students.” In J. A. Banks and C. A. M. Banks, eds., Handbook of Multicultural Education. New York: Macmillan, 1995, pp. 597–616. 60 R. Mickelson and M. Bottia, “Integrated Education and Mathematics Outcomes: A Synthesis of Social Science Research.” North Carolina Law Review 88 (2010): 993; T. Pettigrew and L. Tropp, “A Meta-Analytic Test of Intergroup Contact Theory.” Journal of Personality and Social Psychology 90, no. 5 (2006): 751-783; D. Ready and M. Silander, “School Racial and Ethnic Composition and Young Children’s Cognitive Development: Isolating Family, Neighborhood and School Influences.” In E. Frankenberg and E. DeBray, eds., Integrating Schools in a Changing Society: New Policies and Legal Options for a Multiracial Generation (pp. 91-113). Chapel Hill: The University of North Carolina Press, 2011, pp. 91-113. 61 M. Killen, D. Crystal, and M. Ruck, “The Social Developmental Benefits of Intergroup Contact among Children and Adolescents.” In E. Frankenberg and G. Orfield, eds., Lessons in Integration: Realizing the Promise of Racial Diversity in American Schools. Charlottesville: University of Virginia Press, 2007, pp. 31-56. 62 J. Braddock, “Looking Back: The Effects of Court-Ordered Desegregation.” In C. Smrekar and E. Goldring, eds., From the Courtroom to the Classroom: The Shifting Landscape of School Desegregation. Cambridge, MA: Harvard Education Press, 2009, pp. 3-18; R. Crain and R. Mahard, “The Effect of Research Methodology on Desegregation-Achievement Studies: A Meta-Analysis. American Journal of Sociology 88, no. 5 (1983): 839-854; J. Schofield, “Review of Research on School Desegregation’s Impact on Elementary and Secondary School Students.” In J. A. Banks and C. A. M. Banks, eds., Handbook of Multicultural Education. New York: Macmillan, 1995, pp. 597-616. 63 J. Hoschild and N. Scrovronick, The American Dream and the Public Schools. New York: Oxford University Press, 2004. 64 J. Guryan, “Desegregation and Black Dropout Rates.” The American Economic Review 94, no. 4 (2004): 919-943; J. E. Kaufman and J. Rosenbaum, “The Education and Employment of Low-Income Black Youth in White Suburbs.” Education Evaluation and Policy Analysis 14 (1992): 229-240.
Segregating California’s Future, May 2014 Civil Rights Project/Proyecto Derechos Civiles
23 | P a g e
students who attended desegregated schools for at least five years earned 25 percent more than their
counterparts in segregated schools. By middle age, the same group was also in far better health.65
Perhaps most important of all is evidence that school desegregation can have a perpetuating effect across
generations. Students of all races who attend integrated schools are more likely to seek out integrated
colleges, workplaces, and neighborhoods later in life, which in turn may provide integrated educational
opportunities for their own children.66
Of course these benefits are not automatic, and much depends on how diversity is handled within a
school. In 1954, Gordon Allport, a prominent Harvard social psychologist, suggested that four key
elements are necessary for positive contact across different racial groups.67 Allport theorized that all
group members need to be given equal status, that guidelines must be established for working
cooperatively, that group members need to work toward common goals, and that strong leadership that
is visibly supportive of intergroup relationship-building was necessary. Over the past 60-odd years,
Allport’s conditions have held up in hundreds of studies of diverse institutions across the world.68 This
does not mean that desegregation solves all problems of inequality, some of which are deeply rooted
outside the schools, or that segregated schools are not sometimes able to succeed on a number of these
dimensions, but it does mean that students are significantly more likely to succeed if they attend diverse
schools and white students experience no losses in achievement while gaining in terms of preparing to
live and work successfully in a multiracial society.
How Schools Become Segregated
Although often referred to as “de facto,” the segregation of Mexicans and the growing segregation of
black students in California after the large migration of the 1940s did not just happen, it was the product
of the discrimination found in virtually every city outside the South. This discrimination took many
forms: gerrymandering attendance boundaries to separate minority and white students, permitting white
65 R. C. Johnson and R. Schoeni, “The Influence of Early-Life Events on Human Capital, Health Status, and Labor Market Outcomes over the Life Course.” The B.E. Journal of Economic Analysis & Policy Advances 11, no. 3 (2011): 1-55. 66 R. Mickelson, “Exploring the School-Housing Nexus: A Synthesis of Social Science Evidence.” In P. Tegeler, ed., Finding Common Ground: Coordinating Housing and Education Policy to Promote Integration. Washington, DC: Poverty and Race Research Action Council, 2011, pp. 5-8; A. S. Wells and R. L. Crain, “Perpetuation Theory and the Long-Term Effects of School Desegregation.” Review of Educational Research 6 (1994): 531-555. 67 G. Allport, The Nature of Prejudice. Cambridge, MA: Addison-Wesley, 1954. 68 T. Pettigrew and L. Tropp, “A Meta-Analytic Test of Intergroup Contact Theory. Journal of Personality and Social Psychology 90, no. 5 (2006): 751-783.
Segregating California’s Future, May 2014 Civil Rights Project/Proyecto Derechos Civiles
24 | P a g e
students from areas with substantial nonwhite enrollment to transfer elsewhere, assigning teachers based
on race, concentrating inexperienced or un-credentialed teachers in minority schools, offering minority
students an unequal curriculum, segregating students within diverse schools through tracking and
assignment to special education, and many others.69 When housing was built for the poor, it was located
and tenanted to produce neighborhoods and schools that were intensely segregated by both race and
persistent poverty, forcing students to attend weak, segregated schools, even in the recent past.70
Housing and Schools. Housing segregation was a basic element causing school segregation. Housing
discrimination and developing separate communities for Mexican Americans and whites began early in
California’s cities, and African Americans were rigidly segregated. One study of racial change in Los
Angeles found that as soon as a neighborhood approached a 2 percent black population it would almost
always resegregate irreversibly. Since minorities were able to live only in limited zones, there was great
demand for housing in new areas opened up for black homeseekers and the practice in the real estate
business was to encourage whites to sell, often in a panic over racial change, and steering new white
homeseekers to other areas. Since U.S. families typically move every five or six years, this could
quickly change neighborhoods.71 A statistical study conducted for the Los Angeles Superior Court
during the Los Angeles desegregation trial in the l970s concluded that it took an average of seven years
from the time blacks first entered a classroom for a neighborhood school to resegregate.72 Racially
restrictive covenants that prohibited the sale of a home to blacks and others, including Mexicans and
Jews, were used extensively in California, which often left minorities facing legally enforceable
prohibitions that prevented them from buying a home in any surrounding community, even if a seller
were willing to make such a transaction. These covenants were fostered by federal mortgage policies,
and racial boundaries were often defended with violence and intimidation. Public housing and other
forms of subsidized housing were blocked within white areas and concentrated in ways that reinforced
and even intensified housing segregation.
69 G. Orfield, Must We Bus? Segregated Schools and National Policy. Washington, DC: Brookings Institution Press, 1978, pp. 19-22. 70 D. Pfeiffer, The Opportunity Illusion: Subsidized Housing and Failing Schools in California. Los Angeles: The Civil Rights Project/Proyecto Derechos Civiles, 2009. Retrieved from http://www.civilrightsproject.ucla.edu/research. 71 J. M. McQuiston, “Negro Residential Invasion in Los Angeles County,” unpublished doctoral dissertation, University of Chicago, 1969. 72 Report of Bernard Gifford to the Los Angeles Superior Court, 1979.
Segregating California’s Future, May 2014 Civil Rights Project/Proyecto Derechos Civiles
25 | P a g e
Although California has a self-image of being diverse and progressive, a referendum at the peak of the
civil rights movement in 1964 painted a much less positive picture. By a large majority, California
voters supported a proposition that wrote what would have been a permanent prohibition against a fair
housing law into the state constitution. One very active supporter of that proposition, Ronald Reagan,
who also fought the historic 1964 Civil Rights Act, became governor of California two years later. This
proposition was struck down only by a decision by the U.S. Supreme Court. Five more major
propositions limiting civil rights were adopted by California voters in the next three decades, two of
them limiting school desegregation and one blocking college integration through affirmative action
policies.
Historically, California’s black population has been much more segregated residentially than Latinos.
On a scale known as the dissimilarity index, in which absolute segregation by race is 100 and random
distribution of population among two groups is zero, the segregation between blacks and whites in Los
Angeles in 1960 was a very high 88, while the segregation between Hispanics (then measured by
Spanish surname) and whites was 57. Latinos and blacks were also highly segregated from each other at
a level of 76. In San Francisco, the Latino-white number was only 37 and the black-white number was
66.73 In 1980, Los Angeles was classified as hyper-segregated for African Americans, with an index of
81; the San Francisco-Oakland index was 72.74
The 2010 U.S. Census showed that Los Angeles is the most residentially segregated large metropolitan
area in the U.S. in terms of the even distribution of Latinos and whites. Three other California metro
areas—Salinas, Oxnard-Ventura, and Santa Ana-Anaheim-Irvine—were also in the top nine most
segregated in the country. Four of the nine most segregated areas were within the greater Los Angeles
megalopolis, followed closely by the Bakersfield-Delano region, the San Francisco-San Mateo area, and
the greater San Diego region. Los Angeles ranks among the nation’s most segregated large metropolitan
areas for Latinos, with a dissimilarity index of 63, up from 57 in 1980. Almost a half century since the
federal fair housing law was passed the level of segregation is getting worse, independently of
population changes. At the other end of the spectrum, the state’s least segregated metro areas were
Stockton, Modesto, and Sacramento. When looking at another measure—the level of isolation in the
73 K. Taeuber and A. Taeuber, Negroes in Cities, New York: Atheneum, 1969,, p. 67. 74 D. Massey and N. Denton, American Apartheid: Segregation and the Making of the American Underclass, Cambridge: Harvard Univ. Press, 1990

Segregating California’s Future, May 2014 Civil Rights Project/Proyecto Derechos Civiles
26 | P a g e
most heavily Latino neighborhoods—Salinas and Los Angeles were among the worst and Sacramento
was clearly the best.75
In 2010, California had only three of the nation’s 50 metro areas with the most black residents, but 16 of
the 50 most populated metro areas for Latinos and 10 of the top 25 for Asians.76 Segregation of African
Americans in metropolitan Los Angeles was by 2910 virtually the same as for Latinos, although blacks
were substantially less segregated in the Inland Empire Riverside-San Bernardino area. Blacks in Los
Angeles and Oakland, which are among the 50 U.S. metro areas with the largest black populations, had
far fewer black neighbors than most large metros elsewhere and African Americans living in Riverside-
San Bernardino had only 13 percent black neighbors, the second lowest.77 This reflects the large number
of Latino neighbors.
Housing segregation is a root cause of school segregation. Any long-term policy to foster increased and
lasting school integration must determine how to enforce fair housing and affordable housing policies
more effectively. Plans to avoid the kind of resegregation that now affects an increasing number of
suburban rings would be greatly facilitated by collaboration with municipal and housing agencies.78
California schools now face severe segregation in a state with segregated communities and no
significant state or federal policies pressing for integration of schools or housing. Our new study shows
the results of a history of half measures, mostly abandoned, on an issue that is clearly directly related to
educational opportunity in the state. In a state with excellent public universities, but with fiercely
competitive admissions, where few of the gains of California’s abundance go to those without colleges,
a separate and unequal system of public schools is a fundamental threat to its future.
75 J. R. Logan and B. Stults, “The Persistence of Segregation in the Metropolis: New Findings from the 2010 Census,” census brief prepared for Project US2010, 2011, pp. 12-16. Retrieved from http://www.s4.brown.edu/us2010. 76 Logan and Stults, “The Persistence of Segregation,” 77 Logan and Stults, “The Persistence of Segregation,” pp. 6-9. 78 G. Orfield and E. Frankenberg, The Resegregation of Suburban Schools: A Hidden Crisis in American Education. Cambridge, MA: Harvard Education Press, 2012.
Segregating California’s Future, May 2014 Civil Rights Project/Proyecto Derechos Civiles
27 | P a g e
Current Data on Segregation in California
California as a National Leader in Segregation
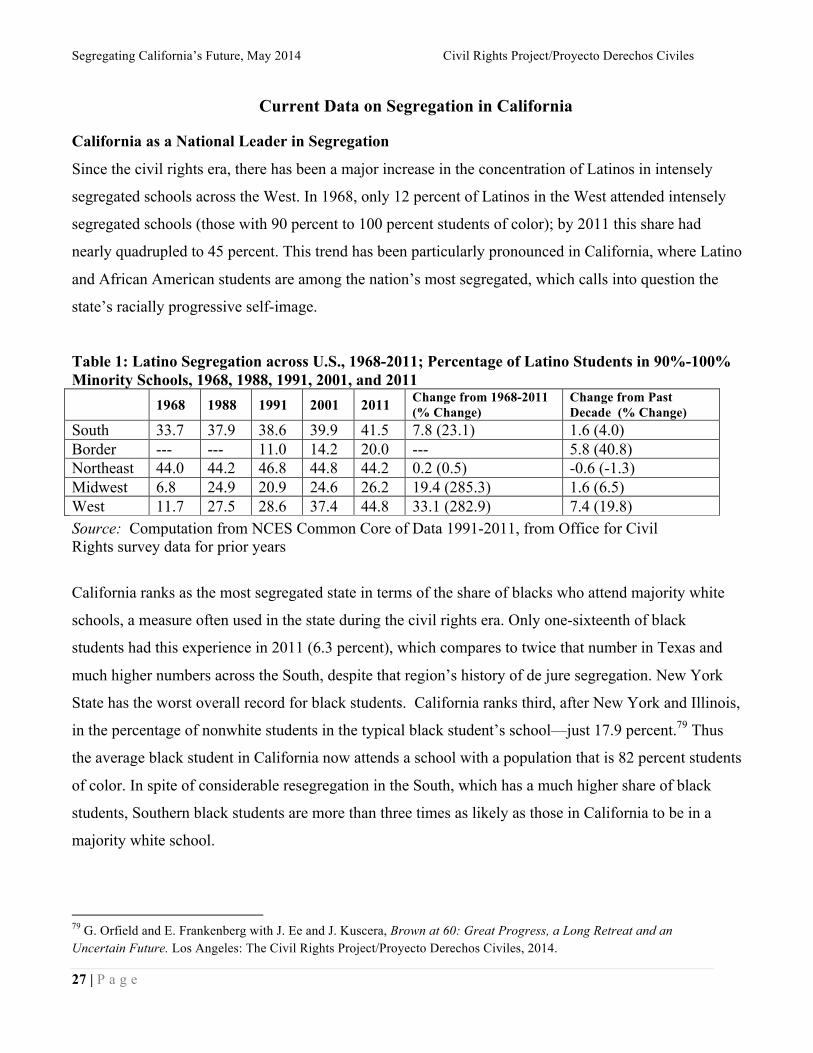
Since the civil rights era, there has been a major increase in the concentration of Latinos in intensely
segregated schools across the West. In 1968, only 12 percent of Latinos in the West attended intensely
segregated schools (those with 90 percent to 100 percent students of color); by 2011 this share had
nearly quadrupled to 45 percent. This trend has been particularly pronounced in California, where Latino
and African American students are among the nation’s most segregated, which calls into question the
state’s racially progressive self-image.
Table 1: Latino Segregation across U.S., 1968-2011; Percentage of Latino Students in 90%-100% Minority Schools, 1968, 1988, 1991, 2001, and 2011 1968 1988 1991 2001 2011 Change from 1968-2011
(% Change) Change from Past Decade (% Change)
South 33.7 37.9 38.6 39.9 41.5 7.8 (23.1) 1.6 (4.0) Border --- --- 11.0 14.2 20.0 --- 5.8 (40.8) Northeast 44.0 44.2 46.8 44.8 44.2 0.2 (0.5) -0.6 (-1.3) Midwest 6.8 24.9 20.9 24.6 26.2 19.4 (285.3) 1.6 (6.5) West 11.7 27.5 28.6 37.4 44.8 33.1 (282.9) 7.4 (19.8)
Source: Computation from NCES Common Core of Data 1991-2011, from Office for Civil Rights survey data for prior years
California ranks as the most segregated state in terms of the share of blacks who attend majority white
schools, a measure often used in the state during the civil rights era. Only one-sixteenth of black
students had this experience in 2011 (6.3 percent), which compares to twice that number in Texas and
much higher numbers across the South, despite that region’s history of de jure segregation. New York
State has the worst overall record for black students. California ranks third, after New York and Illinois,
in the percentage of nonwhite students in the typical black student’s school—just 17.9 percent.79 Thus
the average black student in California now attends a school with a population that is 82 percent students
of color. In spite of considerable resegregation in the South, which has a much higher share of black
students, Southern black students are more than three times as likely as those in California to be in a
majority white school.
79 G. Orfield and E. Frankenberg with J. Ee and J. Kuscera, Brown at 60: Great Progress, a Long Retreat and an Uncertain Future. Los Angeles: The Civil Rights Project/Proyecto Derechos Civiles, 2014.
Segregating California’s Future, May 2014 Civil Rights Project/Proyecto Derechos Civiles
28 | P a g e
The record for Latino students is worse. There has been an increase in the concentration of Latinos in
intensely segregated schools across the West. In 1968, only one-ninth of Latinos in the West attended
intensely segregated schools, that is, with 90 percent to 100 percent students of color. By 2011 this share
had nearly quadrupled to 45%.
A State Experiencing a Transformation
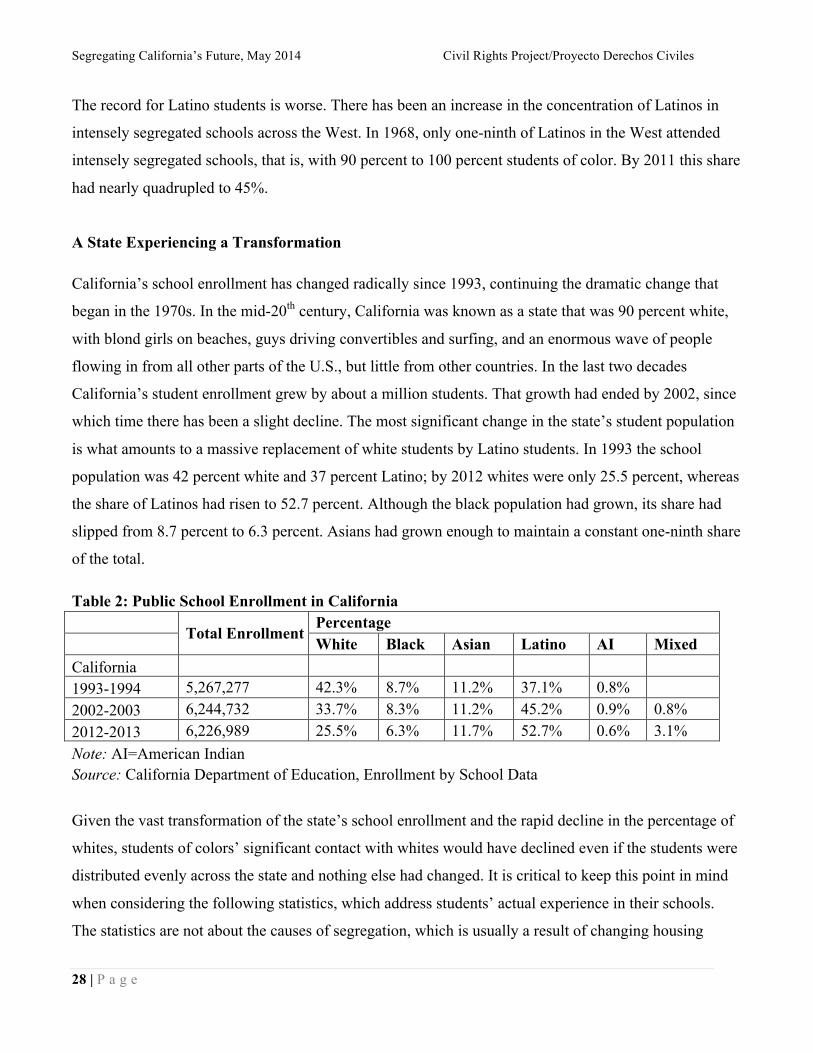
California’s school enrollment has changed radically since 1993, continuing the dramatic change that
began in the 1970s. In the mid-20th century, California was known as a state that was 90 percent white,
with blond girls on beaches, guys driving convertibles and surfing, and an enormous wave of people
flowing in from all other parts of the U.S., but little from other countries. In the last two decades
California’s student enrollment grew by about a million students. That growth had ended by 2002, since
which time there has been a slight decline. The most significant change in the state’s student population
is what amounts to a massive replacement of white students by Latino students. In 1993 the school
population was 42 percent white and 37 percent Latino; by 2012 whites were only 25.5 percent, whereas
the share of Latinos had risen to 52.7 percent. Although the black population had grown, its share had
slipped from 8.7 percent to 6.3 percent. Asians had grown enough to maintain a constant one-ninth share
of the total.
Table 2: Public School Enrollment in California Total Enrollment
Percentage White Black Asian Latino AI Mixed California 1993-1994 5,267,277 42.3% 8.7% 11.2% 37.1% 0.8% 2002-2003 6,244,732 33.7% 8.3% 11.2% 45.2% 0.9% 0.8% 2012-2013 6,226,989 25.5% 6.3% 11.7% 52.7% 0.6% 3.1% Note: AI=American Indian
Source: California Department of Education, Enrollment by School Data
Given the vast transformation of the state’s school enrollment and the rapid decline in the percentage of
whites, students of colors’ significant contact with whites would have declined even if the students were
distributed evenly across the state and nothing else had changed. It is critical to keep this point in mind
when considering the following statistics, which address students’ actual experience in their schools.
The statistics are not about the causes of segregation, which is usually a result of changing housing
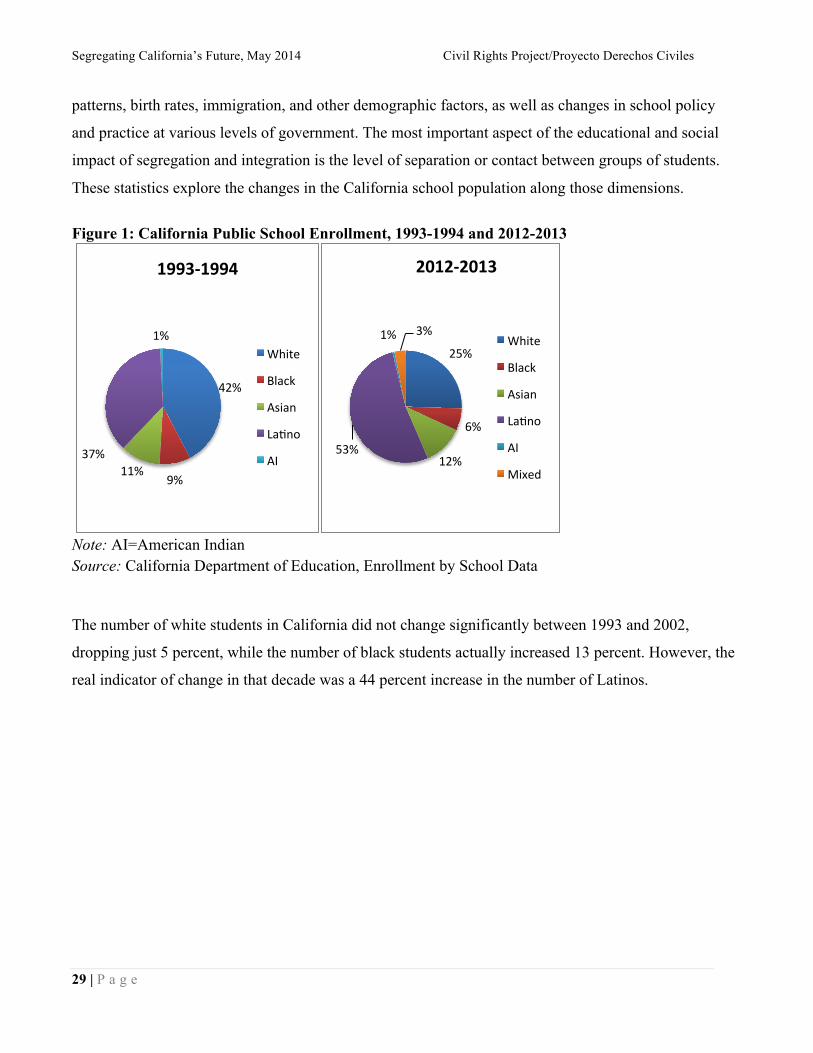
Segregating California’s Future, May 2014 Civil Rights Project/Proyecto Derechos Civiles
29 | P a g e
patterns, birth rates, immigration, and other demographic factors, as well as changes in school policy
and practice at various levels of government. The most important aspect of the educational and social
impact of segregation and integration is the level of separation or contact between groups of students.
These statistics explore the changes in the California school population along those dimensions.
Figure 1: California Public School Enrollment, 1993-1994 and 2012-2013
Note: AI=American Indian
Source: California Department of Education, Enrollment by School Data
The number of white students in California did not change significantly between 1993 and 2002,
dropping just 5 percent, while the number of black students actually increased 13 percent. However, the
real indicator of change in that decade was a 44 percent increase in the number of Latinos.
42%
9% 11%
37%
1%
1993-‐1994
White
Black
Asian
La7no
AI
25%
6%
12% 53%
1% 3%
2012-‐2013
White
Black
Asian
La7no
AI
Mixed
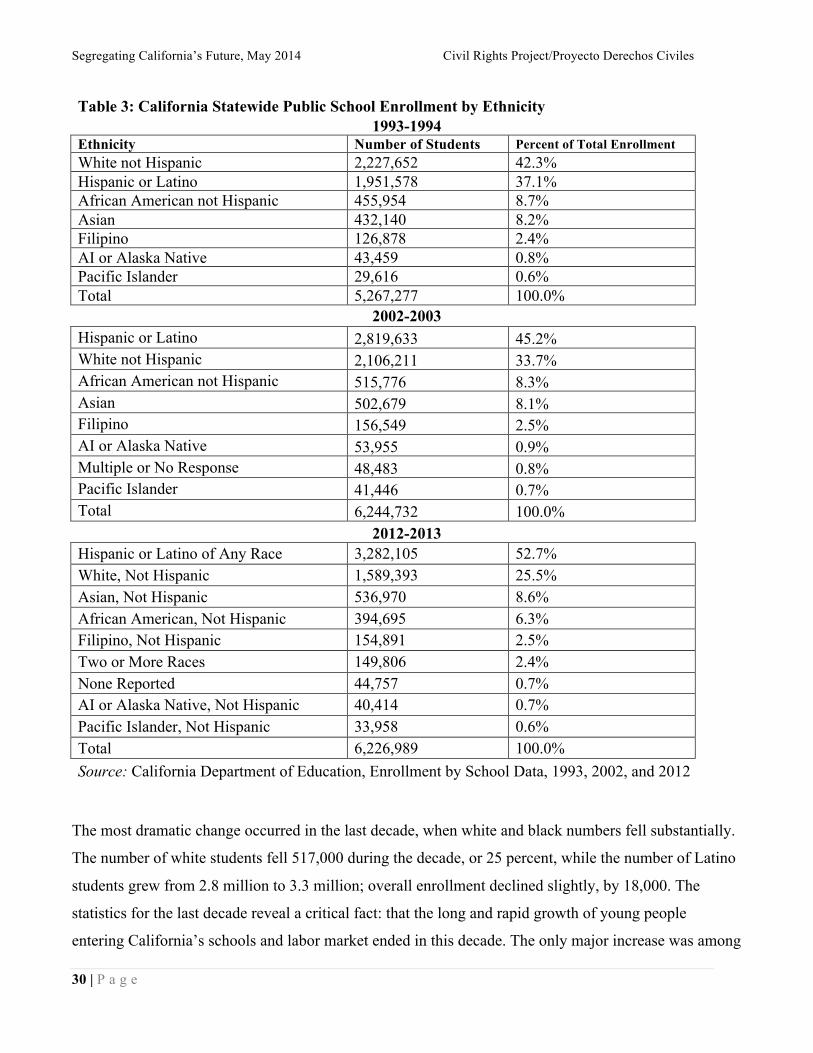
Segregating California’s Future, May 2014 Civil Rights Project/Proyecto Derechos Civiles
30 | P a g e
Table 3: California Statewide Public School Enrollment by Ethnicity 1993-1994
Ethnicity Number of Students Percent of Total Enrollment White not Hispanic 2,227,652 42.3% Hispanic or Latino 1,951,578 37.1% African American not Hispanic 455,954 8.7% Asian 432,140 8.2% Filipino 126,878 2.4% AI or Alaska Native 43,459 0.8% Pacific Islander 29,616 0.6% Total 5,267,277 100.0%
2002-2003 Hispanic or Latino 2,819,633 45.2% White not Hispanic 2,106,211 33.7% African American not Hispanic 515,776 8.3% Asian 502,679 8.1% Filipino 156,549 2.5% AI or Alaska Native 53,955 0.9% Multiple or No Response 48,483 0.8% Pacific Islander 41,446 0.7% Total 6,244,732 100.0%
2012-2013 Hispanic or Latino of Any Race 3,282,105 52.7% White, Not Hispanic 1,589,393 25.5% Asian, Not Hispanic 536,970 8.6% African American, Not Hispanic 394,695 6.3% Filipino, Not Hispanic 154,891 2.5% Two or More Races 149,806 2.4% None Reported 44,757 0.7% AI or Alaska Native, Not Hispanic 40,414 0.7% Pacific Islander, Not Hispanic 33,958 0.6% Total 6,226,989 100.0% Source: California Department of Education, Enrollment by School Data, 1993, 2002, and 2012
The most dramatic change occurred in the last decade, when white and black numbers fell substantially.
The number of white students fell 517,000 during the decade, or 25 percent, while the number of Latino
students grew from 2.8 million to 3.3 million; overall enrollment declined slightly, by 18,000. The
statistics for the last decade reveal a critical fact: that the long and rapid growth of young people
entering California’s schools and labor market ended in this decade. The only major increase was among
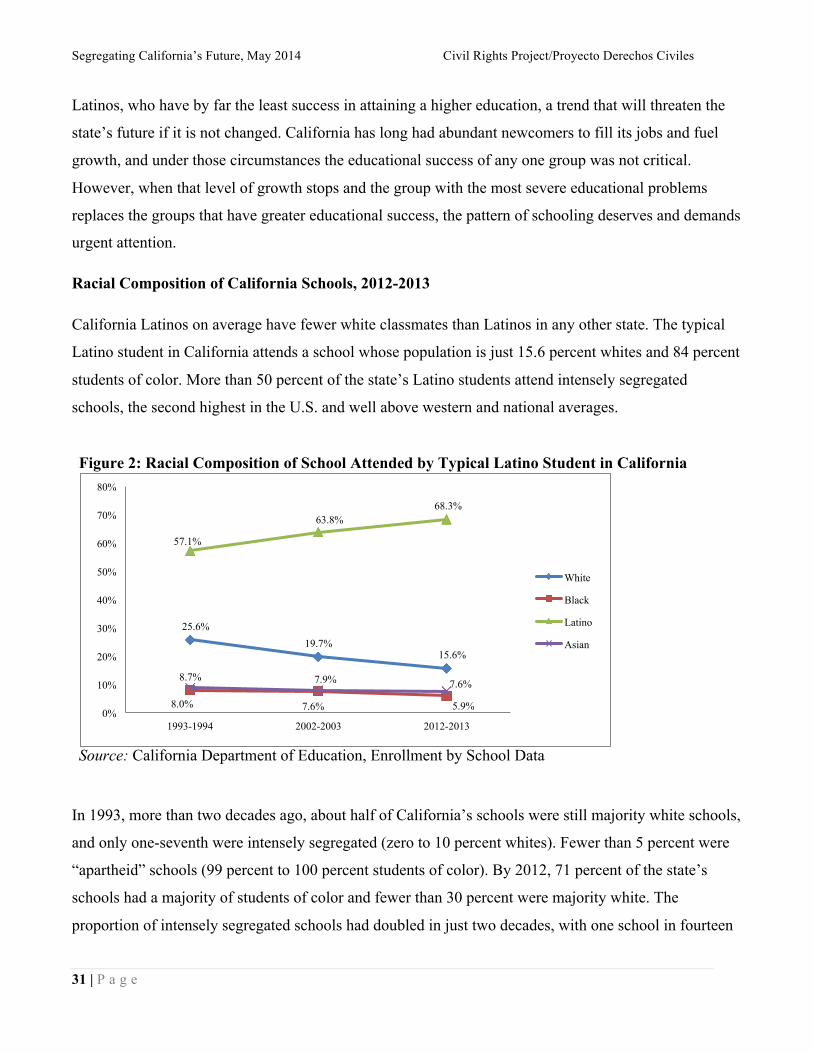
Segregating California’s Future, May 2014 Civil Rights Project/Proyecto Derechos Civiles
31 | P a g e
Latinos, who have by far the least success in attaining a higher education, a trend that will threaten the
state’s future if it is not changed. California has long had abundant newcomers to fill its jobs and fuel
growth, and under those circumstances the educational success of any one group was not critical.
However, when that level of growth stops and the group with the most severe educational problems
replaces the groups that have greater educational success, the pattern of schooling deserves and demands
urgent attention.
Racial Composition of California Schools, 2012-2013
California Latinos on average have fewer white classmates than Latinos in any other state. The typical
Latino student in California attends a school whose population is just 15.6 percent whites and 84 percent
students of color. More than 50 percent of the state’s Latino students attend intensely segregated
schools, the second highest in the U.S. and well above western and national averages.
Figure 2: Racial Composition of School Attended by Typical Latino Student in California
Source: California Department of Education, Enrollment by School Data
In 1993, more than two decades ago, about half of California’s schools were still majority white schools,
and only one-seventh were intensely segregated (zero to 10 percent whites). Fewer than 5 percent were
“apartheid” schools (99 percent to 100 percent students of color). By 2012, 71 percent of the state’s
schools had a majority of students of color and fewer than 30 percent were majority white. The
proportion of intensely segregated schools had doubled in just two decades, with one school in fourteen
25.6% 19.7%
15.6%
8.0% 7.6% 5.9%
57.1%
63.8% 68.3%
8.7% 7.9% 7.6%
0%
10%
20%
30%
40%
50%
60%
70%
80%
1993-1994 2002-2003 2012-2013
White
Black
Latino
Asian
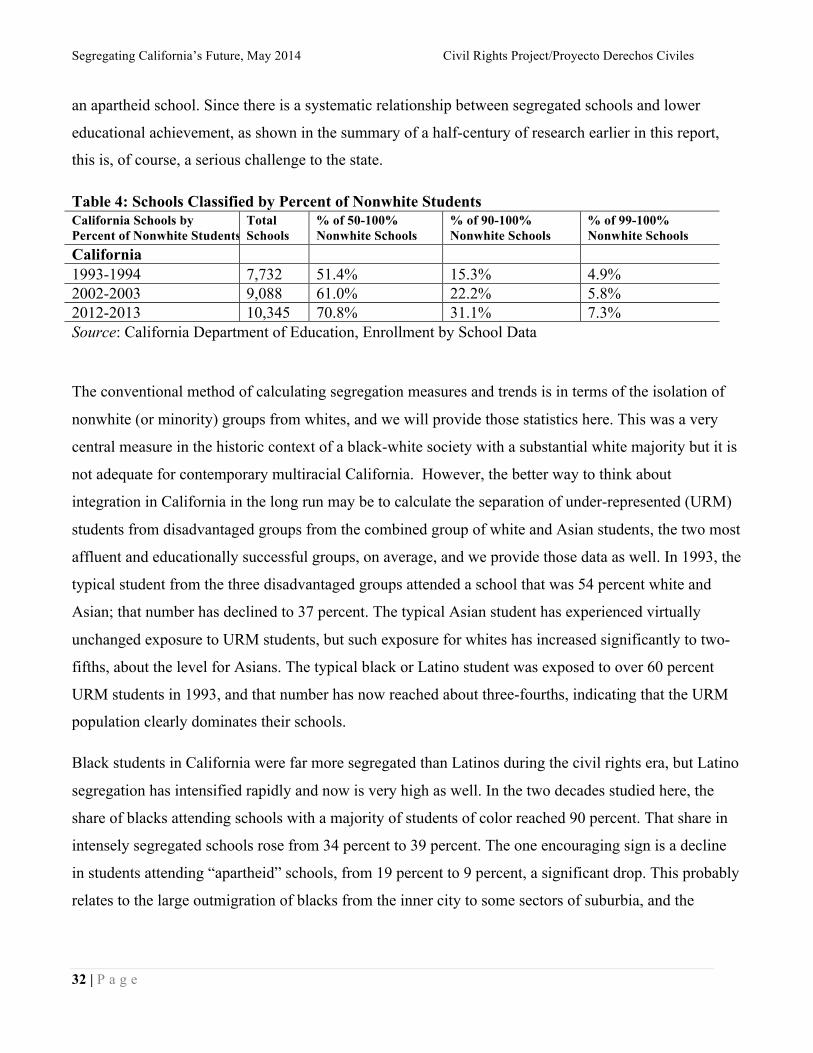
Segregating California’s Future, May 2014 Civil Rights Project/Proyecto Derechos Civiles
32 | P a g e
an apartheid school. Since there is a systematic relationship between segregated schools and lower
educational achievement, as shown in the summary of a half-century of research earlier in this report,
this is, of course, a serious challenge to the state.
Table 4: Schools Classified by Percent of Nonwhite Students California Schools by Percent of Nonwhite Students
Total Schools
% of 50-100% Nonwhite Schools
% of 90-100% Nonwhite Schools
% of 99-100% Nonwhite Schools
California 1993-1994 7,732 51.4% 15.3% 4.9% 2002-2003 9,088 61.0% 22.2% 5.8% 2012-2013 10,345 70.8% 31.1% 7.3% Source: California Department of Education, Enrollment by School Data
The conventional method of calculating segregation measures and trends is in terms of the isolation of
nonwhite (or minority) groups from whites, and we will provide those statistics here. This was a very
central measure in the historic context of a black-white society with a substantial white majority but it is
not adequate for contemporary multiracial California. However, the better way to think about
integration in California in the long run may be to calculate the separation of under-represented (URM)
students from disadvantaged groups from the combined group of white and Asian students, the two most
affluent and educationally successful groups, on average, and we provide those data as well. In 1993, the
typical student from the three disadvantaged groups attended a school that was 54 percent white and
Asian; that number has declined to 37 percent. The typical Asian student has experienced virtually
unchanged exposure to URM students, but such exposure for whites has increased significantly to two-
fifths, about the level for Asians. The typical black or Latino student was exposed to over 60 percent
URM students in 1993, and that number has now reached about three-fourths, indicating that the URM
population clearly dominates their schools.
Black students in California were far more segregated than Latinos during the civil rights era, but Latino
segregation has intensified rapidly and now is very high as well. In the two decades studied here, the
share of blacks attending schools with a majority of students of color reached 90 percent. That share in
intensely segregated schools rose from 34 percent to 39 percent. The one encouraging sign is a decline
in students attending “apartheid” schools, from 19 percent to 9 percent, a significant drop. This probably
relates to the large outmigration of blacks from the inner city to some sectors of suburbia, and the
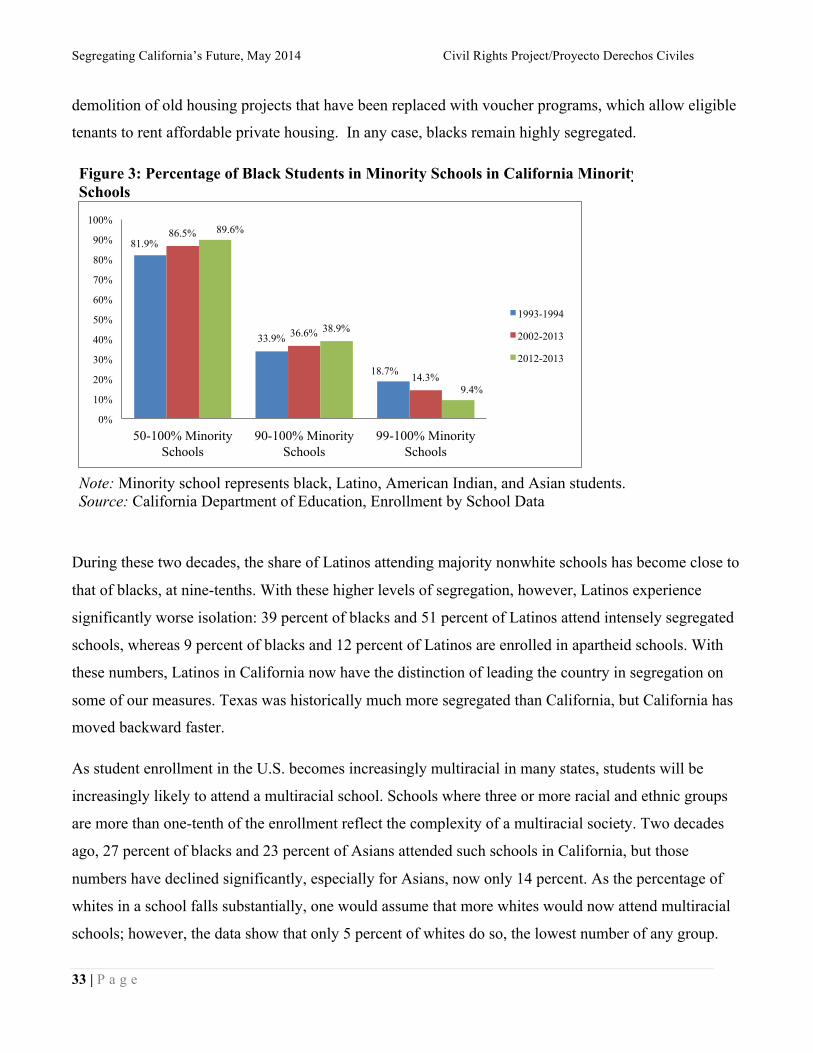
Segregating California’s Future, May 2014 Civil Rights Project/Proyecto Derechos Civiles
33 | P a g e
demolition of old housing projects that have been replaced with voucher programs, which allow eligible
tenants to rent affordable private housing. In any case, blacks remain highly segregated.
Figure 3: Percentage of Black Students in Minority Schools in California Minority Schools
Note: Minority school represents black, Latino, American Indian, and Asian students. Source: California Department of Education, Enrollment by School Data
During these two decades, the share of Latinos attending majority nonwhite schools has become close to
that of blacks, at nine-tenths. With these higher levels of segregation, however, Latinos experience
significantly worse isolation: 39 percent of blacks and 51 percent of Latinos attend intensely segregated
schools, whereas 9 percent of blacks and 12 percent of Latinos are enrolled in apartheid schools. With
these numbers, Latinos in California now have the distinction of leading the country in segregation on
some of our measures. Texas was historically much more segregated than California, but California has
moved backward faster.
As student enrollment in the U.S. becomes increasingly multiracial in many states, students will be
increasingly likely to attend a multiracial school. Schools where three or more racial and ethnic groups
are more than one-tenth of the enrollment reflect the complexity of a multiracial society. Two decades
ago, 27 percent of blacks and 23 percent of Asians attended such schools in California, but those
numbers have declined significantly, especially for Asians, now only 14 percent. As the percentage of
whites in a school falls substantially, one would assume that more whites would now attend multiracial
schools; however, the data show that only 5 percent of whites do so, the lowest number of any group.
81.9%
33.9%
18.7%
86.5%
36.6%
14.3%
89.6%
38.9%
9.4%
0%
10%
20%
30%
40%
50%
60%
70%
80%
90%
100%
50-100% Minority Schools
90-100% Minority Schools
99-100% Minority Schools
1993-1994
2002-2013
2012-2013
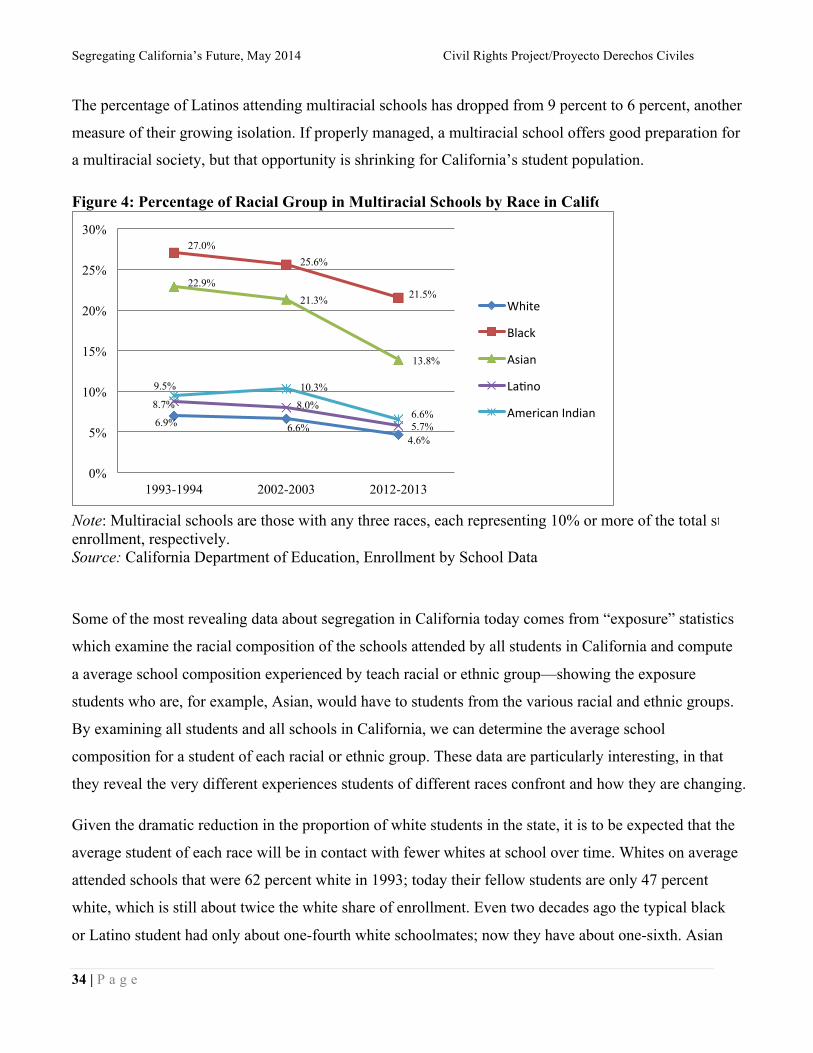
Segregating California’s Future, May 2014 Civil Rights Project/Proyecto Derechos Civiles
34 | P a g e
The percentage of Latinos attending multiracial schools has dropped from 9 percent to 6 percent, another
measure of their growing isolation. If properly managed, a multiracial school offers good preparation for
a multiracial society, but that opportunity is shrinking for California’s student population.
Figure 4: Percentage of Racial Group in Multiracial Schools by Race in California
Note: Multiracial schools are those with any three races, each representing 10% or more of the total student enrollment, respectively. Source: California Department of Education, Enrollment by School Data
Some of the most revealing data about segregation in California today comes from “exposure” statistics
which examine the racial composition of the schools attended by all students in California and compute
a average school composition experienced by teach racial or ethnic group—showing the exposure
students who are, for example, Asian, would have to students from the various racial and ethnic groups.
By examining all students and all schools in California, we can determine the average school
composition for a student of each racial or ethnic group. These data are particularly interesting, in that
they reveal the very different experiences students of different races confront and how they are changing.
Given the dramatic reduction in the proportion of white students in the state, it is to be expected that the
average student of each race will be in contact with fewer whites at school over time. Whites on average
attended schools that were 62 percent white in 1993; today their fellow students are only 47 percent
white, which is still about twice the white share of enrollment. Even two decades ago the typical black
or Latino student had only about one-fourth white schoolmates; now they have about one-sixth. Asian
6.9% 6.6% 4.6%
27.0% 25.6%
21.5% 22.9%
21.3%
13.8%
8.7% 8.0%
5.7%
9.5% 10.3%
6.6%
0%
5%
10%
15%
20%
25%
30%
1993-1994 2002-2003 2012-2013
White
Black
Asian
La7no
American Indian
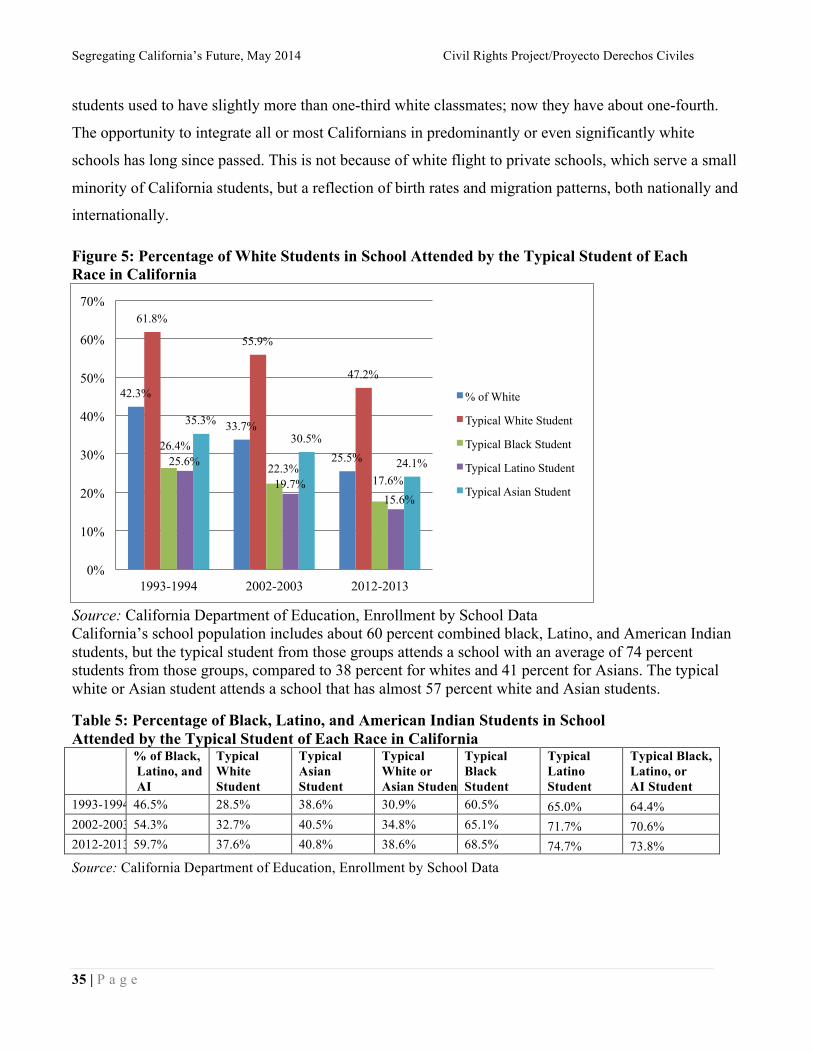
Segregating California’s Future, May 2014 Civil Rights Project/Proyecto Derechos Civiles
35 | P a g e
students used to have slightly more than one-third white classmates; now they have about one-fourth.
The opportunity to integrate all or most Californians in predominantly or even significantly white
schools has long since passed. This is not because of white flight to private schools, which serve a small
minority of California students, but a reflection of birth rates and migration patterns, both nationally and
internationally.
Figure 5: Percentage of White Students in School Attended by the Typical Student of Each Race in California
Source: California Department of Education, Enrollment by School Data California’s school population includes about 60 percent combined black, Latino, and American Indian students, but the typical student from those groups attends a school with an average of 74 percent students from those groups, compared to 38 percent for whites and 41 percent for Asians. The typical white or Asian student attends a school that has almost 57 percent white and Asian students.
Table 5: Percentage of Black, Latino, and American Indian Students in School Attended by the Typical Student of Each Race in California
% of Black, Latino, and AI
Typical White Student
Typical Asian Student
Typical White or Asian Student
Typical Black Student
Typical Latino Student
Typical Black, Latino, or AI Student
1993-1994 46.5% 28.5% 38.6% 30.9% 60.5% 65.0% 64.4% 2002-2003 54.3% 32.7% 40.5% 34.8% 65.1% 71.7% 70.6% 2012-2013 59.7% 37.6% 40.8% 38.6% 68.5% 74.7% 73.8%
Source: California Department of Education, Enrollment by School Data
42.3%
33.7%
25.5%
61.8%
55.9%
47.2%
26.4%
22.3% 17.6%
25.6%
19.7% 15.6%
35.3% 30.5%
24.1%
0%
10%
20%
30%
40%
50%
60%
70%
1993-1994 2002-2003 2012-2013
% of White
Typical White Student
Typical Black Student
Typical Latino Student
Typical Asian Student
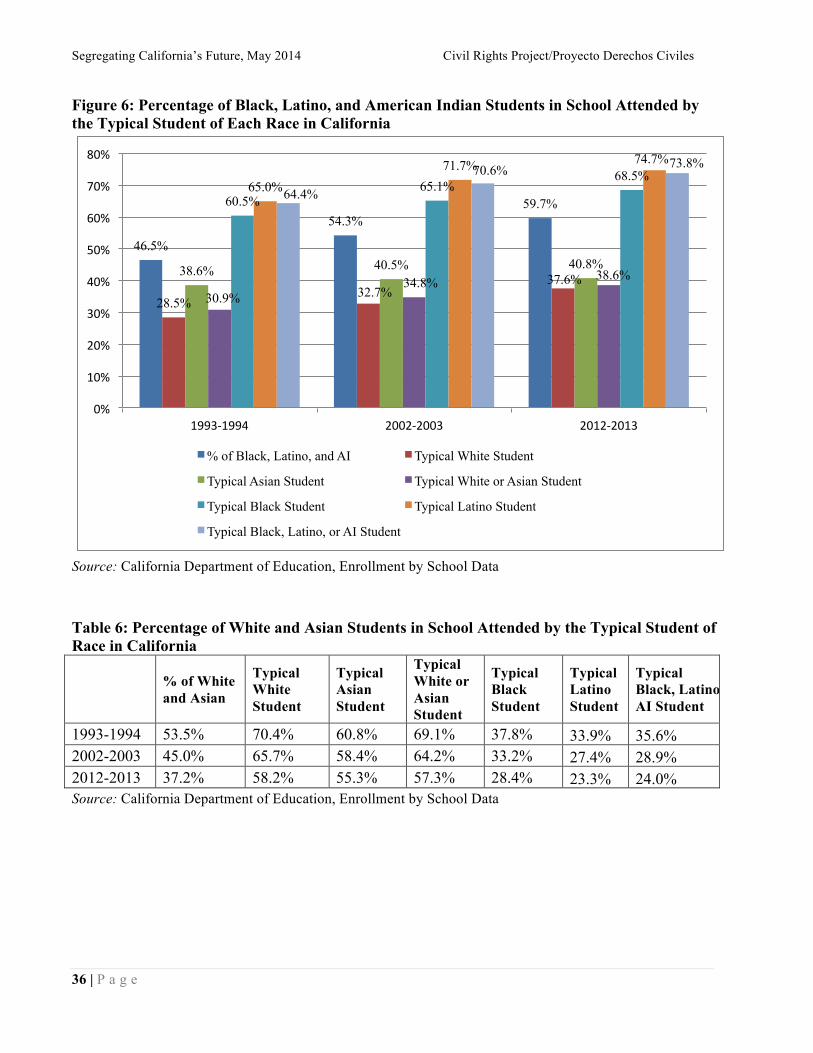
Segregating California’s Future, May 2014 Civil Rights Project/Proyecto Derechos Civiles
36 | P a g e
Figure 6: Percentage of Black, Latino, and American Indian Students in School Attended by the Typical Student of Each Race in California
Source: California Department of Education, Enrollment by School Data
Table 6: Percentage of White and Asian Students in School Attended by the Typical Student of Each Race in California
% of White and Asian
Typical White Student
Typical Asian Student
Typical White or Asian Student
Typical Black Student
Typical Latino Student
Typical Black, Latino, or AI Student
1993-1994 53.5% 70.4% 60.8% 69.1% 37.8% 33.9% 35.6% 2002-2003 45.0% 65.7% 58.4% 64.2% 33.2% 27.4% 28.9% 2012-2013 37.2% 58.2% 55.3% 57.3% 28.4% 23.3% 24.0% Source: California Department of Education, Enrollment by School Data
46.5%
54.3% 59.7%
28.5% 32.7%
37.6% 38.6% 40.5% 40.8%
30.9% 34.8% 38.6%
60.5% 65.1%
68.5% 65.0%
71.7% 74.7%
64.4%
70.6% 73.8%
0%
10%
20%
30%
40%
50%
60%
70%
80%
1993-‐1994 2002-‐2003 2012-‐2013
% of Black, Latino, and AI Typical White Student
Typical Asian Student Typical White or Asian Student
Typical Black Student Typical Latino Student
Typical Black, Latino, or AI Student
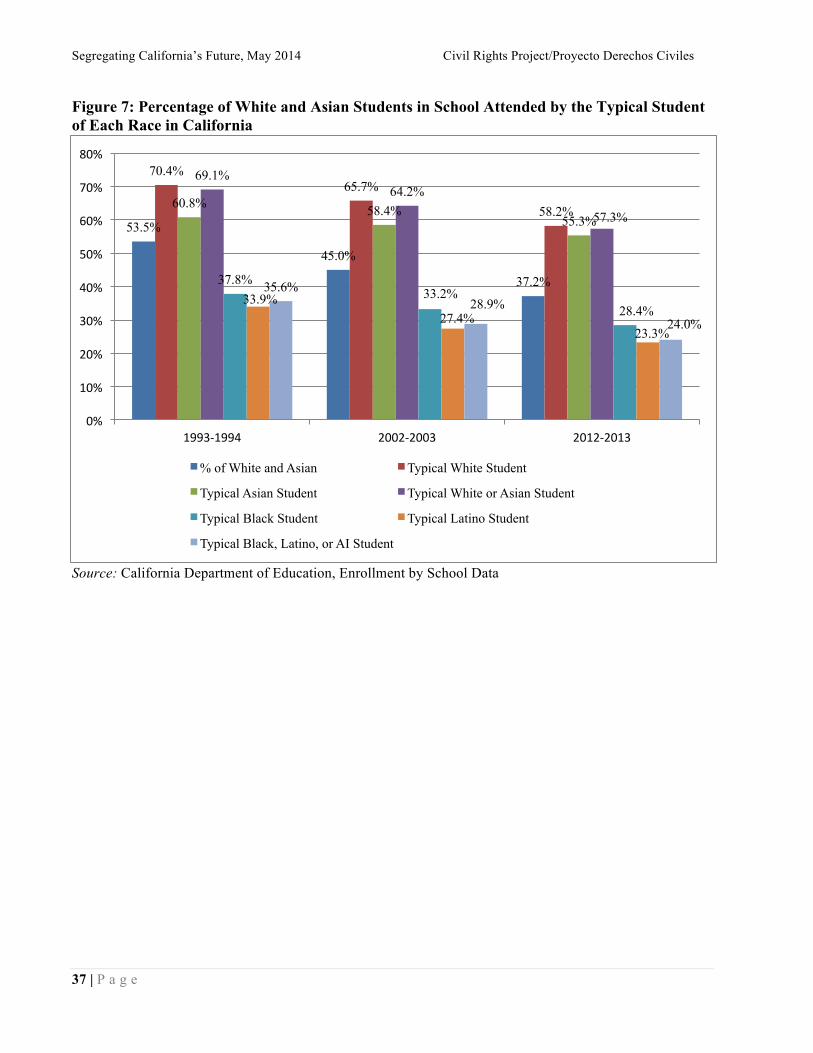
Segregating California’s Future, May 2014 Civil Rights Project/Proyecto Derechos Civiles
37 | P a g e
Figure 7: Percentage of White and Asian Students in School Attended by the Typical Student of Each Race in California
Source: California Department of Education, Enrollment by School Data
53.5%
45.0%
37.2%
70.4% 65.7%
58.2% 60.8% 58.4% 55.3%
69.1% 64.2%
57.3%
37.8% 33.2%
28.4% 33.9%
27.4% 23.3%
35.6% 28.9%
24.0%
0%
10%
20%
30%
40%
50%
60%
70%
80%
1993-‐1994 2002-‐2003 2012-‐2013
% of White and Asian Typical White Student
Typical Asian Student Typical White or Asian Student
Typical Black Student Typical Latino Student
Typical Black, Latino, or AI Student
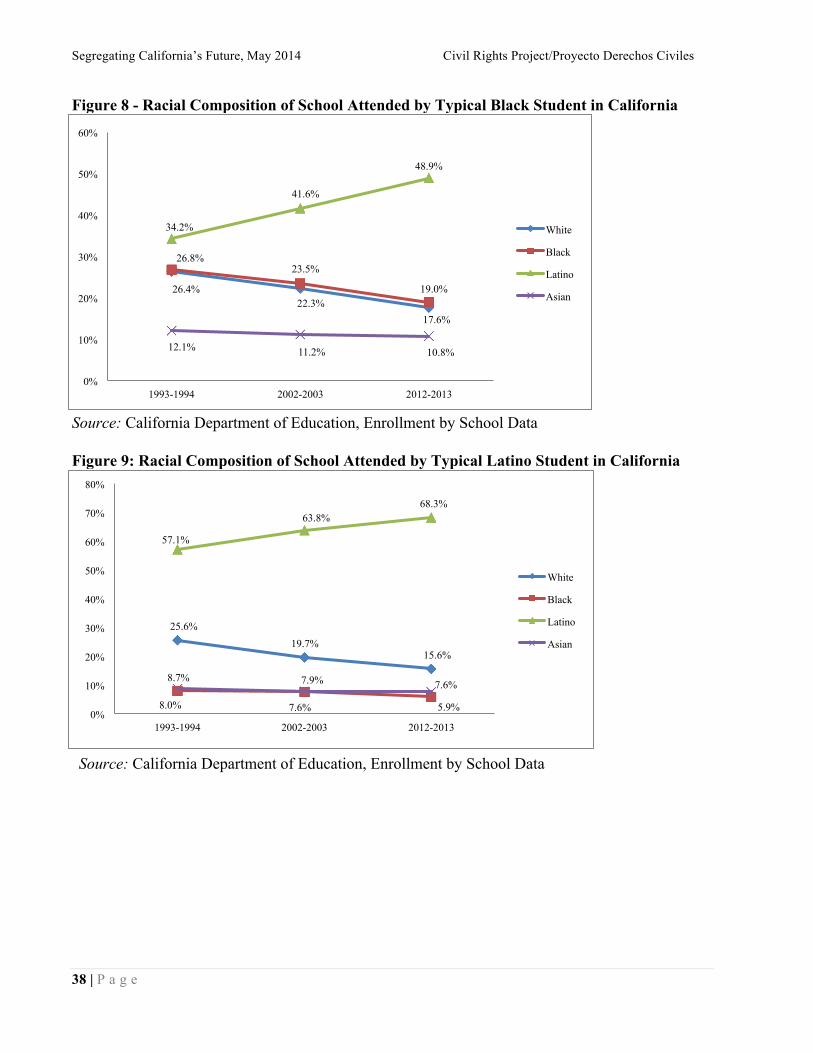
Segregating California’s Future, May 2014 Civil Rights Project/Proyecto Derechos Civiles
38 | P a g e
Figure 8 - Racial Composition of School Attended by Typical Black Student in California
Source: California Department of Education, Enrollment by School Data Figure 9: Racial Composition of School Attended by Typical Latino Student in California
Source: California Department of Education, Enrollment by School Data
26.4% 22.3%
17.6%
26.8% 23.5%
19.0%
34.2%
41.6%
48.9%
12.1% 11.2% 10.8%
0%
10%
20%
30%
40%
50%
60%
1993-1994 2002-2003 2012-2013
White
Black
Latino
Asian
25.6% 19.7%
15.6%
8.0% 7.6% 5.9%
57.1%
63.8% 68.3%
8.7% 7.9% 7.6%
0%
10%
20%
30%
40%
50%
60%
70%
80%
1993-1994 2002-2003 2012-2013
White
Black
Latino
Asian
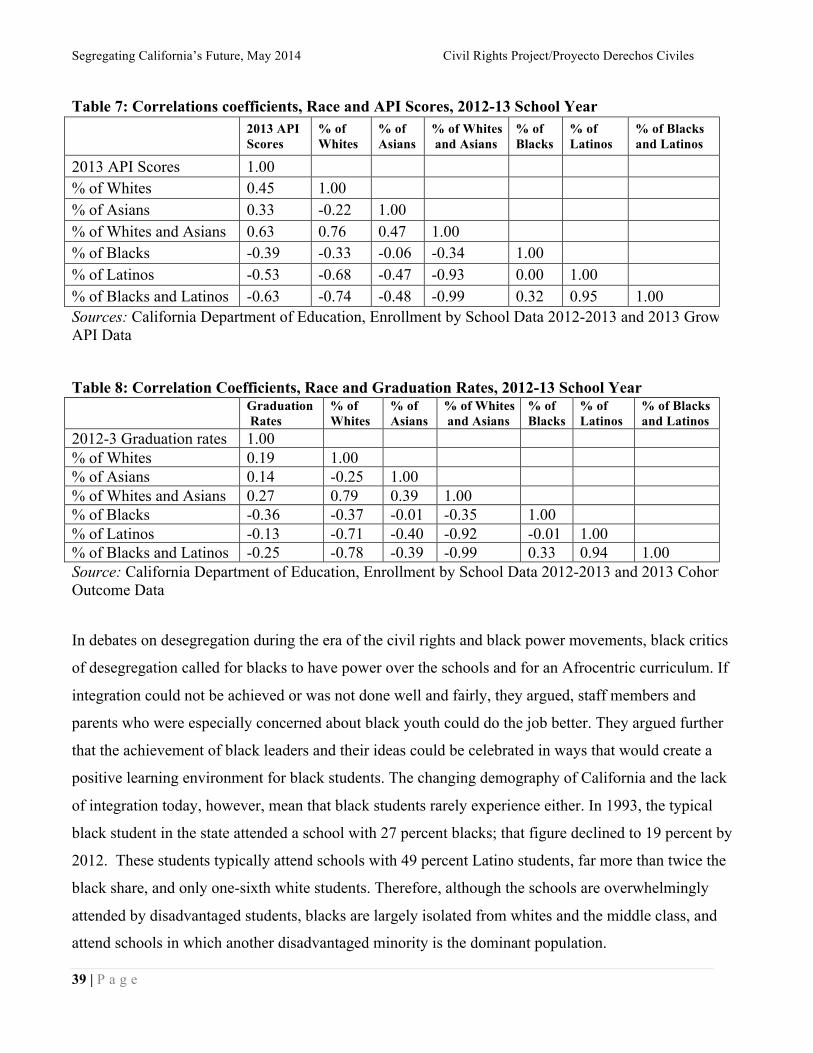
Segregating California’s Future, May 2014 Civil Rights Project/Proyecto Derechos Civiles
39 | P a g e
Table 7: Correlations coefficients, Race and API Scores, 2012-13 School Year
2013 API Scores
% of Whites
% of Asians
% of Whites and Asians
% of Blacks
% of Latinos
% of Blacks and Latinos
2013 API Scores 1.00 % of Whites 0.45 1.00 % of Asians 0.33 -0.22 1.00 % of Whites and Asians 0.63 0.76 0.47 1.00 % of Blacks -0.39 -0.33 -0.06 -0.34 1.00 % of Latinos -0.53 -0.68 -0.47 -0.93 0.00 1.00 % of Blacks and Latinos -0.63 -0.74 -0.48 -0.99 0.32 0.95 1.00 Sources: California Department of Education, Enrollment by School Data 2012-2013 and 2013 Growth API Data
Table 8: Correlation Coefficients, Race and Graduation Rates, 2012-13 School Year Graduation
Rates % of Whites
% of Asians
% of Whites and Asians
% of Blacks
% of Latinos
% of Blacks and Latinos
2012-3 Graduation rates 1.00 % of Whites 0.19 1.00 % of Asians 0.14 -0.25 1.00 % of Whites and Asians 0.27 0.79 0.39 1.00 % of Blacks -0.36 -0.37 -0.01 -0.35 1.00 % of Latinos -0.13 -0.71 -0.40 -0.92 -0.01 1.00 % of Blacks and Latinos -0.25 -0.78 -0.39 -0.99 0.33 0.94 1.00 Source: California Department of Education, Enrollment by School Data 2012-2013 and 2013 Cohort Outcome Data
In debates on desegregation during the era of the civil rights and black power movements, black critics
of desegregation called for blacks to have power over the schools and for an Afrocentric curriculum. If
integration could not be achieved or was not done well and fairly, they argued, staff members and
parents who were especially concerned about black youth could do the job better. They argued further
that the achievement of black leaders and their ideas could be celebrated in ways that would create a
positive learning environment for black students. The changing demography of California and the lack
of integration today, however, mean that black students rarely experience either. In 1993, the typical
black student in the state attended a school with 27 percent blacks; that figure declined to 19 percent by
2012. These students typically attend schools with 49 percent Latino students, far more than twice the
black share, and only one-sixth white students. Therefore, although the schools are overwhelmingly
attended by disadvantaged students, blacks are largely isolated from whites and the middle class, and
attend schools in which another disadvantaged minority is the dominant population.
Segregating California’s Future, May 2014 Civil Rights Project/Proyecto Derechos Civiles
40 | P a g e
The pattern for the typical Latino student is very different. Latinos now attend schools that are on average
more than two-thirds Latino, making them the most isolated group in California schools. With an average
of one-sixth white students and small fractions of blacks and Asians, these schools are severely isolated.
When we look at the relationship between a school’s API scores and its share of white students, we find
a strong positive .45 correlation, indicating that a school with more white students tends to have higher
API scores. As for the relationship between the percentage of Asians and the API scores, there is a
moderate .33 correlation, but it is also positive. When we add the shares of whites and Asians in a school,
there is a stronger .63 correlation. For Latinos, we found a -.39 negative correlation. The percentage of
African Americans is strongly related to the API scores in a negative direction, at a minus .53. When we
combine African Americans and Latinos, the correlation becomes stronger and is still negative, at -.63.
The result shows that API scores, California’s leading academic achievement index, is strongly
associated with the percentage of students from specific racial and ethnic groups who attend a school.
When we add the two more advantaged or the two less academically successful groups together, since
they tend to be disproportionately in the same schools the relationship becomes more powerful.
Graduation rates, another indicator of academic achievement, confirm the racial segregation in
California schools. For whites, there is a positive if not substantial correlation (r=.19) between
graduation rates and the share of whites in a school. There is also a weak but positive .14 correlation
between graduation rates and the share of Asians. However, when we add the shares of whites and
Asians, we find a moderate .27 correlation, indicating that students who have more white and Asian
schoolmates tend to graduate. The percentage of Latinos in a school is slightly associated with
graduation rates (r=-.13), but the direction for blacks is negative, at -.36. This group shows the strongest
magnitude of correlation among given racial groups.
Double Segregation: Racial and Poverty Segregation, and Differences in Neighborhood Schools
There is a clear pattern of intense double segregation by race and poverty for black and Latino children
in California’s metro areas, where the average white or Asian student attends a school where about 40
percent of their schoolmates are poor, while the typical black or Latino student attends a school where
70 percent of students are poor. In other words, the default for a white or Asian family is a middle-class
school, while the default for a Latino or black family is a school of concentrated poverty. Contact with
Segregating California’s Future, May 2014 Civil Rights Project/Proyecto Derechos Civiles
41 | P a g e
poor classmates is lowest for white Californians, about 37 percent, and highest for Latinos, about 71
percent. Since poverty levels are linked to many forces inside and outside of schools that produce very
different kinds of educational opportunity and attainment, this difference, which we call double
segregation, matters tremendously.
The poverty California’s children experience has increased markedly in the last generation, as has the
level of segregation by poverty, particularly for black and Latino students. In 1993, black and Latino
students attended schools with 52 percent and 58 percent poor children, respectively, as measured by
subsidized lunch eligibility (around 120 percent of the federal poverty level qualifies for free school
lunch). By 2012, blacks on average attended schools whose populations were two-thirds poor children,
and Latinos attended schools that were more than 70 percent poor. Whites and Asians, on average,
attended schools with a clear middle-class majority, although also a rising poverty level. This pattern,
which we find nationally and in many state studies, is a strong indicator that, without desegregation
plans in place, white and Asian neighborhood schools will be middle-class, while black and Latino
schools face concentrated poverty and the many associated social and educational challenges.
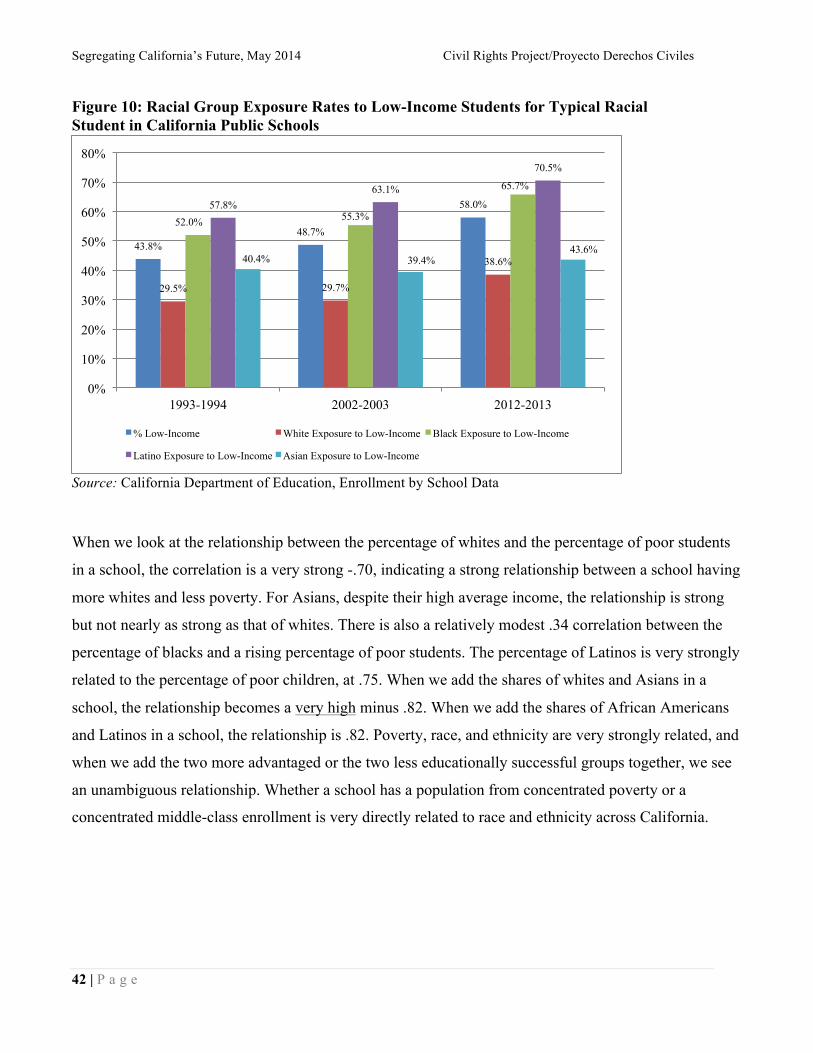
Segregating California’s Future, May 2014 Civil Rights Project/Proyecto Derechos Civiles
42 | P a g e
Figure 10: Racial Group Exposure Rates to Low-Income Students for Typical Racial Student in California Public Schools
Source: California Department of Education, Enrollment by School Data
When we look at the relationship between the percentage of whites and the percentage of poor students
in a school, the correlation is a very strong -.70, indicating a strong relationship between a school having
more whites and less poverty. For Asians, despite their high average income, the relationship is strong
but not nearly as strong as that of whites. There is also a relatively modest .34 correlation between the
percentage of blacks and a rising percentage of poor students. The percentage of Latinos is very strongly
related to the percentage of poor children, at .75. When we add the shares of whites and Asians in a
school, the relationship becomes a very high minus .82. When we add the shares of African Americans
and Latinos in a school, the relationship is .82. Poverty, race, and ethnicity are very strongly related, and
when we add the two more advantaged or the two less educationally successful groups together, we see
an unambiguous relationship. Whether a school has a population from concentrated poverty or a
concentrated middle-class enrollment is very directly related to race and ethnicity across California.
43.8% 48.7%
58.0%
29.5% 29.7%
38.6%
52.0% 55.3%
65.7%
57.8% 63.1%
70.5%
40.4% 39.4% 43.6%
0%
10%
20%
30%
40%
50%
60%
70%
80%
1993-1994 2002-2003 2012-2013
% Low-Income White Exposure to Low-Income Black Exposure to Low-Income
Latino Exposure to Low-Income Asian Exposure to Low-Income
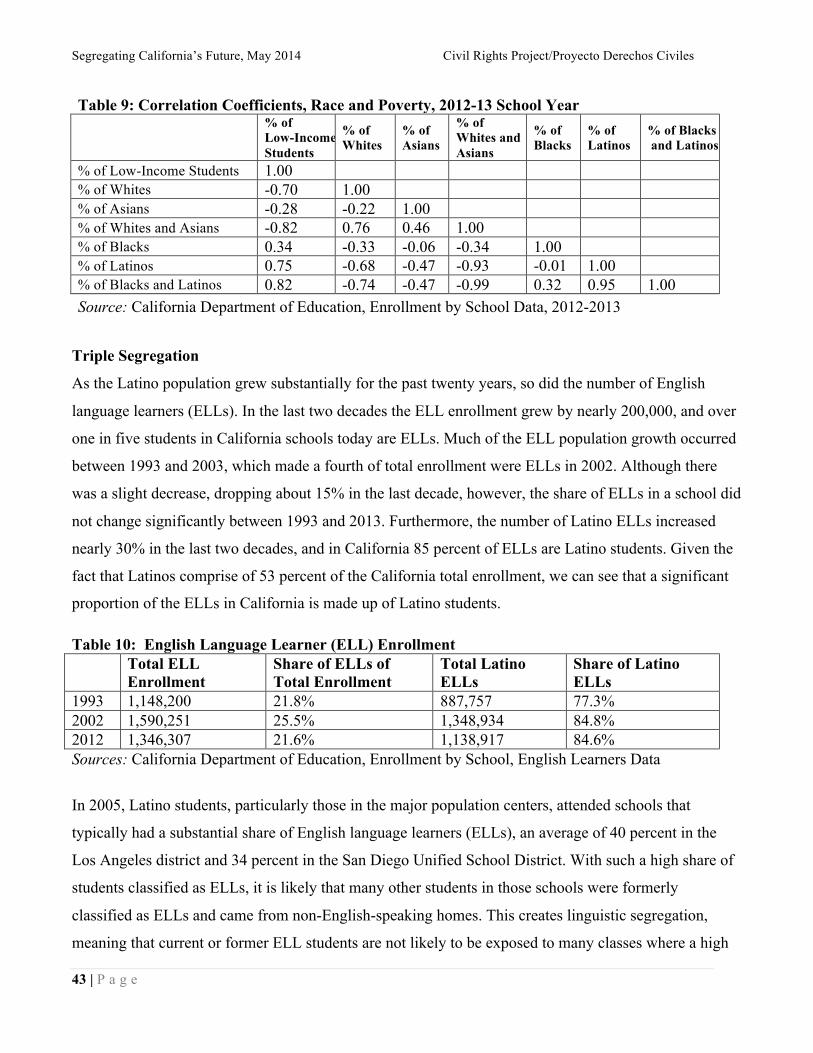
Segregating California’s Future, May 2014 Civil Rights Project/Proyecto Derechos Civiles
43 | P a g e
Table 9: Correlation Coefficients, Race and Poverty, 2012-13 School Year
% of Low-Income Students
% of Whites
% of Asians
% of Whites and Asians
% of Blacks
% of Latinos
% of Blacks and Latinos
% of Low-Income Students 1.00 % of Whites -0.70 1.00 % of Asians -0.28 -0.22 1.00 % of Whites and Asians -0.82 0.76 0.46 1.00 % of Blacks 0.34 -0.33 -0.06 -0.34 1.00 % of Latinos 0.75 -0.68 -0.47 -0.93 -0.01 1.00 % of Blacks and Latinos 0.82 -0.74 -0.47 -0.99 0.32 0.95 1.00 Source: California Department of Education, Enrollment by School Data, 2012-2013
Triple Segregation
As the Latino population grew substantially for the past twenty years, so did the number of English
language learners (ELLs). In the last two decades the ELL enrollment grew by nearly 200,000, and over
one in five students in California schools today are ELLs. Much of the ELL population growth occurred
between 1993 and 2003, which made a fourth of total enrollment were ELLs in 2002. Although there
was a slight decrease, dropping about 15% in the last decade, however, the share of ELLs in a school did
not change significantly between 1993 and 2013. Furthermore, the number of Latino ELLs increased
nearly 30% in the last two decades, and in California 85 percent of ELLs are Latino students. Given the
fact that Latinos comprise of 53 percent of the California total enrollment, we can see that a significant
proportion of the ELLs in California is made up of Latino students.
Table 10: English Language Learner (ELL) Enrollment
Total ELL Enrollment
Share of ELLs of Total Enrollment
Total Latino ELLs
Share of Latino ELLs
1993 1,148,200 21.8% 887,757 77.3% 2002 1,590,251 25.5% 1,348,934 84.8% 2012 1,346,307 21.6% 1,138,917 84.6% Sources: California Department of Education, Enrollment by School, English Learners Data
In 2005, Latino students, particularly those in the major population centers, attended schools that
typically had a substantial share of English language learners (ELLs), an average of 40 percent in the
Los Angeles district and 34 percent in the San Diego Unified School District. With such a high share of
students classified as ELLs, it is likely that many other students in those schools were formerly
classified as ELLs and came from non-English-speaking homes. This creates linguistic segregation,
meaning that current or former ELL students are not likely to be exposed to many classes where a high
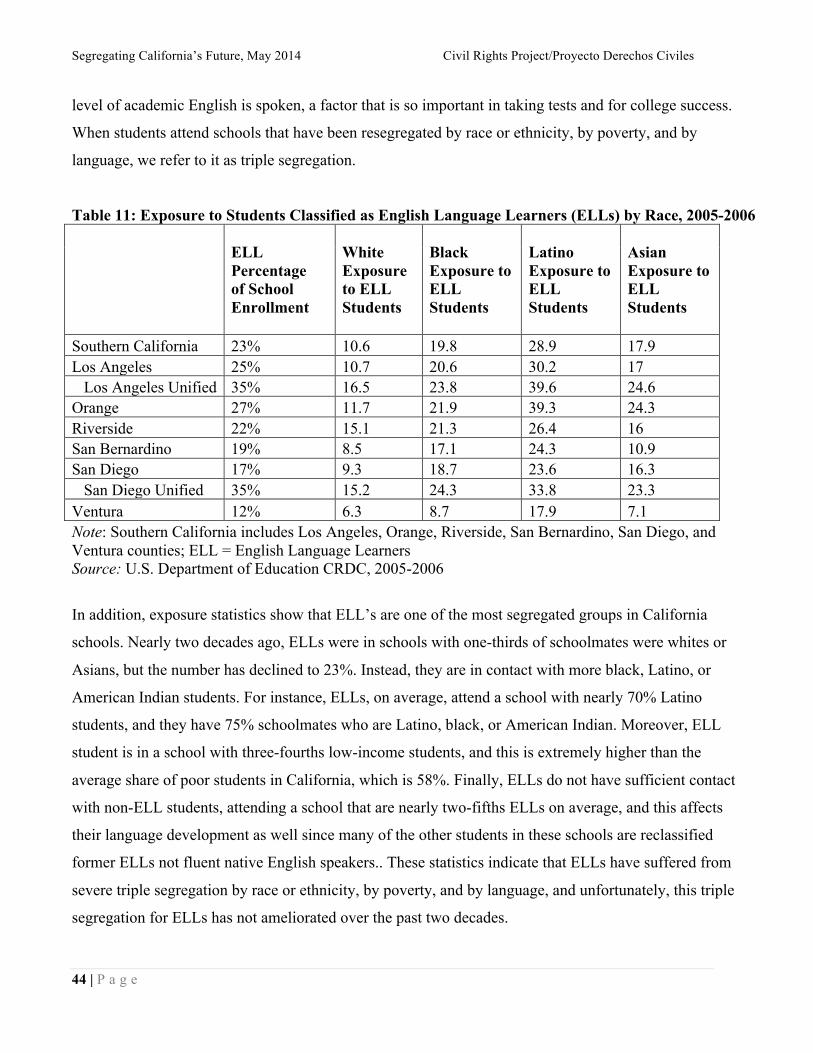
Segregating California’s Future, May 2014 Civil Rights Project/Proyecto Derechos Civiles
44 | P a g e
level of academic English is spoken, a factor that is so important in taking tests and for college success.
When students attend schools that have been resegregated by race or ethnicity, by poverty, and by
language, we refer to it as triple segregation.
Table 11: Exposure to Students Classified as English Language Learners (ELLs) by Race, 2005-2006
ELL Percentage of School Enrollment
White Exposure to ELL Students
Black Exposure to ELL Students
Latino Exposure to ELL Students
Asian Exposure to ELL Students
Southern California 23% 10.6 19.8 28.9 17.9 Los Angeles 25% 10.7 20.6 30.2 17 Los Angeles Unified 35% 16.5 23.8 39.6 24.6 Orange 27% 11.7 21.9 39.3 24.3 Riverside 22% 15.1 21.3 26.4 16 San Bernardino 19% 8.5 17.1 24.3 10.9 San Diego 17% 9.3 18.7 23.6 16.3 San Diego Unified 35% 15.2 24.3 33.8 23.3 Ventura 12% 6.3 8.7 17.9 7.1
Note: Southern California includes Los Angeles, Orange, Riverside, San Bernardino, San Diego, and Ventura counties; ELL = English Language Learners Source: U.S. Department of Education CRDC, 2005-2006
In addition, exposure statistics show that ELL’s are one of the most segregated groups in California
schools. Nearly two decades ago, ELLs were in schools with one-thirds of schoolmates were whites or
Asians, but the number has declined to 23%. Instead, they are in contact with more black, Latino, or
American Indian students. For instance, ELLs, on average, attend a school with nearly 70% Latino
students, and they have 75% schoolmates who are Latino, black, or American Indian. Moreover, ELL
student is in a school with three-fourths low-income students, and this is extremely higher than the
average share of poor students in California, which is 58%. Finally, ELLs do not have sufficient contact
with non-ELL students, attending a school that are nearly two-fifths ELLs on average, and this affects
their language development as well since many of the other students in these schools are reclassified
former ELLs not fluent native English speakers.. These statistics indicate that ELLs have suffered from
severe triple segregation by race or ethnicity, by poverty, and by language, and unfortunately, this triple
segregation for ELLs has not ameliorated over the past two decades.
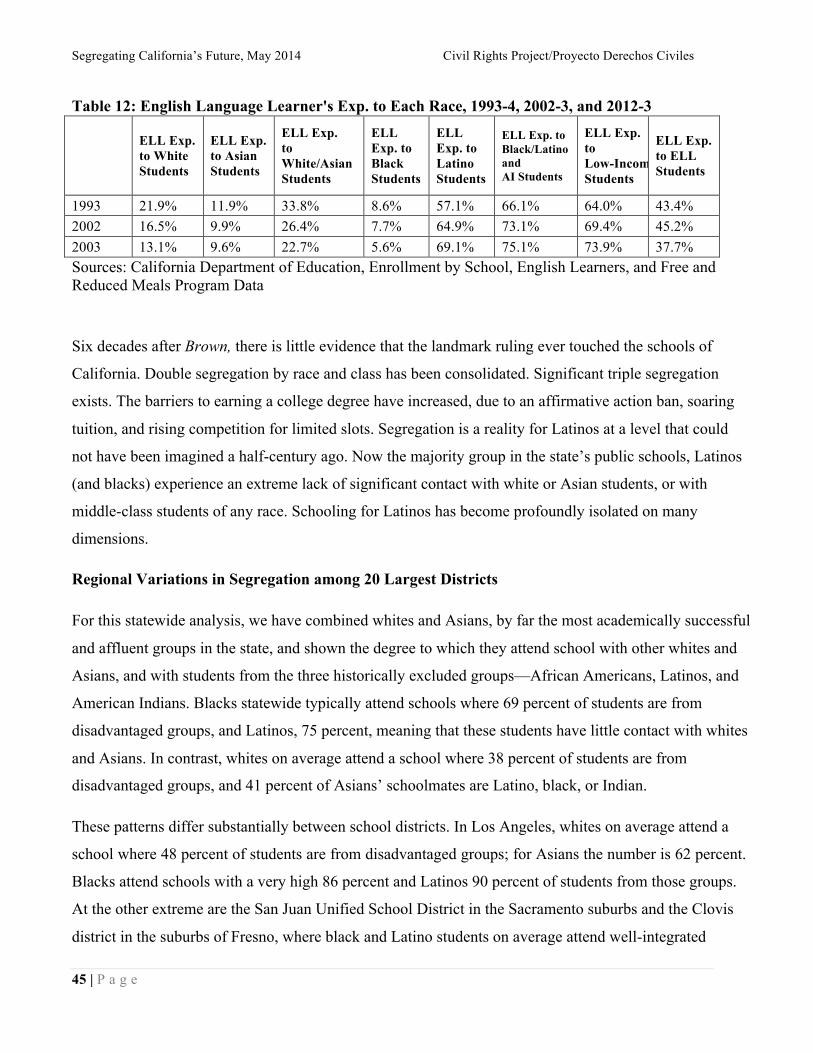
Segregating California’s Future, May 2014 Civil Rights Project/Proyecto Derechos Civiles
45 | P a g e
Table 12: English Language Learner's Exp. to Each Race, 1993-4, 2002-3, and 2012-3
ELL Exp. to White Students
ELL Exp. to Asian Students
ELL Exp. to White/Asian Students
ELL Exp. to Black Students
ELL Exp. to Latino Students
ELL Exp. to Black/Latino and AI Students
ELL Exp. to Low-Income Students
ELL Exp. to ELL Students
1993 21.9% 11.9% 33.8% 8.6% 57.1% 66.1% 64.0% 43.4% 2002 16.5% 9.9% 26.4% 7.7% 64.9% 73.1% 69.4% 45.2% 2003 13.1% 9.6% 22.7% 5.6% 69.1% 75.1% 73.9% 37.7% Sources: California Department of Education, Enrollment by School, English Learners, and Free and Reduced Meals Program Data
Six decades after Brown, there is little evidence that the landmark ruling ever touched the schools of
California. Double segregation by race and class has been consolidated. Significant triple segregation
exists. The barriers to earning a college degree have increased, due to an affirmative action ban, soaring
tuition, and rising competition for limited slots. Segregation is a reality for Latinos at a level that could
not have been imagined a half-century ago. Now the majority group in the state’s public schools, Latinos
(and blacks) experience an extreme lack of significant contact with white or Asian students, or with
middle-class students of any race. Schooling for Latinos has become profoundly isolated on many
dimensions.
Regional Variations in Segregation among 20 Largest Districts
For this statewide analysis, we have combined whites and Asians, by far the most academically successful
and affluent groups in the state, and shown the degree to which they attend school with other whites and
Asians, and with students from the three historically excluded groups—African Americans, Latinos, and
American Indians. Blacks statewide typically attend schools where 69 percent of students are from
disadvantaged groups, and Latinos, 75 percent, meaning that these students have little contact with whites
and Asians. In contrast, whites on average attend a school where 38 percent of students are from
disadvantaged groups, and 41 percent of Asians’ schoolmates are Latino, black, or Indian.
These patterns differ substantially between school districts. In Los Angeles, whites on average attend a
school where 48 percent of students are from disadvantaged groups; for Asians the number is 62 percent.
Blacks attend schools with a very high 86 percent and Latinos 90 percent of students from those groups.
At the other extreme are the San Juan Unified School District in the Sacramento suburbs and the Clovis
district in the suburbs of Fresno, where black and Latino students on average attend well-integrated
Segregating California’s Future, May 2014 Civil Rights Project/Proyecto Derechos Civiles
46 | P a g e
schools with around two-fifths black, Latino, and Indian students, and three-fifths white and Asian
students. In Clovis, the white and Asian students attend schools of similar racial composition. In San
Juan they attend schools with almost three-fourths fellow white and Asian students.
An interesting comparison can be made between Sacramento, Elk Grove, San Juan, and Stockton, all
large districts relatively close to one another in Northern California. San Juan and Elk Grove adjoin the
Sacramento Unified School District and cover large areas of suburbs and exurbs. Stockton is a city
facing a serious economic crisis and a bankrupt government. Sacramento’s school district has been hard
hit by the Great Recession and by major cutbacks in state government, the city’s dominant employer.
When Time magazine asked The Civil Rights Project to identify the nation’s most residentially
integrated big city after the 2000 Census, we computed a number of indices and gave that label to
Sacramento, thus it is not surprising that the entire metro area looks different from the many extremely
stratified regions of California. Stockton is your classic impoverished, overwhelmingly minority school
system. The whites and Asians who remain in the Stockton school district on average attend schools
with more than two-thirds combined enrollment of Latinos, blacks, and Indians. Sacramento has a
heavily nonwhite but diverse population, and the statistics look quite different from the racial
composition of the big city schools, including Los Angeles, San Francisco, San Diego, and others where
there is far less diversity. In Sacramento, whites, on average, attend schools with 46 percent combined
minority enrollment (blacks, Latinos and Indians) and Asians with 52 percent, while blacks and Latinos
attend schools that are, respectively, 62 percent and 60 percent from those groups. All groups of
students in Sacramento tend to go to schools that are highly diverse. In the Elk Grove and San Juan
school districts, students of all races typically attend schools with a significant majority of whites and
Asians but also a substantial presence of the usually segregated groups.
The most extreme isolation of African Americans and Latinos exists in Los Angeles, Santa Ana, San
Bernardino, and the Fontana Unified School District (located near San Bernardino in the Inland Empire).
These are all Southern California cities with a very large Latino majority in the school-age population.
In these districts, close to nine-tenths of the students in schools attended by Latino and black students
are from disadvantaged minorities. In all of these districts, except Los Angeles, the remaining white
students also attend schools with a large majority of Latino and African American students. Los Angeles
is an important exception, especially for white students, who attend schools that are 51 percent white
and Asian, and Asians attend schools that are 37 percent white and Asian—very different circumstances
Segregating California’s Future, May 2014 Civil Rights Project/Proyecto Derechos Civiles
47 | P a g e
from the extreme isolation the other groups experience. In San Francisco, in part because of its large
Asian enrollment, its substantial high-income neighborhoods, and the removal of many major public
housing projects, the termination of the school desegregation plan has a distinctive pattern. Whites and
Asians in San Francisco’s public schools on average have many fewer black and Latino schoolmates
than other large central cities in California, only about one-fourth. The city’s black and Latino students,
in contrast, attend schools that have almost 50 percent white and Asian students, much higher on
average than in other cities.
In Los Angeles, the typical Latino attends a school with an 81 percent poverty rate, whereas whites in
this district attend schools where 43 percent of students are poor; the rate for Asians is typically 59
percent poor children. The statistics are similar for San Diego, except the poverty for Latinos is not quite
as high, much like San Francisco. In San Bernardino, Stockton, and Fontana, on the other hand, the
declining group of whites in these districts attend deeply impoverished schools.
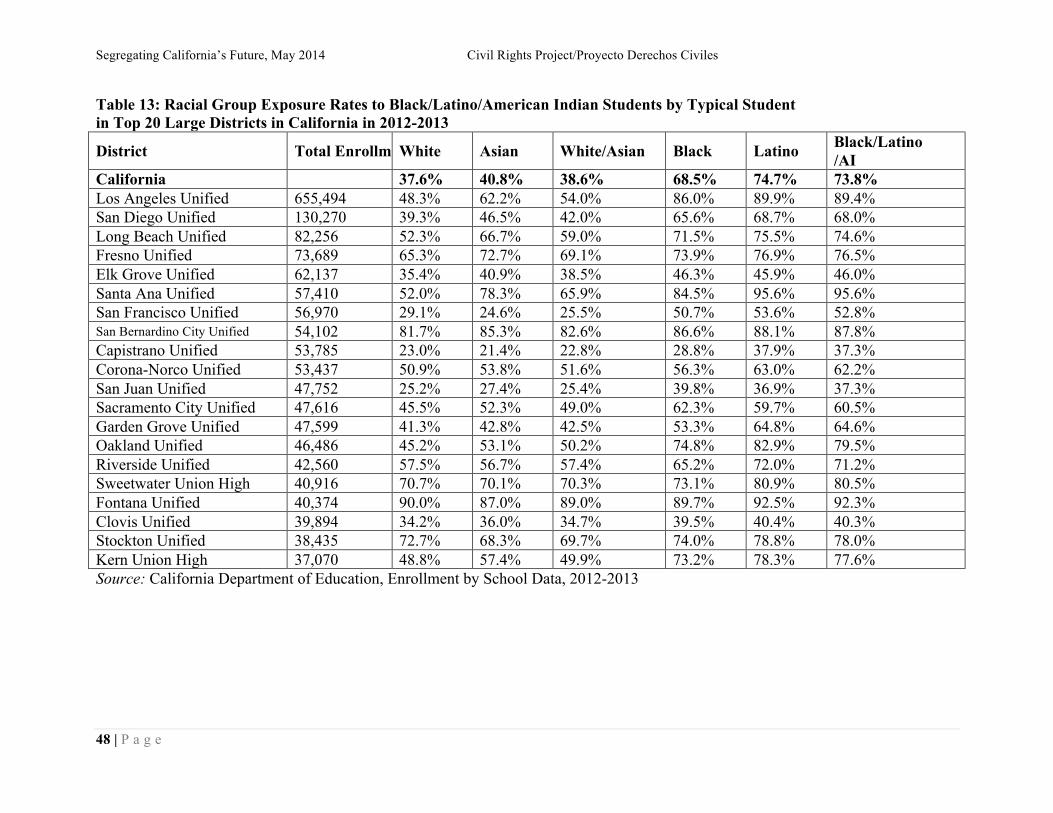
Segregating California’s Future, May 2014 Civil Rights Project/Proyecto Derechos Civiles
48 | P a g e
Table 13: Racial Group Exposure Rates to Black/Latino/American Indian Students by Typical Student in Top 20 Large Districts in California in 2012-2013
District Total Enrollment White Asian White/Asian Black Latino Black/Latino /AI
California 37.6% 40.8% 38.6% 68.5% 74.7% 73.8% Los Angeles Unified 655,494 48.3% 62.2% 54.0% 86.0% 89.9% 89.4% San Diego Unified 130,270 39.3% 46.5% 42.0% 65.6% 68.7% 68.0% Long Beach Unified 82,256 52.3% 66.7% 59.0% 71.5% 75.5% 74.6% Fresno Unified 73,689 65.3% 72.7% 69.1% 73.9% 76.9% 76.5% Elk Grove Unified 62,137 35.4% 40.9% 38.5% 46.3% 45.9% 46.0% Santa Ana Unified 57,410 52.0% 78.3% 65.9% 84.5% 95.6% 95.6% San Francisco Unified 56,970 29.1% 24.6% 25.5% 50.7% 53.6% 52.8% San Bernardino City Unified 54,102 81.7% 85.3% 82.6% 86.6% 88.1% 87.8% Capistrano Unified 53,785 23.0% 21.4% 22.8% 28.8% 37.9% 37.3% Corona-Norco Unified 53,437 50.9% 53.8% 51.6% 56.3% 63.0% 62.2% San Juan Unified 47,752 25.2% 27.4% 25.4% 39.8% 36.9% 37.3% Sacramento City Unified 47,616 45.5% 52.3% 49.0% 62.3% 59.7% 60.5% Garden Grove Unified 47,599 41.3% 42.8% 42.5% 53.3% 64.8% 64.6% Oakland Unified 46,486 45.2% 53.1% 50.2% 74.8% 82.9% 79.5% Riverside Unified 42,560 57.5% 56.7% 57.4% 65.2% 72.0% 71.2% Sweetwater Union High 40,916 70.7% 70.1% 70.3% 73.1% 80.9% 80.5% Fontana Unified 40,374 90.0% 87.0% 89.0% 89.7% 92.5% 92.3% Clovis Unified 39,894 34.2% 36.0% 34.7% 39.5% 40.4% 40.3% Stockton Unified 38,435 72.7% 68.3% 69.7% 74.0% 78.8% 78.0% Kern Union High 37,070 48.8% 57.4% 49.9% 73.2% 78.3% 77.6% Source: California Department of Education, Enrollment by School Data, 2012-2013
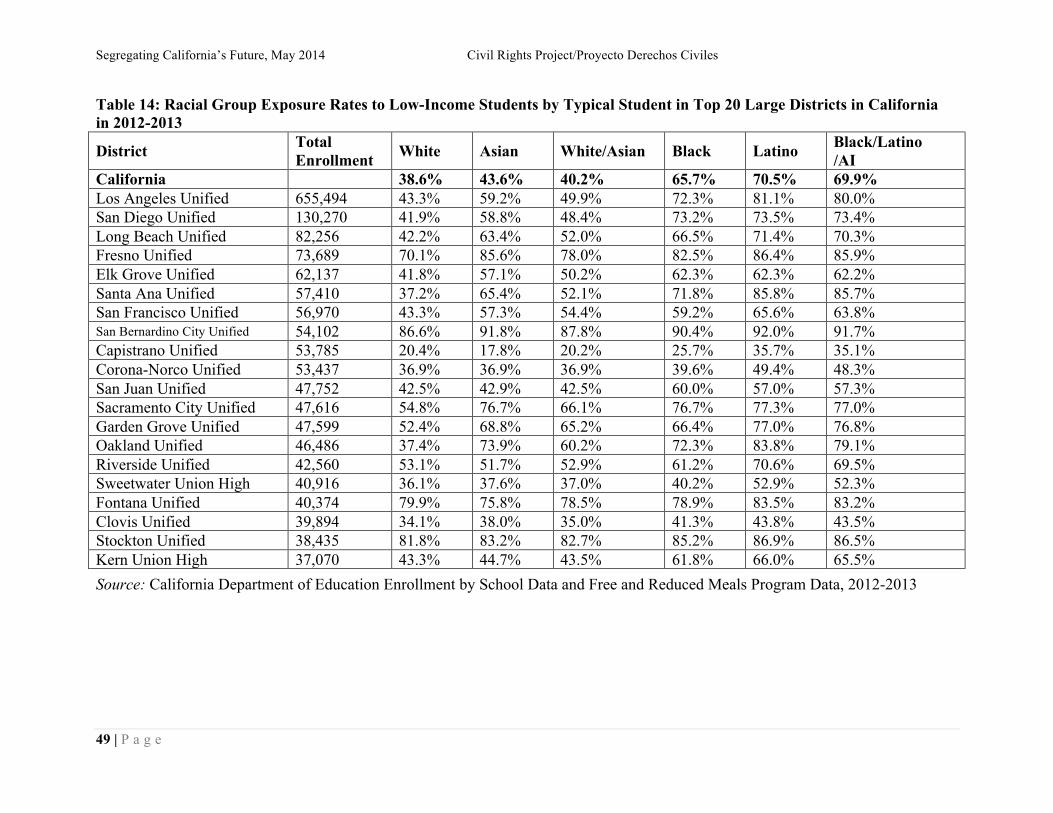
Segregating California’s Future, May 2014 Civil Rights Project/Proyecto Derechos Civiles
49 | P a g e
Table 14: Racial Group Exposure Rates to Low-Income Students by Typical Student in Top 20 Large Districts in California in 2012-2013
District Total Enrollment White Asian White/Asian Black Latino Black/Latino
/AI California 38.6% 43.6% 40.2% 65.7% 70.5% 69.9% Los Angeles Unified 655,494 43.3% 59.2% 49.9% 72.3% 81.1% 80.0% San Diego Unified 130,270 41.9% 58.8% 48.4% 73.2% 73.5% 73.4% Long Beach Unified 82,256 42.2% 63.4% 52.0% 66.5% 71.4% 70.3% Fresno Unified 73,689 70.1% 85.6% 78.0% 82.5% 86.4% 85.9% Elk Grove Unified 62,137 41.8% 57.1% 50.2% 62.3% 62.3% 62.2% Santa Ana Unified 57,410 37.2% 65.4% 52.1% 71.8% 85.8% 85.7% San Francisco Unified 56,970 43.3% 57.3% 54.4% 59.2% 65.6% 63.8% San Bernardino City Unified 54,102 86.6% 91.8% 87.8% 90.4% 92.0% 91.7% Capistrano Unified 53,785 20.4% 17.8% 20.2% 25.7% 35.7% 35.1% Corona-Norco Unified 53,437 36.9% 36.9% 36.9% 39.6% 49.4% 48.3% San Juan Unified 47,752 42.5% 42.9% 42.5% 60.0% 57.0% 57.3% Sacramento City Unified 47,616 54.8% 76.7% 66.1% 76.7% 77.3% 77.0% Garden Grove Unified 47,599 52.4% 68.8% 65.2% 66.4% 77.0% 76.8% Oakland Unified 46,486 37.4% 73.9% 60.2% 72.3% 83.8% 79.1% Riverside Unified 42,560 53.1% 51.7% 52.9% 61.2% 70.6% 69.5% Sweetwater Union High 40,916 36.1% 37.6% 37.0% 40.2% 52.9% 52.3% Fontana Unified 40,374 79.9% 75.8% 78.5% 78.9% 83.5% 83.2% Clovis Unified 39,894 34.1% 38.0% 35.0% 41.3% 43.8% 43.5% Stockton Unified 38,435 81.8% 83.2% 82.7% 85.2% 86.9% 86.5% Kern Union High 37,070 43.3% 44.7% 43.5% 61.8% 66.0% 65.5% Source: California Department of Education Enrollment by School Data and Free and Reduced Meals Program Data, 2012-2013
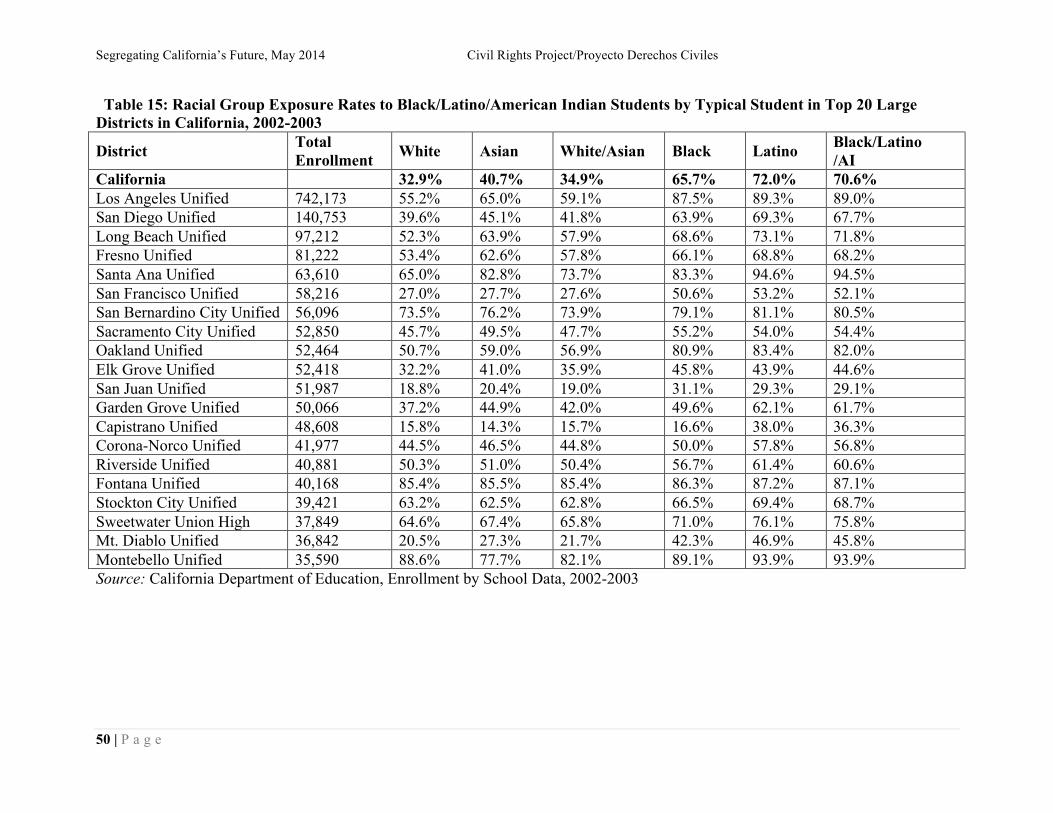
Segregating California’s Future, May 2014 Civil Rights Project/Proyecto Derechos Civiles
50 | P a g e
Table 15: Racial Group Exposure Rates to Black/Latino/American Indian Students by Typical Student in Top 20 Large Districts in California, 2002-2003
District Total Enrollment White Asian White/Asian Black Latino Black/Latino
/AI California 32.9% 40.7% 34.9% 65.7% 72.0% 70.6% Los Angeles Unified 742,173 55.2% 65.0% 59.1% 87.5% 89.3% 89.0% San Diego Unified 140,753 39.6% 45.1% 41.8% 63.9% 69.3% 67.7% Long Beach Unified 97,212 52.3% 63.9% 57.9% 68.6% 73.1% 71.8% Fresno Unified 81,222 53.4% 62.6% 57.8% 66.1% 68.8% 68.2% Santa Ana Unified 63,610 65.0% 82.8% 73.7% 83.3% 94.6% 94.5% San Francisco Unified 58,216 27.0% 27.7% 27.6% 50.6% 53.2% 52.1% San Bernardino City Unified 56,096 73.5% 76.2% 73.9% 79.1% 81.1% 80.5% Sacramento City Unified 52,850 45.7% 49.5% 47.7% 55.2% 54.0% 54.4% Oakland Unified 52,464 50.7% 59.0% 56.9% 80.9% 83.4% 82.0% Elk Grove Unified 52,418 32.2% 41.0% 35.9% 45.8% 43.9% 44.6% San Juan Unified 51,987 18.8% 20.4% 19.0% 31.1% 29.3% 29.1% Garden Grove Unified 50,066 37.2% 44.9% 42.0% 49.6% 62.1% 61.7% Capistrano Unified 48,608 15.8% 14.3% 15.7% 16.6% 38.0% 36.3% Corona-Norco Unified 41,977 44.5% 46.5% 44.8% 50.0% 57.8% 56.8% Riverside Unified 40,881 50.3% 51.0% 50.4% 56.7% 61.4% 60.6% Fontana Unified 40,168 85.4% 85.5% 85.4% 86.3% 87.2% 87.1% Stockton City Unified 39,421 63.2% 62.5% 62.8% 66.5% 69.4% 68.7% Sweetwater Union High 37,849 64.6% 67.4% 65.8% 71.0% 76.1% 75.8% Mt. Diablo Unified 36,842 20.5% 27.3% 21.7% 42.3% 46.9% 45.8% Montebello Unified 35,590 88.6% 77.7% 82.1% 89.1% 93.9% 93.9% Source: California Department of Education, Enrollment by School Data, 2002-2003
Segregating California’s Future, May 2014 Civil Rights Project/Proyecto Derechos Civiles
51 | P a g e
Ten years ago, before the last decade of major demographic change and the Great Recession, the racial
pattern was already set. However, all measures of isolation have become worse for Latinos and African
Americans in the last decade. There also have been major changes for whites in some districts. For example,
a decade ago whites and Asians in Los Angeles actually had higher proportions of black and Latino
schoolmates than they do in the most recent data, although whites in a number of school districts at that time
attended schools with a substantially smaller percentage of black and Latino classmates. In 2002 the poverty
levels were lower statewide, but whites on average still attended schools with less than a 30 percent poverty
level, blacks were in schools with almost half middle-class students, and Latinos did not yet face the
extreme economic isolation that they now confront. Only Los Angeles, Fresno, San Bernardino, and
Montebello showed the extreme poverty concentrations for Latinos that would become much more common
eight years later.
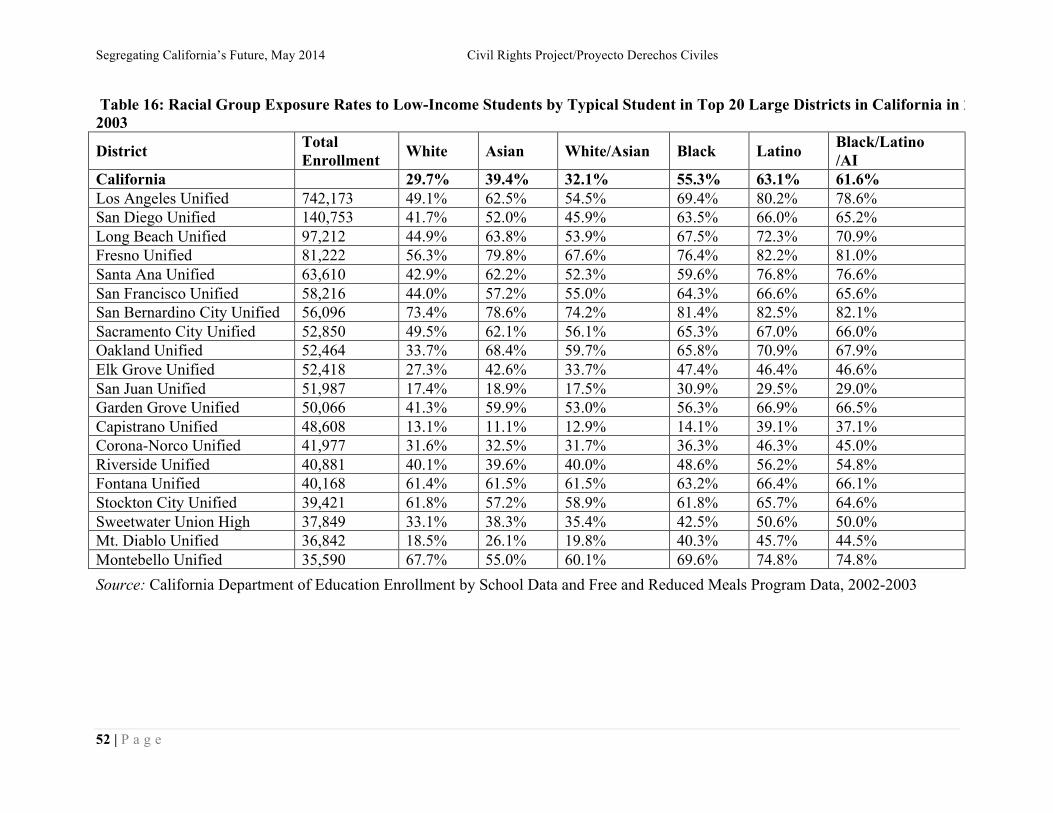
Segregating California’s Future, May 2014 Civil Rights Project/Proyecto Derechos Civiles
52 | P a g e
Table 16: Racial Group Exposure Rates to Low-Income Students by Typical Student in Top 20 Large Districts in California in 2002-2003
District Total Enrollment White Asian White/Asian Black Latino Black/Latino
/AI California 29.7% 39.4% 32.1% 55.3% 63.1% 61.6% Los Angeles Unified 742,173 49.1% 62.5% 54.5% 69.4% 80.2% 78.6% San Diego Unified 140,753 41.7% 52.0% 45.9% 63.5% 66.0% 65.2% Long Beach Unified 97,212 44.9% 63.8% 53.9% 67.5% 72.3% 70.9% Fresno Unified 81,222 56.3% 79.8% 67.6% 76.4% 82.2% 81.0% Santa Ana Unified 63,610 42.9% 62.2% 52.3% 59.6% 76.8% 76.6% San Francisco Unified 58,216 44.0% 57.2% 55.0% 64.3% 66.6% 65.6% San Bernardino City Unified 56,096 73.4% 78.6% 74.2% 81.4% 82.5% 82.1% Sacramento City Unified 52,850 49.5% 62.1% 56.1% 65.3% 67.0% 66.0% Oakland Unified 52,464 33.7% 68.4% 59.7% 65.8% 70.9% 67.9% Elk Grove Unified 52,418 27.3% 42.6% 33.7% 47.4% 46.4% 46.6% San Juan Unified 51,987 17.4% 18.9% 17.5% 30.9% 29.5% 29.0% Garden Grove Unified 50,066 41.3% 59.9% 53.0% 56.3% 66.9% 66.5% Capistrano Unified 48,608 13.1% 11.1% 12.9% 14.1% 39.1% 37.1% Corona-Norco Unified 41,977 31.6% 32.5% 31.7% 36.3% 46.3% 45.0% Riverside Unified 40,881 40.1% 39.6% 40.0% 48.6% 56.2% 54.8% Fontana Unified 40,168 61.4% 61.5% 61.5% 63.2% 66.4% 66.1% Stockton City Unified 39,421 61.8% 57.2% 58.9% 61.8% 65.7% 64.6% Sweetwater Union High 37,849 33.1% 38.3% 35.4% 42.5% 50.6% 50.0% Mt. Diablo Unified 36,842 18.5% 26.1% 19.8% 40.3% 45.7% 44.5% Montebello Unified 35,590 67.7% 55.0% 60.1% 69.6% 74.8% 74.8% Source: California Department of Education Enrollment by School Data and Free and Reduced Meals Program Data, 2002-2003
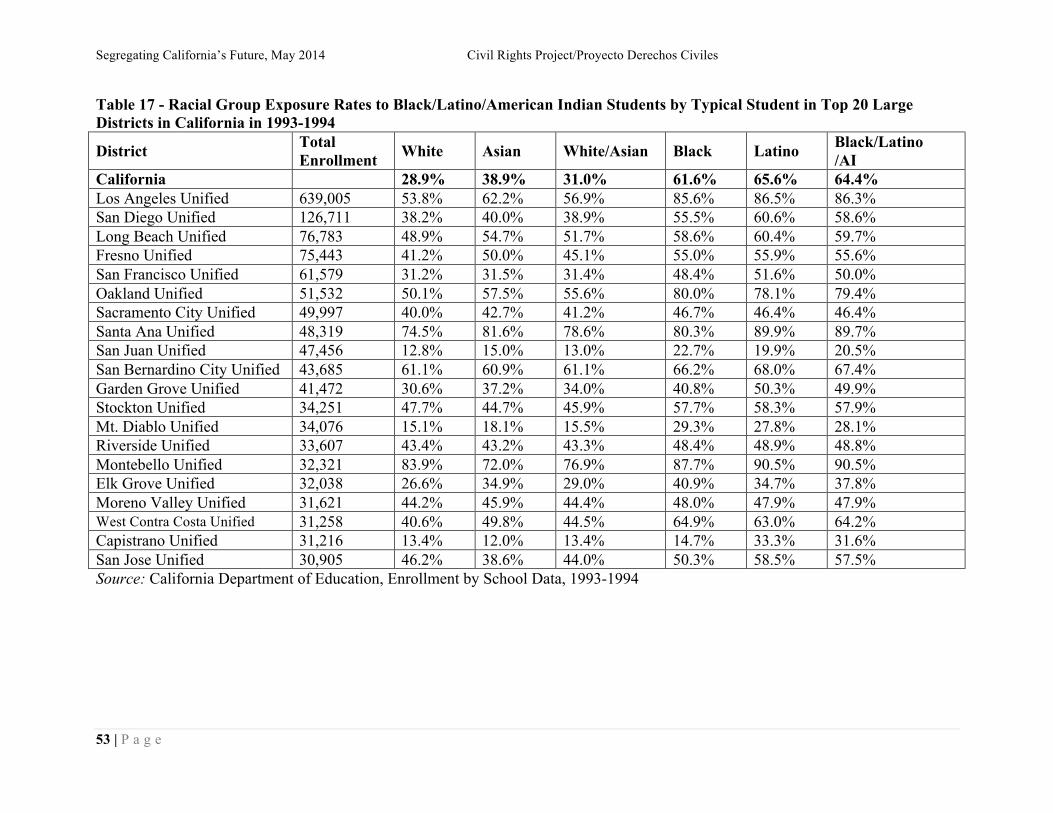
Segregating California’s Future, May 2014 Civil Rights Project/Proyecto Derechos Civiles
53 | P a g e
Table 17 - Racial Group Exposure Rates to Black/Latino/American Indian Students by Typical Student in Top 20 Large Districts in California in 1993-1994
District Total Enrollment White Asian White/Asian Black Latino Black/Latino
/AI California 28.9% 38.9% 31.0% 61.6% 65.6% 64.4% Los Angeles Unified 639,005 53.8% 62.2% 56.9% 85.6% 86.5% 86.3% San Diego Unified 126,711 38.2% 40.0% 38.9% 55.5% 60.6% 58.6% Long Beach Unified 76,783 48.9% 54.7% 51.7% 58.6% 60.4% 59.7% Fresno Unified 75,443 41.2% 50.0% 45.1% 55.0% 55.9% 55.6% San Francisco Unified 61,579 31.2% 31.5% 31.4% 48.4% 51.6% 50.0% Oakland Unified 51,532 50.1% 57.5% 55.6% 80.0% 78.1% 79.4% Sacramento City Unified 49,997 40.0% 42.7% 41.2% 46.7% 46.4% 46.4% Santa Ana Unified 48,319 74.5% 81.6% 78.6% 80.3% 89.9% 89.7% San Juan Unified 47,456 12.8% 15.0% 13.0% 22.7% 19.9% 20.5% San Bernardino City Unified 43,685 61.1% 60.9% 61.1% 66.2% 68.0% 67.4% Garden Grove Unified 41,472 30.6% 37.2% 34.0% 40.8% 50.3% 49.9% Stockton Unified 34,251 47.7% 44.7% 45.9% 57.7% 58.3% 57.9% Mt. Diablo Unified 34,076 15.1% 18.1% 15.5% 29.3% 27.8% 28.1% Riverside Unified 33,607 43.4% 43.2% 43.3% 48.4% 48.9% 48.8% Montebello Unified 32,321 83.9% 72.0% 76.9% 87.7% 90.5% 90.5% Elk Grove Unified 32,038 26.6% 34.9% 29.0% 40.9% 34.7% 37.8% Moreno Valley Unified 31,621 44.2% 45.9% 44.4% 48.0% 47.9% 47.9% West Contra Costa Unified 31,258 40.6% 49.8% 44.5% 64.9% 63.0% 64.2% Capistrano Unified 31,216 13.4% 12.0% 13.4% 14.7% 33.3% 31.6% San Jose Unified 30,905 46.2% 38.6% 44.0% 50.3% 58.5% 57.5% Source: California Department of Education, Enrollment by School Data, 1993-1994
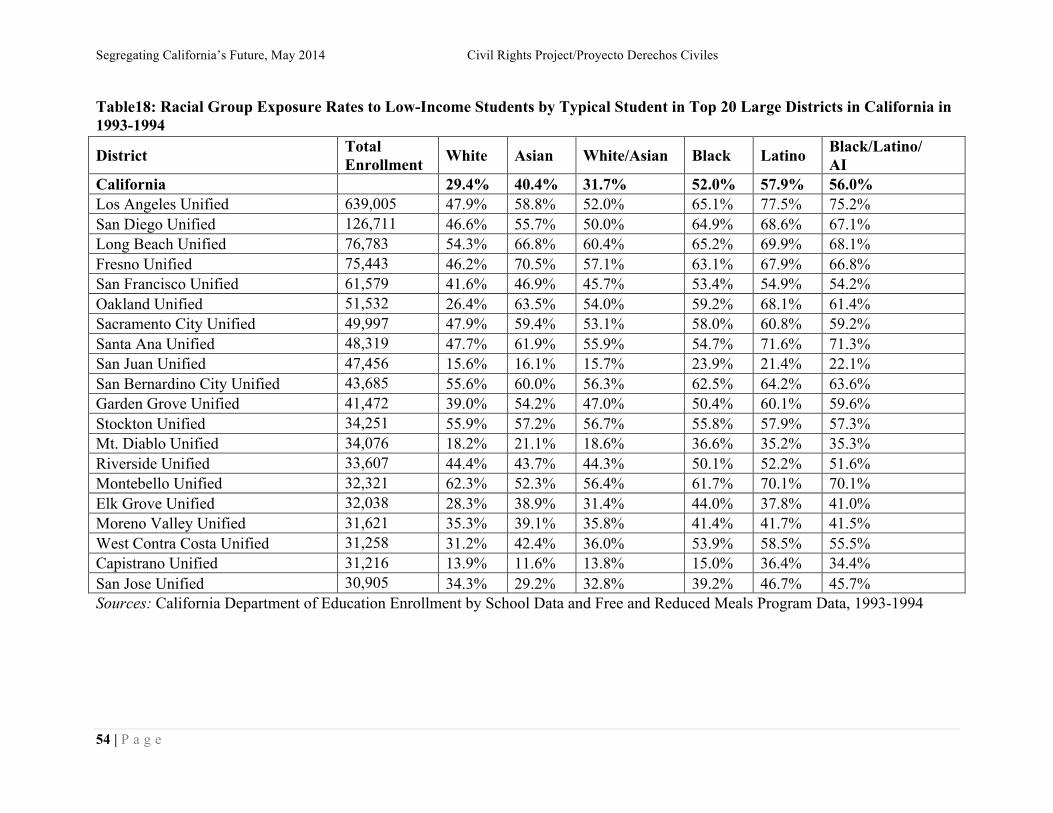
Segregating California’s Future, May 2014 Civil Rights Project/Proyecto Derechos Civiles
54 | P a g e
Table18: Racial Group Exposure Rates to Low-Income Students by Typical Student in Top 20 Large Districts in California in 1993-1994
District Total Enrollment White Asian White/Asian Black Latino Black/Latino/
AI California 29.4% 40.4% 31.7% 52.0% 57.9% 56.0% Los Angeles Unified 639,005 47.9% 58.8% 52.0% 65.1% 77.5% 75.2% San Diego Unified 126,711 46.6% 55.7% 50.0% 64.9% 68.6% 67.1% Long Beach Unified 76,783 54.3% 66.8% 60.4% 65.2% 69.9% 68.1% Fresno Unified 75,443 46.2% 70.5% 57.1% 63.1% 67.9% 66.8% San Francisco Unified 61,579 41.6% 46.9% 45.7% 53.4% 54.9% 54.2% Oakland Unified 51,532 26.4% 63.5% 54.0% 59.2% 68.1% 61.4% Sacramento City Unified 49,997 47.9% 59.4% 53.1% 58.0% 60.8% 59.2% Santa Ana Unified 48,319 47.7% 61.9% 55.9% 54.7% 71.6% 71.3% San Juan Unified 47,456 15.6% 16.1% 15.7% 23.9% 21.4% 22.1% San Bernardino City Unified 43,685 55.6% 60.0% 56.3% 62.5% 64.2% 63.6% Garden Grove Unified 41,472 39.0% 54.2% 47.0% 50.4% 60.1% 59.6% Stockton Unified 34,251 55.9% 57.2% 56.7% 55.8% 57.9% 57.3% Mt. Diablo Unified 34,076 18.2% 21.1% 18.6% 36.6% 35.2% 35.3% Riverside Unified 33,607 44.4% 43.7% 44.3% 50.1% 52.2% 51.6% Montebello Unified 32,321 62.3% 52.3% 56.4% 61.7% 70.1% 70.1% Elk Grove Unified 32,038 28.3% 38.9% 31.4% 44.0% 37.8% 41.0% Moreno Valley Unified 31,621 35.3% 39.1% 35.8% 41.4% 41.7% 41.5% West Contra Costa Unified 31,258 31.2% 42.4% 36.0% 53.9% 58.5% 55.5% Capistrano Unified 31,216 13.9% 11.6% 13.8% 15.0% 36.4% 34.4% San Jose Unified 30,905 34.3% 29.2% 32.8% 39.2% 46.7% 45.7% Sources: California Department of Education Enrollment by School Data and Free and Reduced Meals Program Data, 1993-1994
In 1993, almost 20 years before our new data was gathered, no racial or ethnic group in California attended
schools of overwhelming poverty. All groups of students were, on average, attending schools with
substantial middle-class enrollment. Whites attended schools that were 71 percent middle class, Asians 60
percent, blacks 48 percent, and Latinos 42 percent. Schools in Los Angeles, Santa Ana, Montebello, and
Long Beach (table 16) had substantially higher concentrations of poverty among Latinos, but there was
considerably more social class diversity in many other districts. San Francisco, under its desegregation plan,
had much a lower level of segregation. Big suburban districts like San Juan and Elk Grove had substantial
middle-class majorities among all groups.
The basic message of the new statistics compiled for this report is that, 60 years after Brown, California
shows no significant change in the segregation of its African American students, who have been highly
segregated since state statistics were first collected in the 1960s. Temporary gains from civil rights policies
have evaporated, and no state or local policies are significantly addressing this issue. The major difference is
that back in the 1960s blacks were heavily segregated with other blacks. Now they are heavily segregated
from whites and attending schools where two-thirds of students on average are poor, and the schools have
more than twice as many Latino as black students.
In contrast, the Latino story of recent decades is a one of a drastic increase in segregation. In 1970, Latino
students on average attended majority white schools in a state that still had a large white majority, though it
was beginning to change rapidly. Now Latino students attend schools with only one-sixth whites, three-
quarters poor children, and in some places with significant linguistic segregation. This change is related to
the much greater challenges faced by schools and more severe obstacles to children. Particularly dramatic is
these students’ isolation from qualified and experienced teachers, college-going curricula, well-prepared
fellow students, and schools that provide a strong path to college.
The data show that there are variations across the state and that school segregation is significantly linked to
housing segregation. We see both extremes—from the level of isolation in the Los Angeles-Inland Empire
area to the considerable diversity in some metro areas. This clearly suggests that housing issues are part of
the cause and should be part of the solution.
Segregating California’s Future, May 2014 Civil Rights Project/Proyecto Derechos Civiles
56 | P a g e
Conclusion and Recommendations Since the end of desegregation plans and the radical limitation of desegregation laws, the dominant reaction
has been to ignore the deepening segregation that is explored in this report. There is little new work that
explains the current reality and its impact, or that frames policy alternatives or develops techniques,
incentives supports, or strategies to guide the many schools and communities that have become far more
diverse and now face the possibility of resegregation. The basic reaction has been to give up and to assume
that there is some other way to provide equal opportunity. Clearly evident in these data is the fact that when
this problem is ignored it does not go away; it only gets worse and affects more schools and communities.
The problems associated with double and triple segregation which is the situation faced by California’s
Latinos, now the majority of the state’s students, are much worse than in the years following Brown, but
they are too often seen as something that cannot be changed. The fact that African Americans are segregated
from whites, Asians, and middle-class students while attending schools dominated by another disadvantaged
minority is virtually ignored. The enactment of California’s Local Control Funding Formula, with its effort
to create solutions for children who are poor, who need language development, or who have no family to
care for them (foster children), is a hopeful sign that policymakers have recognized that something must be
done. Now is the time to think about how to use that money and other resources to make California schools
less separate and more equal.
There are no current policy initiatives in California or even any significant discussion about the goals of
Brown. In schools the ruling is treated as a long-ago triumph that ended segregation, while nothing is said
about segregation’s powerful return and the virtual reversal of Brown by our courts is ignored. Segregation
is again being accepted as normal, and its spread into suburbia is not being addressed, although people are
leaving communities because of it.
One central institutional change in recent years has been a large expansion of charter schools, which do not
embrace any of the civil rights policies that worked in the more effective magnet schools. There are many
theories about how to make “failing” schools (which are mostly segregated schools of concentrated poverty)
better, but most of the policies are about increasing the pressure, threats, and sanctions on these schools and
their teachers. Another popular theory is that any school not run by a school district will, in its nature, be
better and offer students a better choice. There is no significant empirical evidence that any of these theories
works, and yet, strangely, there is also little discussion of policies that will give students who are locked
Segregating California’s Future, May 2014 Civil Rights Project/Proyecto Derechos Civiles
57 | P a g e
into weak segregated schools access to schools with strong performance records, staffs, and curricula—
schools that could clearly make a difference in their lives.
Segregation is so deeply embedded and so severe in major segments of California that the first step should
simply be to take a serious, systematic look at the level of segregation by race, poverty, and language in
each region, and the degree to which it is related to unequal opportunities and unequal outcomes. The state
and local data systems will not support a serious longitudinal analysis that follows individual students, but
the simple and stark pattern of separation by race and poverty and its relationship with obviously key
aspects of educational opportunity should be given serious consideration. Academic researchers, education
leaders, journalists, and others need to examine the data and write and talk about what they find. We are
making available data on the segregation levels of all school districts in California.
Since school choice is a major aspect of contemporary reform, state and local school authorities and policy-
makers need to make sure that schools of choice must systematically reach out to all sectors of their
potential audience and plan for and welcome diversity in their schools. The basic requirements of equitable
choice plans are clear: real and worthwhile educational options, good information and outreach to parents of
all communities, lottery selection from among those interested rather than entrance requirements and
screening, diversity plans and a welcome to all, and free transportation so that choices are not controlled by
residential isolation or access to private transportation. Many existing choice options usually fall so far short
that they actually foster isolation and inequality.
Because many communities are either diverse or becoming diverse, while many once diverse are losing
diversity and threatening to spread segregation and its educational and social disadvantages, states, cities,
suburbs, and metropolitan organizations need to support plans to achieve successful and lasting diversity
and to avoid resegregation and its consequences. Successful efforts include clear goals, coordination of
housing and educational policy, and effective outreach to all groups so a community does not become
known as being nonwhite, which is a self-fulfilling prediction. These strategies must include methods to
keep schools integrated and effective, to avoid any symptoms of neighborhood decline or crime, and to be
certain that all staff members are welcoming to all. They also should include prosecution for racial steering
that guides whites and Asians away from and blacks and Latinos into changing neighborhoods. Many
suburbs do not know how to do these things and receive no good advice or assistance, thus change often
simply happens and people leave the community, first whites and then middle-class families of all races.
The state, counties, nonprofits, universities, and others need to provide assistance and advice to minimize
Segregating California’s Future, May 2014 Civil Rights Project/Proyecto Derechos Civiles
58 | P a g e
resegregation and help communities achieve stable integration, a situation that is attractive to many people
of all races and tends to attract and hold strong teachers and administrators.
We must prosecute discrimination. Districts with declining white, Asian, and middle-class enrollments often
take measures to provide special options or charter schools to appeal specially to those students. When this
is done through racial gerrymandering of attendance boundaries and unfair operation of choice programs, it
may be a constitutional violation, as it denies equal protection of the laws to the excluded Latino and black
students. Similarly, when charter and choice schools deny services to language minority students or send
them to other schools, they are violating the 1964 Civil Rights Act. Systemic and disproportionate
assignment of minority students to special education classes, or using discipline and suspension in unfair
ways, are among the issues that could lead to federal investigations, civil rights litigation, and ultimately
new remedies.
Racial diversity and racial change are not things teachers and administrators automatically know about.
Understanding students, their families, and their cultures is not only helpful but essential. Teachers need
training in well-researched methods for handling diversity and potential division in their classes in positive
ways. Administrators play a central role in setting the norms and the climate of their schools, which can
have a significant impact. Solid training in these issues should be required in college teaching programs, and
teachers and administrators should be offered continuing professional training, particularly in times of major
change. Obviously these efforts would be greatly aided by seriously increasing the number of teachers and
administrators from California’s communities of color.
Given the tremendous richness of California students’ linguistic and family backgrounds, the state and the
school districts should systematically plan to expand dual immersion schools, where instruction is carried
out in two languages with groups of students who are fluent speakers of each. These schools should offer
quality programs and be rapidly expanded, as they have the particular advantage of creating positive and
equal status between the two groups, each of which has something very valuable to help the other acquire
important learning.
Create regional collaborations. In our intensely interconnected society, we often create regional
collaborations about many issues far less important than the preparation of the next generation of our society
and our workforce. Many valuable educational experiences that cannot be offered within individual school
districts could be offered regionally, thus expanding options for all families. The state and private
Segregating California’s Future, May 2014 Civil Rights Project/Proyecto Derechos Civiles
59 | P a g e
foundations and county school authorities need to crystallize these collaborations and figure out the treaties
that are needed between systems to finance, staff, and supervise these new institutions. State and federal
incentive funding that could deal with the fears of losing revenue would ease some of the major barriers.
Regional collaborations could develop and operate regional magnet and transfer programs that have been
very successful in other locations. Most segregation is among school districts, not within them, and we
should take any opportunities to offer powerful new educational options that make it possible for students of
all races to voluntarily cross those lines of division and create school communities that would reflect the
diversity of our society.
Support and revive civil rights organizations. Civil rights organizations, including MALDEF, the
NAACP Legal Defense Fund, the ACLU, and others, have a critical role to play in any process of change.
California organizations alone do not have sufficient staff and resources to do the research and the work that
needs to be done. Citizens and foundations need to support these organizations in undertaking serious
campaigns to change the existing patterns of school inequality.
Anyone reading these recommendations has probably asked herself or himself about what should be done to
make segregated schools more equal. Since there will be a great deal of segregation in any case, it is
obviously critical to have a strategy for the many schools that are likely to remain profoundly segregated for
the foreseeable future. Although there is no proven systemic strategy to make segregated schools equal, they
can and must be made less unequal. We close with a few key recommendations.
Create college preferences for those in segregated high schools. Since preparation for college is
profoundly unequal in our highly segregated high schools and the majority of Latino and African American
students in these schools do not get a fair chance to prepare in an extremely competitive system, they should
be given extra consideration in college admissions decisions and support at the beginning of their college
careers to help make up for what they would have received in middle-class high schools.
Expanded learning opportunities are critical. Since students who attend schools in segregated areas of
concentrated poverty typically begin school far behind other children and experience growing gaps over
time, it is critical to provide them with expanded learning opportunities. These would include preschool
conducted by professionally trained teachers, training for parents, and addressing health issues early.
Segregated schools often water down the curriculum to deal with students’ lack of readiness for school and
the excessive focus on test preparation due to by accountability policies. These students need a challenging
Segregating California’s Future, May 2014 Civil Rights Project/Proyecto Derechos Civiles
60 | P a g e
curriculum, but also strong support and tutoring for those students who start behind. For students to be able
to catch up, they need professional after-school and summer supplemental learning opportunities, including
credit recovery programs effectively linked with the school, rather than ineffective grade-retention practices.
Since the beginning of high school is especially risky in these schools, ninth-grade academies should be
offered to address problems with courses and other precursors to dropping out. AP and honors programs,
often missing in these schools, must be provided.
More support is needed to recruit, train, and retain diverse and skilled educators. A basic scandal of
American education is that we provide the weakest teachers for the students most needing skillful help and
strong instruction. Since teachers are a school’s most important resource, we must assign and retain
experienced and skilled administrators in the most profoundly inadequate schools. To attract and hold such
personnel, we must provide fair evaluation systems that reward teachers who make a real difference, rather
than systems that are punitive in design and arbitrary in requirements.
Investing in educators’ cultural and linguistic competency is crucial. Colleges and school districts must
work together to recruit and retain a more diverse teaching force to provide more teachers with personal
experience in underserved communities and inspire a desire to serve there. All levels of government should
support special training in impoverished schools to foster intercultural understanding and stronger relations
between parents and teachers and administrators. Since most of the families sending children to doubly and
triply segregated schools do not speak English as their home language, special priority should be given to
teachers who have the language skills needed to effectively teach non-native speakers of English and
communicate with their families
More health and counseling services are needed at schools for the entire family. Children of poor
families in isolated neighborhoods would be greatly helped by school-based health and social-service
centers to deal with the problems of students and their families. If a student cannot see or hear well or has a
chronic untreated health problem, their teachers face tremendous obstacles they cannot solve. Such families
often face instability and disruption caused by economic and housing and other problems, and live in
communities without accessible information about what students need to do to achieve adult success. We
need counseling and social work resources for impoverished schools, especially to give advice about
dropout prevention, course choices, testing, and access to post-secondary education, as well as the severe
out-of-school problems many students face.

Segregating California’s Future, May 2014 Civil Rights Project/Proyecto Derechos Civiles
61 | P a g e
Replace punitive school discipline with positive approaches that keep students in school. A basic
standard for schools serving these communities should be to avoid anything that makes an already
challenging situation worse. This includes ending discretionary suspensions and misplacements in special
education, and replacing them with research-based in-school alternatives. Staffs will need training and
support in using these approaches.
Offer real choices. In a period that emphasizes student choice, students in segregated schools need
authentic choices, not to attend simply another segregated impoverished school or a charter school in their
neighborhood. All students in segregated schools should have options to transfer to magnet and other
stronger schools, including free transportation. This is extremely critical for high-achieving students who
need a stronger school setting to develop their potential and to be prepared for the competition and diversity
of the best colleges.
California’s new Local Control Funding Formula is an equity-focused policy and funding strategy that is
entirely consistent with these recommendations. As districts around the state make their choices about the
use of this very important new resource, it is critical to for educators and citizens to keep in mind the
fundamentally unequal opportunities we provide in schools that are segregated by race, ethnicity, poverty,
and language. Since we have allowed these problems to become so profound and because even starting to
reverse them will be challenging and take a good deal of time, it is vital to use these funds to help address
some of the inequalities that face students in these unequal and separate schools while also expanding their
real choices.
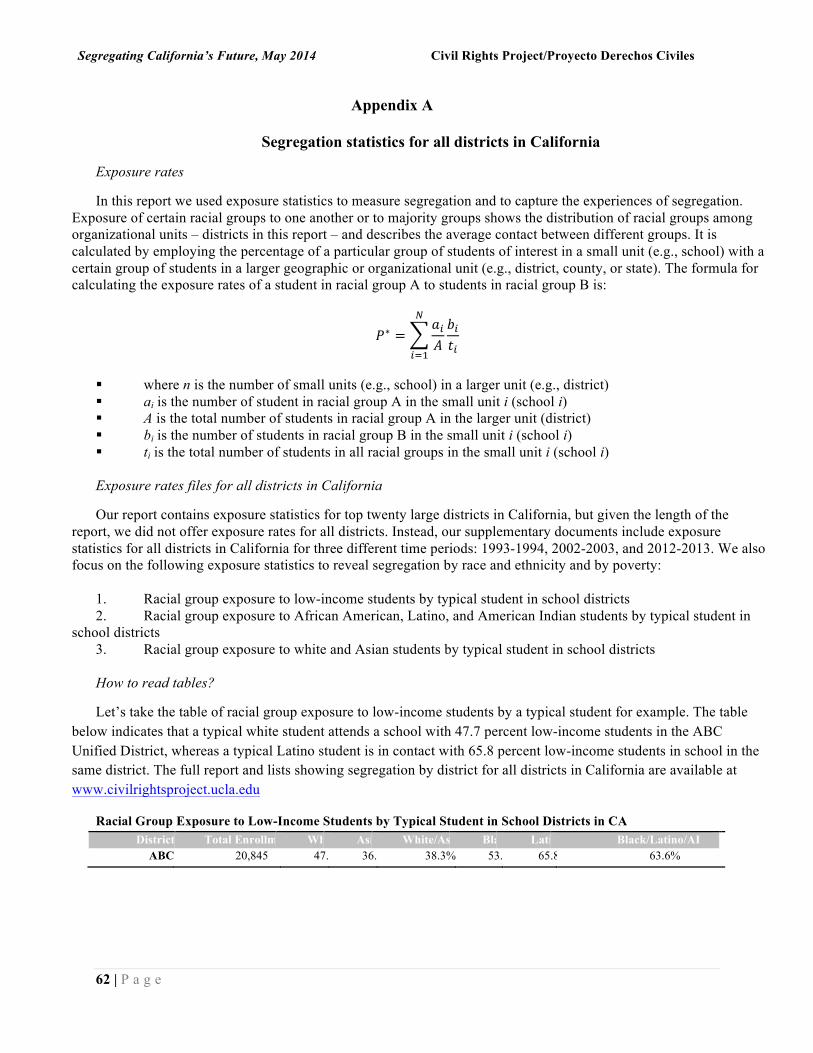
Segregating California’s Future, May 2014 Civil Rights Project/Proyecto Derechos Civiles
62 | P a g e
Appendix A
Segregation statistics for all districts in California Exposure rates In this report we used exposure statistics to measure segregation and to capture the experiences of segregation.
Exposure of certain racial groups to one another or to majority groups shows the distribution of racial groups among organizational units – districts in this report – and describes the average contact between different groups. It is calculated by employing the percentage of a particular group of students of interest in a small unit (e.g., school) with a certain group of students in a larger geographic or organizational unit (e.g., district, county, or state). The formula for calculating the exposure rates of a student in racial group A to students in racial group B is:
𝑃∗ =𝑎!𝐴
!
!!!
𝑏!𝑡!
§ where n is the number of small units (e.g., school) in a larger unit (e.g., district) § ai is the number of student in racial group A in the small unit i (school i) § A is the total number of students in racial group A in the larger unit (district) § bi is the number of students in racial group B in the small unit i (school i) § ti is the total number of students in all racial groups in the small unit i (school i) Exposure rates files for all districts in California Our report contains exposure statistics for top twenty large districts in California, but given the length of the
report, we did not offer exposure rates for all districts. Instead, our supplementary documents include exposure statistics for all districts in California for three different time periods: 1993-1994, 2002-2003, and 2012-2013. We also focus on the following exposure statistics to reveal segregation by race and ethnicity and by poverty:
1. Racial group exposure to low-income students by typical student in school districts 2. Racial group exposure to African American, Latino, and American Indian students by typical student in
school districts 3. Racial group exposure to white and Asian students by typical student in school districts How to read tables? Let’s take the table of racial group exposure to low-income students by a typical student for example. The table
below indicates that a typical white student attends a school with 47.7 percent low-income students in the ABC Unified District, whereas a typical Latino student is in contact with 65.8 percent low-income students in school in the same district. The full report and lists showing segregation by district for all districts in California are available at www.civilrightsproject.ucla.edu
Racial Group Exposure to Low-Income Students by Typical Student in School Districts in CA District Total Enrollment White Asian White/Asian Black Latino Black/Latino/AI
ABC Unified 20,845 47.7% 36.5% 38.3% 53.5% 65.8% 63.6%