Embed Size (px)
Citation preview
11 The Interplay Between Sediment Supply, Subsidence, and Basin Fill
11.1 Introduction Principal Factors Controlling Basin Filling General Remarks to Basin-Filling Models The Elementary Approach in This Book
11.2 Denudation-Sediment Accumulation (DA) 482 Systems
11.2.1 General Concept 11.2.2 Simple Steady-State Models,
Clastic Sediments Over-Supplied Basins Basins with Moderate to Low
Sediment Supply Influence of Several Sediment Sources Transition to Dynamic Models
(Change in Relief) 11.2.3 Modem Examples of Steady-State DA
Systems Open Lake Systems Adjacent Semi-Closed Basins:
The Black Sea Modem Closed Lakes and Larger Basins The Great Salt Lake and Lake Bonneville The Caspian Sea, Aral Sea, and Chad Basin
11.3 Dynamic Denudation-Accumulation (DA) Systems 11.3.1 Rebound by Unloading and Sediment 494
Load-Driven Subsidence 11.3.2 Variations in Subsidence and
Sediment Supply Two East African Lakes: A Comparison
11.3.3 Extensional Basin Models Rift Basins with Constant Sediment Supply Rift Basins with Varying Sediment Supply Rift-Drift Transition and Growing
Ocean Basins 11.3.4 Closing Basin Model 11.3.5 Foreland Basin Models 11.3.6 Pull-Apart Basins
(Dead Sea and Gulf of Califomia) 11.3.7 Summary (DA Basin Models)
11.4 Chemical Sediments (Evaporites) in Basin Filling 11.4.1 General Aspects 512 11.4.2 Mass Balances of Closed Lake Systems
(One Rock Type) 11.4.3 Evolution ofClosed Lake Basins
(Mixed Rock Types) 11.4.4 Summary (Evaporites in Basin Filling)
11.5 Distribution of Clastic Sediments in Water-Filled Basins
11.5.1 Introduction 11.5.2 Transfer ofRiver Sediments to
Marine Deltas Out- and Upbuilding of Sediment
from a Point Source Delta Prograding into Low- to
Medium-Energy Marine Basins Deltaic Sediments in High-Energy
Marine Basins 11.5.3 Sediment Accumulatioh in
Barrier-Lagoon Systems 11.5.4 Transfer ofRiver Sediments to
Deep-Sea Fans 11.5.5 Mud Deposition on Continental Shelves 11.5.6 Sediment Distribution in a Basin Chain 11.5.7 Long-Term Sediment Distribution
Along Passive Continental Margins Gulf of Mexico: Coast and
Shelf Progradation Northwestem AtIantic: Shelf-Slope-Deep
Sea Deposition 11.5.8 Global Marine Sediment Distribution 11.5.9 Summary (Sediment Distribution)
11.6 Consequences for Stratigraphie Sequences and
517
Facies Associations (Overview) 533 11.6.1 Vertical Facies Evolution: Three Principal
TYpes 11.6.2 Vertical and Lateral Facies Associations
(Overview) 11.7 Preservation and Recycling ofOlder Sediments 536
11.7.1 The Survival Rate of Sediment 11. 7.2 Recycling of Sediment 11.7.3 Sediment Loss along Subduction Zones 11.7.4 Summary (Global Sediment Recycling)
11.1 Introduction
Principal Factors Controlling Basin Filling
The filling of sedimentary basins and the architecture and facies associations of their sediments are generally controlled by the interaction between several
G. Einsele, Sedimentary Basins© Springer-Verlag Berlin Heidelberg 2000
11.1 Introduction
more or less independent factors (cf. Chaps. 7 and 9), including:
- Size and denudation characteristics (specific sediment yield) of land areas delivering terrigenous sediments. - Areal extent and geometry of the corresponding basin receiving sediment. - Biogenic sediment production in the basin itself. - Tectonic and total subsidence ofbasin floor as well as compaction of sediments. - Distribution of sediments in relation to the hydraulic regime ofthe water-filled basin or, on land, ofthe river system crossing and feeding the basin with sediment. - Relative sea-level or base-level changes and their frequencies and amplitudes.
U sing these parameters and taking into account their interrelationships, other, dependent variables may be derived, such as:
- Grain size distribution and lateral and vertical sedimentary facies successions within the basin, dependent, e.g., on water depth. - Sedimentation rates at different locations within the basin (e.g. exponentially declining seaward). - Occurrence and extent of carbonate buildups, etc.
These and other points have been intensely discussed recently in numerous articles and some special volumes dealing with computer simulations of sedimentary basins and their application in different fields of earth science, mainly in the oil industry. A thorough treatment of this complex topic is beyond the intention of this book, but it rnay be useful to discuss briefly some general principles related to basin modeling. After that, some simple basin-filling models are presented in which variations in terrestrial sediment supply are emphasized.
General Remarks to Basin-Filling Models
Basin-filling models or "quantitative dynamic stratigraphy" (Cross 1990) are a means of generalizing complex systems and of exploring the effects of varying parameters (Angevine et al. 1990). Basinfilling models can be subdivided into two groups:
(1) Geometric models characterize basins which have a constant surface geometry, for example a fluvial basin which subsides but is filled with sediments all the time. In this case, sedimentation rate and subsidence are in balance and rnaintain an equilibrium. Similarly, a coastal plain and the adjacent foreshore zone rnay maintain a fixed slope which is restored all the time, regardless of sea level fluctuations andlor
481
differential subsidence. Such models are relatively simple to construct. These models are not identical with the steady-state models introduced below in which sediment supply is kept constant. (2) Dynarnic models take into account sediment transport and the rate of deposition. Both tend to change laterally, i.e., downstream along rivers, or from the coastline toward the center of a basin. As a result, the geometry of the sedimentary surface rnay undergo significant modification with time. The basic concept of this approach is founded on the fact that the factors mentioned above and additional relevant processes can be subdivided into two groups (Lawrence et al. 1990; cf. also Sect. 7.2):
- Processes controlling the creation and destruction of space in a basin. - Processes controlling the introduction and removal of sediment.
For a given rate of space creation, the volume of sediment introduced into the basin controls how far the sediments pro grade seaward. If clastic sediment sources can be neglected, in situ biogenic sediment production is the principal factor interacting with space-creating processes (cf. Sect. 7.5). Most of the factors mentioned above are subjected to changes not only spatially (landward-seaward) but also during the evolution of a basin. The characteristics of the source area on land, the size and geometry of the basin, and processes within the basin may vary substantially with time. Such an evolution is referred to as "basin dynamics".
Forward numerical simulation of carbonate buildups, for example, is only possible under the assumption that empirical growth rates at different locations within a basin can be used (e.g. Aigner et al. 1989). In addition, lateral prograding of these buildups and their reactions to minor fluctuations of sea level have to be taken into account.
Various working groups are trying to simulate the evolution of sedimentary basins with the aid of computers (e.g., Strobel et al. 1989; Cross 1990; Lawrence et al. 1990; Hermanrud 1993; Weite et al. 1997; and others). This forward modeling is commonly carried out in two dimensions along transects and requires both a large data set and special training.
So far, most of the published computer models have been devised to produce two-dimensional cross-sections. Common examples are cross-sections of rift basins and passive continental margins. These models are normally based on both theoretical and empirical algorithms for the creating and filling of accommodation space within the basin.
The most important objectives ofthe models are simulations of (1) the stratigraphic architecture including the influence of relative sea-level changes, (2) the thermal history of the basin fill, and (3) fluid flow within the basin including hydrocarbon generation

482
and accumulation (e.g. Hennunrud 1993). It is evident that such models are becoming increasingly important in hydrocarbon exploration, i.e. in predicting the occurrence and distribution of source rocks, reservoirs, and seals in limited areas. With the aid of simulations, based on a limited number of data and assumptions, gaps in the existing data set can be partially closed, although there is no guarantee that the simulation is either correct or unique (e.g. Levell and Leu 1993). On the other hand, such models also have a high educational value. They help to better understand the theoretical background of basin evolution and to find out the influence of certain parameters on basin filling and its stratigraphical architecture.
The Elementary Approach in This Book
The approach in the following Sections is generally more elementary than the above mentioned computer models. It takes into account part of the variables listed above with emphasis on empirically determined data and can be done with small pocket calculators. Whereas most ofthe published computer models deal, for example, with the dynamic evolution and stratigraphic architecture of specific regions within a basin, the generalized models described below are not "dynamic" in the same sense. They actually represent entire basin systems, often including the source area of terrigenous sediments. They may therefore be regarded as models of denudation-sediment accumulation systems which differ in some aspects of the geometric and dynamic models mentioned above. I distinguish between:
- Steady-state systems. The areas of both the terrigenous sediment source and the receiving basin as weIl as the rates of denudation (sediment influx) and subsidence (unifonn over the entire basin) are kept constant. This type of model is useful for relatively short-period evaluations which are undertaken to clarify, for example, the relationship between the mean rates of denudation and sedimentation. - Dynamic systems. One or several of the basin parameters vary with time. (a) The rates of denudation (sediment influx) and subsidence change, while the areas of both sediment source and basin remain constant throughout the time considered. (b) Either the basin area or both the basin area and source area and thus also the sediment influx and sedimentation rate change with time. These models cover long time periods and describe various degrees ofbasin filling.
In all cases, only mean rates of denudation, subsidence and sedimentation for the entire drainage and basin areas are considered (apart from Sect. 11.5). The effects of sea-level or base-level changes are neglected here (cf. Chap. 7). The data used in the
Chapter 11 Sediment Supply, Subsidence, and Basin Fill
model calculations are adjusted to those found in nature for regions of similar characteristics. Several case studies supplement the results of the models. Inspite of the various generalizations, this exercise may serve as an introduction to more sophisticated basin simulations with the aid of computer programs.
11.2 Denudation-Sediment Accumulation (DA) Systems
11.2.1 General Concept
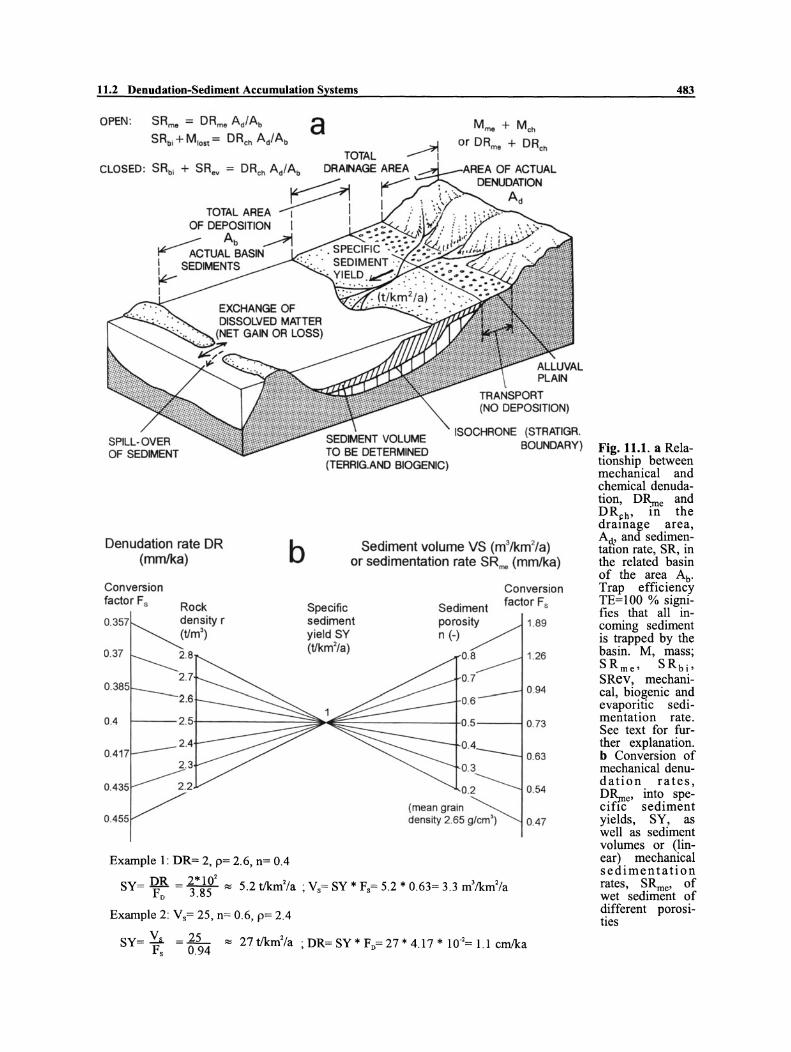
The method, evaluating denudation-sediment accumulation systems (in short: DA systems) as an interrelated unit, is based on the mass balance of terrigenous sediment eroded in the source area and accumulated in adjacent closed or semi-closed basins. In other words, the denudation area on land and the depositional basin constitute a closed erosiondepositional system (e.g. Hay et al. 1989; Leeder 1991 and 1997; Einseie and Hinderer 1998). Denudation in the source area, although varying from 10-cality to locality, can be expressed in terms of masses of mechanical and chemical denudation, Mme and Mcb (Fig. l1.1a). It is assumed that no sediment is intermittently stored or reworked along the way from the source to the basin (delivery ratio = 1). Mme provides terrigenous material which can be entirely trapped in the depositional area (trap efficiency· TE=100%, sedimentologically closed basin). The situation is different for Mcb' In hydrologically open systems part of it (mainly MbJ is used to produce biogenic sediment, the remainder is lost to neighboring basins or the open sea. In closed systems part of Mcb can fonn evaporites (Mev)'
The masses of solid and dissolved material can be converted into specific yields (SY, mass per unit area and time, e.g. in metric tonsIkm2/a, cf. Sect. 9.2 and 9.3) or rates of denudation, D~e and DR.,b' and rates of mechanical, biogenic, and evaporitic sedimentation, S~e' SRbj, SR.v or SR.,b (m3/km2/a or mmIka or mlMa). All these tenns describe mean values under the assumption that the masses of mechanical and chemical denudation and deposition are distributed evenly over the total drainage and basin areas. In addition, mean rock densities and sediment densities have to be known to detennine (linear) denudation and sedimentation rates (for conversion factors see Fig. 11.1 b). A method to detennine the volume of compact (pore-free) sediment from isopach maps is explained in Section 11.3.6 (Gulf of Califomia).
The principal premise of this approach is that the mass of terrigenous sediment accumulating in the basin per time unit is equal to the mass of material eroded mechanically in the drainage basin. This premise also applies to open basins with sills at their outflow or to deep-sea fans of known extent. Then theofollowing calculations can be carried out:
11.2 Denudation-Sediment Accumulation Systems
OPEN: SRme = DRme Ad/Ab a SRbi + MIOS! = DRch Ad/Ab
Mme + MCh
or DRme + DRch
TOTAL CLOSED: SRbi + SRev = DRch Ad/Ab DRANAGE AREA
TOTAL AREA ~ : OF DEPOSITION I
. _____ Ab ,.A ~ ACTUAL BASIN \ SEDIMENTS jkI
SPILL·OVER OF SEDIMENT
Denudation rate DR b (mmlka)
Conversion factor Fs Rock
0.357 density r (tim)
0,37 2,8
2.7 0,385
2.6
0.4 2.5
2.4 0.417
2,3
0.435 2,2
0.455
Example 1: DR= 2, p= 2.6, n= 0.4
SEDIMENT VOLUME ISOCHRONE (STRATIGR.
TO BE DETERMINEO (TERRIG.AND BIOGENIC)
BOUNDARY)
Sediment volume VS (m3/km2/a) or sedimentation rate SR"" (mmika)
Conversion
Specific Sediment factor Fs
sediment porosity 1.89 yield SY n (-) (tlkm2/a)
0.8 1.26
0.7 0.94
0.6
0.5 0.73
0.4 0,63
0.3
0.2 0.54
(mean grain density 2.65 g/cm') 0.47
SY= ~~ = rit ~ 5.2 t/km2/a ; V s= SY * Fs= 5,2 * 0,63= 3.3 m3/km2/a
Example 2: V s= 25, n= 0.6, p= 2.4
SY= ~ = 12- ~ 27 tJkm2/a ; DR= SY * Fo= 27 * 4,17 * 10.2= 1.1 cmlka Fs 0.94
483
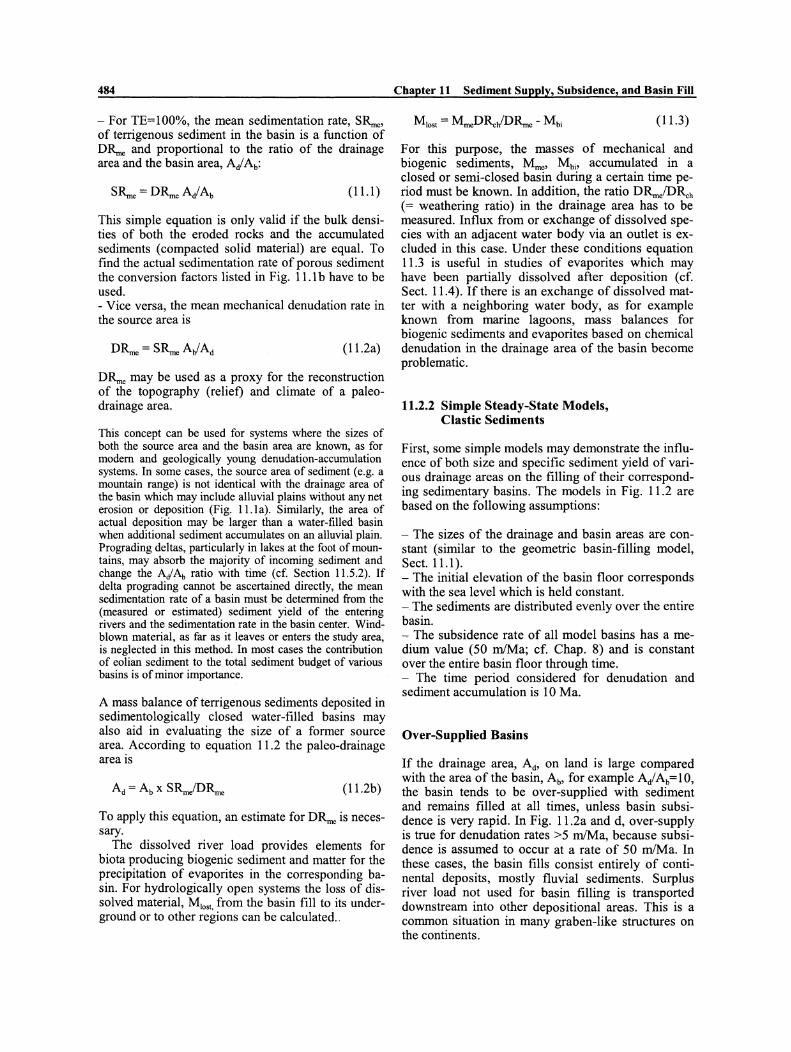
Fig. 11.1. a Relationship between mechanical and chemical denudation, D~e and DR~h' in the dramage area, Ad,> and sedimentatlOn rate, SR, in the related basin of the area Ab. Trap efficiency TE= 100 % signifies that an incoming sediment is trapped by the basin. M, mass; SR me , SRbj ,
SRev, mechanical, biogenic and evaporitic sedimentation rate. See text for further explanation. b Conversion of mechanical denudation rates, D~e' into speciflC sediment yields, SY, as wen as sediment volumes or (linear) mechanical sedimentation rates, S~e' of wet sediment of different porosities
484
- For TE=100%, the mean sedimentation rate, S~e' of terrigenous sediment in the basin is a function of D~e and proportional to the ratio of the drainage area and the basin area, Ai Ab:
(11.1 )
This simple equation is only valid if the bulk densities of both the eroded rocks and the accumulated sediments (compacted solid material) are equal. To find the actual sedimentation rate of porous sediment the conversion factors listed in Fig. 11.1 b have to be used. - Vice versa, the mean mechanical denudation rate in the source area is
(l1.2a)
D~e may be used as a proxy for the reconstruction of the topography (relief) and climate of a paleodrainage area.
This concept can be used for systems where the sizes of both the source area and the basin area are known, as for modem and geologically young denudation-accumulation systems. In some cases, the source area of sediment (e.g. a mountain range) is not identical with the drainage area of the basin which rnay include alluvial plains without any net erosion or deposition (Fig. ll.la). Similarly, the area of actual deposition may be larger than a water-filled basin when additional sediment accumulates on an alluvial plain. Prograding deltas, particularly in lakes at the foot of mountains, may absorb the majority of incoming sediment and change the Ar/Ab ratio with time (cf. Section 11.5.2). If delta prograding cannot be ascertained directly, the mean sedimentation rate of a basin must be determined from the (measured or estimated) sediment yield of the entering rivers and the sedimentation rate in the basin center. Windblown material, as far as it leaves or enters the study area, is neglected in this method. In most cases the contribution of eolian sediment to the total sediment budget of various basins is of minor importance.
A mass balance of terrigenous sediments deposited in sedimentologically closed water-filled basins may also aid in evaluating the size of a former source area. According to equation 11.2 the paleo-drainage area IS
(11.2b)
To apply this equation, an estimate for D~e is necessary.
The dissolved river load provides elements for biota producing biogenic sediment and matter for the precipitation of evaporites in the corresponding basin. For hydrologically open systems the loss of dissolved material, Mlo,t from the basin fill to its underground or to other regions can be calculated ..
Chapter 11 Sediment Supply, Subsidence, and Basin Fill
(11.3)
For this purpose, the masses of mechanical and biogenic sediments, M",e, Mbi, accumulated in a closed or semi-c1osed basin during a certain time period must be known. In addition, the ratio D~/DR:h (= weathering ratio) in the drainage area has to be measured. Influx from or exchange of dissolved species with an adjacent water body via an outlet is excluded in this case. Under these conditions equation 11.3 is useful in studies of evaporites which may have been partially dissolved after deposition (cf. Sect. 11.4). If there is an exchange of dissolved matter with a neighboring water body, as for example known from marine lagoons, mass balances for biogenic sediments and evaporites based on chemical denudation in the drainage area of the basin become problematic.
11.2.2 Simple Steady-State Models, Clastic Sediments
First, some simple models may demonstrate the influence of both size and specific sediment yield of various drainage areas on the filling of their corresponding sedimentary basins. The models in Fig. 11.2 are based on the following assumptions:
- The sizes of the drainage and basin areas are constant (similar to the geometrie basin-filling model, Seet. 11.1). - The initial elevation of the basin floor eorresponds with the sea level whieh is held eonstant. - The sediments are distributed evenly over the entire basin. - The subsidenee rate of all model basins has a medium value (50 mlMa; cf. Chap. 8) and is constant over the entire basin floor through time. - The time period eonsidered for denudation and sediment accumulation is 10 Ma.
Over-Supplied Basins
If the drainage area, Ad, on land is large compared with the area ofthe basin, Ab' for example AiAb=10, the basin tends to be over-supplied with sediment and remains filled at all times, unless basin subsidence is very rapid. In Fig. 11.2a and d, over-supply is true for denudation rates >5 mlMa, beeause sub sidence is assumed to oceur at a rate of 50 mlMa. In these cases, the basin fills eonsist entirely of eontinental deposits, mostly fluvial sediments. Surplus river load not used for basin filling is transported downstream into other depositional areas. This is a eommon situation in many graben-like structures on the continents.

11.2 Denudation-Sediment Accumulation Systems
+0.
POTENTIAL.: SEDIMENT ACCUMULATION IN 10 Ma: 10 km
POTENTIAL SEDIMENT ACCUMULATION IN 10 Ma:
1.000 m
100 m
100 m CLASTICS
485
HIGH RATE OF MECHANICAL DENUDATION
(100 m/Ma)
..... SEA LEVEL
SUBSIDENCE 50 m/Ma
c
CLASTIC BIOGENIC MARINE SEDIMENTS
LOW RATE OF MECHANICAL DENUDATION
(10 m/Ma)
f
{.' .................. SEA LEVEL
SUBSIDENCE 50 m/Ma + 100 m BIOGENIC COMPONENTS 10m CLASTICS + 100 m BIOGENIC COMPONENTS
Fig. 11.2. Simple scheme demonstrating the relationship between mean mechanical denudation rates, ratio Aq/Ab of denudation area, Ad, and basin area, Ab' and subsidence rate. All rates are kept constant and the time period for basin evolution is 10 Ma for the different scenarios. The initial basin floor corresponds to sea level. a High to medium Ai Ab (= 1 0 or 1) values and high to moderate denudation rates (a,b,d) cause rapid basin filling with fluvial
Exceptions from this rule are grabens or rift zones in a stage of initial rapid subsidence (on the order of 200 m1Ma, see Chap. 8.3) which, in addition, have a comparatively
deposits up to an elevation at which most sediment is carried away into other regions. With AiAb=O.1 (e,f) and 1 (e), terrigenous clastics cannot fully compensate for subsidence: deepening basins. For Ad/ Ab =0.1 and low terrigenous supply (f), autochthonous biogenic sediment accumulation (at a rate of about 10 mlMa) predominates over very low clastic sedimentation rate. See text for further explanation
small drainage area with slow denudation. In this case, the graben may be partially filled with lake or seawater (for example in the East African rift zone, Sect. 11.3.2), or the
486
a RAPID FILLING OF LAKE
STRONG INFLUENCE OF LATERAL SEDIMENT INFLUX
LlMITED INFLUECE OF LOW-RELIEF OR SM ALL SEDIMENT SOURCE
b
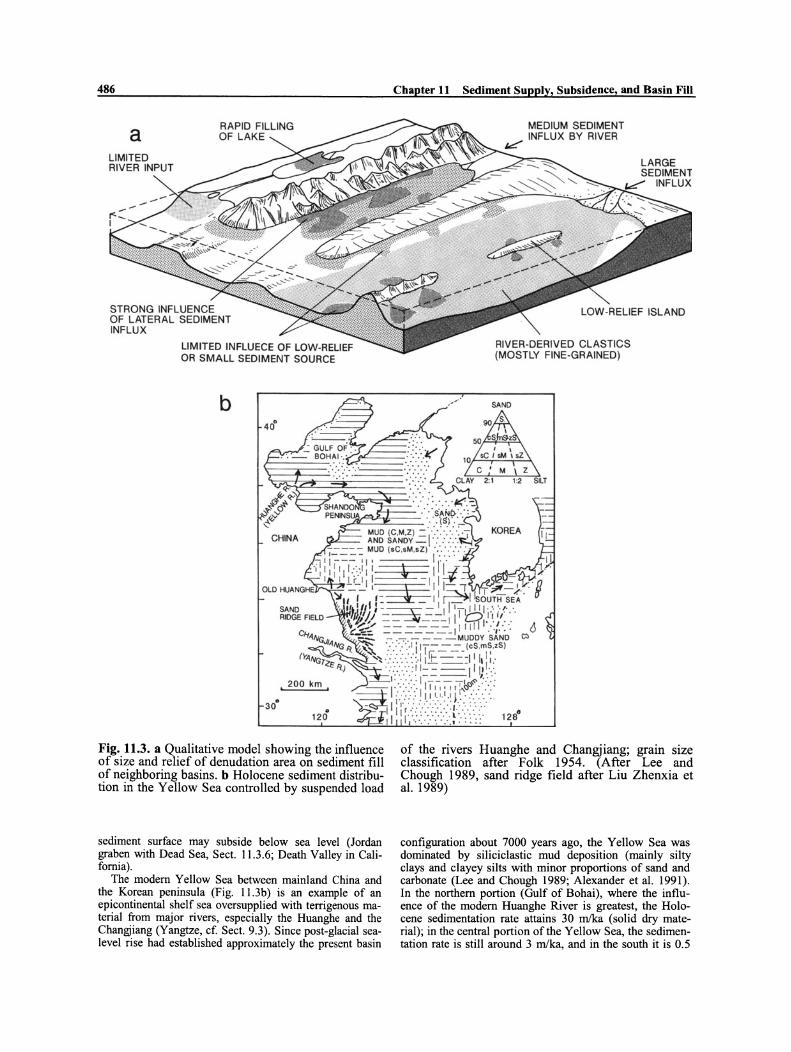
Fig. 11.3. a Qualitative model showing the influence of size and relief of denudation area on sediment fill of neighboring basins. b Holocene sediment distribution in the Yellow Sea controlled by suspended load
sediment surface may subside below sea level (Jordan graben with Dead Sea, Sect. 11.3.6; Death Valley in California).
The modern Yellow Sea between mainland China and the Korean peninsula (Fig. 11.3b) is an example of an epicontinental shelf sea oversupplied with terrigenous material from major rivers, especially the Huanghe and the Changjiang (Yangtze, cf. Sect. 9.3). Since post-glacial sealevel rise had established approximately the present basin
Chapter 11 Sediment Supply, Subsidence, and Basin Fill
MEDIUM SEDIMENT INFLUX SY RIVER
MC"
LOW -RELIEF ISLAND
RIVER-DERIVEO CLASTICS (MOSTLY FINE-GRAINED)
of the rivers Huanghe and Changjiang; grain size classification after Folk 1954. (After Lee and Chough 1989, sand ridge field after Liu Zhenxia et al. 1989)
configuration about 7000 years ago, the Yellow Sea was dominated by silicic1astic mud deposition (mainly silty c1ays and c1ayey silts with minor proportions of sand and carbonate (Lee and Chough 1989; Alexander et al. 1991). In the northern portion (Gulf of Bohai), where the influence of the modern Huanghe River is greatest, the Holocene sedimentation rate attains 30 mika (solid dry material); in the central portion of the Yellow Sea, the sedimentation rate is still around 3 mika, and in the south it is 0.5
11.2 Denudation-Sediment Accumulation Systems
to 1 mika. The highest rates were found in prodelta areas characterized by very gently inc1ined foresets and proximal bottomsets. All these rates appear to be in good agreement with the amount of suspended load which the rivers discharge into the sea (Yellow River on the order of 1 x 10 9
tla). Under steady-state conditions, but with a rate of subsidence lower than the mean sedimentation rate, the Yellow Sea will become filled up with sediments in a very short geological time period. The effects of land use in the huge loess region of northem central China are not considered here.
Basins with Moderate to Low Sediment Supply
Given a ratio of Ai Ab ~ 1, the denudation rate on land predominantly controls whether or not the basin will be filled with continental or aquatic sediments. High and medium denudation rates (Fig. 11.2b) still deliver more sediment volume than required for basin filling due to moderate subsidence (50 m1Ma). A low denudation rate (Fig. 11.2e) only leads to insufficient sediment supply and thus to a deepening basin with lake or marine sediments. In this case, half of the sediment may be autochthonous, provided the biogenie sediment production reaches a medium value of 10 mlMa,
With decreasing Ad/Ab (= 0.1 in Fig. 11.2c and f), even a high rate of denudation is not able to fill the basin and compensate for subsidence. To get equilibrium between subsidence and sediment buildup (50 mlMa) a denudation rate of 500 mlMa is necessary in this case. Under the assumptions of (c) only one half of the resulting marine sediment is terrigenous which is typical of hemipelagic sediments in the modern oceans. Adl Ab =0.1 in combination with low denudation eventually leads to predominantly bio genie marine sediments containing only a small fraction of land-derived material. This model approximates the conditions of pelagic sedimentation in large ocean basins some distance away from a continent (see below).
Influence of Several Sediment Sources
The influence of various terrigenous sediment sources on basin fills is shown qualitatively in Fig. II.3a. Rivers flowing through lakes before they reach the sea deposit their bed load and suspended load in the lake and therefore carry little material into the sea. A high-relief mountain range bordering the sea may exert a strong influence in terms of sedimentation rate, texture, and composition on the filling of a neighboring basin, even if a medium to major river from a large hinterland enters the same basin. Lowrelief peninsulas and islands of limited extension commonly shed small amounts of clastic material into the sea compared with major rivers draining
487
large areas of differing relief and climate. For this reason, the existence of islands in large, ancient ocean basins is often difficult to assess from the basin fill, unless the island differs significantly in its petrographie characteristics from the other, volumetrically predominating sediment sourees.
Sediment budgets of some closed and half-closed basins are described below, those of accretionary wedges are discussed in Section 12.5.
Transition to Dynamic Models
If at least one of the factors controlling basin filling changes during basin evolution, the steady-state system defined above is transformed into adynamie system. This occurs, for example when the relief in the drainage area is enhanced with time by tectonic uplift. This will lead to strongly increased input of terrigenous material (cf. Sect. 9.3) and thus to a shallowing and ultimately fluvial depositional environment (e.g. for AiAb=l; Fig. 11.2e). Simultaneously, the proportion of terrigenous material will increase at the expense of bio genie components (as, e.g., on the Texas-Louisiana shelf, cf. Fig. 11.32a-c). On the contrary, a lowering of relief in the denudation area diminishes the ratio of terrigenous and bio genie sediment components and causes basin deepening, provided the subsidence rate remains constant.
11.2.3 Modern Examples of Steady-State DA Systems
Considering short time periods of some thousand years (e.g. in the Holocene) changes in the characteristics of the drainage area (size, relief, climate, etc.) and basin area (size, subsidence, etc.) can be largely neglected. Such systems are here referred to as "steady-state" systems in which sediment yield from land areas and the mean sedimentation rate of terrestrial material do not significantly change with time. U nder favorable conditions (e.g. limited erosion and slow basin floor subsidence) steady-state conditions mayaiso be assumed for some millions of years. Examples of quasi-steady-state systems are young lake basins and some larger basins located either on continental ernst or adjacent to great ocean basins.
Open Lake Systems
Lake basins originate from different processes (Sect. 2.5). Many of them are small and display negligible subsidence of their basin floor in relation to the surrounding land areas and compared with the high sedimentation rates in the lakes (often > 1 mmJa). Such
488
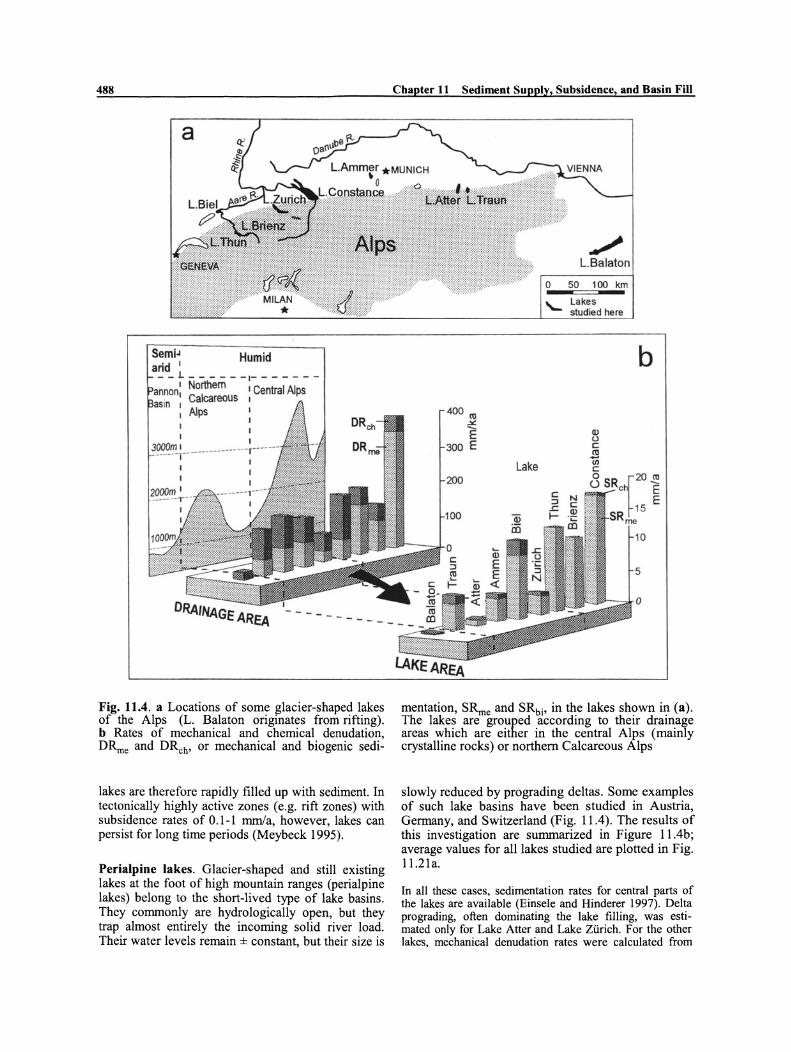
a
Semi~ Humid arid 1 __ L ______ 1_ - - - - - -
1 Northem I Central Alps Calcareous 1
Alps
1 3000m 1 ____ • ____ • __ __ _ ,. __ ._. _
T -
--- ---
Fig. 11.4. a Locations of some glacier-shaped lakes of the Alps (L. Balaton originates from rifting). b Rates of mechanical and chemical denudation, D~e and DReh' or mechanical and biogenic sedi-
lakes are therefore rapidly filled up with sediment In tectonically highly active zones (e.g. rift zones) with subsidence rates of 0.1-1 mmJa, however, lakes can pers ist for long time periods (Meybeck 1995).
Perialpine lakes. Glacier-shaped and still existing lakes at the foot of high mountain ranges (perialpine lakes) belong to the short-lived type of lake basins. They commonly are hydrologically open, but they trap almost entirely the incoming solid river load. Their water levels remain ± constant, but their size is
Chapter 11 Sediment Supply, Subsidence, and Basin Fill
400 1'0 ..><:
E 300 E
200 Lake
./ L.Balaton
o 50 100 km
'- Lakes studied here
b
201'0
10
5
o
E E
mentation, S~e and SRbi, in the lakes shown in (a). The lakes are grouped according to their drainage areas which are either in the central Alps (mainly crystalline rocks) or northem Calcareous Alps
slowly reduced by prograding deltas. Some examples of such lake basins have been studied in Austria, Germany, and Switzerland (Fig. 11.4). The results of this investigation are summarized in Figure il.4b; average values for alllakes studied are plotted in Fig. 11.21a.
In all these cases, sedimentation rates for central parts of the lakes are available (Einseie and Hinderer 1997). Delta prograding, often dominating the lake filling, was estimated only for Lake Atter and Lake Zürich. For the other lake'S, mechanical denudation rates were calculated from

11.2 Denudation-Sediment Accumulation Systems
the river loads (bedloads and suspended loads). To determine the rates of chemical denudation and (biogenic) sedimentation, DR.:h and SReh, the dissolved river load entering and leaving the lakes as well as biogenic carbonate and silica production in the lakes were considered. Detrital carbonate derived from the drainage areas was added to the mechanical sedimentation rate.
Lake systems with drainage areas dominated by crystalline rocks of the Central Alps (group I) show higher DR me
and S~ but lower DReh and SReh values than lakes with drainage areas in the Northem Ca\careous Alps (group 2). The DR,.jDR.:h ratio is 2 to 6 for group I and <I for group 2 lakes. Biogenic carbonate (and also biogenie silica) only playa minor role in lake filling (10-30% in the centrallake sediments; much less in delta sediments). Of the chemical river load, 82-92% passes the lakes. Lake Balaton, a rifttype lake in Hungary (with low DR'otal and DRrne almost negligible), is an example for the effects of low relief and warmer, drier c1imate.
The present-day sediment storage capacity of these perialpine lakes is limited. Using the data of Fig. 11.4b, the lifetimes of the lakes can be estimated. They mainly range from ~ 15 to 40 ka.
Mass balances are also available for some glaciershaped lakes in British Columbia. The wide range in their mean sedimentation rates (1-40 mmla) rnainly results from differences in their ratios of drainagelbasin area, but variations in relief and climate also play a role. The impact of the Ad/ Ab ratio is shown for two examples, the Lillooet Lake and the Stave Lake, British Columbia, both of which lie in the humid zone close the Pacific coast.
About 13% of the Lillooet drainage area are covered by glaciers (SY=560 t/km2/a or 225 rnrnIka); the lake (ratio Aj Ab:::: 180) is mainly filled by rapid delta prograding (Owens and Slaymaker 1993; Desloges and Gilbert 1994). Thus the mean sedimentation rate (dry, related to a constant lake area) is 40 rnrnIa. In reality, the sedimentation rate in the lake center is only 1.6-3 rnrnIa.
The larger Stave lake (Aj Ab:::: 15) receives less sediment (200 tlkm2/a) from a smaller drainage area and therefore displays a mean sedimentation rate of 1.2 mrnIa which is much lower than that of the Lillooet lake.
Adjacent Semi-Closed Basins: The Black Sea
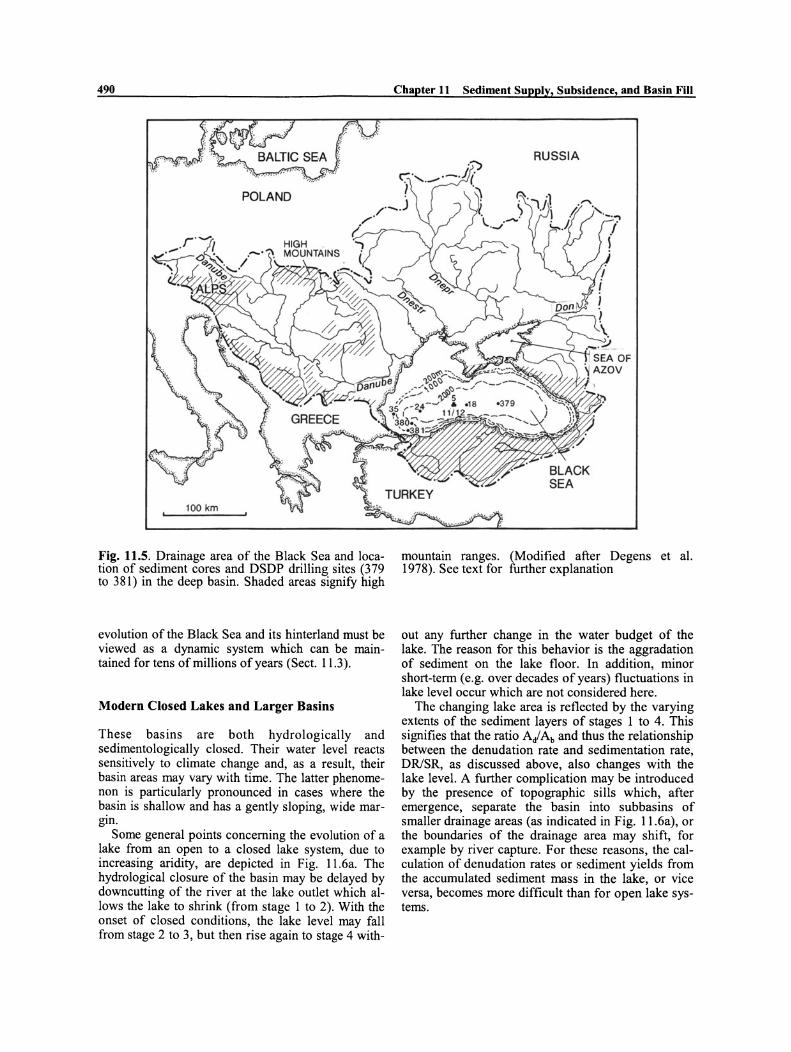
The modem Black Sea (cf. Sects. 4.3 and 9.6) represents an adjacent (backarc) basin with an opening to the Mediterranean Sea. It is a gigantic catch basin for the river discharge of half of Europe and part of Asia (Fig. 11.5). Degens et al. (1978) have calculated denudation rates from river loads and compared these values with observed sedimentation rates in the Black Sea.
The total drainage of the Black Sea comprises an area of 1.98 x 10⁶ km2; the basin area is 0.45 x 10⁶ km2 and AjAb=4.4. The shallow and narrow outlet ofthe Bosporus, connecting the Black Sea with the Mediterranean, allows
489
all the incoming river sediments to be trapped by the Black Sea.
The total suspended and dissolved river load transported into the Elack Sea amounts to 237 x 10 6 tla. The suspended load is slightly greater than the dissolved load. The Danube River delivers about 60% of the total river load. The Don and Kuban rivers discharge into the Sea of Asov, where most of their material is deposited. The Caucasian rivers from the east contribute about 20% of the total detritus.
As determined from their chemical and solid loads, the present-day denudation rates in the principal source areas vary from approxirnately 10 rnrnIka (drainage area of the Dnepr River) to 80 rnrnIka (Danube River; average rock density 2.5 t/m3). The average denudation rate for the total drainage system is 50 mmlka or 120 t/km 2/a); if it is only 20 rnrnIka for the lowlands, it increases to 120 mmlka in the mountainous regions (about 30% ofthe total area).
The estimation of the sediment volume in the Black Sea is based on data available for the deep part of the basin (Fig. 11.5) comprising ab out two thirds of the total basinal area. In the past 5000 years, the sedimentation rate of uncompacted sediment (70% porosity), including coccolith ooze, sapropel, and intercalated turbidites, was approximately 1000 mmlka (cf. Sect. 4.3) or about 300 mmIka for compacted, solid material. Normalized on the drainage area (Ad=4.4xAb), this value yields an average total denudation rate of about 70 mmlka.
The somewhat revised results of this study are shown in Fig. 11.5 (also cf. Fig. 9.19). The average denudation rates of 80 and 70 mmlka, determined independently by applying river load data and sedimentation rates, respectively, agree fairly well. Most of the dissolved river load is probably used up by organisms and deposited in the basin as biogenic carbonate and opaline silica. There is, however, also some exchange of dissolved material via the narrow passage of the Bosporus, but present-day water outflow from the Black Sea is greater than inflow (Sect. 4.3).
The denudation rates obtained in this study are characteristic of the steppe vegetation present in large parts of the drainage area. During times of more extensive forest growth, denudation was probably reduced by more than half. During such times, sapropels were preferentially deposited in the Black Sea basin. Similarly, in the course of Pleistocene glacial melting and loess mobilization in the hinterland, denudation and sedimentation rates increased considerably and may have reached values of up to about five times greater than those found for the Holocene.
Longer-term Quaternary sedimentation rates in the Black Sea were somewhat higher (up to about 1500 mmlka) than in the Holocene. The Quaternary sediments reached thicknesses up to 2.5 km in the western and 3 km in the eastern subbasin. For the entire Tertiary, the average sedimentation rates were lower than in the Holocene (in the order of 200 mrnIka, leading to a Tertiary sediment of 11 to 12 km in thickness; Okay et al. 1994; Robinson et al. 1996). The basin floor must have subsided at a rate of at least 200 mrnIka in the Neogene. Thus, the long-term
490
POLAND
100 km
Fig. 11.5. Drainage area of the Black Sea and location of sediment cores and DSDP drilling sites (379 to 381) in the deep basin. Shaded areas signify high
evolution of the Black Sea and its hinterland must be viewed as a dynarnic system which can be maintained for tens of millions of years (Sect. 11.3).
Modern Closed Lakes and Larger Basins
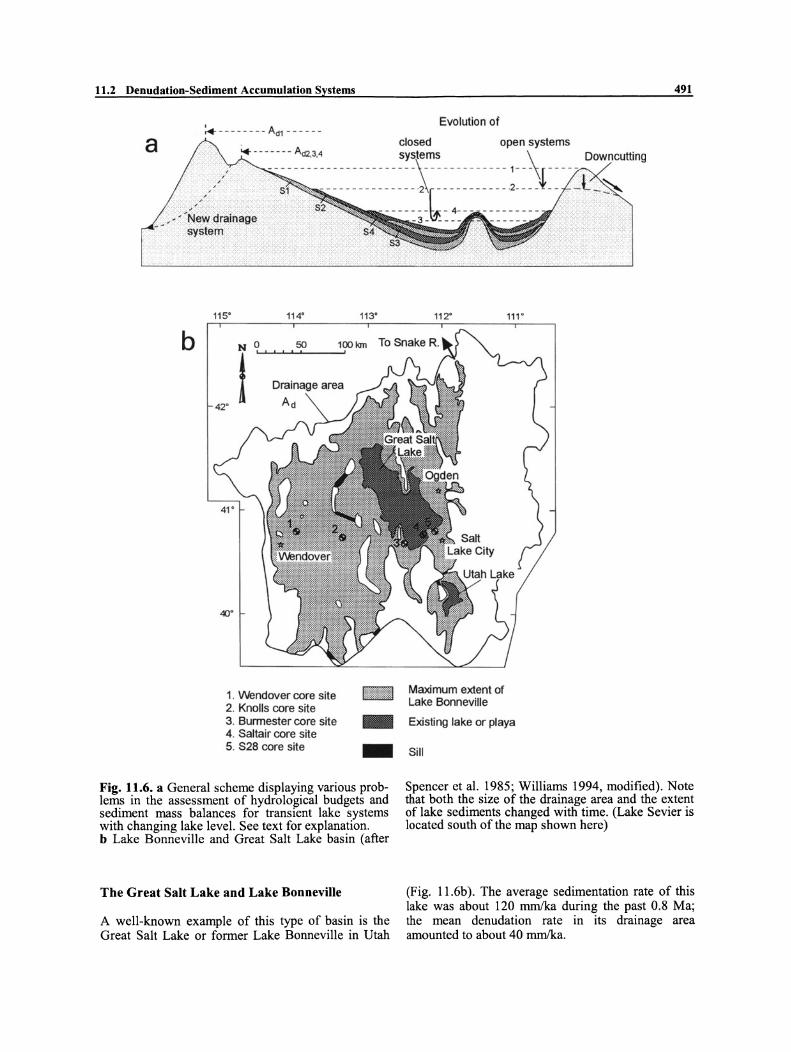
These basins are both hydrologically and sedimentologically cJosed. Their water level reacts sensitively to cJimate change and, as a result, their basin areas may vary with time . The latter phenomenon is particularly pronounced in cases where the basin is shallow and has a gently sloping, wide margin.
Some general points concerning the evolution of a lake from an open to a cJosed lake system, due to increasing aridity, are depicted in Fig. 11.6a. The hydrological cJosure of the basin may be delayed by downcutting of the river at the lake outlet which allows the lake to shrink (from stage I to 2). With the onset of cJosed conditions, the lake level may fall from stage 2 to 3, but then rise again to stage 4 with-
Chapter 11 Sediment Supply, Subsidence, and Basin Fill
RUSSIA
mountain ranges. (Modified after Degens et al. 1978). See text for further explanation
out any further change in the water budget of the lake. The reason for this behavior is the aggradation of sediment on the lake floor. In addition, minor short-term (e.g. over decades ofyears) fluctuations in lake level occur wh ich are not considered here.
The changing lake area is reflected by the varying extents of the sediment layers of stages I to 4. This signifies that the ratio Ai Ab and thus the relationship between the denudation rate and sedimentation rate, DR/SR, as discussed above, also changes with the lake level. A further complication may be introduced by the presence of topographic sills which, after emergence, separate the basin into subbasins of smaller drainage areas (as indicated in Fig. 11.6a), or the boundaries of the drainage area may shift, for example by river capture. For these reasons, the calculation of denudation rates or sediment yields from the accumulated sediment mass in the lake, or vi ce versa, becomes more difficult than for open lake systems.
11.2 Denudation-Sediment Accumulation Systems 491
:. ------- - Ad1 ------Evolution of
a . closed open systems .. - - - - - - - Ad2,3.4 systems \
,,' - - - - - - - - - - - - - - - - - - - - - -~ - - - - - - - - - - - - 1- - -1----,,- 'N'~: ~rainage - - - - - - - - - ~ ~ ~ ~ ~ ~2 ~~; ~~ ~ - - - ~ ~ ~ ~2~ ~ ~ ~ --
- system
115" 11 4'
b N 0 50 , " , ,
t 42"
1. VVendover core site 2. Knolls core site 3. Bunnester core si te 4. Saltair core sile 5. S28 core sile
11 3'
100 km ,
l.Ul --Fig. 11.6. a General scheme displaying various problems in the assessment of hydrological budgets and sediment mass balances for transient lake systems with chan ging lake level. See text for explanation. bLake Bonneville and Great Salt Lake basin (after
The Great Salt Lake and Lake Bonneville
A well-known example of this type of basin is the Great Salt Lake or former Lake Bonneville in Utah
11 2"
Maximum extent of Lake Bonneville
111'
Exisling lake or playa
Sill
Spencer et al. 1985; Williams 1994, modified). Note that both the size of the drainage area and the extent of lake sediments changed with time. (Lake Sevier is located south of the map shown here)
(Fig. 11.6b). The average sedimentation rate of this lake was about 120 mmlka during the past 0.8 Ma; the mean denudation rate in its drainage area amounted to about 40 rnmIka.
492
Lake Bonneville covered a much larger area (51 300 km 2; drainage area 95 000 km2) in the pluvial stages ofthe Pleistocene than the present Great Salt Lake (4360 km 2, drainage area 21 000 km 2, Fig. 11.6b). During its last highstand at about 15 ka B.P., the lake level stood -300 m higher and the lake area was apptoximately 12 times larger than at present (e.g. Benson et al. 1990). Somewhat later, the outlet to the Snake River cut a 100 m deep valley into young sediments at the northern lake margin and caused an extreme flood (Jarrett and Malde 1987). Then the lake level fell below this datum leading to a closed lake system. When the lake level had fallen below the sills now separating the Great Salt Lake basin from the Utah Lake and Sevier Lake basins, the drainage area of the Great Salt Lake was reduced to its present size. Aseries ofboreholes (up to about 300 m in depth) and radiometrie dating of trephra layers have revealed that the Lake Bonneville basin. persisted at least for about 3.3 Ma (Williarns 1994). The sedimentation rates in central bore locations were 120 to 230 mrnIka.
The mean denudation rate is estimated in the following way. The sediment accumulated at a mean rate of 120 mmlka during the past 0.8 Ma (the time period documented best in 5 cores). Half of the lake area (25 000 km 2) during its highstand was covered with sediment deposited at this rate. Then the mean denudation rate in the drainage area of -70 000 km2 (the total Lake Bonneville drainage area minus the area of sediment accumulation) is 43 mmlka, corresponding to a specific sediment yield of about 110 tlkm 2/a (mean rock density 2.5 glcm 3). With AjAb=4.9 ofthe present Great Salt Lake basin and the long-term denudation rate of the entire dr!linage area, the mean clastic sedimentation rate in the Great Salt lake should be 210 mrnIka. The measured mean sedimentation rate (max. value) in the lake basin during the Quaternary was about 170 mrnIka (Oviatt et al. 1994).
In the larger area of the Great Basin of N orth America, the mean denudation rate was about 60 mmlka during the past 100 to 1000 ka (Leeder 1997). It varied ftom lower values during the humid periods to higher values during the semiarid intervals such as in the Holocene.
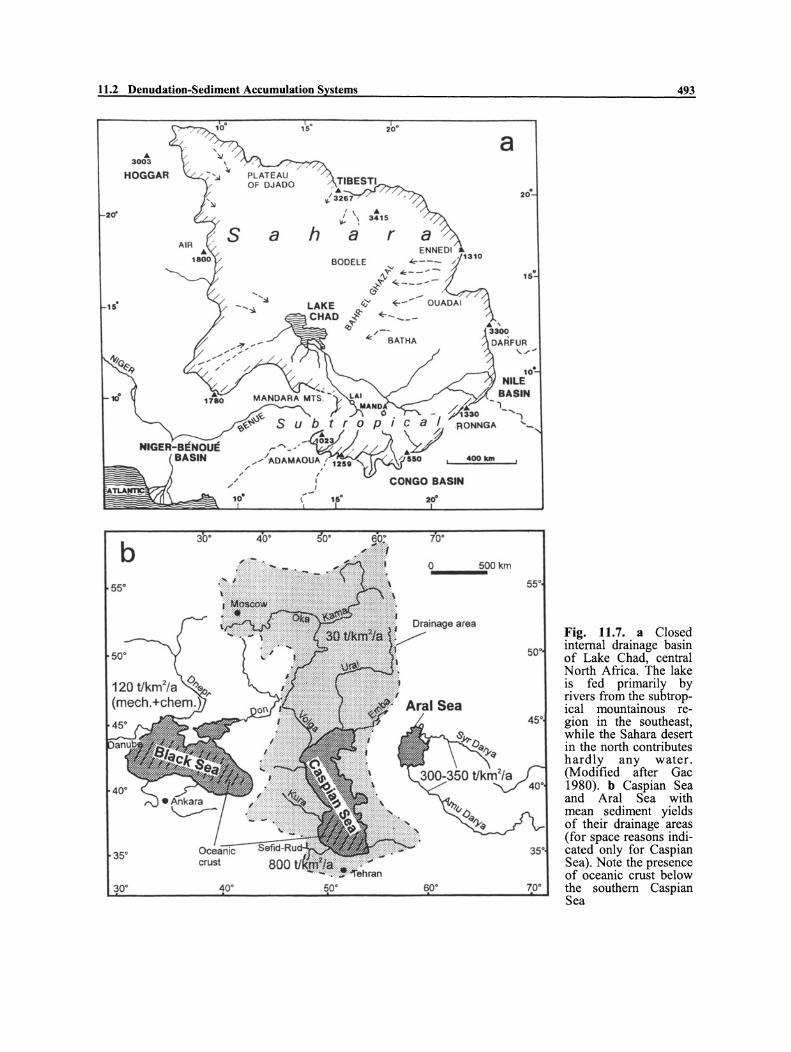
The Caspian Sea, Aral Sea, and Chad Basin
At present, the Chad basin in N Africa, the Caspian Sea, and the Aral Sea in Eurasia represent closed basins. They occupy the centers of large topographic depressions with desert climates and dune fields. Therefore eolian dust plays some part in the sediment fills of these basins (Khrustalyov and Artiukhin 1992). Lake Chad lies above sea level, the water level of the Capsian Sea is about -25 m and that of the Aral Sea +50 m. In wetter periods during the Pleistocene, the Chad Lake was larger than today and had an outflow to the Niger River; the Aral Sea reached an elevation allowing overflow to the Caspian Sea and the Caspian Sea in turn had an outlet to the Black Sea (Letolle and Mainguet 1996). The present-day water budget of the two Eurasian basins is strongly disturbed by artificial dams and irrigation measures along the rivers feeding the basins.
Chapter 11 Sediment Supply, Subsidence, and Basin Fill
Chad basin. This basin in the central part of North Africa, described in detail by Gac (1980), is a completely closed basin with an internal drainage system (Fig. 11.7a).
The total drainage area of the lake comprises an area of approximately 2 x 10⁶ km2, while the area ofthe lake itself varies in response to dry and wet years around an average area of 2.1 x 10⁴ km2 (hence Ad/ Ab=95). Evaporation from the lake is 2150 mmla. About 6 ka ago, when the climate in North Africa was more humid, the lake was open with an outflow to the southwest. Today, the major part of the drainage area is hot and arid (Sahara Desert). Most of the dissolved and detrital river load comes from subtropical highlands to the southeast comprising about 30% of the drainage area. Their sediment yield is so high that an average of 10.5 tlkm2la for the total drainage area is reached. Mean chemical denudation amounts to 3.6 tIkm 2/a. These low rates result from both low relief and dry climate in large parts of the drainage area as weil as from thick, extensive soil cover on top of crystalline parent rocks.
If both mechanical and chemical river loads were evenly spread over the present-day lake area, asolid sediment 1ayer of about 550 rnmJka would result. The actual thickness of wet Ho10cene sediments (4-6 m in 10 ka), consisting of terrigenous silty clay, carbonate and biogenic silica, yields an average (uncompacted) sedimentation rate of about 500 mmlka (compacted 200 mmIka). The modem mechanical and chemical denudation rates, derived from the river loads, are DR",e=4 mmlka and DRch=1.5 rnmJka. The longerterm mean mechanical denudation rate calculated from the Holocene sediment volume of the lake is 2 mm!ka. The observed lower sedimentation rate in the lake rnay reflect the larger extent ofthe lake 6 ka aga and sediment storage along the low-gradient parts of the river courses.
Aral Sea. This present-day lake basin (Fig. 11. 7b) rests on old continental basement. Facies and limited thickness (-2 km) of Mesozoic and younger sediments indicate long-term slow subsidence and sediment accumulation in the order of 20 rnmJka. Quaternary fluvial and deltaic deposits of the lake reach thicknesses of 20-140 m (Letolle and Mainguet 1996), corresponding to mean sedimentation rates of at least 10-70 mmlka.
The modern sedimentation rate is much higher (about 1500 to 2000 mmlka for a sediment density of 1.5 glcm 3). This value comes from a rnass balance of the river and air-borne loads (Khrustalyo'v and Artiukhin 1992) and matches dated sediments in the lake center, containing some carbonates and evaporites (mirabilite).
The high modern sedimentation rate demonstrates a situation in which the lake basin is overfed with sediment. This may result from the continued reduction in lake area with time. Because the present-day rapid sediment accumulation cannot be compensated for by subsidence, the entire water body in the closed basin will be slowly raised in the future
11.2 Denudation-Sediment Accumulation Systems
... 3003
HOGGAR
'" ."
10·
a '\ ..
.:. ~ 3 41 5
h a r
a
10·
NILE BASIN ") -",
493
Fig. 11.7. a Closed internal drainage basin of Lake Chad, eentral N orth Afriea. The lake is fed primarily by rivers from the subtropieal mountainous region in the southeast, while the Sahara desert in the north eontributes hardly any water. (Modified after Gae 1980). b Caspian Sea and Aral Sea with mean sediment yields of their drainage areas (for spaee reasons indieated only for Caspian Sea). Note the presenee of oeeanie erust below the southern Caspian Sea
494
(cf. Fig. 11.7a). The future existence of the Aral Sea depends on its water budget which is presently substantially affected by water subtraction for irrigation. If inflow will again exceed evaporation from the lake, then the lake will deepen, extend and finally overflow. Simultaneously, the sedimentation rate will decrease.
Caspian Sea. This is the world's largest closed lake basin (Fig. 11. 7b). Its northem part is underlain by 2 km of Mesozoie and Tertiary sediments, resting on continental ernst. This situation points to a slow mean subsidence rate similar to that mentioned for the Aral Sea. The shallow water depth (10 to 15 m) indicates that sediment influx from the large northem drainage area, eolian dust input, and autochthonous sediment production keep the basin more or less filled. The potential modem sedimentation rate is higher than necessary to maintain this steady-state condition. Surplus of sediment derived from the north can be transported south by wave and current action.
The middle part of the Caspian Sea is underlain by intermediate crnst and a sedimentary sequence of about 10 km in thickness. The present water depth in the basin center (about 300 m) demonstrates that sediment influx from northem and nearby sources has not completely filled this portion of the basin.
Based on the present-day river loads or sediment yields of the various drainage systems (F ig. 11. 7b), the total sediment influx into the entire Caspian Sea is estimated to be -500 x 106 tJa (summary in Einseie and Hinderer 1997). Transformed into wet sediment (mean porosity of 0.4, conversion factor 0.63, Fig. 11.1b) this mass would yield 315 x 106 m3/a. Neglecting subsidence, a time period of -250 000 years would be necessary to replace the water volume of 78.2 x 10 12 m3 of the modern Caspian Sea by wet porous sediment. However, this is an unrealistic prediction because we are dealing with a dynamic system with basin floor subsidence, particularly so in the southern part of the basin.
The southern Caspian Sea (Fig. 11.7b) still undergoes convergence in relation to Eurasia (~7 mmla) and is further characterized by a large negative free air gravity anomaly implying continuous subsidence (Zonenshain et al. 1990). Tectonic activity in this backarc basin reached its peak in the Upper Pliocene and Quatemary. This is inferred from the thick sedimentary sequences in the center of the southem Caspain Sea (up to 6000 m Pliocene and 1200 to 1500 m Quatemary sediments) as weIl as from intense folding (Narimanov 1993). This part of the basin was and probably still is subsiding at a rate on the order of 1000 mmlka or even more. For a short time period, we mayaiso treat this basin as a steady-state DA system.
The result of a crnde estimation of the overall relationship between mean denudation and sedimentation
Chapter 11 Sediment Supply, Subsidence, and Basin Fill
in the southem Caspian Sea area is plotted in Fig. 9.16. The data on terrestrial sediment influx confirm the high sedimentation rates observed in the basin.
Modern sediment influx from the surrounding mountain ranges enables a sedimentation rate of the same order (-1000 nun/ka, er. Sect. 9.7) as subsidence, but the considerable water depth of the southern Caspian Sea (average 330 m, maximum about 1000 m) implies that modern sediment aeeumulation lags behind subsidence. In fact, the basin appears to have been shallower during most of the Oligoeene to Plioeene time period.
11.3 Dynamic Denudation-Accumulation (DA) Systems
11.3.1 Rebound by Unloading and Sediment Load-Driven Subsidence
Long-term denudation-accumulation (DA) systems, persisting over time periods of millions to tens of million years, have to be viewed as dynarnic systems, even when active tectonic motions have ceased. Then the processes of isostasy are still generating both rock uplift in the source area (cf. Sect. 9.6) providing terrestrial sediment and sediment-load driven subsidence of the basin floor (cf. Chap. 8). A simple twodimensional model of this relationship is shown in Fig. 11.8.
It is assumed that at the begin ofthe development the sediment souree had been raised by tectonic forees to an elevation of I km above sea level and had reaehed isostatie equilibrium. The floor of a dry basin (on stretehed eontinental ernst), twiee as large as the source area, initially lay I km below sea level, but was further lowered by 0.4 km after filling the basin with water (Fig. 11.8a). The areas of both sediment souree and basin remain eonstant throughout the time eonsidered.
After a eertain time interval, depending on the denudation rate, the land surface has been lowered by .:1H=OA km (Fig. 11.8b). To aeeomplish this lowering, a rock column of D j =5 x .:1H=2 km in thiekness had to be eroded to compensate for isostatic rebound (Sects. 8.1 and 9.6, Airy isostasy). The eroded material could form a sediment layer of hs'= I km in thickness in the basin if it had a bulk density of p's=2.5 g/cm3 (as assumed for the eroded rocks). In reality, the mean density of a I km thiek sedimentary column (mostly fine grained) is lower (about Ps=1.6 g/em3) and the sediment thiekness i, therefore greater. Autoehthonous sediment production within the basin is negleeted. As a result of isostatic adjustment to the sediment load, the basin floor subsides by 0.64 km (Fig. 11.8b).
Ongoing denudation (now at a decreasing rate) has to remove another 2 km of rocks in order to further lower the land surface by 0.4 km (Fig. 11.8c). The total thickness of compacted sediment hs' (p's=2.5 g/cm3) in the basin increases to 2 km and will amount to hs=2.85 km (mean sediment density now Ps=1.75 g/cm3). Although the basin floor subsides by another 0.64 km, a small amount of the porous

11.3 Dynamic Denudation Accumulation Systems 495
SOURCE AREA, Ad a " ,r~, ~ \ /\-7 -, H - "-
BASIN AREA, Ab = 2 Ad
~lri=1~;: "-~ ~,~ PR = 2.5 ;;
_ .. . ..i.l. "'" \, ._. _~~_ SEA LEVEL WATER EXCHANGE -"'-----------------~
i 1.0 TECTONIC ";" \ '7,'-Y\ ;-; TRANSPORT
AFTER TECTONIC ZONE UPLIFT I SUBSIDENCE
---* ~Ö~4-SY -\~\iÄTER-LäÄö -----STRETCHED CONT. CRUST
AFTER ISOST ATIC ADJUSTMENT D, = 5'~H, = 2
.... _--_._ .............. - .. .. · . · . · . · .
SUB = h • Ps-Pw s Pm - Pw
Ps' = 2.50 Pm = 3.33 Pw = 1 .00 P in g/cm 3
c
BEFORE AFTER
Fig. 11.8. Model of a dynamic denudation-sediment accumulation system initiated by tectonic forces, but maintained for a long time by isostatic adjustment to erosional unloading and sediment deposition. a Initial stage: elevation of land surface I km above sea level, depth of basin floor (air-filled) I km below sea level. b,c Two stages of ongoing denudation and deposition. Continued isostatic rebound of the land area (not shown) substantially decelerates surface lowering but leads to high production of terrigenous sediment. The basin sediments are displayed in a compacted (rock density) and decompacted state. For further explanation see text
Other numbers in km ISOSTATIC ADJUSTMENT
sediment cannot be accommodated in the basin but will be transported elsewhere.
This elementary exercise demonstrates that rock uplift and basin evolution cannot begin without some tectonic event, but after that the evolution of the DA system may be controlled solely by denudation, sediment accumulation and isostasy. Moderate surface lowering of a relatively small source area is associated with the erosion of a large volume of sediment which can fill a basin larger than the source area with a thick sedimentary sequence. Rock uplift and basin floor subsidence are maintained for a long time at decreasing rates. The areas of the sediment source and basin have not changed through time in this model scenario. The assumptions of this model are modified in the following.
11.3.2 Variations in Subsidence and Sediment Supply
The models in Figure 11.9 are still very simple and therefore barely realistic. The rates of subsidence and sedimentation are assumed to be equal over the entire basin area. This is represented either by the basin center (Fig. 11.9a) or by both subaquatic and continental parts of the basin. The models demonstrate two different modes of basin evolution: (1) the sub sidence rate varies with constant sedimentation rate (b and c) or (2) the sedimentation rate varies whereas the rate of total subsidence remains constant (d and e).
The interplay between sediment supply (sedimentation rate) and subsidence controls both the depositional environment (continental or subaquatic) and the facies of the sediments. Basin deepening occurs during periods in which subsidence operates faster than sediment accumulation (under-supplied
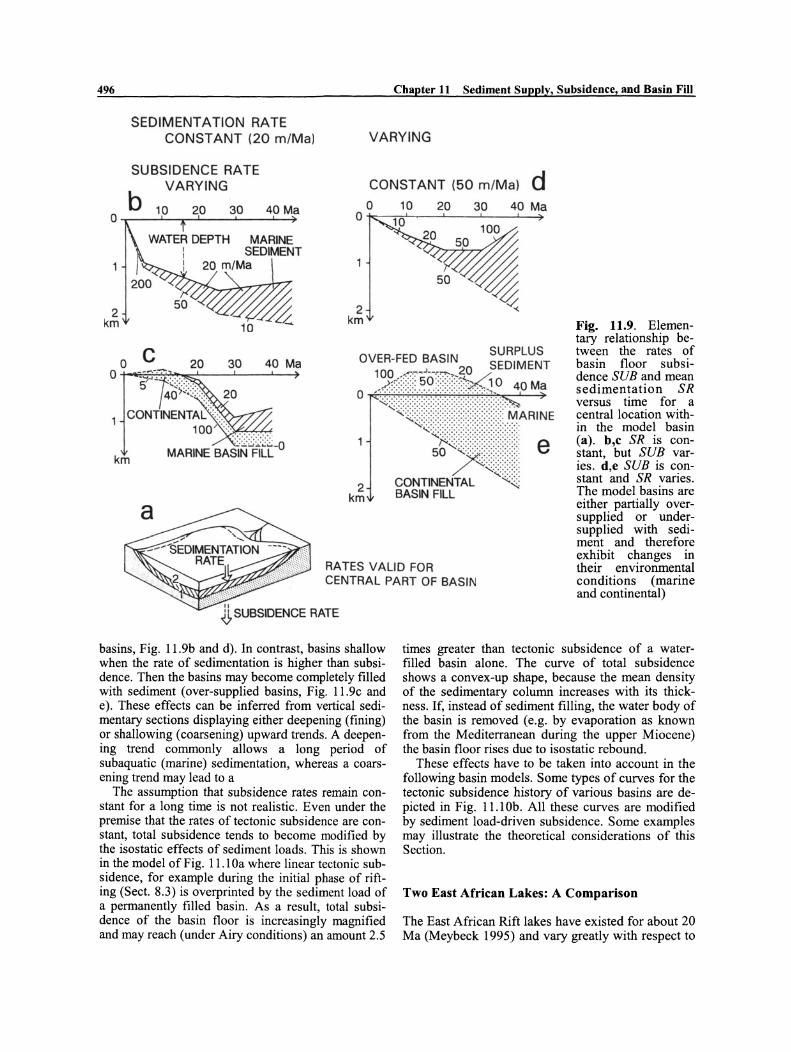
496 Chapter 11 Sediment Supply, Subsidence, and Basin Fill
SEDIMENTATION RATE CONST ANT (20 rn/Mal VARYING
SUBSIDENCE RATE VARYING
b CONSTANT (50 rn/Mal d
10 20 30 40 Ma 0,---~~~--~~--~4
o o~-.~--~----~--~~
40 Ma 10 20 30
2 km
MARINE SEDIMENT
20 m/Ma
c 30 40 Ma 20 o O~~--~~~-~~"~~--~----~~
S1~~~;~::;\, 20
CONTINENTAL ;;;" 100 "<:>" ~~
MARINE BA~:i~;:;F~ä-o km
2 km
RATES VALID FOR CENTRAL PART OF BASIN
Fig. 11.9. Elementary relationship between the rates of basin floor subsidence SUB and mean sedimentation SR versus time for a central location within the model basin (a). b,c SR is constant, but SUB varies. d,e SUB is constant and SR varies. The model basins are either partially oversupplied or undersupplied with sediment and therefore exhibit changes in their environmental conditions (marine and continental)
basins, Fig. 11.9b and d). In contrast, basins shallow when the rate of sedimentation is higher than subsidence. Then the basins may become completely filled with sediment (over-supplied basins, Fig. 11.9c and e). These effects can be inferred from vertical sedimentary sections displaying either deepening (fining) or shallowing (coarsening) upward trends. A deepening trend commonly allows a long period of subaquatic (marine) sedimentation, whereas a coarsening trend may lead to a
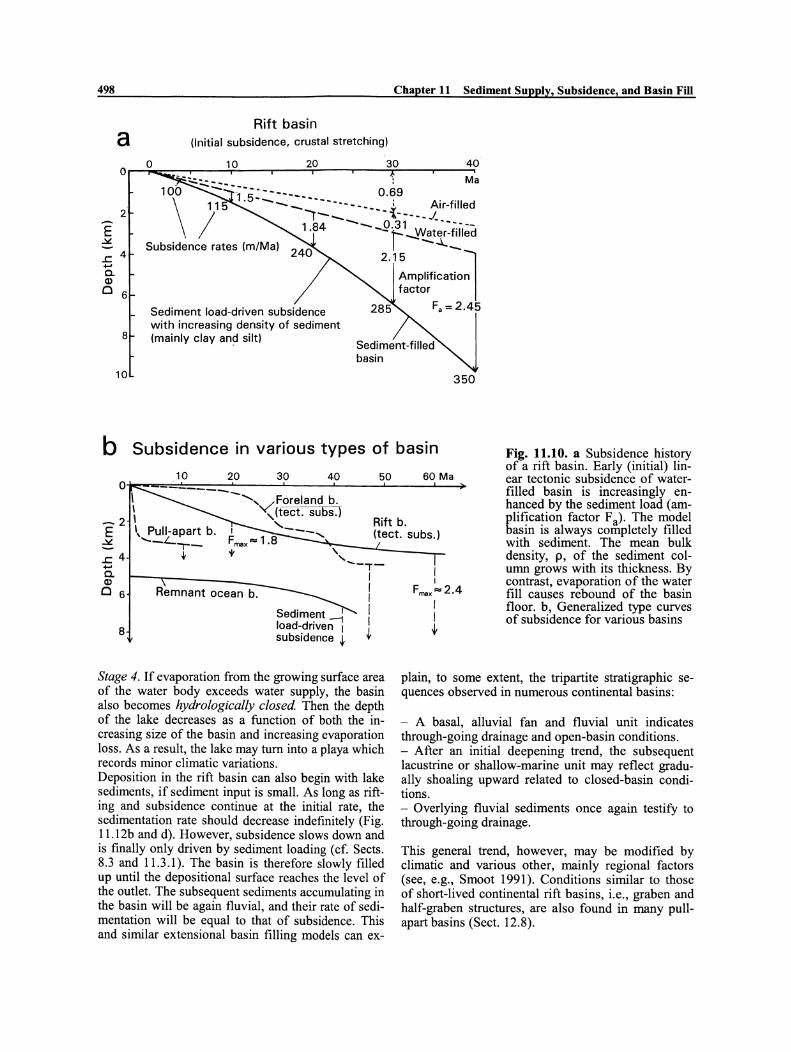
The assumption that subsidence rates remain constant for a long time is not realistic. Even under the premise that the rates of tectonic subsidence are constant, total subsidence tends to become modified by the isostatic effects of sediment loads. This is shown in the model of Fig. 11.10a where linear tectonic subsidence, for example during the initial phase of rifting (Sect. 8.3) is overprinted by the sediment load of a permanently filled basin. As a result, total subsidence of the basin floor is increasingly magnified and may reach (under Airy conditions) an amount 2.5
times greater than tectonic subsidence of a waterfilled basin alone. The curve of total subsidence shows a convex-up shape, because the mean density of the sedimentary colurnn increases with its thickness. If, instead of sediment filling, the water body of the basin is removed (e.g. by evaporation as known from the Mediterranean during the upper Miocene) the basin floor rises due to isostatic rebound.
These effects have to be taken into account in the following basin models. Some types of curves for the tectonic subsidence history of various basins are depicted in Fig. 11.10b. All these curves are modified by sediment load-driven subsidence. Some examples may illustrate the theoretical considerations of this Section.
Two East African Lakes: A Comparison
The East African Rift lakes have existed for about 20 Ma (Meybeck 1995) and vary greatly with respect to
11.3 Dynamic Denudation Accumulation Systems
active subsidence, basin geometry, climatic conditions, water chemistry, and types and rates of sedimentation (e.g. Reading 1986; Cohen 1989). Therefore, open as weH as closed lake basins of different water depths developed. The levels of these lakes fluctuated by up to several hundred meters during the past 15 ka and earlier due to climatic change, accompanied by drastic changes in sediment influx (e.g. increased "lowstand shedding", cf. Sect. 7.6). In the context of this chapter, a comparison of Lake Tanganyika and Lake Turkana may be of interest (cf. Fig. 12.4; for more details see Einseie and Hinderer 1997).
Evaluating the rates of subsidence, sediment influx and mean sedimentation reveals that Lake Tanganyika is under-supplied with sediment and deepening while Lake Turkana is over-supplied and shaHowing.
Lake Tanganyika is at present an open lake with little outflow. The sedimentation rate varies in the different subbasins ofthis lake, but is generally in the order of ~200 mmlka for wet material (porosity n:::::: 50%). Thus, sedimentation cannot keep pace with subsidence of the basin floor (~280 mmlka during the past 20 Ma) because sediment compaction reduces the initial sediment porosity. The modem lake is therefore undersupplied and deepening rather than shallowing (present mean water depth 570 m). The present-day mean mechanical denudation rate as derived from SRme of sediment cores (AJAb=7.1) is about 4 mmlka (10 tlkm2/a). It only allows a mean clastic sedimentation rate of -60 mmlka (n:::::: 50%).
Lake Turkana (closed system, mean water depth 31 m). Thebasin floor is subsiding at a rate of about 130 mmlka, but the modem mean sedimentation rate (n:::::: 50%) is -1200 mmlka and indicates that the basin is presently oversupplied and being filled up rapidly with sediment. The modem (past 2 ka) mean mechanical denudation rate in the drainage area (AJAb=9.7) is 93 mmlka or 230 tlkm 2/a.
The contrasting "state of basin filling" of these two lakes mainly results from the great difference in the denudation rates of their drainage areas. The Ai Ab ratios of the two lakes are almost the same and their subsidence rates are of the same order of magnitude. In the catchment of Lake Turkana D~e is higher by a factor of >20 than in the Tanganyika catchment. This reflects the presence of young, partially nonindurated volcanic rocks and volcaniclastics around Lake Turkana compared with older crystalline rocks in the catchment of Lake Tanganyika as well as differences in climate (serni-arid to subtropical versus subtropical to tropical).
497
11.3.3 Extensional Basin Models
Rift Basins with Constant Sediment Supply
In the context of this chapter three principal types of basins are of interest: (1) basins of more or less constant areal extent (Sect. 11.3.1), (2) extensional basins, and (3) closing basins. The plate tectonic setting and general evolution of sedimentary basins is discussed in Chaps. 1 and 12.
The most important representatives of extensional basins are rift basins, growing ocean basins, and pullapart basins (Fig. 11.11a). For all of them their size increases with time leading to the general trend of decreasing rates of terrigenous sedimentation. The simplest case is when the rate of sediment input is kept constant. Such a situation is demonstrated quantitatively for rift basins (Fig. 11.12) with the following assumptions (Schlische and Olsen 1990; for further details see Schlische 1992):
- The basin represents a continental full-graben or half-graben and is bounded by planar faults dipping at equal angles (Fig. 11.12a). - Uniform extension causes uniform subsidence along the boundary faults and hence the depth of the basin increases linearly. - The outlet of the basin is held at a constant level with respect to an external datum line. - The volume of fluvial sediment added to the basin per unit time is constant; the sediment is distributed uniforrniy over the entire basin.
This model basin may display the following stages of evolution (Fig. 11.12a):
Stage 1. Sediment supply is large enough to keep the narrow basin always filled with fluvial material; excess sediment and water leave the basin which is therefore both hydrologically and sedimentologically open. During this phase, the sedimentation rate is constant and equal to the subsidence rate. Stage 2. As the basin continues to grow, a point is reached at which the sediment input can no longer completely fill the space made available through subsidence. Consequently, the basin becomes sedimentologically closed and is transformed into a lake or shallow sea. The sedimentation rate slows due to the increasing size of the basin. Y ounger strata progressively onlap the basement rocks of the hanging wall block. Stage 3. Further development is controlled by climatic factors and the size of the hydrologic drainage area of the basin. If water supply into the basin remains high enough to keep the basin water-filled up to the fixed outlet, the basin deepens and the sedimentation rate continuously decreases.
498 Chapter 11 Sediment Supply, Subsidence, and Basin Fill
Ritt basin a (Initial subsidence, crustal stretching)
o 10 20 3040 o~~==~~--~r----'----~----'---~f----'----~Ma
-, 5"--"'--- 0.69 • --- ---------- j Air-filled -1-_ ----i;-----_Z
1 84 -- 031 ------2
E ~ Subsidence rates (m/Ma)
. '-'= r Water-filled
2.15 -';-~-l Amplification factor
.!: 4 +-' C. a> Cl 6
8
10
Sediment load-driven subsidence with increasing density of sediment (mainly clay and silt)
basin
Fa =2.45
350
b Subsidence in various types of basin Fig. 11.10. a Subsidence history of a rift basin. Early (initial) linear teetonic subsidence of waterfilled basin is increasingly enhanced by the sediment load (amplification factor Fa). The model basin is always completely filled with sediment. The mean bulk density, p, of the sediment co 1-umn grows with its thickness. By contrast, evaporation of the water fill causes rebound of the basin floor. b, Generalized type curves of subsidence for various basins
10 20 30 40 50 60 Ma O~-=-=-~-=_=_==_=_-_~------~----~----~------~~
\ -"vForeland~ ~2
E \ ,(tect. subs.)
I, Pull-apart b. I '---, Ritt b.
~ ..... -L..,.._ F max ... 1.8 (teet. subs.) -.!:4
+-' C. a>
Cl 6
8
.f t
Remnant ocean b.
, "-
Sediment ~ load-driven I subsidence ~
---,-I I I I I t
Stage 4. If evaporation from the growing surface area of the water body exceeds water supply, the basin also becomes hydrologically closed. Then the depth of the lake decreases as a function of both the increasing size of the basin and increasing evaporation loss. As a result, the lake may turn into a playa which records minor climatic variations. Deposition in the rift basin can also begin with lake sediments, if sediment input is small. As long as rifting and subsidence continue at the initial rate, the sedimentation rate should decrease indefinitely (Fig. 11.12b and d). However, subsidence slows down and is finally only driven by sediment loading (cf. Sects. 8.3 and 11.3.1). The basin is therefore slowly filled up until the depositional surface reaches the level of the outlet. The subsequent sediments accumulating in the basin will be again fluvial, and their rate of sedimentation will be equal to that of subsidence. This and similar extensional basin filling models can ex-
plain, to some extent, the tripartite stratigraphic sequences observed in numerous continental basins:
- A basal, alluvial fan and fluvial unit indicates through-going drainage and open-basin conditions. - After an initial deepening trend, the subsequent lacustrine or shallow-marine unit may reflect gradually shoaling upward related to closed-basin conditions. - Overlying fluvial sediments once again testify to through-going drainage.
This general trend, however, may be modified by climatic and various other, mainly regional factors (see, e.g., Smoot 1991). Conditions sirnilar to those of short-lived continental rift basins, i.e., graben and half-graben structures, are also found in many pullapart basins (Sect. 12.8).

11.3 Dynamic Denudation Accumulation Systems
a Types of basin ~------- --,---:-~~
~ ...... 1 I~ ======! __ ---.J Plan
_____ --'1 .......
Graben filling
Stage 1
view
b
Fluvial sediments
Stage 2
Pure shear I graben
Simple shear I halfgraben Detachrnent fault
Pull-apart b.
Transtensional b.
Higher relief I smaller drainage areas
Lower relief I extended drainage areas
C Extensional basins Drainage area ~=const" -1: Basin area ~ Ab variable
o 1
~ 2 '2
I Ad variable Ad/Ab t--- ~ - ~--- . A L./ DR =
4 1 ,=------ 1 00 2 1 50
DR = 100 'C::=J 50 'c - ----I :---1 0.75 : 25 25
\ __ _ _______ -{:::J 4
10
Q)
E i=
8- -0.5- 0.5 -Spreading rate = const.
, I
10
499
Fig. 11.11. a Types of extensional basins (overview). b,c Changes in the drainage areas and mechanical denudation rates during the evolution of rift basins
The results of two-dimensional modeling of a permanently filled half-graben, continuously growing in size (Fig. 11.l2b), are similar to those found of a full-graben. The cross section of this model reflects the geometry of the early Mesozoic Atlantic basin in North America (cf. Fig. 12.7) and its time slices represent 0.55 Ma. If sediment
input balances the space provided by subsidence, the depositional surface area of the basin ceases to grow. Accelerated tilting of the half-graben causes the basin fill to shift toward the border fault and young layers to onlap previously deposited strata as shown in Fig. 11.12e (Stage 2).

500 Chapter 11 Sediment Supply, Subsidence, and Basin Fill
a CONSTANT SEDIMENT SUPPLY
HYDfI9lOGICALL Y
1 =LEVE~~~:. :::::::::::7C-- ~~~~::~ S:O~~ ~~ .. .... 'iY? 6~;: ---t_ ~~.
·~~?~.~::-;;:.~.,~~.-~.:~;~i71=_~SEDlM~E~ LAKE SED. "~~.'.'.'.'.'.'.'.'~J CLOSED I (SHAllOW) . ':::.','::::.'::,':' I
~ ~ E .-,;;';;: - - - - - - - -
LAKE SURFACE -- ----------~-- -- - - ---_. ~
2
3
INGOF ~,I~-Jt'SEDIM. ~OGI . LAKE SED, -FACIES
4
d
I '0
~ w ~ 1.1 5
~ w o
"",.,:.,.:,.:.,:.,.:,.::.,:.,:.,:.,:.,:.,.:,:..,.:,,:..,;; CLOSED
~';"';"';"':"';":"~...-/- --- - -- -- - -- --
- - r-- ' HYDAOlOG.
.i!1.~--h--c:.~- · V - - - -SEDIM. '-r'-~~~~~~-/ E. 200% CLOSED
SUBSIDENCE
LAKE
WATER DEf'TH OF
OPEN LAKE
SEDIMENT THICKNESS
--r FIWNG EOOAlS SUBSIDENCE v
o ~----~~--~----~----r_----0.8 - - 0.833
0.6
:? E 0.4
.s. 0.2
o o 5 '0 '5
1
2
3
4
b
3
I 2
~ !ll ::s w 1 :J ~ :::E !.l i3 j!: 0
0
~ 2
~ ~1 ~
:J .s :::E :J
~ 0 0
e
SASIN CENTER
SASIN CENTER
~------
\ \
2 3
\,,/ BASlN CENTER ,
4 5
BASlN AVERAGE
---2 3 4 5
~:(b~~o . . . . BASlN FLOOA
~
!!!':=~~~§§i~~ON;:LAP ONTO
STRATA OF SASIN
SUBDMSION OF BAStN
BY ADDmONAl FAULTS
NEWARK BASIN (TRIASSIC·JURASSICI PRESENT·DA Y SITUATION AFTER
LACUSTRINE DELTAJC
11.3 Dynamic Denudation Accumulation Systems
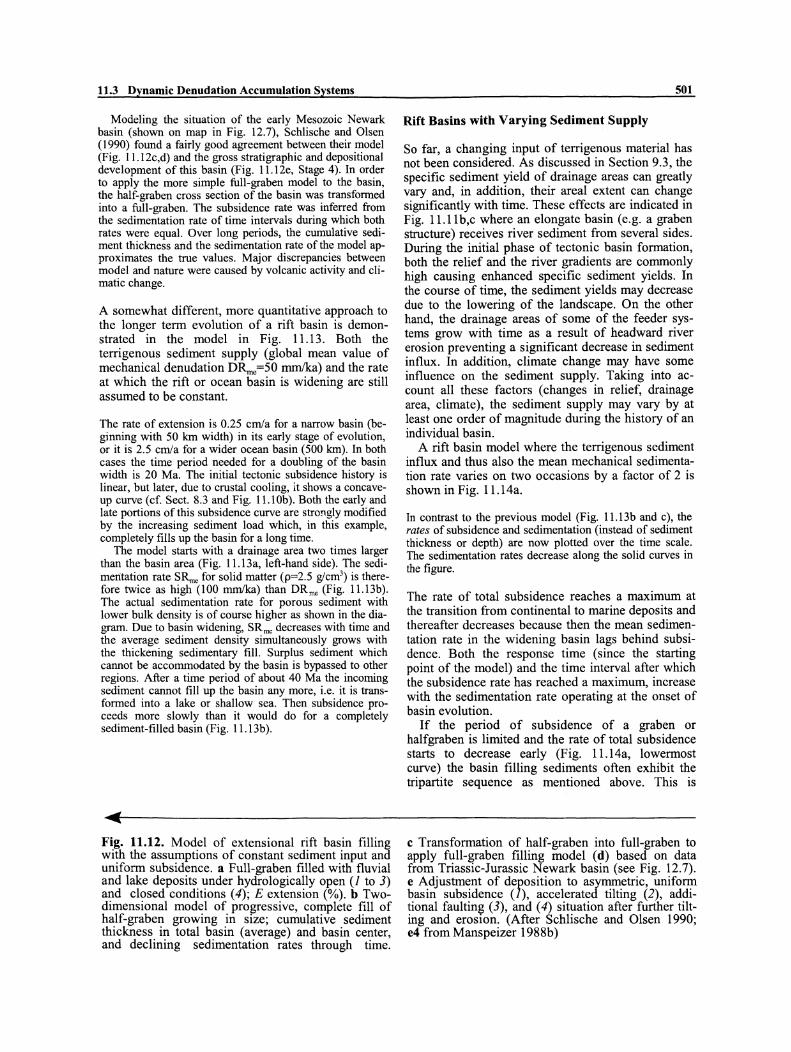
Modeling the situation of the early Mesozoie Newark basin (shown on map in Fig. 12.7), Schlische and Olsen (1990) found a fairly good agreement between their model (Fig. 11.12c,d) and the gross stratigraphie and depositional development of this basin (Fig. 11.12e, Stage 4). In order to apply the more simple full-graben model to the basin, the half-graben cross section of the basin was transformed into a full-graben. The subsidence rate was inferred from the sedimentation rate of time intervals during which both rates were equal. Over long periods, the cumulative sediment thickness and the sedimentation rate of the model approximates the true values. Major discrepancies between model and nature were caused by vo1canic activity and climatic change.
A somewhat different, more quantitative approach to the longer term evolution of a rift basin is demonstrated in the model in Fig. 11.13. Both the terrigenous sediment supply (global mean value of mechanical denudation DR.nc=50 nun/1m) and the rate at which the rift or ocean basin is widening are still assumed to be constant.
The rate of extension is 0.25 cmla for a narrow basin (beginning with 50 km width) in its early stage of evolution, or it is 2.5 cmla for a wider ocean basin (500 km). In both cases the time period needed for a doubling of the basin width is 20 Ma. The initial tectonic subsidence history is linear, but later, due to crustal cooling, it shows a concaveup curve (cf.Sect. 8.3 and Fig. 11.10b). Both the early and late portions ofthis subsidence curve are stro!\gly modified by the increasing sediment load which, in this example, completely fills up the basin for a long time.
The model starts with a drainage area two times larger than the basin area (Fig. 11.13a, left-hand side). The sedimentation rate SR",e for solid matter (p=2.5 g/cm3) is therefore twice as high (100 mmlka) than DRme (Fig. 11.l3b). The actual sedimentation rate for porous sediment with lower bulk density is of course higher as shown in the diagram. Due to basin widening, SRmc decreases with time and the average sediment density simultaneously grows with the thickening sedimentary fill. Surplus sediment which cannot be accommodated by the basin is bypassed to other regions. After a time period of about 40 Ma the incoming sediment cannot fill up the basin any more, i.e. it is transformed into a lake or shallow sea. Then subsidence proceeds more slowly than it would do for a completely sediment-filled basin (Fig. 11.13b).
Fig. 11.12. Model of extensional rift basin filling with the assumptions of constant sediment input and uniform subsidence. a Full-graben filled with fluvial and lake deposits under hydrologically open (1 to 3) and closed conditions (4); E extension (%). b Twodimensional model of progressive, complete fill of half-graben growing in size; cumulative sediment thickness in total basin (average) and basin center, and declining sedimentation rates through time.
501
Rift Basins with Varying Sediment Supply
So far, achanging input of terrigenous material has not been considered. As discussed in Section 9.3, the specific sediment yield of drainage areas can greatly vary and, in addition, their areal extent can change significantly with time. These effects are indicated in Fig. 11.11 b,c where an elongate basin (e.g. a graben structure) receives river sediment from several sides. During the initial phase of tectonic basin formation, both the relief and the river gradients are commonly high causing enhanced specific sediment yields. In the course of time, the sediment yields may decrease due to the lowering of the landscape. On the other hand, the drainage areas of some of the feeder SYSc tems grow with time as a result of headward river erosion preventing a significant decrease in sediment influx. In addition, climate change may have some influence on the sediment supply. Taking into account all these factors (changes in relief, drainage area, climate), the sediment supply may vary by at least one order of magnitude during the history of an individual basin.
A rift basin model where the terrigenous sediment influx and thus also the mean mechanical sedimentation rate varies on two occasions by a factor of 2 is shown in Fig. Il.l4a.
In contrast to the previous model (Fig. 11.13b and c), the rates of subsidence and sedimentation (instead of sediment thickness or depth) are now plotted over the time scale. The sedimentation rates decrease along the solid curves in the figure.
The rate of total subsidence reaches a maximum at the transition from continental to marine deposits and thereafter decreases because then the mean sedimentation rate in the widening basin lags behind subsidence. Both the response time (since the starting point of the model) and the time interval after which the subsidence rate has reached a maximum, increase with the sedimentation rate operating at the onset of basin evolution.
If the period of subsidence of a graben or halfgraben is limited and the rate of total subsidence starts to decrease early (Fig. l1.l4a, lowermost curve) the basin filling sediments often exhibit the tripartite sequence as mentioned above. This is
c Transformation of half-graben into full-graben to apply full-graben filling model (d) based on data from Triassic-Jurassic Newark basin (see Fig. 12.7). e Adjustment of deposition to asymmetric, uniform basin subsidence (1), accelerated tilting (2), additional faultin~ (3), and (4) situation after further tilting and erOSiOn. (After Schlische and Olsen 1990; e4 from Manspeizer 1988b)

502
b -CO
~ --E CI)
E a: Cf)
c: CO Q)
~
Chapter 11 Sediment Supply, Subsidence, and Basin Fill
Extensional basin a Closing basin
200
Observation point Ad Ab~
Ad/~:~';~'~'~ ~,:\~ .. ~~.~~.~.~.~.:~.-' T ~~~~. e.9. 3000/1000 km2 . ':"~' or elongate basins and land areas 600/200 km wide
Ritt basin (Rate of extension 0.25 cm/a; Wj = 50 km, or 2.5 cm/a; Wj = 500 km)
p"'1.92
-3 E ~
2
CIl CIl Q) c: ~ ()
.s::. I-
----\"------------p=2.5 g/cm3 ) -------------------------
30 40 50 60 Ma ~ 0.5
Water depth
O~~~TJ'7~~~T/~_r/'7i~~~~I:~
2 .s::. +-' a. Q)
o 3
_ Initial tectonic ____________ ~ subsidence (50 m/Ma)
, I
~--- Surplus of sediment (bypassing) - - -- -- - -- ---.>I
4 not completely sediment-filled
4
--, Fig. 11.13. Sediment filling of rift basin; basin evolutIOn begins with basin widths of W=50 km or 500 km and Ai Ab =2; rates of extension 0.25 or 2.5 cm/a, respectively. a Cross sections of elongate extensional and closing model basins (basin area Ab) and their drainage areas (Ad). b Mean mechanical sedimenta-
tion rates, SR",c' of fully compacted (p=2.5 g/cm3)
and porous Sealment (lower mean bulk density, increasing with accumulated sediment thickness). The mechanical denudation rate is D~e=50 mmlka (global mean). c Tectonic and thermal subsidence enhanced by sediment load
shown for a relatively low mechanical denudation rate of 25 mmlka controlling the SR25 curve in the diagram.
Short-term variations in the mechanical denudation rate and the related sedimentation rate (decreasing with time) are envisaged in Fig. 11.14b which resembles Fig. 11.13b.
To completely fill the widening basin with sediment, the sediment thickness in the basin should grow as indicated by a broken line (same curve as that for complete basin filling in Fig. 13b). This can be accomplished for a long time period when sediment influx is high (DR me=50 curve). With lower sediment influx the continental phase of the basin fill becomes shorter as mentioned above.

11.3 Dynamic Denudation Accumulation Systems
E a:: Cf)
c: co Q)
::;E
co ~ -....
Q)§ 400 (JC Co Q) . -
:s! ~ 300 Cf)..., ..c c ::JQ) Cf)E _._ 200
0"0 Q)
Cf) Cf)
~"O 100 COc a:::co
a \
\ SR,,,
o 5 10
Extensional basins
20
SRso corresponds to DRme = 50 (mm/ka) but p<2.5 g/cm3
Ritt b ., ocean basin
- -- Marine b. , deepening ----
30 40 Cent .
A /A=- 8-- 4----- 2 - ------------ 1-------- - - - 0.66 d b
Extensional basin b Necessary for complete _ Drainage area Ad and ß = const. basin filling _-Mechanical denudation rate DR .... = variable (m/Ma) '\. - .,..-.,..-..... 4
,200 111 "'~."w. )........ E
Potential mean thickness of accumulated porous sediment
25 Accumulated sediment /
e IJ) IJ) Q)
c: ~ (J
.s:: 2 :::
c: Q)
E "0 Q)
Cf)
o '0 20 30 40 50 60 Ma
2 -- Ad/Ab-- - --- 1 - - - -- - -- ---- - --- - -- -- - - - - 0 .5
503
Fig. 11.14. Extensional basins with varying sediment supply. a Rates of subsidence and mean clastic sedimentation SR vs. time. After 20 Ma, the basin width is W=50 km (rate of extension 0.25 cmla) or 500 km (2.5 cmla); the changing A,jAb ratio is shown at base of diagram. The curves of SR correspond with different denudation rates DR (e.g. SRJOo with DRJOo) but take into account changing sediment porosities. Both the continental phase of basin evolution and the occurrence of the maximum rate of subsidence are con-
trolled by SR. A short-lived basin with lirnited SR may first display continental deposits followed by marine beds and finally again continental conditions. b as Fig. 11.13b, but with short-term changes in S~e and thus also in S~e' This may cause interrnittent complete basin filling (point I) or facies change in marine deposition (point II). At a later stage (point III), only long-term increased terrigenous sediment supply only can restore continental deposition

504 Chapter 11 Sediment Supply, Subsidence, and Basin Fill
a DISTANCE FROM RIFT AXIS
2000 1000 0 1000 2000 km
I I
b .. I I
S.AMERICA
0 SEDIMENT ATIO N RATE OF CAR-
0 BONATE-FREE
., MATERIAL ~ ITREND OF w BASIN MEAN) (!) 0 «
60
TERRIGENOUS CLAY -SILT 80
100
CALCAREOUS OOZE OR LIMESTONE
120
10 20 30 m/Ma
Fig. 11.15. a Extension of South Atlantic through time and generalized chronostratigraphic cross secti on of its sediments between Brazil (Brazil basin) and Angola margin according to results from Deep Sea Drilling Project. Note that vertical drill holes appear as oblique lines in diagram. Calcareous oozes are almost restricted to mid-Atlantic ridge (rift axis),
As long as the basin remains shallow, i.e. shortlyafter the transition from the continental to the aquatic phase, a short-term increase in sediment supply (e.g. caused by climatic change) can cause areturn to continental conditions. This is demonstrated for the D~e=25 curve (Fig. 11.14b, point I). Later, a shortterm increase in sediment supply (point II) can only bring about a minor change in the persisting marine or lake environment. Only a drastic and relatively long-lasting increase in sediment supply can lead to significant shallowing of the basin or again to continental sediments, provided extension and subsidence of the basin floor continue.
Rift-Drift Transition and Growing Ocean Basins
If the rift stage of a basin is followed by sea-floor spreading, the extension of the basin commonly continues at an accelerated rate. For example, if a fullgraben of 50 km width is formed during a time period of 20 Ma, the average rate of basin extension (but not crustal extension) is 0.25 cmla (cf. Fig. 11.13b). In contrast, ocean spreading frequently op-
while sediments at greater distance from rift axis were mostly deposited below CCD (cf. Sect. 5.3.2). Asymmetry of sediment distribution is caused by circulation system. b Trend of carbonate-free sedimentation rate to diminish with increasing extension of ocean. (After Van Andel et al. 1977)
erates at a rate of 1-5 cmJa. Hence, the average sedimentation rate of an extensional basin passing from the rift to drift stage should drastically decrease. This is to some extent the case, but does not apply to the sediment accumulation on shelves. In large ocean basins most of the incoming sediment is deposited on the shelves and continental slopes and therefore cannot be distributed uniformly over the entire basin as assumed for the simple models discussed so far. Nevertheless, it can be expected that the silicic1astic sedimentation rate of deep growing ocean basins dec1ines with time. Similarly, the river supply of dissolved species necessary to produce biogenie carbonate and silica will decrease per unit area in the growing ocean basin. (Nutrient supply by mineralization of organic matter and recycling in the basin itself is discussed in Sects. 5.2 and 5.3).
South Atlantic. The sedimentary history of the South Atlantic, for example, shows this expected trend (Fig. 11.15).
During its early stage of rifting the narrow basin displayed sedimentation rates for carbonate-free material of about 30 mlMa (3 cmlka) and was therefore dominated by

11.3 Dynamic Denudation Accumulation Systems
terrigenous deposits (Van Andel et al. 1977). With continued sea-floor spreading in the late Mesozoic and early Cenozoic, the sedimentation rate of clastics dropped to values mostly under 10 mlMa along the margins and to 2 to 5 mlMa on the Mid-Atlantic ridge (Fig. 11.15b). In contrast, the in situ biogenic carbonate production and preservation did not show such a distinct trend, but rather was controlled by changes in the oceanic circullition system.
North Atlantic. Similar to the South Atlantic, the North Atlantic shows sedimentation rates of terrigenous material which were generally high during its early history and then declined with the widening of the basin up to the early Miocene (Ehrmann and Thiede 1985). However, this rate increased again from the middle Miocene up to. the Quatemary as a result of climatic change and glacial action in high latitudes regions and high mountain ranges.
An approximate mass balance of the present-day denudation on land and overall sedimentation in the Atlantic Ocean between 500 N and S yields the following results. The total drainage area in North and South America, Europe, and Africa is 30 x 10 6 km2 and the basin area 75 x 106
km2• Hence the AjAb ratio is 0040. Assuming the modem global mechanical denudation rate of 50 mlMa (Sect. 9.3) for the entire drainage area, the average sedimentation rate of clastic material in the Atlantic is about 50 x 004 = 20 mlMa (solid, water-free material). Compared with Figure 11.15b, this value appears to be realistic. However, this estimate does not take into account that much sediment is deposited on the shelves ofthis ocean basin.
As regards chemical denudation, the global rate is 16 m1Ma, and approximately 12% of the dissolved river load is Ca2+ and 10% is Si02• Calcium denudation of ~2 m1Ma may lead to a calcium carbonate sedimentation rate (factor 2.5) in the Atlantic of 2 x 2.5 x 0.4 = 2 mlMa or 2 mmlka (AiAb = 0.4). This value is lower than the actual rate observed above the CCD, but higher than that found below the CCD where carbonate is largely dissolved. The present-day river supply of calcium is insufficient to maintain the high oceanic biogenic carbonate production. The deficiency of the ocean in calcium causes carbonate dissolution below the CCD (cf. Sect. 5.3.2). Similarly, the river-bome Si02 enables an average sedimentation rate of 1.6 mlMa or 1.6 mmlka. This value is too low to provide enough silica for the ongoing production of siliceous skeletons by diatoms, radiolaria, and sponges. Hence, most oftheir skeletons are dissolved in the water column (Sect. 5.3.5).
11.3.4 Closing Basin Model
The most important group of closing basins are related to subduction and plate collision. The general principles introduced for extensional basins can also be applied to closing basins which therefore are discussed only briefly.
505
For the model of a closing basin (Fig. 11.16) both sediment supply and the size of the drainage area, Ad,
are assumed to be constant as for the previous models of extensional basins (Fig. l3a). Subsidence follows the rule found for aging, cooling oceanic crust and is enforced by the increasing sediment load. With Ad= constant, the AiAb ratio of the closing ocean basin increases rapidly once it has become already narrow (remnant basins, Fig. 11.l3a). Then the mean mechanical sedimentation rate and thus the accumulating sediment thickness increase exponentially with time and lead to rapid filling of the initially deep basin (Fig. 11.l6a and b).
Initially, the remnant basin is deep and its rates of sedimentation and subsidence, controlled mainly by cooling of the underlying oceanic crust, are slow. Approaching the subduction zone, the oceanic crust tends to be flexed, leading to increased subsidence of the basin floor. Simultaneously, the sedimentation rate grows and thus compensates for subsidence. Finally, the sedimentation rate greatly surpasses subsidence causing rapid and complete basin filling. This can be frequently observed in orogenic belts where flysch sequences pass upward into shallow-water and continental deposits. As a result of subduction and the increasing sediment load, the top of the oceanic crust may become deeply buried. This is also known from passive continental margins below prograding marine deltas (e.g. the Niger delta) or below the head of large deep-sea fans (e.g. the Bengal fan, Sect. 11.5.5). Uplift of the magmatic arc and an increasing sediment supply from the arc region would further accelerate basin filling.
11.3.5 Foreland Basin Model
Foreland basins in front of overthrust belts (Fig. 11.17a; cf. Sect. 12.6) are in many ways more complex than the previous examples of basin evolution. The elementary model of Fig. 11.17 shows a first, pronounced phase of overthrusting and the resulting increase in erosion and basin filling.
The model is based on the following assumptions: (1) the size or width ofthe basin area and its drainage area remain constant (AjAb=I). The mean mechanical sedimentation rate, SR",e (here for compact sediment), in the basin is therefore equal to the mean mechanical denudation rate, DR.ne, in the drainage area. (2) SRme increases from 10 to 250 mmlka during an active phase of overthrusting and decreases thereafter. (3) The subsidence history of a certain location in the basin resembles that observed in actual foreland basins. It is mainly controlled by flexural downwarping of continental crust in response to the loads of the overthrust sheets and the accumulating sediments (cf. Chap. 8). (4) After overthrusting has ceased, erosion continues at a reduced rate causing so me rebound (uplift) of the denudational area. This also affects to some extent the basin area.
Prior to the approach of the overthrust belt, the basin is shallow-marine (or continental), slowly subsiding
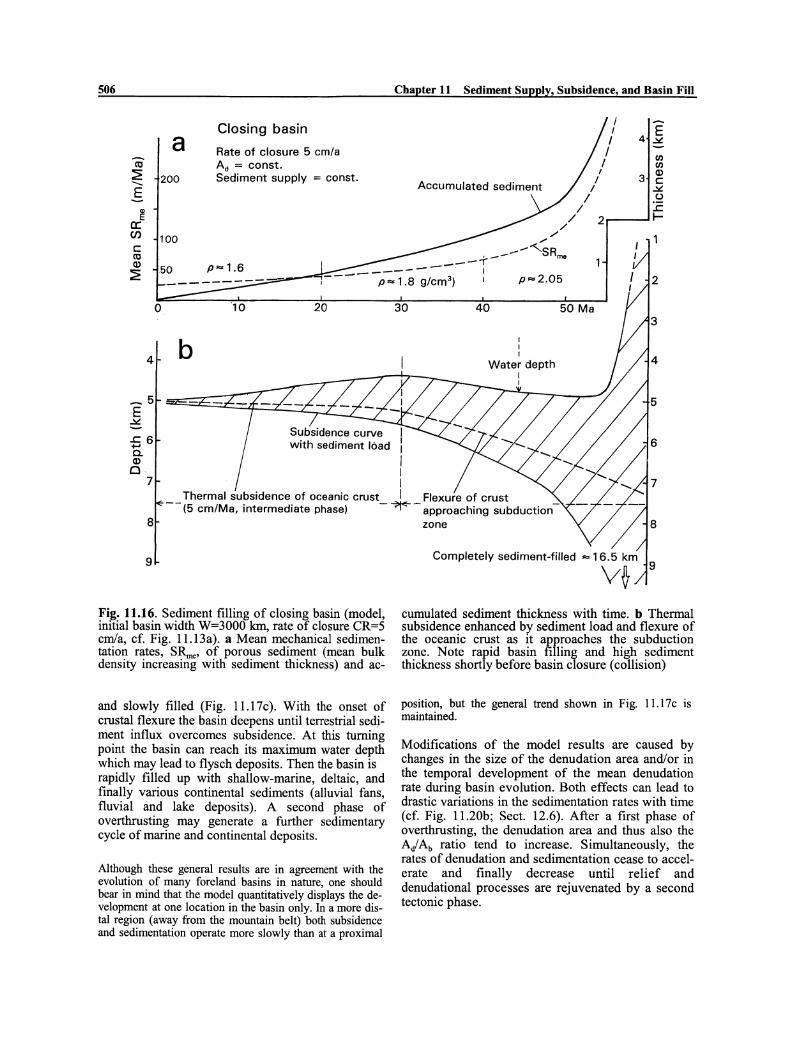
506
CI)
E ce CI)
c co Q)
~
4
-S6 a. Q)
Cl 7
a 200
100
50
b
Closing basin
Rate of closure 5 em/a Ad = eonst. Sediment supply = eonst.
p"" 1.6
20
Chapter 11 Sediment Supply, Subsidence, and Basin Fill
30
I I I I I
./ ..-
I I I
E 4~
I IJ) I IJ)
/ 3 ~ I ~
/ u / ..c
/ 2...--.... 1-/
----"'-SR __ .,..-- me
--- I p=2.05
40
I I I
Water depth I I
50 Ma
2
Thermal subsidenee of oceanie erust I Flexure of crust (5 em/Ma, intermediate phase) - ~~ - approaehing subduction-
8
9
Fig. 11.16. Sediment filling of closing basin (model, initial basin width W=3000 km, rate of closure CR=5 emla, ef. Fig. 11.13a). a Mean mechanieal sedimentation rates, SR".e' of porous sediment (mean bulk density increasing with sediment thickness) and ac-
and slowly filled (Fig. 11.17c). With the onset of crustal flexure the basin deepens until terrestrial sediment influx overcomes subsidence. At this tuming point the basin can reach its maximum water depth which may lead to flysch deposits. Then the basin is rapidly filled up with shallow-marine, deltaic, and finally various continental sediments (alluvial fans, fluvial and lake deposits). A second phase of overthrusting may generate a further sedimentary eycle of marine and continental deposits.
Although these general results are in agreement with the evolution of many foreland basins in nature, one should bear in mind that the model quantitatively displays the development at one loeation in the basin only. In a more distal region (away from the mountain belt) both subsidenee and sedimentation operate more slowly than at a proximal
zone
Completely sediment-filled =16.5 km
V~ cumulated sediment thickness with time. b Thermal subsidence enhanced by sediment load and flexure of the oceanic crust as 1t approaches the subduction zone. Note rapid basin filling and high sediment thickness shortly before basin closure (collision)
position, but the general trend shown in Fig. 11.17e is maintained.
Modifications of the model results are caused by changes in the size of the denudation area andlor in the temporal development of the mean denudation rate during basin evolution. Both effects can lead to drastic variations in the sedimentation rates with time (cf. Fig. 11.20b; Sect. 12.6). After a first phase of overthrusting, the denudation area and thus also the AiAb ratio tend to increase. Simultaneously, the rates of denudation and sedimentation cease to accelerate and finally decrease until relief and denudational processes are rejuvenated by a second tectonic phase.
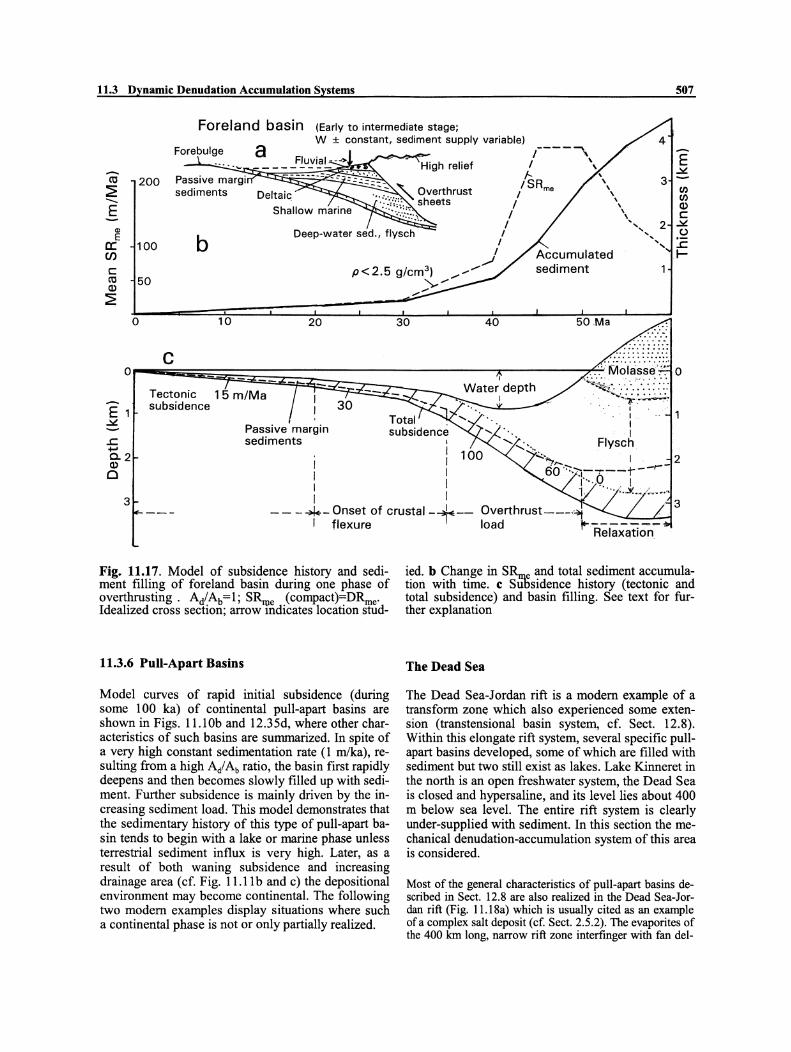
11.3 Dynamic Denudation Accumulation Systems 507
Foreland basin (Early to intermediate stage; W ± constant, sediment supply variable)
-CO
~ -E (I)
E ce. Cf)
200
100
Forepulge
Passive margi sediments
b
a High relief
I ...-J
I I , ,
I I
----'"""\ , , , , f-
'SRme , , 3
\ Cf)
'. Cf)
\ CD \, 2 ~
"........ U " ..c
I-c CO Q)
50 p<2.5 g/cm3 ) .... /-'" sediment
~
E 1 ..:-,&.
o 10 20
Passive margin
"y'" .,,/
30 40 50Ma
30
..c +-'
sediments I
0..2 Q)
Cl
I I I I
2
3 I I -- --*- Onset of crustal-+-
I flexure Overthrust---,~ load 1-"-----:--
Relaxl'Itlon
Fig. 11.17. Model of subsidence history and sediment fiIling of foreland basin during one phase of overthrusting. AiAb=l; S~e (compact)=D~e' Idealized cross seetion; arrow mdicates location stud-
11.3.6 Pull-Apart Basins
Model curves of rapid initial subsidence (during some 100 ka) of continental puIl-apart basins are shown in Figs. 11.10b and 12.35d, where other characteristics of such basins are summarized. In spite of a very high constant sedimentation rate (1 mlka), resulting from a high Ai Ab ratio, the basin first rapidly deepens and then becomes slowly filled up with sediment. Further subsidence is mainly driven by the increasing sediment load. This model demonstrates that the sedimentary history of this type of puIl-apart basin tends to begin with a lake or marine phase unless terrestrial sediment influx is very high. Later, as a result of both waning subsidence and increasing drainage area (cf. Fig. 11.11 band c) the depositional environment may become continental. The foIlowing two modern examples display situations where such a continental phase is not or only partiaIly realized.
ied. b Change in SR,..,e and total sediment accumulation with time. c SÜbsidence history (tectonic and total subsidence) and basin filling. See text for further explanation
The Dead Sea
The Dead Sea-Jordan rift is a modern example of a trans form zone which also experienced some extension (transtensional basin system, cf. Sect. 12.8). Within this elongate rift system, several specific puIlapart basins developed, some of which are filled with sediment but two still exist as lakes. Lake Kinneret in the north is an open freshwater system, the Dead Sea is closed and hypersaline, and its level lies about 400 m below sea level. The entire rift system is clearly under-supplied with sediment. In this section the mechanical denudation-accumulation system of this area is considered.
Most of the general characteristics of pull-apart basins described in Sect. 12.8 are also realized in the Dead Sea-Jordan rift (Fig. 11.18a) which is usually cited as an exarnple of a complex salt deposit (cf. Sect. 2.5.2). The evaporites of the 400 km long, narrow rift zone interfinger with fan del-

508
tas fluvial sediments, laeustrine limestones and marls in a series of strike-slip-indueed depressions (e.g. Manspeizer 1985' Kashai 1988; Niemi et al. 1997). In the northem part of th~ transform zone, gabbroid to basaltie flows eontribute to the graben fill. The basin fill of the Dead Sea reaehes a thiekness of 8 to 10 km. The following interpretation is mainly based on a previous synthesis (Zak and. Freut:d 1981), weil logs (e.g. Kashai 1988), and reeent radlOmetne dating (Steinitz and Bartov 1992) of plateau basalts and lava flows. However, there are still many uneertainties, for example, in the dating of sediments, teetonie events,. and subsidenee history. The preliminary geohistory analysIs of Fig. 11.18e somewhat deviates from the Dead Sea basin history summarized by Garfunkel (1997) who ~sumes an earlier (Late Mioeene) onset of aeeelerated subsldenee than shown in F ig. 1l.l8e.
In the Mioeene and early Plioeene, a sort of shallow depression (protorift, eomparable to that of the Gulf of Califomia; see below) seems to have existed with low to medium relief in its drainage area. This is doeumented by fluvial deposits of varying thiekness (Haveza and Biro-Lido Fms. of some 200 m or more in thiekness) at the base and at plaees along the margin ofthe graben fill. The long time period (around 10 Ma) and the size of the drainage area (possibly five times that of the depositional area) proyi~ed mueh more elastie material than neeessary for the eXIstmg sediment volume. Consequently, the protorift system was sedimentologieaUy open to the west or south, and its floor layabove sea level.
During the Early Plioeene (most !ikely after the Messinian "salt erisis" in the Mediterranean (Fig. lU8e), subsidenee ofthe Jordan rift and the Dead Sea basin aeeelerated in eonjunetion with rapid strike-slip motion. The formerly eontinental basin beeame a salt lagoon eonneeted (in the northwest) with the Mediterranean. Continued rapid subsidenee lowered the basin floor deep below sea level and provided aeeommodation spaee for a thiek marine evaporite sequenee deposited in a very short time period (Fig. 11.18b and e). After the eonneetion to the Mediterranean had been interrupted, the basin beeame both hydrologieally and sedimentologieally elosed. Terrigenous elasties and non-marine evaporites (Amora Fm. and other time-equivalent and younger strata, ineluding dissolved and repreeipitated older salts) on top of the marine roek salt eould not fill the basin up to the niveau of sea level any more. This signifies that mean denudation in the total drainage area of the graben system was !irnited; even the newly ereated high relief along the graben shoulders eould not provide suffieient sediment to fill the further subsiding basin. The suspended load of the Jordan River was trapped by lakes to the north of the Dead Sea.
A erude estimate of the terrigenous sediment influx is possible for the late Pleistoeene Lisan Fm. deposited in a lake eovering most ofthe Dead-Sea Jordan graben during a time period of about 50 ka (Fig. lU8a). The drainage area ofthe graben (Ad=40 000 km2) had beeome wider than before due to headward river erosion; it was about 13 times larger than the lake area (Ab=3000 km2). If the mean thiekness of the Lisan Fm. is 100 m (whieh is uneertain, porosity n ~ 30%) and one half of it eonsists of elasties (elose to alluvial fans it is two thirds, e.g. Reid and Frostiek 1993), a mean meehanieal denudation rate of ~55 mmlka (=135 tlkm2/a) is found for the drainage area. The modem sediment yield of the upper Jordan River entering Lake Kinneret seems to be only 44 tlkm 2/a (Inbar 1982).
Chapter 11 Sediment Supply, Subsidence, and Basin Fill
The relatively high mean mechanical denudation rate (in the order of 50 mmlka) for the drainage area of the Lisan Fm. is sirnilar to that of the Great Salt Lake basin (43 mmIka, see above). It reflects the increased relief of the elevated graben shoulders as well as the somewhat wetter climate of the last pluvial period. It would lead, if valid for a longer time period, to an overall clastic sedimentation rate of about 700 mlMa in the entire graben system. However, even this enhanced sediment supply would not have been sufficient to completely fill the subsiding basin during the past 5 Ma.
The Gulf of California
The Gulf of Califomia is a young oceanic basin formed by strike-slip movements and therefore shows a complicated morphology with a number of srnall deep basins separated by higher areas (cf. Figs. 4.5 and 12.37a, Sect. 12.8). The balanced drainage and basin areas shown in Fig. 11.19b have a ratio of Ad/Ab=1.4. The sediment volume ~fthe gulfha~ be~n deterrnined for the last 4 Ma (Emsele and Nlemltz 1982), i.e. for the so-called post-rift sediments which were deposited after the initiation of ocean spreading (Fig. 11.19a; Curray and Moore et al. 1982a).
Prior to the building of artifieial dams, the northem gulf was fed with substantial amounts of sediment by the Colorado River draining a large hinterland. In the south the gulf has a wide, deep opening to the Paeifie Oeean. To assess a hemipelagic sediment budget, the influenee of the Colorado as a souree of terrigenous material was exeluded by ehoosing some gulf islands as the northem boundary of the studied basin area (Fig. 11.19b). These islands aet as a barrier whieh traps the Colorado sediments. In the south and southwest the boundary !ine of the study area separates a gulf region still influeneed by hernipelagie ~edim.ents fro~ the deeper oeean floor, where pelagie deposlts (wIth a sedimentation rate ofless than 20 mmIka) prevail.
Prior to 4 Ma ago, a "protogulf" existed, in whieh sediments of eonsiderable thiekness aeeumulated, partieularly below the eastem shelf of the present gulf (Fig. 11.19a and d). The protogzilj sediments rest on subsiding eontinental ernst, while the younger, post-rift sediments were deposited either on new oeeanie erust in the deep main part of the gulf, or on top of protogulf sediments separated by an uneonformity.
Based on seismie reeords and holes drilled during Leg 64 ofthe Deep Sea Drilling Projeet, an isopaeh map for the post-rift sediments eould be drawn, whieh sho:ws ~xtremely varying sediment thieknesses (EinseIe and Nlemttz 1982). In order to ealculate the sediment volume of the depositional area, the different ~ediment thieknes~es were subdivided into slabs of equal thlekness and POroSlty. Wet, uneompaeted sediment volume was the!? eon~erted into volume of eompaeted, solid (dry) rnatenal (Flg. lUge) using the porosity/depth relationship found in the boreholes (Fig. lUge).
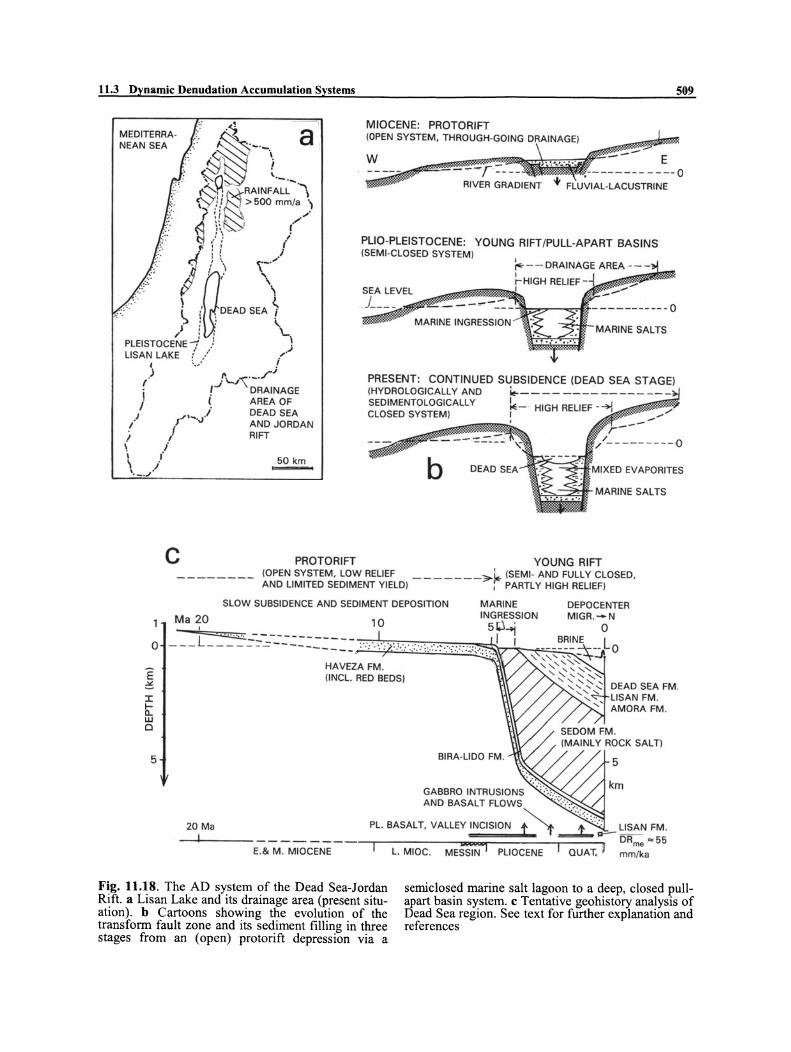
11.3 Dynamic Denudation Accumulation Systems 509
MEDITERRANEAN SEA a ' ~~--\
~. RAINF~~~~\ c;y.!.i > 500 mm/a .)
( :i ,,/'
~ l\ !
I~;\\ '/ l i : DEAD SEA ~ J : ." '" / : , L
PLEISTOCENE -i ! ! I • J
LlSAN LAKE i / /' (.> .- I'\... ~._./; ,J /"\ DRAINAGE i i AREA OF
/ -" .... .i DEAD SEA i l,J AND JORDAN
I I RIFT \ .I i I \ . '._.JI
50 km
MIOCENE: PROTOR1FT (OPEN SYSTEM, THROUGH-GOING DRAINAGE)
w E -~-r --- - ,----- - - - ----0
RIVER GRADIENT .. FLUVIAl-lACUSTRINE
PLIO-PLEISTOCENE: YOUNG RIFT/PULL-APART BASINS (SEMI-ClOSEo SYSTEM)
~-- oRAINAGE AREA - -
l- HIGH RELlEF - i __ ($$_~~b.1
PRESENT: CONTINUED SUBSIDENCE (DEAD SEA STAGE) (HYDROlOGICALLY AND ~---- ---- ---- - - --SEDIMENTOl OGICALl Y k- HIGH RELIEF - -+! __ i!#!~"'!:'? CLOSED SYSTEM) ~ I
----==::--
b
c PROTOR1FT YOUNG RIFT (OPEN SYSTEM, lOW RELIEF _ ______ ~~ (SEM 1- ANo FUllY ClOSED, AND LlMITED SEDIMENT YIELD) I PARTL Y HIGH RELIEF}
SLOW SUBSIDENCE ANo SEDIMENT DEPOSITION MARINE DEPOCENTER M1GR.-N Ma ~o 10 IN;8ES.SION
o _ __ L_~.:--::-~---:'::'::-==,::. ;':"'::' :.:.:: .. ::::::.:.:>:.;:.: : :~: ;,.; : ... I "1 o
E ~ I
t w o
5
HAVEZA FM. (lNCL. RED BEDS)
BI RA-LIDO FM.
DEAo SEA FM. LlSAN FM. AMORA FM.
5
:: " km
20 Ma
- ... 1---------
AND BASALT FlOWS . ::-.. : .. : .. :: .....
PL. BASALT, VAllEY INC1SION 0 2:'~LlSAN FM .
DRme " 55 E.& M. MIOCENE I L. MIOC. MES;N I PLiOCENE r QUAT,' mm/ka
Fig. 11,18. The AD system of the Dead Sea-Jordan Rift. a Lisan Lake and its drainage area (present situation). b Cartoons showing the evolution of the transform fault zone and its sediment filiing in three stages from an (open) protorift depression via a
semiclosed marine salt lagoon to a deep, closed puliapart basin system. c Tentative geohistory analysis of Dead Sea region. See text for further explanation and references

510
SPREADING CENTER
Chapter 11 Sediment Supply, Subsidence, and Basin Fill
\ \
POROSITY (%1 80 40
200 \ c
400
800
\ \ \ \ \ \
\ TRANSFORM. OF WET SED. THICKNESS
\ INTO DRY 800 1---1f---'_'-\SOLID SED.
lTHICKN . \ OF WET \ SED. \
m ~~~~~~--r+
1000
o 100 2"00 300 400 500 600 m
THICKNESS OF SOLID MATTEIl
e
SLABli OF EQUAL 'THICKNESS
o 10 20 km
SW IV
:1:\--_~ ~WETSED= 40 10 20 km
f DENUDATION =========2) RATE IN -
810-GENie
MOUNTAINS 750 ml Ma
TERRIGENOUS (rn/Mal
Fig. 11.19. Sediment budget ofthe central and southem Gulf of Califomia. a Evolution of the gulf from a shallow-marine protogulf stage on continental crnst to a transtensional narrow gulf with deep oceanic spreading centers. b Drainage area, limits of the studied depositional area, and special sections (1- V) across the gulf. c Porosity/depth relationship representative of major parts of the gulf and conversion from wet to solid sediment thickness as shown in (e).
ON . COAST AL PLAIN
~!~~~~~~~,i d,e Sections 11 and IV of b with thicknesses of wet (uncompacted, porous) sediment (vertical exaggeration x5), converted in e to dry (compacted, solid) sediment (shown only for part of the section, vertical exaggeration x50). f Average sedimentation rates in the studied gulf area and derived mean denudation rate in the corresponding drainage area. (After Einseie and Niemitz 1982)
11.3 Dynamic Denudation Accumulation Systems
0.1 0.2 0.5 1 2 5 10 20 50 100 1~--~~-4~----r-~--LI~'~, ~'----+I--~I~----~'--~I
Ad/Ab~ ?~ 2 5 a 2
5 -ca ~ - 10-k----E
Q) -,
b Ad/Ab
2 co
E E 5
E 0: U) 10 C co ~ 20
:ro, 11
1I Iin ~ (In
E 20 a: Cf) Global av.© ~ o.~Ulf of
-~ 1'&1') California
50 \\ D 11
ii~ J" 11 :! c 11 c
ca CI) 50 ~
iS'''o ' ,,~ . I ~~/ >0~
100 " V ., Locall'y
~ / ____ ~:_ Xi9~~ ~ ::-~: 70 _200
100-k---ST-i, I --1_ _ ::-~ .... engal fan Rhone ~ "'<. Slack Sea
200
500
1000
2000-
5000-
", r fan I:',-~: I Lake-D " ~" ---, Chad " ........--" --" --'..... C 7. ---- __ 70 Q ----- iS'~ V I Miss. fan ".
;Qo 6 -- - Nile fan Yellow' --------Sea ~V
,~casp;an, Se,
7Q Vo = Perialpine =.
lake. _~ 10000J ___ -L __ ~~ ____ l_ __ _L~~_L __ ~~ __ ~-L~L---~
511
Fig. 11.20. Interrelationship between the ratio of drainage and basin area, Ai Ab' and the mean mechanical sedimentation, SKme' of various basins (summary). a Trends in the development of extensional and closing basins (arrows) as weH as results from some young basins and deep-sea fans.
(Ihe Xigaze forearc basin is Cretaceous; cf. Sect. 12.5.3, Fig. 12.27; b Trend of SR..,e in foreland basin affected by two phases (1 and II) of overthrusting. Stage A Overthrust beit still submerged. B Rising mountain belt. C Increasing drainage area; D:
The average sedimentation rate for dry solid post-rift deposition was found to be 25 mlMa for the young gulf and 50 mlMa for its eastem shelf, where the young sediments lie on protogulf deposits. When the areal extents of both depositional areas are taken into account, the average sedimentation rate becomes 36 mlMa (Fig. 11.l9t). Because 11 of the 36 mlMa are
Stillstand, lowering relief
made up of biogenic silica, carbonate, and organic matter, only 25 mlMa originate from the influx of terrigenous material (Fig. 11.19b). Ihis average value for the post-rift gulf does not take into account that the areal extent of the basin increased during the last 4 Ma. At present the basin is about three times larger than 4 Ma ago when it mainly comprised the

512
eastern shelf area. Consequently, the sedimentation rate decreased during the past 4 Ma as is characteristic of an extensional basin. Applying a mean ratio of Ai Ab = 1.4, an average denudation rate of about 20 rnIMa for the past 4 Ma was determined. If the sediment vo1ume is only related to the mountain ranges, the denudation rate becomes higher (about 50 rnIMa). The limited drainage area and its relatively low average denudation rate as well as rapidly operating tectonic movements explain why the Gulf of California is still a deep ocean basin.
11.3.7 Summary (DA Basin Models)
The interplay between the source areas, Ad, of terrestrial sediment and various basin types (area Ab) and their subsidence history is demonstrated by a number of simplistic model basins.
- Clastic basin filling is largely controlled by the Ai Ab ratio and the mean rate of mechanical denudation, D~e' In extensional basins, the mean mechanical sedimentation rate, S~e, decreases with time, in closing basins it increases (Fig. 11.20a). The filling of foreland basins is accentuated by pulses of overthrusting (Fig. 11.20b, land 11) and drastic changes in sediment input and Srme.
11.4 Chemical Sediments (Evaporites) in Basin Filling
11.4.1 General Aspects
Chemical sediments or evaporites play a significant part in the filling of rnany basins. They form either by evaporation of sea water in coastal lagoons and larger basins connected with the ocean, or they occur in closed lake basins fed by river water. Marine salts usually accumulate rapidly and generate thick sequences in very short time intervals (cf. Sect. 6.4). A mass balance for these evaporites, which includes the sediment source, is not possible, however, because the salt reservoir of the oceans is practically unlimited.
The situation is different for closed lake basins with certain drainage areas which deliver dissolved material released from various rock types by weathering (cf. Sect. 9.2). Provided the basin floor is impermeable (which is not always the case), then the incorning dissolved matter remains entirely in the lake basin and can form evaporites. Therefore it is possible to establish mass balances for modern lakes, the source areas of which are known, similar to the balances discussed above for terrigenous sediments. Some of the problems and results of this approach
Cbapter 11 Sediment Supply, Subsidence, and Basin Fill
Part of the mountain-derived material was deposited on alluvial plains before it reached the gulf, but even the denudation rate calculated for the mountainous area appears to be rather low. The drainage area ofthe gulflies in the transition zone between the hot dry c1imate to the northwest and the semiarid and increasingly wet c1irnate of the lowlands and mountain ranges of mainland Mexico, the Sierra Madre Occidental, in the southeast. Here, some rivers drain regions of high relief, consisting largely of Cenozoic volcanics. It can be assumed that the size of the drainage area has not changed significantly during the last 4 Ma.
The models predict periods of deepening and shallowing basins as well as transitions from continental to aquatic environments and vice versa. Simplistic models of entire basins cannot account for various complications realized in nature, such as differential subsidence and nonuniform sediment distribution, or lateral facies changes within the basin (two- and three-dimensional effects). Nevertheless, such models can help to better understand the evolution of more complex basins.
are briefly mentioned here. Biogenic sediment production is neglected. A general overview of the sediments of closed lake basins is given in Sect. 2.5.
11.4.2 Mass Balances of Closed Lake Systems (One Rock Type)
For simplified chernical budgets of lakes, it is assumed that the dissolved constituents are precipitated inorganically and form solid, pore-free layers in lake basins. These models simulate to some extent the situation in salt lakes (Sect. 2.5.1) which are, however, not devoid of biota and terrigenous material. Some results of such a model are shown in Fig. 11.21 for three different types of rock exposed to weathering in the drainage area of the lake.
In the model in Fig.l1.21 thedepositional area of the lake remains constant and makes up one tenth of the denudation area feeding the lake with river water. Water depth and subsidence of the lake basin floor are sufficient to take up sediments during a time interval of at least I Ma. The climate in the drainage area of the lake is predominantly semiarid to humid, in the lake area itself it is arid. The rock types in the denudation area may be either granitic, basaltic, or carbonates. The average chemical denudation rates are assumed to be on the order of 5, 10, and 30 m/Ma,

11.4 Chemical Sediments (Evaporites)
35
230
NaCt
CaS04
MgC03
CaC03 BASALTS DR= 10 m/Ma
513
100 <ii ~
~ 50 4. u
a: Vl
0
GRANtTtC OTHER SALTS ROCKS
Fig. 11.21. Model of chemically precipitated lake sediments derived from chemical weathering in the drainage area of a c10sed lake system and deposited in 1 Ma. The ratio of drainage area, All' and lake area, Ab' lS
AiAb=lO and kept constant; the c1imate in the drainage area is semiarid to temperate, around the lake it is arid. The rocks in the drainage area consist altematively of carbonates, basalts, or granites and thus cause differing chemical denudation rates, DRGI.t. Note that part of the seOlments may be biogenic and that MgC03 commonly is used to form dolomitic limes tones and dolomites. See text for further explanation
5 7
18
33
Si02 28 8 ...... . . .
respectively. (The values for granite and basalt appear to be relatively high, but they reflect the groundwater chemistry of these rock types which, in addition to the uptake of atmospheric CO2, also largely controls the chemistry of river water; Sect. 9.2). With the aid of these denudation rates one can calculate the thicknesses of the major chemical sediments precipitating in the lake per time unit.
Provided all the dissolved material is reprecipitated in the lake, this model yields total sediment thicknesses ten times greater than the denudation rates. This signifies that under the conditions of the model, lake sequences of 50, 100, and 300 m accumulate in a time period of 1 Ma. The thicknesses ofthe individual sediment types are not only a function of the differing denudation rates, but also vary significantly in relation to the rock types. In terms of sediment volurne, calcium carbonate is the most important lake sediment derived from a calcareous and basaltic drainage area, followed by magnesium carbonate which normally combines with calcium carbonate to form dolomitic limestones or dolomite. As the solute concentration in the lake water grows, minor proportions of gaylussite and mirabilite may form (cf. Sect. 2.5, not shown in Fig. 11.21). Granitic rocks tend to deliver more silica than other constituents, but calcium carbonate takes the second position in this case also.
DR= 5 m/Ma
The highest silica supply comes from basaltic rocks, while carbonates deli ver only small amounts, unless they are rich in opaline silica. Both calcium and silica may be used up to a large degree by organisms to form skeletal carbonate and opaline silica. Another important sink of silica and cations is the regradation of the incoming, weathering-degraded clay minerals as well as the formation of new clay minerals (not shown in Fig. 11.21, cf. Sect. 2.5).
Likewise, the precipitation of various other salt minerals containing sulfate, carbonate, and chloride (referred to as "other salts") is not quantified. Their formation also depends on the concentrations of hydrogen carbonate and sodium in the lake. The thicknesses of the gypsum and haUfe layers produced in the model basin vary only slightly with rock types. In coastal areas, the rain water may be richer in NaCI and thus produce higher Na + and Cl· concentrations than found in the groundwater analyses used as standards for the model.
The model basin demonstrates the orders of magnitude for evaporite generation as related to chemical denudation rates, the drainage/lake area ratio, and time. U sing the data of Section 9.2 and varying the Ai Ab ratio, other scenarios may be devised in order to evaluate the potential chemical sediment budget of closed lake-drainage systems.

514
11.4.3 Evolution of Closed Lake Basins (Mixed Rock Types)
A more realistic, modem approach is the use of geochemical computer pro grams (e.g. The Geochemist's Workbench; Bethke 1996) to study water-rock interactions and mineral successions in lakes. These programs are based on thermodynamic equilibria between solutions (inflowing water and lake water) and solid phases (precipitating minerals including backreactions with pre-existing minerals). If the chemistry of inflowing waters and the hydrological budget of a closed lake basin are known, one can simulate the past or future evolution of the basin. The validity of backward modeling can be checked by investigating the sediments present in the lake. The mass of authigenic lake sediments, including their porewater composition, allows independent establishment of a mass balance of the dissolved matter influx for a certain time period. Provided these tests are possible and turn out satisfactorily, the modeling can be extended to predict the lake development in the future.
Figure 11.22 shows examples of this type of foreward modeling for two modem closed lakes, Lake Qinghai in Tibet and Lake Turkana in East Africa. Some data about the characteristics of these lakes and their drainage areas are listed in Table 11.1.
Lake Qinghai, Tibet, lies in a rift depression (mainly sedimentary rocks) and has existed since the early Pleistocene (Yan 1999; Yan et al. 2000). The simulation of this lake is based on its development during the Holocene (10 ka) when the lake became increasingly salty.
Lake Turkana, East Africa, lies in the eastem branch ofthe East African rift zone (cf. Fig. 12.3) and has evolved since about 4.5 Ma. It has a complex history (e.g. Cerling 1986). The data used below refer to the development during the past 4 ka. The northem drainage area of this lake, which delivers 80-90% of the inflow, is characterized by young basalts whereas in other parts granitic and metamorphic rocks also occur.
By extrapolating the mean sedimentation rates of the lakes into the future, the lifetime of the lakes up to overflow was determined. Furthermore, the storage capacities of the basins and their subsidence was taken into account (Lake Qinghai 200 mmlka, Lake Turkana 230 mmlka). Lake Qinghai was found to persist for about 300 ka, Lake Turkana for 100-150 ka. These time periods were taken as limits for the forward modeling.
Fig. 11.22. Simulation of the future evolution of two naturallakes, L. Qinghai, Tibet, and L. Turkana, East African rift. (After Yan 1999, modified). The two hydrological models meet both reduction in water volume and leakage ofthe lake basins. The solute input (in 1016 g) is based on modem measurements and gives the masses for 300 ka and 100 ka, respectively). The
Chapter 11 Sediment Supply, Subsidence, and Basin Fill
The influx of dissolved matter was taken from chemical analyses of river water and mean chemical denudation rates in the drainage areas (Lake Qinghai 20 mmlka, Lake Turkana 7.5 mmlka).
F or both lakes two different scenarios are assumed: (1) the salt concentration increases with time due to influx and, in addition, the initial (present-day) water volume, VI' of the lakes is reduced to the ultimate volume V E=O.l VI (additional evaporative concentration), or (2) VI remains constant with time (V E=VI) and the salt concentration solely increases due to influx.
The input of dissolved species has to be subdivided into solutes derived from rocks and others coming from the atmosphere (mainly HC03 and Cl). Only part of the atrnospheric HC03 is used up for mineral precipitation, the remainder is again released into the atmosphere or stored in the lake. Due to the various losses (part of HC03, leakage, regradation of clay minerals, sulfate reduction) the mass of minerals and solutes remaining in the lake and its sediments is less than the solute input. This is particularly so in Lake Turkana. The succession of salt minerals and their mean sedimentation rates in the two lakescan be seen from Fig. 11.22.
Lake Qinghai is slightly leaky (loss of 25% of the inflowing Na and Cl to groundwater) and Lake Turkana is very leaky (75% loss). As a result, the salt concentration increases faster in Lake Qinghai and in model (I) of Lake Turkana than in model (2) ofLake Turkana with the result that, even after a time period of 100 ka, the salinity is not high enough for precipitation of highly soluble minerals. With less leakage, model (2) of Lake Turkana would produce a mineral succession similar to that ofmodel (I).
Ions consumed by the regradation and neo-formation of clay minerals are not considered in Fig. 11.22. In Lake Qinghai they make up around 6% of the influx (80% of K+), in Lake Turkana 25% of the influx. In Lake Qinghai, Ca- and Mg-carbonates will be precipitated during the first 20 ka ofthe simulation. Primary magnesite will be replaced by dolomite during early diagenesis. After this phase, gaylussite (Ca-Na~carbonate) will form but, due to further solute influx, the precipitation of calcite and magnesite continues at a somewhat reduced rate. After 60 to 80 ka, mirabilite (Na-sulfate) starts to precipitate along with the carbonate minerals. Saturation with respect to halite (NaCl) is reached after about 130 ka (model I) or 220 ka (model 2). Sylvite (KCI) only forms in model I at the very end of the lake evolution.
It should be noted that in reality the various salts do not precipitate simultaneously as indicated in the diagrams.
masses precipitated as authigenic minerals and left in lake water are reduced by leakage, ion uptake by weathered clay minerals and release of CO2 into the atmosphere. Note that second and following minerals react with formerly precipitated minerals and thus reduce their sedimentation rate. See text for further explanation

11.4 Chemical Sediments (Evaporites)
P = PRECIPITATION E = EVAPORATION
QIN = INFLOW 1 'bw =TO GROUNO (1) VE=O. 1 ~ E
HYDROlOGICAl MODELS
WATER ~ P - - - - - -1- - - - - --
SOlUTEINPUT
64
'I
L. QINGHAI. TIBET (300 ka, 25 % 01 Na and CI lost by leakage)
200
ro ~ E E 100
.r. rr.u (f)
0 0
55.2
41 KCI
NaCI AUTHIGENIC -N~S04
::~~ N~C03 /' MINERAlS _________
MgC03
SOlUTES ENRICHED IN LAKE WATER
/ 0.3 ,Na
' CI
3.0 t:=:"::3O Na
CI
SALINITY (g/kg) ~--------~----~~---r400
90
SYLVITE
HAllTE
MIRABILITE
GAYLUSSITE
CALCITE AND MAGNESITE (DOLOMITE)
i80 270 0 90 180 270
Cl ~ Cl
200 > t: z ::J <! (/)
TIME (ka)
L. TURKANA, EAST AFRICAN RIFT (100 ka, 75 % of Na and CI lost by leakage)
515
lmilmm~ S~: ~.76 AUTHIGENIC MINERALS /"' ~13.6
SOlUTES ENRICHED IN LAKE WATER
","i'i"I"I' -f--I I 1 11 HCCL = 31 9 , I I 11 "3 .
,111 1 FROM ,11'1 ATMO· 1 11 I I SPHERE
11 11 ' : 1 II11 1 -I1 1I1 ~ ~ 200
1 Na ~CI
SOLUTE ~
INPUT ~.r. 100 '11111111~i I ~t 0 J x1016 g 0 20 40 60 80 100
(= 10'0 metric tons)
o 20 40
\ Na
~CI ~S04
HC~
o 60 80 100
TIME (ka)

516 Chapter 11 Sediment Supply, Subsidence, and Basin Fill
Table 11.1 Characteristics ofLake Qinghai (Tibet) and Lake Turkana (East African rift zone) and data relevant for modeling the future lake evolutIOn (after Yan 1999, simplified, rounded values)
L. Qinghai L. Turkana
Drainage area Ad (km2)
Dominant rock types
Lake area Ab (present-day, km2)
Ratio AiAb Mean water depth (m)
Climate in drainage area
Annual precipitation in dramage area (mm/a) in lake area (mm/a)
State oflake
Total dissolved matter in inflow (present-day)
Lake water chemistry (present) Total dissolved species Dominant species Saturated with respect to
Characteristics of Holocene sediments
Average sedimentation rate, pore-free (mm/a)
Chemical denudation rate (mm/ka)
Influx of dissolved matter derived from sediment mass in lake
Accumulated in lake water in % of influx
Removed by mineral precipitation, pore water, leakage in % ofinflux
Total storage capacity of lake basin up to overflow (km3)
Lifetime of lake (ka)
-30000
sdst. and limest., some metamorphic rocks, grani~es and diorites
4340 7
16
semi-arid
350-550 350
closed since 15 ka B.P. slightly leaky
0.35 g/l (pH 8.3)
14.1 g/l (pH 9.2) Na,CI aragonite, hydro-magnesite, ± mirabilite
black, organic-rich carbonate mud (authigenic low-Mg calcite, aragonite and dolomite)
0.2 (Holocene)
-20
2 X 10¹² g/a
<10 Mg, 10-20 K, Na and S04' 40 Cl, depleted of Ca, HC03 and Si02
-95
500
200-450*
*Higher value takes into account subsidence
123000
young basalts (main source of water) granitic rocks, alluvium
7560 16 31
mixed: semi-arid to humid subtropical
400-1400 200
c10sed since 3.5 ka B.P. strongly leaky
0.12 g/l (pH 7.1)
2.5 g/l (pH 9.3) Na, HC03, Cl, rich in Si02
calcite
calcareous c1ay (70 % c1ay minerals, (5-10% autigenic carbonate)
0.4-0.8 (past 4 ka)
-7.5 ?
6 x 10¹² g/a (past 4 ka)
10 Na, 20 Cl, all other ions 0-2
~98
1350
100-150*
Instead, oversaturation may prevent precipitation of a certain mineral for some time and thus lead to delayed, very rapid and discontinuous deposition of relati vely pure layers of this mineral. In other words, the simulation only shows the ranges of saturation and mean deposition rates of the various minerals. In addition, older salt minerals may be partly dissolved and used up during the formation ofyounger minerals.
In Lake Turkana (modell) it takes more than 80 ka to come to the gaylussite stage and the subsequent mirabilite and halite precipitation. In model 2 (V j= constant) the carbonate stage of the lake persists throughout the entire time (up to 100 ka) offorward simulation.

11.5 Clastie Sediment, Distribution
The evaporites (including authigenic carbonates) contribute about one half of the total filling of the Qinghai basin and about 10% of the sediment fill of Lake Turkana. In the latter, the precipitates are strongly diluted as a result of the relatively high mechanical denudation rate (~50 mmlka). Due to the moderate chemical denudation rates in the drainage areas, the overall chemical sedimentation rates in the lakes (around 150 mmlka in Lake Qinghai and mostly ;:; 100 mmlka in Lake Turkana) are limited. They cannot compete with the often extremely rapid
11.4.4 Summary (Evaporites in Basin Filling)
- Using the DA concept (Sect. 11.2.1) and known rates of chemical weathering, the contribution of evaporites (and biogenie carbonates and silica) to the filling of closed lake basins can be estimated.
- Closed lake basins need long concentration times (in the order of 50-200 ka) to achieve saturation with respect to high-soluble salts, such as halite.
- In contrast, evaporite basins connected with the open sea have a huge reservoir of salts and can accurnulate thick evaporite sequences in a very short time span (cf. Sect. 6.44).
- The accumulation rates of lacustrine evaporites increase with the growing AJAb ratio (cf. Sect.
11.5 Distribution of Clastic Sediments in Water-Filled Basins
11.5.1 Introduction
In the previous sections on denudation-accurnulation systems it was mostly assumed that the incoming sediment is distributed evenly over the entire basin area. This assumption is useful for the assessment of overall sediment mass balances but it is, of course, unrealistic for studies into sedimentary facies and stratigraphie architecture of entire or partial basin fills. One rule is valid in all basins, including fluvial ones: more sediment tends to accumulate in areas of relatively strong subsidence than, for example, along the basin margin.
Distribution of terrestrial sediment in water-filled basins is more complex and less predictable than that in fluvial systems (cf. Sect. 2.2). Fundamental differences between these two groups of depositional environments include:
- Fluvial basins never trap all the incoming sediment. The gradient of the channel system and the turbulent
517
rates of salt deposition known from pre-concentrated brines of deeper marine basins (cf. Sect. 6.4). When Ai Ab is much greater than in the lake example (~7 and ~ 16, respectively, Table 11.1), then of course the rates of chemical sedimentation become higher.
The fate of the dissolved river load entering the sea and i'iS significance in geochemical cycles is discussed in special volumes, such as Holland (1984) and Gregor et al. (1988).
11.2.1) and depend on the lithologies in the drainage areas. With Ad/Ab ~ 10, rates in the order of 100-200 mm!ka are common.
- Long-term, the ratio between clastic and evaporitic sediments in hydrologically completely closed lakes (no leakage) reflects the mechanical and chemical denudation rates in their drainage areas.
- Leakage of lake basins delays or even prevents the precipitation of well-soluble salts (e.g. gaylussite, mirabilite, and halite).
- Sulfate reduction and regradation of clay minerals play a significant role in controlling the types and successions of evaporite minerals.
river flow maintain sediment transport through the basin, at least intermittently. Generally, the relatively coarse grained bed load tends to settle whereas the suspended material is easily exported to areas downstream. The proportion of coarse and fine sediment deposited in the basin greatly depends on the accommodation space provided by subsidence or change in base level (cf. Sect. 7.6). - Water-filled basins norrnally trap both the bed load and the suspended river load. The modes of sediment distribution, reworking and redistribution, however, rnay significantly differ from basin to basin. AIthough one can apply some rules (cf. Chaps. 3 through 5), the current systems operating within the basin as well as specific bathymetric features of the basin can greatly modify the "normal" sediment dispers al.
It is mostly assumed that the rate of deposition systematically declines from the mouth of a river (or several rivers in line) towards the basin center (Fig. 11.23, broken lines).

518
a
b
Chapter 11 Sediment Supply, Subsidence, and Basin Fill
SHALLOW LAKES (LOW ENERGYI
SEDIMENT DEPOSITED PER TIME UNIT
DELTA PROGRADING
DEPOSITION
EPICONTINT AL SHALLOW SEA
RIVER GRADIENT
± MINOR DELTA (iNTERMEDIATE TO HIGH ENERGYI PROGRADING
---------------------------------r
--~ :=-.::;. ~---::;..;..:.::-- ± EQUILIBRIUM PROFILE
- - CONTROLLED BY WAVES -, '. ;;.::..::': - -DIFFERENTIAL AND CURRENTS
, SUBSIDENCE \'--- - - - -', .. --~
BYPASSIN~_ ~- - - - I
. ~ . :i"
C SHELF - DEEP SEA (HIGH ENERGY) ± DELTA PROGRADING
------- ----------------------7~--~----
~~~~:::~=:~1]t;~::~~ OISTRIB~ION DEEP-SEA FAN, PROGRADING SLOPE \ _ - - -:
=:r:~~.::.:;;@fi!i.L .. ~ .. : .~. ~ .~~.~~ 1 <:=J
Fig. 11.23. General principles for the distribution of river-bome terrigenous sediment in water-filled basins; relative sea-Ievel changes are not considered. In all cases, sediment supply keeps pace with overall subsidence; the potential sediment thicknesses decrease more or less exponentially from the river mouth toward the basin center. However, the actual sediment thicknesses for a certain time unit, shown below the basin cross-sections, are controlled by processes operating within the basin. a Shallow, lowenergy lake basin. The incorning sediment contains a high proportion of coarse-grained material (e.g.
perialpine lakes); subsidence is neglected. Most of the sediment influx bypasses the subaerial delta and is deposited along the delta slope. b Epicontinental shallow sea of intermediate hydrodynarnie energy. Waves and currents maintain a certain equilibrium profile of the basin floor. Sediment thicknesses are therefore mainly controlled by differential subsidence causing bypassing from the foreshore zone to deeper water. c Shelf-slope-deep sea setting. Sediment rnainly accumulates on the (prograding) slope or on deep-sea fans. Bottom currents mayaiso redistribute sediment in the morphological basin deep

11.5 Clastic Sediment, Distribution
This is also one of the assumptions (diffusion algorithms) used for computer programs simulating sediment accumulation and stratigraphie architecture in basin cross-sections, but this assumption is only true of speciflc cases. As known from many modern examples, the directions of sediment transport in aquatic systems often differ from the straight land-sea relationship. In studies on ancient basin flUs, sole marks and other sedimentary structures can reveal the former current systems (paleocurrent analysis). This method is useful for some depositional environments (e.g. deep-sea fans), but it is problematic in regions of frequently chang-ing current directions (e.g. in shaUow seas). .
A straightforward, more or less exponential decrease in sediment supply can be observed in lakes where little sediment redistribution takes place (Fig. 11.23a). However, the site of most rapid deposition below the delta front migrates toward the far end of the basin with time. Alpine and perialpine lakes, which receive a great proportion of sandy and coarser grained bed load, are mainly filled by prograding delta sediments. These often make up 50 to 90% of the total basin fill.
In shallow, low to medium energy marine basins (epicontinental seas), the basin floor may maintain a certain equilibrium profile generated by the hydrodynamic regime ofthe basin (Fig. 11.23b).
When more sediment is supplied than can be accommodated by subsidence, the surplus sediment is transported into deeper water (sediment bypassing). As a result, the sediment thicknesses deposited during a certain time unit are mainly controlled by differential subsidence. Long-term sedimentation rates in areas elose to the coastline therefore tend to be slow, whereas the depocenter with the highest sedimentation rate may be located far away from the coast.
Shelf-slope-deep sea settings of high energy and differential subsidence (Fig. 11.23c) exhibit a behavior similar to that of shallow-marine basins. The site of most rapid deposition here is the slope or a deepsea fan fed by turbidites. Even deep-sea sediments can be frequently redistributed by bottom currents (cf. Sect. 5.5).
The models in Fig. 11.23b,c demonstrate that sediment distribution in common marine environments does not follow a simple rule. In addition, relative lake or sea-Ievel changes may considerably modify the local or regional situation (cf. Sects. 7.3 and 7.4). These complications are only briefly mentioned here. Some further problems will be addressed below by a number of modern examples dealing with the transfer of river sediments to deltas, prograding coastlines, and deep-sea fans.
11.5.2 Transfer ofRiver Sediments to Marine Deltas
Out- and Upbuilding of Sediment from a Point Source
519
Given a point source (river mouth) with large and constant input of sediment into a deepening basin, the pro gradation of the deltaic sediment wedge slows through time (Fig. 11.24a,b). This results from two factors: (1) increasingly more sediment is required to form fore sets of the same thickness on the inelined basin floor; (2) more sediment is needed with time to build out a three-dimensional sediment body at a constant rate. Falling sea level causes accelerated seaward pro gradation, while rising sea level may result either in coastal retreat or continued, but reduced seaward progradation, depending on the rates of both sea-Ievel rise and sediment supply (Fig. 11.24c and d). Further influences of sea-Ievel changes on deltaic systems are discussed in Sect. 7.4. The main question addressed in the following exampIes is: what proportion of the incoming river load is used up for the prograding of deltas and wider coastlines, and how much sediment is transferred to deeper and more remote parts ofthe basin?
Delta Prograding into Low- to Medium-Energy Marine Basins
The Holocene was aperiod in which marine deltas began to prograde seaward due to the deceleration of sea-Ievel rise after the last glacial lowstand (Stanley and Warne 1994). The following examples are taken from this time period.
Several medium to major rivers enter the Mediterranean Sea and generate prograding, more or less wave-dominated or mixed river- and wave-dominated lobate deltas, such as the deltas of the rivers Nile, Rhöne, Ebro and others (cf. Sect. 3.5). The tidal range of the semi-elosed Mediterranean is very low and wind-generated waves and currents are normally of low to medium energy. Similarly, the prograding of the Danube delta into the Black Sea and that of the Volga delta into the Caspian Sea is moderately affected by waves and currents. Here, some further, well-studied examples are described.
Po delta and Tiber delta, Italy. With the aid ofhistorical marks, the late Holocene development of these deltas and their adjacent coastlines has been established. This allows an estimate of the partition of the river-borne sediment into portions stored either in the delta area or deposited in deeper water.
ThePo River drains part of the Alps and, to a minor degree, the Apennines and builds a delta out into the shaUow northern Adriatic Sea (Fig. 11.25a). Using the weU-dated

520
a
OUTBUILDING
~ oE- ~
SEDIMENT SUPPlY. 55
~
Fig. 11.24. a-d Simple theoretical models of delta outbuilding and upbuilding during constant (a,b) or rising sea level (c,d). Outbuilding from a point source slows due to both increasing water depth and
paleo-coastline of 2500 years B.P. (Bondesan et al. 1996) the river-dominated delta front prograded at a mean rate of about 10 mlyear and the adjacent coastline to the south of the delta at a rate of about 4 mlyear (Fig. 11.25b). Assuming a 15 m deep prograding sediment body, the sediment mass deposited between Chioggia (south of Venice) and Cervia (south of Ravenna) is about 37 x 10 9 t (mean porosity 0.4). This corresponds to -15 x 10 6 t1a. The modem sediment discharge ofthe river Po is 13 X 10 6 t/a (Milliman and Syvitski 1992), but some smaller rivers (Adige, Brenta and Reno) also deliver sediment to the coast (on the order of 10 x 106 t1a). It thus appears that at least half of the river load is used for prograding of the delta and the adjacent coastline.
The Tiber River originates in the Apeninnes, crosses Rome, and enters the deep Tyrrhenean Sea (Fig. 11.25a). After the last glacial sea-Ievel lowstand, the sea transgressed and almost reached its present position about 5000 years BP (Bel10tti et al. 1994). Since that time the delta prograded seawards which is interpreted as a 5th order highstand systems tract (Fig. 11.25e). The last 2500 years of this development are weil documented by dated beach ridges and historical marks (e.g. the location ofthe old harbour of Rome, Ostia Antica; Fig. 11.25c), indicating that the delta front prograded at a mean rate of almost 2 mla. (The actual rate was higher than average during the last 500 years.) A rough estimation of the sediment mass deposited during the highstand systems tract, i.e. undemeath the Tiber delta plain and on the continental shelf, yields a total volume of 20-25 km 3 for the last 5 ka. This amount includes lagoonal deposits behind the migrating delta front.
Chapter 11 Sediment Supply, Subsidence, and Basin Fill
c SLR>SS
-t------- -~~~==7 RAPID RISE IN SEA LEVEL
__ L __ ~~~~~ TOPSET BEDS
FORESET SEDS
BOTTOMSET SEDS
UPSUILDING
SLR<SS
lateral sediment dispersal (b). Outbuilding during rising sea level SLR can be maintained only by high sediment supply SS (d)
The modem suspended and bed load ofthe river Tiber is 15-20 x 106 t1a. Compared with the sediment volume deposited during the past 5 ka (sediment density 1. 7 g/cm 3), it appears that about one half of the incoming sediment has been stored in the delta and prodelta area. The remainder has been conveyed into deeper water. The principal site of deposition is the upper prodelta slope which is subjected to Iimited current action and is not affected by wave reworking (Fig. 11.25c and d). On the lower slope and outer shelf, the sedimentation rates decrease significantly.
The examples of thePo and Tiber deltas indicate that during the Holocene sea-Ievel highstand approximately one half of the incoming river sediment was stored on the delta plains, prodelta slopes, and along the adjacent prograding coastlines. The proportion of river sediment deposited in the coastal areas may be even greater because the measured modem river loads are probably too high.
The RhOne delta, France, and the Ebro delta, Spain, prograded during the late Holocene sea-Ievel highstand (since 6 and 7 ka BP) at rates similar to the Tiber delta (2.5 and 1.5 mla; Gensous et al. 1995; Somoza et al. 1998: also see Sect. 11.5.4).
The rules derived from individual river deltas (point sources ) can also be applied to situations where several rivers in line enter the sea (linear sediment sourees). These enable prograding of wide

11.5 Clastic Sediment, Distribution
b :
.. " ",
, I I I
\
\ OUTER', ,SHELF ' , I
WAVE ~ : APPROACH
~ ~ •
J J I , , ,
I I J
• 0
'" , I
SHELF BREAK
0 0
, J I I
PRODELTA
~ \ \
521
c
5 km ~
RATES OF DEPOSITION d __ '~~~~~' __ ~~'~~~~JO CONT. SLOPE
OUTER SHELF
PRODELTA SLOPE
DELTA FRONT
BEACH RIDGES o N
DELTA FRONT
0.. o <XI o rn ~ Ir N >-
e
PRODELTA SLOPE ...........
0 .8 · 1·
, ,
30 km
Fig. 11.25. Holocene pro gradation oftwo lobate deltas with their adjacent coastlines in Italy. a Location map of river Po, some of his tributaries, and river Tiber. b Development of Po delta during the past 2500 years (time period for mass balance); older and younger coastlines are not shown; the modem Po delta formed during the last 250 to 400 years. (After
10 km 200 m
Bondesan et al. 1995, modified). c Tiber delta, dated historical sites and beach ridges as weIl as (generalized) hydrodynamic regime of the pro delta area. d Site of most rapid deposition on pro delta slope. e Cross-section of Tiber delta demonstrating Holocene transgressive and highstand systems tracts. (After Bellotti et al. 1994, modified)

522 Chapter 11 Sediment Supply, Subsidence, and Basin Fill
b RELATIVE SEA LEVEL 150 100 50 0 -50
0
D.. m 2 Vl a: « 4 w >-0 6 0 0
x 8 BEG IN OF
10 DELTA GROWTH
12 ... ---.:. DEGLACIA TION
10 km
d
-5
-10
-15 mt.:.:.:.:i==== Fi~. 11.26. Progradation of the Fraser river delta, Bntish Columbia, in the Holocene. (After Hart et al. 1995 and 1998, modified). a Location map (overview). b Change of relative sea-level since the last glacial period. eDelta plain and thieknesses of
eoastal zones as weH as the formation of overlapping fan deltas or deep-sea fans as known from a number of modem and aneient examples including basin fiHs adjacent to mountain ranges or magmatic ares (e.g. foreare basins and foreland basins, cf. Sects. 12.5 and 12.6).
prodelta sediments (simplified). d Generalized longitudinal seetion through delta plain and prodelta. e, Uppermost part of delta plain displaying time lines of upbuilding and outbuilding. (Modified after Williams and Roberts 1989)
Deltaie Sediments in High-Energy Marine Basins
High-energy marine environments, including tidal currents, often prevent the prograding of delta fronts and eoastlines in spite of signifieant sediment supply. In these environments, wave- und tide-dominated delta eomplexes form (Seet. 3.5), and the ineoming sediment is widely distributed on the adjaeent
11.5 Clastic Sediment, Distribution
shelves and slopes or carried into deeper water. Nevertheless, some examples of modern deltas demonstrate that even under high-energy conditions a large proportion of the incoming sediment is stored in the coastal and prodelta zones elose to the river mouth.
Fraser River delta, British Columbia. The Holocene Fraser River delta progrades into the more than 300 m deep Strait of Georgia between mainland British Columbia and Vancouver Island (Fig. 11.26a). The delta front is not directly exposed to the large waves of the northeastern Pacific, but affected by strong tidal currents, wind-generated currents, estuarine circulation, and fresh-brackish water plumes during river floods (Hart et al. 1995). The evolution of the delta is influenced by the specific bathymetry of the marine strait and sea-Ievel change strongly modified by post-glacial rebound (Fig. 11.26b).
At the transition from late Pleistocene to Holocene, the relative sea level stood higher than today because the land was depressed by a heavy ice load in the Rocky mountains. Between 10 and 8 ka B.P. the relative sea level had dropped 10-15 m below the present datum as a result of rebound after the melting of ice. Then the sea level started to slowly rise to its present position. During this time period, the Fraser River delta grew westward into the Strait of Georgia at a mean rate of about 2 mla (Fig. 11.26e; Williams and Roberts 1989) and formed a subaerial delta plain of about 1000 km 2• Outbuilding and upbuilding (5 to >10 mmla, behind the delta front 2 to 5 mmla) of delta sediments occurred simultaneously. The Holocene sediments rest on glacial drift deposits with an irregular surface (Fig. 11.26d). Shallow banks in front of the delta are covered by tidal marsh.
Seismic studies enabled the drawing of an isopach map of the Holocene prodelta sediments (Fig. 11.26c,d, Hart et a1. 1998) which reach 100-150 m in thickness over large areas, and locally more than 200 m. Large slope failures (slope angles typically 2-3°), submarine channels, and the dominating northwest directed currents create much spatial variability in the sediment thicknesses.
Based on simplified cross sections of the isopach map, a crude estimate of the sediment masses deposited during the Holocene yielded the following results:
Prodelta slope in front of the tidal marsh: ~55 x 109 tllO ka
Subaerial delta including the tidal marsh: ~45 x 109 tlI0 ka
Total: ~100xl09t110kaorlOxl06t1a.
The modern sediment load of the Fraser River 42 km upstream of its mouth (drainage area 234 000 km2) is 17.3 X 10⁶ tla and therefore ab out 1.7 times higher than that found from the delta sediments. The ratio between sediment deposited on the delta plain and in
523
the prodelta area during the Holocene is about 0.8; the modern data indicate a ratio of about 0.6.
The higher modem sediment discharge may result from both neoglaciation since about 4 ka and human activities. A minor portion of the river load possibly reaches areas beyond the prodelta investigated. The modem river load consists of 35% sand, 50% silt, and 15% day. Ofthese 6.4 x 10⁶ t/a (i.e. 37%) are deposited on the subaerial delta.
Using Cesium-137 fallout stratigraphy (the radioisotope generated by nuclear tests with a peak in 1964) the sedimentation rate in wide areas of the prodelta area was found to have been 1-2 cmla (average for the past 30 years, Hart et a1. 1998). The prodelta sediment mass (4.0 x 10 6 t/a) derived from this data is less than expected from the measured modem river load or from the estimate of Holocene prodelta deposition. It is possible that part of the incoming sediment could not be identified by the Cs method.
In the previous examples from the Mediterranean, i.e. from areas farther away from the regions of former inland ice, the Holocene eustatic rise in sea level was not substantially reduced by rebound of the crust following deglaciation; thus, many former lowstand deltas were flooded and the rivers had to build new deltas adjusted to the present sea level (Fig. 11.23c).
Niger delta, West Africa. This is an example of long-term delta outbuilding. The delta started to form after the separation of Africa and South America during the Cretaceous (Fig. 11.27a). Today, it represents a lobate, mixed fluvial- to wave-dominated delta (Sect. 3.5) including moderate tidal influence.
The general history of the Niger delta and other aspects of its sediments are weil documented by many publications (summary in Shannon and Maylor 1989; also see Cohen and McClay 1996; Roubyand Cobbold 1996). The delta developed in a crustal depression (Benue Trough) and prograded at a very slow mean rate of about 4 mmla over the boundary between the continental and oceanic crust. Its huge sediment body reached a thickness ofup to 12 km.
Using the information summarized in Fig. 11.27, volurne and mass of sediment below the delta plain and in the prodelta urea deposited since the Eocene (40 Ma) were estimated: 380 000 km 3 or 7.5 x 10 14 t. To accumulate this mass an annual average of ~ 19 x 10 6 t/a is needed. The present-<lay sediment dis charge of the Niger River (drainage area 1.2 x 10⁶ km2) is about 40 x 106 t/a (Milliman and Syvitski 1992).
A comparison with the modern river load indicates that ab out one half of the incorning sediment is stored in the delta area. However, it is possible that both the drainage area and the sediment dis charge of the river significantly changed during the long time period considered. In any case, loss of sediment to the deep sea is documented by the existence of the Niger deep-sea fan. Other marine deltas associated with deep-sea fans are discussed in Section 11.5.4.
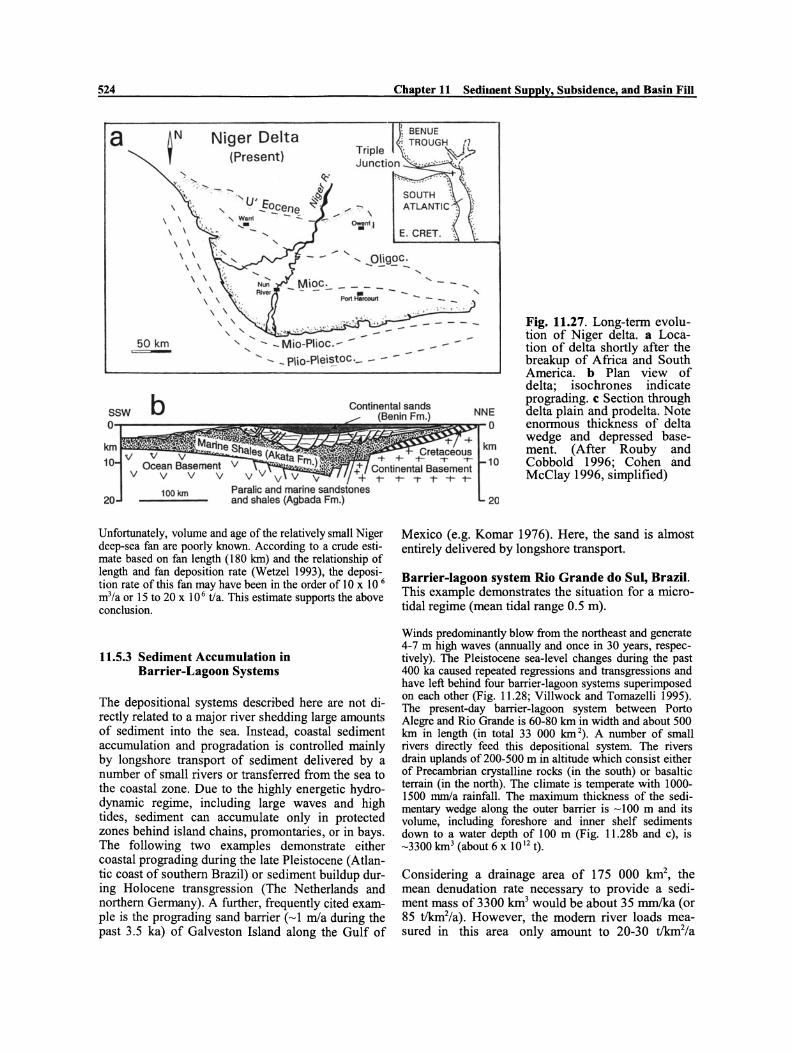
524 Chapter 11 Sediment Supply, Subsidence, and Basin Fill
~ BENUE a r Niger Delta (Present)
;. TROUGIl. (I Tripie -... ~):' Junction ;, ..•.... '. " '- . •
E. CRET.
- - ... "..... Oligoc . ----" - -
" I· · •.
50 km
Continental sands NNE
Fig. 11.27. Long-term evolution of Niger delta. a Location of delta shortly after the breakup of Africa and South America. b Plan view of delta; isochrones indicate prograding. c Section through delta plain and prodelta. Note enormous thickness of delta wedge and depressed basement. (After Rouby and Cobbold 1996; Cohen imd McClay 1996, simplified)
~~=,-o
v
Cretaceous km -t- + -t- -r -.-- 10
Continental Basement r-t-TT--r-t-
100 km Paralic and marine and shales (Agbada Fm.)
Unfortunately, volume and age ofthe relatively small Niger deep-sea fan are poorly known. Aeeording to a erude estimate based on fan length (180 km) and the relationship of length and fan deposition rate (Wetzel 1993), the deposition rate ofthis fan may have been in the order of 10 x 10 6
m3/a or 15 to 20 x 10 6 tla. This estimate supports the above eonclusion.
11.5.3 Sediment Accumulation in Barrier-Lagoon Systems
The depositional systems described here are not directly related to a major river shedding large amounts of sediment into the sea. Instead, coastal sediment accumulation and pro gradation is controlled rnainly by longshore transport of sediment delivered by a number of small rivers or transferred from the sea to the coastal zone. Due to the highly energetic hydrodynamic regime, including large waves and high tides, sediment can accumulate only in protected zones behind island chains, promontaries, or in bays. The following two examples demonstrate either coastal prograding during the late Pleistocene (Atlantic coast of southem Brazil) or sediment buildup during Holocene transgression (The Netherlands and northem Germany). A further, frequently cited exampIe is the prograding sand barrier (~1 mla during the past 3.5 ka) of Galveston Island along the Gulf of
20
Mexico (e.g. Komar 1976). Here, the sand is almost entirely delivered by longshore transport.
Barrier-Iagoon system Rio Grande do Sul, Brazil. This example demonstrates the situation for a microtidal regime (mean tidal range 0.5 m).
Winds predominantly blow trom the northeast and generate 4-7 m high waves (annually and onee in 30 years, respeetively). The Pleistoeene sea-level ehanges during the past 400 ka eaused repeated regressions and transgressions and have left behind four barrier-lagoon systems superimposed on eaeh other (Fig. 11.28; Villwoek and Tomazelli 1995). The present-day barrier-lagoon system between Porto Alegre and Rio Grande is 60-80 km in width and about 500 km in length (in total 33 000 km 2). A number of small rivers direetly feed this depositional system. The rivers drain uplands of 200-500 m in altitude whieh eonsist either of Preeambrian erystalline rocks (in the south) or basaltie terrain (in the north). The climate is temperate with 1000-1500 mmla rainfall. The maximum thiekness of the sedimentary wedge along the outer barrier is ~ 100 m and its volume, including foreshore and inner shelf sediments down to a water depth of 100 m (Fig. 11.28b and e), is -3300 km3 (about 6 x 10 12 t).
Considering a drainage area of 175 000 km2, the mean denudation rate necessary to provide a sediment rnass of3300 km3 would be about 35 mm/ka (or 85 t!km2/a). However, the modem river loads measured in this area only amount to 20-30 tlkm2/a

11.5 Clastie Sediment, Distribution
v V
I I
I I
I
I I
I I
I
I I \
/
100 km
b
I I
I
525
~ .. .. ......... -- -------
·-·100m :·: . C ... :-.: .. <:: ...... .
COASTAL PLAIN (MARSH) \
LAGOONAL DEP.
d OLDER BEACH RIDGE
RAVINEMENT
(Instituto de Pesquisas Hidraulicas 1992). Whether increased denudation during the Pleistocene has provided the surplus sediment volume from the hinterland is uncertain. It is more likely that the major part (around two thirds) of sediment accumulated in the barrier-lagoon system has come by longshore transport from the north. Here, high cliffs in Mesozoic basalts of the Parana basin point to the fact that considerable volumes of rock have been eroded along the coast.
BEACH RIDGES AND EOLIAN DUNES
Fig. 11.28. Barrier-lagoon complex at the coast of Rio Grande do Sul, Brazil, prograded during the past 400 ka. a,b Location and simplified map of study area. c Generalized crosssection of barrier-lagoon complex used for mass balance estimation. d Facies model displaying three hypothetical sequence boundaries (ravinement surfaces) overlain by transgressive parasequences. (Modified after Villwock and Tomazelli 1995)
Barrier-Iagoon systems of the North Sea. The example from the Netherlands and northwestem Germany (Fig. 11.29) shows coastal sediment aggradation for a meso- to macrotidal, high-energy wave regime of the southem North Sea (tidal range 1.5 up to 4 m).
Detailed investigations in these regions have allowed a relatively reliable estimate of the sediment mass accumulated in the coastal zone during the late Holocene transgression (DJ. Beets in Streif 1996; Hoselmann and Streif 1997; also see Oost and Boer 1994). About 7500 years
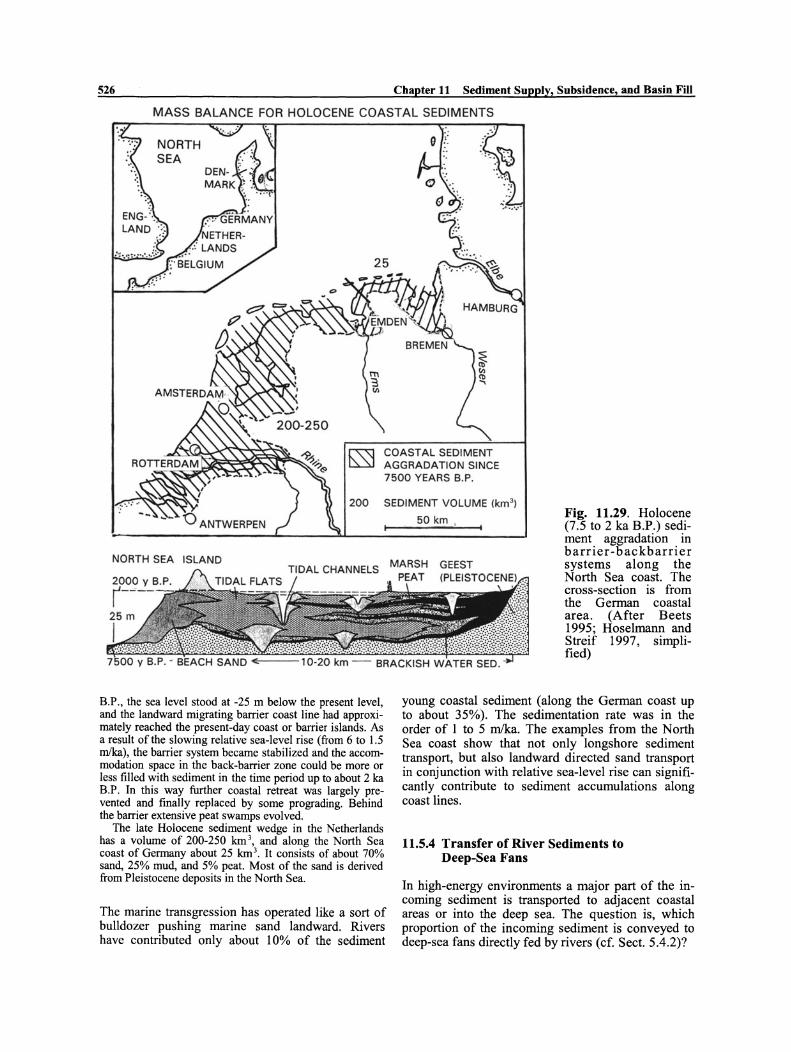
526 Chapter 11 Sediment Supply, Subsidence, and Basin Fill
MASS BALANCE FOR HOLOCENE COASTAL SEDIMENTS
NORTH SEA
25
NORTH SEA ISLANO
B.P., the sea level stood at -25 m below the present level, and the landward migrating barrier coast line had approximately reached the present-day coast or barrier islands. As a result of the slowing relative sea-Ievel rise (from 6 to l.5 mIka), the barrier system became stabilized and the accommodation space in the back-barrier zone could be more or less filled with sediment in the time period up to about 2 ka B.P. In this way further coastal retreat was largely prevented and finally replaced by some prograding. Behind the barrier extensive peat swamps evolved.
The late Holocene sediment wedge in the Netherlands has a volume of 200-250 km 3, and along the N orth Sea coast of Gerrnany about 25 km 3• It consists of about 70% sand, 25% mud, and 5% peat. Most of the sand is derived from Pleistocene deposits in the North Sea.
COASTAL SEDIMENT AGGRADATION SINCE 7500 YEARS B.P.
SEDIMENT VOLUME (kml )
50 km , Fig. 11.29. Holocene (7.5 to 2 ka B.P.) sediment aggradation in barrier-backbarrier systems along the N orth Sea coast. The cross-section is from the German coastal area. (After Beets 1995; Hoselmann and Streif 1997, simplified)
young coastal sediment (along the German coast up to about 35%). The sedimentation rate was in the order of 1 to 5 mlka. The examples from the North Sea coast show that not only longshore sediment transport, but also landward directed sand transport in conjunction with relative sea-level rise can significantly contribute to sediment accumulations along coast lines.
11.5.4 Transfer of River Sediments to Deep-Sea Fans
The marine transgression has operated like a sort of bulldozer pushing marine sand landward. Rivers have contributed only about 10% of the sediment
In high-energy environments a major part of the incorning sediment is transported to adjacent coastal areas or into the deep sea. The question is, which proportion of the incoming sediment is conveyed to deep-sea fans directly fed by rivers (cf. Sect. 5.4.2)?
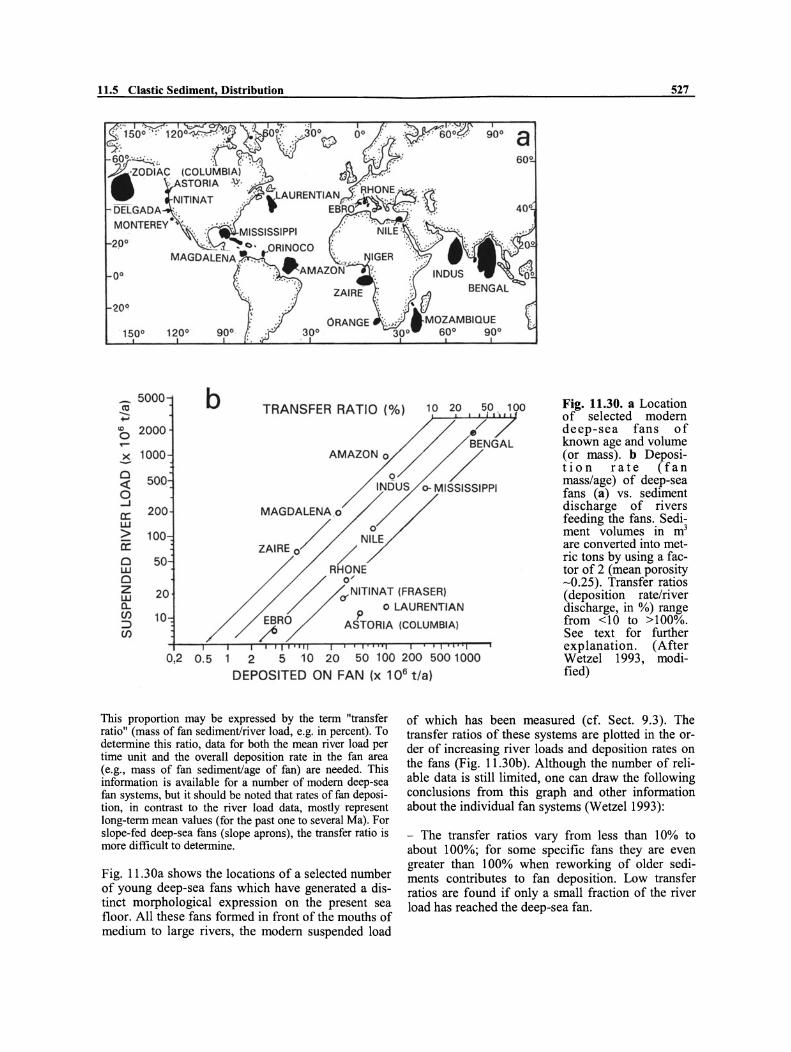
11.5 Clastic Sediment, Distribution 527
90° a 60°
20°
150° 120°
5000 ctI -.....
b TRANSFER RATIO (%) 10 20 50 100 Fig. 11.30. a Location of selected modem deep-sea fans of known age and volume (or mass). b Deposition rate (fan mass/age) of deep-sea fans (a) vs. sediment discharge of rivers feeding the fans. Sediment volumes in m3
are converted into metric tons by using a factor of 2 (mean porosity -0.25). Transfer ratios (deposition rate/river discharge, in %) range from <10 to >100%. See text for further explanation. (After Wetzel 1993, modified)
Ö 2000 / / BENGAL
~ 1000
o « o ..J
500
AMAZONOo
/ / /
INDUS 0- MISSISSIPPI
a:: w > 1i: o w o z w a... (J)
200
100
50
MAGDALENA.o ~ / NILE
ZAIRE o/ / /
RHONE
=> (J)
20
10 / / 0 LAURENTIAN V;~ITINAT {FRASER)
,RO AtTORIA (COLUMBlA)
0,2 0.5 1 2 5 '10 20 50 100 200 5001000
DEPOSITED ON FAN (x 106 t/a)
This proportion may be expressed by the term "transfer ratio" (mass of fan sedimentJriver load, e.g. in percent). To determine this ratio, data for both the mean river load per time unit and the overall deposition rate in the fan area (e.g., rnass of fan sedimentJage of fan) are needed. This information is available for a number of modem deep-sea fan systems, but it should be noted that rates of fan deposition, in contrast to the river load data, mostly represent long-term mean values (for the past one to several Ma). For slope-fed deep-sea fans (slope aprons), the transfer ratio is more difficult to determine.
Fig. 11.30a shows the 10cations of aselected number of young deep-sea fans which have generated a distinct morphological expression on the present sea floor. All these fans formed in front of the mouths of medium to large rivers, the modem suspended load
of which has been measured (cf. Sect. 9.3). The transfer ratios of these systems are plotted in the order of increasing river loads and deposition rates on the fans (Fig. 11.30b). Although the number of reliable data is still limited, one can draw the following conclusions from this graph and other information about the individual fan systems (Wetzell993):
- The transfer ratios vary from less than 10% to about lOO%; for some specific fans they are even greater than lOO% when reworking of older sediments contributes to fan deposition. Low transfer ratios are found if only a small fraction of the river load has reached the deep-sea fan.
528
In zones of stable c!imate, such as the tropics, approximately one fourth of the river load is deposited on the corresponding deep-sea fan. F or time periods of > 1 Ma, the Pleistocene sea-Ievel changes have not significantly affected the transfer ratios. Reduced sediment supply to the fans during sea-Ievel rise and highstands has been more or less compensated for by increased supply during sea-Ievel fall. An intermittent surplus of fan sediment in comparison to the average river load can be caused, for example, by reworking of older glacial deposits (as known of the Laurentian fan and Astoria fan).
A prominent example of low sediment transfer is the Amazon fan receiving !ittle terrigenous material from the Amazon river during the ptesent-day sea-Ievel highstand. About one third of the fluvial mud is deposited in the lowermost reaches ofthe river before entering the sea (Vital et al. 1998), and most of the mud arriving in the ocean is driven northward by currents (Nittrouer et al. 1986). The fact that the long-term (16.5 Ma) transfer ratio of this system is also very low indicates substantial lateral sediment transport on the shelf even during lowered sea-Ievel stands.
A very low present-day transfer ratio (2%) is also known of the Ebro (Valencia) fan in the Mediterranean. However, during the past 4.8 Ma about 22% of the incoming Ebro sediment reached the deep-sea fan while 45% remained on the shelf and 33% on the slope (Nelson 1990).
A transfer ratio> 1 00% seems to have been realized for the Nitinat fan, representing amiddie to late Pleistocene (0.6 to 0.8 Ma B.P.) sediment body of the Fraser River. This fan was deposited in the open deep northwestem Pacific (in contrast to the modern Fraser delta prograding into the Strait ofGeorgia discussed above). Its mean deposition rate (11 to 15 x 10 6 mJ/a or about 20 to 28 X 10 6 tla, porosity -0.3) was somewhat greater than that determined for the Holocene Fraser delta. This finding appears to be reasonable because during glacial periods sediment supply was probably higher than in the late Holocene.
- Fluvial-dominated and lobate deltas store a higher proportion of the incoming sediment by prograding than wave- and tide-dominated deltas. Especially deltas with deeply incised canyons in front of their river mouths seem to convey a high amount of the river load to the deep sea. This is true, for example, of the Rhöne fan in the western Mediterranean and, to some extent, also of the huge Bengal fan in the Indian ocean.
Bengal fan. About 50% of the rock material eroded in the Himalayas during the past 20 Ma has been deposited on the Bengal fan (Figs. 11.30b and 11.31). Even with the present-day sea-Ievel highstand, a large proportion of the incoming sediment is funneled to the deep sea via a deep canyon cut into the shelf and fan head (Kuehl et al. 1989; Hübscher et al. 1997; Weber et al. 1997, Kudrass et al. 1998). Storm-induced and tidal currents transport sediment from the inner shelf into the head of the canyon. The upper subaerial Bengal delta in northeastem Bangladesh seems to have subsided at an average rate of 1.2 mika during the last few millions ofyears (Worm et al. 1998).
Mississippi fan. If the deposition rate of this fan is related to the modern suspended river load reduced by dam sites upstream, then the transfer ratio would be about 60%. Considering a sediment balance of the major part of the
Chapter 11 Sediment Supply, Subsidence, and Basin Fill
Gulf of Mexico for the past 2.3 Ma (Hay et al. 1989; Wetzel 1993), however, the average transfer ratio is only 35%.
Columbia and Zaire fans. The Columbia fan (off the US Atlantic coast) and Zaire fan (off central West Africa) presently receive 11 and 15% of their river loads, respectively.
- The sediment transfer ratio to deep-sea fans seems to be independent ofthe size ofthe fan (Fig. 11.30b). On the other hand, relatively small fans close to coastal mountain ranges, tend to have high er proportions of sand and gravel than the large, mud-dominated deep-sea fans (e.g. Reading and Richards 1994; Reynolds 1994). One can expect that the transfer ratios of coarser grained fans are higher than those of mud-dominated fans, hut quantitative data are not yet available. The sum of all deposition rates known from modem deep-sea fans (Wetze1 1993) is about 650 x 106 m3/a or -1.2 x 10⁹ tla. Assuming that these examples cover about one half of all fans existing in the present-day oceans, one finds that approximate1y 15-20% of the global river load reaching the oceans (Sect. 9.3.2) is transferred to deep-sea fans. This is a surprisingly low proportion, but it supports the conclusions on sediment storage in delta areas and prograding coastlines. In addition, a significant part of the river-borne sediment must come to rest outside of delta complexes and river-fed deep-sea fans, i.e. on shelves, slopes, slope-aprons, and basin plains beyond the range of deep-sea fans (cf. Sects. 11.5.5 and 11.5.7).
11.5.5 Mud Deposition on Continental Shelves
Significant proportions of the river-borne terrigenous sand and mud are not deposited in the corresponding delta and prodelta areas or directly transferred to deep-sea fans as discussed above. Sand can be transported alongshore over long distances away from the mouths of rivers and either be stored in the coastal zone, or become trapped in the heads of distant submarine valleys funneling sediment into the deep sea. Mud commonly accumulates at some distance seaward from the coastline on the middle and outer shelf, depending on the hydrodynamic regime of the area and river mud supply (cf. Sect. 3.3). Shelves in front of mud-rich rivers, such as the Amazon River, can become mud-dominated and store large proportions of the incoming fine-grained sediment as mentioned above. High-energy environments, for exampIe the Pacific coast of North America, allow mud deposition only at water depths greater than about 50 m.
Such an example has been reported from the Ca!ifomian coast elose to the delta of the Eel River (Sumrnerfield and

11.5 Clastic Sediment, Distribution
Nittrouer 1999). High wave- and current action do not allow the outbuilding of a delta lobe, and a large proportion of the modem terrigenous influx is collected by the Eel Canyon. However, episodic floods carry mud to the adjacent shelf where it accumulates seaward of the 50 m isobath at mean rates ofO.5 glcm2/a (~ 4 mmla; according to Pb-21O and Cs-137 dating). Toward the shelfbreak, the accumulation rates decrease. About 20% ofthe total fluvial mud supply are deposited on the shelf.
11.5.6 Sediment Distribution in a Basin Chain
Several lake basins (Sect. 2.5) and basins of larger dimensions may be connected and form a basin chain displaying distinct trends in their sedimentary fills. A well studied example in Central Europe is the young (Neogene) basin chain including the Vienna basin, the Transcarpathian basins, the Pannonian basin, and the Black Sea (cf. Sect. 12.7.3). These basins received terrigenous material mainly from the north (e.g. from the precursor of the Danube River) and were successively filled up with sediment. At present, only the Black Sea is left as a water-filled basin at the end of the chain.
Himalayas-Bengal fan. The largest young example of a basin chain ranges from the Sub-Himalayan foredeep (foreland basin) via the Bengal basin of Bangladesh (remnant basin, foredeep) to the huge Bengal fan in the Indian ocean. The successive filling of these basins during the past 20 Ma can be approximately reconstructed by applying the DA-approach introduced in Section 11.2 (Fig. 11.31; Einseie et al. 1996). A sediment mass balance for the past 20 Ma, supported by the independently determined mass of erosion in the Himalayas (Fig. 11.31 b), reveals that about 17% of the total mass (about 19.5 x 10¹⁵ t) remained in the Sub-Himalayan foredeep, 28% in the Bengal basin (including its prograding delta area), and 55% accumulated on the Bengal deep-sea fan (Fig. 11.31 c-e).
In pre-Miocene times, the Sub-Himalayan foredeep represented a marine foreland basin which received limited amounts of river-borne sediment from northern, distal parts of the evolving mountain complex. In the early Miocene, thick overthrust sheets (the present-day High Himalayan chain) moved southward on top ofthe Main Central Thrust and gained in altitude (Fig. 11.31 b). As a result of increased sediment supply, the foredeep was transformed into a fluvial basin (Siwalik Group) and has remained so up to the present. The precursors of the Ganges and Brahmaputra rivers then transported their surplus sediment to the Bengal basin which was successively filled by prograding delta and prodelta deposits. Westward overthrusting of the Indoburman Ranges narrowed the Bengal basin and promoted delta prograding toward the Bay of Bengal. Sediment (mostly mud) not deposited in the delta area and on the prodelta slope was transferred to the Bengal deep-sea fan by gravity flows and turbidity currents over a distance ofup to almost 3000 km.
529
With the aid of the sediment masses and grain size fractions present in the individual basins, the average grain size distribution of the Himalayan river loads can be roughly determined (Fig. 11.3lf; Einseie 1996). This estimate shows that the Himalayan rivers carried about 30% sand and 70% silt and clay. Approximately 20% ofthe total sand supply and 80% of the mud supply reached the Bengal fan.
11.5.7 Long-Term Sediment Distribution Along Passive Continental Margins
Terrigenous sediment escaping from deposition on delta fronts, prodelta slopes, and deep-sea fans is often widely distributed on adjacent shelves, continental slopes, and in the deep sea. The processes involved in this sediment dispersal are briefly described in Sections 5.2 and 5.3.1. Their importance is here underlined by two examples from areas where at least a semi-quantitative approach is possible due to extensive seismic studies and deep-sea drilling.
Gulf of Mexico: Coastal Progradation and Marine Sediment Accumulation
The frequently described drainage system of the Mississippi River delivering its sediment load into the Gulf of Mexico (Fig. 11.32a-c) is a classic example of the interplay between processes in the source area and deposition along a passive continental margin (summarized, e.g., by Matthews 1974; mass balance see Ray et al. 1989).
In the Jurassic and Lower Cretaceous, terrigenous sediment supply to the basin was limited. This allowed the growth and prograding of an extensive carbonate platform. With the onset ofuplift ofthe Rocky Mountains and the Appalachians in the upper Cretaceous, terrigenous sediment input into the gulf increased significantly. The river-derived material was distributed over a wide shelf and slope region and formed a huge clastic wedge. This wedge migrated about 200 km seaward since the upper Cretaceous (average rate ~0.25 crnla). Uniform outbuilding was, however, modified by sea level fluctuations and regional differential subsidence in response to the increasing sediment load and diapirism of Jurassic salt. Cenozoic clastic sediments reach a thickness of up to 15 km. Mass bai an ces indicate that extensive areas of the Rocky Mountains and High Plains have been uplifted as much as I to 3 km since the late Pliocene. On the western Florida shelf, which is an area outside of the influence of the Mississippi river, carbonate sedimentation continues to prevail up to the Present.
Using the present-day chemical and mechanical denudation rates of the Mississippi River for the other drainage areas of the Gulf of Mexico, one can estimate the average sedimentation rate in the gulf. The gulf covers an area of about 1.5 x 10⁶ km2, the drainage area of the rivers approximately 4.5 x 10⁶ km2;
hence the Ad/ Ab ratio is about 3. The drainage of the
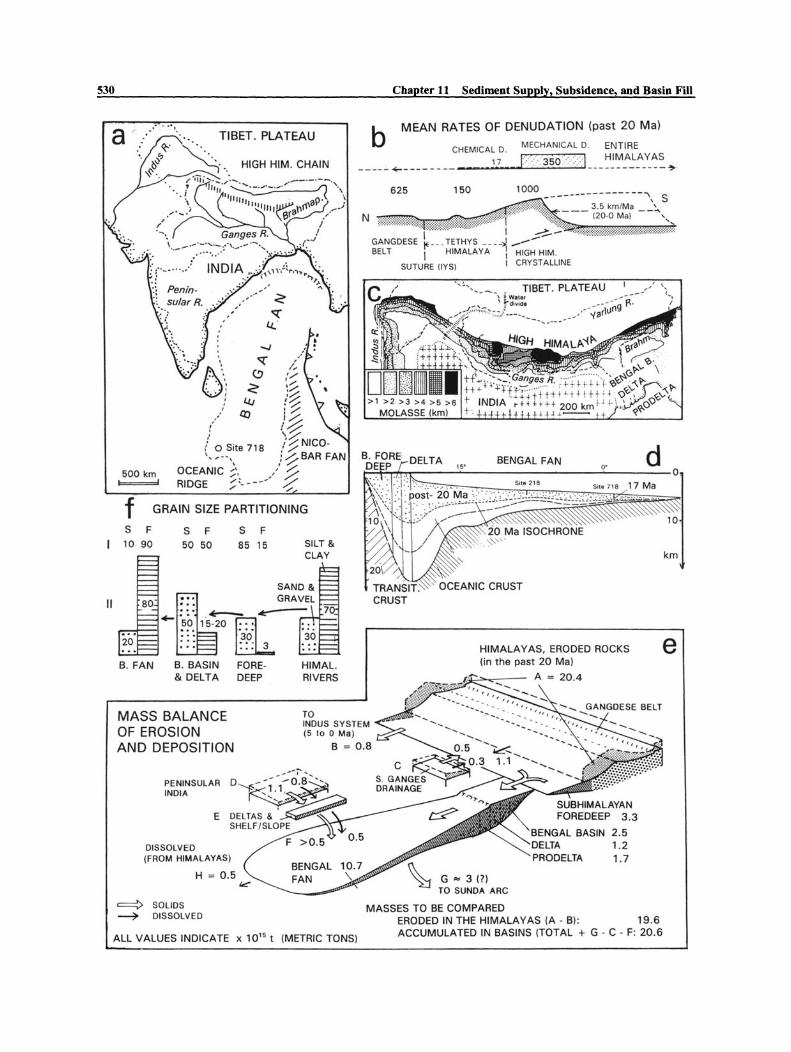
530 Chapter 11 Sediment Supply, Subsidence, and Basin Fill
a b MEAN RATES OF DENUDATION (past 20 Ma)
MECHANICAL O. ENTIRE
11
CHEMICAl D.
----- ...... ----- --- ',7 J ..... 350 ':·-:'·:>1 ___ ~~~~:~_~~:. .,.
TIBET. PLATEAU " --- --- ' j{.--
___ ,.- -,/31w09
-..J
'';/ f\\ i "~ u , <;. ~% .: :; (~ I~
: !~ I );:::-NICO-( 0 Site 718 : ;/
500 km i======d
"--\ .: ~ BAR FAN
OCEANIC :-'.. ,-'.%' RIDGE ~ '----- ;::
's' BENGAl FAN d ~~~~----~~----------------~~~----~--o
f GRAIN SIZE PARTITIONING
S F 10 90
S F
50 50
S F
85 15 SILT & CLAY
SAND &
~.:: GRAVEL
.. ::' ~ c-:?, 1'5-20 [Bh':: ::. ", 30 : : : : :: 3
L..---L-...--4
B. FAN B. BASIN FORE- HIMAl. & DELTA DEEP RIVERS
MASS BALANCE OF EROSION AND DEPOSITION
PENINSUlAR INOIA
E
OISSOlVED (FROM HIMAlAYAS)
TO INOUS SYSTEM (5 10 0 Ma )
B = O.B
HIMALA YAS, ERODED ROCKS (in the past 20 Mal
A = 20.4
SUBHIMALAYAN FOAEDEEP 3.3
2.5 1.2
'.7
==:> SOLIDS MASSES TO BE COMPARED ~ OISSOLVEO
ALL VALUES INDICATE x 10'5 t (METRIC TONS)
ERODED IN THE HIMALAYAS (A - BI: 19.6 ACCUMULATED IN BASINS (TOTAL + G - C - F: 20.6
km
e
11.5 Clastic Sediment, Distribution
Mississippi River alone is 3.27 x 10⁶ km2• With a mechanical denudation rate of 48 mlMa (cf. Fig. 9.16), the average siliciclastic sedimentation rate (solid, pore-free sediment) in the gulfshould be -145 mlMa. This rate does not represent the actual situation in the basin because the sediment is not distributed evenly. The average sedimentation rate of biogenic calcium carbonate (15 mlMa) calculated from the present-day river load is about equal to rates found for pelagic carbonates in other ocean basins above the CCD (Sect. 10.2).
In fact, the basin was fi1led irregularly by several point sources of variable efficiency. Most of the incoming sediment accumulated on the prograding continental slope. In its late history (some Ma B.P.), about 35% ofthe sediment load of the Mississippi River was stored in the Mississippi deep-sea fan (Sect. 11.5.4). Here, the sedimentation rate can reach values up to 1000 mJMa (cf. Sect. 5.4.2).
The chemical denudation rate in the drainage area is 15 mlMa, but only part of the dissolved river load is deposited in the basin. About 15% of this load is Ca 2+ (cf. Fig. 9.8, Mississippi and Rio Grande rivers), corresponding to a Ca denudation rate of around 2 mJMa. After conversion into CaC03 (factor 2.5) and using AjAb=3, one obtains a (biogenie ) calcium carbonate sedimentation rate of approximately 15 mJMa. Calcium carbonate deposition in the gulf, however, is diluted too much by silic1astic material to generate carbonate-rich sediments, apart from some shelf regions (western Florida, Yucatan). Finally, it should be mentioned that part of the dissolved river load is exchanged with sea water flowing into and out ofthe gulf.
Northwestern Atlantic: Shelf-Slope-Deep Sea Deposition
The Atlantic is a mature ocean basin which has grown mainly since the middle Jurassic (cf. Sect. 12.2). Huge amounts of sediments have accumulated along its margins including the continental slope and rise. Architecture and stratigraphy of these sediments are relatively well known due to seismic work and deep-sea drilling. The US Atlantic margin is a thoroughly studied part of this margin and therefore used as an example of wide and uneven sediment distribution. Isopach maps and sediment mass balances for both the source and depositional area have led to results which also characterize other sections of mature continental margins (Fig. Il.32d and e).
Oll!(
Fig. 11.31. Mass balance of denudation and sediment accumulation in the Himalaya-Bengal fan system for the past 20 Ma. a Catchment areas of rivers draining the Himalayas and part of peninsular India; extent of Bengal deep-sea fan. b Mean denudation rates in the Himalayas during the past 20 Ma. c Isopach map of molasse sediments in the Himalayan foredeep and location of Bengal basin (foredeep), present-day delta and prodelta. d Longitudinal section of Bengal fan. e Mass balances of denudation (solids and
531
The depositional area comprises the Baltimore canyon trough and Hatteras basin, and the drainage area a major part of the Appalachians (Grow et al. 1988; Poag and Sevon 1989; Pazzaglia and Brandon 1996; cf. Sect. 9.5 and Table 9.1).
The majority of terrigenous sediment, entering the basin via point sources, bypassed the coastal plain and inner shelf and accumulated on the outer shelf, continental slope and rise (cf. model basin Fig. 11.23c). The sediment thicknesses are largely controlled by the rates of (differential) subsidence and the tendency of the basin to maintain a certain shelfstope morphology. As a result of slowing subsidence of the shelf (on transitional crnst), the depocenter migrated from the outer shelf (Jurassic) to the upper rise (Cretaceous) and ultimately to the deeper rise (Neogene). The overall mean rate ofterrigenous sedimentation was in the order of 60 mlMa for the past 175 Ma, but the rates varied enormously from location to location as well as with time.
11.5.8 Global Marine Sediment Distribution
The results of regional studies are also supported by estimates about the global distribution of post-rift sediments (deposited after the breakup of Pangea, -120 Ma ago). Ofthe total sediment mass existing in the present-day oceans, about 70% accumulated on the continental slopes and continental rises, 17% on the shelves, and the remainder in the deep sea (Emery and Uchupi 1984). Other workers have stressed the great differences in the accumulation rates of terrigenous sediments in various parts of the oceans (e.g. Lisitzin 1991). In the large ocean basins some distance off the coasts, these rates are very low (1-10 mlMa). In limited areas close to the coasts, the rates reach values of 100-1000 mlMa. Extremely high rates of ;:: 1000 mlMa occur at the upper portions of large deep-sea fans where sediment thicknesses of 10-15 km have been recorded.
dissolved matter) in the Himalayas and part of peninsular India as well as sediment accumulation in the basin chain from the Himalayan foredeep to the Bengal fan. f Grain size partitioning of Himalayan riverine sediment supply along basin chain: I proportions of sand (S, sand and gravel) and fines (F, silt and clay) present in individual basins; 11 percentage of total river load (S= 1 00% and F= 100%) left behind along basin chain. (After Einseie et al. 1996, simplified)
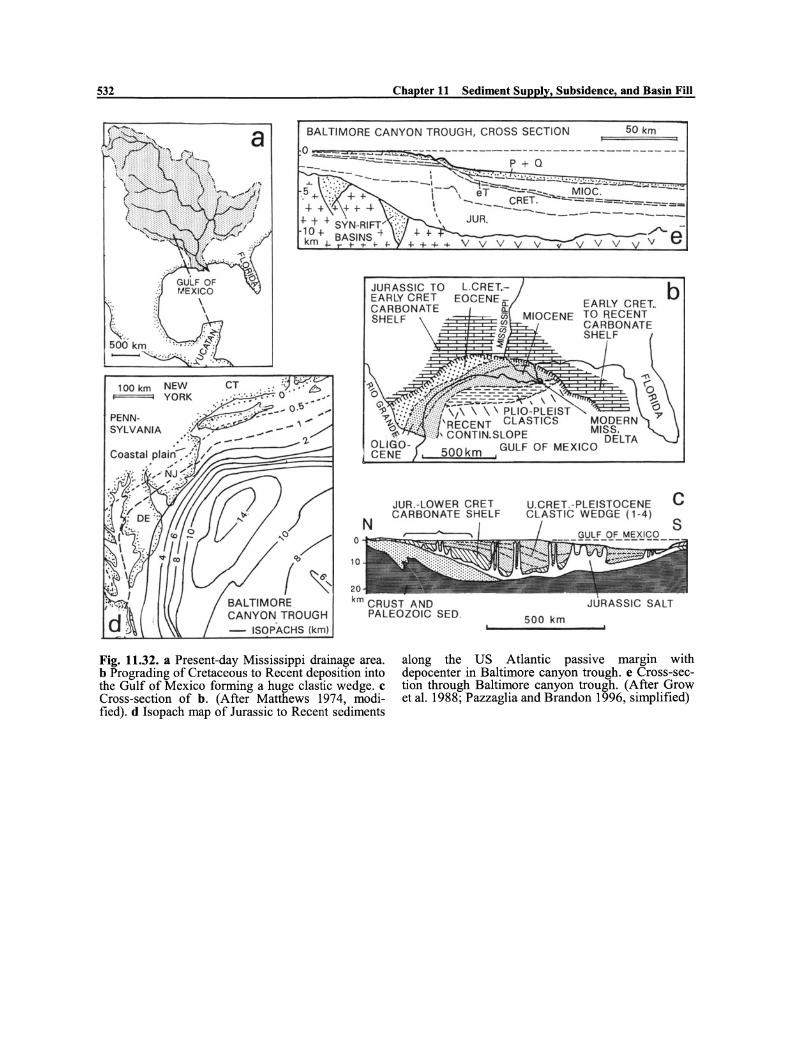
532 Chapter 11 Sediment Supply, Subsidence, and Basin Fill
BAl TIMORE CANYON TROUGH, CROSS SECTION 50 km
o ------------------------- --- --- ---- ----=-==-~~;;;::;.::..~ P + Q
~~~~~~
+- + -I- SYN-RIFr .. ·:··~.:~,: 10 + BASINS t ';' km.j.. !- ... ~ ..
- ISOPACHS (km)
JUR.-lOWER CRET CARBONATE SHElF
'0
20
km GRUST AND PAlEOZOIG SED.
U.CRET,-PlEISTOGENE GLASTIG WEDGE (1-4)
500 km
c
Fig. 11.32. a Present-day Mississippi drainage area. b Prograding of Cretaceous to Recent deposition into the Gulf of Mexico forrning a huge clastic wedge. c Cross-section of b. (After Matthews 1974, modified). d Isopach map of Jurassie to Recent sediments
along the US Atlantic passive margin with depocenter in Baltimore canyon trough. e Cross-section thrOUgh Baltimore canyon trough. (After Grow et al. 1988; Pazzaglia and Brandon 1996, simplified)

11.6 Consequenees for Stratigraphie Sequenees
11.5.9 Summary (Sediment Distribution)
- The assumption of an exponential decrease in the sedimentation rate from a point source toward the morphological center of a water-filled basin is only valid for some specific cases.
- In medium- to high-energy shallow-marine basins, sediment bypassing is common; even in deep basins great proportions of sediment may be redistributed by bottom currents. As a result, sediment thicknesses are largely controlled by the hydrodynamic regime of the basin and differential subsidence.
- Holocene (sea-Ievel highstand) up- and outbuilding of delta plains and prodelta slopes into low- to medium-energy marine environments has often occurred at rates of several m/a, including prograding of adjacent coastlines. This process has consumed at least one half of the incoming river sediment. The same applies to some lobate marine deltas subjected to high er energy conditions. The same degree of sediment partition mayaiso be valid for longer time periods. The (upper) prodelta slope is the site of most rapid deposition.
11.6 Consequenees for Stratigraphie Sequenees and Facies Associations (Overview)
11.6.1 Vertical Facies Evolution: Three Principal Types
Summarizing the results of the interplay between denudation and depositional areas, sedimentation, and subsidence, three principal alternatives for the vertical facies evolution in sedimentary basins can be distinguished:
(1) Vertical sediment buildup ~ subsidence (oversupplied basins): shallowing basin, transition from marine or lake deposits into fluvial or eolian sediments. Decrease in the proportion of biogenic sediment components. In the case of carbonates: increase in benthic and reef-derived carbonate.
(2) Sediment buildup ::; subsidence (sedimentstarved conditions): deepening basin, transition from continental or shallow-marine into deep-marine environment. Increase in the proportion of biogenic sediment components, except for water depths below the lysocline (dissolution of carbonate and opaline silica).
(3) Sediment supply and vertical buildup approximately compensates for subsidence ("balanced" basins): long-persisting identical morphological basin
533
- The prograding of barrier-Iagoon systems along high-energy co asts seems to be largely fed by longshore sediment transport or material derived from the shallow sea. This is shown for Holocene and late Pleistocene examples.
- The transfer of river sediment to deep-sea fans varies widely (transfer ratios from <10 to 100%). Fluvial-dominated and lobate deltas tend to convey a lower proportion of the incoming sediment to the deep sea than tidedominated deltas. The latter also transfer sediment to fans during sea-Ievel highstands. The long-term sediment transfer is essentially controlled by terrigenous sediment supply and is little affected by sea-Ievel changes.
- Apart from deltas, prodeltas, and deep-sea fans (which may migrate), a large proportion of the river-borne sediment is widely dispersed on shelves and in deeper basins. Along passive continental margins, terrigenous sediments are preferentially deposited on the outer shelf, continental slope and upper continental rise.
configuration, maintenance of deep-marine, shallowmarine, or continental facies. No long-term drastic change in the proportions of terrigenous and biogenic sediment components.
Basins Over-Supplied with Sediment
Over-supplied basins are short-lived, but well represented in the geologic record. Their facies types are dominated by clastic sediments and show a shallowing-upward trend. This category of basins comprises deep-sea to continental basin settings and environments, including
- Graben structures and rift basins with fluvial deposits (examples of Sect. 12.1). - Lakes fed by rivers from high-relief regions (Sects. 2.2.2 and 2.5.1) and proglacial lake deposits (Sect. 2.1.1 and Sect. 11.2). - Marine deltas and deep-sea fans (Sects. 3.5, 5.4.2, and 11.5). - Rernnant basins with turbidites (Sect. 12.6.1). - Foreland basins with flysch and molasse deposition (Sect. 12.6.2). - Forearc and backarc basins with high supply of volcaniclastics and other clastic material (Sects. 12 5.3 and 12.5.4).

534
- Pull-apart basins in areas of high relief (Sect. 12.8.2). - Some adjacent seas with high terrigenous sediment input (e.g. the northem Gulf of Califomia (Sects. 4.3 and 11.3).
Sediment-Starved Basins
Sediment-starved basins evolve far away from effieient, mostly high-relief terrigenous sediment sourees. Their upward-fining and thinning vertical facies successions indicate deepening basins, and their slowly deposited sediments tend to become increasingly rich in bio genie material, and sometimes also in organic matter. Typical examples include - Central parts of large oceanic basins and smaller basins in the vicinity of mid-oceanic ridges (Sects. 5.3.2 and 5.3.3). - Isolated submarine highs and platforms (Sect. 5.3.7). - Epicontinental seas surrounded by lowlands. - Arid adjacent seas with drainage areas of low sedi-ment yield (e.g. the present-day Red Sea (Sect. 4.3). - Closed lakes receiving little terrigenous sediment (e.g. the Dead Sea, Sect. 11.3).
Basins with Balanced Sediment Supply
These basins tend to maintain their depositional environment for considerable time periods. Long-term shallowing- or fining-upward trends are absent. Characteristic examples are
- Siliciclastic shelf seas of moderate subsidence, a surplus in terrigenoUs sediment influx is often removed by sediment bypassing into deeper water. - Carbonate shelves and carbonate platforms tend to adjust their vertical buildup to relative sea level, with and without various types of reefs (Sect. 3.4). Excess bio genie carbonate production is transferred by currents to deeper water. - Some shelf areas affected by upwelling water masses and high organic productivity (e.g. the modem shelves off Peru and South Africa, Sect. 5.3.4) maintain these conditions for long time periods. - Epicontinental seas with moderate influx of terrigenous sediment and slow subsidence. - Some foreare and backare basins with limited sediment supply. - Subsiding lake basins with limited sediment supply.
Chapter 11 Sediment Supply, Subsidence, and Basin Fill
Modifying Factors
The three principal trends mentioned above may become modified in many ways by changes in oceanographie and climatic conditions, and by variations in organic productivity due to the faunal and floral evolution through time. In addition, sea-level fluctuations and synsedimentary tectonism (such as extension, convergence, strike-slip etc.) play an important part. The great variety of sedimentary facies through time is mainly a result of these modifying factors which obscure the simple basic principles.
Why Are Shallow-Marine Deposits So Common?
It is surprising that shallow-marine deposits constitute a great proportion of the total sediment volume in present-day environments as weIl as in the fossil record. One would expect that the principle condition (3), i.e., a balance between sediment supply and subsidence, is rarely realized for a time period of some geological significance. Hence, long-persisting shallow-water conditions should be an exception. However, the present-day, high-energy shelf environments demonstrate that the hydrodynamic conditions of the sea prevent aggradation of sediment up to sea level (Fig. 11.23b and c). Instead, the incoming terrigenous sediment is widely distributed over the entire shelf area and some is bypassed into deeper water (cf. Sect. 3.3). Significant outbuilding of the coastline is normally restricted to zones of very high sediment influx.
Thus, long persistence of shallow-marine conditions in the sedimentary record testifies to the fact that the former basin was probably oversupplied with sediment most of the time, but has lost part of its sediment influx to deeper, more poorly supplied regions. Similarly, fluvial basins are commonly filled up to the level of their stream gradient. Any excess in river supply is carried farther downstream; thus a balance between sediment aggradation and basin subsidence is established· for a significant time period. Such a process provides thick fluvial records. The examples in Chapter 12 further illustrate the principles briefly discussed here.
In contrast to shallow-marine sediments, deep-sea sediments are under-represented in the fossil record, because they were largely subducted at convergent plate boundaries and transformed intometamorphic rocks.
11.6 Consequences for Stratigraphie Sequences 535
11.6.2 Vertical and Lateral Facies Associations Moderate clastic input (Overview)
Low clastic input
Facies and Facies Change (General Aspects)
As described in Part 11 of this book, sediments deposited in special environments have distinct characteristics, i.e., texture, sedimentary structures, mineralogical and chemical composition, preserved remains of their original fauna and flora, trace fossils, etc. All these characteristics are summarized under the term (sediment) ''facies ", which is discussed in more detail in many textbooks (e.g. Dunbar and Rodgers 1957; Krumbein and Sloss 1963; Blatt et al. 1980, and others). The facies of a sediment may indicate its particular depositional environment that· distinguishes it from other facies in the same or another basin. Changing sedimentary environments cause facies changes both in vertical and lateral directions. One of the basic mIes in sedimentary geology is that a special facies type can "migrate" obliquely through space and time, whereas the facies types change both in horizontal and vertical directions (Walter's Law, see, e.g., Teichert 1958; textbooks mentioned above). This means that a specific environment, producing a certain sediment facies, is established at different locations and times during the basin evolution.
Individual facies types are combined in characteristic vertical facies successions or, more generally, in vertical and lateral facies associations. The principal morphological evolution of ancient sedimentary basins can be reconstructed mainly with the aid of such fades associations and their architectural elements (cf. Sect. 1.4.3). Large-scale phenomena and trends are mostly superimposed by smaller scale features caused by relative sea-Ieve1 changes or base level cyc1es (stacking patterns, minor sequences, parasequences, systems or facies tracts, and rhythmic bedding; Chap. 7). The identification and interpretation of facies associations of a basin fill are one of the most important aims in sedimentary geology. For this reason, the major groups of large-scale facies associations are briefly mentioned here; smallerscale trends in the facies evolution of specific depositional systems are described in Part IL
Vertical Facies Successions
The first two columns of facies associations demonstrate deepening environments evolving from fluvial (bottom) to deep-sea conditions:
Abyssal plain
Deep-sea fan
Shallow marine c1astics
Delta and lake sediments
Braidplain
Alluvial fan
Deep-sea pelagic sediments
Deeper marine hemipel. sediments
Shallow marine (below wave base)
Coastal-marine (above wave base)
Delta, lagoon, tidal flats
Alluvial plain
The examples of shallowing environments display either silicic1astic or carbonate-dominated systems and begin with deep-sea conditions (bottom of column):
Siliciclastic sediments
Fluvial plain
Delta plain, lake, marsh
Coastal, tidallagoonal
River mouth bar sands
Prodelta, c1astic shelf
Deep-sea fan Basin plain
Carbonate sediments
Alluvial plain (red beds)
Coastal sabkha
Carbonate lagoon, evaporites
Reef and reef detritus
Deeper carbonate platform
Carbonate slope Slope apron
carbonates Deep-sea carbonate
Frequently, only part of these successions is realized in a particular basin (cf. Part 11, e.g. Figs. 2.13 and 2.14, 2.28b, 3.15, 3.28a,b, 3.34 and 3.35, 4.6, 6.5e and 6.9).
Minor vertical facies associations inc1ude:
- Pelagic to hemipelagic shales, marls, limes tones, and black shales (cf. Sect. 7.9.3). - Pe1agic carbonates, carbonaceous siliceous shales and chert, red shales, mostly associated with oceanic cmst (cf. Sect. 5.3, Figs. 5.4 and 5.5). - Skeletal lag deposits, consisting of cephalopods, crinoids, gastropods, etc., phosphorites, glauconitic minerals, cmsts and nodules of iron and mangane se oxyhydrates (condensed sections). - Red and green shales and various evaporites (cf. Sect. 6.4).

536
These and many other minor facies assoeiations described in Part 11 are particularly useful for the identification of depositional environments.
Lateral Facies Associations
Successions similar to those mentioned above also occur as lateral facies associations:
- Alluvial fan - braidplain - (playa) lake ± eolian sands (cf. Figs. 2.8 and 2.32). - Alluvial plain - tidal flats (lagoon) - shallow marine - deeper marine. - Alluvial plain (red beds, eolian sands) - coastal sabkha - lagoonal carbonates and evaporites - reef -forereef - carbonate slope - slope apron (partially shown in Fig. 6.8e). - Clastic shelf - slope and slope channels deep-sea fan- basin plain (cf. Fig. 5.18). - Mid-oceanic ridge - deep-sea pelagic and hemipelagic environments (below and above CCD)deep-sea trench - accretionary wedge with slope basins. (Sect. 12.5, Fig. 12.19).
Proximal-distal trends in relation to the sediment souree also lead to distinct lateral facies associations, for example:
- Slope channel deposits - upper and lower deep-sea fan - overbank deposits - basin plain, displaying channel, proximal and distal turbidites (Sect. 5.4.2, Fig.5.18). - Lava flows - pyroclastic flows and ignimbrites -ash falls with decreasing grain size - fluvial-transported tephra - ash turbidites in lakes and in the deep sea (Sect. 2.4.2, Fig. 2.24). - Relatively coarse fluvial sand - fine eolian sand -eolian dust (loess, Fig. 2.1).
Further examples of facies aSSOCIatlOns in various tectonically defined basin types are described in Chapter 12.
11.7 Preservation and Recycling of Older Sediments
11.7.1 Tbe Survival Rate of Sediment
A general, global problem is the preservation and recycling of sediments in the geological record. Due to uplift and erosion as weIl as subduction at convergent plate boundaries, only part of the ancient sediments still exists. Old mountain ranges, such as the Caledonian and Hercynian fold-thrust belts, are
Chapter 11 Sediment Supply, Subsidence, and Basin Fill
largely stripped of their sedimentary cover and exhibit their "roots" at the present land surface. By contrast, pre- and synorogenic sediments of younger orogenic belts are still in the process of being rapidly eroded. Considering the state of erosion of presentday mountain ranges, we observe that, for example in the Himalayas, Paleozoic metamorphic and nonmetamorphic rocks as weIl as Mesozoic and some Tertiary sediments are presently exposed to coeval weathering and denudation. In the Alps, Triassic to Cretaceous sediments as weIl as older metamorphic rocks of the central crystalline zones are widely subjected to present-day erosion, but some Tertiary sediments also contribute to the modem sediment yield of this region.
These examples and the fact that mountain ranges have sediment yields about two orders of magnitude greater than lowlands demonstrate that modem sediments are derived from rocks of a wide range in age. Their terrestrial proportion mainly consists of recycled older sediments including metamorphic rocks. One can define a kind of mean residence time of sedimentary rocks, i.e. the time span between their formation and erosion. Similarly, the "half-life" ('"&"50) of sediments of a certain time period can be determined which is the time after which 50% of the initial sediment volume has been eroded (Fig. 11.33a).
A rough estimate for the sediments of Alpine orogenie belts renders a mean residenee time on the order of 200 to 300 Ma. Immature orogenie belts exhibit a sediment halflife of 78 Ma, mature orogenie belts with exhumed "roots" one of -350 Ma (Veizer et al. 1989). Aetive margin basins tend to be rapidly destroyed ('50 = 25 Ma), whereas the sediments of passive margins live longer ('so = 75 Ma). Sediments on eontinental platforms reaeh a half-live of -350 Ma. For the post-Devonian time, the average half-life of all types of sediment was found to be 130 Ma (Gregor 1985). For all ages ofsediment, including the Preeambrian, the half-life is longer. Total sediment produetion for the last 3000 Ma is estimated to have been about 5 to 6 times the mass· of the presently existing sediment. The average sediment yield of the Phanerozoie was probably in the order of7 to 10 x 10 9 tlyear (Gregor 1985; Tardy et al. 1989; see also Wold and Hay 1990).
To define the remaining sedimentary mass of an older time period, the term "survival rate" was proposed (e.g. Gregor 1985). This is the present-day surviving mass (or volume) of sedimentary rocks of a given time span per unit time of deposition (e.g. tonsIMa). The volume of sediments preserved from a certain time period, including some metamorphosed material, generally decreases with their age. For the Phanerozoic this decline in sediment mass can be approximated by an exponential curve (Fig. 11.34a,b). However, the masses of preserved Precambrian rocks are greater than predicted by this rule, because they are predominantly cratonic. Even in the Phanerozoic, there are many deviations from
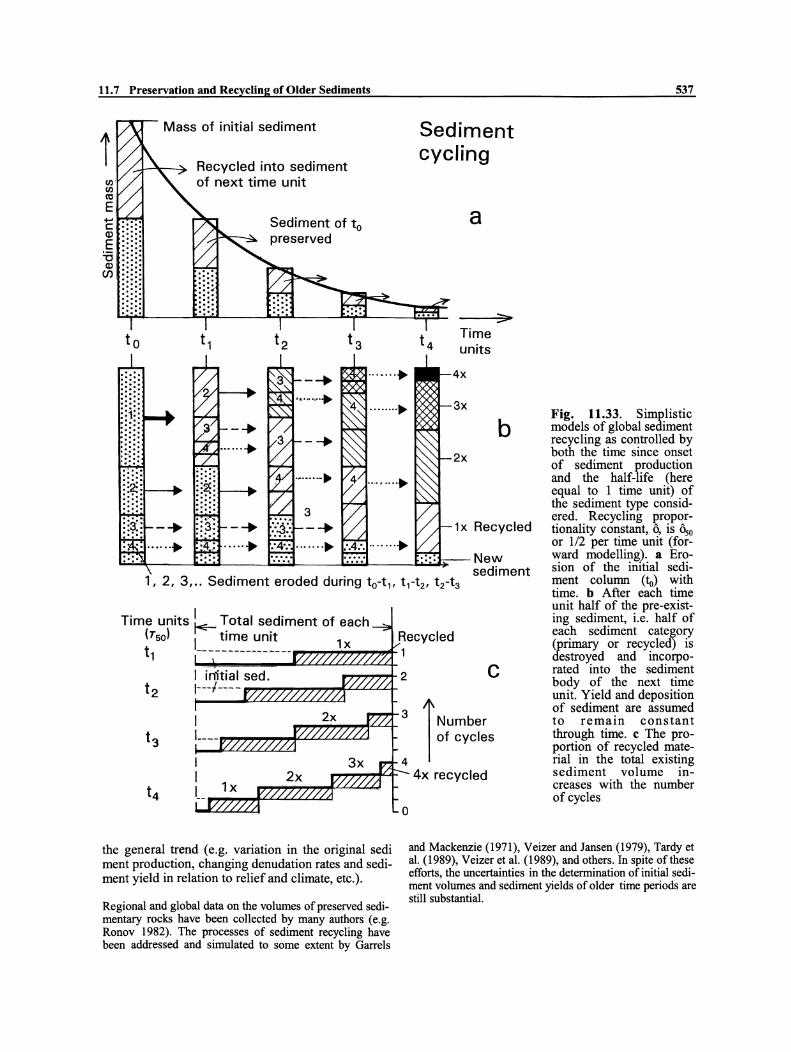
11.7 Preservation and Recycling ofOlder Sediments
I !/J !/J ttI
E ..... c Q) ... E :: : "0 .. Q)
.. Cf) :: : . . :.: ..
Mass of initial sediment
Recycled into sediment of next time unit
Sediment of to preserved
Sediment cycling
a
Time units
3x
2x
b
1x Recycled
537
New sediment
, 2, 3, .. Sediment eroded during to-t1, t 1-t2 , t 2-t3
Fig. 11.33. Simplistic models of global sediment recycling as controlled by both the time since onset of sediment production and the half-life (here equal to 1 time unit) of the sediment type considered. Recycling proportionality constant, Ö, is 050
or 1/2 per time unit (forward modelling). a Erosion of the initial sediment column (10) with time. b After each time unit half of the pre-existing sediment, i.e. half of each sediment category (primary or recycled) is destroyed and incorporated into the sediment body of the next time unit. Yield and deposition of sediment are assumed to remain constant through time. c The proportion of recycled material in the total existing sediment volume increases with the number of cycles
Time units ~ Total sediment of each (Tso) I time unit t1 --------------
the general trend (e.g. variation in the original sedi ment production, changing denudation rates and sediment yield in relation to relief and climate, etc.).
Regional and global data on the volumes ofpreserved sedimentary rocks have been collected by many authors (e.g. Ronov 1982). The processes of sediment recycling have been addressed and simulated to some extent by Garrels
o
c
and Mackenzie (1971), Veizer and Jansen (1979), Tardyet al. (1989), Veizer et al. (1989), and others. In spite ofthese efforts, the uncertainties in the detennination of initial sediment volumes and sediment yields of older time periods are still substantial.

538
log S a
s, ~ :21:' I t I
4 t 1 0 Time units B.P.
b
volcanic free K T
6 5 4 3 _2 1 Time B.P. (x 100 Ma)
c - Caledon.-+- Hercyn.+-- Alpine ----
r-'" r--.., I I Average I I I
E d d-.L I I I rate of r-
Chapter 11 Sediment Supply, Subsidence, and Basin Fill
10 m
BE I/J c 0
6;-' 0 .-
4-Cf)
Q) ..... 2 ~
m > 0';;
o :; Cf)
10 m ::E
Ben ro e I I I I deposition 1 K --1-.---+.. __ I . --I-J. -_. - .1_-"I/,4~ I ""'-"1.. I I -
c o .....
Fig. 11.34. a Semilogarithmic plot of sediment, St, preserved after time t In relation to the initial sediment rnass So (backward modelling). k slope in the diagram. b Sediment survival rates of Phanerozoic sediments. (a and b after Gregor 1985, modified). c Sediment survival rates as b, approximated by an exponential curve. Estirnates (broken fines) indicate the original sediment yields (derived from runoff data in conjunction with the paleo-position of the continents) as weH as the average sediment yield during the Phanerozoic. (After Tardy et al. 1989, modified)
I I 1"1 1 rJ I : I I L :
General I I I I I - L..-;:-l I ~ I 0 151 0 lei p IR trend "I c: I 1 I I I I I I I 1 I
Preserved I I
sedimenlt~ _]I~~~~~
600 500 400 300 200 100 Time B.P. (Ma)
11.7.2 Recycling of Sediment
Relatively young sediments partly consist of material which has been recycled several times. The number of cycles increases with time after the onset of sediment production and with decreasing half-life ('t"50) of the sediment type in question (Fig. 11.33b,c).
The simplistic model of this relationship is based on the assumption that all rock types of the previous time unit are equally exposed to erosion. Sediments transformed to metamorphic rocks also contribute to the production of new sediment. The model demonstrates, for example, that after a time period of 4 half-lives, 63% of the total young sediment consist of material recyc1ed 2 to 3 times; 6% have been recycled 4 times.
Repeatedly recycled sediments tend to mature chemically and mineralogically as well as texturally (cf. Sect. 9.1). Some sediment types, such as easi1y soluble evaporites and to some extent also carbonates, are
"' 6'0
Cf)
4 ~ CI) ....
destroyed faster than shales, sandstones, and volcanogenic rocks. This selective sediment destruction leads to shorter half-lives of the soluble rocks. This explains why their proportion of the existing total mass of sedimentary rocks tends to increase in young geological periods (Mesozoic and Cenozoic), whereas· they are largely gone in old sedimentary sequences. In very old sequences, the most resistant rocks tend to become relatively enriched (e.g. quartzitic sandstones and chert, ironstones ).
11.7.3 Sediment Loss Along Subduction Zones
A factor hardly evaluated in earlier mass balances is the loss of sediment along subduction zones. Generally, one should distinguish between sediment deposition and erosion on (1) stable and extensional tectonic settings and (2) processes on convergent plate boundaries.

11.7 Preservation and Recycling of Older Sediments·
Global mass balances (all va lues for solid sediment or rock in l<.m3 /a, values of subduction zone for past 30 Ma)
Magmatic are are 0.6
(a) Frontal accretion
+ + +
539
Modern total sediment yield 7.5 (Modern mean denudation rate 50 mm/ka)
Erosion
~- -i. <.... --~ _.~ . ~ •••••••••• , ••• :;u:;::::==
1- , + Fold-thrust belt ,
+ + + + +: Older
+ '} + O Continental + I cont. " core + . growth 1.5-2.0 +
+ v Decollement
(c) By-passing sediment . 1.0
+ + + + + D Uplift '\ +
t + +
Juvenile igneous rocks 1.65
Past 30 Ma: a+b+c = 1.9 Modern: cycling of nonsubducting sediment c. 5.5
(d) Subduction erosion: 1.1 (long-term 0.9) not considered (Long-term rate of subcrustally subducted sediment: b + c + d 1.6)
Fig. 11.35. Processes operating alon~ subduction zones and global mass balance calculatlons for sediment loss by frontal accretion, subcrustal underplating and sediment by-passing to the mantle. All numbers are in km3/year for the past 30 Ma.
- The major part of the globally existing clastic sediment is stored in rift zones and intracratonic basins, on passive continental margins, marginal and epicontinental seas, fore land and coastal basins, and on deep-sea fans. As far as these sediments were uplifted and exposed to weathering and denudation, they underwent recycling as indicated above. The mean residence time or half-life of sediments of cratonic and marginal basins, especially those of initially deeply buried strata, is normally longer than the half-life of orogenie and oceanic sediments. - A significant part of the oceanic (deep-marine) sediments is consumed along subduction zones of convergent margins and ultimately contributes to the growth of continents and/or it is incorporated into the mantle (Fig. 11.35). Principally, there are two types of subduction zones: Accreting margins and nonaccreting margins. Along accreting margins the incoming sediment is partially used to form an accretionary wedge, the remainder is stored subcrustally (accretion by underplating), or it bypasses this zone and is conveyed to and absorbed by the mantle. At non-accreting margins all the incom-
Subduction erosion is not considered (see text). Growth rates of the continental crust and the production of juvenile igneous rocks are listed for comparison. (Based on von Huene and Scholl 1991)
ing sediment is subducted and, in addition, part of the rocks on top of the decollement surface may be removed subcrustally (subduction erosion).
In their overview about the processes operating along the modem subduction zones, von Huene and Scholl (1991) have shown that 24 500 km out of the total length of the global subduction zones (43 500 km) belong to the first category, and 19 000 km to the non-accreting margins. Tbe results of their mass balances are summarized in Fig. 11.35. Evaluating relatively "modem" data (for the past 30 Ma), about 1.9 km 3/year solid sediment (consisting of about 60% terrestrial and 40% pelagic material) reach the subduction zone. For frontal accretion, 0.35 km 3/year (out of 1.9 km3/year) are used; 0.45 km3/year are used for subcrustal underplating, and 1.0 km 3/year are absorbed by the mantle. Tbe values reported by Leeder (1997), mainly based on the same sources, are of the same order of magnitude.
Compared with the present-day global sediment yield derived from solid river loads (7.5 krn3/year, equivalent to a mean global denudation rate of 50 mmlka, cf. Sect. 9.3), the total sediment 10ss along the
540
subduction zones is about one fourth of the global modem river load. In times not affected by human activities (global sediment yield about 3 to 4 km3/year) about one half of the river load may have been absorbed by subduction zones and about one fifth was probably removed by frontal accretion and subcrustal underplating. Long-tenri (pre-30 Ma) values for the total amount of subducted sediment appear to have been lower (around 1.0 km3/year) than the post-30 Ma values. In any case, sediment subduction explains why only small proportions of old (>50 to 100 Ma) deep-sea sediments are preserved.
Sediment accreted by underplating and absorbed by the mantle may have contributed to the slow growth of the continents (in the order of 1.5 to 2.0 km3/year) as weIl as to the generation ofnew magma and juvenile igneous rocks (about 1.65 km3/year).
11.7.4 Summary (Global Sediment Recycling)
A major part of the preserved sediment masses of medium to young ages consists of recycled older sediments.
- The present-day existing fraction from the initial total mass of older sedimentary rocks, deposited in a certain time unit, is defined as the survival rate. This rate generally decreases with the age of the initial sediment.
- The residence time or half-life of the sediments of particular basins increases from active via passive margin basins to intracontinental basins. For the post-Devonian time, the average half-life of all types of sediment was -130 Ma. After this
Chapter 11 Sediment Supply, Subsidence, and Basin Fill
The magma of the volcanic arcs seerns to be fed only to a very small part by subducting sediment. Continents can also shrink in areas where subduction erosion is significant (global long-term average about 1.0 km3/year).
All these data are subjected to modifications in line with the progress in our knowledge. Nevertheless, the presently available data are useful for an understanding and preliminary evaluation of the processes of sediment recycling. This processes exert a profound influence on the (changing) composition of sediments with time and they are important in studies on geochemical cycles. The latter, such as the areal and temporal distribution of certain elements and element ratios in turn can support, refine, or modify our present-day knowledge about long-term sediment recycling. Basin filling and basin destruction play, in combination with tectonic processes and isostasy, a great part in the evolution of the continents and the entire globe.
time, half of the original sediment mass was eroded. Easily soluble evaporites and carbonates are destroyed faster than shales, sandstones, and volcanogenic rocks. The most resistant rocks (e.g. quartzitic sandstones, chert, and ironstones ) are relatively enriched in very old sequences. A significant part of the oceanic (deep-marine) sediments is consumed along subduction zones. It ultimately contributes to the growth of the continents and/or it is absorbed by the mantle.