Embed Size (px)
Citation preview
5Sectoral Analyses with Recommendations
ACEH PUBLIC EXPENDITURE ANALYSISSPENDING FOR RECONSTRUCTION AND POVERTY REDUCTION
SECTORAL ANALYSES WITH RECOMMENDATIONS62
This chapter explores the health, education, and infrastructure sectors. Each sector analysis is followed by recommendations.
Health
Access to primary health care facilities is generally better in Aceh than in the rest of Indonesia. According to Podes (BPS Village Potential Survey), in 2005 Aceh had 277 puskesmas (health centers), 705 pustu (subhealth centers), 427 private doctor practices, 1,078 private midwife practices, 4,247 posyandu (health posts), and 2,765 polindes (public midwife practices).37 According to UNICEF’s Health and Nutrition Survey38, approximately 25 percent of villages in Aceh Province do not have on-site health facilities. However this survey might overestimate the need for health facilities since there are many small villages in Aceh whose population and distance to larger villages would not justify a health facility. Compared to the national average, an average Acehnese facility serves a smaller population (14,577 vs. 26,789 people) and has a smaller service area (200 vs. 242 km2).
Unequal distribution of hospitals creates unnecessary needs in some districts. Most hospitals (20 out of 37) are clustered in the 4 city districts (Banda Aceh, Lhokseumawe, Langsa, and Sabang) while 5 districts remain without a hospital. Due to the small population of many districts as well as the distance to other districts with hospitals, hospitals per district may not be a very useful indicator. Aceh has a similar health services profi le relative to Indonesia’s: hospitals per population (0.89 vs. 0.77 per 100,000 population), population per hospital bed (1,703 vs. 1,641), and hospital service area (1,500 vs. 1,200 km2).
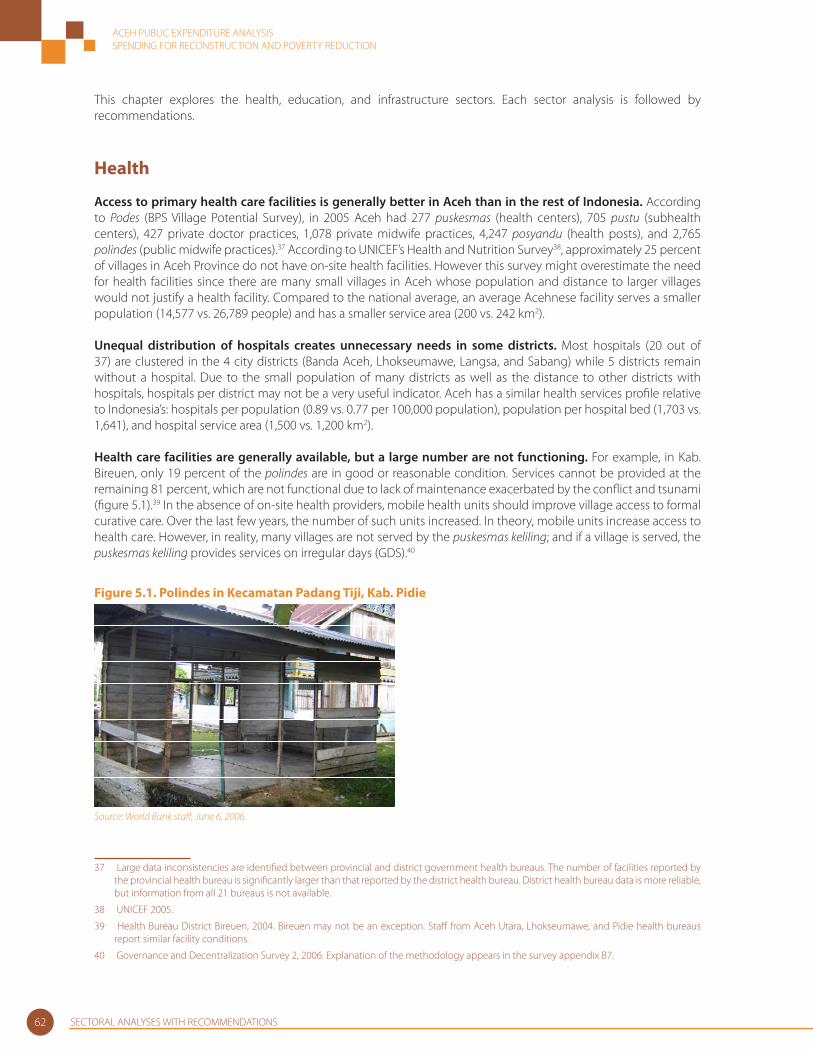
Health care facilities are generally available, but a large number are not functioning. For example, in Kab. Bireuen, only 19 percent of the polindes are in good or reasonable condition. Services cannot be provided at the remaining 81 percent, which are not functional due to lack of maintenance exacerbated by the confl ict and tsunami (fi gure 5.1).39 In the absence of on-site health providers, mobile health units should improve village access to formal curative care. Over the last few years, the number of such units increased. In theory, mobile units increase access to health care. However, in reality, many villages are not served by the puskesmas keliling; and if a village is served, the puskesmas keliling provides services on irregular days (GDS).40
Figure 5.1. Polindes in Kecamatan Padang Tiji, Kab. Pidie
Source: World Bank staff , June 6, 2006.
37 Large data inconsistencies are identifi ed between provincial and district government health bureaus. The number of facilities reported by the provincial health bureau is signifi cantly larger than that reported by the district health bureau. District health bureau data is more reliable, but information from all 21 bureaus is not available.
38 UNICEF 2005.
39 Health Bureau District Bireuen, 2004. Bireuen may not be an exception. Staff from Aceh Utara, Lhokseumawe, and Pidie health bureaus report similar facility conditions.
40 Governance and Decentralization Survey 2, 2006. Explanation of the methodology appears in the survey appendix B7.
ACEH PUBLIC EXPENDITURE ANALYSISSPENDING FOR RECONSTRUCTION AND POVERTY REDUCTION
SECTORAL ANALYSES WITH RECOMMENDATIONS 63
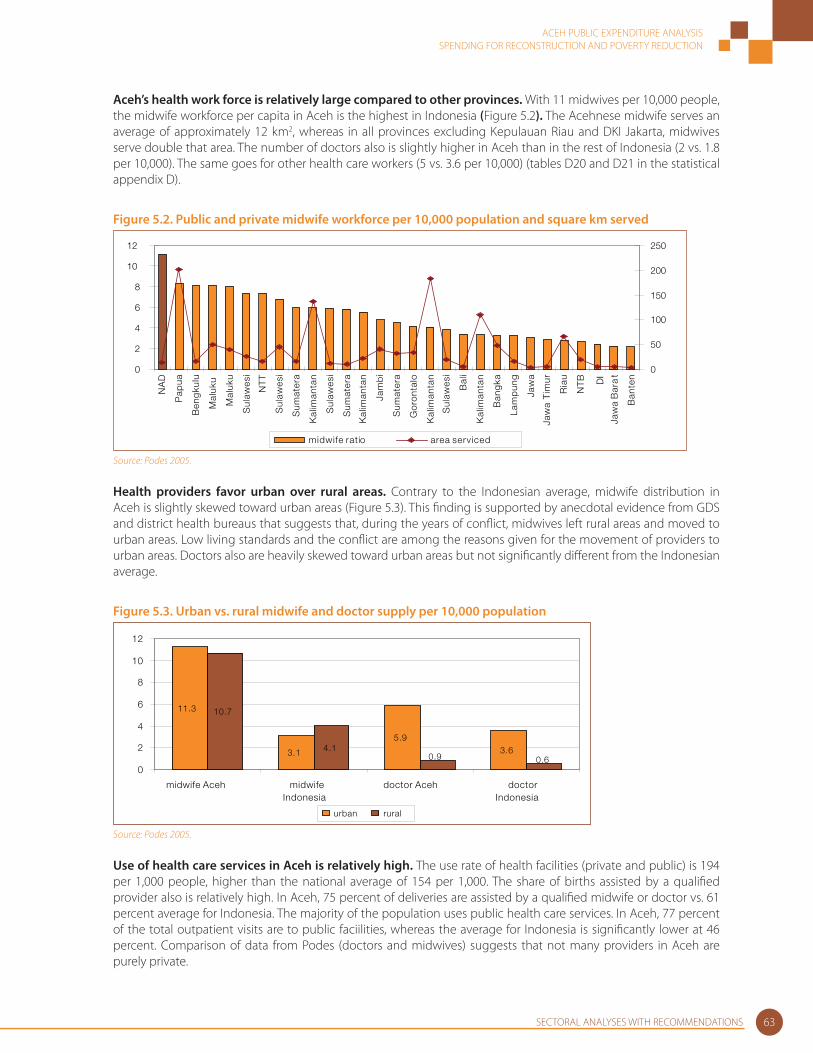
Aceh’s health work force is relatively large compared to other provinces. With 11 midwives per 10,000 people, the midwife workforce per capita in Aceh is the highest in Indonesia (Figure 5.2). The Acehnese midwife serves an average of approximately 12 km2, whereas in all provinces excluding Kepulauan Riau and DKI Jakarta, midwives serve double that area. The number of doctors also is slightly higher in Aceh than in the rest of Indonesia (2 vs. 1.8 per 10,000). The same goes for other health care workers (5 vs. 3.6 per 10,000) (tables D20 and D21 in the statistical appendix D).
Figure 5.2. Public and private midwife workforce per 10,000 population and square km served
0
2
4
6
8
10
12
NA
D
Pap
ua
Ben
gku
lu
Mal
uku
Mal
uku
Sul
awes
i
NT
T
Sul
awes
i
Sum
ater
a
Kal
iman
tan
Sul
awes
i
Sum
ater
a
Kal
iman
tan
Jam
bi
Sum
ater
a
Go
ront
alo
Kal
iman
tan
Sul
awes
i
Bal
i
Kal
iman
tan
Ban
gka
Lam
pun
g
Jaw
a
Jaw
a T
imur
Ria
u
NT
B DI
Jaw
a B
ara
t
Ban
ten
0
50
100
150
200
250
midwife ratio area serviced
Source: Podes 2005.
Health providers favor urban over rural areas. Contrary to the Indonesian average, midwife distribution in Aceh is slightly skewed toward urban areas (Figure 5.3). This fi nding is supported by anecdotal evidence from GDS and district health bureaus that suggests that, during the years of confl ict, midwives left rural areas and moved to urban areas. Low living standards and the confl ict are among the reasons given for the movement of providers to urban areas. Doctors also are heavily skewed toward urban areas but not signifi cantly diff erent from the Indonesian average.
Figure 5.3. Urban vs. rural midwife and doctor supply per 10,000 population
11.3
3.1
5.93.6
10.7
4.10.60.9
0
2
4
6
8
10
12
midwife Aceh midwifeIndonesia
doctor Aceh doctorIndonesia
urban rural
Source: Podes 2005.
Use of health care services in Aceh is relatively high. The use rate of health facilities (private and public) is 194 per 1,000 people, higher than the national average of 154 per 1,000. The share of births assisted by a qualifi ed provider also is relatively high. In Aceh, 75 percent of deliveries are assisted by a qualifi ed midwife or doctor vs. 61 percent average for Indonesia. The majority of the population uses public health care services. In Aceh, 77 percent of the total outpatient visits are to public faciilities, whereas the average for Indonesia is signifi cantly lower at 46 percent. Comparison of data from Podes (doctors and midwives) suggests that not many providers in Aceh are purely private.

ACEH PUBLIC EXPENDITURE ANALYSISSPENDING FOR RECONSTRUCTION AND POVERTY REDUCTION
SECTORAL ANALYSES WITH RECOMMENDATIONS64
Use of puskesmas services varies tremendously in Aceh. Puskesmas receive on average 230 outpatients per week (GDS),41 or 360 according to a survey by Universitas Gajah Mada (UGM).42 However, there is vast variation among Aceh’s puskesmas ranging from 0 to over 6,500 outpatients per week. Almost one-third of the facilities had under 100 visits per week, or 20 visits per day. An assessment should be made to understand why these facilities provide such a small number of services and whether the maintenance of each facility is justifi ed.
On many fronts, quality of health care services can be improved. Many facilities are below minimum acceptable standards. The GDS survey shows that 5 of 34 puskesmas do not have clean water; 12 puskesmas do not have their own generators so face frequent blackouts, and 1 puskesmas has no electricity. Of the 34 puskesmas surveyed, every puskesmas had at least 1 medicine out of stock. In addition, on average, 2–3 of the 13 basic medications were out of stock or had been in the past 3 months. Half of the puskesmas had at least 1 of the 4 main vaccines missing. Provider absenteeism is endemic in the public health system. A 2004 study found that 40 percent of the health providers in Indonesia were absent during offi cial working hours. Based on anecdotal evidence, it seems unlikely that Aceh is any diff erent.43
Health outcomes
Aceh’s overall health outcome indicators seem to be worse than the national average. Diff erent sources have been used to contrast information from diff erent sources (provincial and district health bureaus, SUSENAS, BPS, and UNICEF). A variety of reasons (tsunami damage, data collection problems due to the confl ict) contribute to a lack of accuracy of data in the health sector. Immunization coverage in Aceh is lower than the national average. All data sources suggest that tuberculosis (Bacillus of Calmette and Guerin-BCG), DPT3 (combined vaccination against diphtheria: pertussis-whooping cough-tetanus), and measles immunizations are well below the national average (table 5.1).44
Table 5.1. Immunization coverage comparison (%)
Aceh(UNICEF 2005)
(%)
Aceh (Dinas Kesehatan 2004) (%)
Aceh(SUSENAS 2004)
(%)
Indonesia(SUSENAS 2002–03)
(%)
BCG 62 36.4 76.2 90.2
DPT 3 48 33.3 21.1 43.2
Polio 3 n.a. n.a. 6.6 12.8
Measles 49 31.8 76.5 84.2Sources: UNICEF 2005, Dinas kesehatan 2004, and the Indonesian Demographic and Health Survey (IDHS) 2002–03.
Data from a UNICEF survey conducted in Aceh after the tsunami shows worse health outcomes in Aceh than in the rest of Indonesia. The survey was conducted in March and September 2005 in 18 districts in Aceh province that were representative of disease incidence in children below 6 years and pregnant women. The fact that both surveys took place after the tsunami somewhat conditions the analysis. The survey shows that, in Aceh, 37 percent of children suff er from Acute Respiratory Infection (ARI) and 38 percent from fever. These percentages are higher than the average for Indonesia, in which 6.3 percent of children suff er from ARI and 20 percent from fever. Malnutrition incidence indicators also were worse in Aceh, where 44 percent of children were underweight, compared to 26 percent in Indonesia.45
41 GDS covered 34 puskesmas in 6 districts.
42 UGM (Universitas Gajah Mada) facility survey contains reliable use data of 165 puskesmas throughout the province.
43 Smeru 2004.
44 UNICEF health and nutrition survey, September 2005.
45 Abreu 2005.
ACEH PUBLIC EXPENDITURE ANALYSISSPENDING FOR RECONSTRUCTION AND POVERTY REDUCTION
SECTORAL ANALYSES WITH RECOMMENDATIONS 65
Impact of confl ict and tsunami on health system and health outcomes
During the confl ict, although health facilities were not purposely targeted––as schools were––health infrastructure was seriously damaged. During the fi rst week of martial law in 2003, three health subcenters and 35 village maternity clinics were burned down in Kab. Bireuen and Kab. Pidie. They were in addition to the 8 health centers, 19 health subcenters, and 7 mobile units destroyed in the province during previous years of hostilities. Furthermore, between 1999 and 2004, 20 health care staff lost their lives, and another 29 health care staff from 20 districts were subject to violence. As a result of the confl ict, many midwives left their posts to live in the city. The confl ict overburdened the health care system due to the large number of displaced people, restricted access to services in confl ict areas, and increased need for specialized care. In addition, during the confl ict, many health workers moved from rural to urban areas, resulting in sparse provision of health care services in rural areas. Even although the confl ict has ended, these providers have not returned to their postings. In some villages, services have been discontinued, whereas in others, services are at irregular hours depending on the provider. Villagers often depend on a provider at a more distant location.
The tsunami caused widespread damage to health facilities and human resources. The earthquake and tsunami of December 26 caused signifi cant destruction to the health sector, damaging or destroying 8 hospitals, 41 puskesmas, 59 pustu, 44 posyandu, and 240 polindes. The provincial health bureau also was heavily damaged, with a heavy loss of data. Many health professionals lost their lives. The reduction in the health workforce has been addressed by replacing them with almost twice the number of health care providers. Approximately 1,306 new health staff , including 222 medical doctors and 162 midwives, were recruited shortly after to replace perished staff . Most new health workers were hired by NGOs, work at temporary health service posts, and are not paid by government salaries.
The tsunami left more than 500,000 people homeless. Most were forced to move to internally displaced persons (IDP) camps. This move created specifi c health care issues. As of July 2006, over 50,000 people remained in the IDP camps. The IDP camps have to deal with the limited access to water and poor sanitation. Despite the perceived larger threats to health nutrition indicators, a recent study by UNICEF did not identify signifi cant diff erences in wasting, global acute malnutrition, stunting, underweight, and anemia between children living in IDP camps and non-IDPs.46 Recovery is ongoing, but it is taking longer than expected. By July 2006, 25 percent of the damaged health infrastructure had been rebuilt. Eight major hospital reconstruction and rehabilitation projects had been completed; another 13 were ongoing. Half of the damaged puskesmas and pustu are being reconstructed.
Spending on health vs. quality of health care and health outcomes
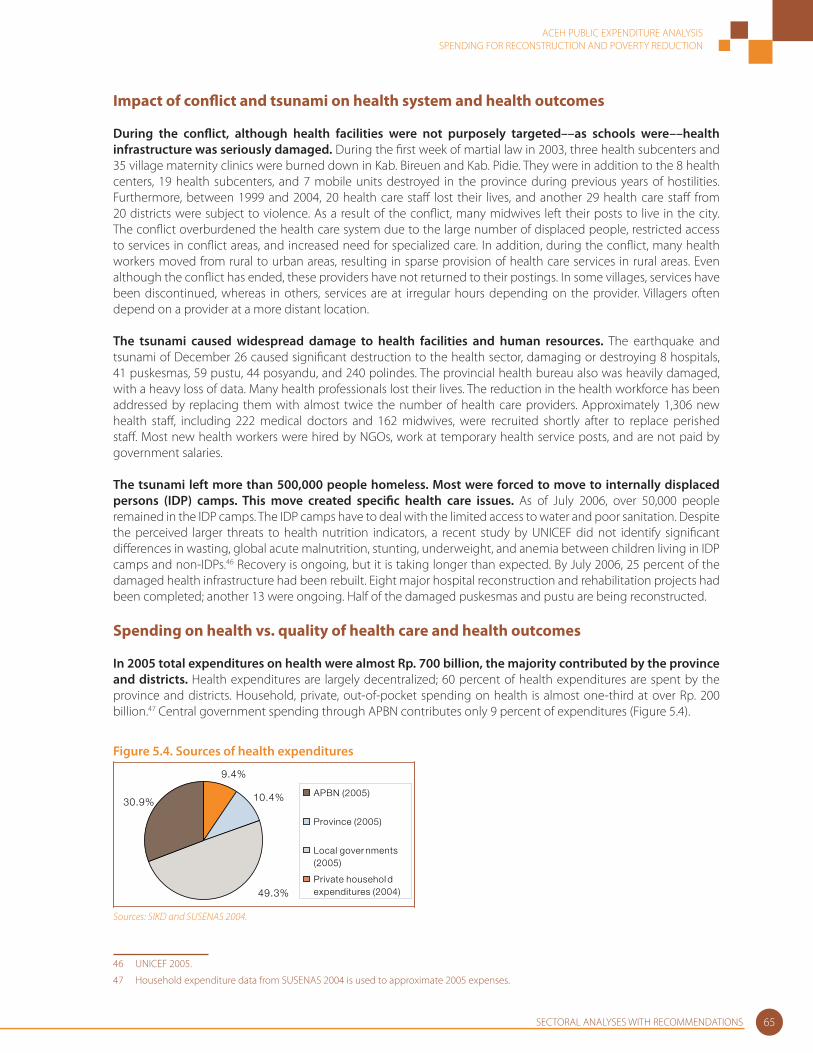
In 2005 total expenditures on health were almost Rp. 700 billion, the majority contributed by the province and districts. Health expenditures are largely decentralized; 60 percent of health expenditures are spent by the province and districts. Household, private, out-of-pocket spending on health is almost one-third at over Rp. 200 billion.47 Central government spending through APBN contributes only 9 percent of expenditures (Figure 5.4).
Figure 5.4. Sources of health expenditures
9.4%
10.4%
49.3%
30.9%APBN (2005)
Province (2005)
Local gover nments(2005)
Private househol dexpenditures (2004)
Sources: SIKD and SUSENAS 2004.
46 UNICEF 2005.
47 Household expenditure data from SUSENAS 2004 is used to approximate 2005 expenses.
ACEH PUBLIC EXPENDITURE ANALYSISSPENDING FOR RECONSTRUCTION AND POVERTY REDUCTION
SECTORAL ANALYSES WITH RECOMMENDATIONS66
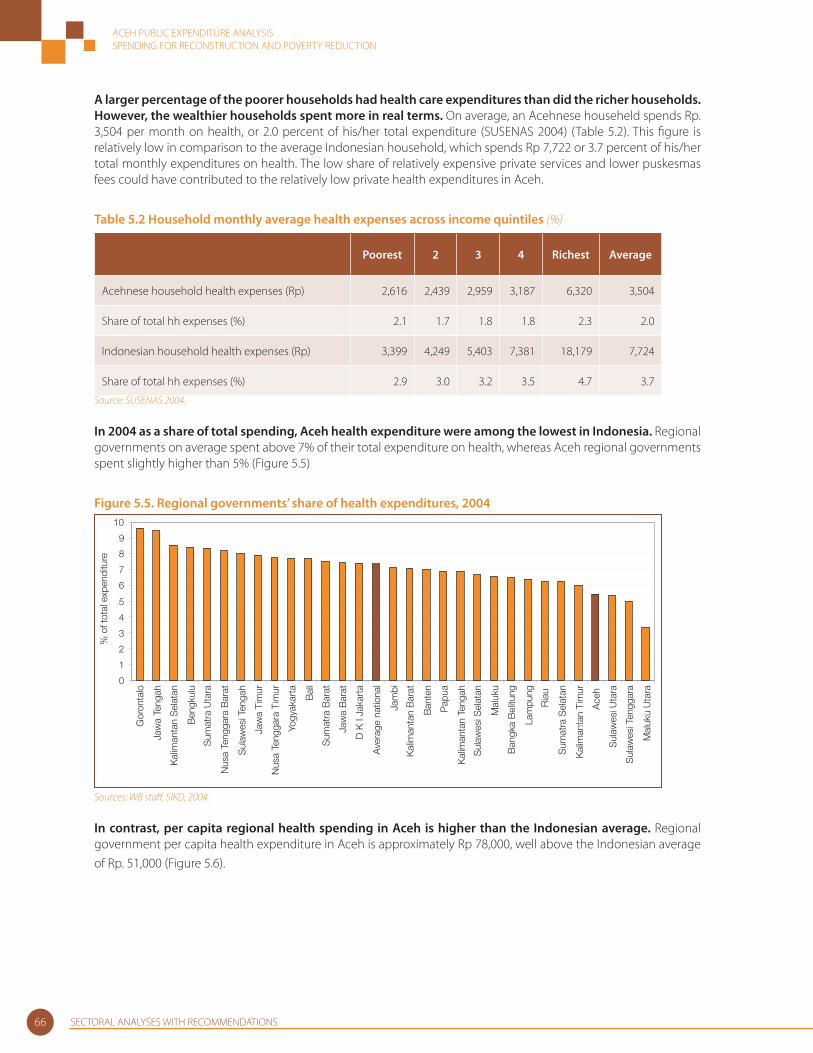
A larger percentage of the poorer households had health care expenditures than did the richer households. However, the wealthier households spent more in real terms. On average, an Acehnese househeld spends Rp. 3,504 per month on health, or 2.0 percent of his/her total expenditure (SUSENAS 2004) (Table 5.2). This fi gure is relatively low in comparison to the average Indonesian household, which spends Rp 7,722 or 3.7 percent of his/her total monthly expenditures on health. The low share of relatively expensive private services and lower puskesmas fees could have contributed to the relatively low private health expenditures in Aceh.
Table 5.2 Household monthly average health expenses across income quintiles (%)
Poorest 2 3 4 Richest Average
Acehnese household health expenses (Rp) 2,616 2,439 2,959 3,187 6,320 3,504
Share of total hh expenses (%) 2.1 1.7 1.8 1.8 2.3 2.0
Indonesian household health expenses (Rp) 3,399 4,249 5,403 7,381 18,179 7,724
Share of total hh expenses (%) 2.9 3.0 3.2 3.5 4.7 3.7
Source: SUSENAS 2004.
In 2004 as a share of total spending, Aceh health expenditure were among the lowest in Indonesia. Regional governments on average spent above 7% of their total expenditure on health, whereas Aceh regional governments spent slightly higher than 5% (Figure 5.5)
Figure 5.5. Regional governments’ share of health expenditures, 2004
0
1
2
3
4
5
6
7
8
9
10
Gor
onta
lo
Jaw
a Te
ngah
Kal
iman
tan
Sel
atan
Ben
gkul
u
Sum
atra
Uta
ra
Nus
a Te
ngga
ra B
arat
Sul
awes
i Ten
gah
Jaw
a Ti
mur
Nus
a Te
ngga
ra T
imur
Yogy
akar
ta
Bal
i
Sum
atra
Bar
at
Jaw
a B
arat
D K
I Ja
kart
a
Ave
rage
nat
iona
l
Jam
bi
Kal
iman
tan
Bar
at
Ban
ten
Pap
ua
Kal
iman
tan
Teng
ah
Sul
awes
i Sel
atan
Mal
uku
Ban
gka
Bel
itung
Lam
pung
Ria
u
Sum
atra
Sel
atan
Kal
iman
tan
Tim
ur
Ace
h
Sul
awes
i Uta
ra
Sul
awes
i Ten
ggar
a
Mal
uku
Uta
ra
% o
f tot
al e
xpen
ditu
re
Sources: WB staff , SIKD, 2004.
In contrast, per capita regional health spending in Aceh is higher than the Indonesian average. Regional government per capita health expenditure in Aceh is approximately Rp 78,000, well above the Indonesian average of Rp. 51,000 (Figure 5.6).

ACEH PUBLIC EXPENDITURE ANALYSISSPENDING FOR RECONSTRUCTION AND POVERTY REDUCTION
SECTORAL ANALYSES WITH RECOMMENDATIONS 67
Figure 5.6. Regional per capita health expenditures by province, 2004
0
50
100
150
200
250
Pap
ua
Kal
iman
tan
Tim
ur
Go
ront
alo
Kal
iman
tan
Ten
gah
DK
I Jak
arta
Ria
u
Mal
uku
Sul
awes
i Ten
gah
NA
D
Kal
iman
tan
Sel
atan Bal
i
Ben
gku
lu
Jam
bi
NT
T
Sum
ater
a B
ara
t
Ban
gka
Bel
itung
DI Y
og
yaka
rta
Kal
iman
tan
Bar
at
Sul
awes
i Sel
atan
Sum
ater
a U
tara
Nat
iona
l
NT
B
Sul
awes
i Ten
gg
ara
Sul
awes
i Uta
ra
Mal
uku
Uta
ra
Sum
ater
a S
elat
an
Jaw
a T
eng
ah
Jaw
a T
imur
Lam
pun
g
Jaw
a B
ara
t
Ban
ten
Rp
('0
00
)
Source: World Bank staff .Note: Data for DKI Jakarta is not available.
After decentralization, regional health expenditures increased in absolute terms, but the share in total regional expenses did not change much (Figure 5.7). As a result of the special autonomy status, absolute health expenditures increased by approximately 50 percent, but the share of total expenditures allocated to health stayed between 5 percent and 7 percent.
Figure 5.7. Health expenditures as a share of total regional expenditures, 2001–05
342
545 539444
508
6%
7%6%
5%
6%
0
100
200
300
400
500
600
2001 2002 2003 2004 2005
Rp
(Bln
Rp
)
0%
1%
2%
3%
4%
5%
6%
7%
Source: World Bank staff estimates based on MoF data (constant 2006 prices).
District governments spend more on health than do provincial and central governments. After decentralization, the share of province expenditures in total public health spending decreased when local government health expenditures rose. In 2005 only 15 percent of total public health expenses were contributed by the province, vs. 71 percent from districts and 14 percent from the center. A similar breakdown applies to contributions to routine and development expenditures (Table 5.3).
ACEH PUBLIC EXPENDITURE ANALYSISSPENDING FOR RECONSTRUCTION AND POVERTY REDUCTION
SECTORAL ANALYSES WITH RECOMMENDATIONS68
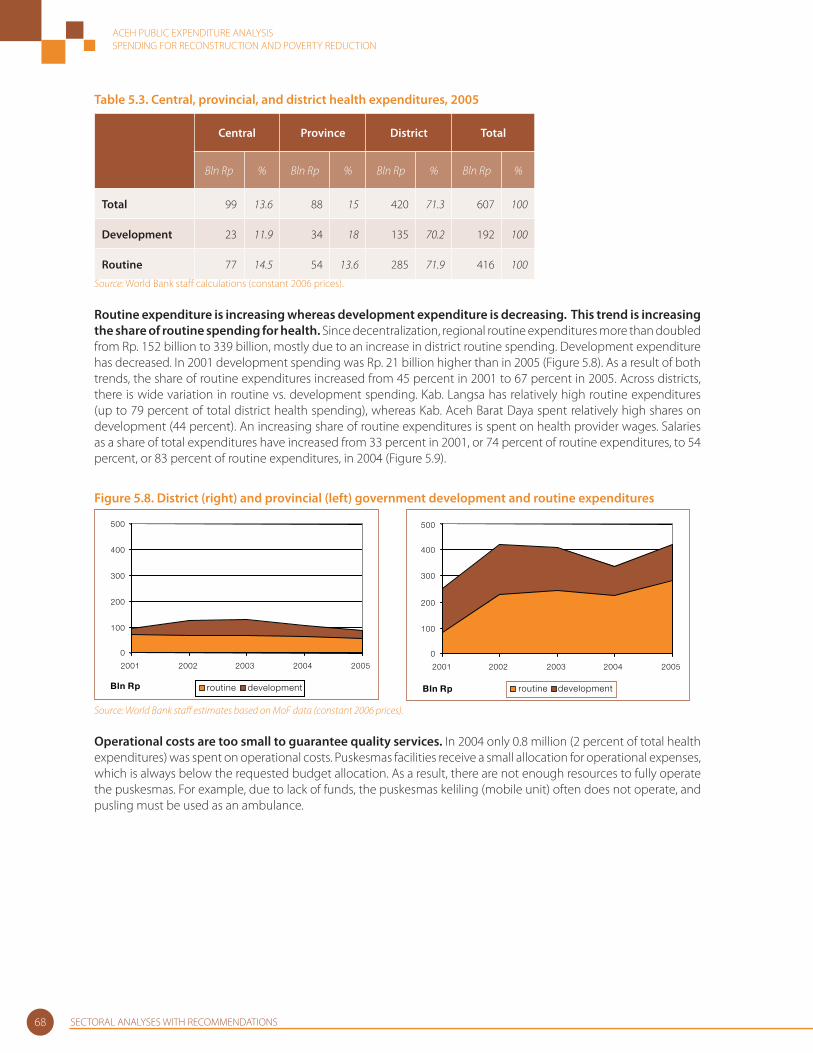
Table 5.3. Central, provincial, and district health expenditures, 2005
Central Province District Total
Bln Rp % Bln Rp % Bln Rp % Bln Rp %
Total 99 13.6 88 15 420 71.3 607 100
Development 23 11.9 34 18 135 70.2 192 100
Routine 77 14.5 54 13.6 285 71.9 416 100
Source: World Bank staff calculations (constant 2006 prices).
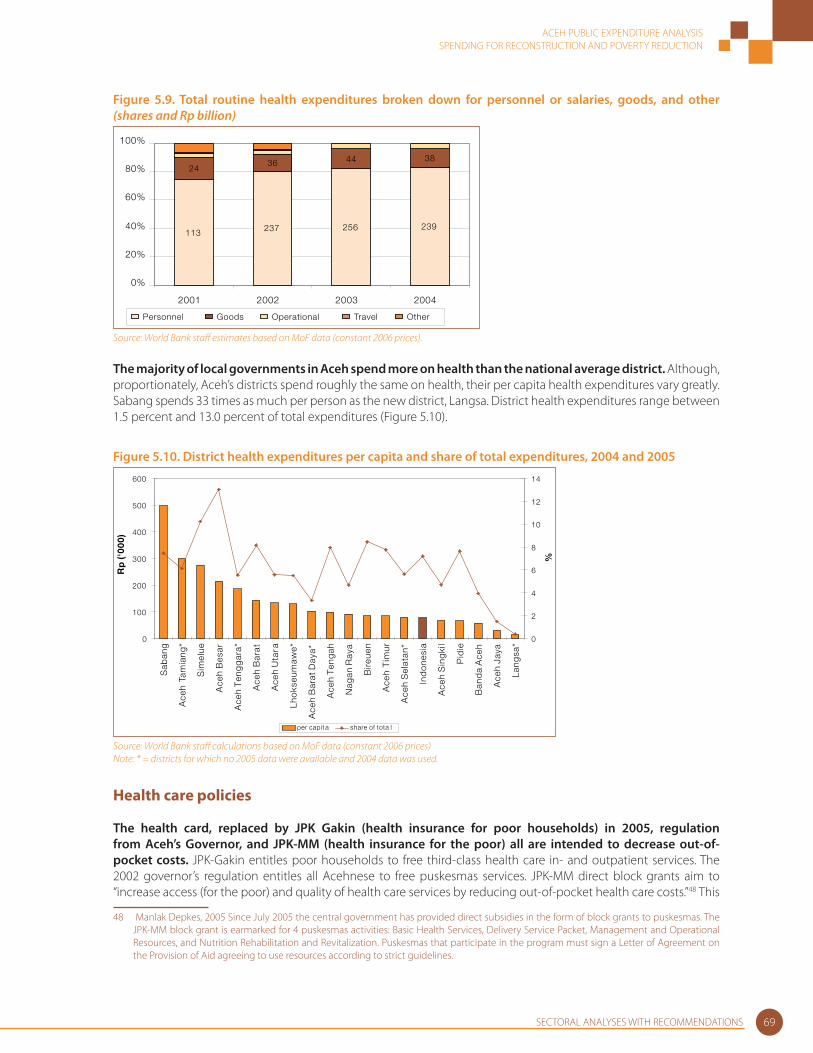
Routine expenditure is increasing whereas development expenditure is decreasing. This trend is increasing the share of routine spending for health. Since decentralization, regional routine expenditures more than doubled from Rp. 152 billion to 339 billion, mostly due to an increase in district routine spending. Development expenditure has decreased. In 2001 development spending was Rp. 21 billion higher than in 2005 (Figure 5.8). As a result of both trends, the share of routine expenditures increased from 45 percent in 2001 to 67 percent in 2005. Across districts, there is wide variation in routine vs. development spending. Kab. Langsa has relatively high routine expenditures (up to 79 percent of total district health spending), whereas Kab. Aceh Barat Daya spent relatively high shares on development (44 percent). An increasing share of routine expenditures is spent on health provider wages. Salaries as a share of total expenditures have increased from 33 percent in 2001, or 74 percent of routine expenditures, to 54 percent, or 83 percent of routine expenditures, in 2004 (Figure 5.9).
Figure 5.8. District (right) and provincial (left) government development and routine expenditures
0
100
200
300
400
500
2001 2002 2003 2004 2005
Bln Rp routine development
0
100
200
300
400
500
2001 2002 2003 2004 2005
Bln Rp routine development
Source: World Bank staff estimates based on MoF data (constant 2006 prices).
Operational costs are too small to guarantee quality services. In 2004 only 0.8 million (2 percent of total health expenditures) was spent on operational costs. Puskesmas facilities receive a small allocation for operational expenses, which is always below the requested budget allocation. As a result, there are not enough resources to fully operate the puskesmas. For example, due to lack of funds, the puskesmas keliling (mobile unit) often does not operate, and pusling must be used as an ambulance.
ACEH PUBLIC EXPENDITURE ANALYSISSPENDING FOR RECONSTRUCTION AND POVERTY REDUCTION
SECTORAL ANALYSES WITH RECOMMENDATIONS 69
Figure 5.9. Total routine health expenditures broken down for personnel or salaries, goods, and other (shares and Rp billion)
113 237 256 239
2436 44 38
0%
20%
40%
60%
80%
100%
2001 2002 2003 2004
Personnel Goods Operational Travel Other
Source: World Bank staff estimates based on MoF data (constant 2006 prices).
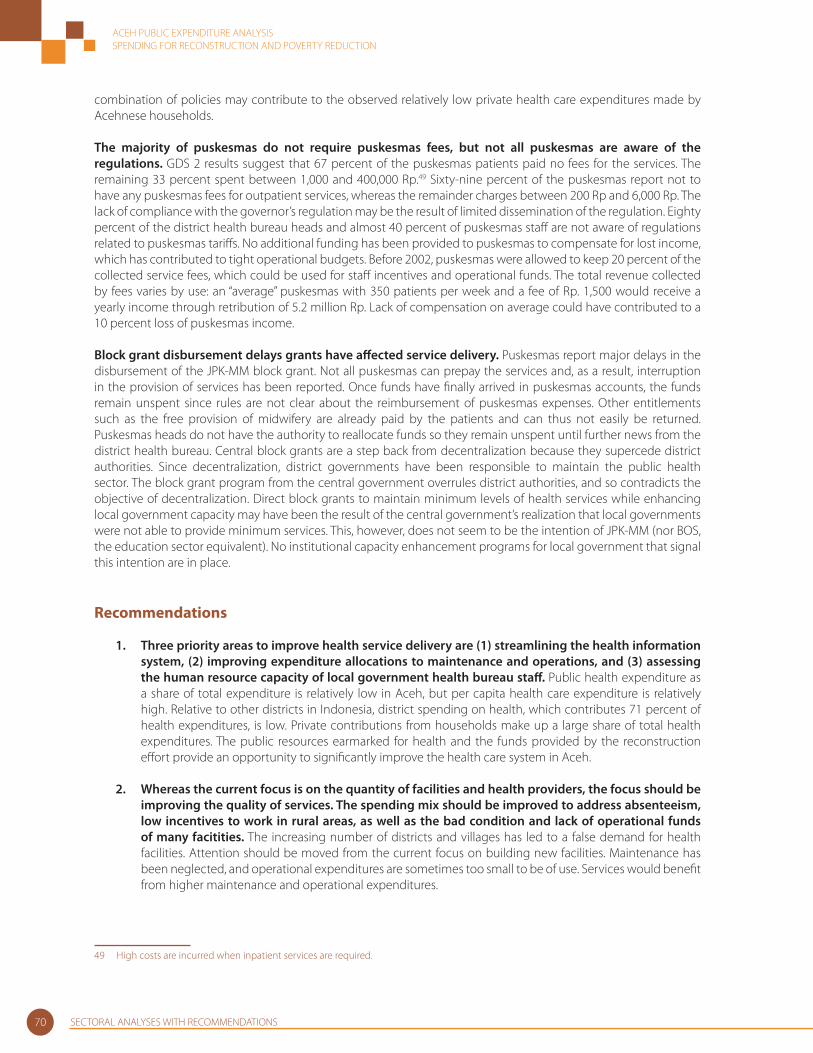
The majority of local governments in Aceh spend more on health than the national average district. Although, proportionately, Aceh’s districts spend roughly the same on health, their per capita health expenditures vary greatly. Sabang spends 33 times as much per person as the new district, Langsa. District health expenditures range between 1.5 percent and 13.0 percent of total expenditures (Figure 5.10).
Figure 5.10. District health expenditures per capita and share of total expenditures, 2004 and 2005
0
100
200
300
400
500
600
Sab
ang
Ace
h Ta
mia
ng*
Sim
elue
Ace
h B
esar
Ace
h T
eng
gar
a*
Ace
h B
arat
Ace
h U
tara
Lho
kseu
maw
e*
Ace
h B
arat
Day
a*
Ace
h T
eng
ah
Nag
an R
aya
Bire
uen
Ace
h T
imur
Ace
h S
elat
an*
Ind
one
sia
Ace
h S
ing
kil
Pid
ie
Ban
da
Ace
h
Ace
h Ja
ya
Lang
sa*
Rp
('0
00
)
0
2
4
6
8
10
12
14
%
per capit a share of tota l
Source: World Bank staff calculations based on MoF data (constant 2006 prices)Note: * = districts for which no 2005 data were available and 2004 data was used.
Health care policies
The health card, replaced by JPK Gakin (health insurance for poor households) in 2005, regulation from Aceh’s Governor, and JPK-MM (health insurance for the poor) all are intended to decrease out-of-pocket costs. JPK-Gakin entitles poor households to free third-class health care in- and outpatient services. The 2002 governor’s regulation entitles all Acehnese to free puskesmas services. JPK-MM direct block grants aim to “increase access (for the poor) and quality of health care services by reducing out-of-pocket health care costs.”48 This
48 Manlak Depkes, 2005 Since July 2005 the central government has provided direct subsidies in the form of block grants to puskesmas. The JPK-MM block grant is earmarked for 4 puskesmas activities: Basic Health Services, Delivery Service Packet, Management and Operational Resources, and Nutrition Rehabilitation and Revitalization. Puskesmas that participate in the program must sign a Letter of Agreement on the Provision of Aid agreeing to use resources according to strict guidelines.
ACEH PUBLIC EXPENDITURE ANALYSISSPENDING FOR RECONSTRUCTION AND POVERTY REDUCTION
SECTORAL ANALYSES WITH RECOMMENDATIONS70
combination of policies may contribute to the observed relatively low private health care expenditures made by Acehnese households.
The majority of puskesmas do not require puskesmas fees, but not all puskesmas are aware of the regulations. GDS 2 results suggest that 67 percent of the puskesmas patients paid no fees for the services. The remaining 33 percent spent between 1,000 and 400,000 Rp.49 Sixty-nine percent of the puskesmas report not to have any puskesmas fees for outpatient services, whereas the remainder charges between 200 Rp and 6,000 Rp. The lack of compliance with the governor’s regulation may be the result of limited dissemination of the regulation. Eighty percent of the district health bureau heads and almost 40 percent of puskesmas staff are not aware of regulations related to puskesmas tariff s. No additional funding has been provided to puskesmas to compensate for lost income, which has contributed to tight operational budgets. Before 2002, puskesmas were allowed to keep 20 percent of the collected service fees, which could be used for staff incentives and operational funds. The total revenue collected by fees varies by use: an “average” puskesmas with 350 patients per week and a fee of Rp. 1,500 would receive a yearly income through retribution of 5.2 million Rp. Lack of compensation on average could have contributed to a 10 percent loss of puskesmas income.
Block grant disbursement delays grants have aff ected service delivery. Puskesmas report major delays in the disbursement of the JPK-MM block grant. Not all puskesmas can prepay the services and, as a result, interruption in the provision of services has been reported. Once funds have fi nally arrived in puskesmas accounts, the funds remain unspent since rules are not clear about the reimbursement of puskesmas expenses. Other entitlements such as the free provision of midwifery are already paid by the patients and can thus not easily be returned. Puskesmas heads do not have the authority to reallocate funds so they remain unspent until further news from the district health bureau. Central block grants are a step back from decentralization because they supercede district authorities. Since decentralization, district governments have been responsible to maintain the public health sector. The block grant program from the central government overrules district authorities, and so contradicts the objective of decentralization. Direct block grants to maintain minimum levels of health services while enhancing local government capacity may have been the result of the central government’s realization that local governments were not able to provide minimum services. This, however, does not seem to be the intention of JPK-MM (nor BOS, the education sector equivalent). No institutional capacity enhancement programs for local government that signal this intention are in place.
Recommendations
1. Three priority areas to improve health service delivery are (1) streamlining the health information system, (2) improving expenditure allocations to maintenance and operations, and (3) assessing the human resource capacity of local government health bureau staff . Public health expenditure as a share of total expenditure is relatively low in Aceh, but per capita health care expenditure is relatively high. Relative to other districts in Indonesia, district spending on health, which contributes 71 percent of health expenditures, is low. Private contributions from households make up a large share of total health expenditures. The public resources earmarked for health and the funds provided by the reconstruction eff ort provide an opportunity to signifi cantly improve the health care system in Aceh.
2. Whereas the current focus is on the quantity of facilities and health providers, the focus should be improving the quality of services. The spending mix should be improved to address absenteeism, low incentives to work in rural areas, as well as the bad condition and lack of operational funds of many facitities. The increasing number of districts and villages has led to a false demand for health facilities. Attention should be moved from the current focus on building new facilities. Maintenance has been neglected, and operational expenditures are sometimes too small to be of use. Services would benefi t from higher maintenance and operational expenditures.
49 High costs are incurred when inpatient services are required.
ACEH PUBLIC EXPENDITURE ANALYSISSPENDING FOR RECONSTRUCTION AND POVERTY REDUCTION
SECTORAL ANALYSES WITH RECOMMENDATIONS 71
3. Proper mapping of health care facilities, their maintenance, and human resources are important before deciding to build more health care services. Since decentralization, the number of puskesmas and pustu has kept increasing. Despite a high number of public and private health care providers, human resources are not always suffi cient to actually staff the new facilities. As a result, facilities are minimally equipped, and the working environment does not support health care staff , who consequently leave their posting.
4. There is a need to rebuild the data management information system to support prioritization of the health budget allocation. Government health institutions are overwhelmed with data, which seem to be collected without a clear purpose. As a result, little attention is paid to the quality of the data. Comparison of diff erent data sources within the health bureau shows inconsistencies. In addition, as a result of the confl ict and the tsunami, much data has been lost. A proper stocktaking of health infrastructure, human resources, and services is therefore very diffi cult. The lack of an institutionalized fl ow of data between districts and province further hampers the quality of data. Proper verifi cation of data is not possible, and verifi cation has not received the attention it deserves.
5. Central government spending should be on centralized tasks only. The central government subsidies (block grants) to puskesmas cover a responsibility of the district government. The allocation of central government spending in the regions is very unpredictable. District governments cannot depend on this revenue, which is subject to changing regulations to operate. It is notable that districts seem to adapt their expenditures accordingly, not assuming full responsibility for areas for which they are responsible.
6. The mobility of health care providers should be facilitated to increase the eff ectiveness of health care services. At the village level, providers depend on their own transportation. Provision of transport for health care staff , especially midwives in the fi eld, is essential to increase use of their services. Without the support of the puskesmas, provision of antenatal care, assistance during birth, postnatal care, immunizations, and socialization of best information and best practice depend on the midwife.
Education
Education system and outcomes
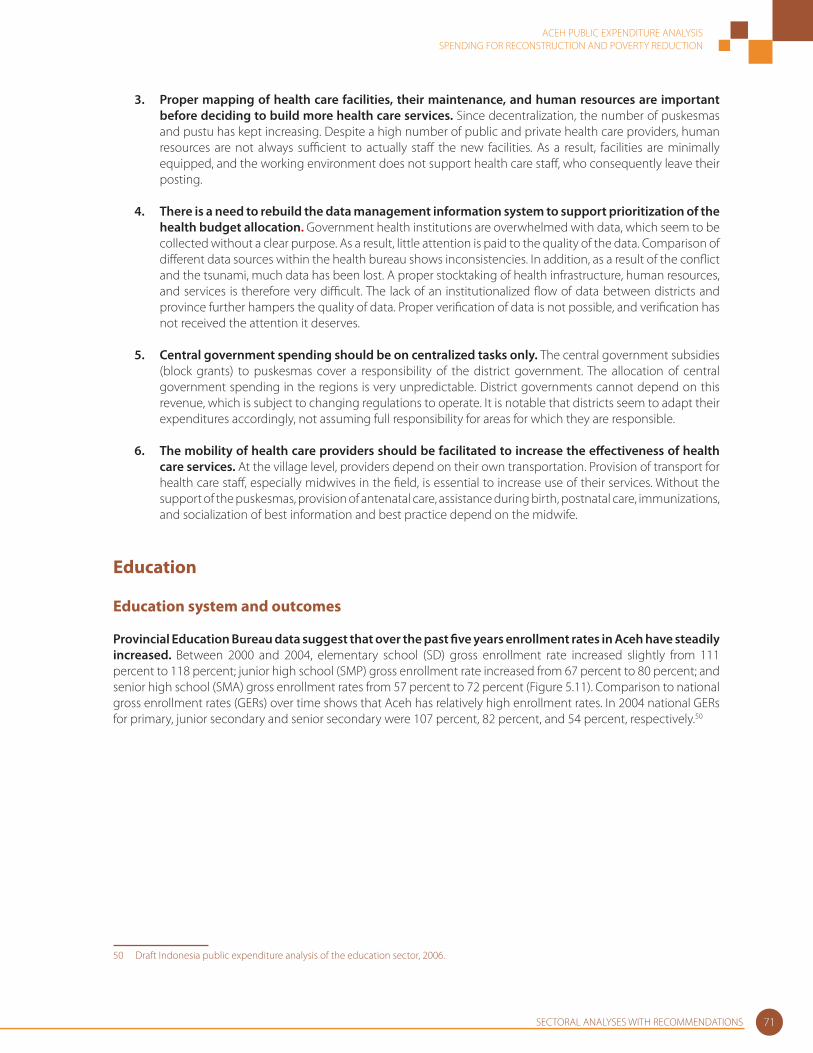
Provincial Education Bureau data suggest that over the past fi ve years enrollment rates in Aceh have steadily increased. Between 2000 and 2004, elementary school (SD) gross enrollment rate increased slightly from 111 percent to 118 percent; junior high school (SMP) gross enrollment rate increased from 67 percent to 80 percent; and senior high school (SMA) gross enrollment rates from 57 percent to 72 percent (Figure 5.11). Comparison to national gross enrollment rates (GERs) over time shows that Aceh has relatively high enrollment rates. In 2004 national GERs for primary, junior secondary and senior secondary were 107 percent, 82 percent, and 54 percent, respectively.50
50 Draft Indonesia public expenditure analysis of the education sector, 2006.
ACEH PUBLIC EXPENDITURE ANALYSISSPENDING FOR RECONSTRUCTION AND POVERTY REDUCTION
SECTORAL ANALYSES WITH RECOMMENDATIONS72
Figure 5.11. Gross enrollment rate trends for primary, junior, and senior high school in Aceh, 1999–2006
0
20
40
60
80
100
120
140
99/00 00/01 2001/02 2002/ 2003/04 2004/05 2005/06
GER (%)
GER SD GER SM P GER SM A
Source: Ministry of National Education and BPS population data, various years.
Trends in enrollment rates are more reliable than enrollment levels, which seem overestimated.51 Review of the education bureau data and BPS population data is necessary to make a reliable estimate of enrollment rates. Three diff erent sources (BPS, Education Bureau, and SUSENAS) on 2004–05 SD student enrollment numbers (both private and public) vary from 523,228 to 579,804 students. The religion bureau data does not seem to vary signifi cantly, creating GERs ranging from 118 percent to 127 percent.52 Other data issues include an inconsistency between the number of SD students graduated in 2004–05 with the number of SD students enrolled in the fi nal grade of that year.
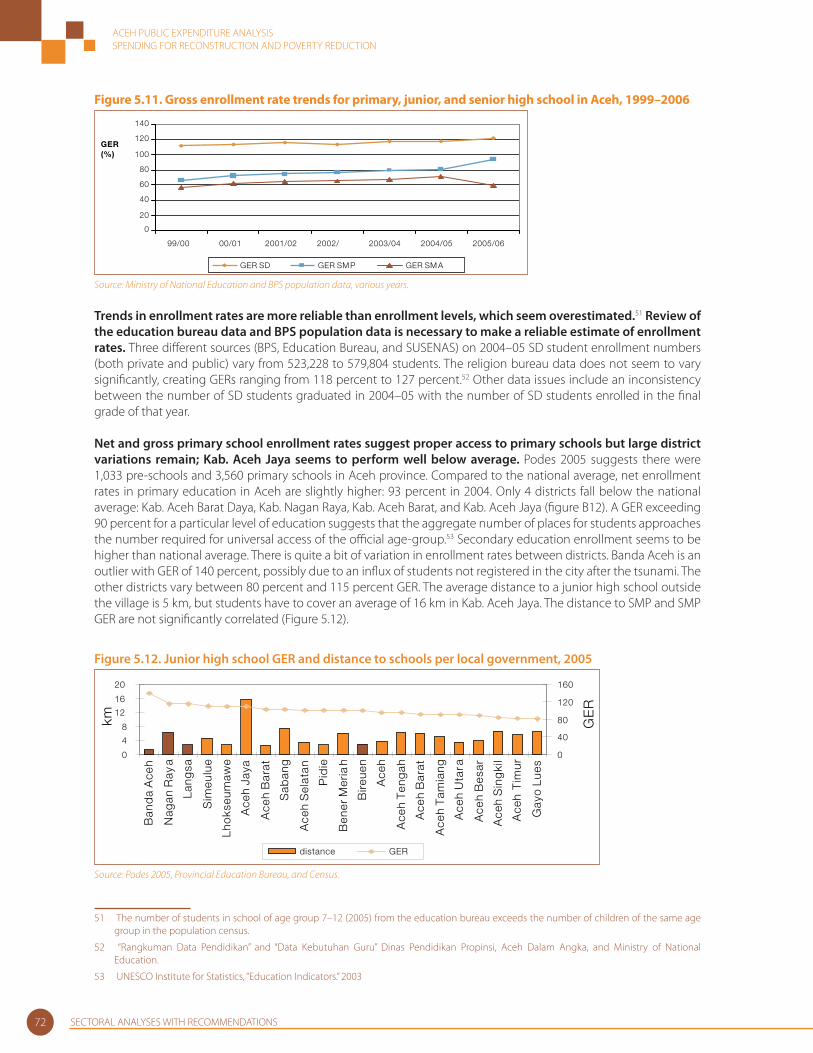
Net and gross primary school enrollment rates suggest proper access to primary schools but large district variations remain; Kab. Aceh Jaya seems to perform well below average. Podes 2005 suggests there were 1,033 pre-schools and 3,560 primary schools in Aceh province. Compared to the national average, net enrollment rates in primary education in Aceh are slightly higher: 93 percent in 2004. Only 4 districts fall below the national average: Kab. Aceh Barat Daya, Kab. Nagan Raya, Kab. Aceh Barat, and Kab. Aceh Jaya (fi gure B12). A GER exceeding 90 percent for a particular level of education suggests that the aggregate number of places for students approaches the number required for universal access of the offi cial age-group.53 Secondary education enrollment seems to be higher than national average. There is quite a bit of variation in enrollment rates between districts. Banda Aceh is an outlier with GER of 140 percent, possibly due to an infl ux of students not registered in the city after the tsunami. The other districts vary between 80 percent and 115 percent GER. The average distance to a junior high school outside the village is 5 km, but students have to cover an average of 16 km in Kab. Aceh Jaya. The distance to SMP and SMP GER are not signifi cantly correlated (Figure 5.12).
Figure 5.12. Junior high school GER and distance to schools per local government, 2005
0
4
8
12
16
20
Ban
da
Ace
h
Nag
an R
aya
Lang
sa
Sim
eulu
e
Lho
kseu
maw
e
Ace
h Ja
ya
Ace
h B
arat
Sab
ang
Ace
h S
elat
an
Pid
ie
Ben
er M
eria
h
Bir e
uen
Ace
h
Ace
h T
eng
ah
Ace
h B
arat
Ace
h T
amia
ng
Ace
h U
tara
Ace
h B
esar
Ace
h S
ing
kil
Ace
h T
imur
Gay
o Lu
es
km
0
40
80
120
160
GE
R
distance GER
Source: Podes 2005, Provincial Education Bureau, and Census.
51 The number of students in school of age group 7–12 (2005) from the education bureau exceeds the number of children of the same age group in the population census.
52 “Rangkuman Data Pendidikan” and “Data Kebutuhan Guru” Dinas Pendidikan Propinsi, Aceh Dalam Angka, and Ministry of National Education.
53 UNESCO Institute for Statistics, “Education Indicators.” 2003

ACEH PUBLIC EXPENDITURE ANALYSISSPENDING FOR RECONSTRUCTION AND POVERTY REDUCTION
SECTORAL ANALYSES WITH RECOMMENDATIONS 73
Public schools are generally preferred because of lower costs, better equipment, and higher quality. However, some public schools have limited enrollment. Fewer than 10 percent of the students go to private schools (Figure 5.13). Public and private schools have the same curriculum, teaching hours, and national test requirements. Private schools are in demand where public schools are not available, where public schools have maximum enrollment levels, and where there are households who can aff ord expensive, better quality education. SMA Anak Bangsa Banda Aceh and SMA Yapena Lhokseumawe are examples of better quality private education. High fees enable hiring quality teachers, and buying good books and quality equipment.
Figure 5.13. Number of students per education level, public vs. private, 2004–05
0 100 200 300 400 500 600
primary school
junior highschool
senior highschool
students ('000)
public
private
Source: Dinas Pendidikan Propinsi.
The new education law No. 19/2005 requires teachers to have a bachelor’s degree, but throughout Aceh only 37 percent of teachers fulfi ll this requirement.54 At primary school level, between 13 percent and 28 percent of teachers fulfi ll this requirement (Table 5.4). Teacher qualifi cations in Aceh are lower than the national average: 55 percent and 73 percent of teachers have the minimum qualifi cations required for primary and junior secondary levels, respectively.55 Teachers at religious schools on average have higher degrees than teachers at nonreligious schools. Although teachers at religious schools have higher levels of educational attainment (58 percent–75 percent vs. 50 percent), Provincial Education Bureau data suggest that student performance on the national tests is similar. Junior high school teachers are more qualifi ed than elementary school teachers. The highest qualifi cations are found at the senior high school level.
Table 5.4. Teacher qualifi cations in Aceh province, 2005–06 (%)
SD MI SMP MTs SMA/MA
Public Private Public Private Public Private Public PrivatePublic + private
D1 44 50 26 34 13 16 5 13 2
D2 37 26 43 26 9 6 3 4 1
D3 6 8 6 12 32 27 19 26 19
Bachelors degree or higher 13 15 25 28 46 51 73 58 77
Total 100 100 100 100 100 100 100 100 100 Source: Provincial Education Bureau NAD.
Teacher absenteeism is relatively high. The GDS, which included 72 teachers in Aceh Utara, Aceh Besar, and Aceh Barat, suggests that 30 percent of the teachers were absent during school time, engaged in tasks outside school, sick, or attending to private business. A study that included 147 schools in Indonesia found that 19 percent of the teachers were absent.56 Quality teaching is further hindered by the poor condition of school buildings. Almost one-quarter (23 percent) of elementary classrooms are classifi ed as heavily damaged and require complete reconstruction. Only 44 percent of elementary classrooms in Aceh are considered in good condition, whereas 33
54 Provincial Education Bureau, NAD.
55 Ministry of National Education, Indonesia: Educational Statistics in Brief 2004/2005.
56 SMERU 2004.
ACEH PUBLIC EXPENDITURE ANALYSISSPENDING FOR RECONSTRUCTION AND POVERTY REDUCTION
SECTORAL ANALYSES WITH RECOMMENDATIONS74
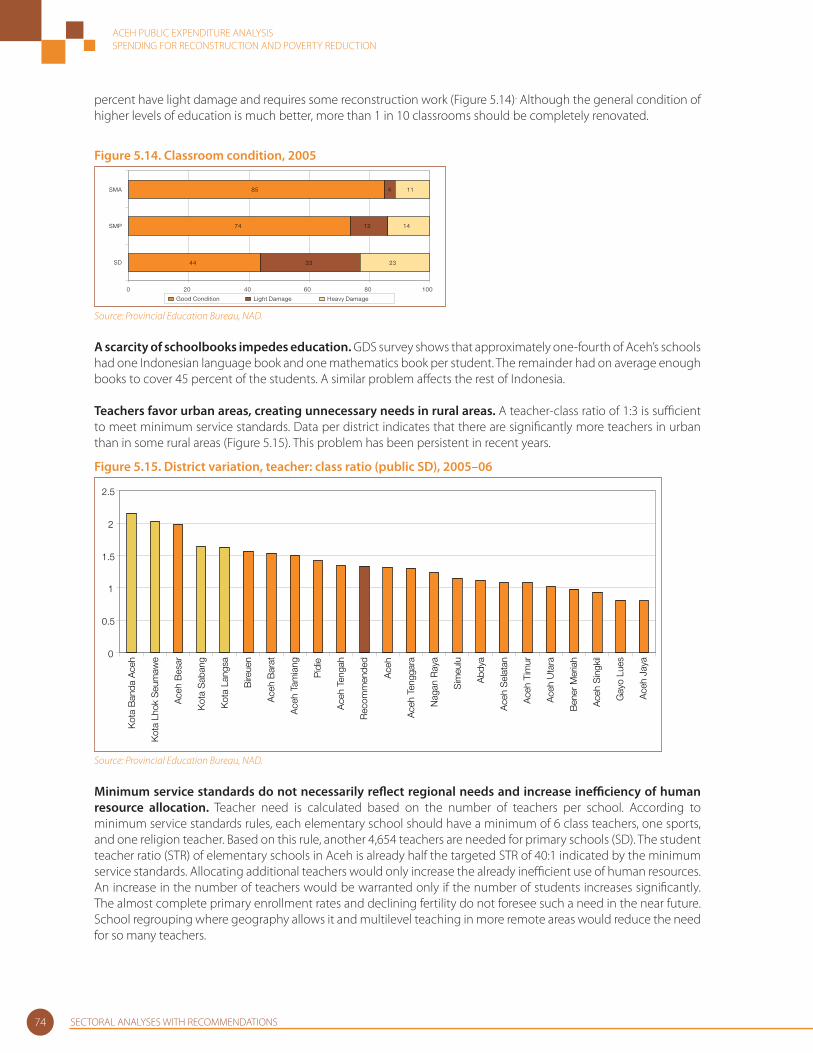
percent have light damage and requires some reconstruction work (Figure 5.14). Although the general condition of higher levels of education is much better, more than 1 in 10 classrooms should be completely renovated.
Figure 5.14. Classroom condition, 2005
44
74
85
33
12
4
23
14
11
0 20 40 60 80 100
SD
SMP
SMA
Good Condition Light Damage Heavy Damage
Source: Provincial Education Bureau, NAD.
A scarcity of schoolbooks impedes education. GDS survey shows that approximately one-fourth of Aceh’s schools had one Indonesian language book and one mathematics book per student. The remainder had on average enough books to cover 45 percent of the students. A similar problem aff ects the rest of Indonesia.
Teachers favor urban areas, creating unnecessary needs in rural areas. A teacher-class ratio of 1:3 is suffi cient to meet minimum service standards. Data per district indicates that there are signifi cantly more teachers in urban than in some rural areas (Figure 5.15). This problem has been persistent in recent years.
Figure 5.15. District variation, teacher: class ratio (public SD), 2005–06
0
0.5
1
1.5
2
2.5
Kot
a B
anda
Ace
h
Kot
a Lh
ok S
eum
awe
Ace
h B
esar
Kot
a S
aban
g
Kot
a La
ngsa
Bire
uen
Ace
h B
arat
Ace
h Ta
mia
ng
Pid
ie
Ace
h Te
ngah
Rec
omm
ende
d
Ace
h
Ace
h Te
ngga
ra
Nag
an R
aya
Sim
eulu
Abd
ya
Ace
h S
elat
an
Ace
h Ti
mur
Ace
h U
tara
Ben
er M
eria
h
Ace
h S
ingk
il
Gay
o Lu
es
Ace
h Ja
ya
Source: Provincial Education Bureau, NAD.
Minimum service standards do not necessarily refl ect regional needs and increase ineffi ciency of human resource allocation. Teacher need is calculated based on the number of teachers per school. According to minimum service standards rules, each elementary school should have a minimum of 6 class teachers, one sports, and one religion teacher. Based on this rule, another 4,654 teachers are needed for primary schools (SD). The student teacher ratio (STR) of elementary schools in Aceh is already half the targeted STR of 40:1 indicated by the minimum service standards. Allocating additional teachers would only increase the already ineffi cient use of human resources. An increase in the number of teachers would be warranted only if the number of students increases signifi cantly. The almost complete primary enrollment rates and declining fertility do not foresee such a need in the near future. School regrouping where geography allows it and multilevel teaching in more remote areas would reduce the need for so many teachers.
ACEH PUBLIC EXPENDITURE ANALYSISSPENDING FOR RECONSTRUCTION AND POVERTY REDUCTION
SECTORAL ANALYSES WITH RECOMMENDATIONS 75
Impact of the confl ict and tsunami on the education system and outcomes
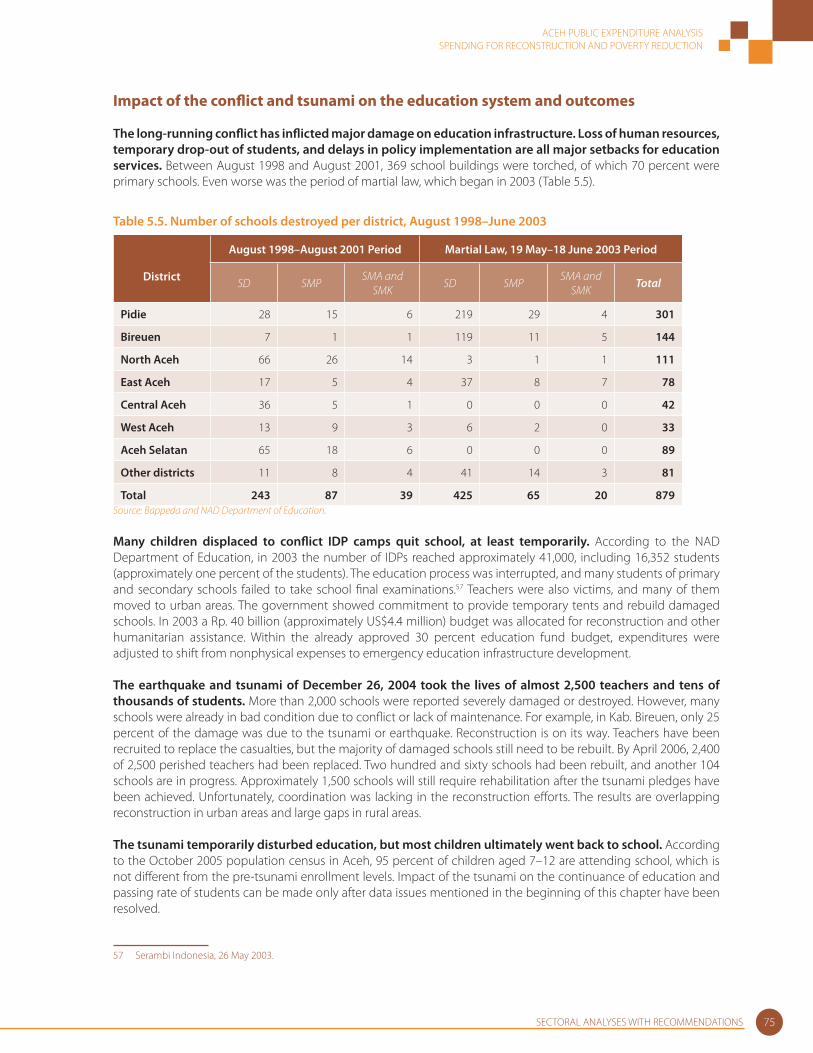
The long-running confl ict has infl icted major damage on education infrastructure. Loss of human resources, temporary drop-out of students, and delays in policy implementation are all major setbacks for education services. Between August 1998 and August 2001, 369 school buildings were torched, of which 70 percent were primary schools. Even worse was the period of martial law, which began in 2003 (Table 5.5).
Table 5.5. Number of schools destroyed per district, August 1998–June 2003
District
August 1998–August 2001 Period Martial Law, 19 May–18 June 2003 Period
SD SMPSMA and
SMKSD SMP
SMA and SMK
Total
Pidie 28 15 6 219 29 4 301
Bireuen 7 1 1 119 11 5 144
North Aceh 66 26 14 3 1 1 111
East Aceh 17 5 4 37 8 7 78
Central Aceh 36 5 1 0 0 0 42
West Aceh 13 9 3 6 2 0 33
Aceh Selatan 65 18 6 0 0 0 89
Other districts 11 8 4 41 14 3 81
Total 243 87 39 425 65 20 879Source: Bappeda and NAD Department of Education.
Many children displaced to confl ict IDP camps quit school, at least temporarily. According to the NAD Department of Education, in 2003 the number of IDPs reached approximately 41,000, including 16,352 students (approximately one percent of the students). The education process was interrupted, and many students of primary and secondary schools failed to take school fi nal examinations.57 Teachers were also victims, and many of them moved to urban areas. The government showed commitment to provide temporary tents and rebuild damaged schools. In 2003 a Rp. 40 billion (approximately US$4.4 million) budget was allocated for reconstruction and other humanitarian assistance. Within the already approved 30 percent education fund budget, expenditures were adjusted to shift from nonphysical expenses to emergency education infrastructure development.
The earthquake and tsunami of December 26, 2004 took the lives of almost 2,500 teachers and tens of thousands of students. More than 2,000 schools were reported severely damaged or destroyed. However, many schools were already in bad condition due to confl ict or lack of maintenance. For example, in Kab. Bireuen, only 25 percent of the damage was due to the tsunami or earthquake. Reconstruction is on its way. Teachers have been recruited to replace the casualties, but the majority of damaged schools still need to be rebuilt. By April 2006, 2,400 of 2,500 perished teachers had been replaced. Two hundred and sixty schools had been rebuilt, and another 104 schools are in progress. Approximately 1,500 schools will still require rehabilitation after the tsunami pledges have been achieved. Unfortunately, coordination was lacking in the reconstruction eff orts. The results are overlapping reconstruction in urban areas and large gaps in rural areas.
The tsunami temporarily disturbed education, but most children ultimately went back to school. According to the October 2005 population census in Aceh, 95 percent of children aged 7–12 are attending school, which is not diff erent from the pre-tsunami enrollment levels. Impact of the tsunami on the continuance of education and passing rate of students can be made only after data issues mentioned in the beginning of this chapter have been resolved.
57 Serambi Indonesia, 26 May 2003.

ACEH PUBLIC EXPENDITURE ANALYSISSPENDING FOR RECONSTRUCTION AND POVERTY REDUCTION
SECTORAL ANALYSES WITH RECOMMENDATIONS76
Young children aged 0-4 were disproportionately casualties to the tsunami, which will cause a shift in student distribution. A basic comparison of the population census of 2005 with the population projection of 2005 indicates a 7 percent reduction in the number of children in the age group of 0–4 years, and a 3 percent reduction in the age group of 5–9 years. This means that approximately 40,000 pupils fewer than initially planned will go to primary education during the next four years. Comparison of new student enrollment numbers with projections from before the tsunami shows the decline in enrollment; 114,410 new students vs. the predicted 126,510.58 Thus, decreasing class sizes initially for SD and later for SMP need to be expected. The generous amount of funds allocated to the education sector after the tsunami can be used for programs to improve the quality of teaching and leave a legacy of better quality education in Aceh.
Spending on Education vs. Quality of Education and Education Outcomes
Education expenditures in Aceh include those by central government (APBN), regional governments (APBD I + II), and private households. In 2005 they totaled Rp. 8 trillion. Public education expenditures, if not defi ned diff erently, include expenses by the religious and culture bureaus. Local governments are the biggest spenders with approximately Rp. 1.2 trillion or 46 percent of total expenses. They are followed by Rp. 655 billion of central spending (APBN and BOS contribute to 24 percent of spending). Private contributions from households should not be neglected; they contributed Rp. 340 billion to total education spending (Figure 5.16).
Figure 5.16. Composition of education expenditures in Aceh, 2005 (%)
21
3
13
1746
APBN
BOS
APBD (P rov)
APBD (LG)
Private household expenditu res (2004)
Source: SIKD MoF, BOS MoNE, and SUSENAS 2004.
Private expenditures contribute signifi cantly to total education expenditures. Extrapolating adjusted 2004 SUSENAS to 2005 suggests that private contributions to education add another Rp. 340 billion to education spending. Analysis of the Governance and Decentralization Survey data shows that private spending for junior and senior high school goes primarily to books, writing materials, and transport when necessary, whereas enrollment and monthly fees seem to take a smaller share of spending.
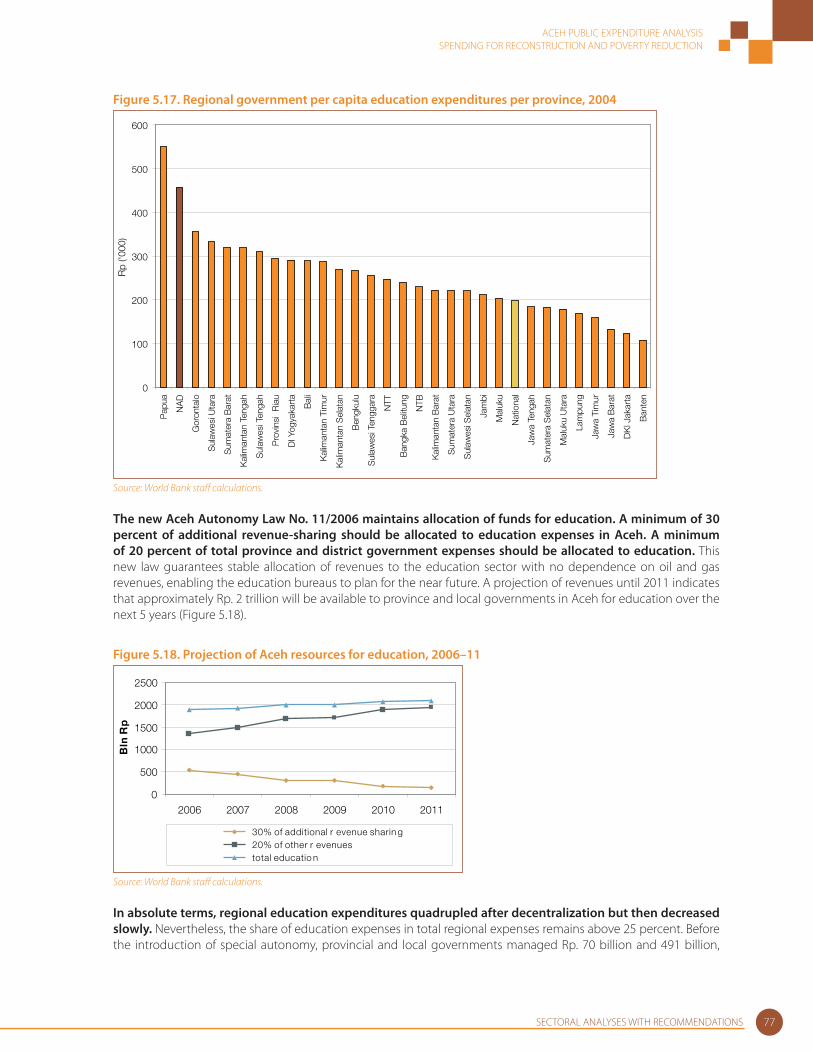
Aceh has the second highest per capita education expenditures of all provinces in Indonesia. Together with Papua, Aceh province spends signifi cantly more on education relative to its population than all other provinces in Indonesia. A per capita spending of Rp. 457,000 is more than twice the national average of Rp. 198,000 (Figure 5.17).
58 Provincial Education Bureau, 2005.
ACEH PUBLIC EXPENDITURE ANALYSISSPENDING FOR RECONSTRUCTION AND POVERTY REDUCTION
SECTORAL ANALYSES WITH RECOMMENDATIONS 77
Figure 5.17. Regional government per capita education expenditures per province, 2004
0
100
200
300
400
500
600
Pap
ua
NA
D
Gor
onta
lo
Sul
awes
i Uta
ra
Sum
ater
a B
arat
Kal
iman
tan
Teng
ah
Sul
awes
i Ten
gah
Pro
vins
i R
iau
DI Y
ogya
kart
a
Bal
i
Kal
iman
tan
Tim
ur
Kal
iman
tan
Sel
atan
Ben
gkul
u
Sul
awes
i Ten
ggar
a
NTT
Ban
gka
Bel
itung
NTB
Kal
iman
tan
Bar
at
Sum
ater
a U
tara
Sul
awes
i Sel
atan
Jam
bi
Mal
uku
Nat
iona
l
Jaw
a Te
ngah
Sum
ater
a S
elat
an
Mal
uku
Uta
ra
Lam
pung
Jaw
a Ti
mur
Jaw
a B
arat
DK
I Jak
arta
Ban
ten
Rp
('000
)
Source: World Bank staff calculations.
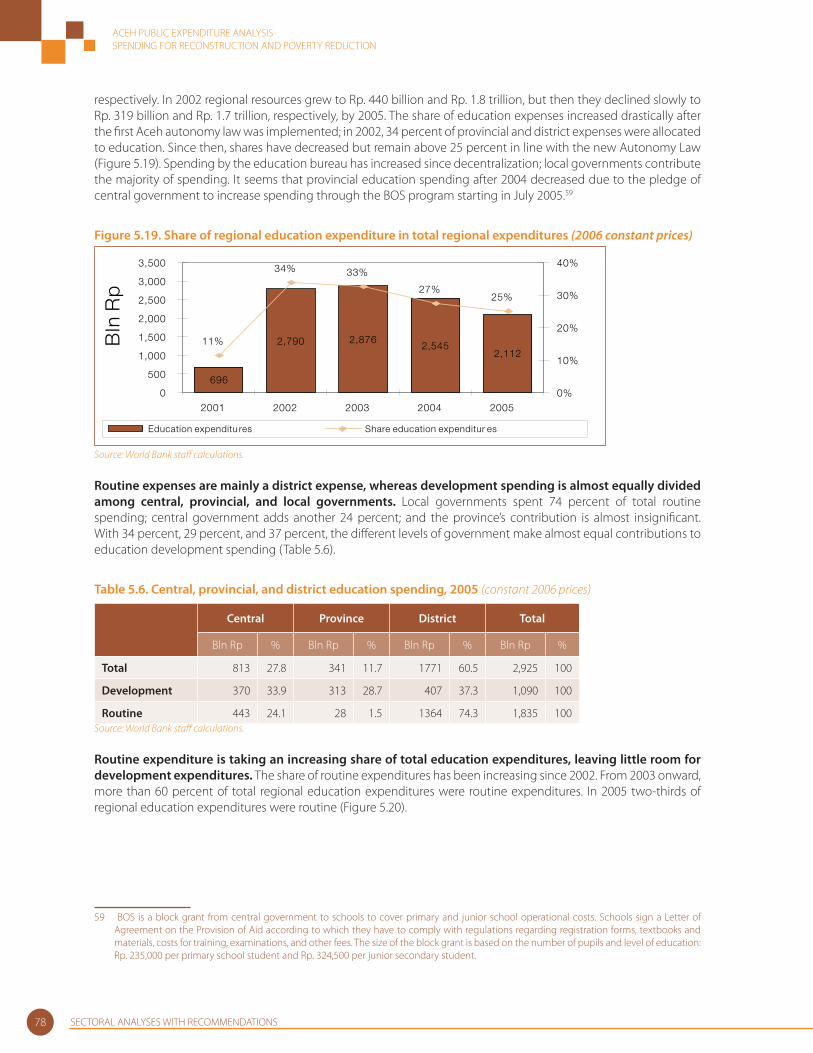
The new Aceh Autonomy Law No. 11/2006 maintains allocation of funds for education. A minimum of 30 percent of additional revenue-sharing should be allocated to education expenses in Aceh. A minimum of 20 percent of total province and district government expenses should be allocated to education. This new law guarantees stable allocation of revenues to the education sector with no dependence on oil and gas revenues, enabling the education bureaus to plan for the near future. A projection of revenues until 2011 indicates that approximately Rp. 2 trillion will be available to province and local governments in Aceh for education over the next 5 years (Figure 5.18).
Figure 5.18. Projection of Aceh resources for education, 2006–11
0
500
1000
1500
2000
2500
2006 2007 2008 2009 2010 2011
Bln
Rp
30% of additional r evenue sharin g20% of other r evenuestotal educatio n
Source: World Bank staff calculations.
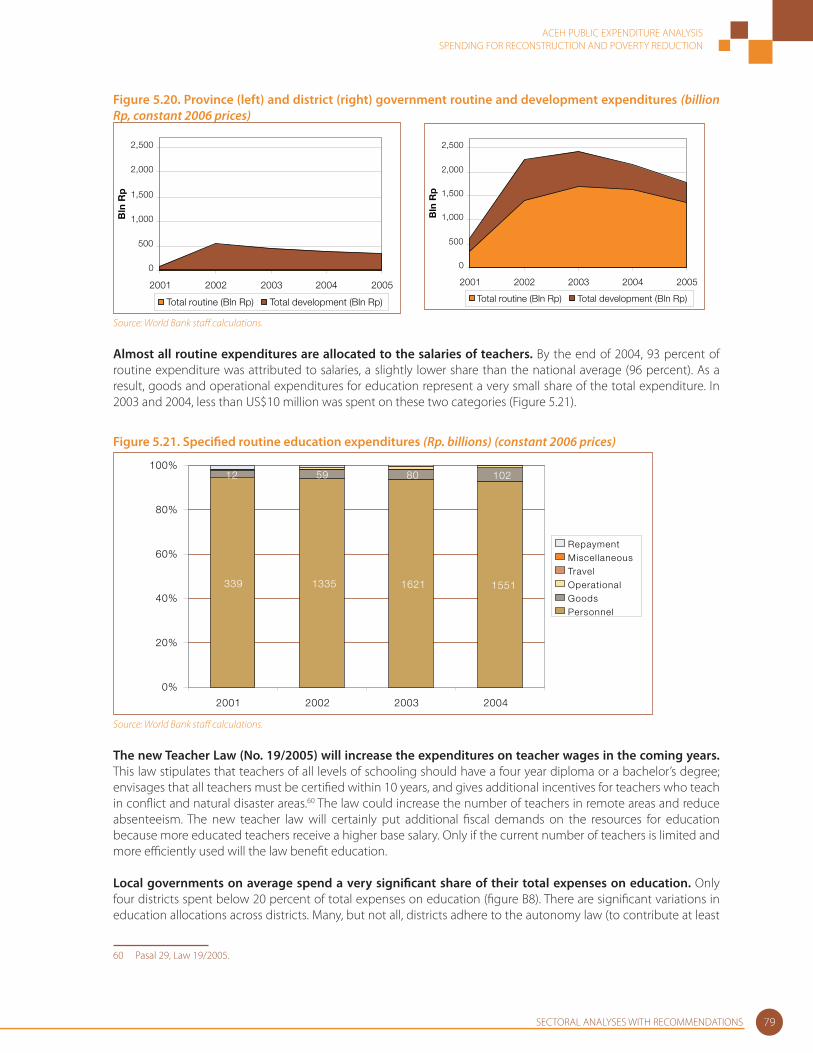
In absolute terms, regional education expenditures quadrupled after decentralization but then decreased slowly. Nevertheless, the share of education expenses in total regional expenses remains above 25 percent. Before the introduction of special autonomy, provincial and local governments managed Rp. 70 billion and 491 billion,
ACEH PUBLIC EXPENDITURE ANALYSISSPENDING FOR RECONSTRUCTION AND POVERTY REDUCTION
SECTORAL ANALYSES WITH RECOMMENDATIONS78
respectively. In 2002 regional resources grew to Rp. 440 billion and Rp. 1.8 trillion, but then they declined slowly to Rp. 319 billion and Rp. 1.7 trillion, respectively, by 2005. The share of education expenses increased drastically after the fi rst Aceh autonomy law was implemented; in 2002, 34 percent of provincial and district expenses were allocated to education. Since then, shares have decreased but remain above 25 percent in line with the new Autonomy Law (Figure 5.19). Spending by the education bureau has increased since decentralization; local governments contribute the majority of spending. It seems that provincial education spending after 2004 decreased due to the pledge of central government to increase spending through the BOS program starting in July 2005.59
Figure 5.19. Share of regional education expenditure in total regional expenditures (2006 constant prices)
696
2,790 2,8762,545
2,11211%
34% 33%
27%25%
0
500
1,000
1,500
2,000
2,500
3,000
3,500
2001 2002 2003 2004 2005
Bln
Rp
0%
10%
20%
30%
40%
Education expenditu res Share education expenditur es
Source: World Bank staff calculations.
Routine expenses are mainly a district expense, whereas development spending is almost equally divided among central, provincial, and local governments. Local governments spent 74 percent of total routine spending; central government adds another 24 percent; and the province’s contribution is almost insignifi cant. With 34 percent, 29 percent, and 37 percent, the diff erent levels of government make almost equal contributions to education development spending (Table 5.6).
Table 5.6. Central, provincial, and district education spending, 2005 (constant 2006 prices)
Central Province District Total
Bln Rp % Bln Rp % Bln Rp % Bln Rp %
Total 813 27.8 341 11.7 1771 60.5 2,925 100
Development 370 33.9 313 28.7 407 37.3 1,090 100
Routine 443 24.1 28 1.5 1364 74.3 1,835 100Source: World Bank staff calculations.
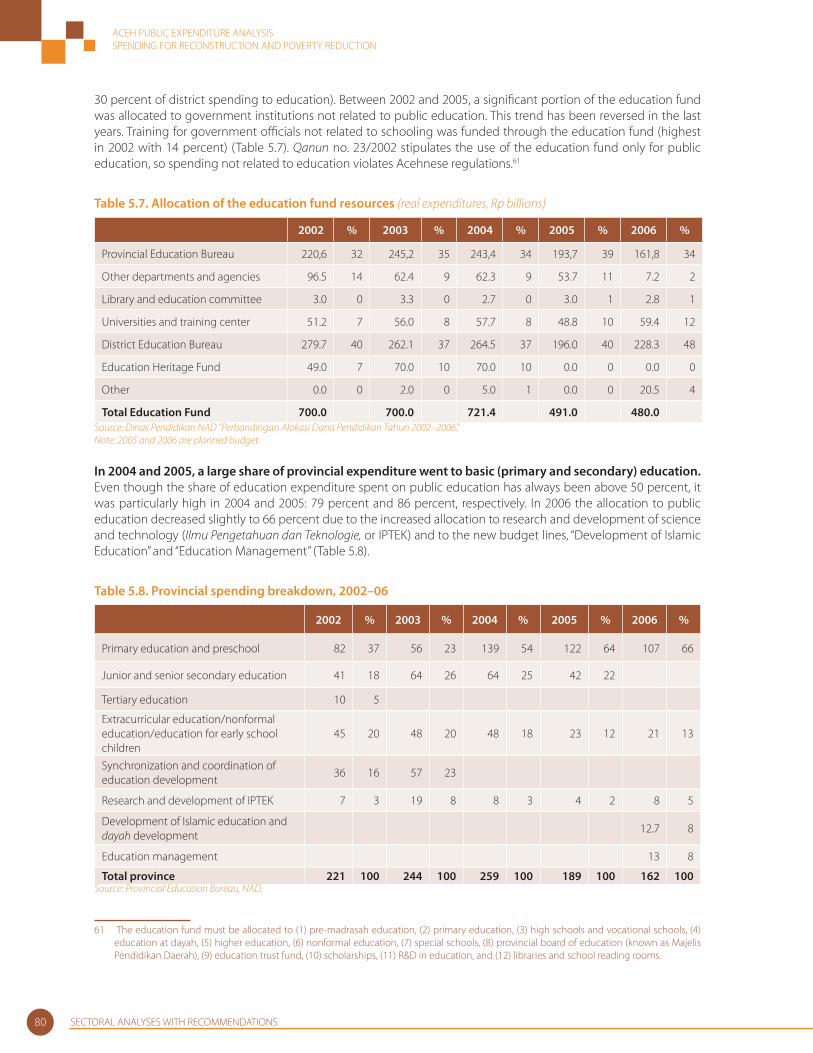
Routine expenditure is taking an increasing share of total education expenditures, leaving little room for development expenditures. The share of routine expenditures has been increasing since 2002. From 2003 onward, more than 60 percent of total regional education expenditures were routine expenditures. In 2005 two-thirds of regional education expenditures were routine (Figure 5.20).
59 BOS is a block grant from central government to schools to cover primary and junior school operational costs. Schools sign a Letter of Agreement on the Provision of Aid according to which they have to comply with regulations regarding registration forms, textbooks and materials, costs for training, examinations, and other fees. The size of the block grant is based on the number of pupils and level of education: Rp. 235,000 per primary school student and Rp. 324,500 per junior secondary student.
ACEH PUBLIC EXPENDITURE ANALYSISSPENDING FOR RECONSTRUCTION AND POVERTY REDUCTION
SECTORAL ANALYSES WITH RECOMMENDATIONS 79
Figure 5.20. Province (left) and district (right) government routine and development expenditures (billion Rp, constant 2006 prices)
0
500
1,000
1,500
2,000
2,500
2001 2002 2003 2004 2005
Bln
Rp
Total routine (Bln Rp) Total development (Bln Rp)
0
500
1,000
1,500
2,000
2,500
2001 2002 2003 2004 2005
Bln
Rp
Total routine (Bln Rp) Total development (Bln Rp)
Source: World Bank staff calculations.
Almost all routine expenditures are allocated to the salaries of teachers. By the end of 2004, 93 percent of routine expenditure was attributed to salaries, a slightly lower share than the national average (96 percent). As a result, goods and operational expenditures for education represent a very small share of the total expenditure. In 2003 and 2004, less than US$10 million was spent on these two categories (Figure 5.21).
Figure 5.21. Specifi ed routine education expenditures (Rp. billions) (constant 2006 prices)
339 1335 1621 1551
12 59 80 102
0%
20%
40%
60%
80%
100%
2001 2002 2003 2004
RepaymentMiscellaneousTravelOperationalGoodsPersonnel
Source: World Bank staff calculations.
The new Teacher Law (No. 19/2005) will increase the expenditures on teacher wages in the coming years. This law stipulates that teachers of all levels of schooling should have a four year diploma or a bachelor’s degree; envisages that all teachers must be certifi ed within 10 years, and gives additional incentives for teachers who teach in confl ict and natural disaster areas.60 The law could increase the number of teachers in remote areas and reduce absenteeism. The new teacher law will certainly put additional fi scal demands on the resources for education because more educated teachers receive a higher base salary. Only if the current number of teachers is limited and more effi ciently used will the law benefi t education. Local governments on average spend a very signifi cant share of their total expenses on education. Only four districts spent below 20 percent of total expenses on education (fi gure B8). There are signifi cant variations in education allocations across districts. Many, but not all, districts adhere to the autonomy law (to contribute at least
60 Pasal 29, Law 19/2005.
ACEH PUBLIC EXPENDITURE ANALYSISSPENDING FOR RECONSTRUCTION AND POVERTY REDUCTION
SECTORAL ANALYSES WITH RECOMMENDATIONS80
30 percent of district spending to education). Between 2002 and 2005, a signifi cant portion of the education fund was allocated to government institutions not related to public education. This trend has been reversed in the last years. Training for government offi cials not related to schooling was funded through the education fund (highest in 2002 with 14 percent) (Table 5.7). Qanun no. 23/2002 stipulates the use of the education fund only for public education, so spending not related to education violates Acehnese regulations.61
Table 5.7. Allocation of the education fund resources (real expenditures, Rp billions)
2002 % 2003 % 2004 % 2005 % 2006 %
Provincial Education Bureau 220,6 32 245,2 35 243,4 34 193,7 39 161,8 34
Other departments and agencies 96.5 14 62.4 9 62.3 9 53.7 11 7.2 2
Library and education committee 3.0 0 3.3 0 2.7 0 3.0 1 2.8 1
Universities and training center 51.2 7 56.0 8 57.7 8 48.8 10 59.4 12
District Education Bureau 279.7 40 262.1 37 264.5 37 196.0 40 228.3 48
Education Heritage Fund 49.0 7 70.0 10 70.0 10 0.0 0 0.0 0
Other 0.0 0 2.0 0 5.0 1 0.0 0 20.5 4
Total Education Fund 700.0 700.0 721.4 491.0 480.0Source: Dinas Pendidikan NAD ”Perbandingan Alokasi Dana Pendidikan Tahun 2002–2006.” Note: 2005 and 2006 are planned budget.
In 2004 and 2005, a large share of provincial expenditure went to basic (primary and secondary) education. Even though the share of education expenditure spent on public education has always been above 50 percent, it was particularly high in 2004 and 2005: 79 percent and 86 percent, respectively. In 2006 the allocation to public education decreased slightly to 66 percent due to the increased allocation to research and development of science and technology (Ilmu Pengetahuan dan Teknologie, or IPTEK) and to the new budget lines, “Development of Islamic Education” and “Education Management” (Table 5.8).
Table 5.8. Provincial spending breakdown, 2002–06
2002 % 2003 % 2004 % 2005 % 2006 %
Primary education and preschool 82 37 56 23 139 54 122 64 107 66
Junior and senior secondary education 41 18 64 26 64 25 42 22
Tertiary education 10 5
Extracurricular education/nonformal education/education for early school children
45 20 48 20 48 18 23 12 21 13
Synchronization and coordination of education development
36 16 57 23
Research and development of IPTEK 7 3 19 8 8 3 4 2 8 5
Development of Islamic education and dayah development
12.7 8
Education management 13 8
Total province 221 100 244 100 259 100 189 100 162 100Source: Provincial Education Bureau, NAD.
61 The education fund must be allocated to (1) pre-madrasah education, (2) primary education, (3) high schools and vocational schools, (4) education at dayah, (5) higher education, (6) nonformal education, (7) special schools, (8) provincial board of education (known as Majelis Pendidikan Daerah), (9) education trust fund, (10) scholarships, (11) R&D in education, and (12) libraries and school reading rooms.
ACEH PUBLIC EXPENDITURE ANALYSISSPENDING FOR RECONSTRUCTION AND POVERTY REDUCTION
SECTORAL ANALYSES WITH RECOMMENDATIONS 81
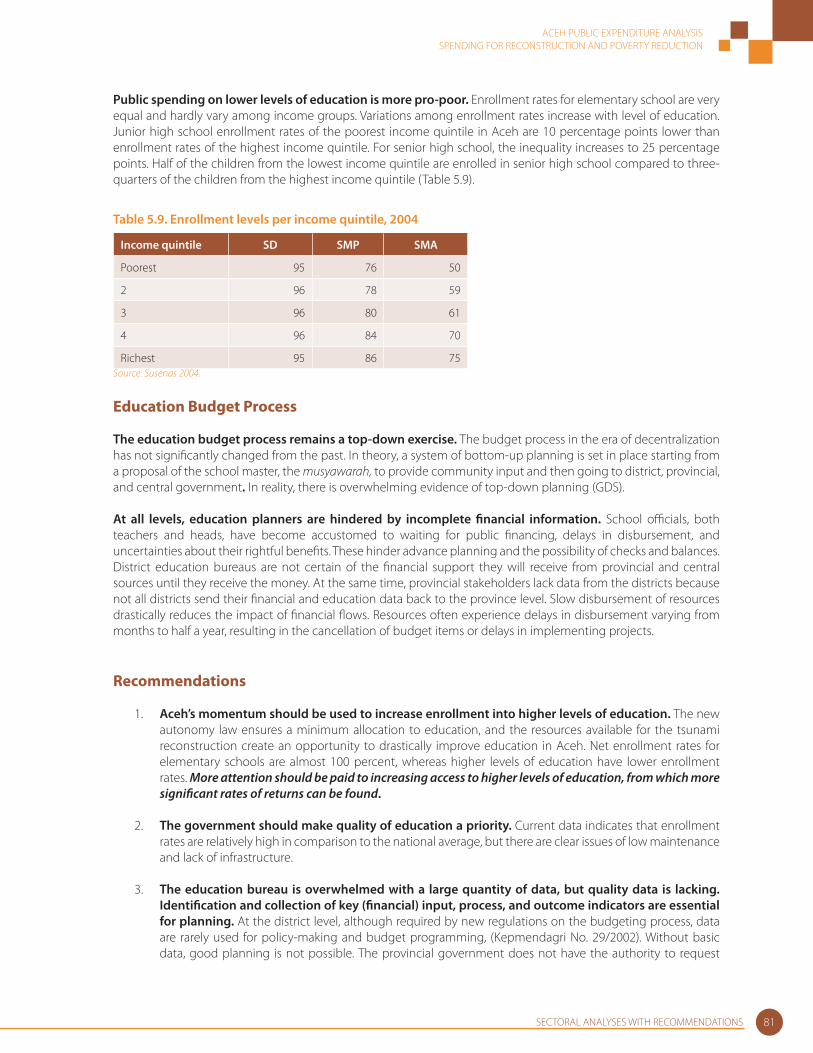
Public spending on lower levels of education is more pro-poor. Enrollment rates for elementary school are very equal and hardly vary among income groups. Variations among enrollment rates increase with level of education. Junior high school enrollment rates of the poorest income quintile in Aceh are 10 percentage points lower than enrollment rates of the highest income quintile. For senior high school, the inequality increases to 25 percentage points. Half of the children from the lowest income quintile are enrolled in senior high school compared to three-quarters of the children from the highest income quintile (Table 5.9).
Table 5.9. Enrollment levels per income quintile, 2004
Income quintile SD SMP SMA
Poorest 95 76 50
2 96 78 59
3 96 80 61
4 96 84 70
Richest 95 86 75 Source: Susenas 2004.
Education Budget Process
The education budget process remains a top-down exercise. The budget process in the era of decentralization has not signifi cantly changed from the past. In theory, a system of bottom-up planning is set in place starting from a proposal of the school master, the musyawarah, to provide community input and then going to district, provincial, and central government. In reality, there is overwhelming evidence of top-down planning (GDS).
At all levels, education planners are hindered by incomplete fi nancial information. School offi cials, both teachers and heads, have become accustomed to waiting for public fi nancing, delays in disbursement, and uncertainties about their rightful benefi ts. These hinder advance planning and the possibility of checks and balances. District education bureaus are not certain of the fi nancial support they will receive from provincial and central sources until they receive the money. At the same time, provincial stakeholders lack data from the districts because not all districts send their fi nancial and education data back to the province level. Slow disbursement of resources drastically reduces the impact of fi nancial fl ows. Resources often experience delays in disbursement varying from months to half a year, resulting in the cancellation of budget items or delays in implementing projects.
Recommendations
1. Aceh’s momentum should be used to increase enrollment into higher levels of education. The new autonomy law ensures a minimum allocation to education, and the resources available for the tsunami reconstruction create an opportunity to drastically improve education in Aceh. Net enrollment rates for elementary schools are almost 100 percent, whereas higher levels of education have lower enrollment rates. More attention should be paid to increasing access to higher levels of education, from which more signifi cant rates of returns can be found.
2. The government should make quality of education a priority. Current data indicates that enrollment rates are relatively high in comparison to the national average, but there are clear issues of low maintenance and lack of infrastructure.
3. The education bureau is overwhelmed with a large quantity of data, but quality data is lacking. Identifi cation and collection of key (fi nancial) input, process, and outcome indicators are essential for planning. At the district level, although required by new regulations on the budgeting process, data are rarely used for policy-making and budget programming, (Kepmendagri No. 29/2002). Without basic data, good planning is not possible. The provincial government does not have the authority to request
ACEH PUBLIC EXPENDITURE ANALYSISSPENDING FOR RECONSTRUCTION AND POVERTY REDUCTION
SECTORAL ANALYSES WITH RECOMMENDATIONS82
information from local governments. Thus, reports from local governments to the provincial government are rare and of poor quality, an issue that clearly aff ects the quality of provincial reports. The implementation of the “one-roof” education system, in which both nonreligious and religious education will fall under the education bureau from 2008, provides an opportunity to improve data collection and evidence-based policy-making.
4. Education budget planning and programming should be based on performance indicators, not on minimum education service standards. Minimum service standards should refl ect district needs and be feasible both practically and fi nancially. The intention to comply with the “9 teachers per school” regulation would further reduce the student-teacher ratio, putting additional fi nancial burdens on the system without improving effi ciency. The “9 teachers” rule also would limit the fl exibility of local governments to provide other solutions to education supply problems. Solutions could include regrouping exercises in urban areas and multi-level teaching in rural areas.
5. To ensure equal distribution of teachers, the civil servant staffi ng policies must be reevaluated. Although the education bureau is aware of the clearly uneven distribution of teachers between urban and rural areas, it has made no real attempts to redistribute teachers. In theory, the new teacher law increases incentives to teach in remote and confl ict areas. However, in reality rural areas continue to suff er from a lack of qualifi ed teachers.
6. More resources should be allocated for maintenance. The share of education resources spent on maintenance is insignifi cant in comparison to the share spent on teachers’ salaries. The new teacher law is likely to result in an increasing share of expenditure going to teachers’ salaries.
7. In reality, spending authority remains with the center. The BOS program has increased central authority. A large share of district education expenditure, such as fi nancial resources from DAK, is already earmarked, and the province and district governments do not have the authority to use the money for what they deem necessary. Bottom-up planning in education with greater participation from all stakeholders, including parents, school committees, and local governments should be promoted.
8. Timely disbursement of fi nancial resources and early and accurate information about volume and time of disbursement are essential. District planners should have timely information about the amount of education resources available to them so that they can use the resources effi ciently.
Infrastructure
Even prior to the tsunami of December 2004, Aceh’s infrastructure was in poor condition because of a lack of public and private investment. The natural disaster crippled an already deteriorating sector. Aceh’s inadequate power, water and sanitation, and transportation infrastructure prior to the disaster highlights the lack of economic development in a resource-rich region.
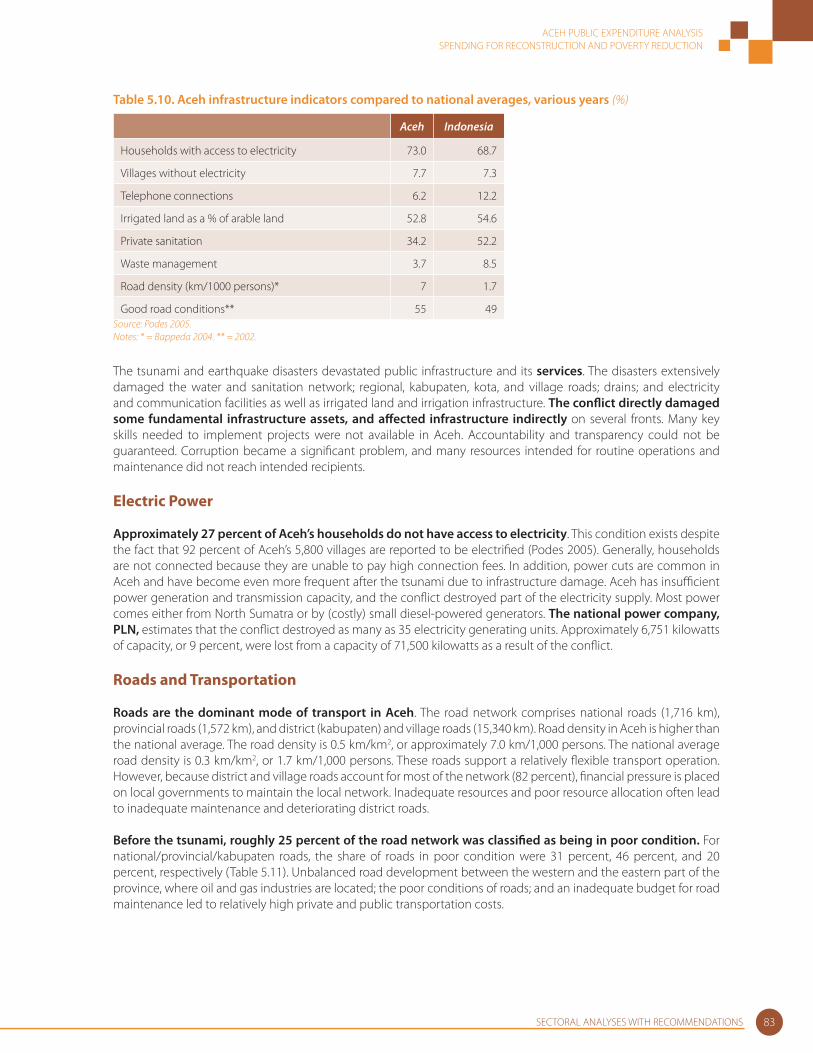
Apart from major investments in industries including oil and gas, natural fertilizer, and cement, the private sector has made little direct investment by in infrastructure. Regional government was and is the major investor in infrastructure development. The volume of regional infrastructure spending in real terms has increased from Rp. 452 billion in 1999 to Rp. 1,188 billion in 2002. Infrastructure development in Aceh is behind national levels on many fronts. The number of villages with electricity and households with telephone connections or private sanitation and waste management all fall below the national average. On the other hand, electrifi cation rates and road density are signifi cantly higher than the national average (Table 5.10).
ACEH PUBLIC EXPENDITURE ANALYSISSPENDING FOR RECONSTRUCTION AND POVERTY REDUCTION
SECTORAL ANALYSES WITH RECOMMENDATIONS 83
Table 5.10. Aceh infrastructure indicators compared to national averages, various years (%)
Aceh Indonesia
Households with access to electricity 73.0 68.7
Villages without electricity 7.7 7.3
Telephone connections 6.2 12.2
Irrigated land as a % of arable land 52.8 54.6
Private sanitation 34.2 52.2
Waste management 3.7 8.5
Road density (km/1000 persons)* 7 1.7
Good road conditions** 55 49Source: Podes 2005.Notes: * = Bappeda 2004. ** = 2002.
The tsunami and earthquake disasters devastated public infrastructure and its services. The disasters extensively damaged the water and sanitation network; regional, kabupaten, kota, and village roads; drains; and electricity and communication facilities as well as irrigated land and irrigation infrastructure. The confl ict directly damaged some fundamental infrastructure assets, and aff ected infrastructure indirectly on several fronts. Many key skills needed to implement projects were not available in Aceh. Accountability and transparency could not be guaranteed. Corruption became a signifi cant problem, and many resources intended for routine operations and maintenance did not reach intended recipients.
Electric Power
Approximately 27 percent of Aceh’s households do not have access to electricity. This condition exists despite the fact that 92 percent of Aceh’s 5,800 villages are reported to be electrifi ed (Podes 2005). Generally, households are not connected because they are unable to pay high connection fees. In addition, power cuts are common in Aceh and have become even more frequent after the tsunami due to infrastructure damage. Aceh has insuffi cient power generation and transmission capacity, and the confl ict destroyed part of the electricity supply. Most power comes either from North Sumatra or by (costly) small diesel-powered generators. The national power company, PLN, estimates that the confl ict destroyed as many as 35 electricity generating units. Approximately 6,751 kilowatts of capacity, or 9 percent, were lost from a capacity of 71,500 kilowatts as a result of the confl ict.
Roads and Transportation
Roads are the dominant mode of transport in Aceh. The road network comprises national roads (1,716 km), provincial roads (1,572 km), and district (kabupaten) and village roads (15,340 km). Road density in Aceh is higher than the national average. The road density is 0.5 km/km2, or approximately 7.0 km/1,000 persons. The national average road density is 0.3 km/km2, or 1.7 km/1,000 persons. These roads support a relatively fl exible transport operation. However, because district and village roads account for most of the network (82 percent), fi nancial pressure is placed on local governments to maintain the local network. Inadequate resources and poor resource allocation often lead to inadequate maintenance and deteriorating district roads.
Before the tsunami, roughly 25 percent of the road network was classifi ed as being in poor condition. For national/provincial/kabupaten roads, the share of roads in poor condition were 31 percent, 46 percent, and 20 percent, respectively (Table 5.11). Unbalanced road development between the western and the eastern part of the province, where oil and gas industries are located; the poor conditions of roads; and an inadequate budget for road maintenance led to relatively high private and public transportation costs.

ACEH PUBLIC EXPENDITURE ANALYSISSPENDING FOR RECONSTRUCTION AND POVERTY REDUCTION
SECTORAL ANALYSES WITH RECOMMENDATIONS84
Table 5.11. Road network in Aceh, 2004
Type of roadGood conditon Fair condition Poor condition Total length
km % km % km % km %
National 127 7.4 1,052 61.3 538 31.3 1,716.27 100
Provincial 199 12.6 646 41.1 727 46.2 1,571.66 100
Kabupaten 2,995 19.5 9,410 61.3 2995 19.5 15,339.37 100
Total 3,320 17.8 11,108 59.4 4259 22.8 18,687.30 100
Source: BAPPEDA.
The transport sector sustained signifi cant damage as a result of the tsunami. The west coast road linking Banda Aceh with Meulaboh (250 km) suff ered the greatest damage. In Banda Aceh alone, 380 km of secondary urban roads were severely damaged. In total, almost 3,000 km of road was classifi ed as impassable. On the east coast, the tsunami had less of an impact. However, the trucks and heavy traffi c volumes to bring in materials and supplies for the reconstruction have put increasing pressure on road conditions.
Irrigation
The confl ict damaged the irrigation system. Prior to the tsunami, Aceh had approximately 465,000 ha of arable land62 of which almost 267,000 ha (60 percent) was incorporated in irrigation schemes. Seventy percent of irrigation projects are medium to large scale. Only 25 percent are covered by small to medium schemes (150–500 ha), and fi ve percent small to very small schemes (<150 ha). The ratio of irrigated land to arable land in Aceh is slightly higher than the nation-wide average. Irrigation networks and water sources were destroyed by the fi ghting. Some irrigation canals were intentionally damaged to cause fl ooding and destruction of agricultural land. Irrigation maintenance, rehabilitation, and upgrade activities had to be suspended due to security concerns. Irrigation land and other arable land were severely aff ected by the tsunami. Apart from the loss of standing crops and livestock, losses also resulted from sediment deposits, seawater inundation, salinity, damage to irrigation and drainage infrastructure, and farm roads. The precise scale of losses (land area aff ected and reduced productivity) and level of recovery are unknown and diffi cult to determine.
Aceh falls behind other provinces in implementing irrigation reforms such as transferring responsibility to local Water Users Association (WUAs). Traditional water user groups (Keujruen Blang) are responsible for determining the planting period and planting pattern; and managing water use in the irrigation network. According to the Water Resources Service of Aceh, at least 1,125 WUAs have been formed. However, the level of responsibility that the government has transferred to these groups is uncertain.
Water and Sanitation
Prior to the tsunami, access to formal water and sanitation services in Aceh was low. Only 9 percent of households were connected to PDAM’s (local water supply enterprise) piped water supply, compared to the national average of 17 percent.63 Most people obtained water from wells constructed either with their own funds, or by communities/villages with access to project fi nancing. During the confl ict years, many households obtained water from military tankers. All urban and rural sanitation in Aceh is on-site, mainly in the form of septic tanks and pit latrines, which often are constructed adjacent to wells. Prior to the tsunami, Aceh had limited sludge collection, no waste water treatment, and no urban sewerage in Aceh. This is consistent with the rest of Indonesia, in which only an estimated 1 percent of the population is connected to a sewerage system.64
62 Includes irrigated and nonirrigated cultivated land but excludes swamps.
63 Plummer, 2005
64 ibid
ACEH PUBLIC EXPENDITURE ANALYSISSPENDING FOR RECONSTRUCTION AND POVERTY REDUCTION
SECTORAL ANALYSES WITH RECOMMENDATIONS 85
Aceh’s already inadequate water and sanitation network, including treatment installations, the piping network, water tankers, and water wells were extensively damaged by the tsunami and earthquake. The tsunami alone destroyed almost 17,000 of the 28,000 pipe connections available in Banda Aceh district. The only sludge treatment plant of Banda Aceh was destroyed. The local level drainage was rendered ineff ective because of earthquake-induced land settlement. The majority of the shallow wells and aquifers which were the main source of water to the local population became contaminated and saline.
Infrastructure Spending
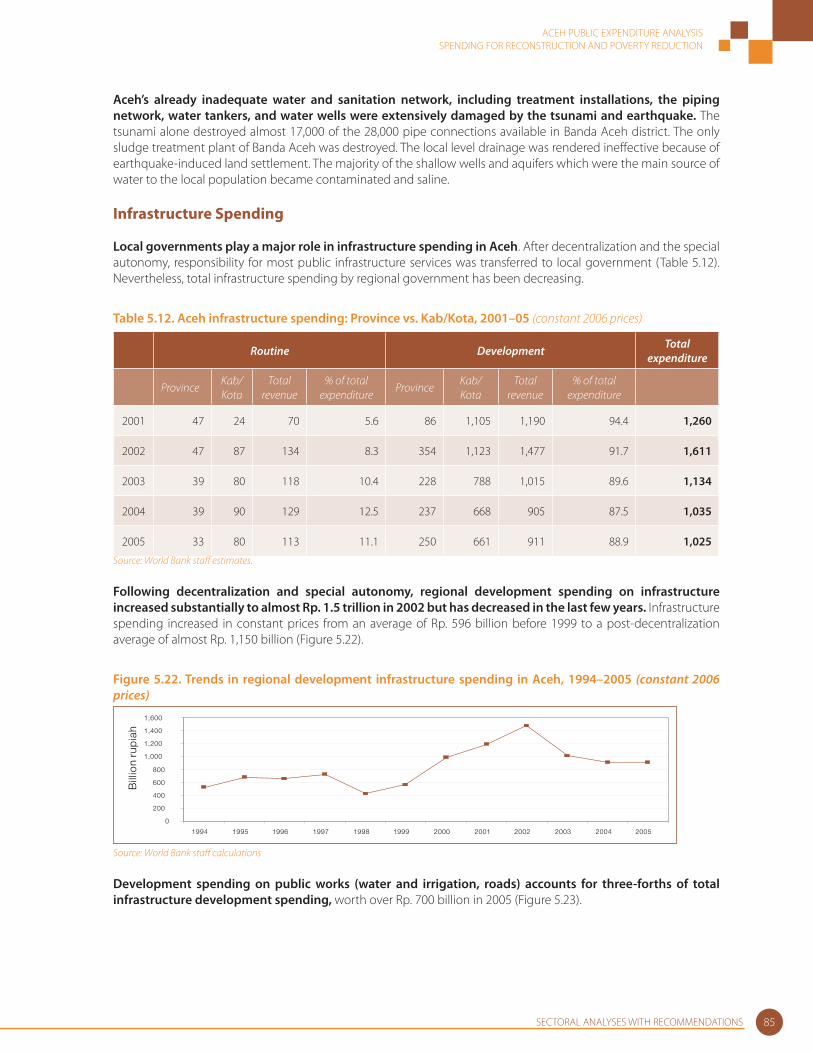
Local governments play a major role in infrastructure spending in Aceh. After decentralization and the special autonomy, responsibility for most public infrastructure services was transferred to local government (Table 5.12). Nevertheless, total infrastructure spending by regional government has been decreasing.
Table 5.12. Aceh infrastructure spending: Province vs. Kab/Kota, 2001–05 (constant 2006 prices)
Routine Development Total expenditure
ProvinceKab/Kota
Total revenue
% of total expenditure
ProvinceKab/Kota
Total revenue
% of total expenditure
2001 47 24 70 5.6 86 1,105 1,190 94.4 1,260
2002 47 87 134 8.3 354 1,123 1,477 91.7 1,611
2003 39 80 118 10.4 228 788 1,015 89.6 1,134
2004 39 90 129 12.5 237 668 905 87.5 1,035
2005 33 80 113 11.1 250 661 911 88.9 1,025
Source: World Bank staff estimates.
Following decentralization and special autonomy, regional development spending on infrastructure increased substantially to almost Rp. 1.5 trillion in 2002 but has decreased in the last few years. Infrastructure spending increased in constant prices from an average of Rp. 596 billion before 1999 to a post-decentralization average of almost Rp. 1,150 billion (Figure 5.22).
Figure 5.22. Trends in regional development infrastructure spending in Aceh, 1994–2005 (constant 2006 prices)
0
200
400
600
800
1,000
1,200
1,400
1,600
1994 1995 1996 1997 1998 1999 2000 2001 2002 2003 2004 2005
Bill
ion
rup
iah
Source: World Bank staff calculations
Development spending on public works (water and irrigation, roads) accounts for three-forths of total infrastructure development spending, worth over Rp. 700 billion in 2005 (Figure 5.23).

ACEH PUBLIC EXPENDITURE ANALYSISSPENDING FOR RECONSTRUCTION AND POVERTY REDUCTION
SECTORAL ANALYSES WITH RECOMMENDATIONS86
Figure 5.23. Average development spending in subsectors, 2003–05
1%
21%
7%
72%
Public works (water and irrigation) sector
Transportation sector (include telecommunication)
Housing, regional development, and settlement sector
Energy (electricity)
Source: World Bank staff estimates (constant 2006 prices).
Routine spending, which includes salaries and other operational costs, remained fairly constant since 2002, but development spending declined. Average routine spending during 2002–05 was approximately Rp. 120 billion, or 11 percent of total infrastructure spending indicating the provincial government’s commitment to building up the infrastructure network. However, during the same period, development spending declined by over Rp. 500 billion (Figure 5.24). The development budget’s decline might have been caused by the worsening confl ict between GAM and GOI, which peaked in 2003 after the introduction of martial law.
Figure 5.24. Regional (province and local government) infrastructure spending (Rp billion)
0
200
400
600
800
1,000
1,200
1,400
1,600
2001 2002 2003 2004 2005
Bill
ion
Rp
h.
(co
nsta
nt p
rice
s 2
00
5)
Routine Development
Source: World Bank data. Data are in constant 2006 prices.
Routine expenses consist primarily of salaries, with little attention being paid to maintaining existing assets. The data show that on average during 2001–04, salaries accounted for the largest share of routine spending at 76 percent. During the same period, operational and maintenance expenses were rather low at 7 percent (Figure 5.25).
Figure 5.25. Average composition of routine expenditure, 2001–04 (%)
76%
2% 2%
7%
13%Personnel expenses
Goods expenses
Operational and maintanance expenses
Travelling expenses
Others
Source: World Bank staff estimates.
ACEH PUBLIC EXPENDITURE ANALYSISSPENDING FOR RECONSTRUCTION AND POVERTY REDUCTION
SECTORAL ANALYSES WITH RECOMMENDATIONS 87
The three major issues facing provincial and local governments with regard to infrastructure spending include:
1. Provincial and local governments seem not to be prioritizing infrastructure spending based on local needs. Aceh has no distinct infrastructure spending pattern that derives from local needs. The majority of spending is split between public works and transportation.65
2. Capacity varies between local government units. Staff numbers were generally adequate, but skills mix and motivation were inadquate. Lack of technical expertise to perform project planning, implementation, supervision, and maintenance needs to be addressed.
3. BRR presence may lead local governments to spend less on development and more on routine. However, given the temporary nature of BRR’s mandate as well as the transfer of all assets to local and provincial governments by BRR, there will be signifi cant development and maintenance needs for infrastructure sector at the local government level.
Reconstruction Spending for Infrastructure and Role of the Rehabilitation and Reconstruction Agency (BRR)
Funding for rehabilitation and reconstruction of infrastructure comes from the Government of Indonesia, which is channeling large amounts through BRR and local governments, and through multilateral and bilateral donors and NGOs. Infrastructure and the social sectors have received the greatest resource allocations. However, an apparent “surplus” in total available funds to build back minimum needs hides shortfalls in key sectors. Infrastructure shows a US$653 million defi cit of available funds for reconstruction. The lack of suffi cient funding for the transport sector is clearly a critical issue because an effi cient transport network is vital for the delivery of rehabilitation and reconstruction assistance and for overall economic development.
There are signifi cant diff erences in the availability of funds between regions in Aceh. The areas immediately adjacent to Banda Aceh (Banda Aceh Kota and Aceh Besar) have more than adequate resources to rebuild, but other areas are severely under-funded. Infl ation is now one of the major problems for the reconstruction eff ort, with wages of construction workers up by 40 percent–50 percent during 2005. Funding critical gaps in infrastructure will likely fall to GOI through BRR and local governments. Many NGOs will complete their reconstruction tasks by the end of 2006 and are unlikely to make additonal commitments. Similarly, other bilateral and multilateral donors will likely continue to fund projects that they have funded previously and will concentrate on housing, education, health, and livelihoods.
It is essential that BRR keep the local and provincial governments involved at all times because they are directly responsible for the present and subsequent operation and maintenance of infrastructure. Some major infrastructure projects including major roads and large-scale drainage systems are beyond the capacity of international agencies and NGOs. Thus, deeper involvement of provincial and local governments in infrastructure fi nancing is crucial. In addition, current local government allocation of resources does not seem suffi cient to maintain assets.
Recommendations
1. BRR will need to involve the local and provincial governments more in becoming owners of projects fi nanced. Ownership not only will help build local government skills and capacity but also will ensure that local and provincial governments are immediately involved in the maintenance and upkeep of the newly reconstructed assets. To increase local government ownership, it is recommended that local governments be requested to cofi nance infrastructure projects with BRR and other NGOs if possible. Ideally, local governments would cover an increasing share of the costs of infrastructure projects over the next years starting from 2007.
2. The diff erent government levels (central, provincial and local) should promote a favorable investment climate to attract private sector investments in infrastructure. A favorable climate
65 In contrast, Papua, allocates almost 90 percent of infrastructure budget to transportation development.
ACEH PUBLIC EXPENDITURE ANALYSISSPENDING FOR RECONSTRUCTION AND POVERTY REDUCTION
SECTORAL ANALYSES WITH RECOMMENDATIONS88
requires addressing longer term issues, such as transparent public management and desperately needed legal reforms. They should encourage the private sector to undertake some of the major reconstruction and rehabilitation projects.
3. Local governments’ technical and institutional absorptive capacity constraints must be improved. Weak capacity of local governments limits the realization of increases in spending despite readily available funding. Technical assistance projects by donors and other agencies are critical to help ensure that local governments are well prepared and have the capacity to implement high quality projects. Their executing and implementing capacity must be maintained after 2009, when the reconstruction process will be over. The infrastructure development plans need to be disseminated down to the subdistrict level so that coordination is improved and responsibility is handed over effi ciently.
4. Maintenance of existing infrastructure assets and those under construction must be guaranteed. Maintenance is of utmost priority to ensure sustainability and to avoid decay of existing and newly developed infrastructure. To gain ground, an optimal balance is required between routine (maintenance) and development expenses. This balance will require strategies for local and provincial governments to have ownership of all the projects with which they will be left after the donor-fi nanced reconstruction is completed.
5. To make infrastructure spending more eff ective, local governments and BRR will need to prepare a long-term plan for infrastructure development in the province. This collaborative plan will necessitate greater coordination between provincial and local governments. In the short to medium term, BRR will be in the driver’s seat of reconstruction and development of infrastructure in the region. However, in the medium term, local governments must develop their capacities as regulators and planners, as investors in selected infrastructure subsectors, and, most importantly, as policy-makers. It will be useful to develop a medium-term fi scal and expenditure framework that will determine the expenditure ceilings over the medium term—for both capital and current expenditures on operations and maintenance. This framework will need to specify expenditures over a longer period in accordance with the revenue forecast.
6. BRR and the regional governments should strengthen monitoring and evaluation (MandE) systems. The fi rst 18 months of rehabilitation and reconstruction might have resulted in more cost-eff ective and sustainable infrastructure if MandE systems had been more robust. The sector must establish a workable MandE system that can be utilized by all projects at all levels of implementation: from national to kabupaten.